Groundwater Nitrate Contamination Integrated Modeling for Climate and Water Resources Scenarios: The Case of Lake Karla Over-Exploited Aquifer

 ,
, 
 ,
, 

Abstract
1. Introduction
2. Materials and Methods
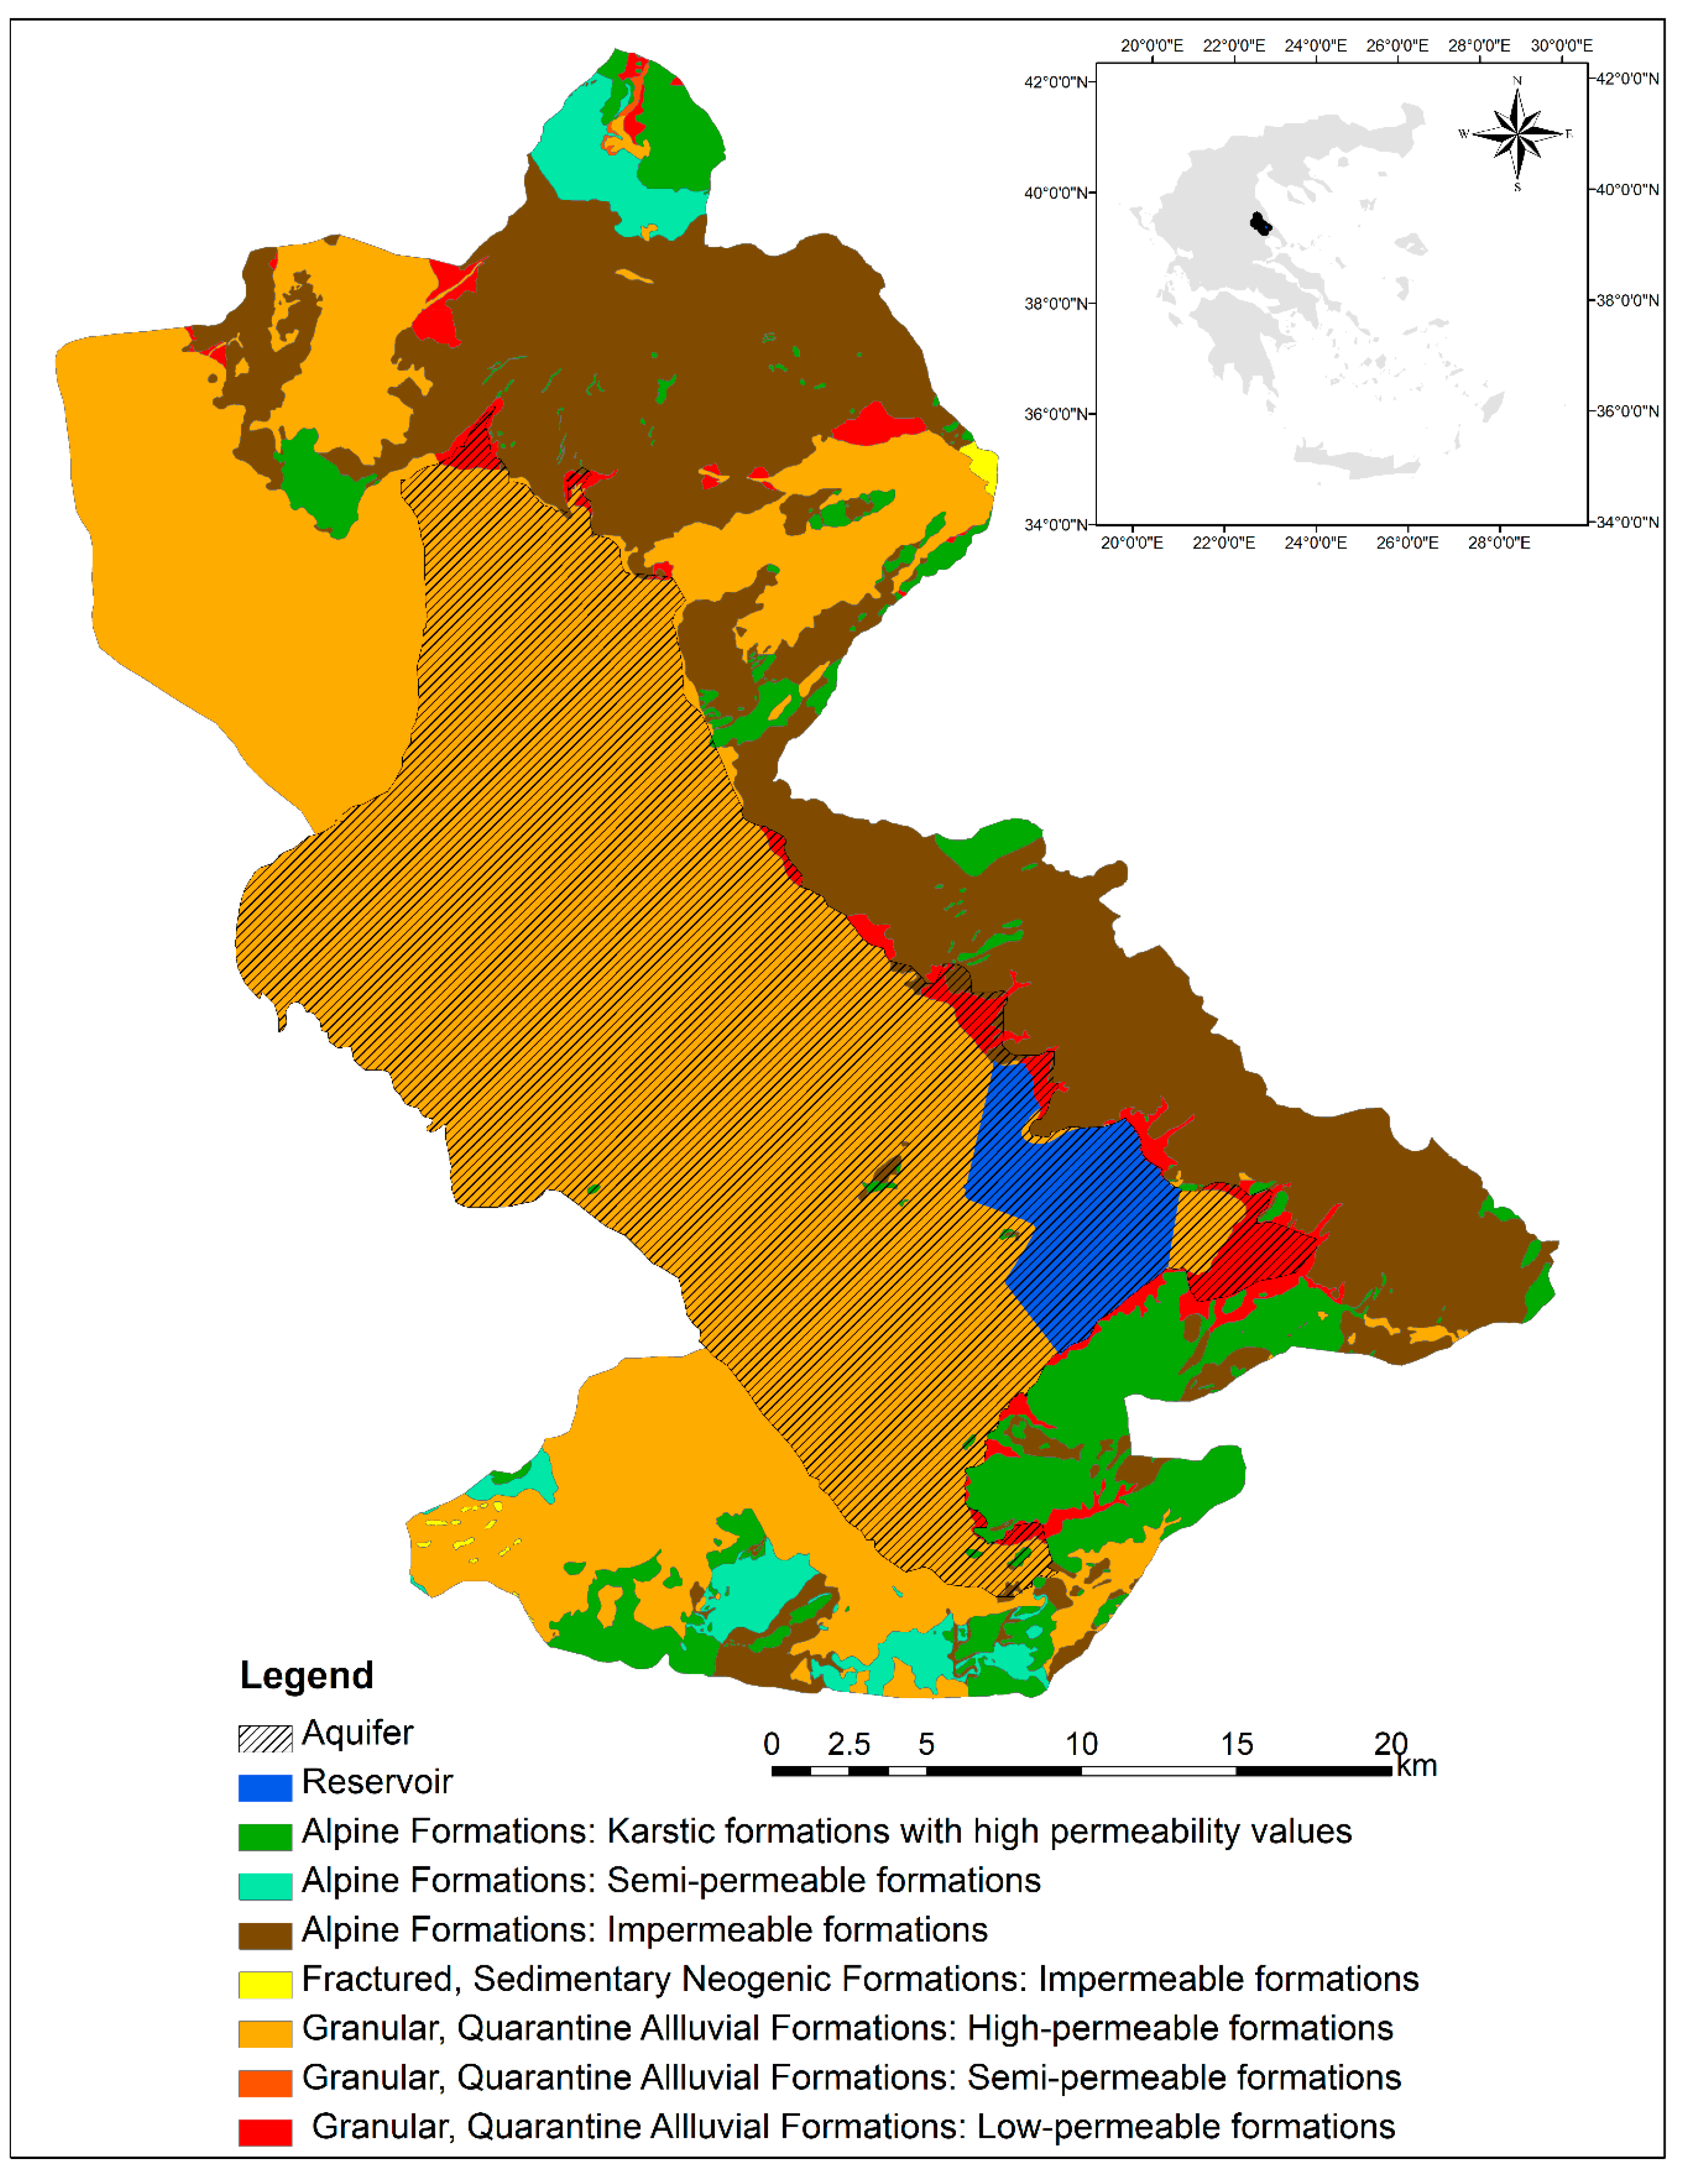
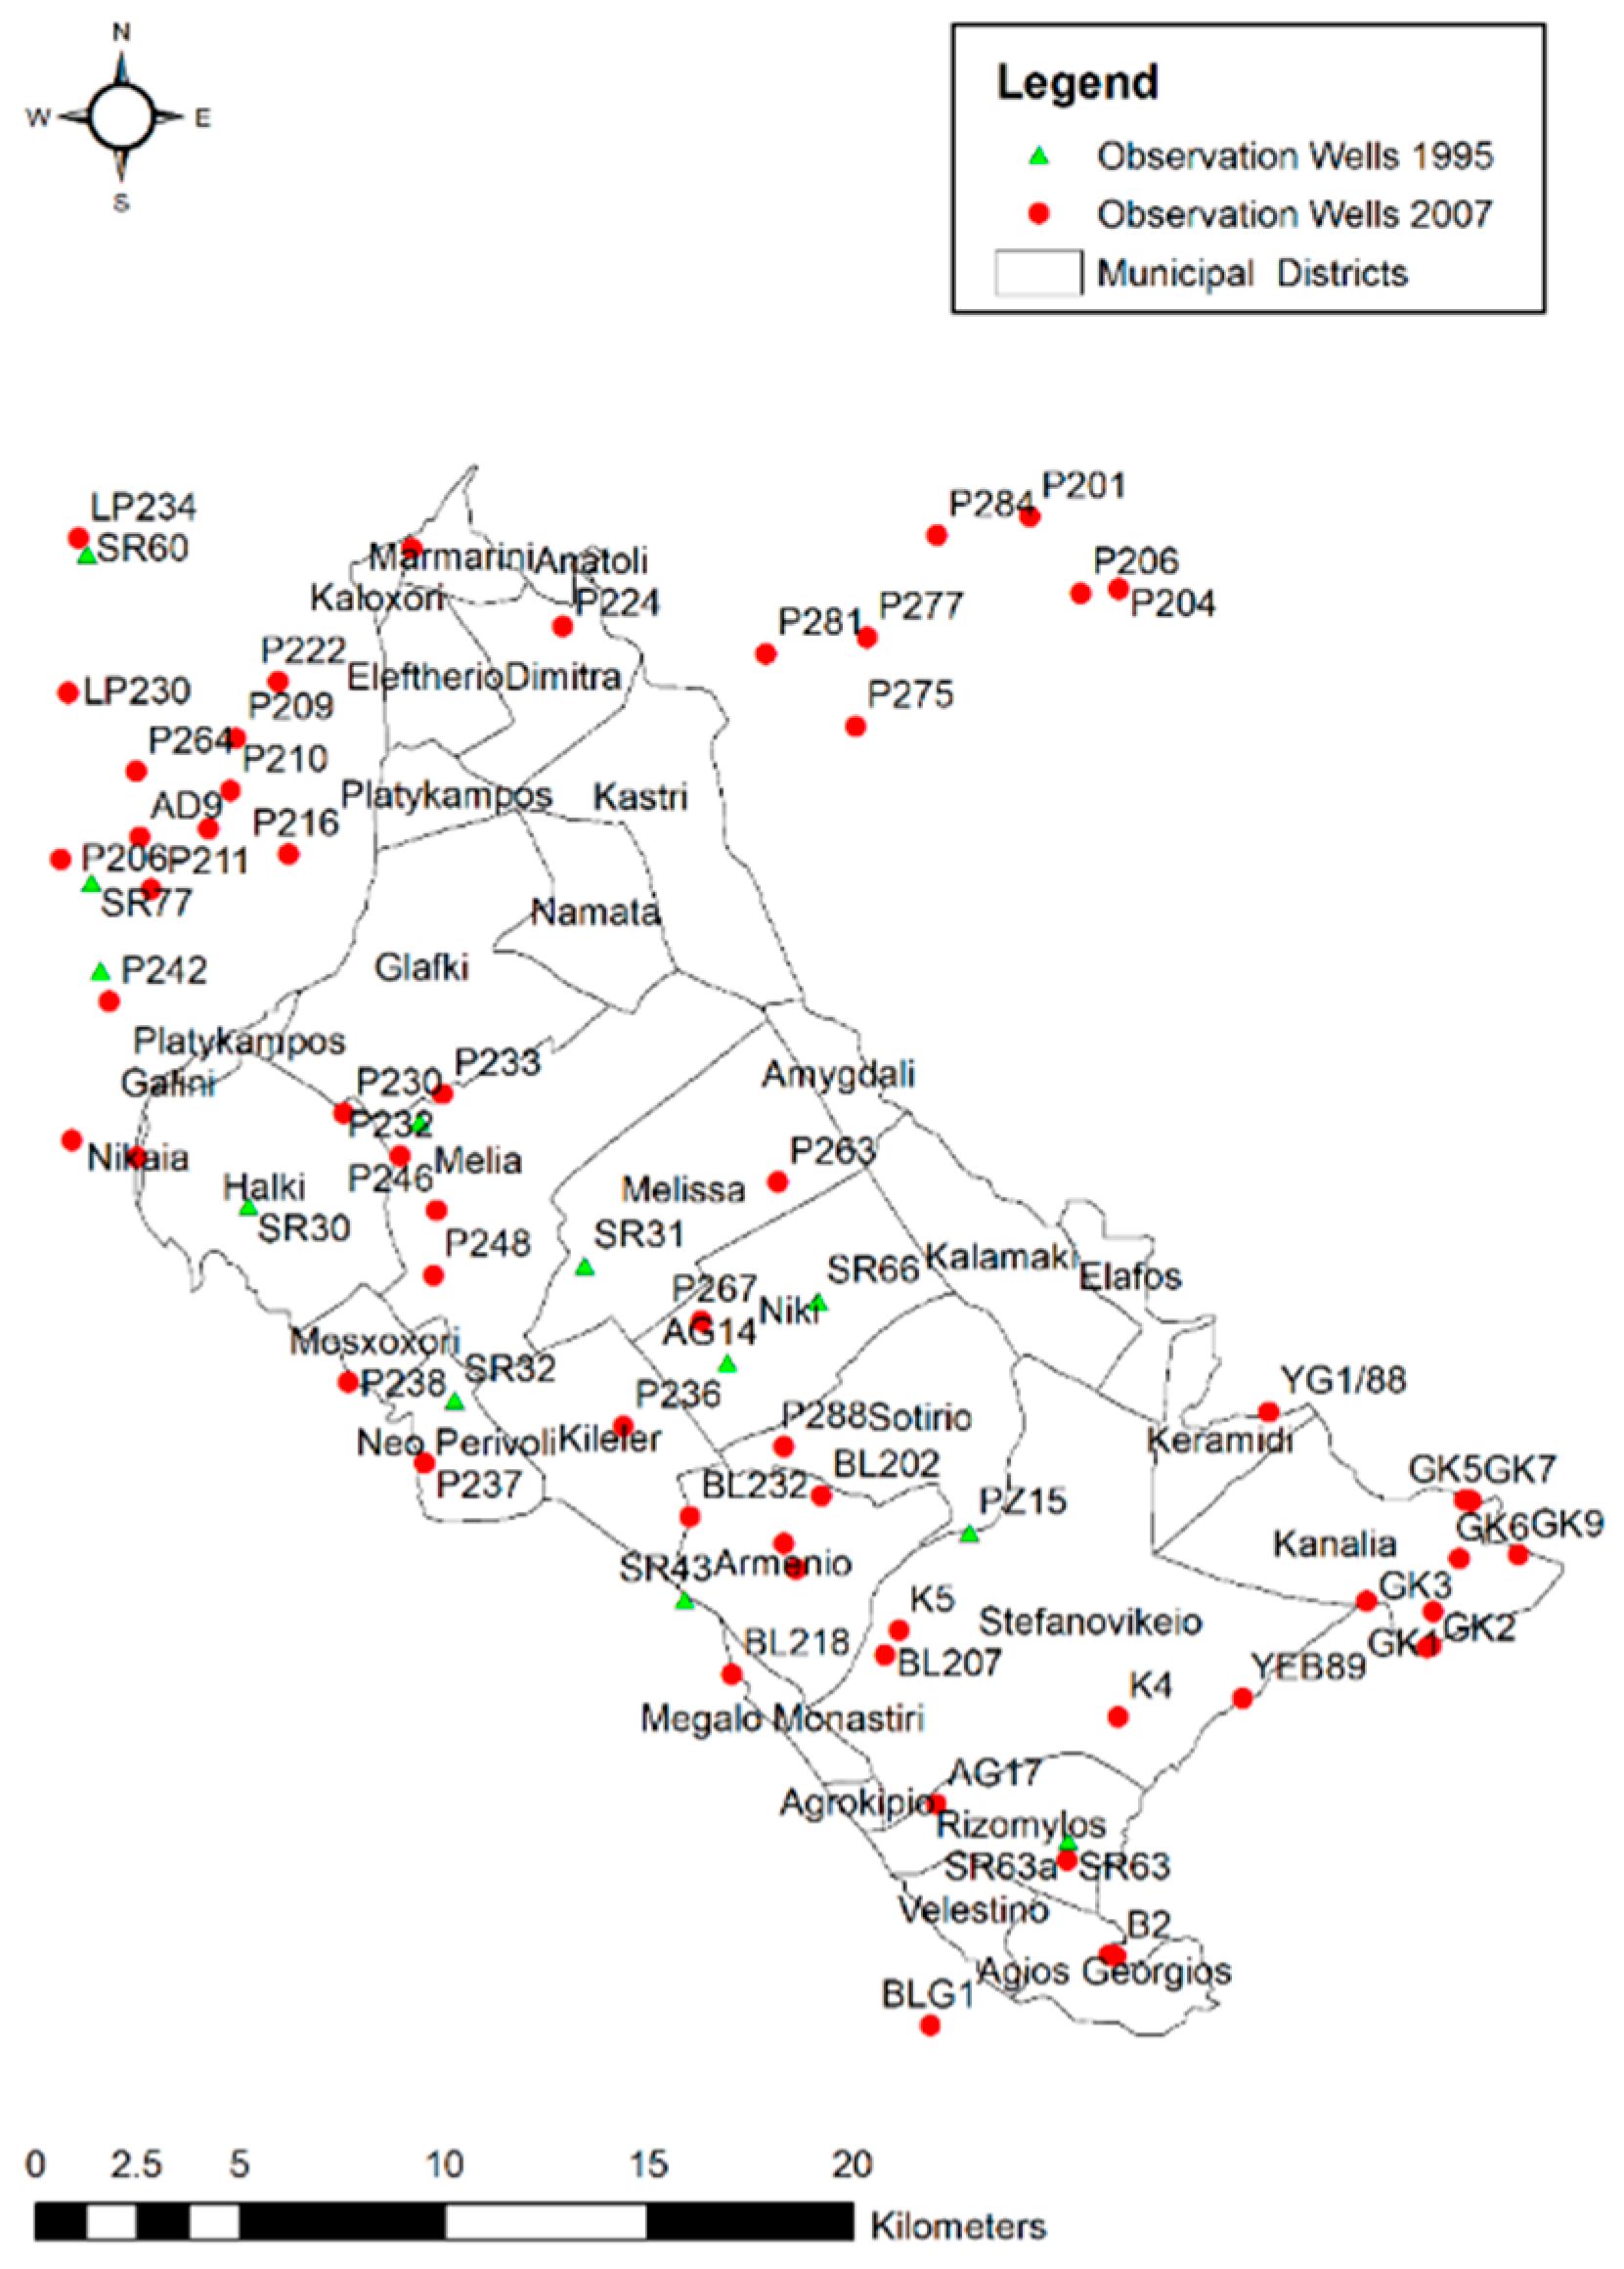
2.1. Study Area Description
2.2. Climate, Hydrology, and Climate Change Scenarios
2.3. Geology and Hydrogeological Settings
2.4. Water Resources Management
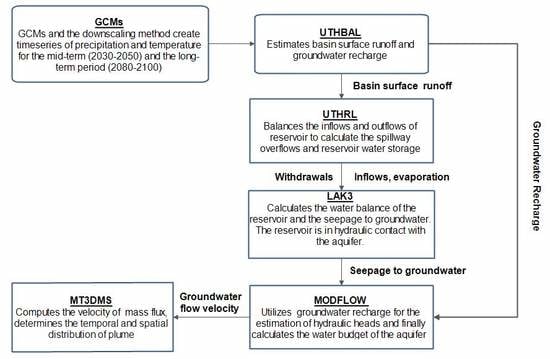
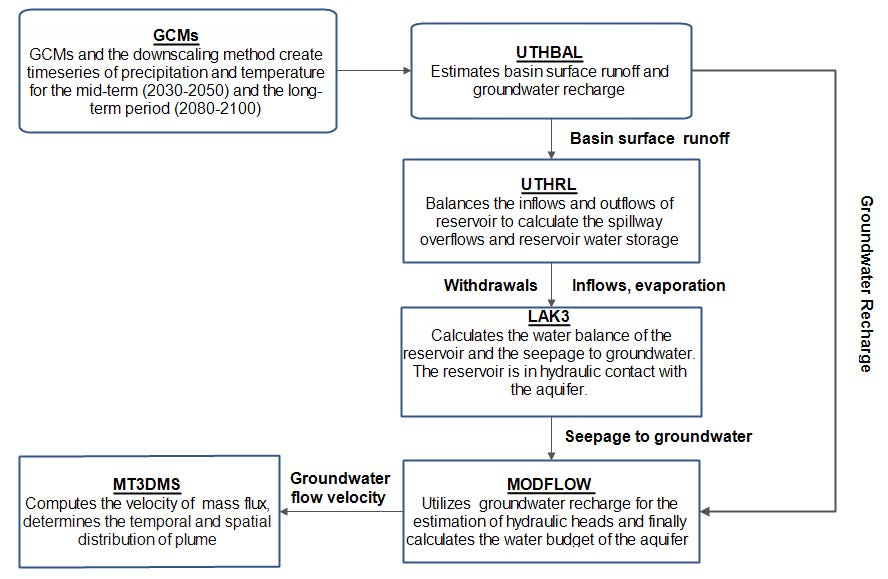
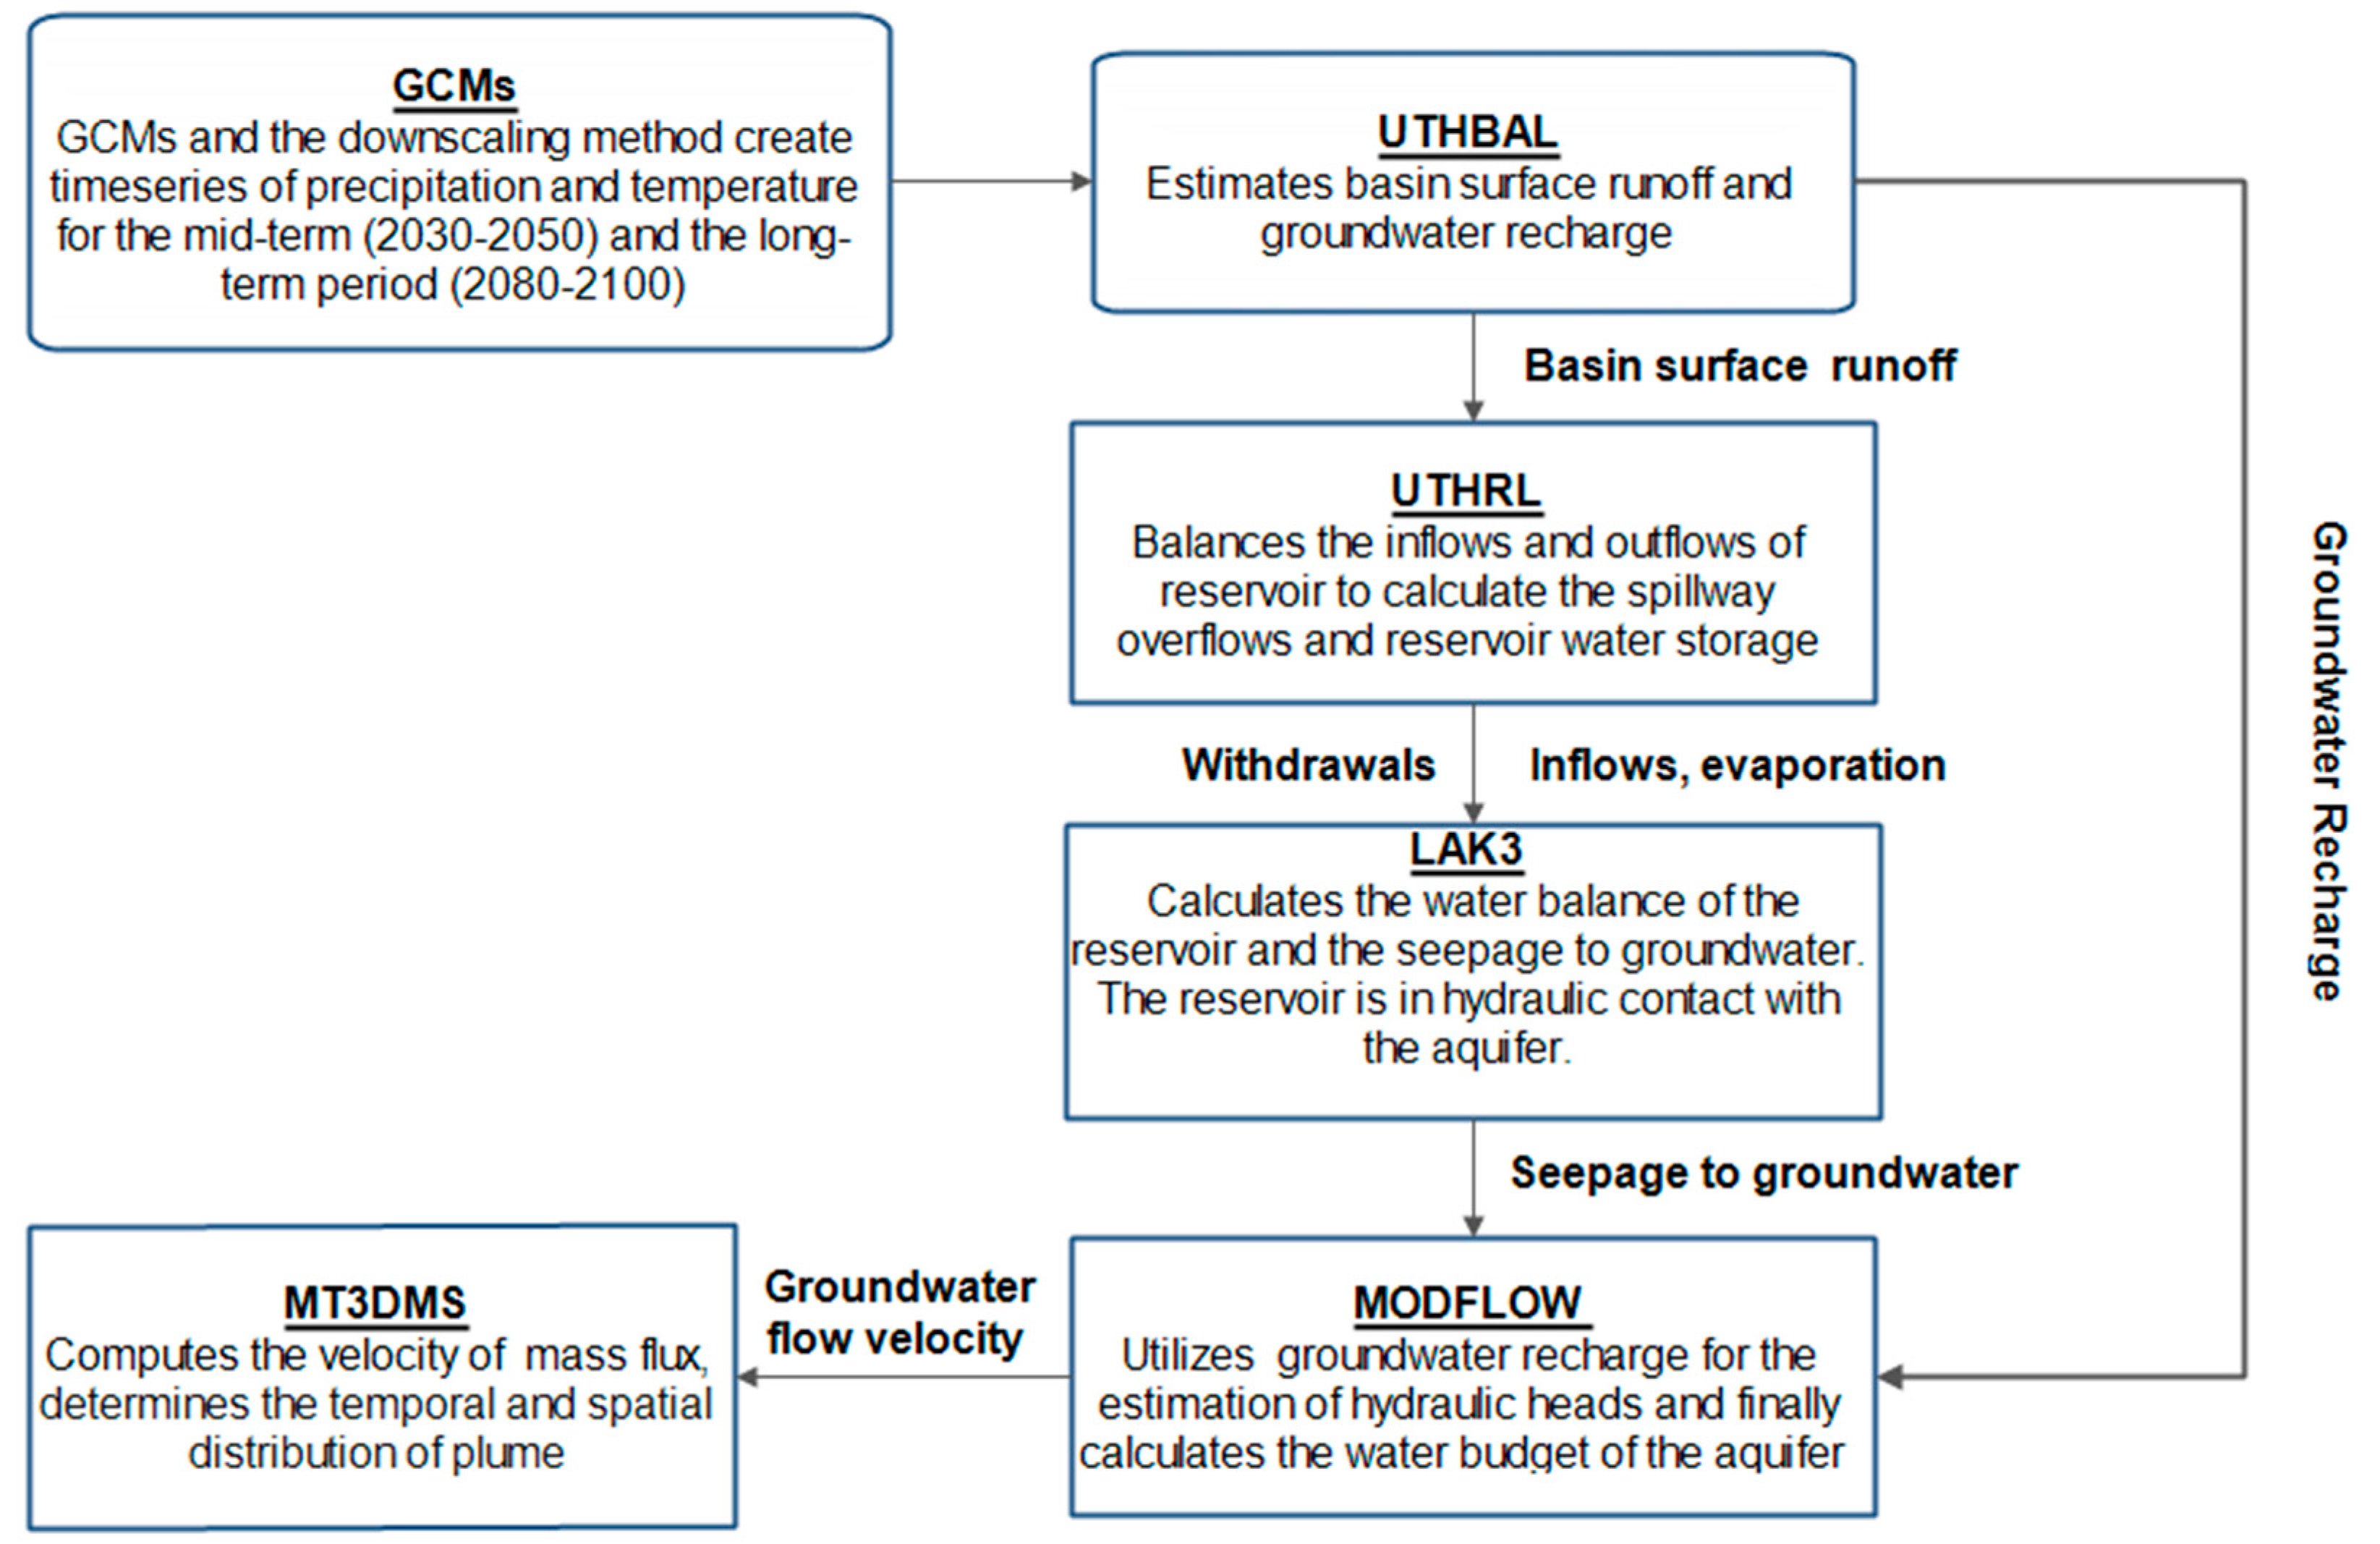
2.5. Modeling Framework
2.5.1. Ground Water Flow Model Description
2.5.2. Nitrate Transport and Dispersion Model Description
3. Results
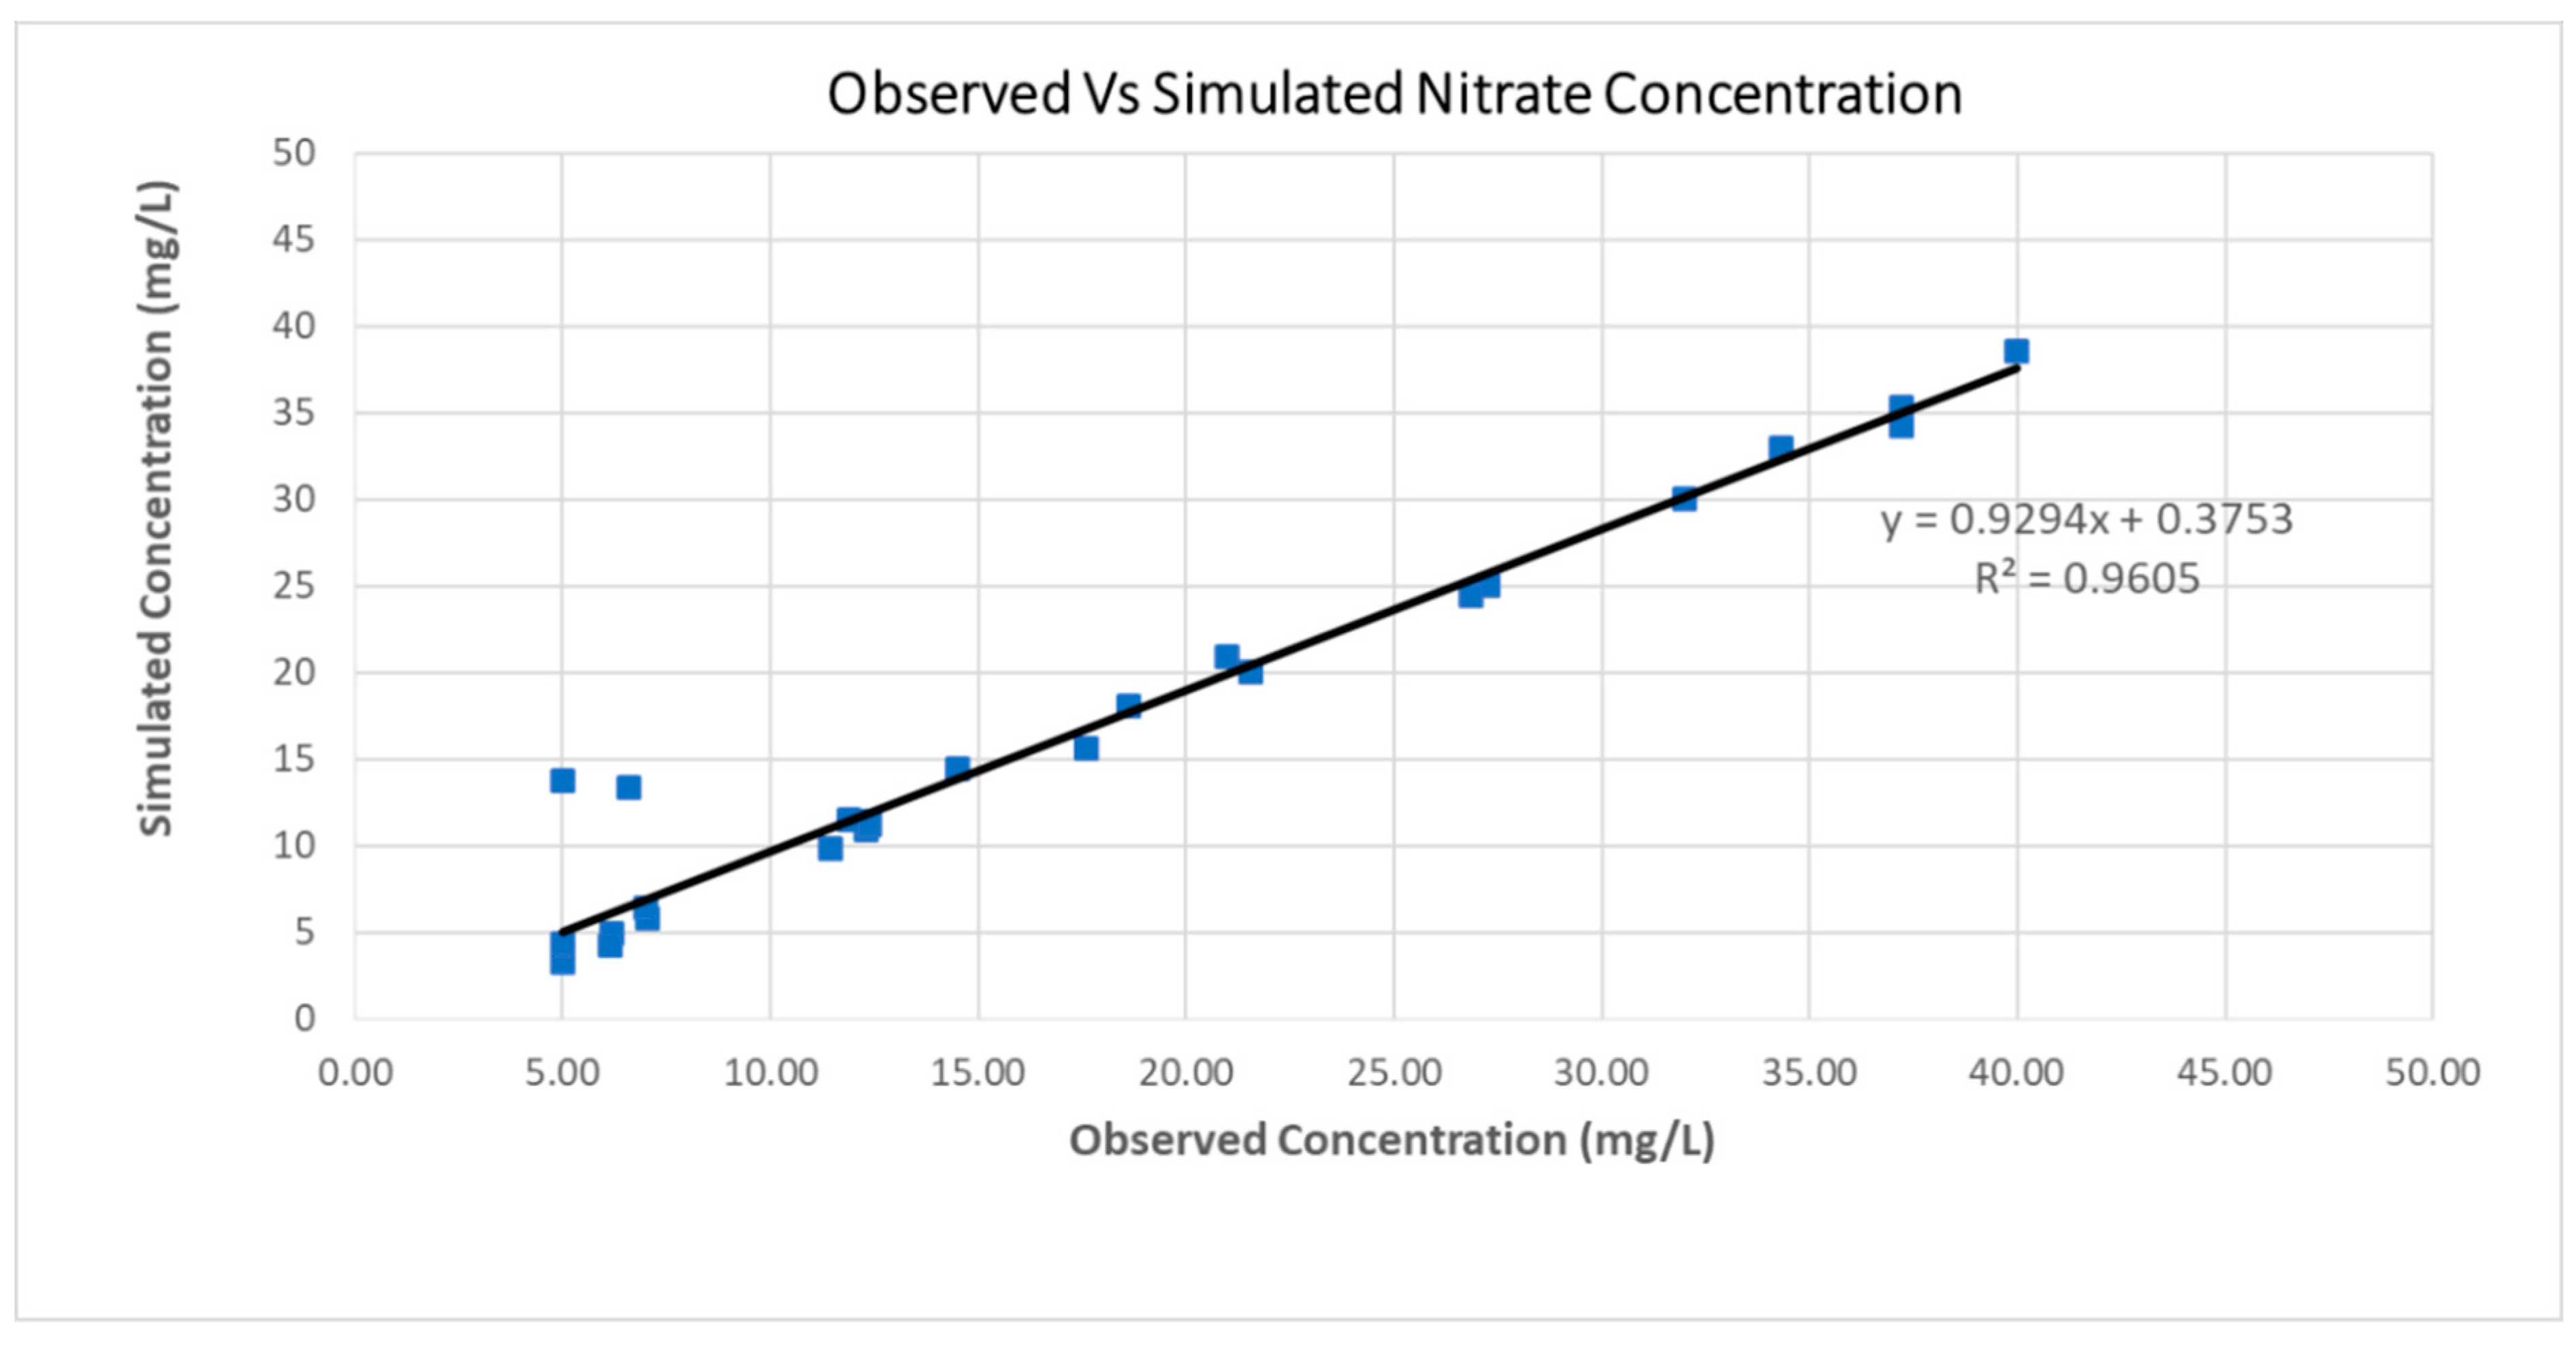
3.1. Nitrate Transport and Dispersion Model Calibration
3.2. Operation Strategies Results
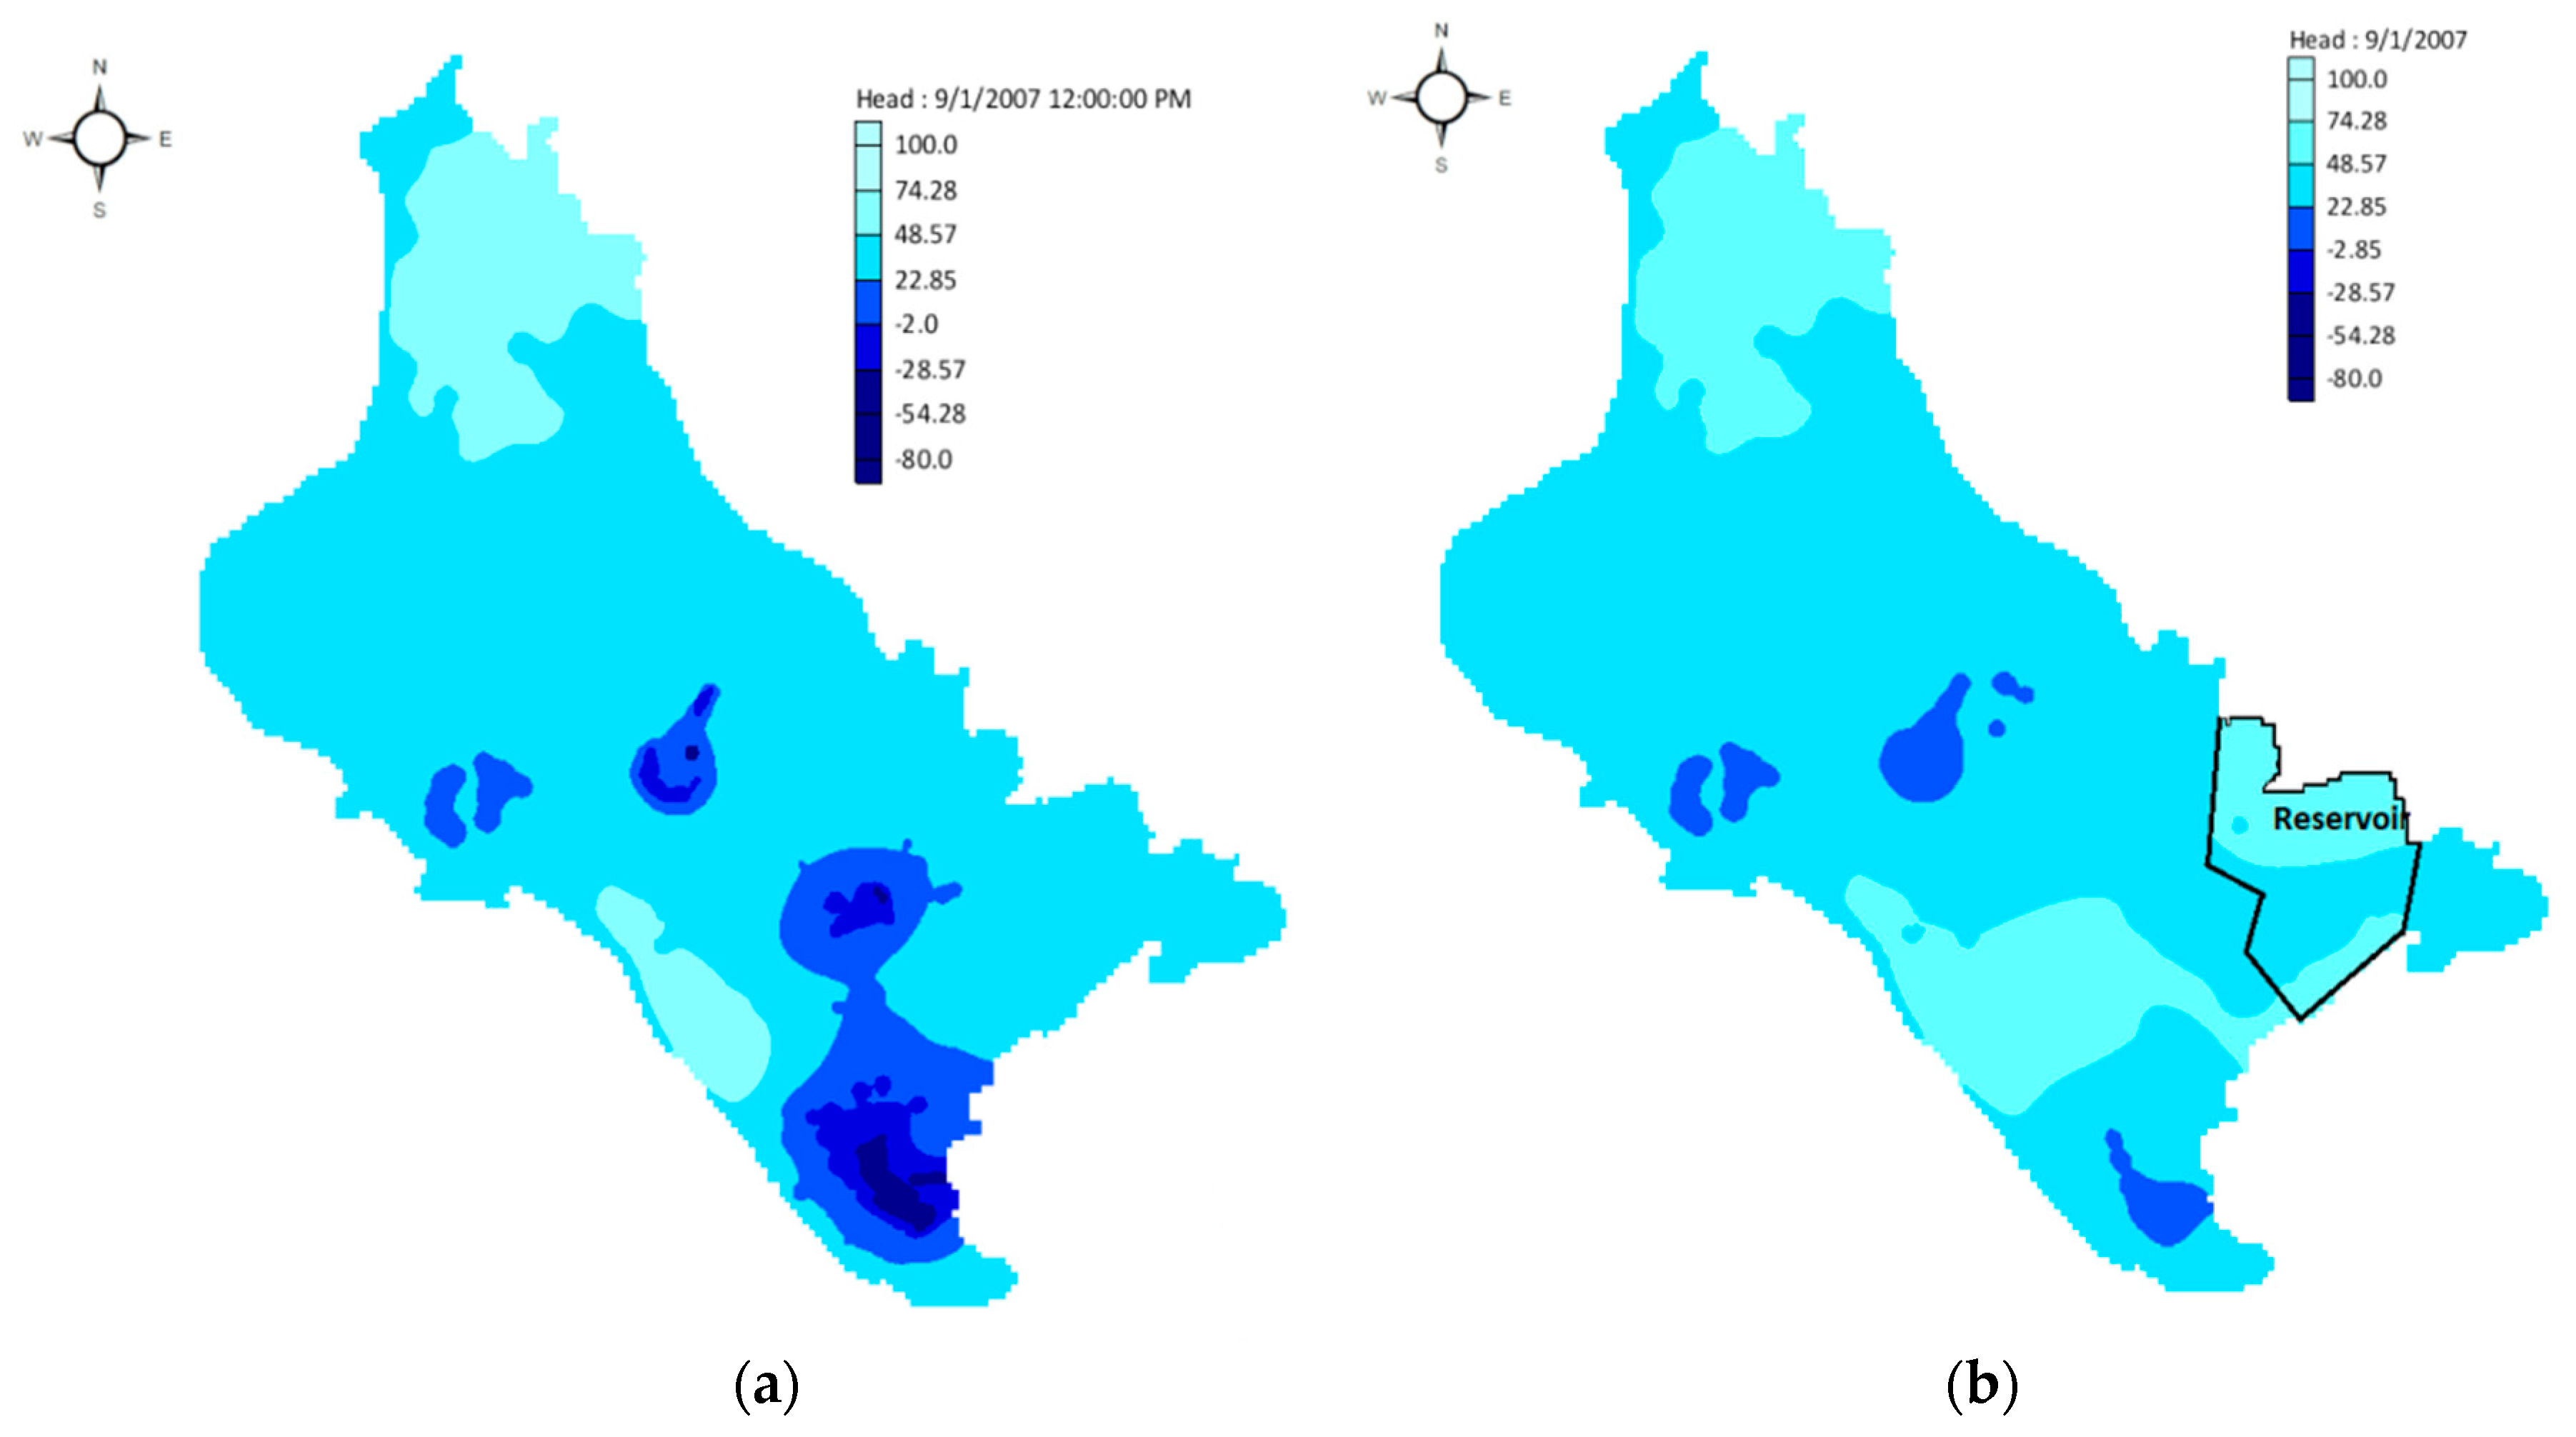
3.2.1. Groundwater Hydrological Modeling
3.2.2. Nitrate Transport and Dispersion Modelling
3.3. Climate Change Results
3.3.1. Surface Hydrological Modeling
3.3.2. Groundwater Hydrological Modeling
3.3.3. Nitrate Solute and Transport Model
4. Discussion
5. Conclusions
Author Contributions
Funding
Acknowledgments
Conflicts of Interest
References
- Jajarmizadeh, M.; Harun, S.; Salarpour, M. A review on theoretical consideration and types of models in hydrology. IJEST 2012, 5, 249–261. [Google Scholar] [CrossRef]
- Biswas, A.K. Integrated water resources management: Is it working? Int. J. Water Resour. 2008, 24, 5–22. [Google Scholar] [CrossRef]
- Li, L.; Zongxue, X.; Depeng, Z.; Jie, Z. A grid-based integrated surface–groundwater model (GISMOD). J. Water Clim. Chang. 2015, 7, 296–320. [Google Scholar] [CrossRef]
- Jaworska-Szulc, B. Role of the Lakes in groundwater recharge and discharge in the Young Glacial area, Northern Poland. Ground Water 2016, 54, 603–611. [Google Scholar] [CrossRef] [PubMed]
- Candela, L.; Von Igel, W.; Javier Elorza, J.F.; Aronica, G. Impact assessment of combined climate and management scenarios on groundwater resources and associated wetland (Majorca, Spain). J. Hydrol. 2009, 376, 510–527. [Google Scholar] [CrossRef]
- Simon, B.R.; Bernard, S.; Meurville, C.; Rebour, V. Flow-through stream modeling with MODFLOW and MT3D: Certainties and limitations. Ground Water 2015, 53, 967–971. [Google Scholar] [CrossRef]
- Spalding, R.F.; Exner, M.E. Occurrence of nitrate in groundwater—A review. J. Environ. Qual. 1993, 22, 392–402. [Google Scholar] [CrossRef]
- Voudouris, K.; Panagopoulos, A.; Koumantakis, I. Nitrate pollution in the coastal aquifer system of the Korinthos (Greece). Glob. Nest J. 2004, 6, 11–18. [Google Scholar]
- Molénat, J.; Gascuel-Odoux, C. Modelling flow and nitrate transport in groundwater for the prediction of water travel times and of consequences of land use evolution on water quality. Hydrol. Process. 2002, 16, 479–492. [Google Scholar] [CrossRef]
- Papaioannou, A.; Plageras, P.; Dovriki, E.; Minas, A.; Krikelis, V.; Nastos, P.T.; Kakavas, K.; Paliatsos, A.G. Groundwater quality and location of productive activities in the region of Thessaly (Greece). Desalination 2007, 213, 209–217. [Google Scholar] [CrossRef]
- Ghiglieri, G.; Barbieri, G.; Vernier, A.; Carletti, A.; Demurtas, N.; Pinna, R.; Pittalis, D. Potential risks of nitrate pollution in aquifers from agricultural practices in the Nurra region, northwestern Sardinia, Italy. J. Hydrol. 2009, 379, 339–350. [Google Scholar] [CrossRef]
- Peña-Haro, S.; Velazquez, P.M.; Sahuquillo, A. A hydro-economic modelling framework for optimal management of groundwater nitrate pollution from agriculture. J. Hydrol. 2010, 373, 193–203. [Google Scholar] [CrossRef]
- Takounjou, F.A.; Kuitcha, D.; Fantong, W.Y.; Ewodo, M.G.; Khan, H.H.; Isssa, O.T. Assessing groundwater nitrate pollution in Yaoundé, Cameroon: Modelling approach. World Appl. Sci. J. 2013, 23, 333–344. [Google Scholar] [CrossRef]
- Sharma, M.K.; Jain, C.K.; Rao, G.T.; Gurunadha Rao, V.V.S. Modelling of lindane transport in groundwater of metropolitan city Vadodara, Gujarat, India. Environ. Monit. Assess. 2015, 187. [Google Scholar] [CrossRef] [PubMed]
- Almasri, M.N.; Kaluarachchi, J.J. Modeling nitrate contamination of groundwater in agricultural watersheds. J. Hydrol. 2007, 343, 211–229. [Google Scholar] [CrossRef]
- Shamrukh, M.; Corapcioglu, M.Y.; Hassona, F.A.A. Modeling the effect of chemical fertilizers on groundwater quality in the Nile Valley aquifer. Ground Water 2001, 39, 59–67. [Google Scholar] [CrossRef]
- Paradis, D.; Vigneault, H.; Lefebvre, R.; Savard, M.M.; Ballard, J.M.; Qian, B.D. Groundwater nitrate concentration evolution under climate change and agricultural adaptation scenarios: Prince Edward Island, Canada. Earth Syst. Dyn. 2016, 7, 183–202. [Google Scholar] [CrossRef]
- Ghoraba, S.M.; Zyedan, B.A.; Rashwan, I.M.H. Solute transport modeling of the groundwater for quaternary aquifer quality management in Middle Delta, Egypt. Alexandria Eng. J. 2013, 52, 197–207. [Google Scholar] [CrossRef]
- Psaropoulou, E.T.; Karatzas, G. Pollution of nitrates contaminant transport i heterogeneous porous media: A case study of the coastal aquifer of Corinth, Greece. Glob. Nest J. 2014, 16, 9–23. [Google Scholar] [CrossRef][Green Version]
- Serio, F.; Miglietta, P.P.; Lamastra, L.; Ficocelli, S.; Intini, F.; De Leo, F.; De Donno, A. Ground water nitrate contamination and agricultural land use: A grey water footprint perspective in Southern Apulia Region (Italy). Sci. Total Environ. 2018, 645, 1425–1431. [Google Scholar] [CrossRef]
- Gemitzi, A.; Petalas, C.; Pisinaras, V.; Tsihrintzis, V.A. Spatial prediction of nitrate pollution in groundwaters using neural networks and GIS: An application to South Rhodope aquifer (Thrace, Greece). Hydrol. Process. 2009, 23, 372–383. [Google Scholar] [CrossRef]
- Lockhart, K.M.; King, A.M.; Harter, T. Identifying sources of groundwater nitrate contamination in a large alluvial groundwater basin with highly diversified intensive agricultural production. J. Contam. Hydrol. 2013, 151, 140–154. [Google Scholar] [CrossRef] [PubMed]
- Almasri, M.N.; Kaluarachchi, J.J. Multi-criteria decision analysis for the optimal management of nitrate contamination of aquifers. J. Environ. Manag. 2005, 74, 365–381. [Google Scholar] [CrossRef] [PubMed]
- Powlson, D.S.; Addiscott, T.M. Nitrogen in Soils, Nitrates, Encyclopedia of Soils in the Environment, 1st ed.; Hinnel, D.A., Rosenzweig, C.B., Polson, S.D.C., Scow, M.K., Singer, J.M., Sparks, L.D., Eds.; Academic Press, Elsevier: New York, NY, USA, 2005; pp. 21–56. ISBN1 10:0123485304. ISBN2 13:978-0123485304. [Google Scholar]
- Liu, C.W.; Lin, C.N.; Jang, C.S.; Ling, M.P.; Tsai, J.W. Assessing nitrate contamination and its potential health risk to Kinmen residents. Environ. Geochem. Health 2011, 33, 503–514. [Google Scholar] [CrossRef] [PubMed]
- Olesen, E.J.; Bindi, M. Consequences of climate change for European agricultural productivity, land use and policy. Eur. J. Agron. 2002, 16, 239–262. [Google Scholar] [CrossRef]
- Roelsma, J.; Hendriks, R.F.A. Comparative study of nitrate leaching models on a regional scale. Sci. Total Environ. 2014, 499, 481–496. [Google Scholar] [CrossRef]
- Maran, N.H.; Crispim, B.D.; Iahnn, S.R.; Araújo, R.P.; Grisolia, A.B.; Oliveira, K.M. Depth and well type related to groundwater microbiological contamination. Int. J. Environ. Res. Public Health 2016, 13, 1036. [Google Scholar] [CrossRef]
- Shrestha, S.; Bach, V.T.; Pandey, P.V. Climate change impacts on groundwater resources in Mekong Delta under representative concentration pathways (RCPs) scenarios. Environ. Sci. Policy 2016, 61, 1–13. [Google Scholar] [CrossRef]
- Pulido-Velazquez, M.; Peña-Haro, S.; García-Prats, A.; Mocholi-Almudever, A.F.; Henriquez-Dole, L.; Macian-Sorribes, H.; Lopez-Nicolas, A. Integrated assessment of the impact of climate and land use changes on groundwater quantity and quality in the Mancha Oriental system (Spain). Hydrol. Earth Syst. Sci. 2015, 19, 1677–1693. [Google Scholar] [CrossRef]
- Pascual, D.; Pla, E.; Lopez-Bustins, J.A.; Retana, J.; Terradas, J. Impacts of climate change on water resources in the Mediterranean Basin: A case study in Catalonia, Spain. Hydrol. Sci. J. 2015, 60, 2132–2147. [Google Scholar] [CrossRef]
- Taylor, R.G.; Scanlon, B.; Döll, P.; Rodell, M.; Van, B.R.; Wada, Y.; Longuevergne, L.L.M.; Famiglietti, J.S.; Edmunds, M.; Konikow, L.; et al. Ground water and climate change. Nat. Clim. Chang. 2012, 3, 322–329. [Google Scholar] [CrossRef]
- Green, T.R.; Taniguchi, M.; Kooi, H.; Gurdak, J.J.; Allen, D.M.; Hiscock, K.M.; Treidel, H.; Aureli, A. Beneath the surface: Impacts of climate change on groundwater. J. Hydrol. 2011, 405, 532–560. [Google Scholar] [CrossRef]
- Sidiropoulos, P.; Tziatzios, G.; Vasiliades, L.; Papaioannou, G.; Mylopoulos, N.; Loukas, A. Modelling flow and nitrate transport in an over-exploited aquifer of rural basin using an integrated system: The case of Lake Karla watershed. Proceedings 2018, 2, 667. [Google Scholar] [CrossRef]
- Loukas, A.; Mylopoulos, N.; Kokkinos, K.; Sidiropoulos, P.; Vasiliades, L.; Liakopoulos, A. The effect of spatial discretization in integrated modeling of surface and groundwater hydrology through OpenMI. In Proceedings of the International Interdisciplinary Conference on Predictions for Hydrology, Ecology and Water Resources Management—Using Data and Models to Benefit Society, Prague, Czech Republic, 15–18 September 2008. [Google Scholar]
- Sidiropoulos, P.; Mylopoulos, N.; Loukas, A. Stochastic simulation and management of an over-exploited aquifer using an integrated modeling system. Water Resour. Manag. 2015, 29, 929–943. [Google Scholar] [CrossRef]
- Intergovernmental Panel on Climate Change IPCC. Climate Change 2007—The Physical science basis. In Contribution of Working Group I to the Fourth Assessment Report of the Intergovernmental Panel on Climate Change (IPCC); Solomon, S., Qin, D., Manning, M., Chen, Z., Marquis, M., Averyt, K.B., Tignor, M., Miller, H.L., Eds.; Cambridge University Press: Cambridge, UK, 2007. [Google Scholar]
- Kløve, B.; Ala-Aho, P.; Bertrand, G.; Gurdak, J.J.; Kupfersberger, H.; Kvoerner, J.; Muotka, T.; Mykrä, H.; Preda, E.; Rossi, P.; et al. Climate change impacts on groundwater and dependent ecosystems. J. Hydrol. 2014, 518, 250–266. [Google Scholar] [CrossRef]
- Tzabiras, J.; Vasiliades, L.; Loukas, A.; Mylopoulos, N. Climate change impacts on hydrometeorological variables using a bias correction method. The Lake Karla watershed case. MESA J. 2015, 6, 683–700. [Google Scholar]
- Tzabiras, J.; Vasiliades, L.; Sidiropoulos, P.; Loukas, A.; Mylopoulos, N. Evaluation of water resources management strategies to overturn climate change impacts on Lake Karla watershed. Water Resour. Manag. 2016, 30, 5819–5844. [Google Scholar] [CrossRef]
- Moss, R.H.; Edmonds, J.A.; Hibbard, K.A.; Manning, M.R.; Rose, S.K.; Van Vuuren, D.P.; Carter, T.R.; Emori, S.; Kainuma, M.; Kram, T.; et al. The next generation of scenarios for climate change research and assessment. Nature 2010, 463, 747–756. [Google Scholar] [CrossRef]
- Alotaibi, K.; Ghumman, A.; Haider, H.; Ghazaw, Y.; Shafiquzzaman, M. Future predictions of rainfall and temperature using GCM and ANN for arid regions: A case study for the Qassim Region, Saudi Arabia. Water 2018, 10, 1260. [Google Scholar] [CrossRef]
- Loukas, A.; Mylopoulos, N.; Vasiliades, L. A modeling system for the evaluation of water resources management strategies in Thessaly, Greece. Water Resour. Manag. 2007, 21, 1673–1702. [Google Scholar] [CrossRef]
- Merritt, M.L.; Konikow, L.F. Documentation of a Computer Program to Simulate Lake-Aquifer Interaction Using the MODFLOW Ground-Water Flow Model and the MOC3D Solute-Transport Model; Water-Resources Investigations Report 00–4167; U.S. Geological Survey: Reston, VA, USA, 2000.
- Harbaugh, A.W.; McDonald, M.G. User’s Documentation for MODFLOW-2000, an Update to the U.S. Geological Survey Modular Finite-Difference Ground-Water Flow Model; United States Government Printing Office: Washington, DC, USA, 2000.
- Zheng, C.; Wang, P.P. MT3DMS: A Modular Three-Dimensional Multi-Species Transport Model for Simulation of Advection, Dispersion and Chemical Reactions of Contaminants in Groundwater Systems, Documentation and User’s Guide; Army Corps of Engineers: Washington, DC, USA, 1999. [Google Scholar]
- Costantinidis, D. Hydrodynamique d’un système aquifère hétérogène, Hydrogéologie de la Thessalie Orientale. Ph.D. Thesis, University of Grenoble, Grenoble, France, 1978. [Google Scholar]
- Craig, J.R.; Rabideau, A.J. Finite element transport modeling using analytic element flow solutions. Water Resour. Res. 2006, 42, 1–16. [Google Scholar] [CrossRef]
- Konikow, F.L. The secret to successful solute-transport modeling. Ground Water 2011, 49, 144–159. [Google Scholar] [CrossRef] [PubMed]
- Schulze-Makuch, D. Longitudinal dispersivity data and implications for scaling behavior. Ground Water 2005, 43, 443–456. [Google Scholar] [CrossRef] [PubMed]
- Gelhar, L.; Welty, C.; Rehfeldt, K.A. Critical review of data on field-scale dispersion in aquifers. Water Resour. Res. 1992, 28, 1955–1974. [Google Scholar] [CrossRef]
- Institute of Geological and Mineral Exploration. Recording and Evaluation of the Hydrogeological Characteristics of the Groundwater Systems of the Country; Basement of the Aquatic Potential of Thessaly; Institute of Geological and Mineral Exploration: Thessaloniki, Greece, 2010. [Google Scholar]
- Libutti, A.; Monteleone, M. Soil vs. groundwater: The quality dilemma. Managing nitrogen leaching and salinity control under irrigated agriculture in Mediterranean conditions. Agric. Water Manag. 2017, 186, 40–50. [Google Scholar] [CrossRef]
- Kourakos, G.; Harter, T. Parallel simulation of groundwater non-point source pollution using algebraic multigrid preconditioners. Computat. Geosci. 2014, 18, 851–867. [Google Scholar] [CrossRef]
- Almasri, M.N.; Kaluarachchi, J.J. Implications of on-ground nitrogen loading and soil transformations on ground water quality management. JAWRA 2004, 40, 165–186. [Google Scholar] [CrossRef]
- Doble, M.; Kumar, A. Groundwater Decontamination and Treatment. In Biotreatment of Industrial Effluents, 1st ed.; Elsevier: Amsterdam, The Netherlands; Butterworth-Heinemann: New York, NY, USA, 2005; pp. 285–294. ISBN 9780750678384. [Google Scholar]
- Burkart, M.R.; Stoner, D.J. Nitrate in aquifers beneath agricultural systems. Water Sci. Technol. 2007, 56, 59–69. [Google Scholar] [CrossRef]
- Wichmann, W. World Fertilizer Use Manual; International Fertilizer Association: Paris, France, 1992. [Google Scholar]
- Ministry of Rural Development and Food. Data on the Integrated Management System of Cultivated Areas; Ministry of Rural Development and Food: Athens, Greece, 1995–2007.
- Pisinaras, V.; Petalas, C.; Tsihrintzis, V.A.; Zagana, A. A groundwater flow model for water resources management in the Ismarida plain, North Greece. Environ. Model. Assess. 2007, 12, 75–89. [Google Scholar] [CrossRef]
- Antonakos, A.; Lambrakis, N. Hydrodynamic characteristics and nitrate propagation in Sparta aquifer. Water Resour. Res. 2000, 34, 3977–3986. [Google Scholar] [CrossRef]
- Zajac, Z.; Revilla-Romero, B.; Salamon, P.; Burek, P.; Hirpa Feyera, A. The impact of lake and reservoir parameterization on global streamflow simulation. J. Hydrol. 2016, 548, 552–568. [Google Scholar] [CrossRef] [PubMed]
- Yihdego, Y.; Webb, J.A.; Vaheddoost, B. Highlighting the role of groundwater in lake—Aquifer interaction to reduce vulnerability and enhance resilience to climate change. Hydrology 2017, 4, 10. [Google Scholar] [CrossRef]
- Seeboonruang, U. Impacts of reservoir on groundwater level and quality in a Saline Area, Nakhon Panom Province, Thailand. APCBEE Procedia 2012, 4, 16–21. [Google Scholar] [CrossRef]
- Guo, W. Transient groundwater flow between reservoirs and water-table aquifers. J. Hydrol. 1997, 195, 370–384. [Google Scholar] [CrossRef]


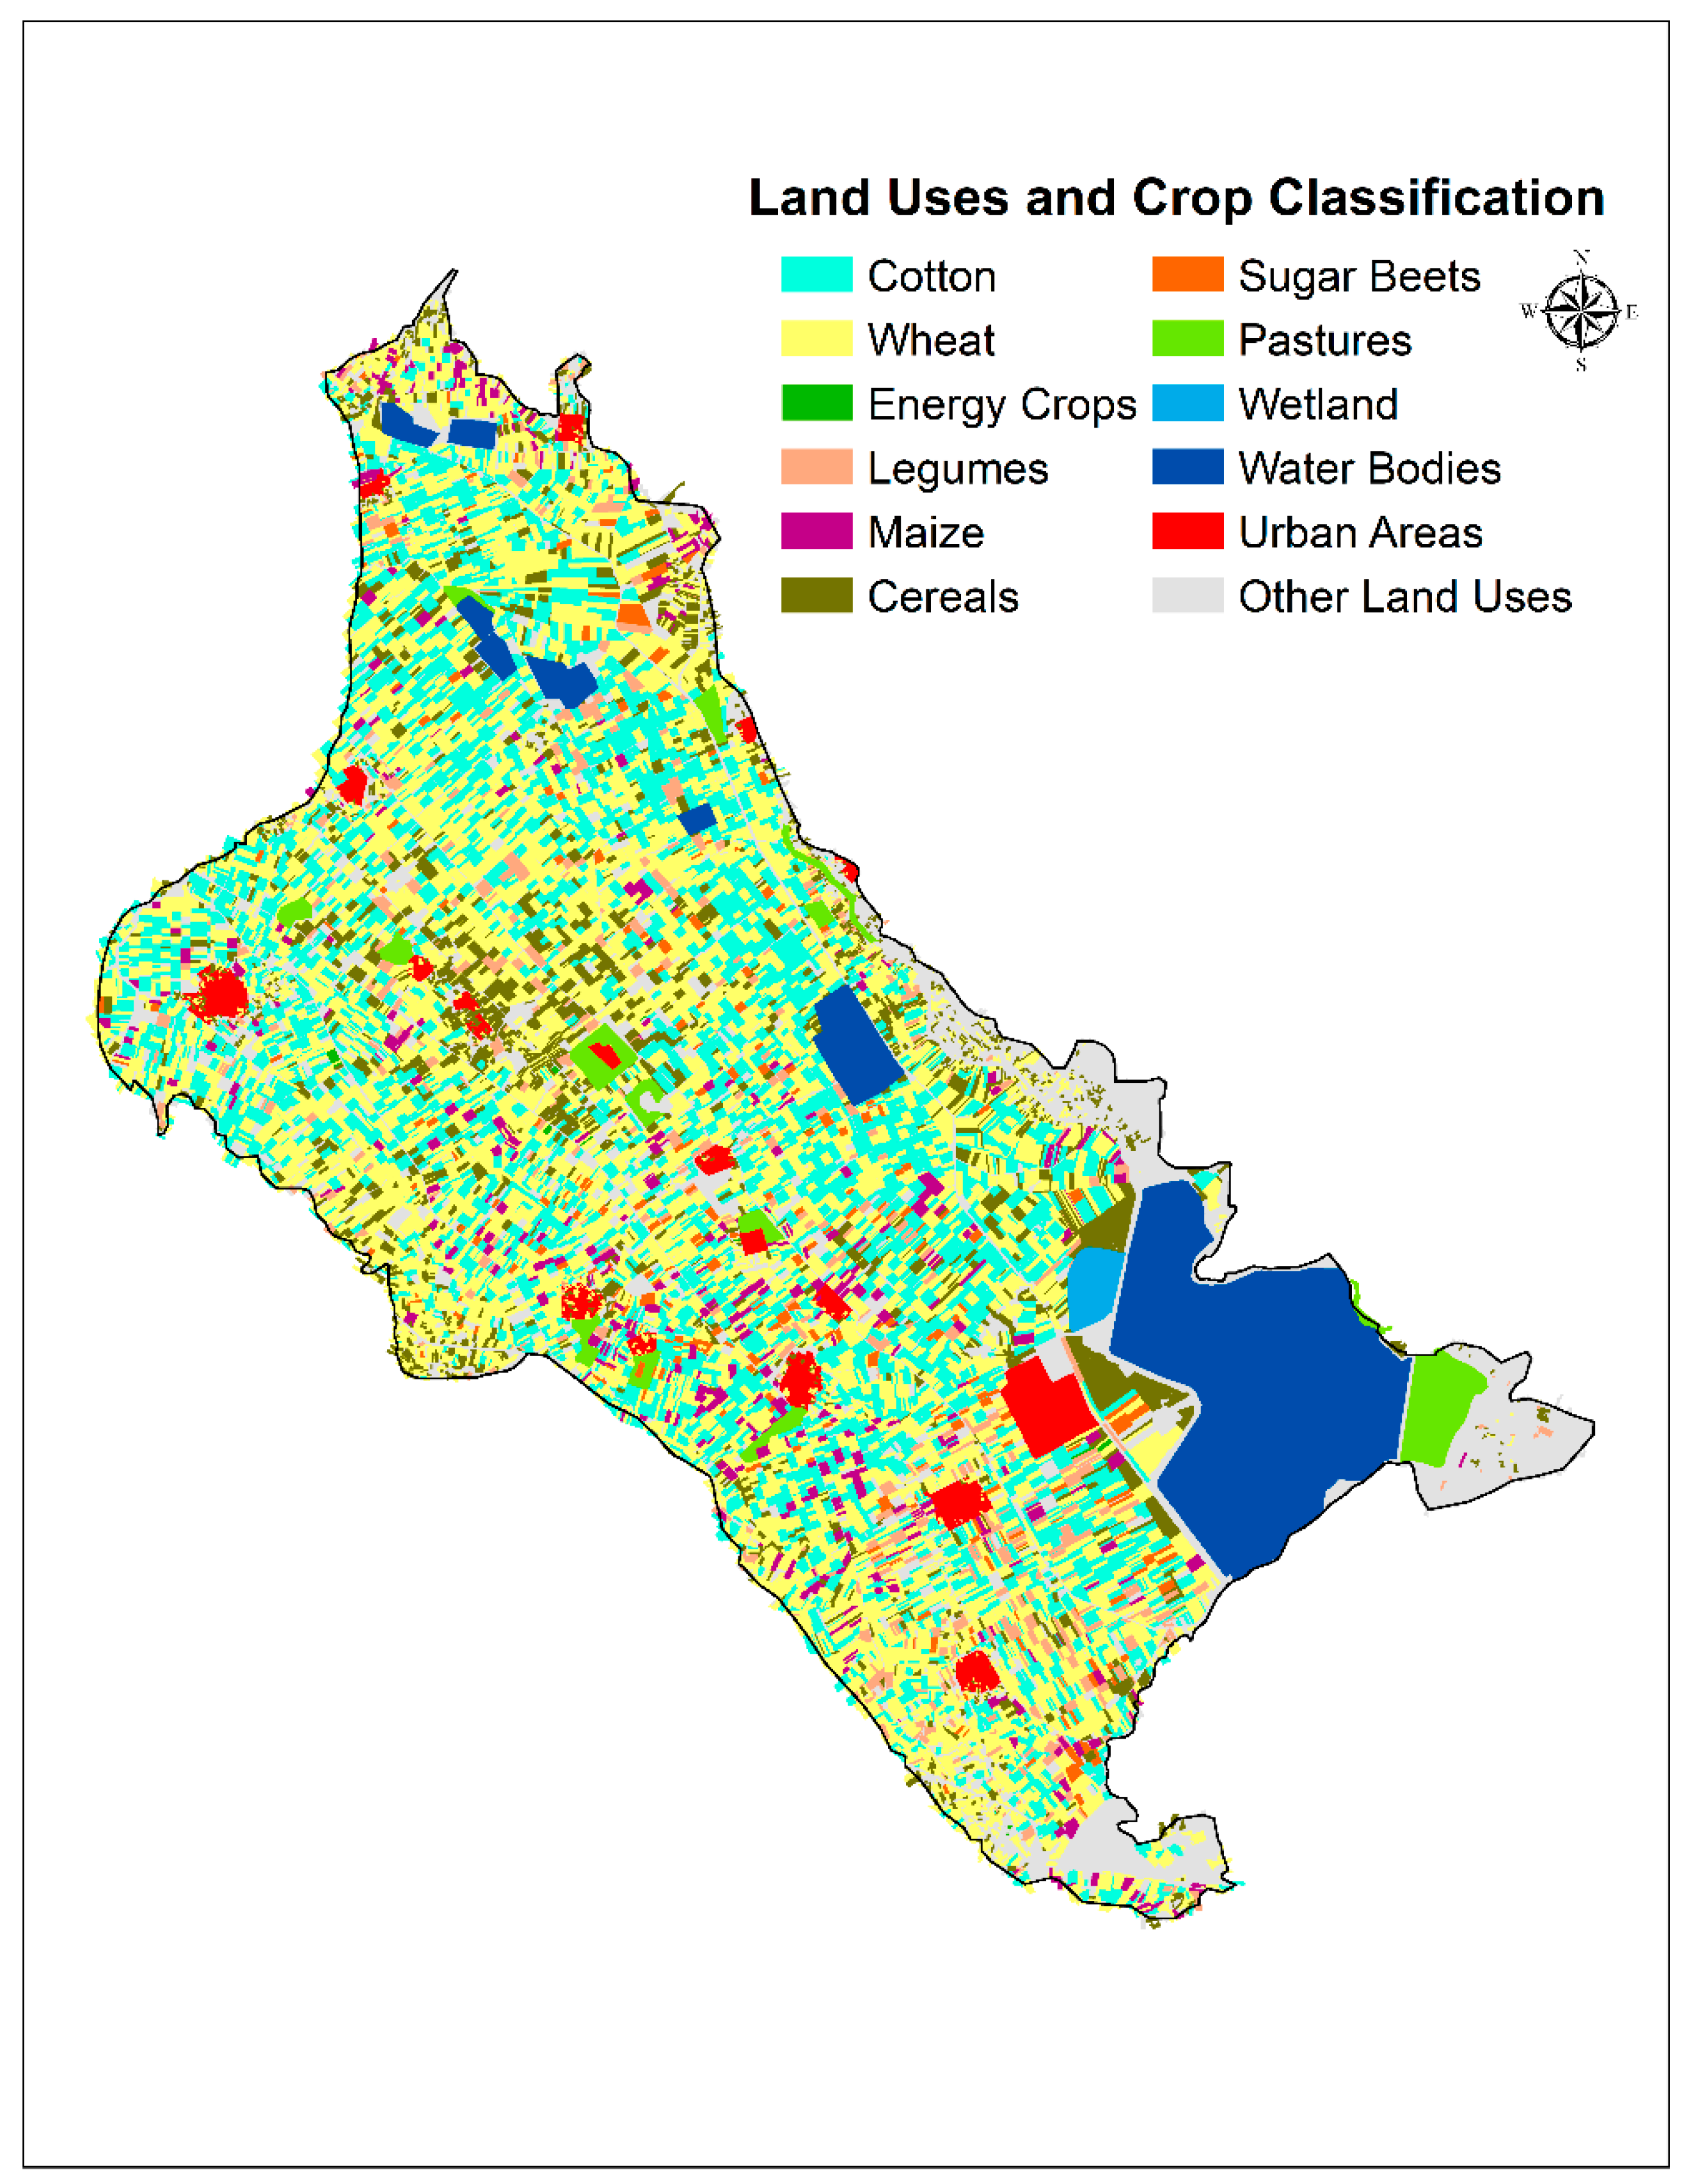
| Crops | Area km2 | Percentage (%) |
|---|---|---|
| Cotton | 114.47 | 22.89 |
| Wheat | 153.19 | 30.64 |
| Energy Crops | 0.28 | 0.06 |
| Legumes | 14.38 | 2.88 |
| Maize | 12.29 | 2.46 |
| Cereals | 32.23 | 6.45 |
| Sugar Beets | 8.67 | 1.73 |
| Pastures | 37.24 | 7.45 |
| Wetland | 1.91 | 0.38 |
| Water Bodies | 42.28 | 8.46 |
| Urban Areas | 42.81 | 8.56 |
| Other Land Uses | 40.25 | 8.05 |
| Total Area | 500.00 | 100.00 |
| Crops | Nitrate Loading | |
|---|---|---|
| Before Calibration (kg/ha/year) | After Calibration (kg/ha/year) | |
| Cereal Crops | 100 | 140 |
| Cotton | 150 | 240 |
| Energy Crops | 220 | 310 |
| Legumes | 0 | 30 |
| Maize | 250 | 330 |
| Sugar Beets | 115 | 195 |
| Wheat | 140 | 240 |
| MODFLOW Simulation Results | |||||||||
|---|---|---|---|---|---|---|---|---|---|
| Historical Period | Mid-Term Period | Long-Term Period | |||||||
| A1B | A2 | B1 | A1B | A2 | B1 | ||||
| Hydraulic Head (m) | CS sub-scenario | Min | −80.60 | −216.49 | −146.96 | −201.37 | −198.11 | −218.31 | −228.32 |
| Max | 105.57 | 49.81 | 69.85 | 58.68 | 58.68 | 60.04 | 49.82 | ||
| Mean | 44.52 | −31.66 | 45.81 | 7.04 | 6.95 | −16.38 | −30.97 | ||
| Median | 45.81 | −29.05 | 48.32 | 7.79 | 7.74 | −13.30 | −28.19 | ||
| Standard deviation | 0.97 | 1.62 | 2.18 | 2.31 | 2.33 | 2.85 | 1.65 | ||
| RCL sub-scenario | Min | −80.60 | −210.59 | −210.73 | −200.69 | −224.14 | −204.94 | −225.28 | |
| Max | 105.57 | 58.75 | 58.68 | 58.68 | 49.81 | 49.78 | 49.81 | ||
| Mean | 44.52 | 8.37 | 7.38 | 7.58 | −27.83 | −29.40 | −27.48 | ||
| Median | 45.81 | 9.10 | 7.91 | 8.05 | −23.69 | −25.55 | −23.32 | ||
| Standard deviation | 0.97 | 1.95 | 2.02 | 1.99 | 1.64 | 1.67 | 1.60 | ||
| AIM sub-scenario | Min | −80.60 | −208.44 | −201.37 | −202.03 | −224.56 | −231.40 | −221.41 | |
| Max | 105.57 | 58.68 | 60.31 | 56.08 | 49.81 | 62.29 | 49.81 | ||
| Mean | 44.52 | 7.19 | 19.25 | −1.30 | −30.38 | −12.01 | −33.06 | ||
| Median | 45.81 | 7.81 | 18.46 | −1.93 | −27.06 | −7.98 | −30.08 | ||
| Standard deviation | 0.97 | 2.21 | 2.53 | 2.74 | 1.70 | 1.44 | 1.35 | ||
| MODFLOW Simulation Results | |||||||||
|---|---|---|---|---|---|---|---|---|---|
| Historical Period | Mid-Term Period | Long-Term Period | |||||||
| A1B | A2 | B1 | A1B | A2 | B1 | ||||
| Hydraulic Head (m) | CS sub-scenario | Min | −79.00 | −201.11 | −202.25 | −205.72 | −223.95 | −222.59 | −197.11 |
| Max | 105.44 | 58.68 | 59.00 | 59.02 | 69.73 | 71.62 | 71.81 | ||
| Mean | 46.52 | 12.27 | 6.98 | 7.43 | −8.95 | −12.41 | −10.50 | ||
| Median | 47.22 | 11.82 | 7.51 | 8.00 | −1.93 | −3.73 | −1.97 | ||
| Standard deviation | 1.01 | 2.20 | 3.03 | 2.94 | 1.94 | 1.96 | 1.72 | ||
| RCL sub-scenario | Min | −79.00 | −202.22 | −207.48 | −201.73 | −224.73 | −224.21 | −229.15 | |
| Max | 105.44 | 58.99 | 59.00 | 59.02 | 71.71 | 71.62 | 71.81 | ||
| Mean | 46.52 | 8.33 | 8.05 | 8.54 | −8.18 | −9.25 | −7.47 | ||
| Median | 47.22 | 7.94 | 7.69 | 8.09 | −3.41 | −4.33 | −2.86 | ||
| Standard deviation | 1.01 | 2.58 | 2.64 | 2.55 | 1.55 | 1.61 | 1.54 | ||
| AIM sub-scenario | Min | −79.00 | −203.02 | −199.75 | −202.22 | −221.32 | −194.98 | −222.90 | |
| Max | 105.44 | 58.99 | 59.00 | 59.02 | 71.71 | 71.62 | 71.81 | ||
| Mean | 46.52 | 7.68 | 7.40 | 7.87 | −9.94 | −11.13 | −9.19 | ||
| Median | 47.22 | 7.98 | 7.69 | 8.21 | −3.07 | −4.05 | −2.66 | ||
| Standard deviation | 1.01 | 2.82 | 2.87 | 2.78 | 1.64 | 1.75 | 1.59 | ||
| MT3DMS Simulation Results | |||||||||
|---|---|---|---|---|---|---|---|---|---|
| Historical Period | Mid-Term Period | Long-Term Period | |||||||
| A1B | A2 | B1 | A1B | A2 | B1 | ||||
| Nitrate Concentration (mg/L) | CS sub-scenario | Min | 0.20 | 0.93 | 0.93 | 0.92 | 0.90 | 0.93 | 0.95 |
| Max | 32.64 | 31.87 | 32.47 | 31.70 | 47.72 | 50.48 | 47.18 | ||
| Mean | 14.13 | 13.86 | 13.96 | 13.84 | 18.54 | 18.66 | 18.45 | ||
| Median | 13.29 | 13.76 | 13.84 | 13.75 | 17.53 | 17.35 | 17.45 | ||
| Standard deviation | 0.87 | 0.18 | 0.17 | 0.17 | 0.45 | 0.50 | 0.44 | ||
| RCL sub-scenario | Min | 0.20 | 0.93 | 0.93 | 0.92 | 1.06 | 1.05 | 1.07 | |
| Max | 32.64 | 30.73 | 31.13 | 31.17 | 49.26 | 48.93 | 51.33 | ||
| Mean | 14.13 | 13.80 | 13.69 | 13.86 | 18.39 | 18.23 | 18.12 | ||
| Median | 13.29 | 13.75 | 13.66 | 13.76 | 17.45 | 17.03 | 16.89 | ||
| Standard deviation | 0.87 | 0.19 | 0.21 | 0.14 | 0.47 | 0.50 | 0.45 | ||
| AIM sub-scenario | Min | 0.20 | 0.93 | 0.93 | 0.92 | 0.98 | 0.98 | 0.99 | |
| Max | 32.64 | 31.28 | 31.71 | 31.01 | 48.05 | 49.78 | 47.24 | ||
| Mean | 14.13 | 13.87 | 13.61 | 13.84 | 18.54 | 17.97 | 18.44 | ||
| Median | 13.29 | 13.77 | 13.29 | 13.75 | 17.51 | 16.91 | 17.43 | ||
| Standard deviation | 0.87 | 0.18 | 0.19 | 0.17 | 0.46 | 0.48 | 0.45 | ||
| MT3DMS Simulation Results | |||||||||
|---|---|---|---|---|---|---|---|---|---|
| Historical Period | Mid-Term Period | Long-Term Period | |||||||
| A1B | A2 | B1 | A1B | A2 | B1 | ||||
| Nitrate Concentration (mg/L) | CS sub-scenario | Min | 0.06 | 0.26 | 0.26 | 0.26 | 0.18 | 0.17 | 0.19 |
| Max | 24.04 | 20.58 | 20.69 | 20.37 | 20.84 | 20.56 | 20.77 | ||
| Mean | 11.40 | 11.06 | 11.06 | 18.85 | 10.33 | 10.34 | 19.20 | ||
| Median | 11.33 | 11.23 | 11.23 | 11.06 | 10.43 | 10.44 | 10.33 | ||
| Standard deviation | 0.23 | 0.06 | 0.05 | 0.10 | 0.03 | 0.03 | 0.09 | ||
| RCL sub-scenario | Min | 0.06 | 0.26 | 0.26 | 0.26 | 0.22 | 0.21 | 0.23 | |
| Max | 24.04 | 18.95 | 18.49 | 18.47 | 19.52 | 18.08 | 19.24 | ||
| Mean | 11.40 | 11.06 | 11.21 | 11.21 | 10.50 | 10.50 | 10.49 | ||
| Median | 11.33 | 11.23 | 11.17 | 11.17 | 10.44 | 10.45 | 10.43 | ||
| Standard deviation | 0.23 | 0.06 | 3.27 | 3.27 | 3.24 | 3.25 | 3.23 | ||
| AIM sub-scenario | Min | 0.06 | 0.26 | 0.26 | 0.23 | 0.20 | 0.18 | 0.15 | |
| Max | 24.04 | 19.65 | 18.59 | 18.79 | 19.06 | 18.59 | 19.98 | ||
| Mean | 11.40 | 11.06 | 11.10 | 11.21 | 10.49 | 10.36 | 10.48 | ||
| Median | 11.33 | 11.23 | 10.98 | 11.17 | 10.43 | 10.23 | 10.42 | ||
| Standard deviation | 0.23 | 0.06 | 3.23 | 3.27 | 3.25 | 3.20 | 3.27 | ||
© 2019 by the authors. Licensee MDPI, Basel, Switzerland. This article is an open access article distributed under the terms and conditions of the Creative Commons Attribution (CC BY) license (http://creativecommons.org/licenses/by/4.0/).
Share and Cite
Sidiropoulos, P.; Tziatzios, G.; Vasiliades, L.; Mylopoulos, N.; Loukas, A. Groundwater Nitrate Contamination Integrated Modeling for Climate and Water Resources Scenarios: The Case of Lake Karla Over-Exploited Aquifer. Water 2019, 11, 1201. https://doi.org/10.3390/w11061201
Sidiropoulos P, Tziatzios G, Vasiliades L, Mylopoulos N, Loukas A. Groundwater Nitrate Contamination Integrated Modeling for Climate and Water Resources Scenarios: The Case of Lake Karla Over-Exploited Aquifer. Water. 2019; 11(6):1201. https://doi.org/10.3390/w11061201
Chicago/Turabian StyleSidiropoulos, Pantelis, Georgios Tziatzios, Lampros Vasiliades, Nikitas Mylopoulos, and Athanasios Loukas. 2019. "Groundwater Nitrate Contamination Integrated Modeling for Climate and Water Resources Scenarios: The Case of Lake Karla Over-Exploited Aquifer" Water 11, no. 6: 1201. https://doi.org/10.3390/w11061201
APA StyleSidiropoulos, P., Tziatzios, G., Vasiliades, L., Mylopoulos, N., & Loukas, A. (2019). Groundwater Nitrate Contamination Integrated Modeling for Climate and Water Resources Scenarios: The Case of Lake Karla Over-Exploited Aquifer. Water, 11(6), 1201. https://doi.org/10.3390/w11061201