Article

Water Table Trend—A Sustainability Status of Groundwater Development in North-West Bangladesh

1
Department of Irrigation and Water Management, Bangladesh Agricultural University, Mymensingh 2202, Bangladesh
2
CSIRO Land and Water, GPO Box 1700, Canberra ACT 2601, Australia
3
CSIRO Land and Water, Perth WA 6009, Australia
*
Author to whom correspondence should be addressed.
Water 2019, 11(6), 1182; https://doi.org/10.3390/w11061182
Submission received: 10 May 2019 / Revised: 4 June 2019 / Accepted: 4 June 2019 / Published: 6 June 2019
(This article belongs to the Section Water Resources Management, Policy and Governance)

Abstract

:
Historical trends of the annual maximum and minimum depths of groundwater tables (GWTs) that are indicative of sustainability status of groundwater resources still remain inadequately studied in the North-West (NW) hydrological region of Bangladesh. This study aimed at evaluating long-term (1985–2016) trends of GWTs of 350 monitoring wells and their impacts on groundwater development status in that region. The trends of the annual maximum and minimum depths of GWTs were determined and evaluated by using MAKESENS trend model. The functionality of suction-mode pumps was identified based on the annual maximum depth of GWTs. A significant (p ≤ 0.05) falling trend of the annual maximum depths of GWTs in 65.71% of the monitoring wells revealed continuous increase in groundwater abstraction. A significant falling trend of the annual minimum depths of GWTs in 69.71% of the monitoring wells revealed groundwater mining. GWTs remained below the suction limit (≈6 m) for 3 to 6 months in each year in 59.72% of the monitoring wells and for the whole year in 15.14% of the monitoring wells, making suction-mode pumps inoperable and creating domestic water scarcity. Therefore, groundwater extraction in many locations has become unsustainable, and hence, measures such as artificial recharge to the aquifers and water-saving technologies are needed to prevent groundwater mining.

1. Introduction

Worldwide, groundwater provides over 97% of accessible freshwater, half of the drinking water, and approximately half of the irrigation water for agriculture [1]. In Bangladesh, scarcity of surface water has made groundwater an essential source to supplement dry season water demand to meet urban, industrial, and irrigation requirements [2,3]. Groundwater abstraction has tremendously increased in Bangladesh since the 1980s. Currently, it supplies 79% of the water demand for irrigation, livestock, household, and industrial usages [4]. In the North-West (NW) region of the country, about 95% of irrigation water comes from groundwater, which is extracted, mainly, by shallow tubewells (STW) and deep tubewells (DTW), in addition to some small-capacity pumping technologies, such as hand pumps, popularly known as hand tubewells (HTWs), rower pumps, and treadle pumps. There are now 1.77 million irrigation pumps in the country, of which 1.56 million are STWs [5,6]. In addition to irrigation, most STWs also supply water for domestic usage.
Groundwater in Bangladesh is a renewable and dynamic natural resource. It maintains that dynamism by recharging, mainly in the wet or monsoon season (June–September) through monsoon rainfall and flooding, and receding during the dry season (April–May) due to withdrawal for various usages, especially for irrigation. Irrigated crop fields also contribute to groundwater recharge; especially, for shallow aquifers much of the irrigation water returns to aquifer [7]. Prior to widespread abstraction of groundwater from the mid-1980s and onwards, water tables in the mostly unconfined aquifers of Bangladesh were generally shallow with a weak seasonal fluctuating trend. After the monsoon period, groundwater tables were near, or in some places, very close to the ground surface. At the end of the dry season, GWTs receded, mainly due to evapotranspiration and inter-basin flow out of the aquifers. Much of the potential recharge from rainfall and flooding in the monsoon period was rejected due to the limited storage capacity of the aquifers. However, with increasing abstraction of groundwater, GWTs fall at a greater rate during the dry season, when pumping for various usages and base flow to the rivers deplete the aquifers. The deepest GWTs are now found from April to mid-May and the shallowest GWTs are found in November [8].
Most parts of the NW region of the country are flood-free zones and the main source of groundwater recharge is rainfall, which is also the lowest in this region. Moreover, the expanding presence of plough pans due to the increasing practice of conservation agriculture, and especially, the thick sticky clay surface (6.10−21.34 m) of the Barind Tract act as aquitards and hinder groundwater recharge by increasing surface runoff. As a result, groundwater use in the Barind area has exceeded recharge and GWTs have been successively falling over the years, with increasing withdrawal of groundwater for irrigation [8,9]. Rajshahi, Pabna, Bogura, Dinajpur, and Rangpur were identified as the severely depleted areas, with depletion of GWTs between 2.3 m and 11.5 m [10]. However, it is not clear whether the declining groundwater levels in the rest of the NW region results from excessive use or an observed decline in rainfall, or from a combination of these and possibly other factors. GWTs at many areas in the NW region fall below 8 m during March–May in each year, causing water scarcity for domestic supply [11], agriculture, and secured livelihood [12]. Here, water scarcity implies the lack of access to adequate quantity of water for human, animal, and environmental requirements. Therefore, groundwater use in the Barind area, especially from shallow aquifers, has become unsustainable [13,14]. Population growth, agricultural pollution, urbanization, climate change, and poor water management practices are threatening the water resources in Bangladesh and are challenging to their sustainable management [15,16,17]. Changes in the spatial-time series (1990−2010) of pre-monsoon and post-monsoon groundwater depths in the NW region of Bangladesh suggest that if the current level of groundwater usage continues, the resulting GWTs will decline continuously with a potential long-term threat to the sustainability of irrigated agriculture [18]. Consequently, groundwater research needs to be focused both in its thematic and critical areas, due to the appearance of unexpected or unanticipated problems [19].
Continuous monitoring of groundwater is required [20] to know the dynamic equilibrium or non-equilibrium nature of the groundwater resources in the aquifers and the associated sustainability issues of the groundwater resources. Trend analysis of hydrological and meteorological data is needed to explain the dynamic behavior of GWTs [21]. The trend of GWTs, indicating general direction of their change or development, reveals the condition of groundwater resources in terms of sustainability. Since GWTs in the NW region of Bangladesh have been successively falling over the years [11], the trend of GWTs and associated sustainability status of groundwater availability in the region are important topics for investigation. The trend of GWTs, especially with latest data sets, is needed to adjust groundwater development and management policy. The locations of critical depth of GWTs for operating suction mode pumps can identify the places with water scarcity for irrigation and domestic needs. The goal of this study was to know the long-term trend of the yearly maximum and minimum depths of GWTs from ground surfaces in the NW region of Bangladesh over the past 32 years (1985–2016). The specific objectives were: (i) to identify and quantify the trends of GWTs over the years from 1985 to 2016, (ii) to infer sustainability status of groundwater extraction from the aquifers based on their recharge and depletion magnitudes, and (iii) to identify locations where suction-mode pumps are now an inappropriate technology for groundwater extraction.

2. Materials and Methods
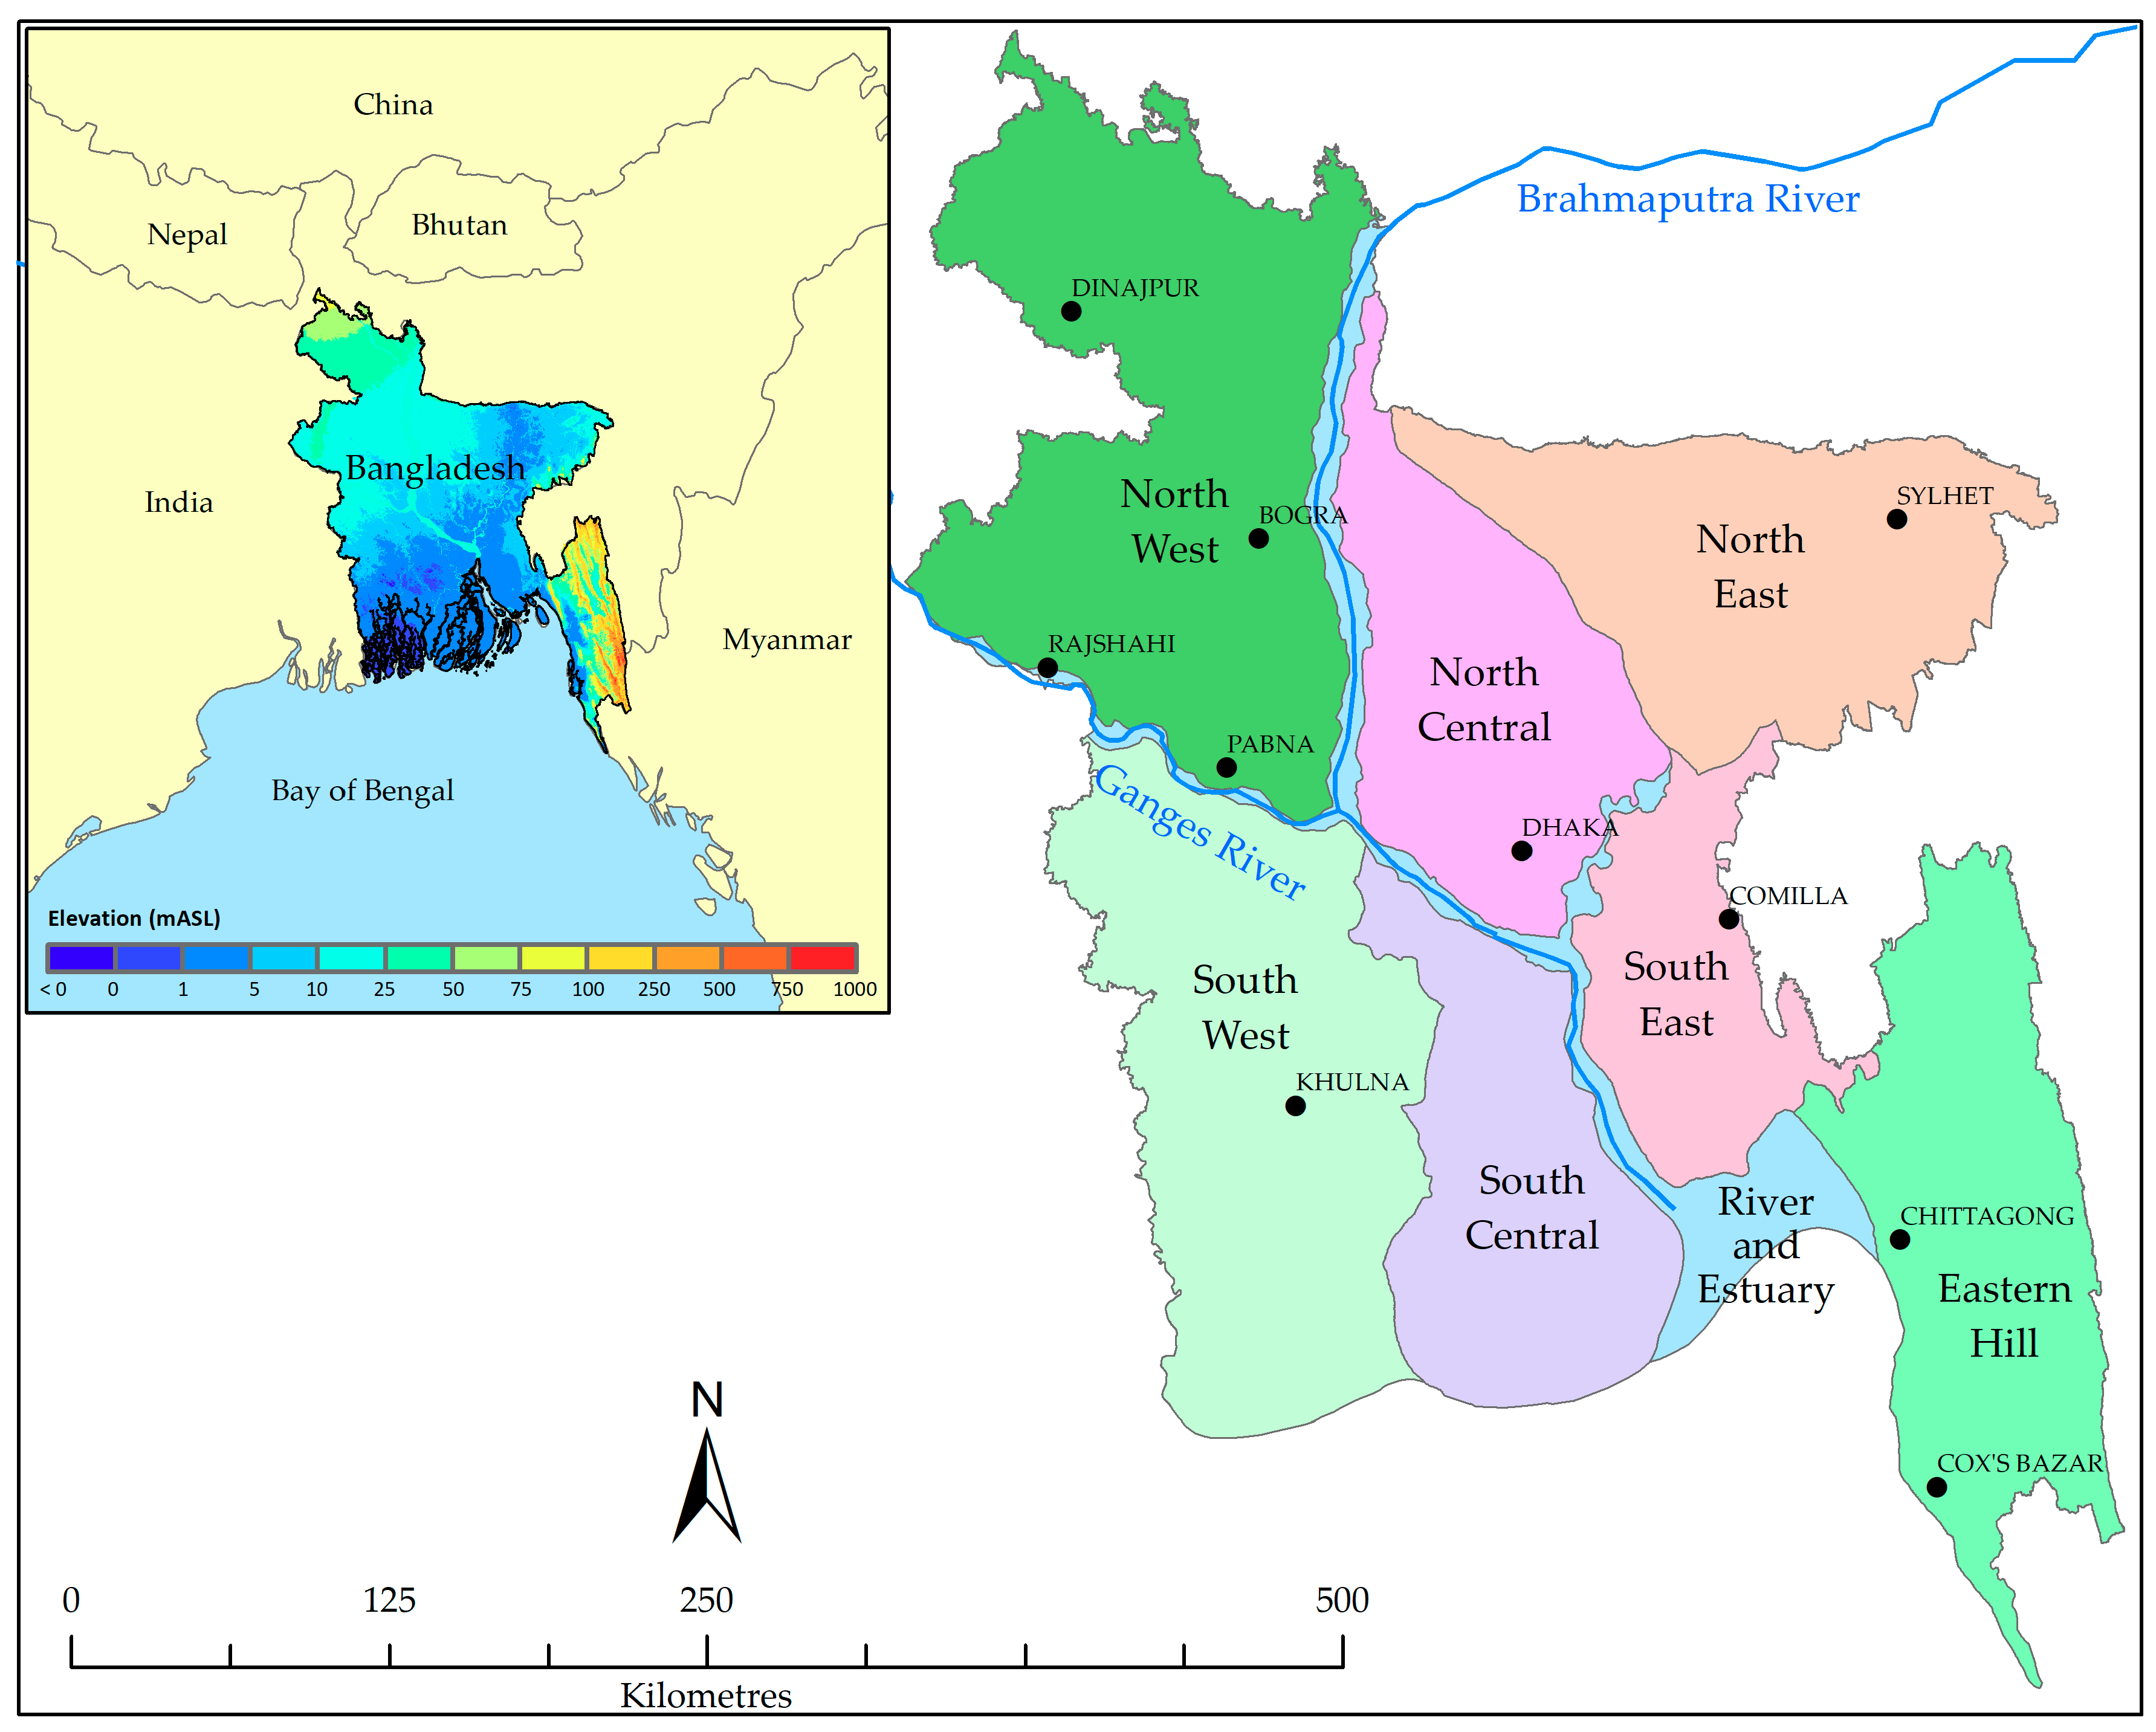
2.1. Study Area

Bangladesh has eight Hydrological Regions, which are mainly characterized by surface water flow processes and major rivers as boundaries (Figure 1). These regions are North West (NW), North Central (NC), North East (NE), South East (SE), South Central (SC), South West (SW), Eastern Hills (EH), and the active flood plains and char lands of the main rivers and estuaries [22]. It is noted that although usually the boundaries of watersheds or water region coincide with water divides, the hydrological regions in Bangladesh were delineated based on appropriate natural features for planning of the development of their water resources. Accordingly, in defining the hydrological regions, the principles adopted [22] were: (i) the entire country should be covered; (ii) the principal rivers and natural features should form the boundaries; (iii) the principal rivers themselves should form a region; and (iv) effective use should be made of previous studies. The Barind Tract and its surrounding areas have been divided into three major physiographic units and fifteen sub-units. The major units are the Barind Tract, Channel-floodplain complexes, and Himalayan piedmont plain (Tisa Fan). The elevation of the Barind Tract ranges from about 11–48 m above mean sea level (AMSL), the floodplain is about 8–23 m AMSL, and the Tista Fan is about 30–45 m AMSL. There is a wide variation in the sub-surface lithology of the NW hydrological region. The upper-most layer of Rajshahi area (Figure 1) comprised a 2.5 to 35 m thick clay to silty clay layer, but in Pabna, the upper-most clay to silty clay layer varies from 1 to 20 m. The aquifers in these areas are generally unconfined. In the northern half of NW region (Rangpur area), the upper layer of soil comprised coarse and medium sand and gravel and the aquifers are unconfined. This study focused on the NW hydrological region, which covers the administrative divisions of Rajshahi and Rangpur. Rajshahi division, consisting of 8 districts and 70 upazillas, has an area of 18,174.4 square kilometers and a population of 18,484,858, and Rangpur division, which consists of 8 districts and 58 upazillas, has a population of 15,665,000 [23]. In the NW region, the mean maximum temperature is 32 °C in summer, mean minimum temperature is 10 °C in winter, annual average rainfall is 1927 mm, and potential evapotranspiration is 1309 mm [9].
Groundwater irrigation is crucial to the recent attainment of rice grain food security in Bangladesh [24]. The NW region alone supplies about 35 percent of the irrigated Boro rice and about 60 percent of the wheat of the whole country [9,25]. The use of groundwater in this region is the most intense; over 97% of the total area (85% of net cultivable area) was irrigated by groundwater during 2012–2013 [26]. The increased irrigation coverage associated with increased extraction of groundwater from the aquifers over the last three decades has contributed to decline in groundwater levels. Therefore, the NW region, especially, the Barind area, is of greatest concern over falling groundwater levels [14], which lead to a lack of access to water for drinking and irrigation in some areas. Sustaining groundwater irrigation in the NW region is, therefore, vital for the domestic water supply and future food security of Bangladesh. In this context, investigation of the groundwater table dynamics in the NW region to evaluate the nature of equilibrium of the groundwater resources is crucial, since this can dictate policies for future groundwater use in the region.

2.2. Data Collection and Preparation

Bangladesh Water Development Board (BWDB) maintains an extensive groundwater monitoring database, which contains time series of groundwater table depth recordings of about 1200 monitoring wells across the country. Although some wells have GWT data from the mid-1960s onwards, most wells have weekly GWT data from 1985. The NW region has a total of 437 monitoring wells, and their water table data from 1985 to 2016 were analyzed in this study. First, by plotting the observed GWT data against time in scatter plots, the important features of the data, such as trends, seasonality, discontinuities, and outliers, were identified. The monitoring wells with more than 5 years discontinuous data and irrational or erratic distribution of water tables, and also the wells with identification problems, were discarded. In total, 350 monitoring wells had good quality GWT data and these were selected for trend analysis and critical GWT depth identification. Because of the large-size information, the geographical distribution of these monitoring wells is provided as supplementary material in Table S1. From the weekly GWT data of the monitoring wells, annual maximum and minimum depths of GWTs from ground surface were identified and recorded in a MS Excel spread sheet separately for each well.

2.3. Trend Analysis

In determining trends and drift of time-series data, Mann-Kendall-Sens (MAKESENS) statistics is a well-adopted method. This statistics is based on non-parametric Mann-Kendall tests to identify the trend and non-parametric Sen’s method to quantify the trend [27]. This type of trend statistics is applicable for both monotonic and non-monotonic trends. MAKESENS utilizes two statistics, called S-statistics and Z-statistics [28], to estimate trend. For time series with less than 10 data points, S-statistics is used, and for time series with ≥10 data points, Z-statistics is used. If x1, x2, x3, …, xj represent n data points, where xj is the data point at time j, Mann-Kendall statistics “S” is expressed by
S = k = 1 n 1 j = k + 1 n sgn ( x j x k )
In Equation (1), sgn(xjxk) = 1 for xjxk > 0, or sgn(xjxk) = 0 for xjxk = 0, or sgn(xjxk) = −1 for xjxk < 0. The normalized Z-statistics is given by
Z = S 1 [ V A R ( S ) ] 1 / 2 if   S > 0 Z = S + 1 [ V A R ( S ) ] 1 / 2 if   S < 0 Z = 0 if   S = 0
The MAKESENS model provides trends of the annual maximum and minimum depths of GWTs in terms of Z-statistics (Equation (2)), slope, and intercept of the trend line. It also provides statistical significance of the GWT trends. This information for each monitoring well is provided as supplementary material in Tables S2 and S3 for the annual maximum and minimum depths of GWTs, respectively. The Z-statistics is a deterministic index of the trend. The intercept and slope together provide the trend lines. The slope of the trend lines determines magnitude and direction of the trend. Based on data type, especially sensitivity of change, the MAKESENS model determines statistical significance of the trend at p ≤ 0.05.

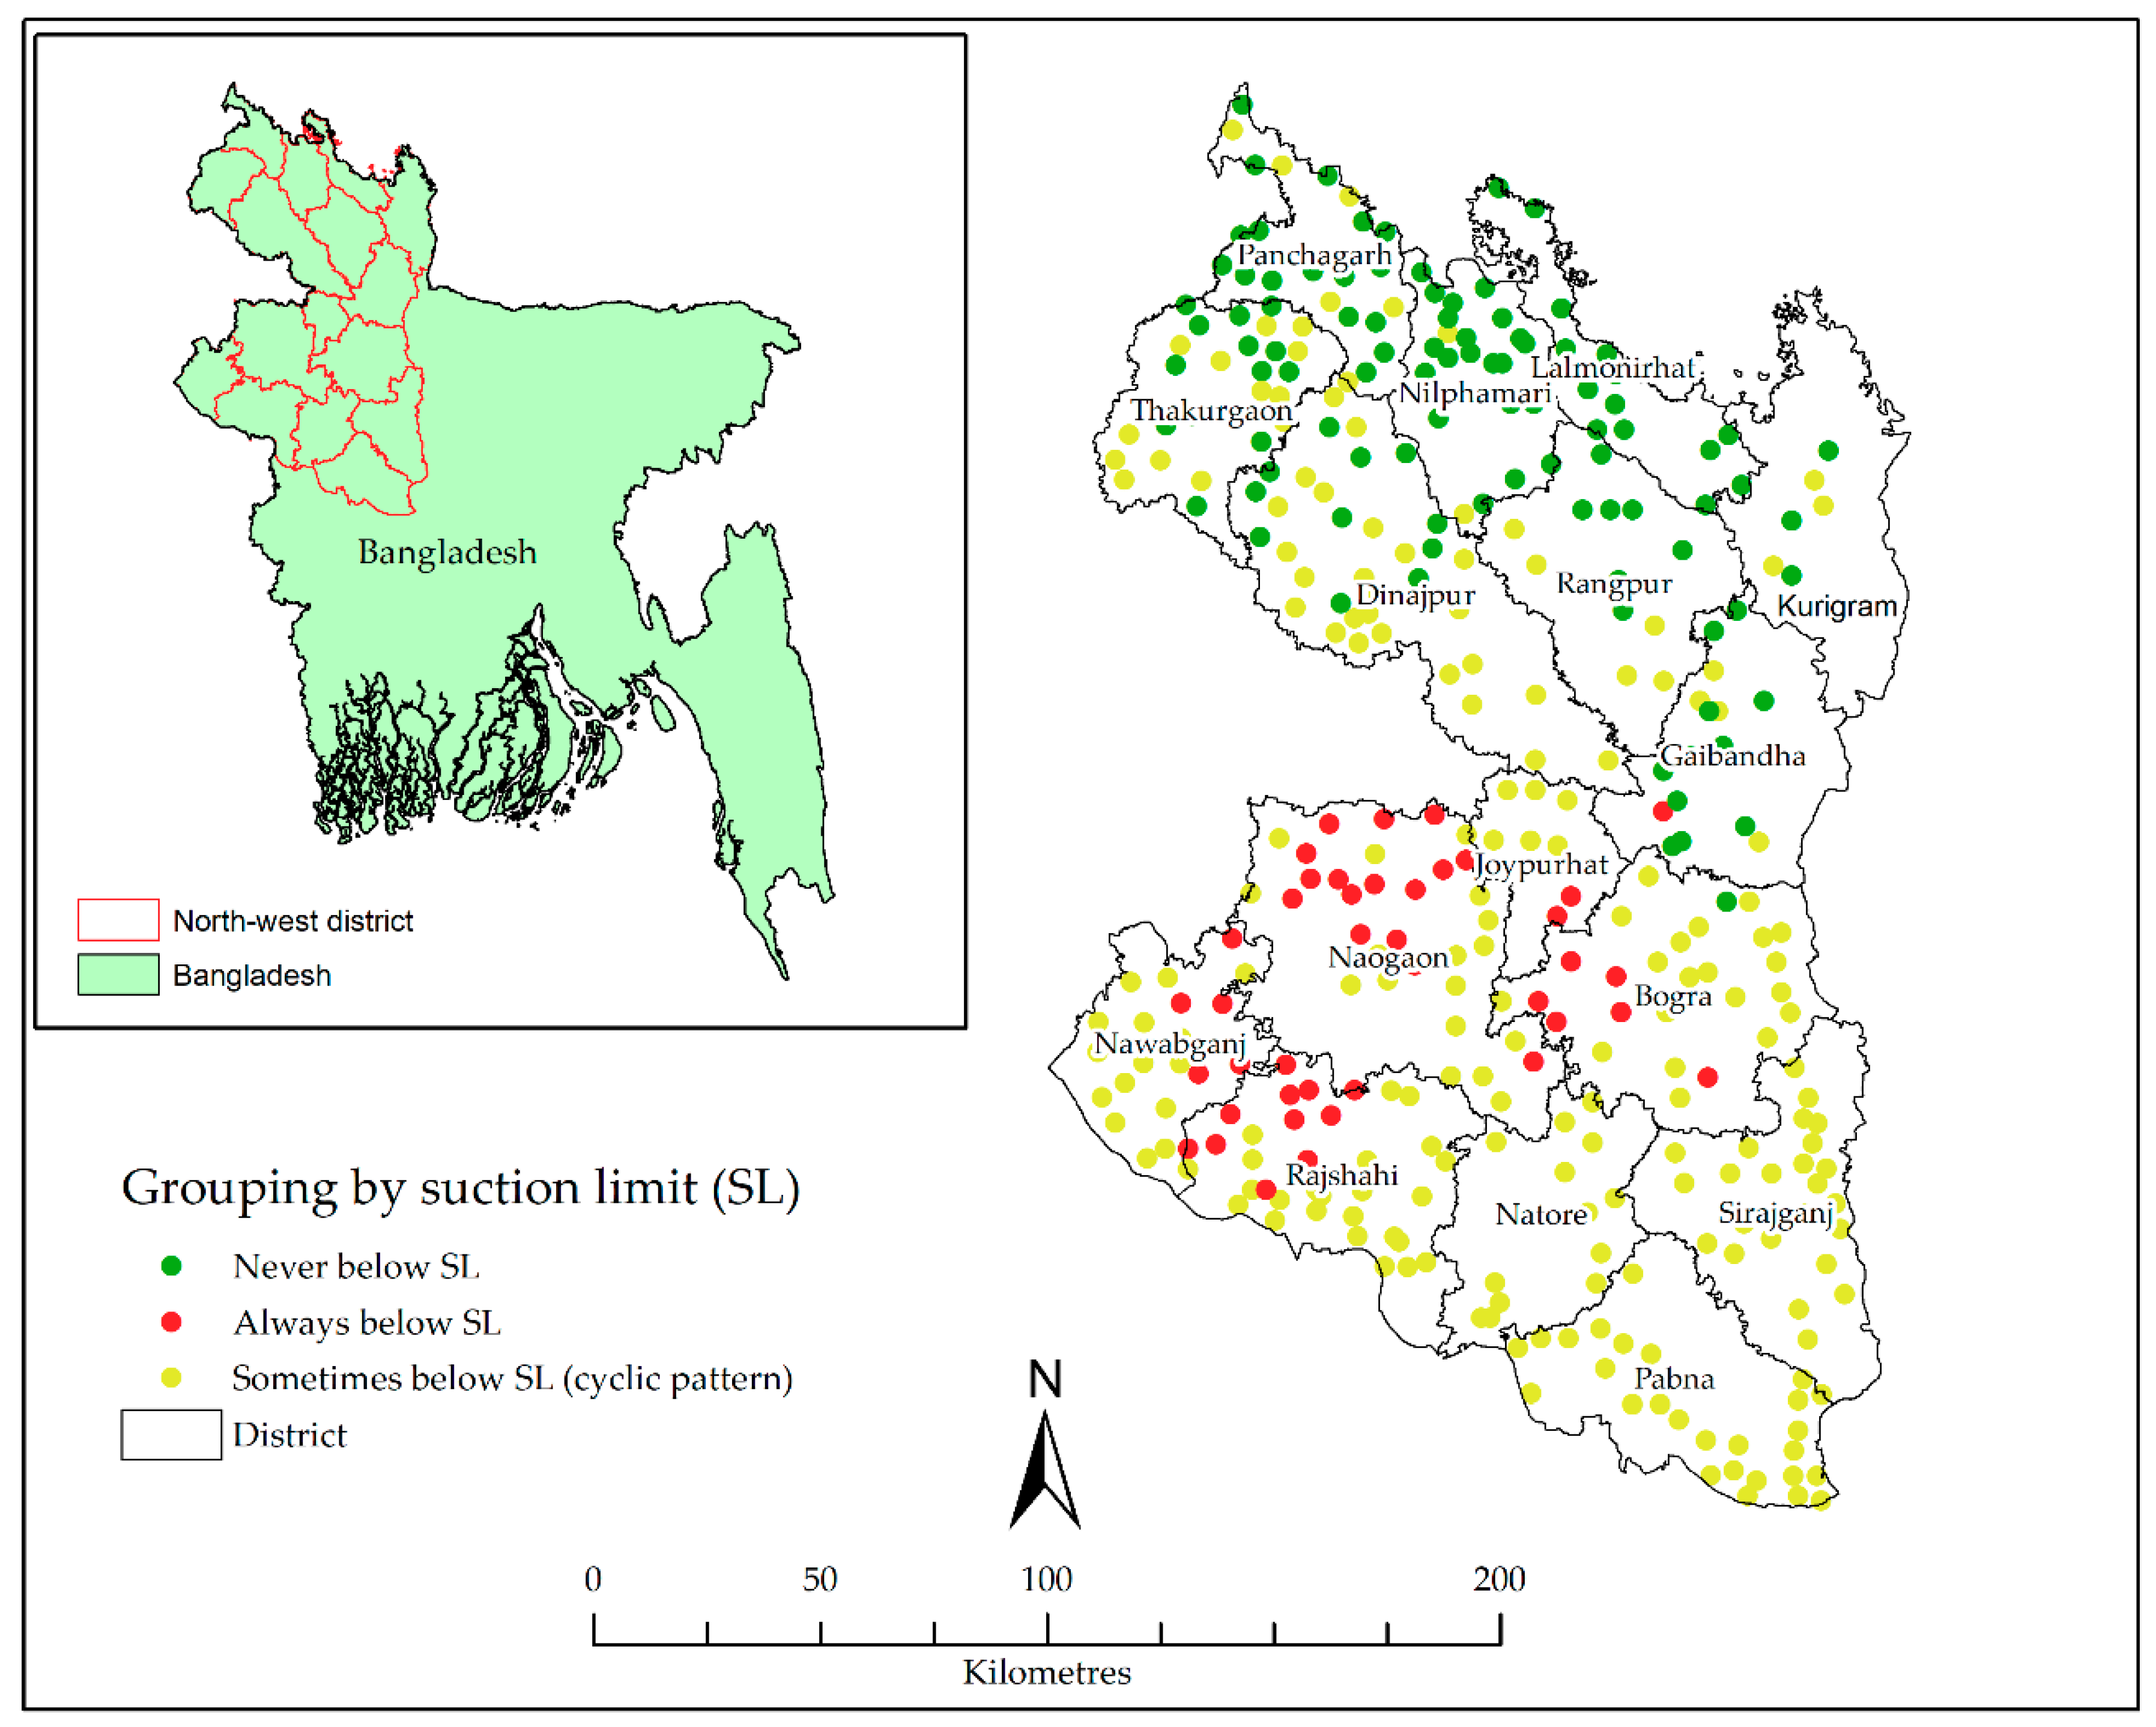
2.4. Water Scarcity Identification

All suction-mode pumps, including STW and HTW, utilize atmospheric pressure to lift water. The standard atmospheric pressure is 1.034 kg/cm2, which is equivalent to 10.34 m of water column. Therefore, the maximum theoretical lift for suction-mode tubewells for abstraction of groundwater is 10.34 m, which reduces to 8 m due to frictional head losses in the piping system. A further reduction in suction lift occurs due to dynamic drawdown of GWT during the pumping period, which depends on aquifers’ water transmitting properties and pumping rate. We determined specific drawdown (drawdown per unit discharge) from discharge-drawdown data of 31 DTWs of 19 upazillas of the North-West region. The specific drawdown varied from 0.14 to 15.24 m/m3/s, with a mean of 5.69 m/m3/s. This implies that a dynamic drawdown of 0.14 to 15.24 m per cubic meter per second of well discharge will occur at the well face during pumping. The design capacity of most STWs in the North-West region is 0.5 m3/s (14.3 L/s). Therefore, an average dynamic drawdown of 2.85 m will occur at the well face during the pumping period. The actual capacity of STWs is, however, smaller than the design capacity, and hence the dynamic drawdown will be smaller than the observed values. In this study, we used an average 2 m dynamic drawdown in calculating the suction lift limit of STWs. Thus, considering frictional head losses in the piping system and a dynamic drawdown of GWT (≈2 m) during pumping, practically, 6 m was considered as the critical depth (maximum suction lift) for pumping groundwater by the suction-mode pumps. However, the low-capacity suction-mode pumps, such as HTWs, do not create considerable drawdown of the GWT during pumping and they can operate up to 8.0 m suction lift or even a bit more in case of low frictional head loss. If GWT resides below the suction limit, it makes the suction-mode pumps inoperative.
The groundwater monitoring wells were categorized into three groups based on their GWT depths over the study period (1985–2016): (i) wells with GWTs below critical depth (6 m) during the whole year, (ii) wells with GWTs below critical depth for certain months of the year, and (iii) wells with GWTs above critical depth during whole year. The locations (up to village level) of these three categories of monitoring wells were identified to reveal the conditions of groundwater availability of the places from suction-mode pumps, especially for domestic water supply.

3. Results

3.1. Trend of Annual Maximum Depth of GWT

The trend of time-series of GWTs revealed the pattern of change of GWTs over the time period from 1985 to 2016; it revealed both the direction and magnitude of the changes. Among 350 monitoring wells with consistent GWT data, the annual maximum depths of GWTs from ground surface revealed falling/increasing trend in 300 wells, rising/decreasing trend in 48 wells, and no trend in 2 wells. Table 1 provides distribution of the monitoring wells with the three trend-types of the annual maximum depth of GWTs of 350 wells over sixteen districts in the NW region. Dinajpur and Joypurhat districts have the highest proportion (100%) of the monitoring wells, with falling trends of the annual maximum depth of GWTs. Nilphamari district has the largest number (8 out of 24) of monitoring wells with a rising trend of the GWTs. Only Chapai Nawabganj district has two wells with no trend of GWT. The falling water-table trend outnumbered the other two trend-types (rising and no trend) for the maximum depth of GWTs (Table 1). Among 300 monitoring wells with a falling trend of the annual maximum depths of GWTs, 244 (81.33%) wells showed significant (p ≤ 0.05) falling rate. Out of 48 monitoring wells with a rising trend of the annual maximum depths of GWTs, only 17 wells (35.42%) showed a significant rising trend. The distribution of the monitoring wells among 16 districts based on significance level of their GWT trends is given in Table 2.

3.2. Trend of Annual Minimum Depth of GWT

The annual minimum depths of GWTs revealed falling trends in 315 monitoring wells, rising trends in 31 wells, and no trend in only 4 wells over the years under investigation (1985–2016). Table 3 provides the distribution of the monitoring wells with different trend-types among 16 districts of the NW region. The majority of the monitoring wells showed falling trends of the annual minimum depths of GWTs, implying that recharge deficit in the aquifers had been increasing in the wet season over the study period (1985–2016). Rajshahi had the highest proportion (100%) of the monitoring wells with falling trend of the GWTs, while Nilphamari had the highest number (9 out of 15) of the monitoring wells with a rising trend of the GWTs. The number of monitoring wells with a falling trend of GWTs outnumbered the number of wells with a rising trend and no trend of GWTs (Table 3). Among 315 monitoring wells (Table 3), the annual minimum depths of GWTs in 230 (73%) wells dropped significantly (p ≤ 0.05) over the years. The GWTs in only 6 wells rose significantly. The distribution of the monitoring wells in different districts, based on significance level of their GWT trends, is given in Table 4.

3.3. Critical Depth of GWT

The annual minimum and maximum GWTs in some monitoring wells never dropped below 6 m (limiting or critical depth for operating suction-mode pumps) during 1985–2016, while the GWTs in some monitoring wells always remained below this depth. In another group of the monitoring wells, GWTs remained below 6 m during 3 to 6 months in most of the years during 1985–2016. Accordingly, the monitoring wells, regardless of their GWT-trend types, were divided into three groups based on the depth of GWTs in the wells. The numbers of monitoring wells having their GWTs always greater than critical depth, those that maintained critical depth for 3 to 6 months, and those having GWTs always above the critical depth in each district is given in Table 5. Identification of the individual monitoring wells of each group is provided as supplementary material in Table S4.
A large number of the monitoring wells (209 out of 350) had their GWTs below the suction lift limit for several months of the year. These wells maintained an annual cycle of their GWTs with the water table remaining below critical depth (6 m) in the dry season. The GWTs in 88 monitoring wells remained above the critical depth throughout the year, keeping STWs and other suction-mode pumps operational throughout the year. Fifty-three (53) monitoring wells had their GWTs always below the critical depth, demonstrating STWs and other suction-mode pumps as the technically infeasible technologies at those locations. Due to dominating number of the STWs over DTWs, water scarcity occurs when the STWs fail to operate because of the suction-lift limitation.

4. Discussion

4.1. Groundwater Abstraction Status

The falling trend of the annual maximum depths of GWTs in 300 monitoring wells (Table 1) implies steadily increased annual abstraction of groundwater from the aquifers for various usages and that the GWTs had been declining in the dry season over the years from 1985 to 2016. The rising trend of the annual maximum depths of GWTs in 48 monitoring wells indicates continual reduced annual abstraction of groundwater or continual annual increase in recharge to the aquifers, or some combination of these, while the GWTs with no trend in 2 monitoring wells suggest stable annual abstraction of groundwater from the aquifers over the years. Statistical significance in the variation of the annual maximum depths of GWTs is important for planned management of groundwater resources in the study area. In areas where the falling rates of GWTs are not significant (p ≤ 0.05), the observed changes in GWT trends are not currently concerning. However, the vast majority (244) of the monitoring wells (Table 2) in the NW region showed falling trends for the annual maximum depths of GWTs and a persistent decline in GWTs in the dry season that were statistically significant.
The declining trend of the annual maximum depths of GWTs in the dry season over the successive years for most of the monitoring wells was largely due to increased abstraction of groundwater for increased cultivation of irrigated crops [29], since most of the areas were used for intensive Boro cultivation. The declining trend of GWTs might also be due to reduced recharge caused by low rainfall, an expanding plough pan resulting from increasing conservation agriculture practices, and a thick clay surface in the Barind Tract. In the study area, the rainfall has decreased 10−45 mm/year over the last decade, which will likely lead to reduced natural recharge [30]. There is also evidence [7] of the reduced vertical hydraulic conductivity in irrigated rice fields due to the presence of plough pans. Inefficient use of water for domestic and irrigation purposes leads to over-extraction of groundwater and also contributes, to some extent, to declining GWTs. The falling trend of the annual maximum depths of GWTs, thus, indicates an ever-increasing extraction of groundwater in most parts in the NW hydrological region. Globally, agriculture accounts for the majority of freshwater withdrawals, with some water sources being drawn down faster than they are being replenished, as evidenced by the groundwater resources in NW Bangladesh. Given the necessity of increasing crop production, increased water requirement in irrigated agriculture is inevitable [24,31], although changing cropping patterns to lower water usage of crops may mitigate this risk to some degree. Therefore, the prevailing situation in most parts of the study area is likely a push to exploit more water for food security in the face of a changing and more variable climate [32]. In line with global high expectations for improved water management to drive agricultural growth and poverty reduction [33], further development of yet unexploited water sources is the most plausible option of satisfying increasing future water demand in Bangladesh. Exploiting underutilized rivers and streams, estimating aquifers’ safe yields, recharging the aquifers by natural and artificial means, harvesting rain water, and utilizing wastewater are the possible scopes for this option. Also, practice such as mulching can increase water-holding capacity of field soils and decrease evaporation [34]; organic mulching, by increasing soil organic matter, can also facilitate groundwater recharge.

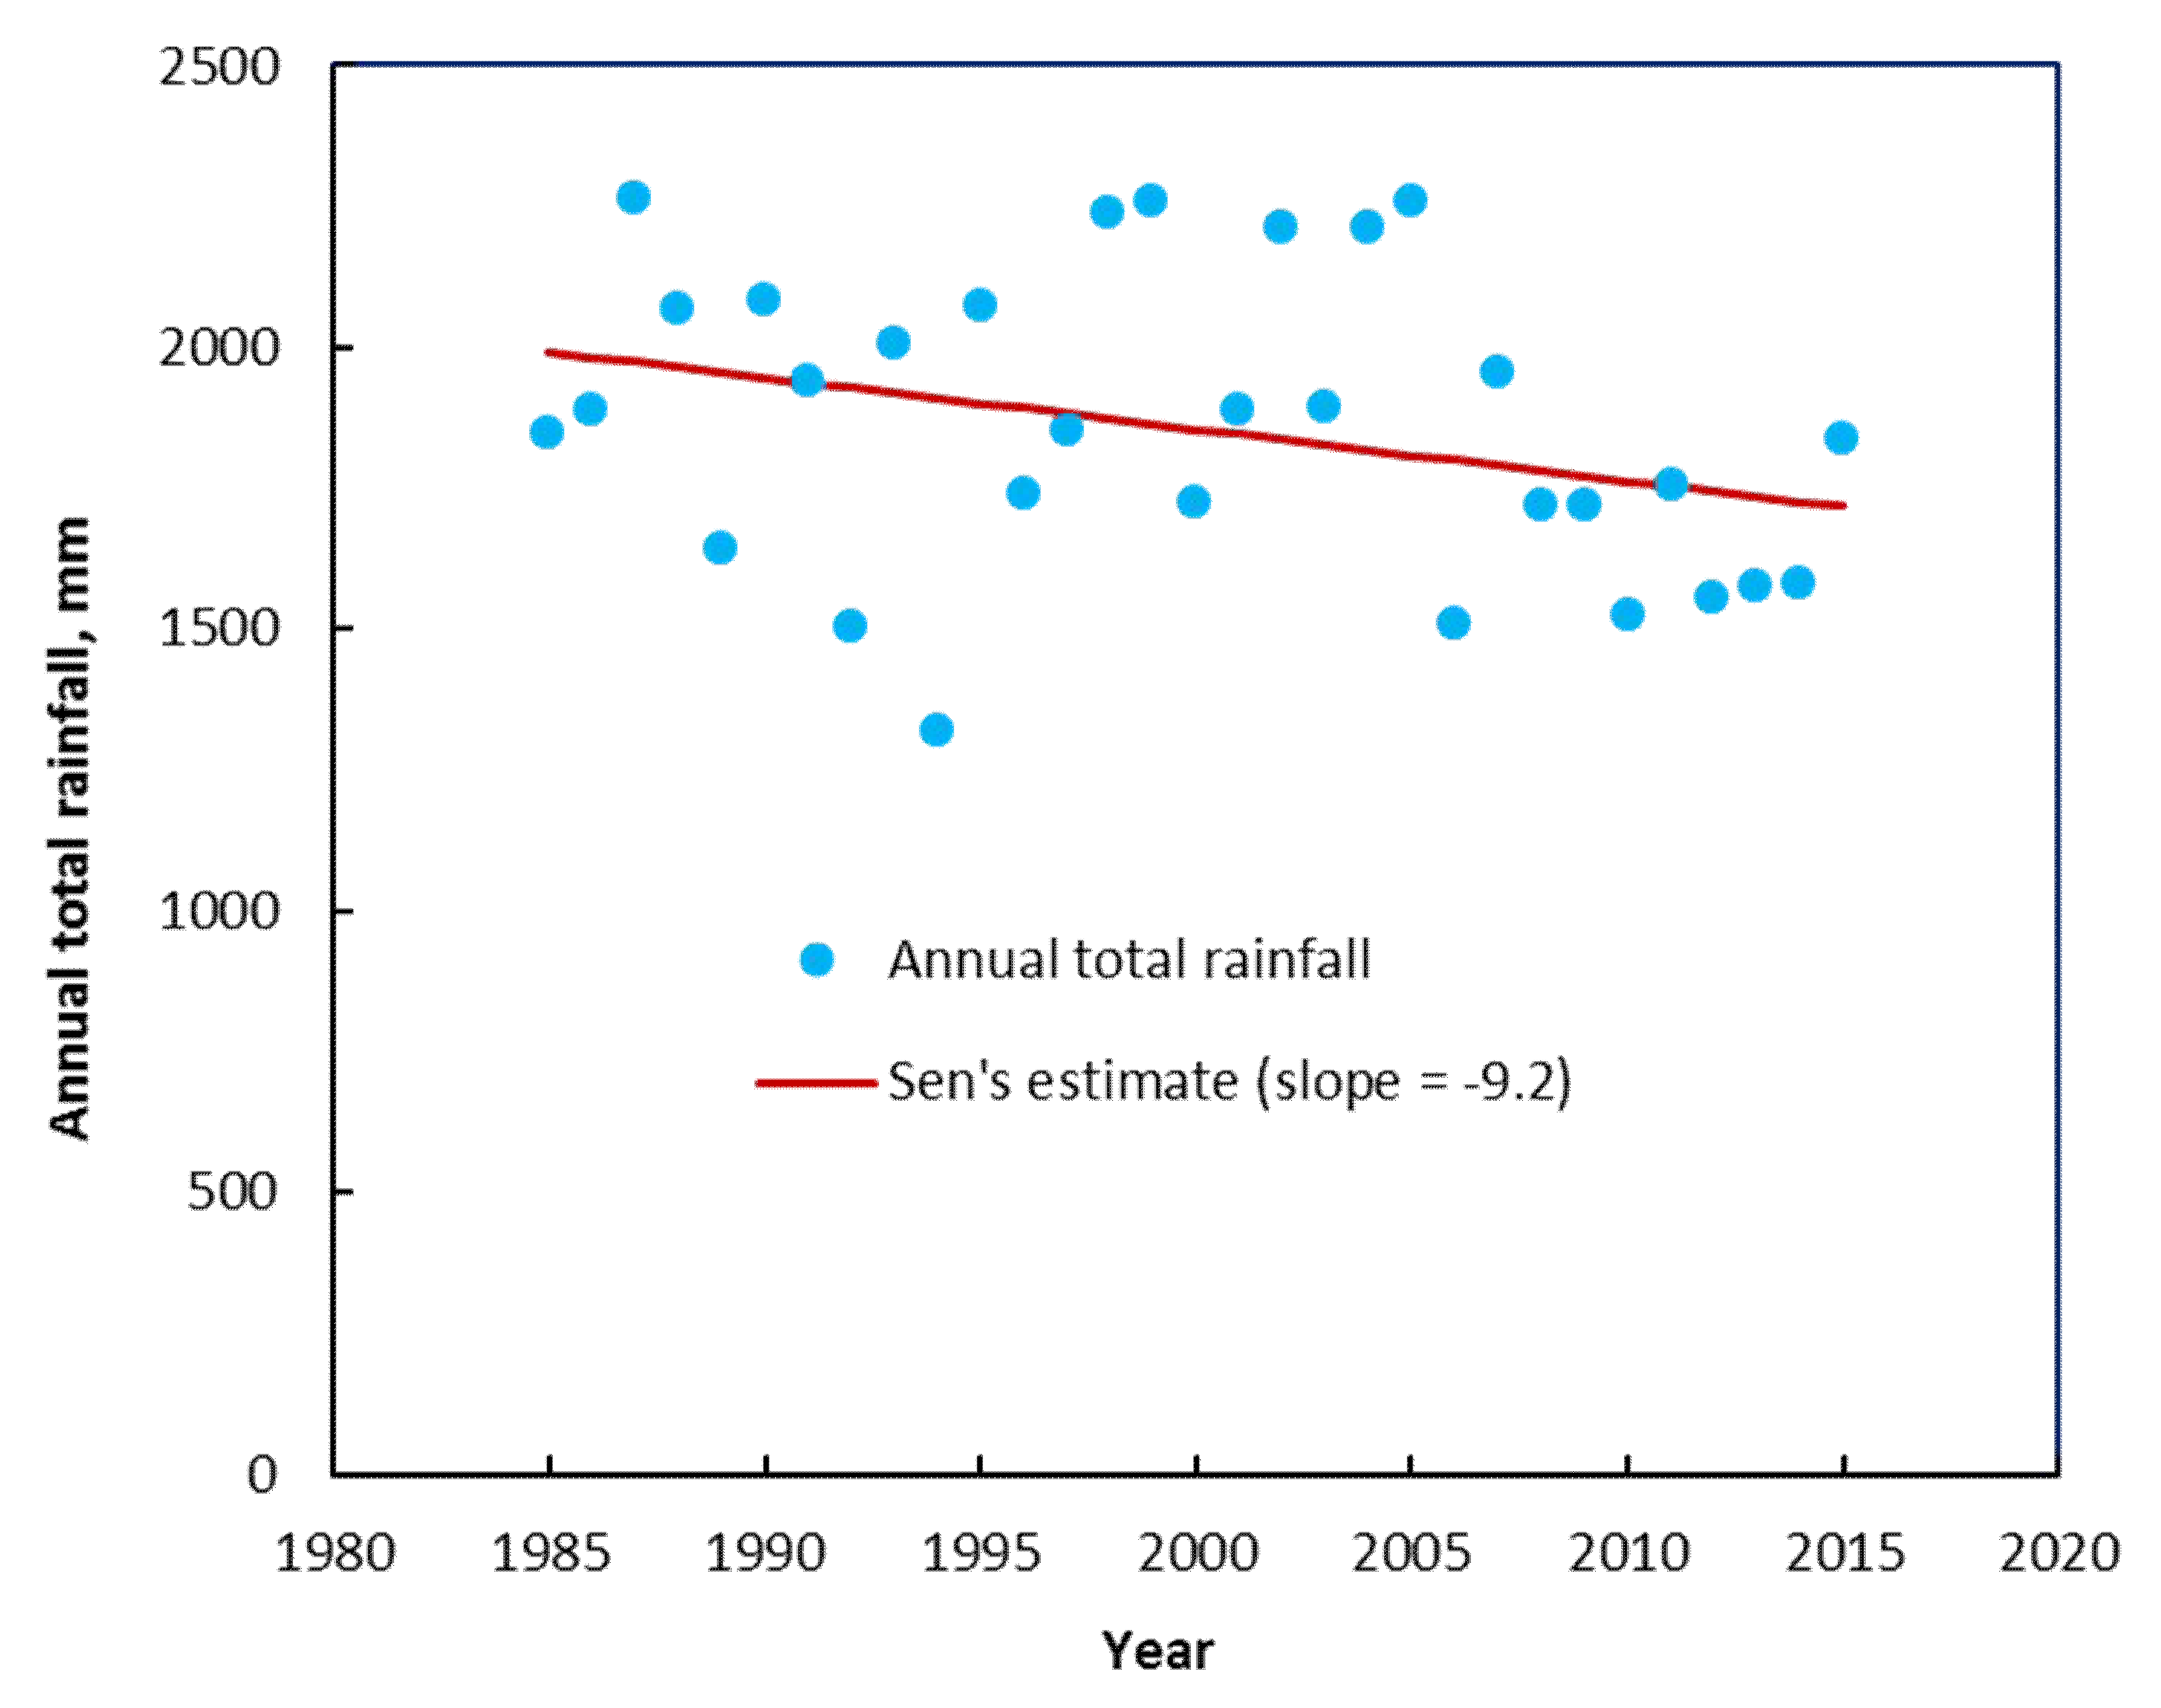
4.2. Groundwater Replenishment Status

The falling trend of the annual minimum depths of GWTs in 315 monitoring wells (Table 3) suggests that the depth of GWTs from ground surface had been increasing in the wet season (recharging period) over the years (1985–2016). The falling rates of the GWTs were statistically significant (p ≤ 0.05) (Table 4). Therefore, due to a deficit in the amount of recharge during the main recharging period, the depleted aquifers were not replenished completely, resulting in the effective mining of the aquifer. The NW region of Bangladesh has the lowest amount of average annual rainfall (1927 mm) of all hydrological regions in Bangladesh, and the region has a thick (6.10−21.34 m) clay layer [9]. Both these factors hindered recharge to the aquifers, and consequently, contributed to the declining trend of the annual minimum depth of GWTs obtained in the wet season. Also, both the monsoon rainfall and annual total rainfall in the region have been experiencing a decreasing trend for most of the districts in the NW region [35], making the available water for recharging the aquifers limited. The average annual rainfalls (n = 21) of Bogra, Dinajpur, Ishurdi, Rajshahi, Rangpur, and Sayedpur stations in the NW region are 1759, 2012, 1466, 1428, 2262, and 2118 mm, respectively. The overall average annual rainfall (1985–2015) of these six stations shows a declining trend (Figure 2), with a slope of 9.2 mm/year.
The rising trend of the annual minimum depths of GWTs in 31 monitoring wells indicated full replenishment of the aquifers during monsoon after depletion in the dry season. These GWTs also indicated the possibility of recharge rejection when the aquifers were fully replenished before the end of the recharge period. This result is in support of a previous study [36], which reported that the actual recharge in some areas of the NW region was still less than potential recharge, except in the western extreme of the country.
Our results emphasize the necessity of taking corrective decisions and measures to prevent further mining of GWTs and suggest implementing techniques to increase groundwater recharge to obtain sustainability in groundwater usage. To ensure that the aquifers are replenished adequately, artificial recharge can be introduced. Rainwater harvesting in the existing ponds and depressions can contribute to groundwater recharge. Greater attention to demand-side adaptive strategies that seek to reduce crop-water requirements is needed. Introduction of water-saving techniques (e.g., mulching) that reduce soil surface evaporation or evapotranspiration, which can reduce groundwater abstraction from the aquifers or increase recharge to the aquifers, are also important. Increasing irrigation efficiency by adopting water-conserving management practices (e.g., buried pipe for water distribution, alternate wetting and drying (AWD) irrigation method) can reduce cost of irrigation and may increase irrigation command area, but does not actually contribute to water saving at the watershed or national scale [37]. This is especially important for areas such as the North-West region of Bangladesh, where water is scarce, and aquifers are being over-drafted and surface water sources dry up during the dry season. Higher water use efficiency may eventually reduce recharge to the aquifers by minimizing seepage and percolation loss of water from the canals and crop fields, since a considerable part of the lost water in an irrigation project replenishes the underlying aquifer [38]. However, the water-conserving management practices can contribute to groundwater sustainability by reducing groundwater abstraction when irrigation is applied by surface water. The major water-conserving management practices being used or considered suitable in Bangladesh include conservation agriculture (reduced or zero tillage), direct-seeded rice or aerobic rice cultivation, raised-bed planting, deficit irrigation, lower water-demanding crops and cropping patterns (e.g., replacing rice with less water-demanding wheat), partial shifting of agricultural development from the NW to the South-West region [39], and efficient irrigation methods, such as the AWD irrigation method (20–30% water saving), micro-irrigation, sprinkler irrigation, and drip irrigation. Other water-saving measures, such as high-velocity low-flow showerheads, dual-flush toilets, and sensor-activated faucets, can also be practiced at the household level. However, although conservation agriculture is regarded as a water-saving management practice, there is clear evidence of reduced recharge to aquifers under this practice due to the expanded and prolonged existence of a plough pan with lower permeability [9]. In the context of Bangladesh, conservation agriculture can help save water by reducing soil surface evaporation in the dry season, but may have a negative effect in the wet season, since it reduces recharge to the underlying aquifers. The advantages of conservation agriculture in saving water may, however, be exploited by breaking the plough pans through deep ploughing at the beginning of the wet season.

4.3. Domestic Water Scarcity

In the NW region of Bangladesh, household water is mostly supplied by groundwater, which is abstracted predominantly by STWs. The suction lift limitation of the STWs restricts groundwater abstraction. Figure 3 shows the locations having GWTs below the suction lift limit during 3 to 6 months of the dry season of the year, below the suction lift limit during the whole year, and always above the suction lift limit. Bogura, Rajshahi, Naogaon, Joypurhat, and Chapai Nowabgonj districts, forming the Barind track, have GWTs below the suction lift limit during the whole year, and thus demonstrate severity of water scarcity due to failure of the STWs. The Barind track has low rainfall and high runoff due to a thick clay layer starting from the ground surface, which largely explains the observed GWT distribution. The locations with GWTs always above the suction lift limit amassed in Rangpur, Gaibandha, Kurigram, Dinajpur, Nilphamari, Panchagor, and Thakurgaon districts (Figure 3) reveal the good condition of the groundwater resource in those areas. The locations having GWTs below the suction limit for 3 to 6 months are found distributed all over the NW region, indicating areas with dry season water scarcity. Based on trends of the annual maximum and minimum depths of GWTs, the groundwater monitoring wells in Bangladesh were categorized into four types [11]: Type 1 wells—both the annual minimum and maximum depths of GWTs are declining with little recovery; Type 2 wells—both the annual minimum and maximum depths of GWTs are declining with some recovery; Type 3 wells—dry season maximum depths of GWTs are declining but wet season minimum depths of GWTs remain steady; and Type 4 wells—both the dry season maximum and wet season minimum depths of GWTs are steady. In the northern sub-region of NW hydrological region (north of Joypurhat and Bogura, Figure 1), GWTs remain relatively stable, with large numbers of type 3 and type 4 wells, only a few type 2 wells, and no type 1 well in this sub-region [11]. In the southern sub-region of this hydrological region, trend types 1 and 2 dominate most of the monitoring wells.
During the 1980s and 1990s, STWs were adopted as a widespread irrigation technology in most parts of the North-West region, especially to support year-round rice production. However, this technology no longer remains technically feasible in most parts of Rajshahi division and some parts of Rangpur division due to declining groundwater levels (Figure 3). The non-functioning of STWs has created a number of negative impacts. In most parts of Rajshahi, Naogaon, and Chapai Nawabganj districts, and some parts of Bogura and Joypurhat districts, GWTs remain below suction lift limit throughout the whole year (Figure 3). Consequently, STW users can no longer provide supplementary irrigation for aman rice in case of inadequate rainfall. The non-functioning of STWs for a few weeks or months in most parts of the North-West region reduces yields of the rabi crops by hindering adequate irrigation. When declining water tables approach the suction lift limit, this can cause a reduction in the discharge of many STWs, requiring more time to irrigate the same land area, leading to higher production cost, which often constitutes over 50% of the total production cost [40]. Many farmers as well as households depend entirely on DTWs located close by their localities; many of the DTWs also struggle to supply water during peak water demand in the rabi season. The groundwater unsustainability situation is most advanced in some districts of Rajshahi division, where STWs do not function (Figure 3). In some districts of Rangpur division, increasing STW failure is significantly curtailing the crop production and income of the farmers [40]. It is noted that for the NW region, water quality is generally not a major issue, and also not within the scope of this study; the major issue in the region is the quantity of water, specifically from groundwater source during the dry season.
Water crises affect both men and women in different ways. Millions of women carry a double burden of disadvantage from the water crisis [41,42]. In rural Bangladesh, men are mainly engaged in irrigation, and women are primarily responsible for the collection of water for domestic use [43]. DTWs and STWs are exclusively used for irrigation, whereas some STWs and all HTWs are used for domestic water supply. In the dry season, when STWs and HTWs become non-functional due to declining GWTs, women have to walk a significant distance to DTWs to collect water for domestic usage. The increased workload for women often causes delays or failure to perform their household obligatory activities, such as cooking, due to additional expense of both time and energy to collect water. Such situations often bring risks of normative marital male violence against women as a punishment for not performing their obligatory activities in a timely manner [44].

5. Conclusions

The dynamic nature of groundwater resources in the North-West hydrological region of Bangladesh was characterized through historical (1985–2016) trends of the annual maximum and minimum depths of groundwater tables (GWTs) of 350 monitoring wells. Three features of the GWTs’ trend—falling, rising, and stable—revealed the impact of past abstraction and replenishment status of the groundwater resource. The falling trend of the annual maximum depth of GWTs in 300 monitoring wells (mostly statistically significant at p ≤ 0.05) suggests a cumulative increase in abstraction of groundwater over the study period, coupled with reduced recharge from lower rainfall. The falling trend of the annual minimum depths of GWTs in 315 monitoring wells (mostly significant) supports this result by revealing that the aquifers were not completely replenished in the wet season and mining of GWTs was occurring. In 60% of the monitoring wells, GWTs stayed below the suction lift limit (<6 m) of the suction-mode pumps (e.g., STWs and HTWs) during 3 to 6 months of the dry season in each year. Most of the NW parts of the study area encounter such GWTs and face water scarcity during those months. In 15% of the monitoring wells, located in Bogura, Rajshahi, Naogaon, Joypurhat, and Chapai Nowabgonj districts, GWTs remained below 6 m throughout the year. These districts, comprising the Barind track, face severe water scarcity, especially for domestic supply, due to failure of STWs and HTWs. Therefore, it is inevitable that the currently practiced groundwater development and use policy in those areas need to be revised to make groundwater use more sustainable. Strategies such as artificial recharge to the aquifers and rain water harvesting along with water-saving technologies and integrated water resources management need to be adopted. Special attention needs to be given in areas where GWTs drop below the critical suction limit of suction-mode pumps. Alternate technology for pumping groundwater needs to be made available to provide household water.

Supplementary Materials

The following are available online at https://www.mdpi.com/2073-4441/11/6/1182/s1. Table S1: Distribution of 350 monitoring wells selected for the study. Table S2: MAKESENS trend analysis results for annual maximum groundwater levels. Table S3: MAKESENS trend analysis results for annual minimum groundwater levels. Table S4: List of monitoring well-types based on suction limit (6 m).

Author Contributions

Conceptualization, M.A.M.; data curation, G.H.; formal analysis, M.F.P.; funding acquisition, M.M.; methodology, M.F.P.; project administration, M.M.; supervision, M.A.M.; writing—original draft, M.A.M.; writing—review and editing, M.A.M., M.M., and G.H.

Funding

This research received no external funding.

Acknowledgments

This research was undertaken in collaboration with CSIRO and contributes to the South Asia Sustainable Development Investment Portfolio and is supported by the Australian aid program.

Conflicts of Interest

The authors declare to have no conflicts of interest.

References

  1. Jakeman, A.; Barreteau, O.; Hunt, R.J.; Rinaudo, J.D.; Ross, A. Integrated Groundwater Management; Springer: Berlin, Germany, 2016. [Google Scholar]
  2. Michael, H.A.; Voss, C.I. Estimation of regional-scale groundwater flow properties in the Bengal Basin of India and Bangladesh. Hydrogeol. J. 2009, 17, 1329–1346. [Google Scholar] [CrossRef]
  3. Alam, M.; Alam, M.M.; Curray, J.R.; Chowdhury, M.L.R.; Gani, M.R. An overview of the sedimentary geology of the Bengal Basin in relation to the regional tectonic framework and basin-fill history. Sediment. Geol. 2003, 155, 179–208. [Google Scholar] [CrossRef]
  4. BBS (Bangladesh Bureau of Statistics). Statistics and Informatics Division (SID). Ministry of Planning; Government of the People’s Republic of Bangladesh: Dhaka, Bengal, 2017.
  5. SPIS (Solar-Powered Irrigation Systems). Prospects for Solar-Powered Irrigation Systems in Developing Countries; Final Workshop Report; International Workshop Jointly Organized by the Food and Agriculture Organization (FAO) and the German Agency for International Cooperation (GIZ); FAO HQ: Rome, Italy, 2015. [Google Scholar]
  6. BADC (Bangladesh Agricultural Development Corporation). Summary of Irrigation Equipment Used, Area Irrigated and Benefited Farmers: 2010−2011; BADC: Shech Bhavan, Dhaka, 2016. [Google Scholar]
  7. Neumann, R.B.; Polizzotto, M.L.; Badruzzaman, A.B.M.; Ali, M.A.; Zhang, Z.; Harvey, C.F. Hydrology of a groundwater-irrigated rice field in Bangladesh: Seasonal and daily mechanisms of infiltration. Water Resour. Res. 2009, 45, W09412. [Google Scholar] [CrossRef]
  8. CSIRO; WARPO; BWDB; IWM; BIDS; CEGIS. Bangladesh Integrated Water Resources Assessment; Final Report; CSIRO: Canberra, Australia, 2014. [Google Scholar]
  9. Rahman, M.M.; Mahbub, A.Q.M. Lithological study and mapping of Barind Tract using borehole log data with GIS: In the context of Tanore upazila. J. Geogr. Inf. Syst. 2012, 4, 349–357. [Google Scholar]
  10. Dey, N.C.; Bala, S.K.; Islam, A.K.M.S.; Rashid, M.A.; Hossain, M. Sustainability of Groundwater Use for Irrigation in Northwest Bangladesh; National Food Policy Capacity Strengthening Programme (NFPCSP): Dhaka, Bangladesh, 2013. [Google Scholar]
  11. Hodgson, G.; Ali, R.; Turner, J.; Ahmed, M.; Dawes, W.; Masud, M.S.; Hossain, M.J.; Alam, S.; Islam, M.M.; Saha, G.K.; et al. Bangladesh Integrated Water Resources Assessment Supplementary Report: Water Table Trends and Associated Vertical Water Balance in Bangladesh; CSIRO: Canberra, Australia, 2014. [Google Scholar]
  12. Alice, M. Research Report on: Water Scarcity in Northern Bangladesh; Voluntary Service Overseas (VSO): Dhaka, Bangladesh, 2010. [Google Scholar]
  13. Hossain, N.; Bahauddin, K.M. Integrated water resource management for mega city: A case study of Dhaka City, Bangladesh. Eur. J. Earth Environ. 2013, 3, 13–19. [Google Scholar]
  14. Kirby, M.; Ahmad, M.D.; Poulton, P.; Zhu, Z.; Lee, G.; Mainuddin, M. Review of Water, Crop Production and System Modelling Approaches for Food Security Studies in the Eastern Gangetic Plains; CSIRO: Canberra, Australia, 2013. [Google Scholar]
  15. Adamowski, K.; Prokoph, A.; Adamowski, J. Development of a new method of wavelet aided trend detection and estimation. Hydrol. Process. 2009, 23, 2686–2696. [Google Scholar] [CrossRef]
  16. Campisi-Pinto, S.; Adamowski, J.; Oron, G. Forecasting urban water demand via wavelet-denoising and neural network models. Case study: City of Syracuse, Italy. Water Resour. Manag. 2012, 26, 3539–3558. [Google Scholar] [CrossRef]
  17. Butler, C.; Adamowski, J. Empowering marginalized communities in water resources management: Addressing inequitable practices in Participatory Model Building. J. Environ. Manag. 2015, 153, 153–162. [Google Scholar] [CrossRef] [PubMed]
  18. Ahmad, M.U.; Kirby, M.; Islam, M.S.; Hossain, M.J.; Islam, M.M. Groundwater use for irrigation and its productivity: Status and opportunities for crop intensification for food security in Bangladesh. Water Resour. Manag. 2014, 28, 1415–1429. [Google Scholar] [CrossRef]
  19. Pinder, G.F. Groundwater Hydrology in 2050. In Toward a Sustainable Water Future: Visions for 2050; ASCE: Preston, WV, USA, 2012; pp. 277–287. [Google Scholar]
  20. Adamowski, J.; Zyla, C.; Cuenca, E.; Medema, W.; Clamen, M.; Reig, P. Integrated and Adaptive Water Resources Planning, Management, and Governance; Water Resources Publications, LLC.: Littleton, CO, USA, 2013. [Google Scholar]
  21. Hasanuzzaman, M.; Song, X.; Han, D.; Zhang, Y.; Hussain, S. Prediction of groundwater dynamics for sustainable water resource management in Bogura district, Northwest Bangladesh. Water 2017, 9, 238. [Google Scholar] [CrossRef]
  22. WARPO (Water Resources Planning Organization). National Water Management Plan. Volume 2: Main Report; Water Resources Planning Organization, Ministry of Water Resources: Dhaka, Bangladesh, 2001.
  23. Population Census. National Volume-1: Analytical Report, Bangladesh Bureau of Statistics 199; Government of the People’s Republic of Bangladesh: Dhaka, Bangladesh, 2011.
  24. Mainuddin, M.; Kirby, M. National food security in Bangladesh to 2050. Food Secur. 2015, 7, 633–646. [Google Scholar] [CrossRef]
  25. Mainuddin, M.; Kirby, M.; Chowdhury, R.A.R.; Sanjida, L.; Sarker, M.H.; Shah-Newaz, S.M. Bangladesh Integrated Water Resources Assessment Supplementary Report: Land Use, Crop Production, and Irrigation Demand; Water for a Healthy Country Flagship; CSIRO: Canberra, Australia, 2014. [Google Scholar]
  26. Mainuddin, M.; Rawson, H.M.; Poulton, P.L.; Ali, R.; Roth, C.; Islam, K.M.; Saifuzzaman, M.; Rahman, M.M.; Quader, M.E.; Shah-Newaz, S.M.; et al. Scoping Study to Assess Constraints and Opportunities for Future Research into Intensification of Cropping Systems in Southern Bangladesh; ACIAR Report; ACIAR: Canberra, Australia, 2013. [Google Scholar]
  27. Salmi, T. Detecting Trends of Annual Values of Atmospheric Pollutants by the Mann-Kendall Test and Sen’s Slope Estimates-the Excel Template Application MAKESENS; Ilmatieteen Laitos: Helsinki, Finland, 2002. [Google Scholar]
  28. Gilbert, R.O. Statistical Methods for Environmental Pollution Monitoring; John Wiley & Sons: Manhattan, NY, USA, 1987. [Google Scholar]
  29. Shamsudduha, M.; Chandler, R.E.; Taylor, R.G.; Ahmed, K.M. Recent trends in groundwater tables in a highly seasonal hydrological system: The Ganges-Brahmaputra-Meghna Delta. Hydrol. Earth Syst. Sci. 2009, 13, 2373–2385. [Google Scholar] [CrossRef]
  30. Pena-Arancibia, J.L.; Van Dijk, A.I.; Guerschman, J.P.; Mulligan, M.; Bruijnzeel, L.A.S.; McVicar, T.R. Detecting changes in streamflow after partial woodland clearing in two large catchments in the seasonal tropics. J. Hydrol. 2012, 416, 60–71. [Google Scholar] [CrossRef]
  31. Mainuddin, M.; Kirby, M.; Chowdhury, R.A.R.; Shah-Newaz, S.M. Spatial and temporal variations of and the impact of climate change on the dry season crop irrigation requirements in Bangladesh. Irrig. Sci. 2015, 33, 107–120. [Google Scholar] [CrossRef]
  32. USAID (United States Agency for International Development). Agricultural Water Management, Water and Development Strategy, Implementation Brief–Jan 2015. Available online: https://www.usaid.gov/documents/1865/agricultural-water-management-implementation-brief-january-2015 (accessed on 23 March 2019).
  33. Mollinga, P.P.; Meinzen-Dick, R.; Merrey, D.J. Politics, Plurality and Problemsheds: A Strategic Approach for Reform of Agricultural Water Resources Management. Dev. Policy Rev. 2007, 25, 699–719. [Google Scholar] [CrossRef]
  34. McIntyre, B.D. International Assessment of Agricultural Knowledge, Science and Technology for Development (IAASTD): Global Report; Ecumenical Advocacy Alliance: Johannesburg, South Africa, 2009. [Google Scholar]
  35. Bari, S.H.; Rahman, M.T.; Hoque, M.A.; Hussain, M.M. Analysis of seasonal and annual rainfall trends in the northern region of Bangladesh. Atmos. Res. 2016, 176–177, 148–158. [Google Scholar] [CrossRef]
  36. Shamsudduha, M.; Taylor, R.G.; Ahmed, K.M.; Zahid, A. The impact of intensive groundwater abstraction on recharge to a shallow regional aquifer system: Evidence from Bangladesh. Hydrogeol. J. 2011, 19, 901–916. [Google Scholar] [CrossRef]
  37. Ahmad, M.U.D.; Turral, H.; Masih, I.; Giordano, M.; Masood, Z. Water Saving Technologies: Myths and Realities Revealed in Pakistan’s Rice-Wheat Systems; International Water Management Institute (IWMI): Colombo, Sri Lanka, 2007. [Google Scholar]
  38. Perry, C.; Steduto, P. Does Improved Irrigation Technology Save Water? A Review of the Evidence. Discussion Paper on Irrigation and Sustainable Water Resources Management in the Near East and North Africa; Food and Agriculture Organization: Cairo, Egypt, 2017. [Google Scholar]
  39. FAO; IFAD; WFP. The State of Food Insecurity in the World 2013. The Multiple Dimensions of Food Security; Food and Agriculture Organization: Rome, Italy, 2013. [Google Scholar]
  40. De Silva, S.; Leder, S. Improving Water Use for Dry Season Agriculture by Marginal and Tenant Farmers in the Eastern Gangetic Plains: Evaluating Groundwater Irrigation Technology Adoption in Rangpur, Thakurgaon and Rajshahi Districts; Research Report; ACAIR: Canberra, Australia, 2017. [Google Scholar]
  41. Wallace, T.; Porter, F. Introduction. Gend. Dev. 2010, 18, 1–10. [Google Scholar] [CrossRef]
  42. United Nations Development Programme (UNDP). Beyond Scarcity: Power, Poverty and the Global Water Crisis; UNDP Human Development Report; United Nations Development Programme (UNDP): New York, NY, USA, 2006. [Google Scholar]
  43. Jordans, E.; Zwarteveen, M. A Well of One’s Own: Gender Analysis of an Irrigation Program in Bangladesh; International Irrigation Management Institute and Grameen Krishi Foundation: Dhaka, Bengal, 1997. [Google Scholar]
  44. Karim, K.R.; Emmelin, M.; Resurreccion, B.P.; Wamala, S. Water development projects and marital violence: Experiences from rural Bangladesh. Health Care Women Int. 2012, 33, 200–216. [Google Scholar] [CrossRef] [PubMed]
Figure 1. Hydrological regions of Bangladesh, with the major river network, cities, and elevation above mean sea level.
Water 11 01182 g001
Figure 2. Variation of average annual total rainfall of six stations of the North-West Bangladesh and its trend over the years from 1985 to 2015.
Water 11 01182 g002
Figure 3. Distribution of the groundwater table (GWT) monitoring well-types based on suction lift limit in 16 districts in the North-West hydrological region of Bangladesh.
Water 11 01182 g003
Table 1. Number of groundwater table (GWT) monitoring wells in 16 districts of the North-West hydrological region of Bangladesh with falling, rising, and no trends of the annual maximum depths of GWTs from ground surface.
DistrictsNo. of Wells with Falling GWT TrendNo. of Wells with Rising GWT TrendNo. of Wells with No Trend of GWTTotal Number of Wells
Rajshahi351036
Bogura207027
Dinajpur380038
Gaibandha125017
Joypurhat8008
Kurigram6107
Lalmonirhat131014
Naogaon321033
Natore94013
Chapai Nawabganj181221
Nilphamari168024
Pabna216027
Panchagarh184022
Rangpur84012
Shirajganj222024
Thakurgaon243027
Total wells300482350
Table 2. Distribution of groundwater table (GWT) monitoring wells based on statistical significance (p ≤ 0.05) of their annual maximum GWT trends in 16 districts of the North-West hydrological region of Bangladesh.
DistrictsNo. of Wells with Falling GWT TrendNo. of Wells with Rising GWT TrendNo. of Wells with No Trend of GWTTotal Number of Wells
Sig.Insig.Sig.Insig.Sig.Insig.
Rajshahi332010036
Bogura164430027
Dinajpur380000038
Gaibandha102230017
Joypurhat8000008
Kurigram3301007
Lalmonirhat94010014
Naogaon302010033
Natore63040013
Chapai Nawabganj153010221
Nilphamari142710024
Pabna147150027
Panchagarh99130022
Rangpur53040012
Shirajganj139200024
Thakurgaon213030027
Total wells24456173102350
Table 3. Number of groundwater table (GWT) monitoring wells in 16 districts of the North-West hydrological region of Bangladesh with falling, rising, and no trends of the annual minimum depths of GWTs from ground surface.
DistrictsNo. of Wells with Falling GWT TrendNo. of Wells with Rising GWT TrendNo. of Wells with No Trend of GWTTotal Number of Wells
Rajshahi360036
Bogura270027
Dinajpur371038
Gaibandha132217
Joypurhat8008
Kurigram6107
Lalmonirhat104014
Naogaon330033
Natore130013
Chapai Nawabganj201021
Nilphamari159024
Pabna251127
Panchagarh202022
Rangpur93012
Shirajganj222024
Thakurgaon215127
Total wells315314350
Table 4. Distribution of the groundwater table (GWT) monitoring wells based on statistical significance (p ≤ 0.05) of their annual minimum GWT trends in 16 districts of the North-West hydrological region of Bangladesh.
DistrictsNo. of Wells with Falling GWT TrendNo. of Wells with Rising GWT TrendNo. of Wells with No Trend of GWTTotal Number of Wells
Sig.Insig.Sig.Insig.Sig.Insig.
Rajshahi351000036
Bogura243000027
Dinajpur2215010038
Gaibandha76110217
Joypurhat7100008
Kurigram2401007
Lalmonirhat46040014
Naogaon312000033
Natore112000013
Chapai Nawabganj173010021
Nilphamari69360024
Pabna205010127
Panchagarh119020022
Rangpur45030012
Shirajganj1012020024
Thakurgaon192230127
Total wells2308562504350
Table 5. Distribution of the groundwater table (GWT) monitoring wells in 16 districts of the North-West hydrological region of Bangladesh based on suction lift limit (6 m) of GWTs.
DistrictsNo. of Wells Having GWT always below 6 mNo. of Wells Having GWT below 6 m Maintaining a CycleNo. of Wells Having GWT always above 6 mTotal Number of Wells
Rajshahi1125036
Bogura620127
Dinajpur0271138
Gaibandha125017
Joypurhat2608
Kurigram0437
Lalmonirhat001414
Naogaon1617033
Natore013013
Chapai Nawabganj615021
Nilphamari022224
Pabna027027
Panchagarh051722
Rangpur05712
Shirajganj024024
Thakurgaon0141327
Total wells5320988350

