Analysis of the Inhomogeneous Effect of Different Meteorological Trends on Drought: An Example from Continental Croatia


Abstract
1. Introduction
2. Materials and Methods
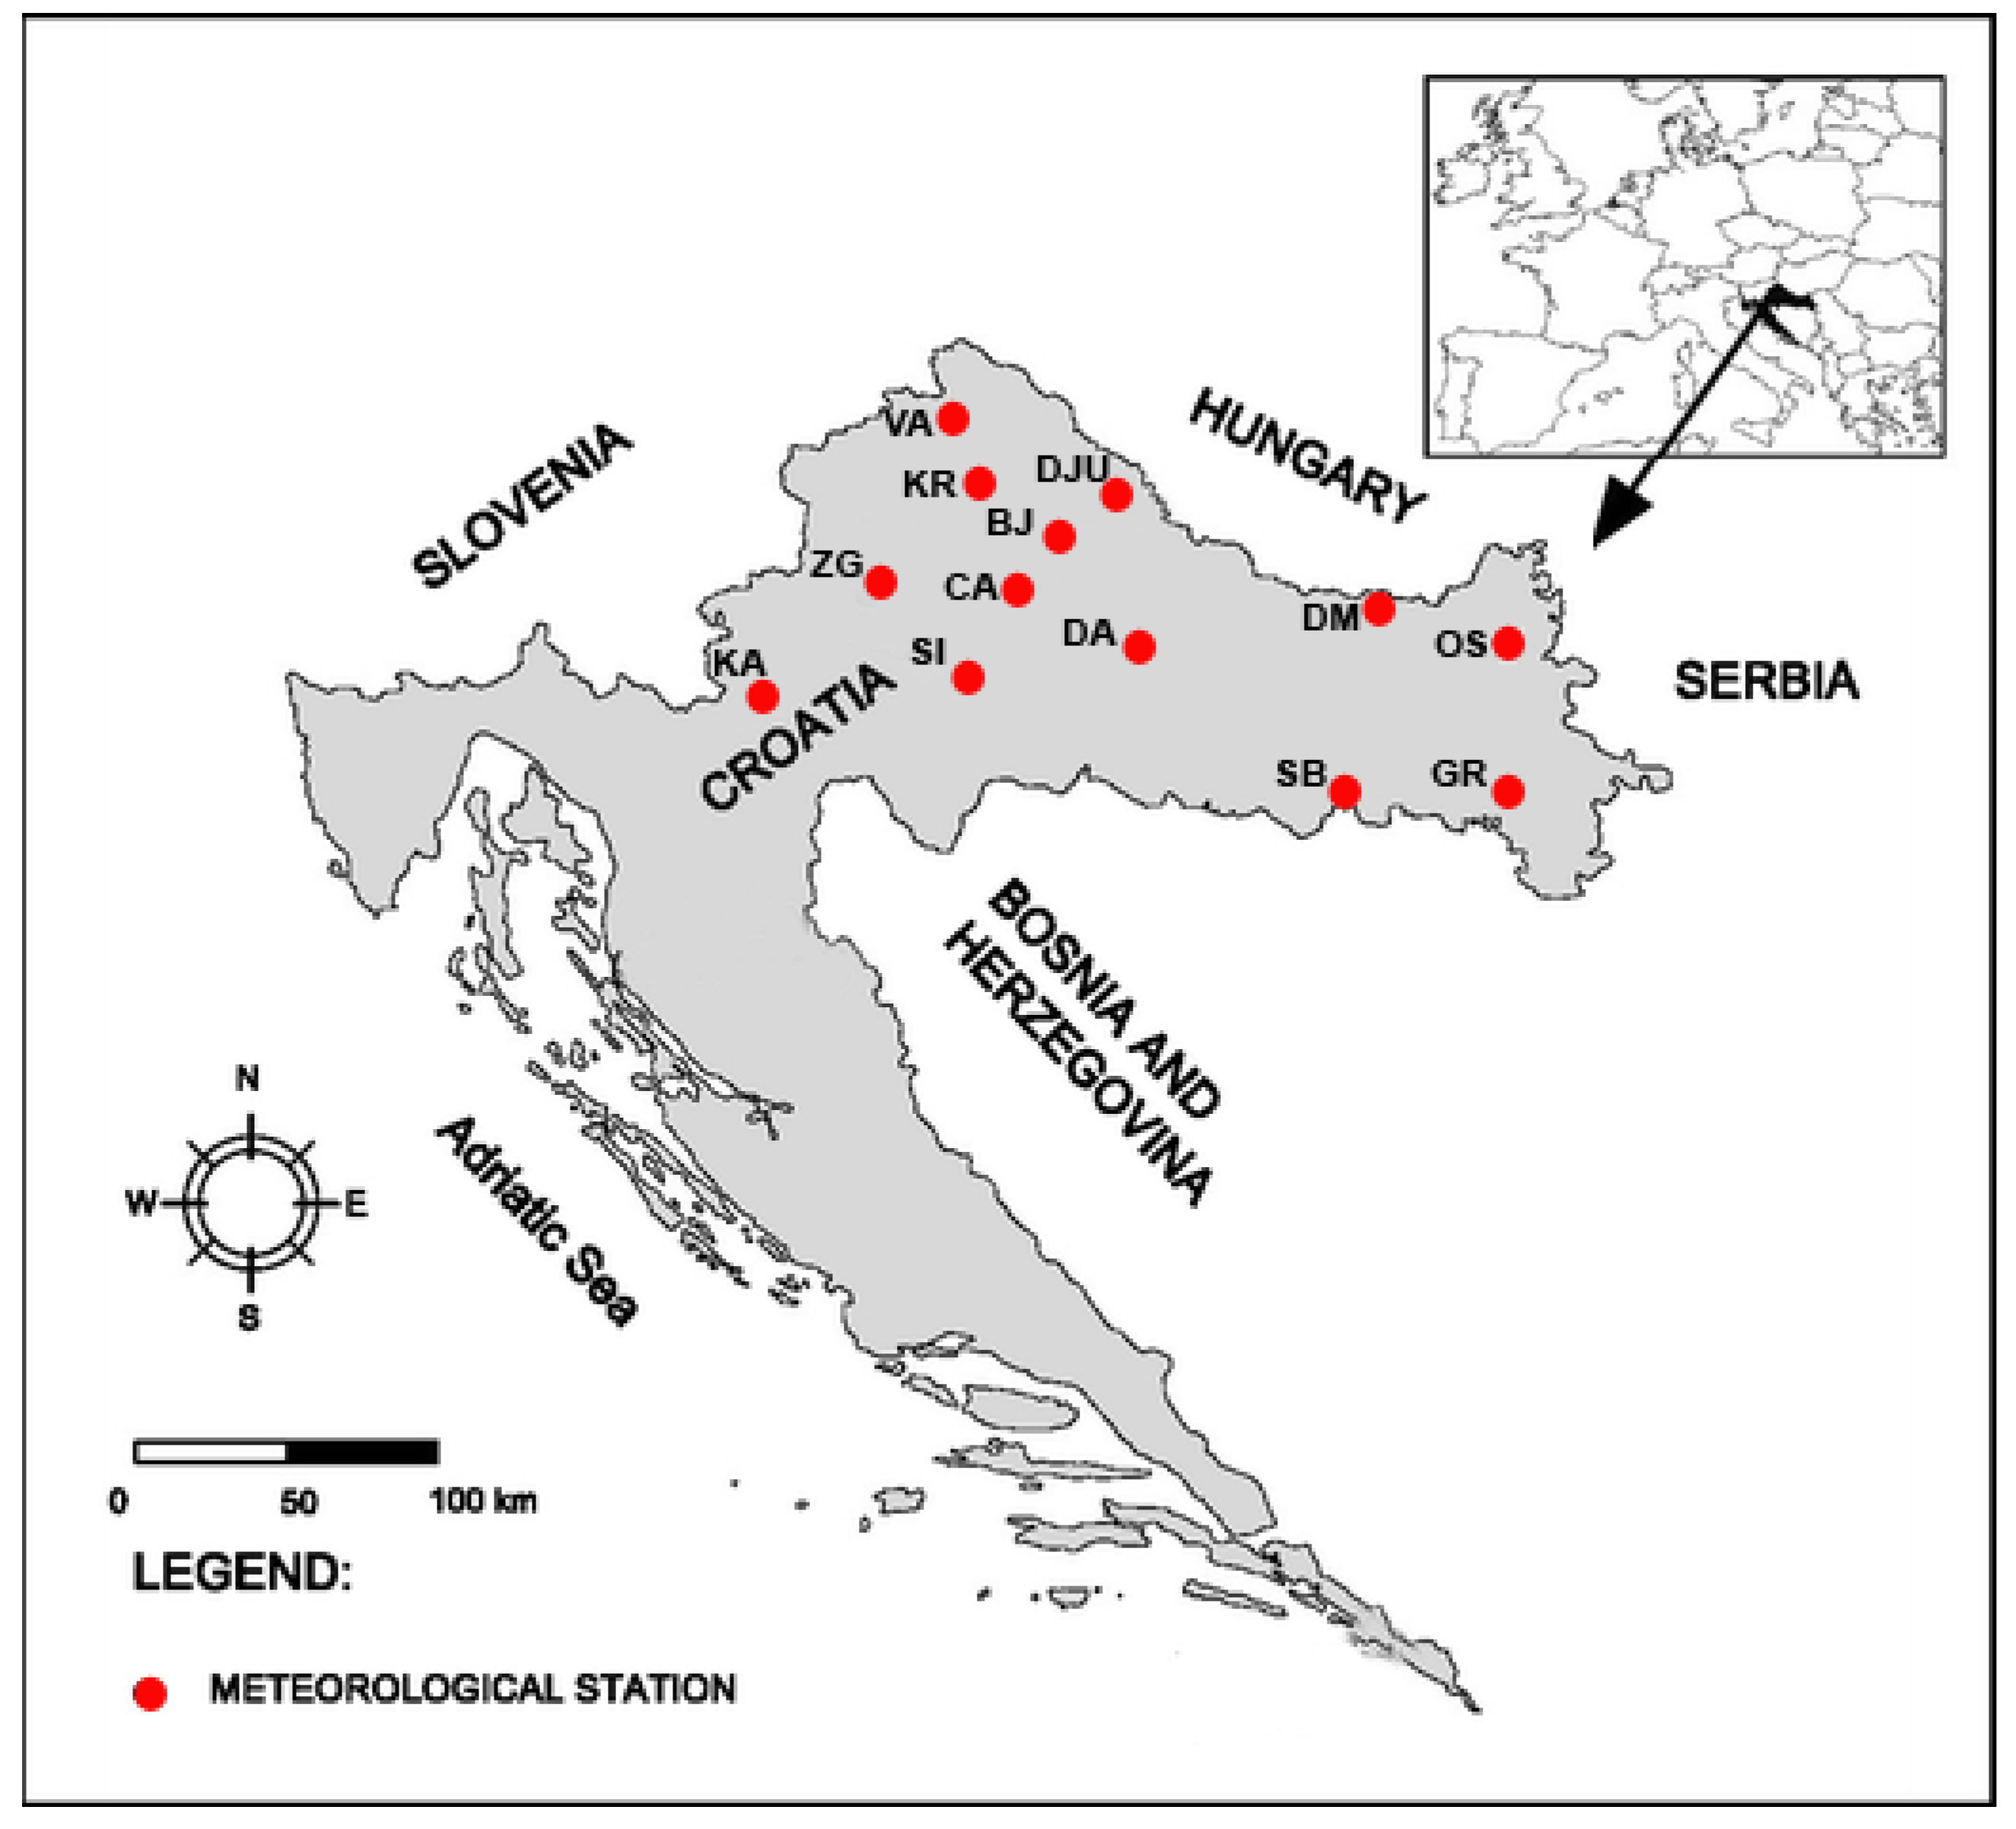
2.1. Study Area
2.2. Data Set
2.3. Methodology
3. Results
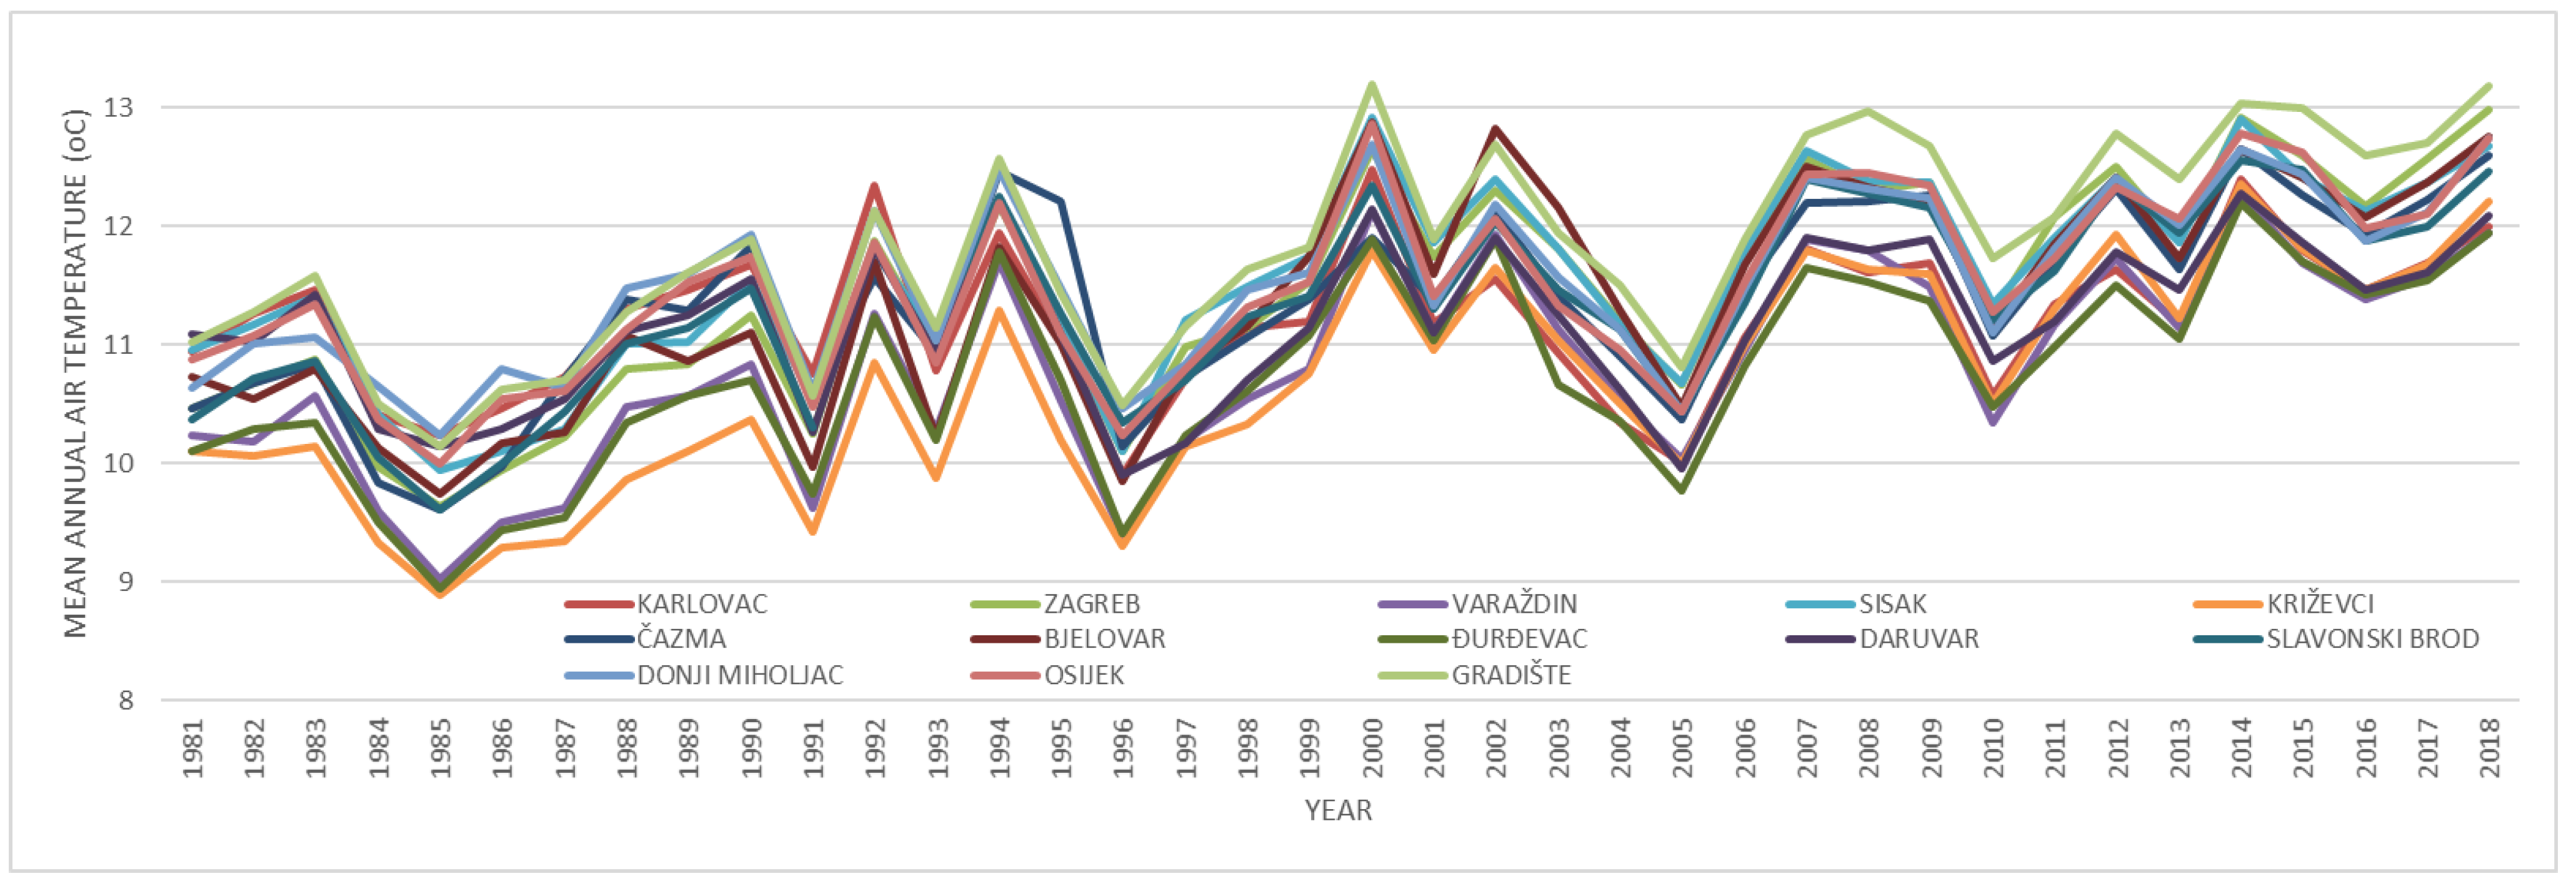
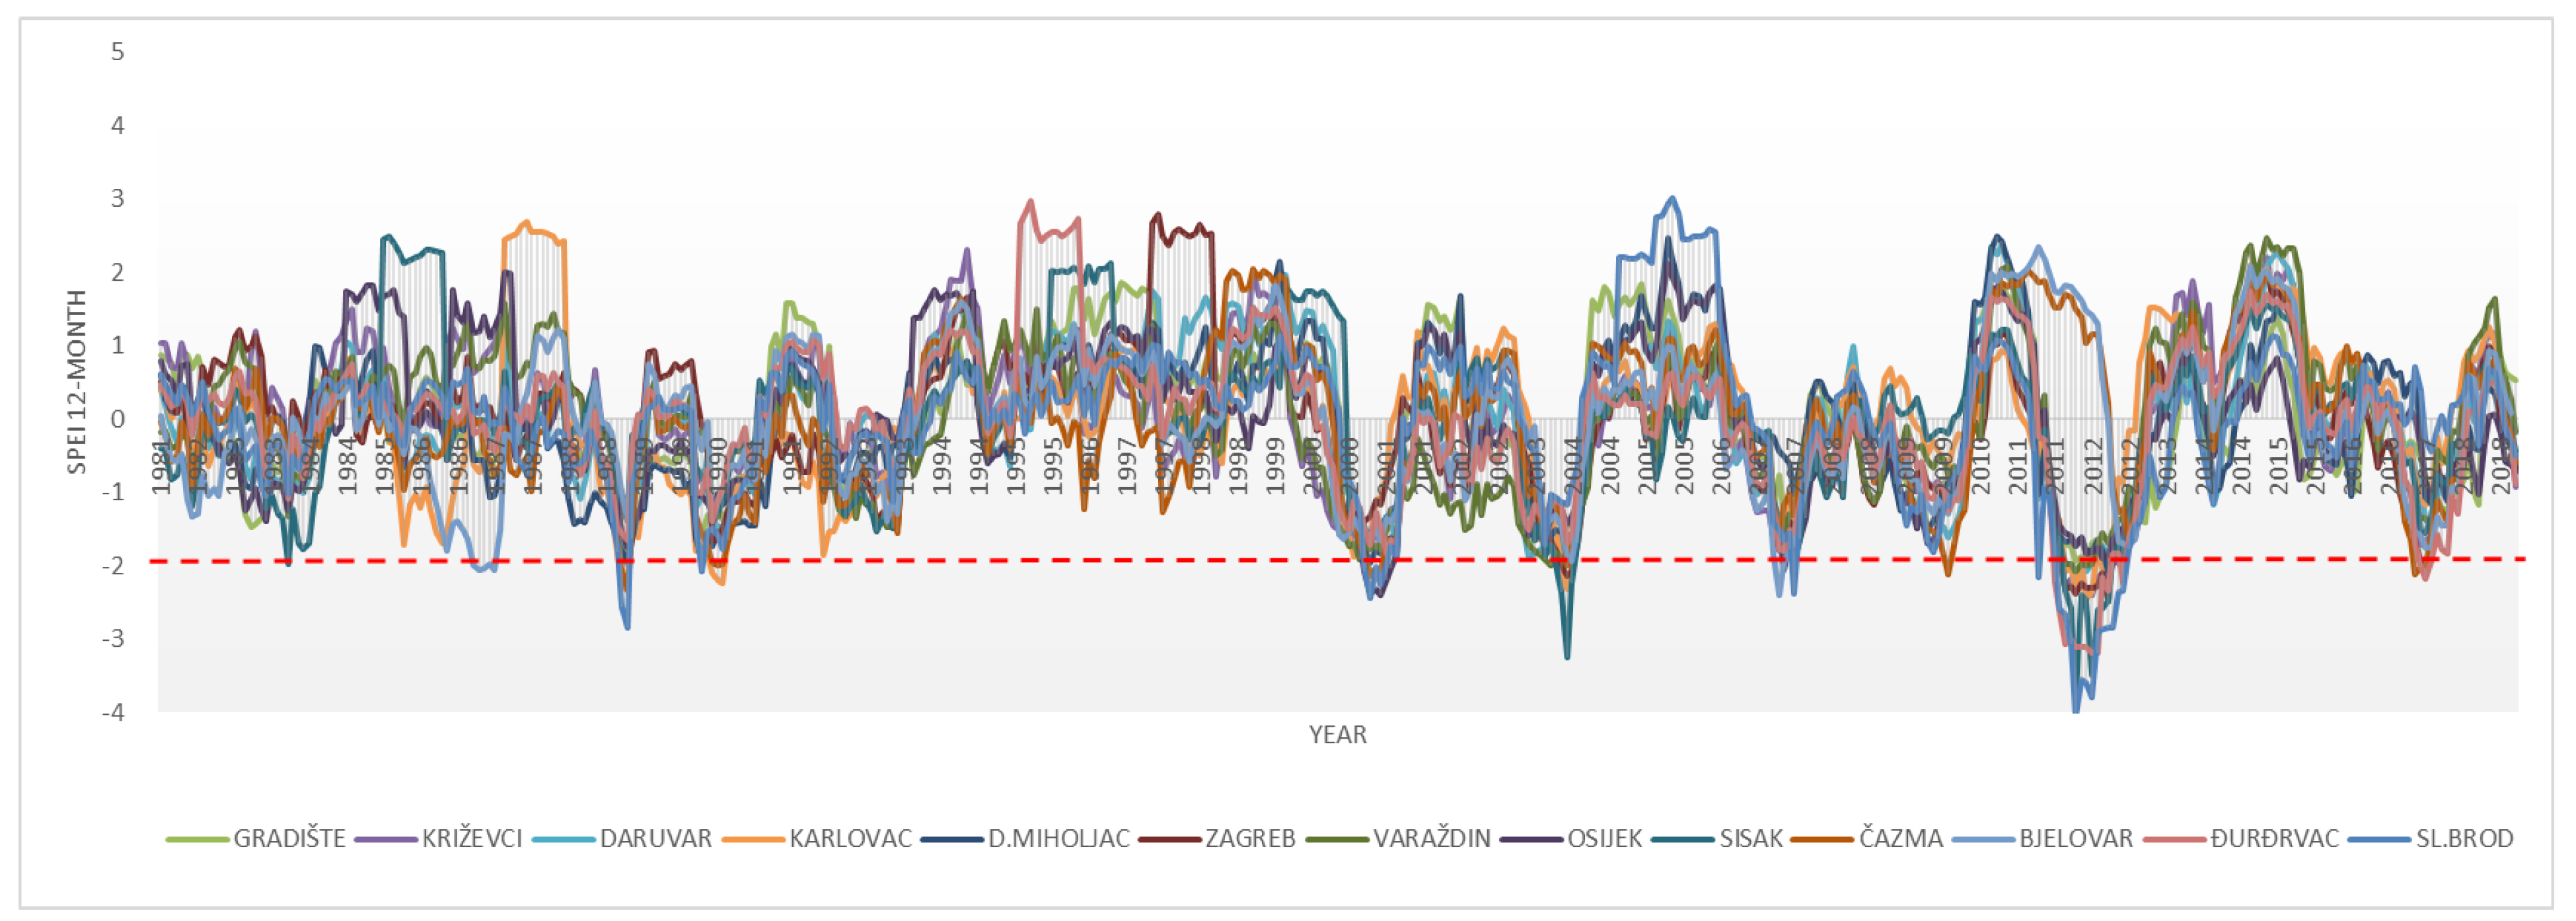
3.1. Temporal Variability
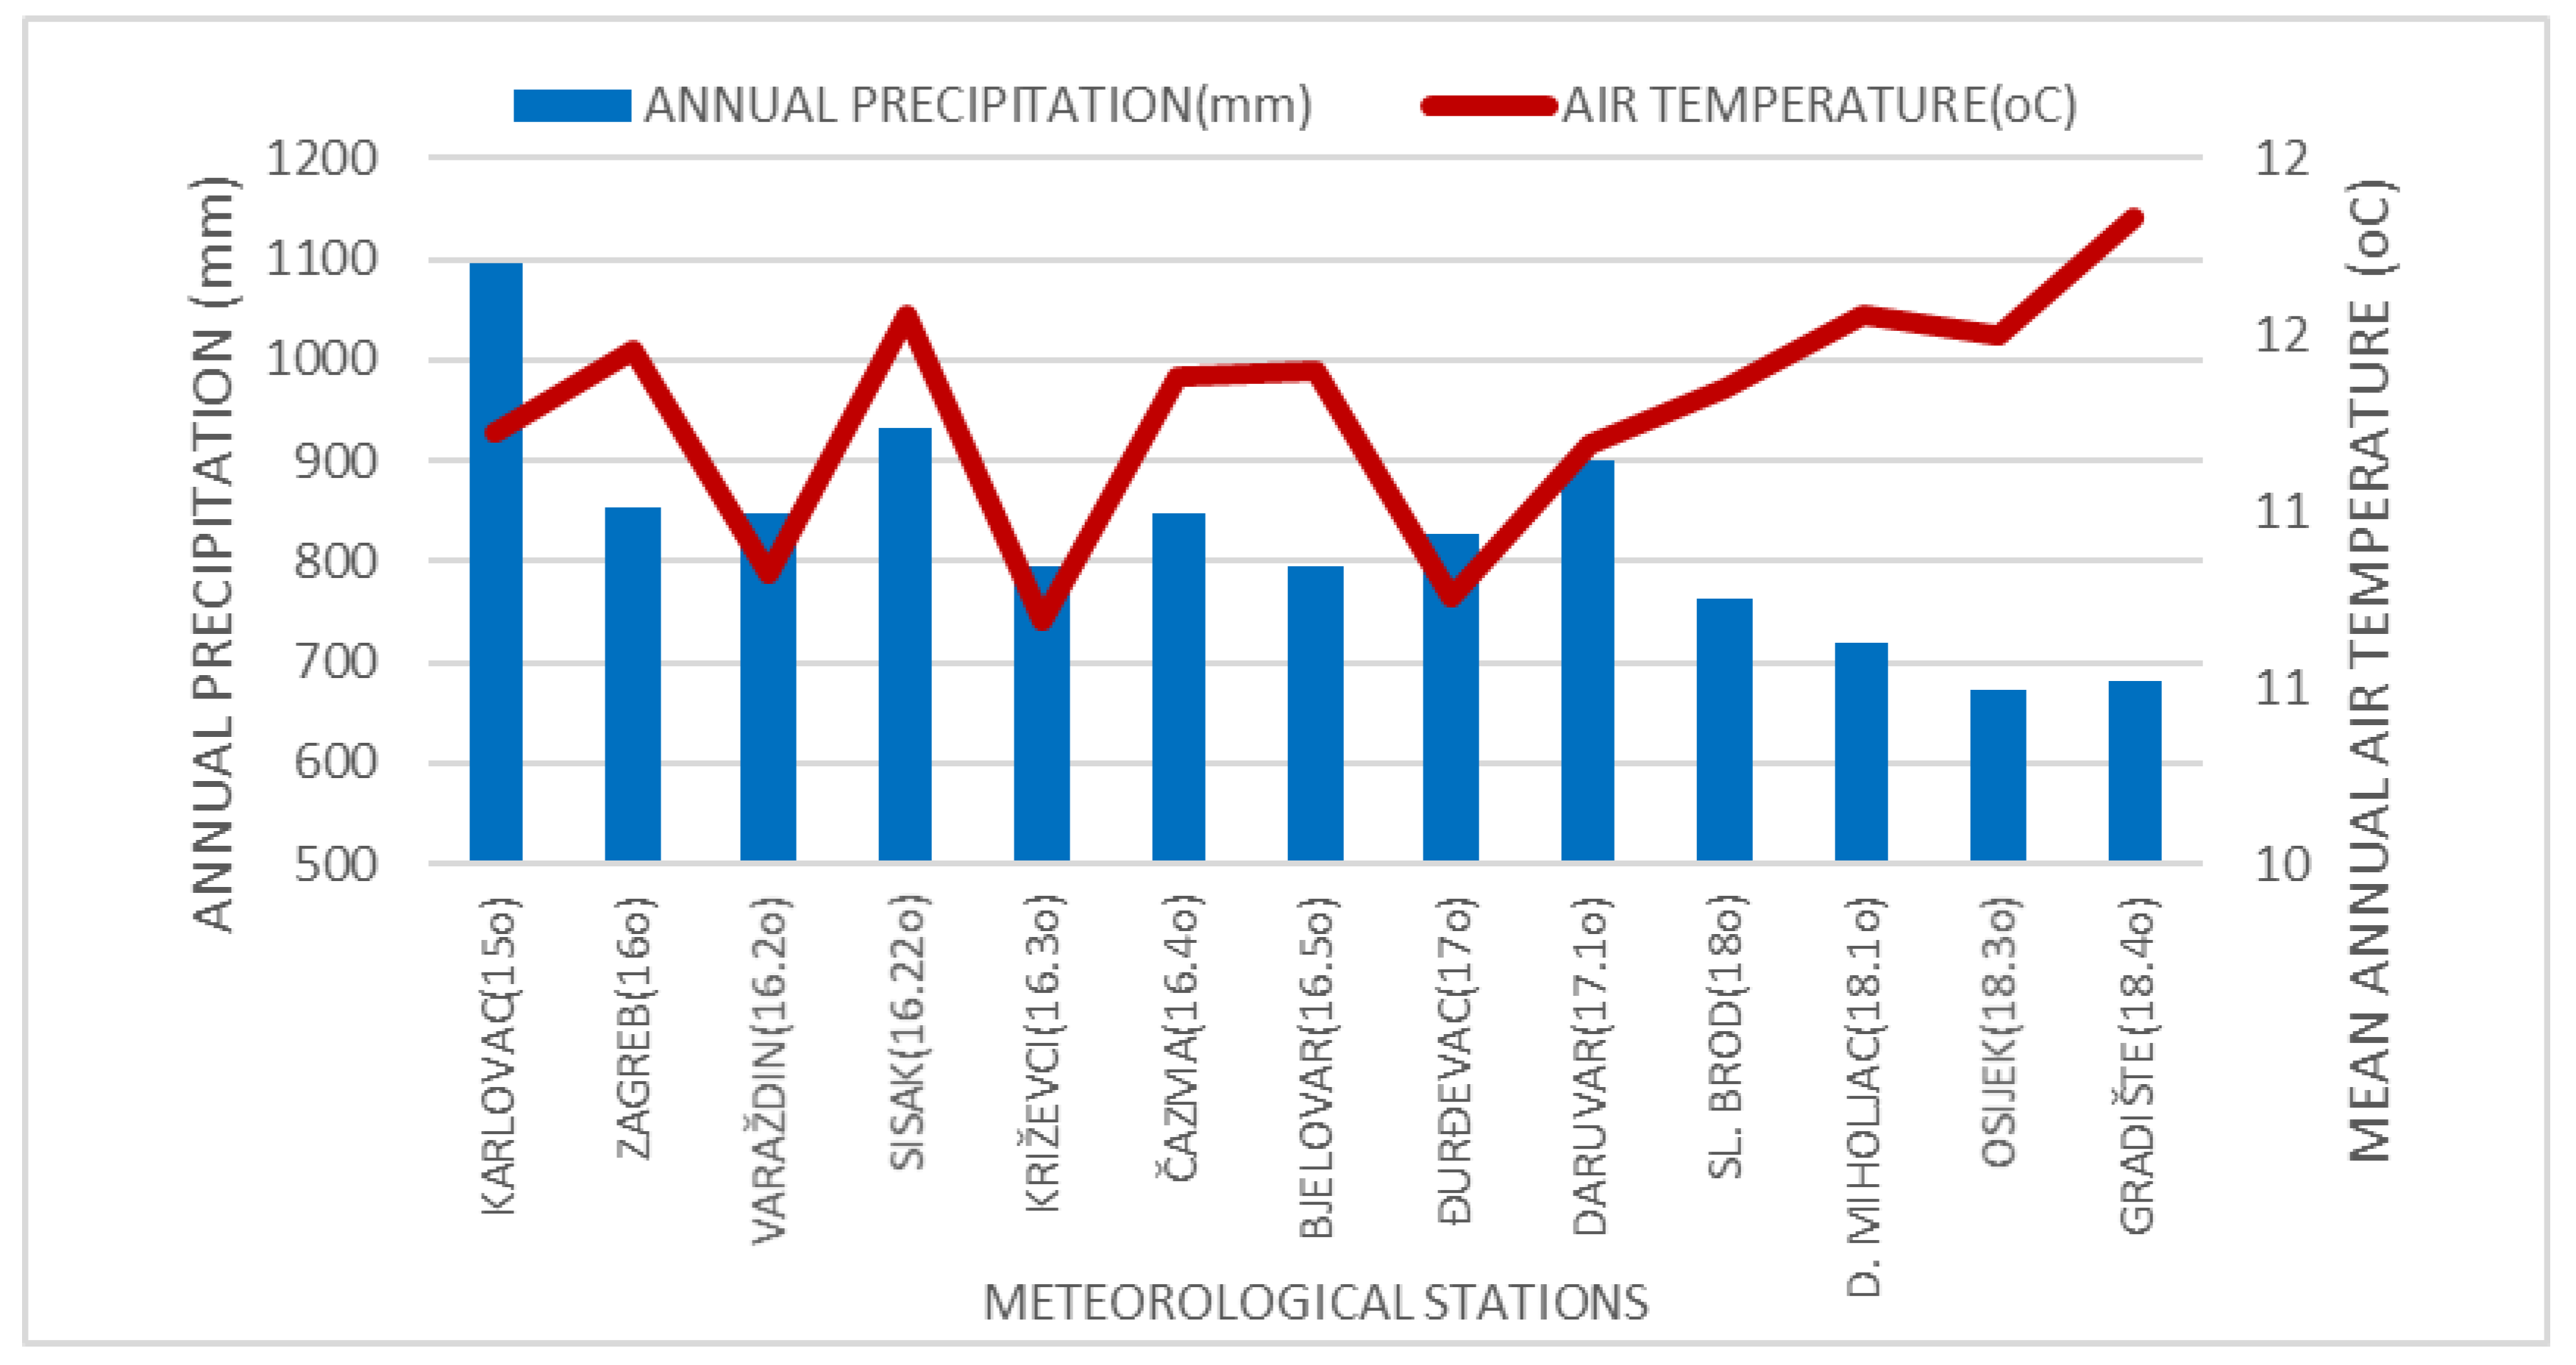
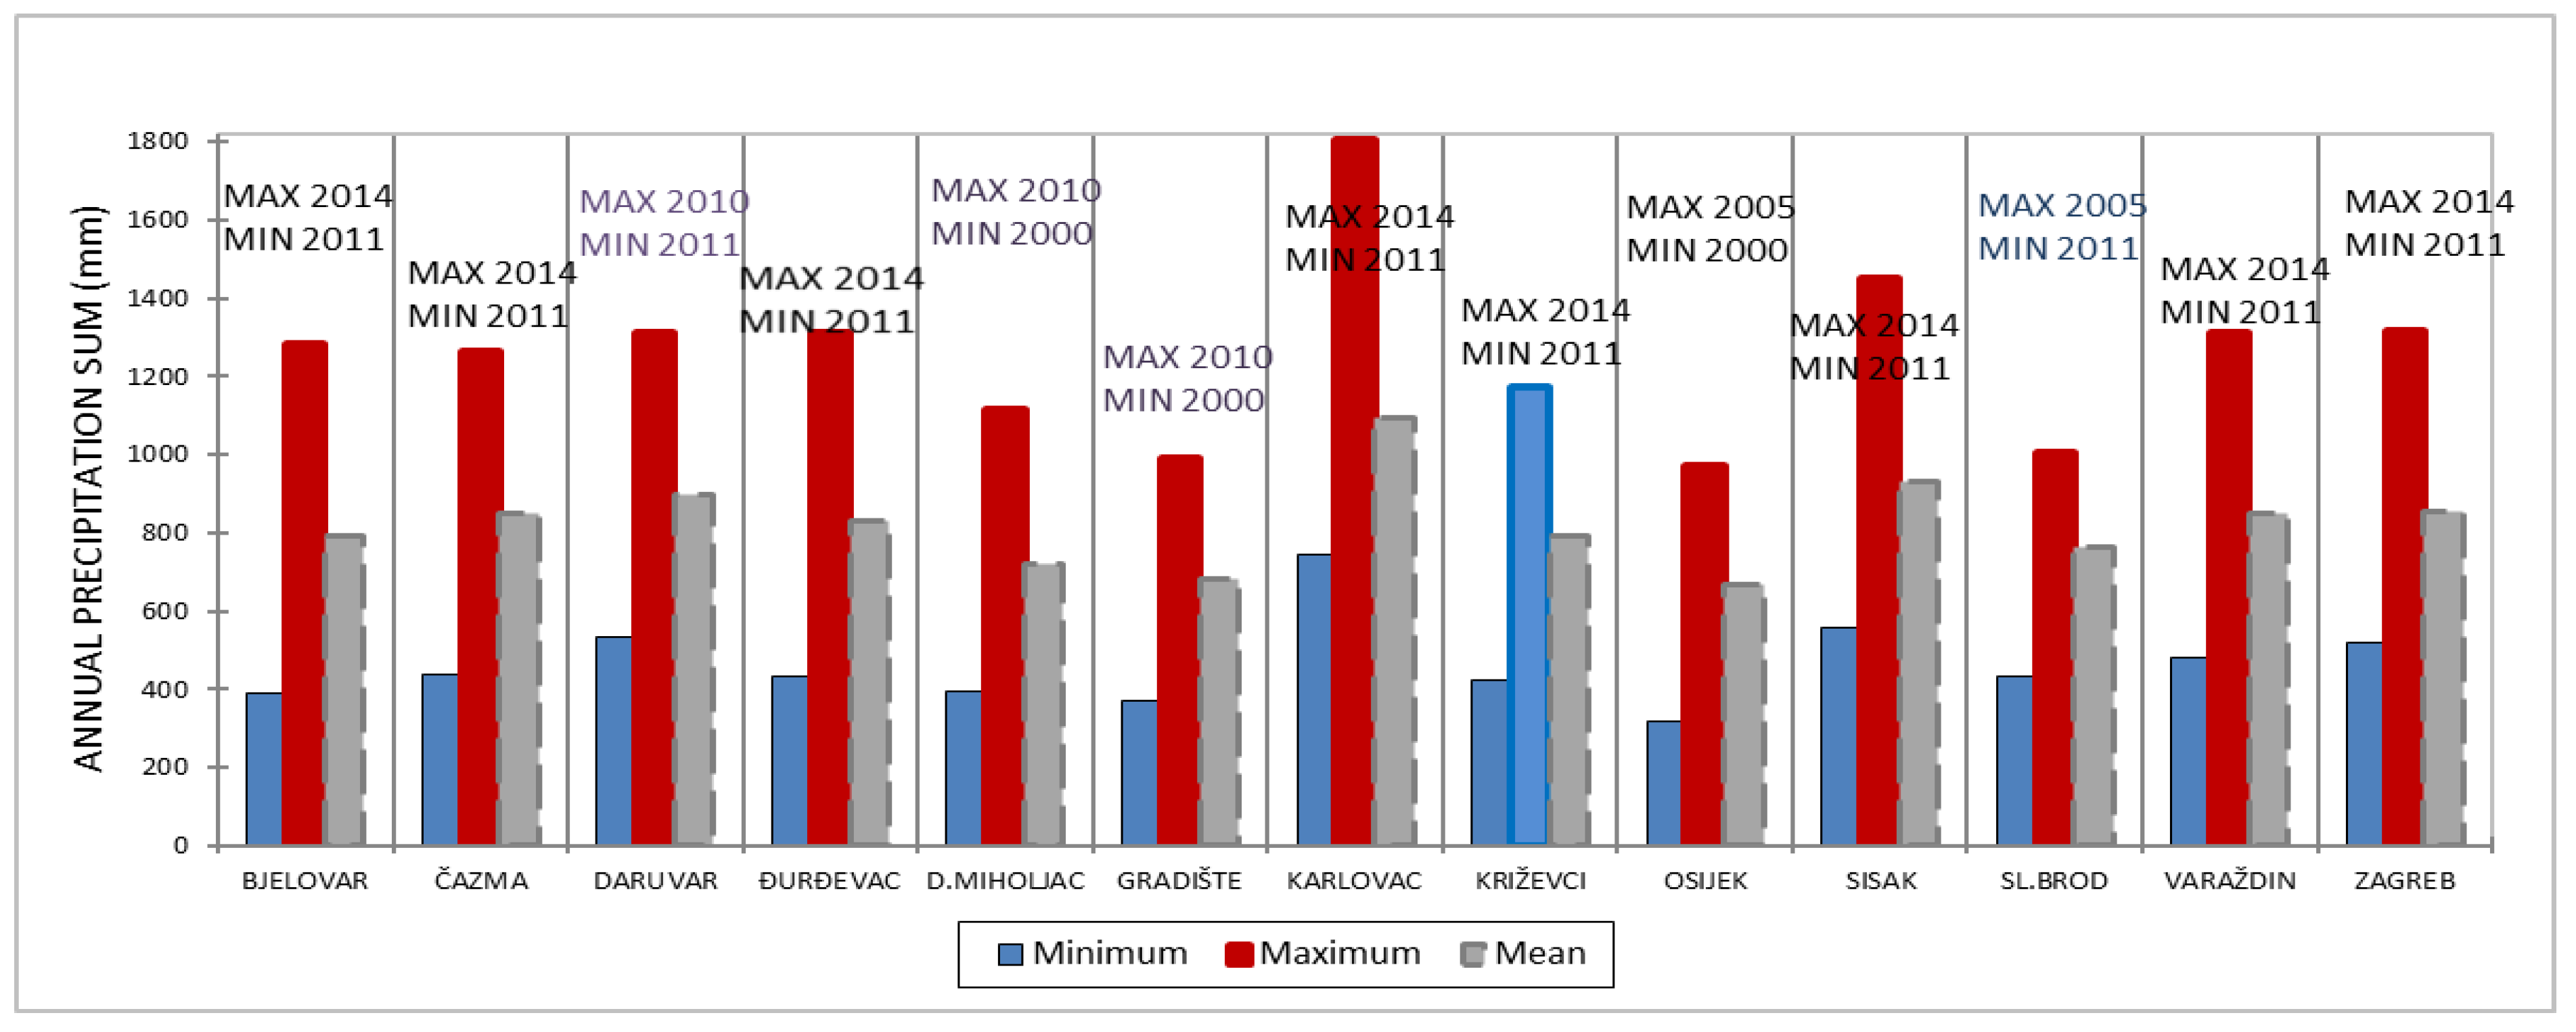
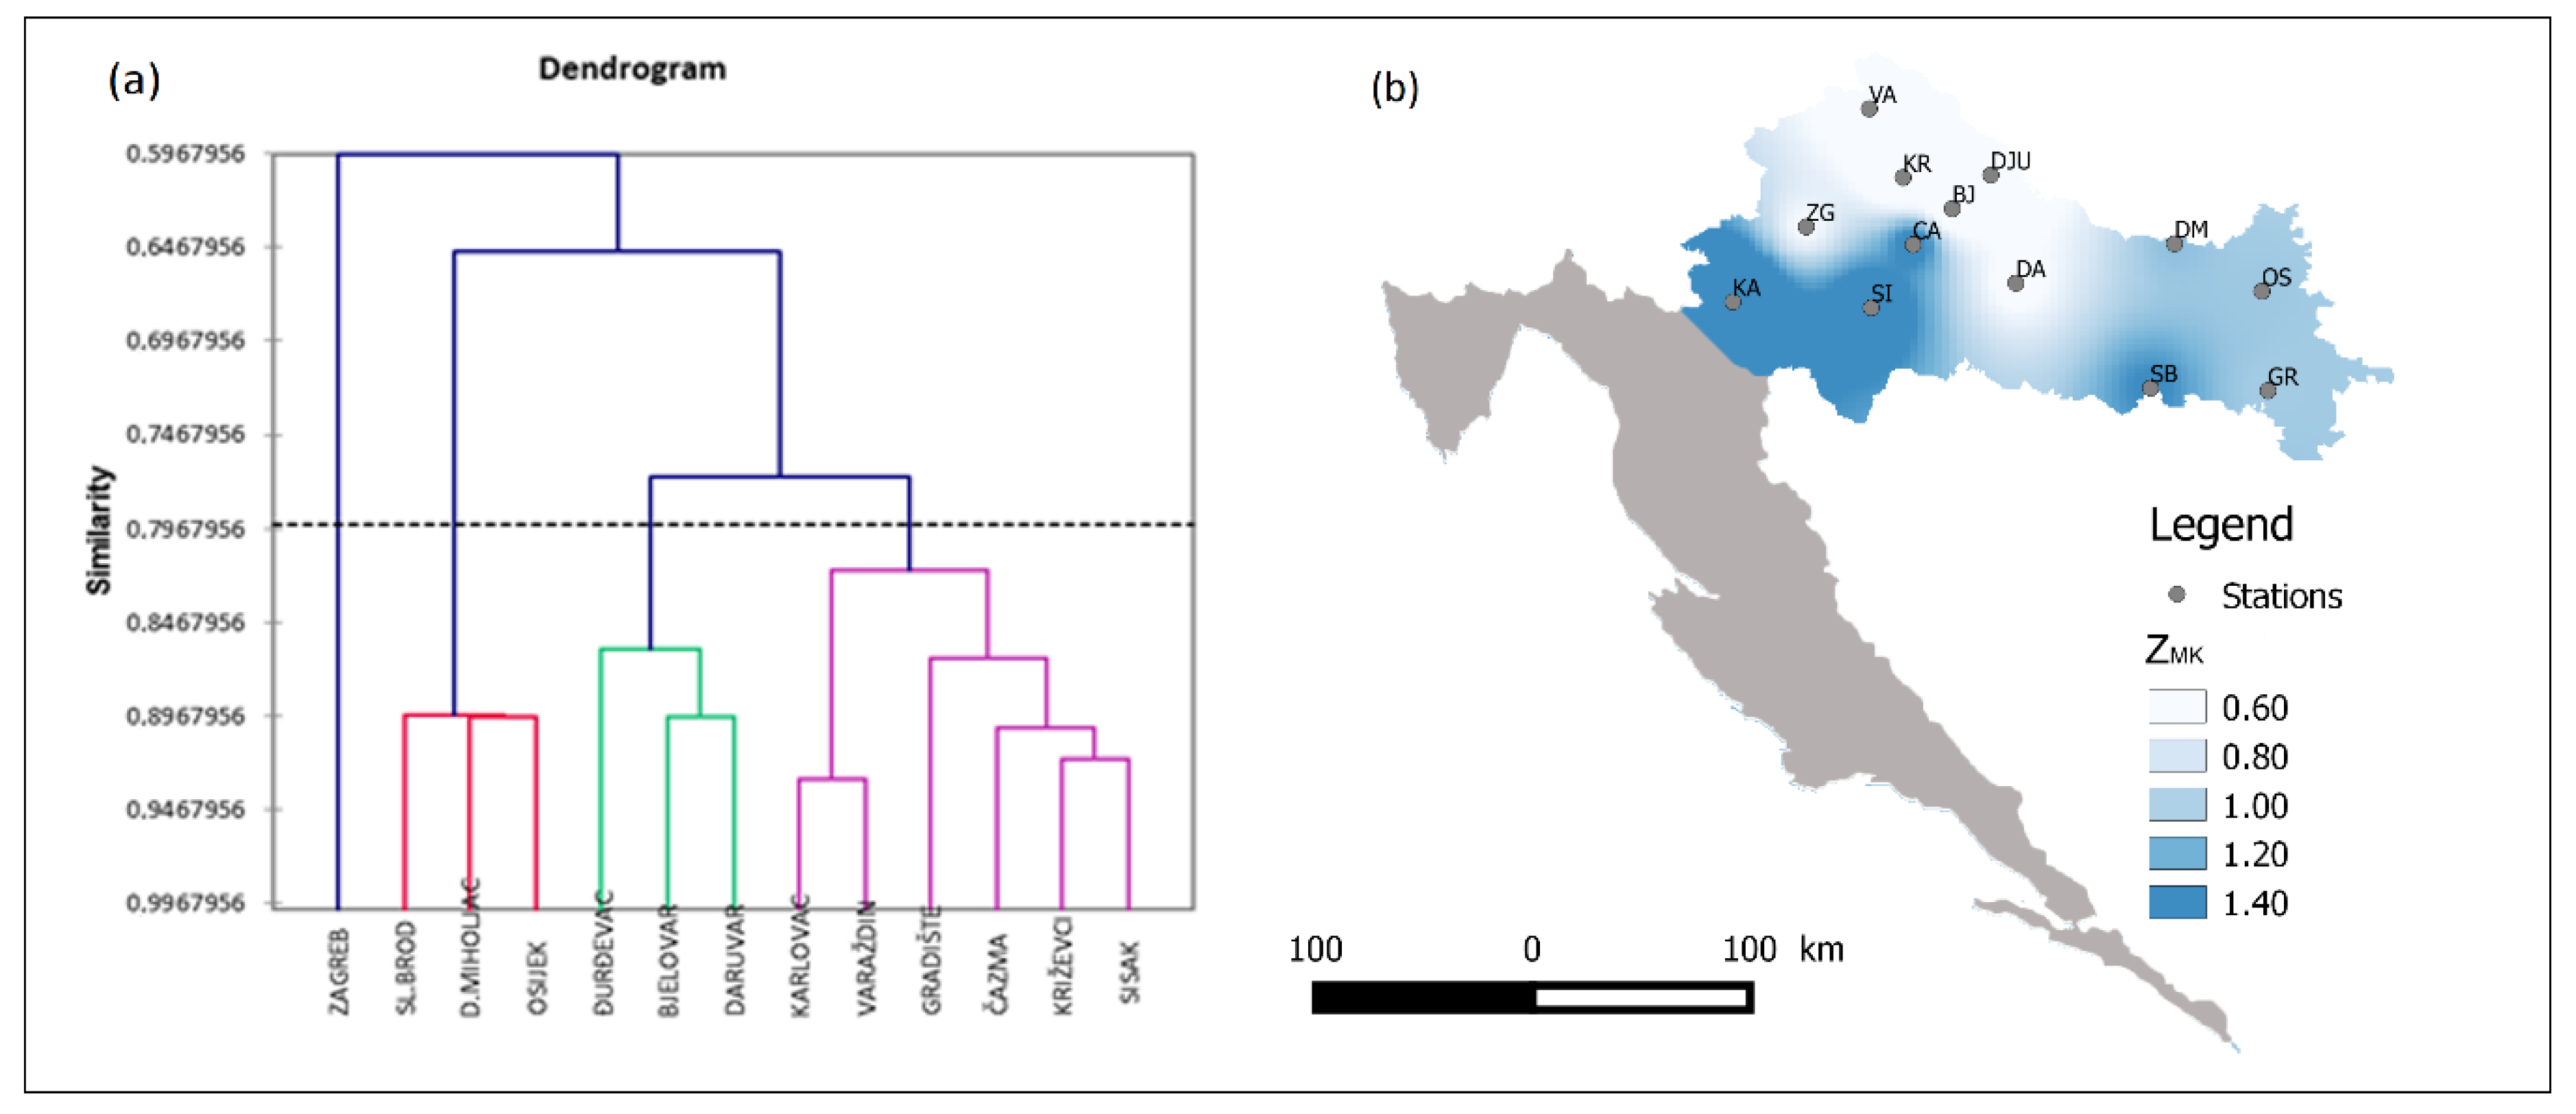
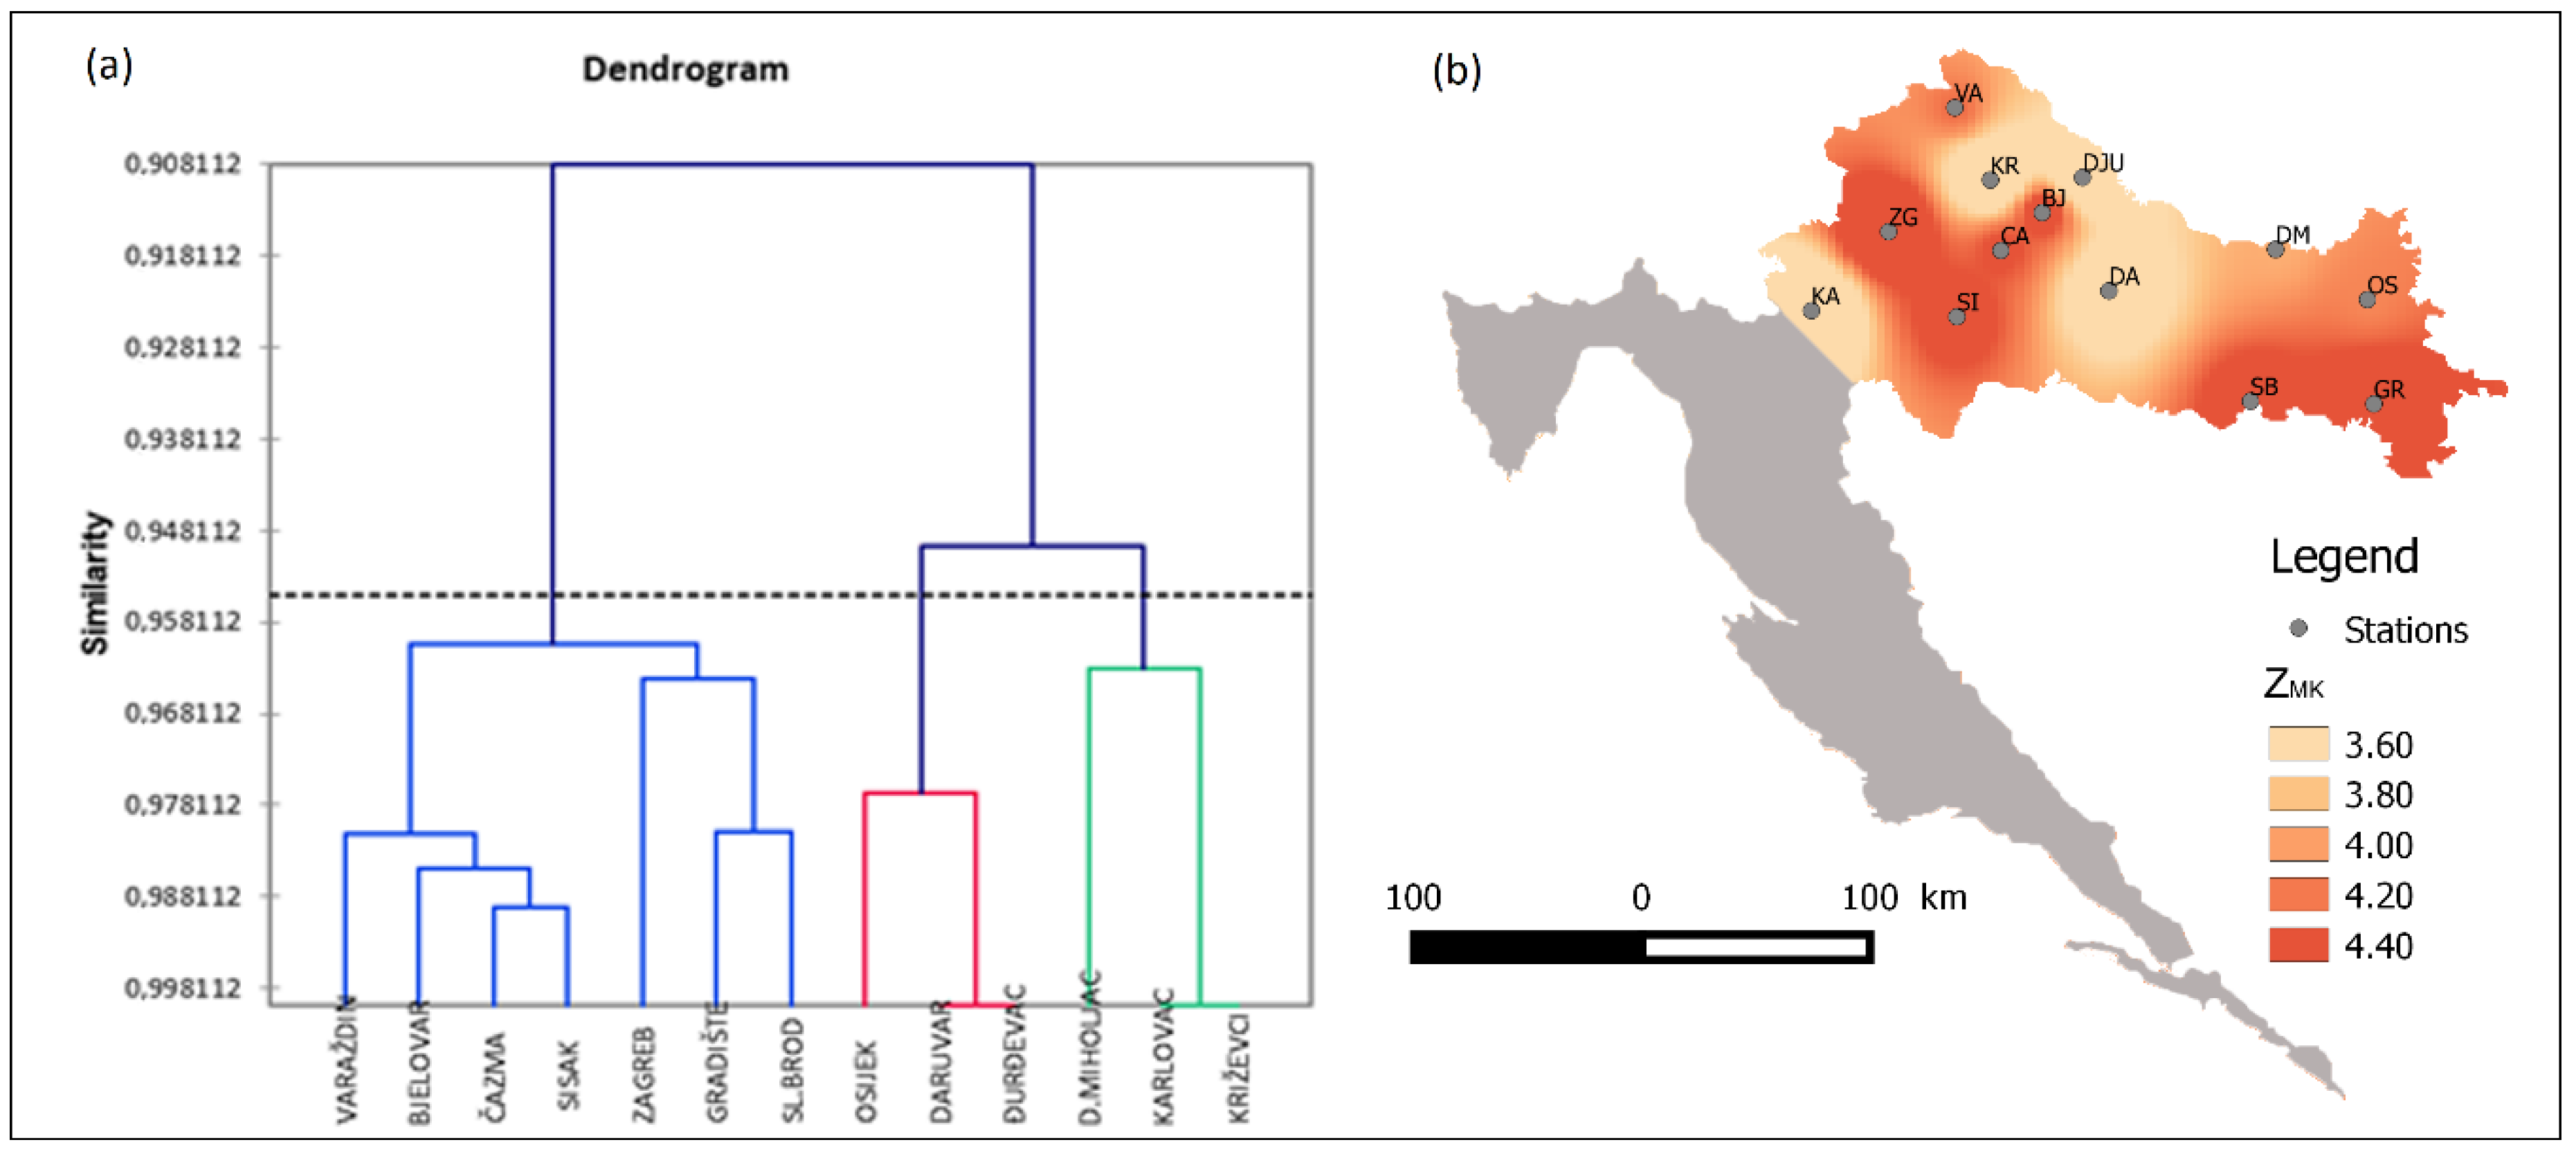
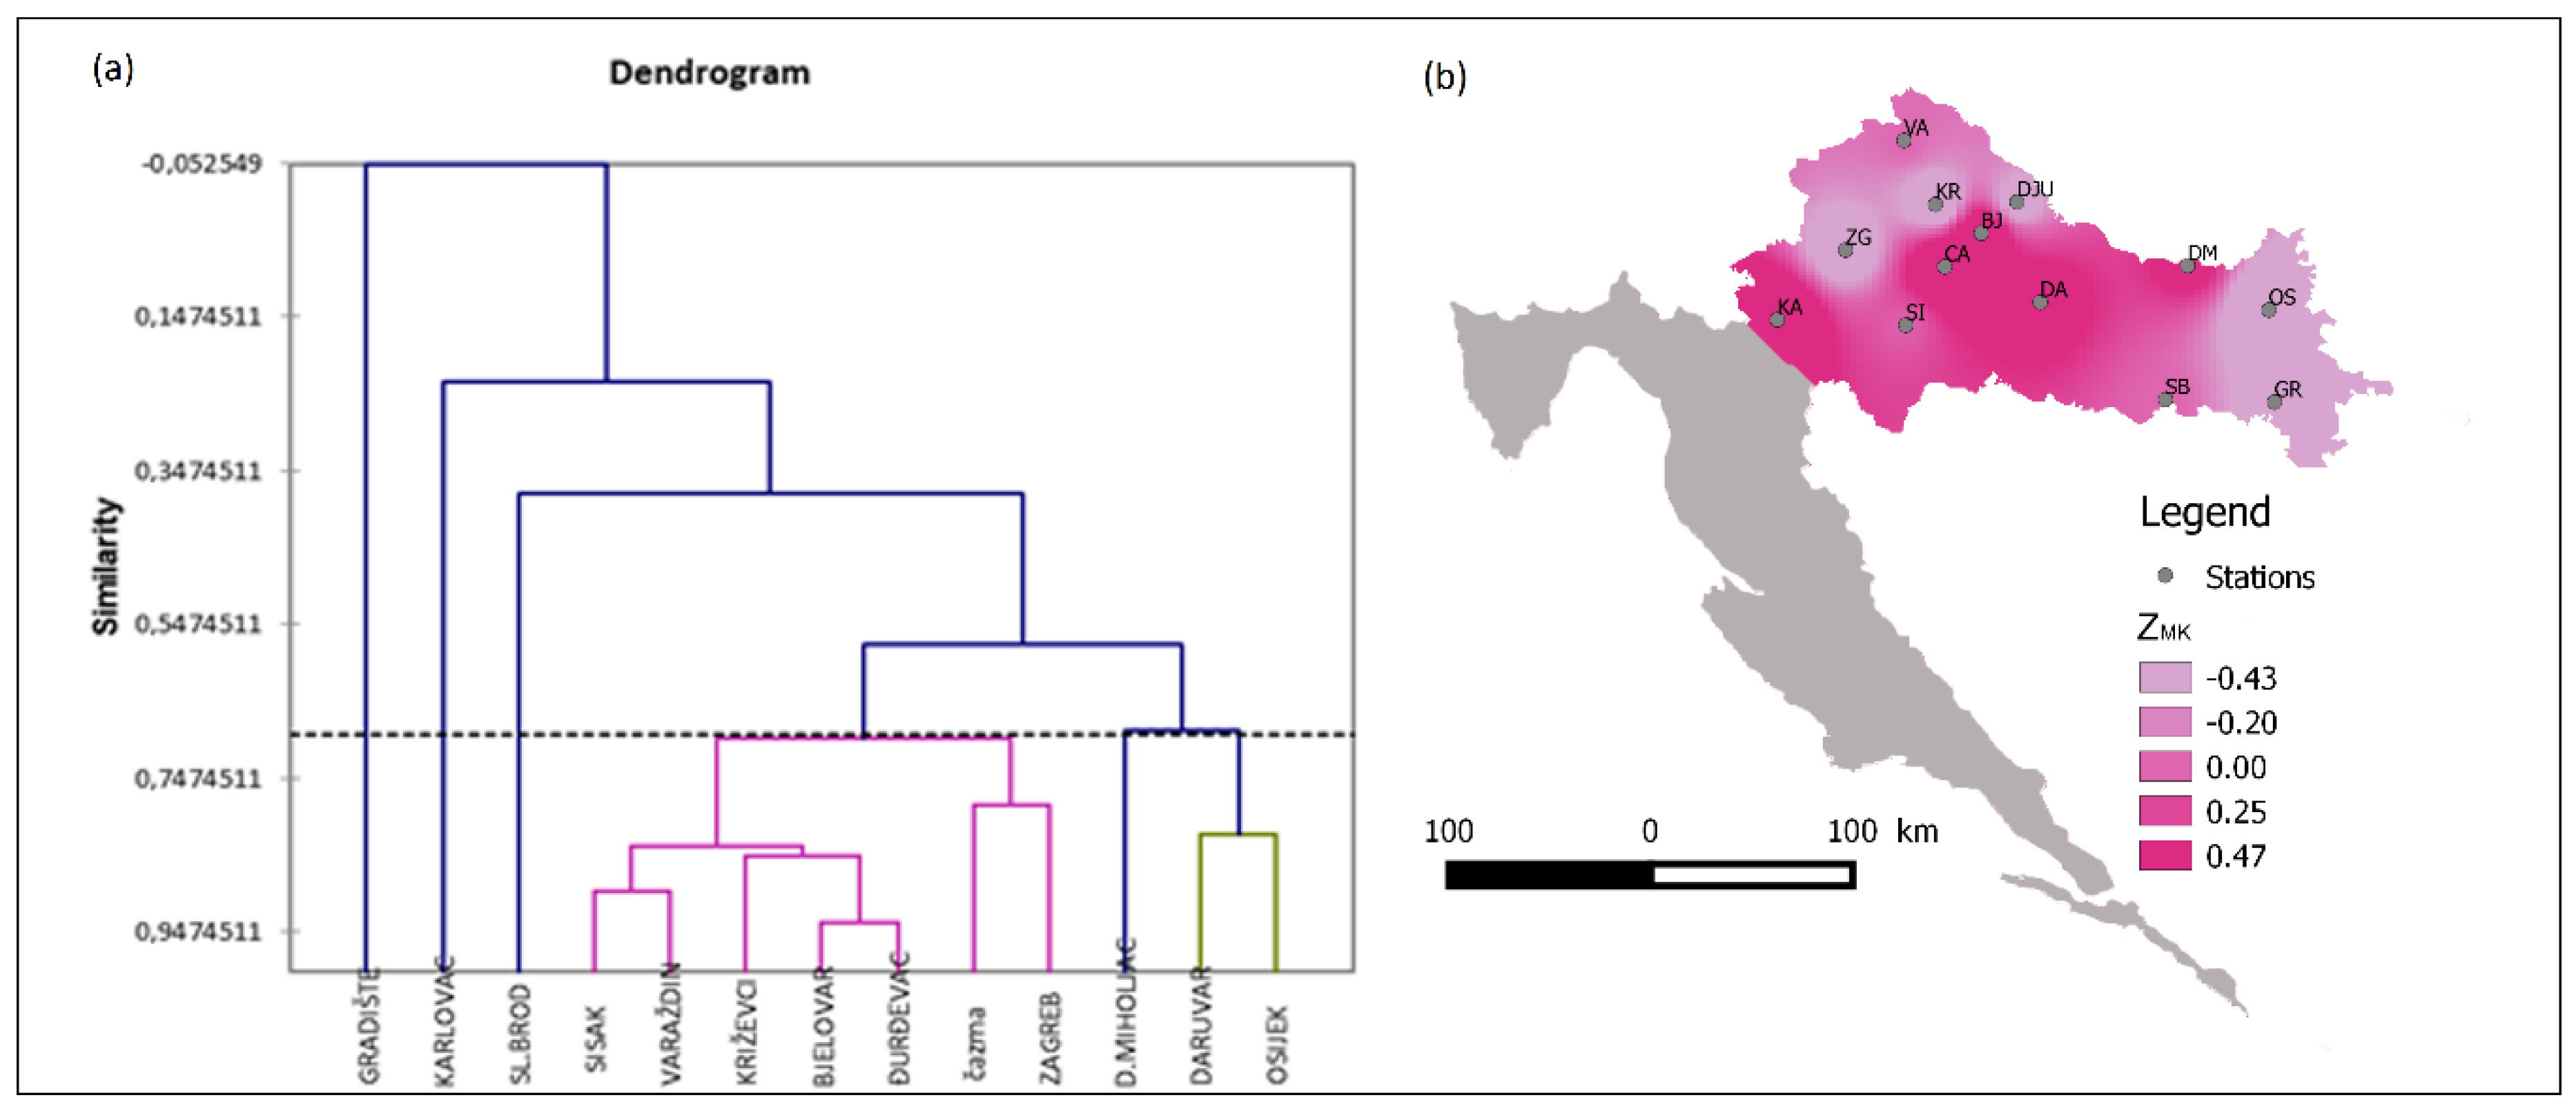
3.2. Spatial Variability
3.3. Copula Functions
4. Discussion and Conclusions
Author Contributions
Funding
Conflicts of Interest
References
- Lloyd-Hughes, B.; Shaffrey, L.C.; Vidale, P.L.; Arnell, N.W. An evaluation of the spatiotemporal structure of large-scale European drought within the HiGEM climate model. International. J. Climatol. 2012, 33, 2024–2035. [Google Scholar] [CrossRef]
- Ezenwaji, E.E.; Nzoiwu, C.P.; Chima, G.N. Analysis of Precipitation Concentration Index (PCI) for Awka Urban Area, Nigeria. Hydrol. Curr. Res. 2017, 8, 4. [Google Scholar]
- Klein Tank, A.M.G.; Können, G.P. Trends in Indices of Daily Temperature and Precipitation Extremes in Europe 1946–1990. J. Clim. 2003, 6, 3665–3680. [Google Scholar] [CrossRef]
- Solomon, S.D.; Qin, D.; Manning, M.; Chen, Z.; Marquis, M.; Averyt, K.B.; Tignor, M.; Miller, H.L. (Eds.) Climate Change 2007: The Physical Science Basis; Cambridge University Press: New York, NY, USA, 2007. [Google Scholar]
- Brunetti, M.; Buffoni, L.; Maugeri, M.; Nanni, T. Precipitation intensity trends in Northern Italy. Int. J. Climatol. 2000, 20, 1017–1031. [Google Scholar] [CrossRef]
- Alpert, P.; Ben-Gai, T.; Baharad, A.; Benjamini, Y.; Yekutieli, D.; Colacino, M.; Diodato, L.; Ramis, C.; Homar, V.; Romero, R.; et al. The paradoxical increase of Mediterranean extreme daily rainfall in spite of decrease in total values. Geophys. Res. Lett. 2002, 29, 311–314. [Google Scholar] [CrossRef]
- Kumar, P.V.; Bindi, M.; Crisci, A.; Maracchi, G. Detection of Variations in Air Temperature at Different Time Scales During the Period 1889–1998 at Firenze, Italy. Clim. Chang. 2005, 72, 123–150. [Google Scholar] [CrossRef]
- Costa, A.C.; Soares, A. Trends in extreme precipitation indices derived from a daily rainfall database for the South of Portugal. Int. J. Climatol. 2009, 29, 1956–1975. [Google Scholar] [CrossRef]
- Philandras, C.M.; Nastos, P.T.; Kapsomenakis, J.; Douvis, K.C.; Tselioudis, G.; Zerefos, C.S. Long term precipitation trends and variability within the Mediterranean region. Nat. Hazards Earth Syst. Sci. 2011, 11, 3235–3250. [Google Scholar] [CrossRef]
- Caloiero, T.; Veltri, S.; Caloiero, P.; Frustaci, F. Drought Analysis in Europe and in the Mediterranean Basin Using the Standardized Precipitation Index. Water 2018, 10, 1043. [Google Scholar] [CrossRef]
- Stahl, K.; Hisdal, H.; Hannaford, J.; Tallaksen, L.M.; van Lanen, H.A.J.; Sauquet, E.; Demuth, S.; Fendekova, M.; Jódar, J. Streamflow trends in Europe: Evidence from a dataset of near-natural catchments. Hydrol. Earth Syst. Sci. 2010, 14, 2367–2382. [Google Scholar] [CrossRef]
- Gudmundsson, L.; Tallaksen, L.M.; Stahl, K.; Clark, D.B.; Dumont, E.; Hagemann, S.; Bertrand, N.; Gerten, D.; Heinke, J.; Hanasaki, N.; et al. Comparing large-scale hydrological model simulations to observed runoff percentiles in Europe. J. Hydrometeorol. 2011, 13, 604–620. [Google Scholar] [CrossRef]
- Prudhomme, C.; Parry, S.; Hannaford, J.; Clark, D.B.; Hagemann, S.; Voss, F. How Well Do Large-Scale Models Reproduce Regional Hydrological Extremes in Europe? J. Hydrometeorol. 2011, 12, 1181–1204. [Google Scholar] [CrossRef]
- Kyselý, J. Trends in heavy precipitation in the Czech Republic over 1961–2005. Int. J. Climatol. 2009, 29, 1745–1758. [Google Scholar] [CrossRef]
- Cheng, S.; Huang, J. Enhanced soil moisture drying in transitional regions under a warming climate. J. Geophys. Res. Atmos. 2016, 121, 2542–2555. [Google Scholar] [CrossRef]
- Vogel, M.M.; Zscheischler, J.; Seneviratne, S.I. Varying soil moisture-atmosphere feedbacks explain divergent temperature extremes and precipitation projections in central Europe. Earth Syst. Dyn. 2018, 9, 1107–1125. [Google Scholar] [CrossRef]
- Vicente-Serrano, S.; Beguaria, S.; López-Moreno, J.I. A Multiscalar Drought Index Sensitive to Global Warming: The Standardized Precipitation Evapotranspiration Index. J. Clim. 2010, 23, 1696–1718. [Google Scholar] [CrossRef]
- Zhang, Y.; Li, Y.; Ge, J.; Li, G.; Yu, Z.; Niu, H. Correlation analysis between drought indices and terrrestrial water storage from 2002–2015 in China. Environ. Earth Sci. 2018, 77, 462. [Google Scholar] [CrossRef]
- Tirivarombo, S.; Osupile, D.; Eliasson, P. Drought monitoring and analysis: Standardised Precipitation Evapotranspiration Index (SPEI) and Standardised Precipitation Index (SPI). Phys. Chem. Earth 2018, 106, 1–10. [Google Scholar] [CrossRef]
- García-Valdecasas Ojeda, M.; Romero Jiménez, E.; Gámiz-Fortis, S.R.; Castro-Díez, Y.; Jesús Esteban Parra, M. Understanding the Drought Phenomenon in the Iberian Peninsula. In Drought (Aridity); Intechopen: London, UK, 2019; pp. 1–18. [Google Scholar]
- Zaninović, K.; Gajić-Čapka, M. Changes in components of the water balance in the Croatian Lowlands. Appl. Clim. 2000, 65, 111–117. [Google Scholar] [CrossRef]
- Gajić-Čapka, M.; Cindrić, K.; Pasarić, Z. Trends in precipitation indices in Croatia, 1961–2010. Appl. Clim. 2015, 121, 167–177. [Google Scholar] [CrossRef]
- Branković, Č.; Cindrić, K.; Gajić-Čapka, M.; Güttler, I.; Pandžić, K.; Patarčić, M.; Srnec, L.; Tomašević, I.; Vučetić, V.; Zaninović, K. Sixth National Communication of the Republic of Croatia under the UN Framework Convention on the Climate Change (UNFCCC). Clim. Chang. Impacts Adapt. Meas. 2013, 8. [Google Scholar]
- Perčec Tadić, M.; Gajić-Čapka, M.; Gačeša-Zaninović, K.; Cindrić, K. Drought Vulnerability in Croatia. Agric. Conspec. Scintificus 2014, 79, 31–38. [Google Scholar]
- Garbrecht, J.; Fernandez, P.G. Visualizationof trends and fluctuations in climatic records. Water Resour. Bull. 1994, 30, 297–306. [Google Scholar] [CrossRef]
- Bonacci, O.; Trninić, D.; Roje-Bonacci, T. Analysis of the water temperature regime of the Danube and its tributaries in Croatia. Hydrol. Process. 2008, 22, 1014–1021. [Google Scholar] [CrossRef]
- Mann, H.B. Nonparametric tests against trend. Econometrica 1945, 13, 245–259. [Google Scholar] [CrossRef]
- Kendall, M.G. Rank Correlation Methods; Charles Griffin & Company Limited: London, UK, 1962. [Google Scholar]
- Gilbert, R.O. Statistical Methods for Environmental Pollution Monitoring; Wiley: New York, NY, USA, 1987. [Google Scholar]
- Asfaw, A.; Simane, B.; Hassen, A.; Bantider, A. Variability and time series trend analysis of rainfall and temperature in northcentral Ethiopia: A case study in Woleka sub-basin. Weather Clim. Extrem. 2018, 19, 29–41. [Google Scholar] [CrossRef]
- Salmi, T.; Määttä, A.; Anttila, P.; Ruoho-Airola, T.; Amnell, T. Detecting Trends of Annual Values of Atmospheric Pollutants by the Mann-Kendall Test and Sen’s Slope Estimates—The Excel Template Application MAKESENS; Finnish Meteorological Institute: Helsinki, Finland, 2002; p. 31. [Google Scholar]
- Tadić, L.; Brleković, T. Drought and Precipitation Concentration Index (PCI) analysis in continental Croatia. In Proceedings of the 16th International Simposium Water Management & Hydraulic Engineering WMHE, Skopje, Nirth Macedonia, 3–7 September 2019. [Google Scholar]
- Liu, Y.; Chen, S.; Sun, H.; Gui, D.; Xue, J.; Lei, J.; Zeng, X.; Lv, G. Does the long-term precipitation variations and dry-wet conditions exist inthe arid areas? A case study from China. Quat. Int. 2019, 519, 3–9. [Google Scholar]
- Wang, F.; Wang, Z.; Yang, H.; Zhao, Y.; Zhang, Z.; Li, Z.; Hussain, Z. Copula-Based Drought Analysis Using Standardized Precipitation Evapotranspiration Index: A Case Study in the Yellow River Basin, China. Water 2019, 11, 1298. [Google Scholar] [CrossRef]
- Tadić, L.; Dadić, T.; Bosak, M. Comparison of different drought assessment methods in continental Croatia. Građevinar 2015, 671, 11–22. [Google Scholar]
- Li, B.; Zhou, W.; Zhao, Y.; Ju, Q.; Yu, Z.; Liang, Z.; Acharya, K. Using the SPEI to Assess Recent Climate Change in the Yarlung Zangbo River Basin, South Tibet. Water 2015, 7, 5474–5486. [Google Scholar] [CrossRef]
- Liu, X.; Liu, W. Regionalization and Spatiotemporal Variation of Drought in China Based on Standardized Precipitation Evapotranspiration Index (1961–2013). Adv. Meteorol. 2015, 2015, 950262. [Google Scholar] [CrossRef]
- Karmakar, S.; Simonovic, S.P. Flood Frequency Analysis Using Copula with Mixed Marginal Distributions; Project Report No: 055.2007; University of Western Ontario, Department of Civil and Environmental Engineering: London, ON, Canada, 2007. [Google Scholar]
- Klein, B.; Pahlow, M.; Hundecha, Y.; Schumann, A. Probability Analysis of Hydrological Loads for the Design of Flood Control Systems Using Copulas. J. Hydrol. Eng. 2010, 15, 360–369. [Google Scholar] [CrossRef]
- Sraj, M.; Bezak, N.; Brilly, M. Bivariate flood frequency analysis using the copula function: A case study of the Litija station on the Sava River. Hydrol. Process. 2015, 29, 225–238. [Google Scholar] [CrossRef]


| Meteorological Station | Northern Geographical Longitude | Northern Geographical Latitude | Altitude (m a.s.l.) |
|---|---|---|---|
| Karlovac (KA) | 15°34′ | 45°30′ | 110 |
| Zagreb-Maksimir (ZG) | 16°02′ | 45°49′ | 123 |
| Varaždin (VŽ) | 16°20′ | 46°18′ | 167 |
| Sisak (SI) | 16°22′ | 45°30′ | 98 |
| Križevci (KR) | 16°33′ | 46°02′ | 155 |
| Čazma (ČA) | 16°38′ | 45°45′ | 144 |
| Bjelovar (BJ) | 16°51′ | 45°55′ | 141 |
| Đurđevac (ĐU) | 17°04′ | 46°03′ | 121 |
| Daruvar (DA) | 17°14′ | 45°36′ | 161 |
| Slavonski Brod (SB) | 17°23′ | 45°10′ | 88 |
| Donji Miholjac (DM) | 18°10′ | 45°46′ | 97 |
| Osijek (OS) | 18°34′ | 45°30′ | 89 |
| Gradište (GR) | 18°42′ | 45°09′ | 97 |
| SPEI Value | SPEI Classification |
|---|---|
| ≥2.00 | Extremely wet |
| 1.50–1.99 | Very wet |
| 1.00–1.49 | Moderately wet |
| −0.99–0.99 | Normal |
| −1.49–(−1.0) | Moderately dry |
| −1.99–(−1.5) | Very dry |
| ≤−2.00 | Extremely dry |
| PRECIPITATION | BJ | ČA | DA | ĐU | DM | GR | KA | KR | OS | SI | SB | VŽ | ZG |
|---|---|---|---|---|---|---|---|---|---|---|---|---|---|
| Homogeneity | YES | YES | YES | YES | YES | YES | YES | YES | YES | YES | YES | YES | YES |
| Mann-Kendall Coeff. (ZMK) | 0.352 | 1.609 | 0.503 | −0.101 | 1.106 | 1.031 | 2.565 | 0.101 | 1.056 | 1.986 | 1.433 | 0.377 | 0.578 |
| Trend Significance | - | - | - | - | - | - | * (α= 0.05) | - | - | * (α= 0.05) | - | - | - |
| AIR TEMPERATURE | BJ | ČA | DA | ĐU | DM | GR | KA | KR | OS | SI | SB | VŽ | ZG |
|---|---|---|---|---|---|---|---|---|---|---|---|---|---|
| Homogeneity | NO | NO | NO | NO | NO | NO | YES | NO | NO | NO | NO | NO | NO |
| Break Year | 1998 | 2005 | 2006 | 1998 | 1998 | 1999 | - | 1998 | 2005 | 1998 | 1998 | 1999 | 1998 |
| Mann-Kendall Coeff. (ZMK) | 4.802 | 4.526 | 2.741 | 4.463 | 3.910 | 4.904 | 2.414 | 5.369 | 4.123 | 4.778 | 4.749 | 4.262 | 5.431 |
| Trend Significance | *** (α= 0.001) | *** (α= 0.001) | ** (α= 0.01) | - | *** (α= 0.001) | *** (α= 0.001) | * (α= 0.05) | - | *** (α= 0.001) | *** (α= 0.001) | *** (α= 0.001) | *** (α= 0.001) | *** (α= 0.001) |
| SPEI | BJ | ČA | DA | ĐU | DM | GR | KA | KR | OS | SI | SB | VŽ | ZG |
|---|---|---|---|---|---|---|---|---|---|---|---|---|---|
| Homogeneity | NO | NO | NO | NO | NO | NO | NO | NO | NO | NO | NO | NO | NO |
| Break Year | 2010 | 1993 | 1993 | 2000 | 1993 | 2006 | 1993 | 1999 | 2006 | 1993 | 2006 | 1999 | 2000 |
| Mann-Kendall Coeff. (ZMK) | 1.216 | 1.635 | 0.902 | −0.824 | 0.719 | −0.693 | 1.556 | −1.269 | −1.425 | 0.039 | 0 | −0.013 | −0.164 |
| Trend Significance | - | - | - | - | - | - | - | - | - | - | - | - | - |
| Station | Drought Characteristics | Marginal Distribution | Equivalent Rank Order Coefficient | Kendall’s Tau Coefficient | Copula |
|---|---|---|---|---|---|
| KA | Duration | Burr | 0.96 | 0.83 | Clayton |
| Severity | Beta4 | ||||
| ZG | Duration | JohnsonU | 0.96 | 0.83 | Clayton |
| Severity | Beta4 | ||||
| VA | Duration | Fatigue | 0.98 | 0.90 | Gumbel |
| Severity | Beta4 | ||||
| SI | Duration | Beta4 | 0.99 | 0.91 | Gumbel |
| Severity | JohnsonB | ||||
| KR | Duration | Burr | 0.94 | 0.75 | Frank |
| Severity | Beta4 | ||||
| ČA | Duration | JohnsonU | 0.96 | 0.83 | Frank |
| Severity | Beta4 | ||||
| BJ | Duration | GPD | 0.89 | 0.71 | Normal |
| Severity | Beta4 | ||||
| ĐU | Duration | GPD | 0.89 | 0.73 | Normal |
| Severity | Burr | ||||
| DA | Duration | Fatigue | 0.96 | 0.83 | Frank |
| Severity | Beta4 | ||||
| SB | Duration | Burr | 0.96 | 0.83 | Frank |
| Severity | Beta4 | ||||
| DM | Duration | Beta4 | 0.99 | 0.90 | Gumbel |
| Severity | Beta4 | ||||
| OS | Duration | Fatigue | 0.96 | 0.83 | Frank |
| Severity | Beta4 | ||||
| GR | Duration | Fatigue | 0.90 | 0.65 | Frank |
| Severity | Beta4 |
© 2019 by the authors. Licensee MDPI, Basel, Switzerland. This article is an open access article distributed under the terms and conditions of the Creative Commons Attribution (CC BY) license (http://creativecommons.org/licenses/by/4.0/).
Share and Cite
Tadić, L.; Brleković, T.; Hajdinger, A.; Španja, S. Analysis of the Inhomogeneous Effect of Different Meteorological Trends on Drought: An Example from Continental Croatia. Water 2019, 11, 2625. https://doi.org/10.3390/w11122625
Tadić L, Brleković T, Hajdinger A, Španja S. Analysis of the Inhomogeneous Effect of Different Meteorological Trends on Drought: An Example from Continental Croatia. Water. 2019; 11(12):2625. https://doi.org/10.3390/w11122625
Chicago/Turabian StyleTadić, Lidija, Tamara Brleković, Andreja Hajdinger, and Save Španja. 2019. "Analysis of the Inhomogeneous Effect of Different Meteorological Trends on Drought: An Example from Continental Croatia" Water 11, no. 12: 2625. https://doi.org/10.3390/w11122625
APA StyleTadić, L., Brleković, T., Hajdinger, A., & Španja, S. (2019). Analysis of the Inhomogeneous Effect of Different Meteorological Trends on Drought: An Example from Continental Croatia. Water, 11(12), 2625. https://doi.org/10.3390/w11122625