1. Introduction
Contaminates transported through stormwater runoff to coastal waters can pose a potential risk to public health and the environment [
1]. Furthermore, the stormwater drainage system can also be contaminated by sewage through infiltration or unintended connections with sewer systems and poorly maintained in-ground sewage disposal systems [
2]. Contaminated stormwater runoff will often contain excessive levels of bacterial contaminants, which are directly related to disease outbreaks and adverse impacts to aquatic life [
3,
4]. Therefore, many municipalities will monitor and manage stormwater quality for both health and environmental concerns. Fecal coliforms (FC) have historically been used as a fecal indicator to indicate the presence of microbial contamination in surface and ground waters [
5,
6]. Since they are considered as an indicator of surface water quality and safety, FC is often selected for monitoring in those water quality monitoring programs concerned with microbial loading. Microbially contaminated water can be a serious source of intestinal disease through ingestion, or exposure through bathing or by consuming contaminated shellfish [
7]. Factors that could affect fecal indicator bacteria levels have been investigated in the literature [
8,
9,
10]. Sewage overflow, wildlife and stormwater runoff from urban and agricultural land use are important sources of fecal coliform affecting water quality [
11,
12]. Non-point urban and agricultural land use zones have significant impacts on water quality and produce a large number of fecal bacteria conveyed to water bodies [
13,
14]. As well, climatic variables like precipitation and wet seasons in a region are suggested to have a positive correlation with the concentration of fecal bacteria in the surface waters [
15,
16,
17].
There are a variety of studies looking at stormwater generated microbial loadings and how they are influenced by climatic variables. Henry et al. [
18] found rainfall within the 24 h preceding sampling was found to be correlated with incidence of fecal matter, however, absence of rainfall was also significantly tied the incidence of fecal matter depending on the location. The length of the period over which precipitation was computed for determining correlations with fecal contamination, impacted whether the correlations were positive, negative, significant, or had no impact [
19,
20,
21,
22,
23]. Seasonal variations in the correlations computed for fecal indicators versus temperature, precipitation and antecedent dry period length were observed in several studies [
21,
24,
25] but generally, temperature was positively correlated with indicator bacteria concentrations [
26], and precipitation was also positively correlated [
20,
22]. McCarthy et al. [
27] found that
E. coli (EC) levels were highly correlated to antecedent climatic parameters but like [
26], found they were less correlated to hydrologic parameters such as runoff and suggested that EC concentrations “were not prone to displaying a first flush effect”, which is in contrast to other studies in which fecal coliforms peaked after storm events [
28]. Solar intensity was also seen to have a negative correlation with EC [
29]. The additional influence of spatial location in analyses examining climatic influences on fecal contamination was observed in several studies [
30,
31] with Vermeulen and Hofstra [
31] suggesting that the great variability among location characteristics helped to explain variations in
E. coli levels in their study. All of these studies vary extensively by how strongly or weakly correlations are seen between bacteria loading and climate variables, as well as to the way the variable is constructed. That is, depending on whether precipitation is measured during a rain event, on the day of sampling, or averaged over a 3 day period over which the sampling took place, produced variations in results. This suggests that the scale of the climate variable matters as much in the research as the climatic variable itself (whether temperature, precipitation, solar radiation, etc.).
Spatial influence studies in the literature include several works stating that the contamination in coastal water quality is caused by the combined effects of human activity and environmental factors in coastal areas [
28,
32]. The accumulated fecal coliform can be transported into nearshore ocean regions from direct runoff or sewage overflow during storm events [
33,
34] in combined sewer systems. Mallin et al. [
35] showed that watershed population and watershed size were significantly related to average fecal coliform levels, with the strongest relationships for percentage of impervious surface and fecal coliform levels. Jent et al [
19] found that in non-dry periods, fecal contamination was significantly correlated with agricultural land use, while Tiefenthaler et al. [
21] showed that mean EC were significantly greater in developed watersheds than undeveloped watersheds. Similarly, Vitro et al. [
36] found that road network density was associated with increasing fecal coliform levels but housing unit density had a significantly negative relationship with FC levels; Paule-Mercado et al. [
25] found the highest FC concentrations were also found in urban areas versus agricultural areas. Delpla and Rodriguez [
37] showed that FC were significantly and positively correlated with urban and agricultural land, but forests were negatively correlated. FC concentration was found to be significantly and positively correlated with urban land use in even low percentages of urbanization [
38]. Additional studies [
20,
22] found higher fecal indicator bacteria concentrations in urban sites over forested sites. The literature suggests that urban areas provide higher bacterial loads in comparison to undeveloped green spaces, and agricultural lands also contribute higher bacterial loads than green spaces.
Other studies have gone a step further in attempts to mathematically model bacteria levels as a function of land-use or climatic variables in order to provide insight into the relationships. Wu et al. [
23] used logistic regression modelling and showed that EC
presence was significantly and positively associated with developed area but negatively associated with agricultural area. Multivariable logistic regression models were used to show that increases in the number of heavy rain days significantly increased the likelihood of the presence of EC and that EC was also likely to be detected with increases in mean temperature. Cha et al. [
24] developed a model using Bayesian regression that used meteorological and land-use characteristics to estimate FC concentrations. The modelling was used to provide predictions in FC increases given temperature increases. Galfi et al. [
39] used PCA and cluster analysis to find correlation patterns and found that significant climatic variables for influencing indicator bacteria levels varied among catchments as well as seasonally. St. Laurent and Mazumder [
38] used a classification tree to better understand the influence of land use on FC levels. A common aspect of all of these modelling studies is that they use data-driven, stochastic methods for modelling. This is reasonable as causal mechanisms are difficult to capture and physically based models may be onerous to implement when simply attempting to determine climatic influences on FC concentrations. Examples of sophisticated, physically-based models in the literature that predict bacterial levels as a function of environmental parameters include [
29,
40], but both look at transport in river systems. The latter did note that the sparsity in the time series of bacteria concentrations adversely affected the modelling [
40].
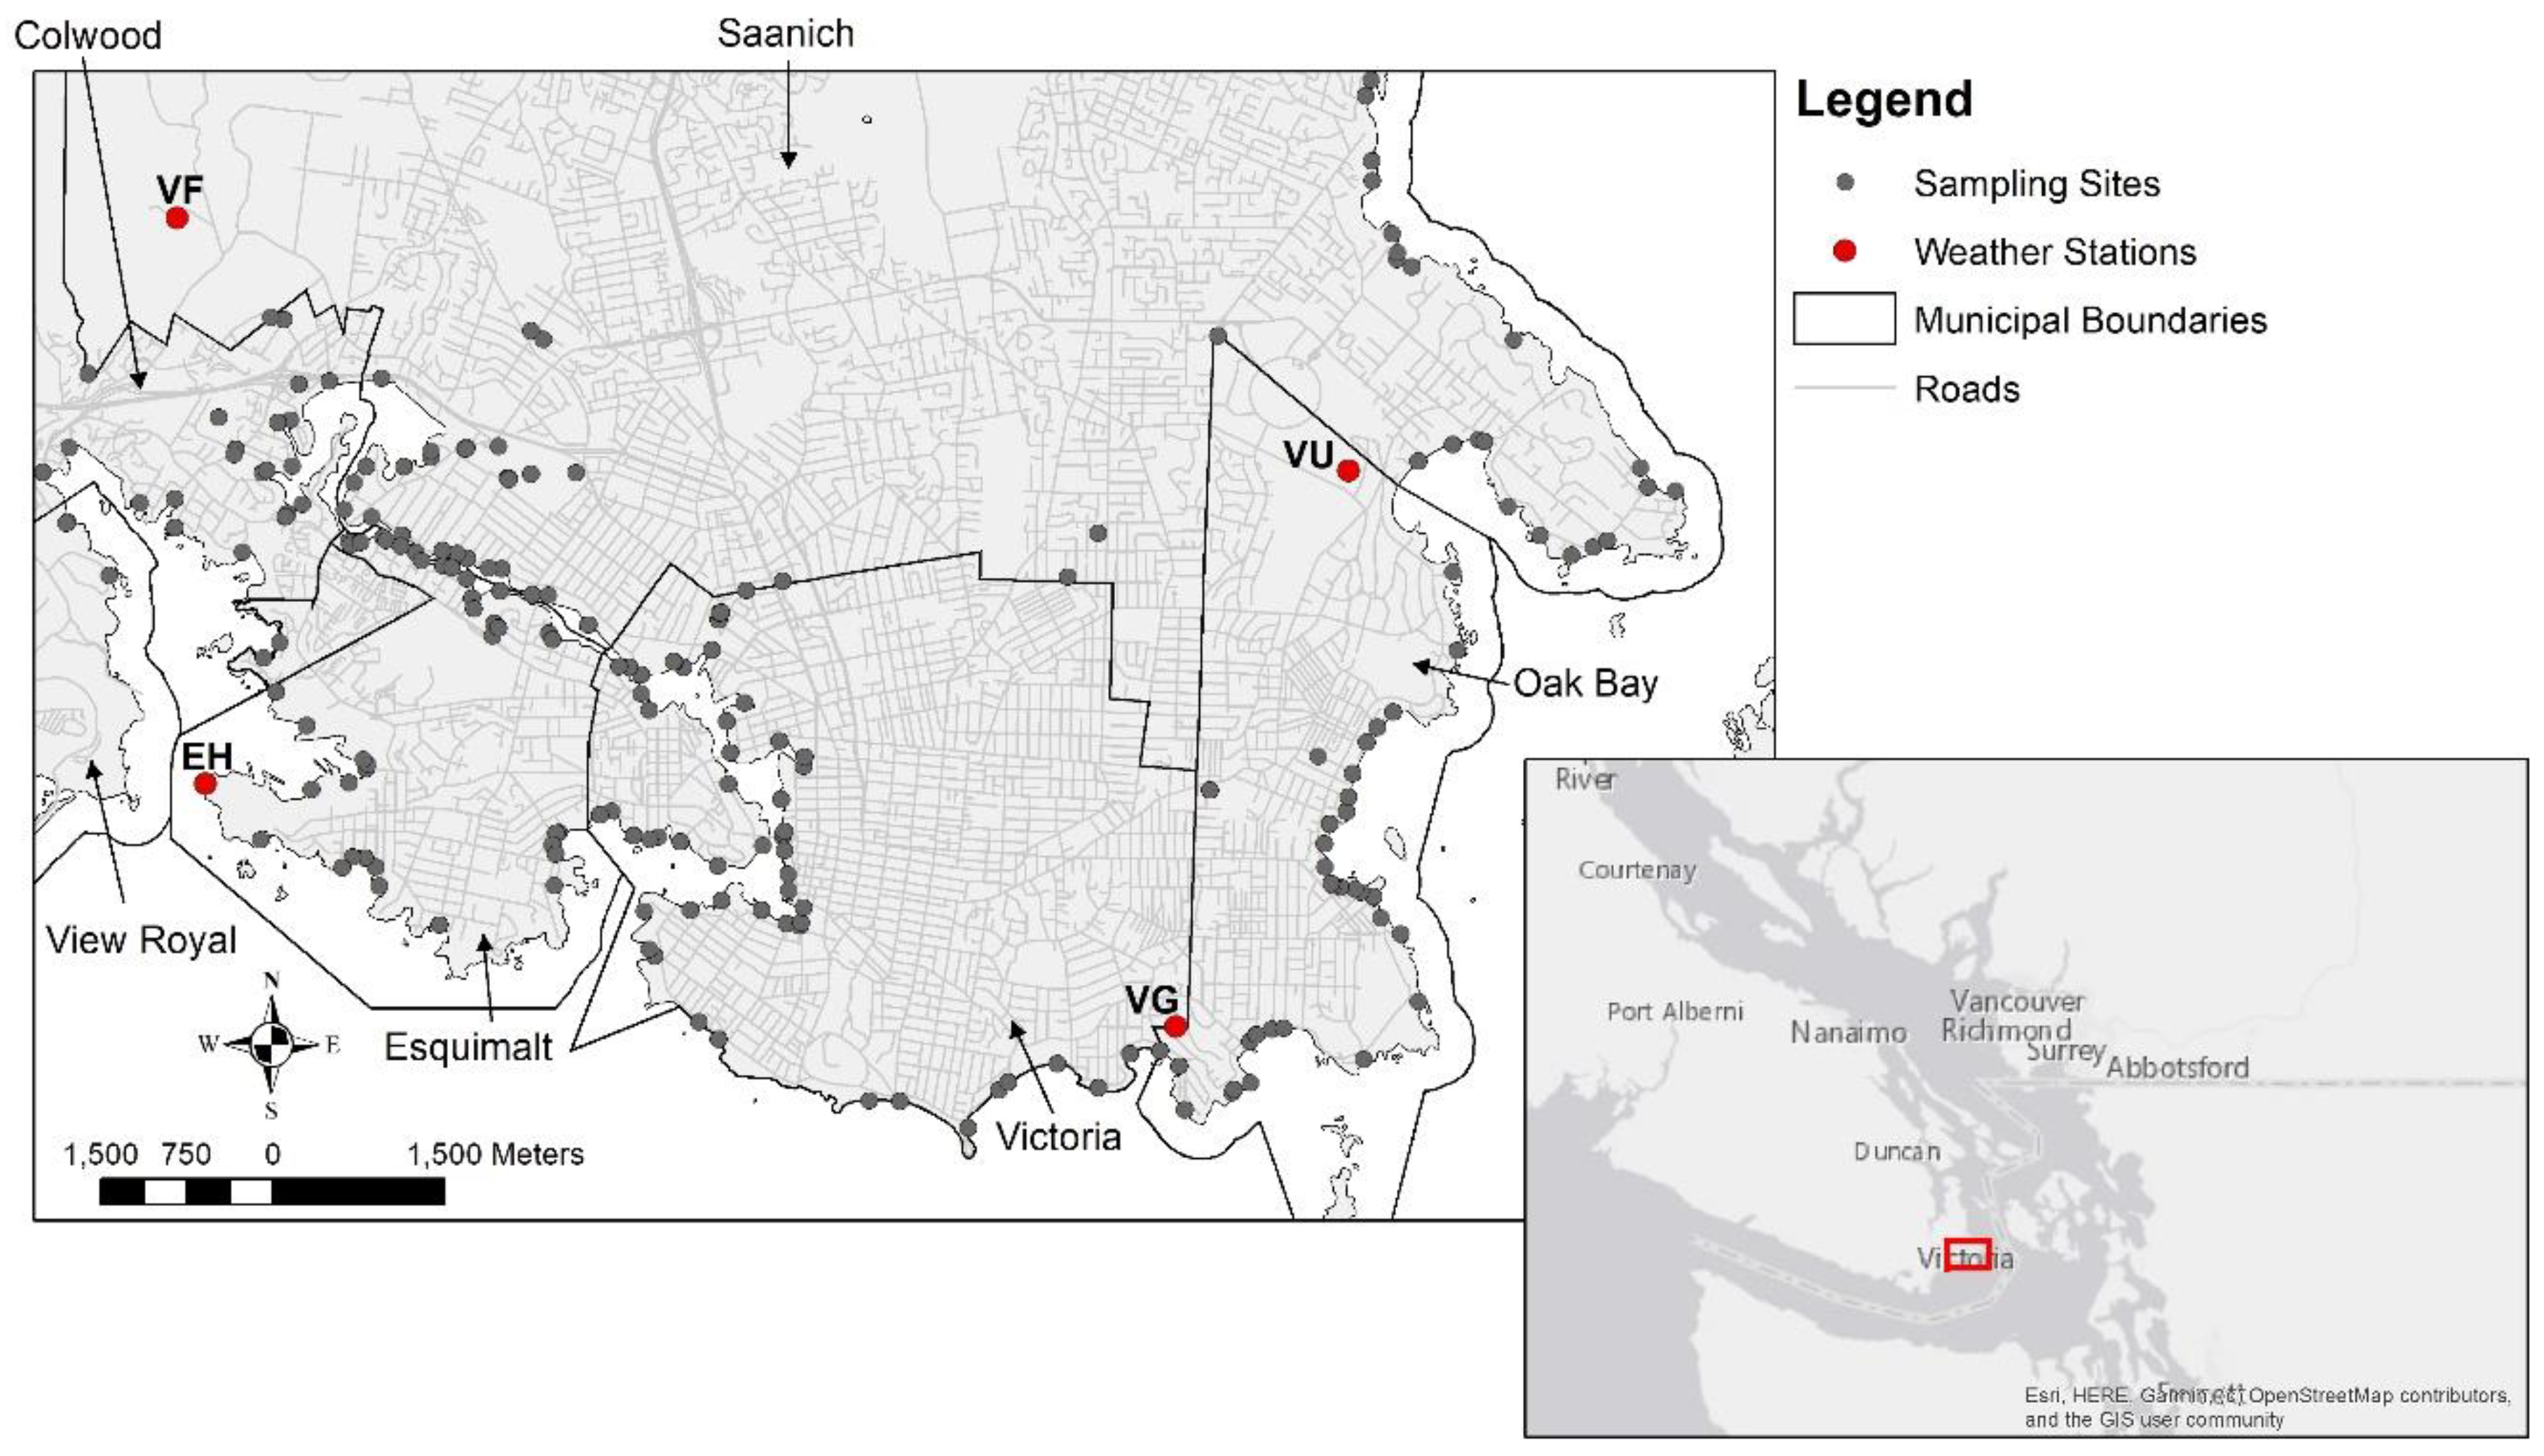
The Capital Regional District (CRD) of southern Vancouver Island is a government body representing 13 municipalities and three electoral areas. The core area of CRD has approximately 270,000 people and 27,600 hectares including residential, industrial, commercial, institutional and agriculture regions. The area has approximately 8350 properties with onsite sewage disposal and with others connected to a sewer system [
2]. The CRD assists these municipalities in developing their stormwater management plans and infrastructure, as well as water quality monitoring for these municipalities. Coastal water quality has been a critical issue worldwide for nearshore inhabited regions and the CRD is no exception. Coastal water quality is known to be affected by natural and human factors includes runoff, sewage wastewater, land reclamation and climate change [
41]. The implementation of monitoring programs is necessary and critical in managing coastal water contamination [
42,
43]. The CRD collects pollutant levels (including fecal coliforms) within stormwater pipes, streams and nearshore areas throughout the CRD, with an interest in identifying hotspots and remediating those areas of highest priority. This process includes collecting water samples and analyzing for fecal coliform bacteria in the sample. The collected data are used to estimate and analyze the distribution of microbial contamination and any possible public health concerns. This allows the jurisdictions involved to undertake remedial measures where most needed. Currently, the sampling frequency is regulated primarily by cost and capacity but increased sampling strategies are advised for locations exceeding a certain threshold. Given that fecal coliform contamination in stormwater runoff is directly influenced by climate and watershed properties [
10,
13,
44], a regular sampling scheme that does not consider climate and weather will likely miss peaks in contamination.
The literature shows some consensus on the impact of land use on bacteria levels but the influence of climate variables remains contentious, particularly where the study focuses on stormwater runoff generation. Much of what is observed is likely due to site specificity and the scale of the sampling and analysis [
40,
45]. If agricultural areas are absent from the drainage area, bacteria loads in stormwater runoff generation are believed to be low and are thus, highly affected by sampling plans, which tend to be sparse and intermittent. Thus, stormwater specific data sets tend to be limited in terms of sampling period, length of database in time and extent over space, and therefore, the insight they can provide on environmental influences is limited. This often drives researchers to turn to data-driven methods [
23,
24,
38,
39,
46,
47] to provide insight but these methods are not unaffected by the temporal and spatial scale of the sampling and analysis.
Given the extensive monitoring network developed by the CRD, the objectives of this work are to determine if the fecal coliform data collected by the CRD during its regular monitoring program are influenced by local weather and land use; what insights arise from the scale of the collection and variable (fecal coliforms in this research) studied, and in particular, whether data-driven methods are able to provide insights into the causal mechanisms behind the observations. With the outcomes, the monitoring program can be modified to improve sampling statistics and possibly indicate the impacts of climate change on bacterial loads in the future.
4. Conclusions
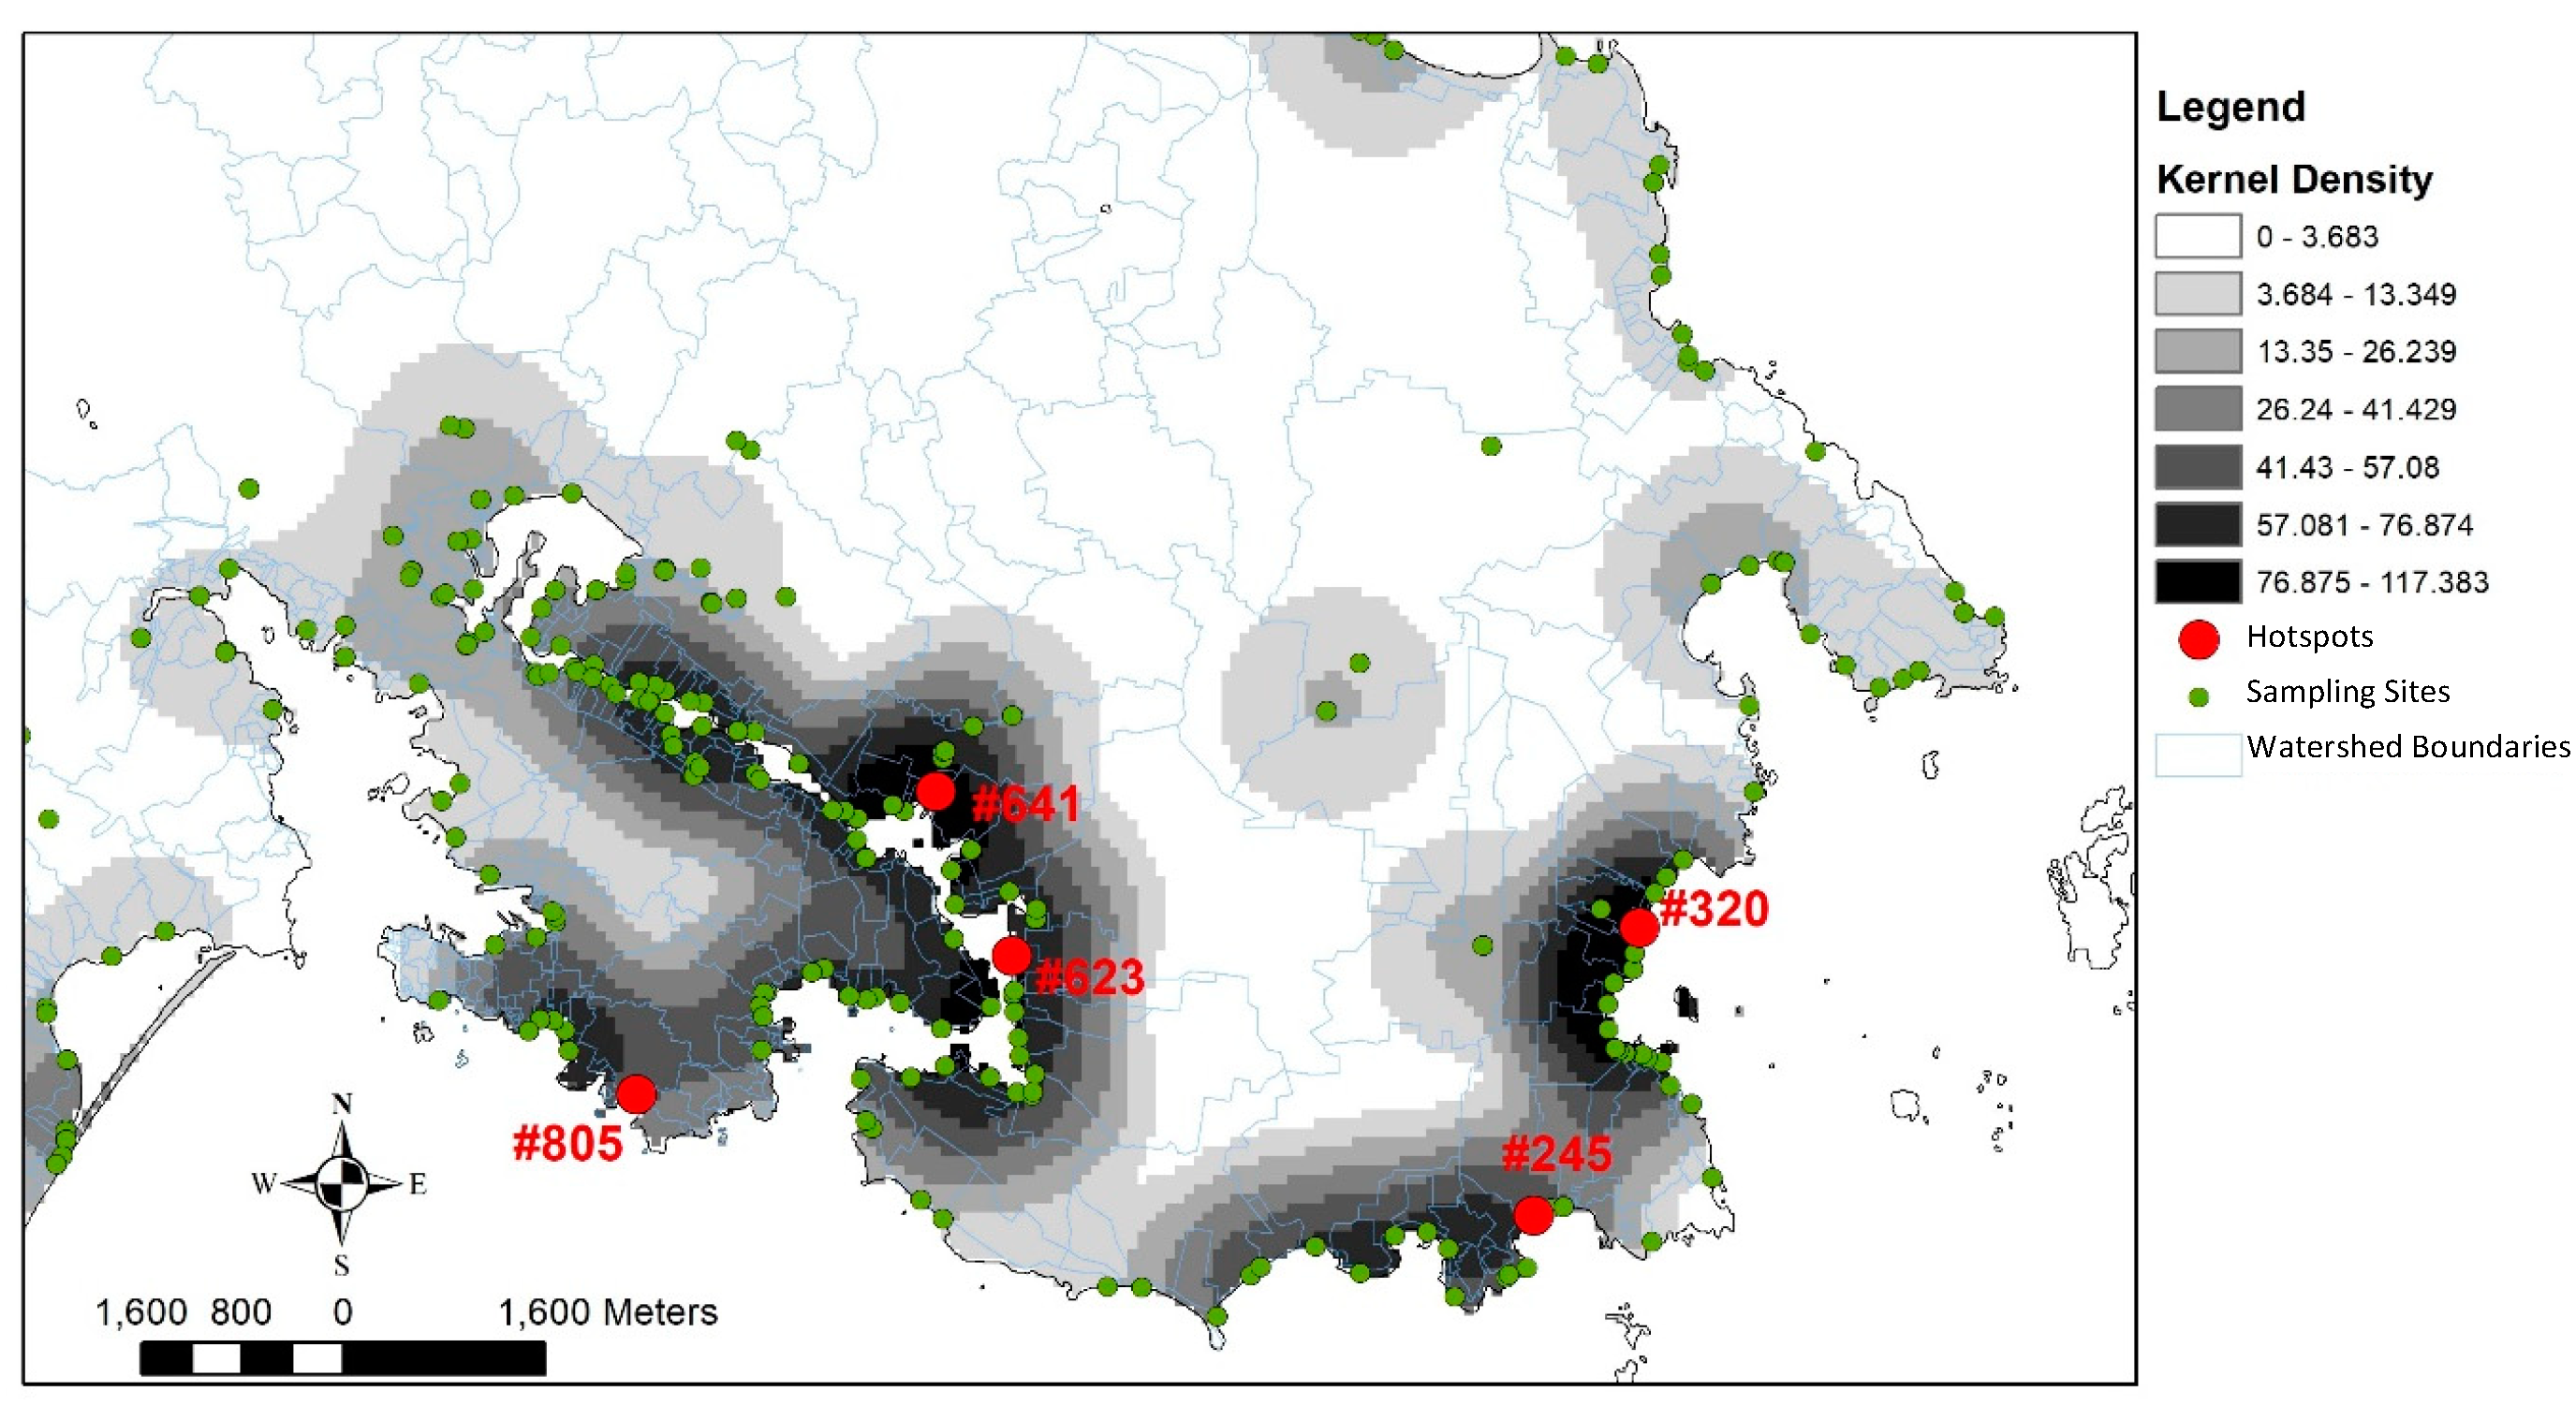
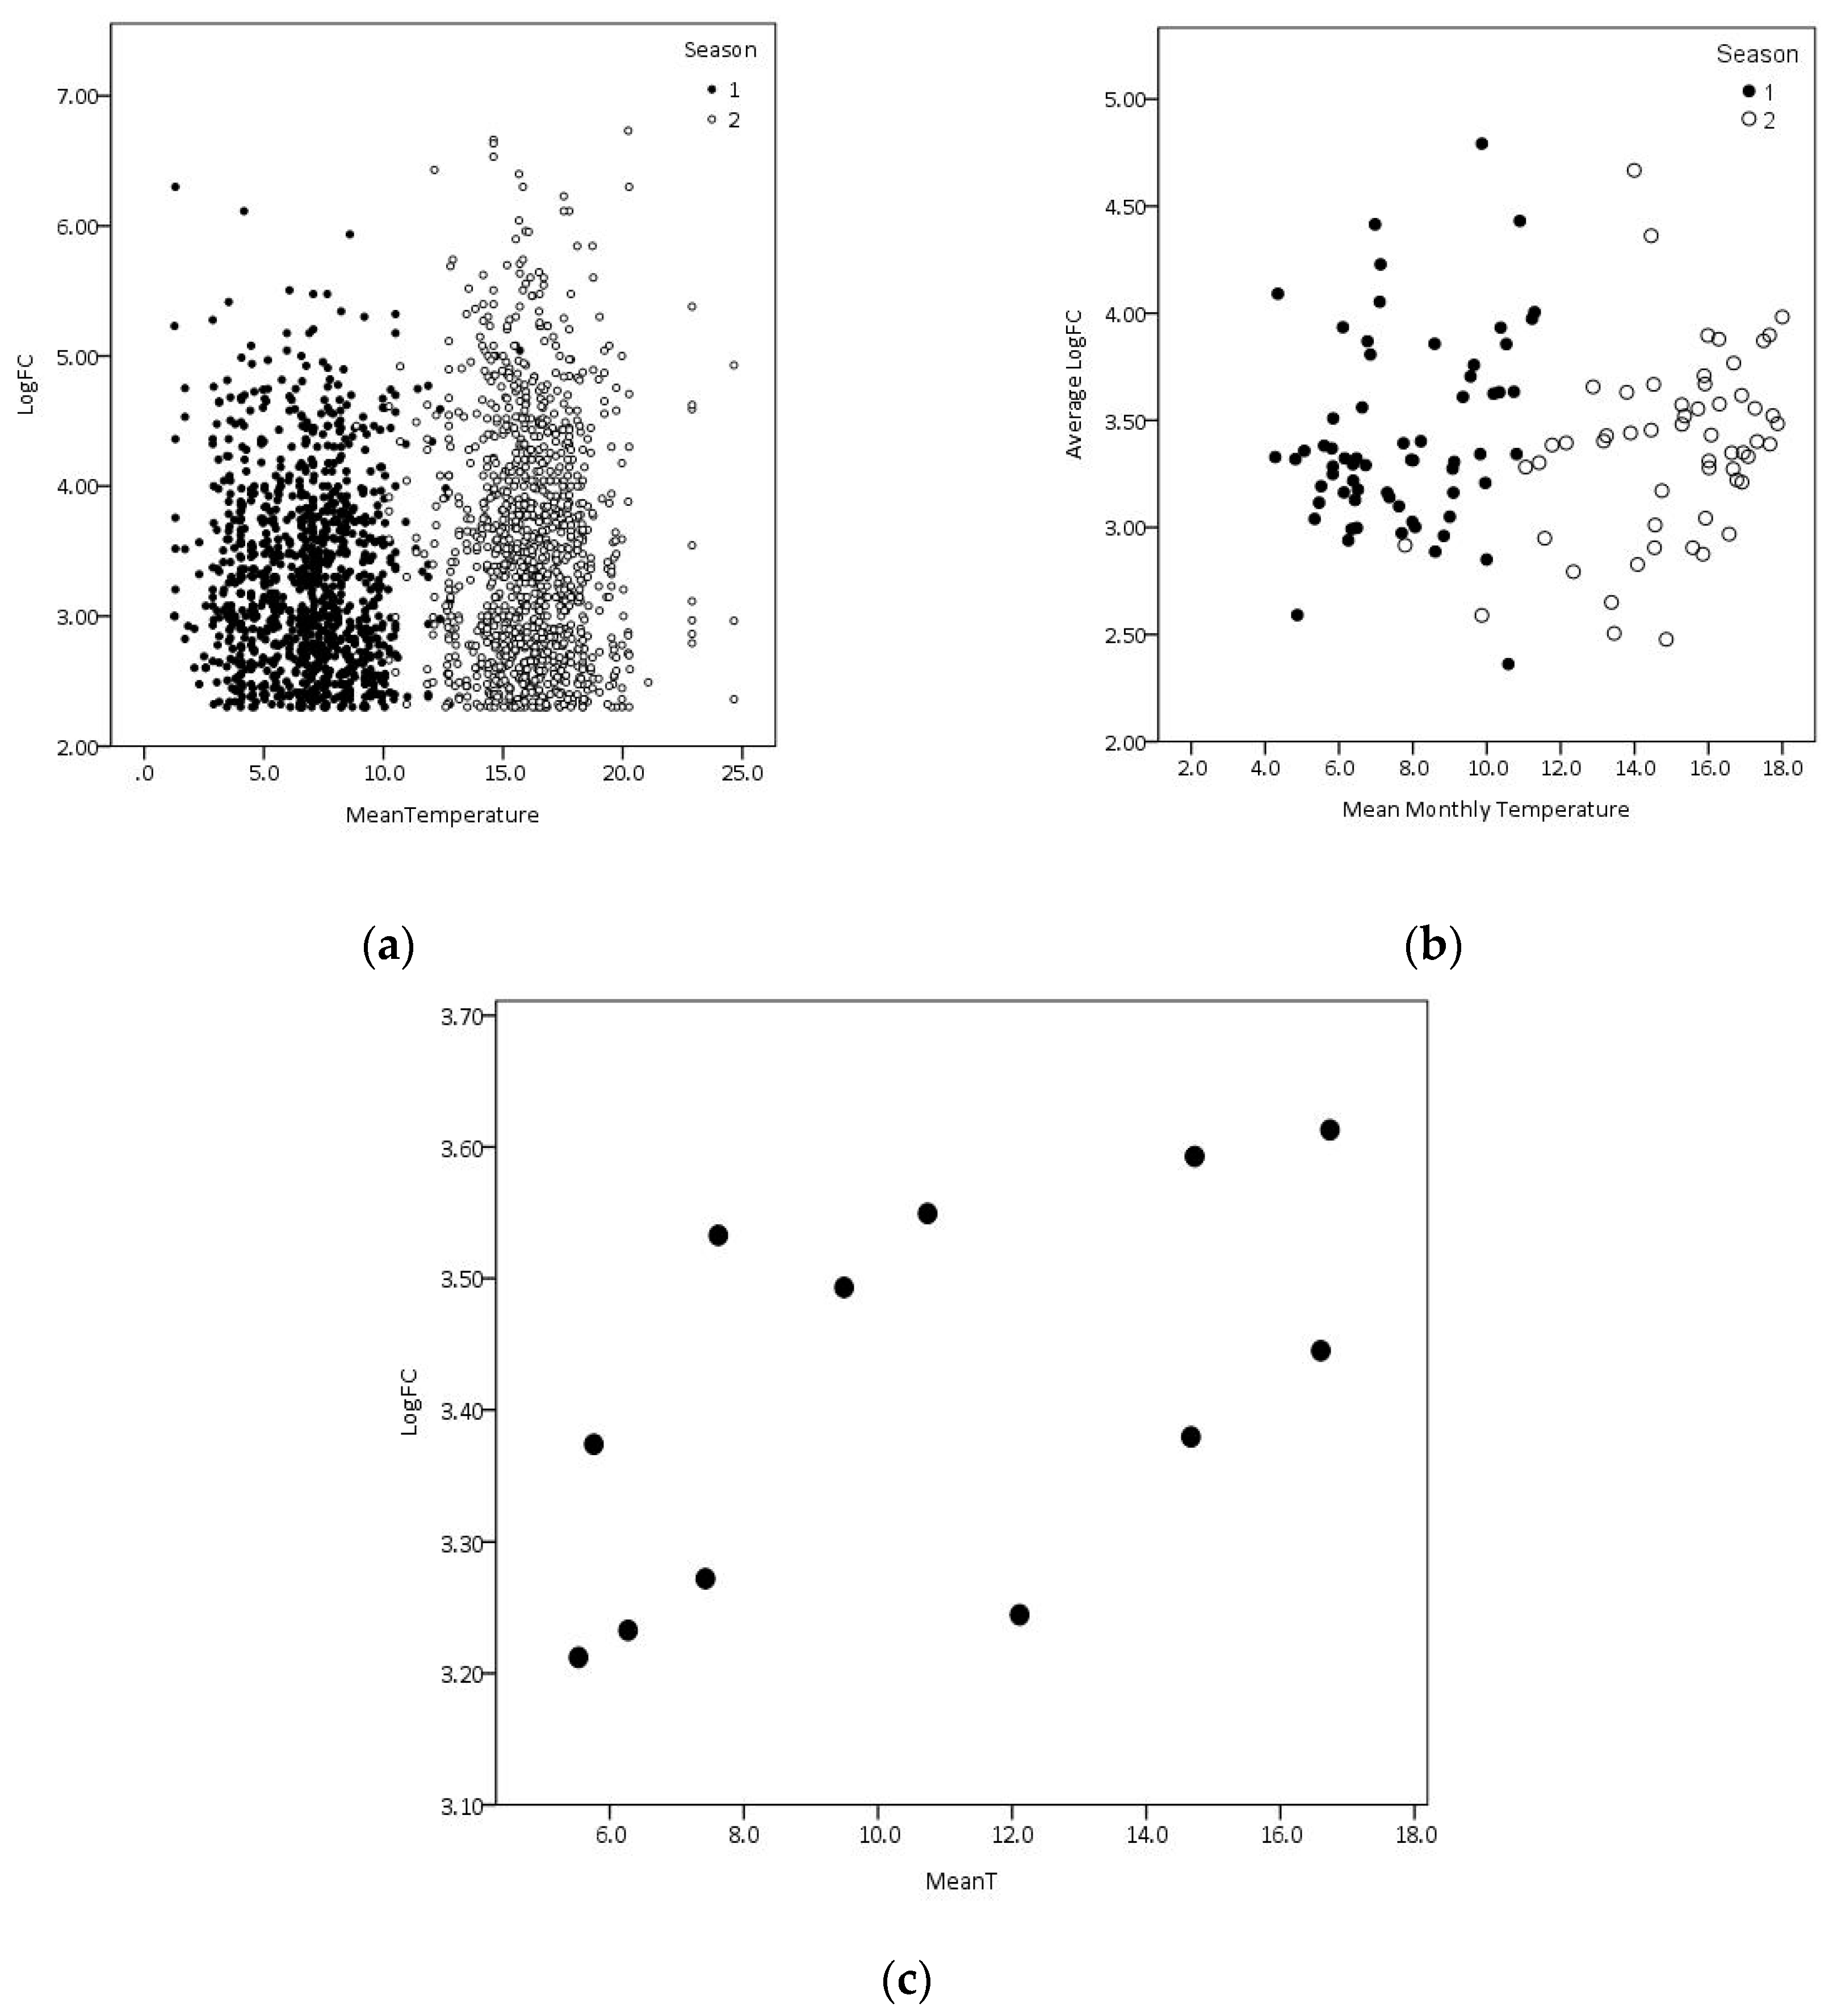
This study provides insight into the temporal and spatial distribution of bacterial contamination in nearshore areas of southern Vancouver Island and explains the potential relationships in fecal coliform levels in stormwater with land-use and climate variables. Non-parametric correlation analysis, Fourier analysis, multiple linear regression and multivariate logistic regression were used to determine the significance and relative influence of climatic variables on LogFC levels measured between 1995 and 2011 at three temporal scales: at the time of sampling, the monthly average of LogFC across all stations in the region, and the average across space and time for each month.
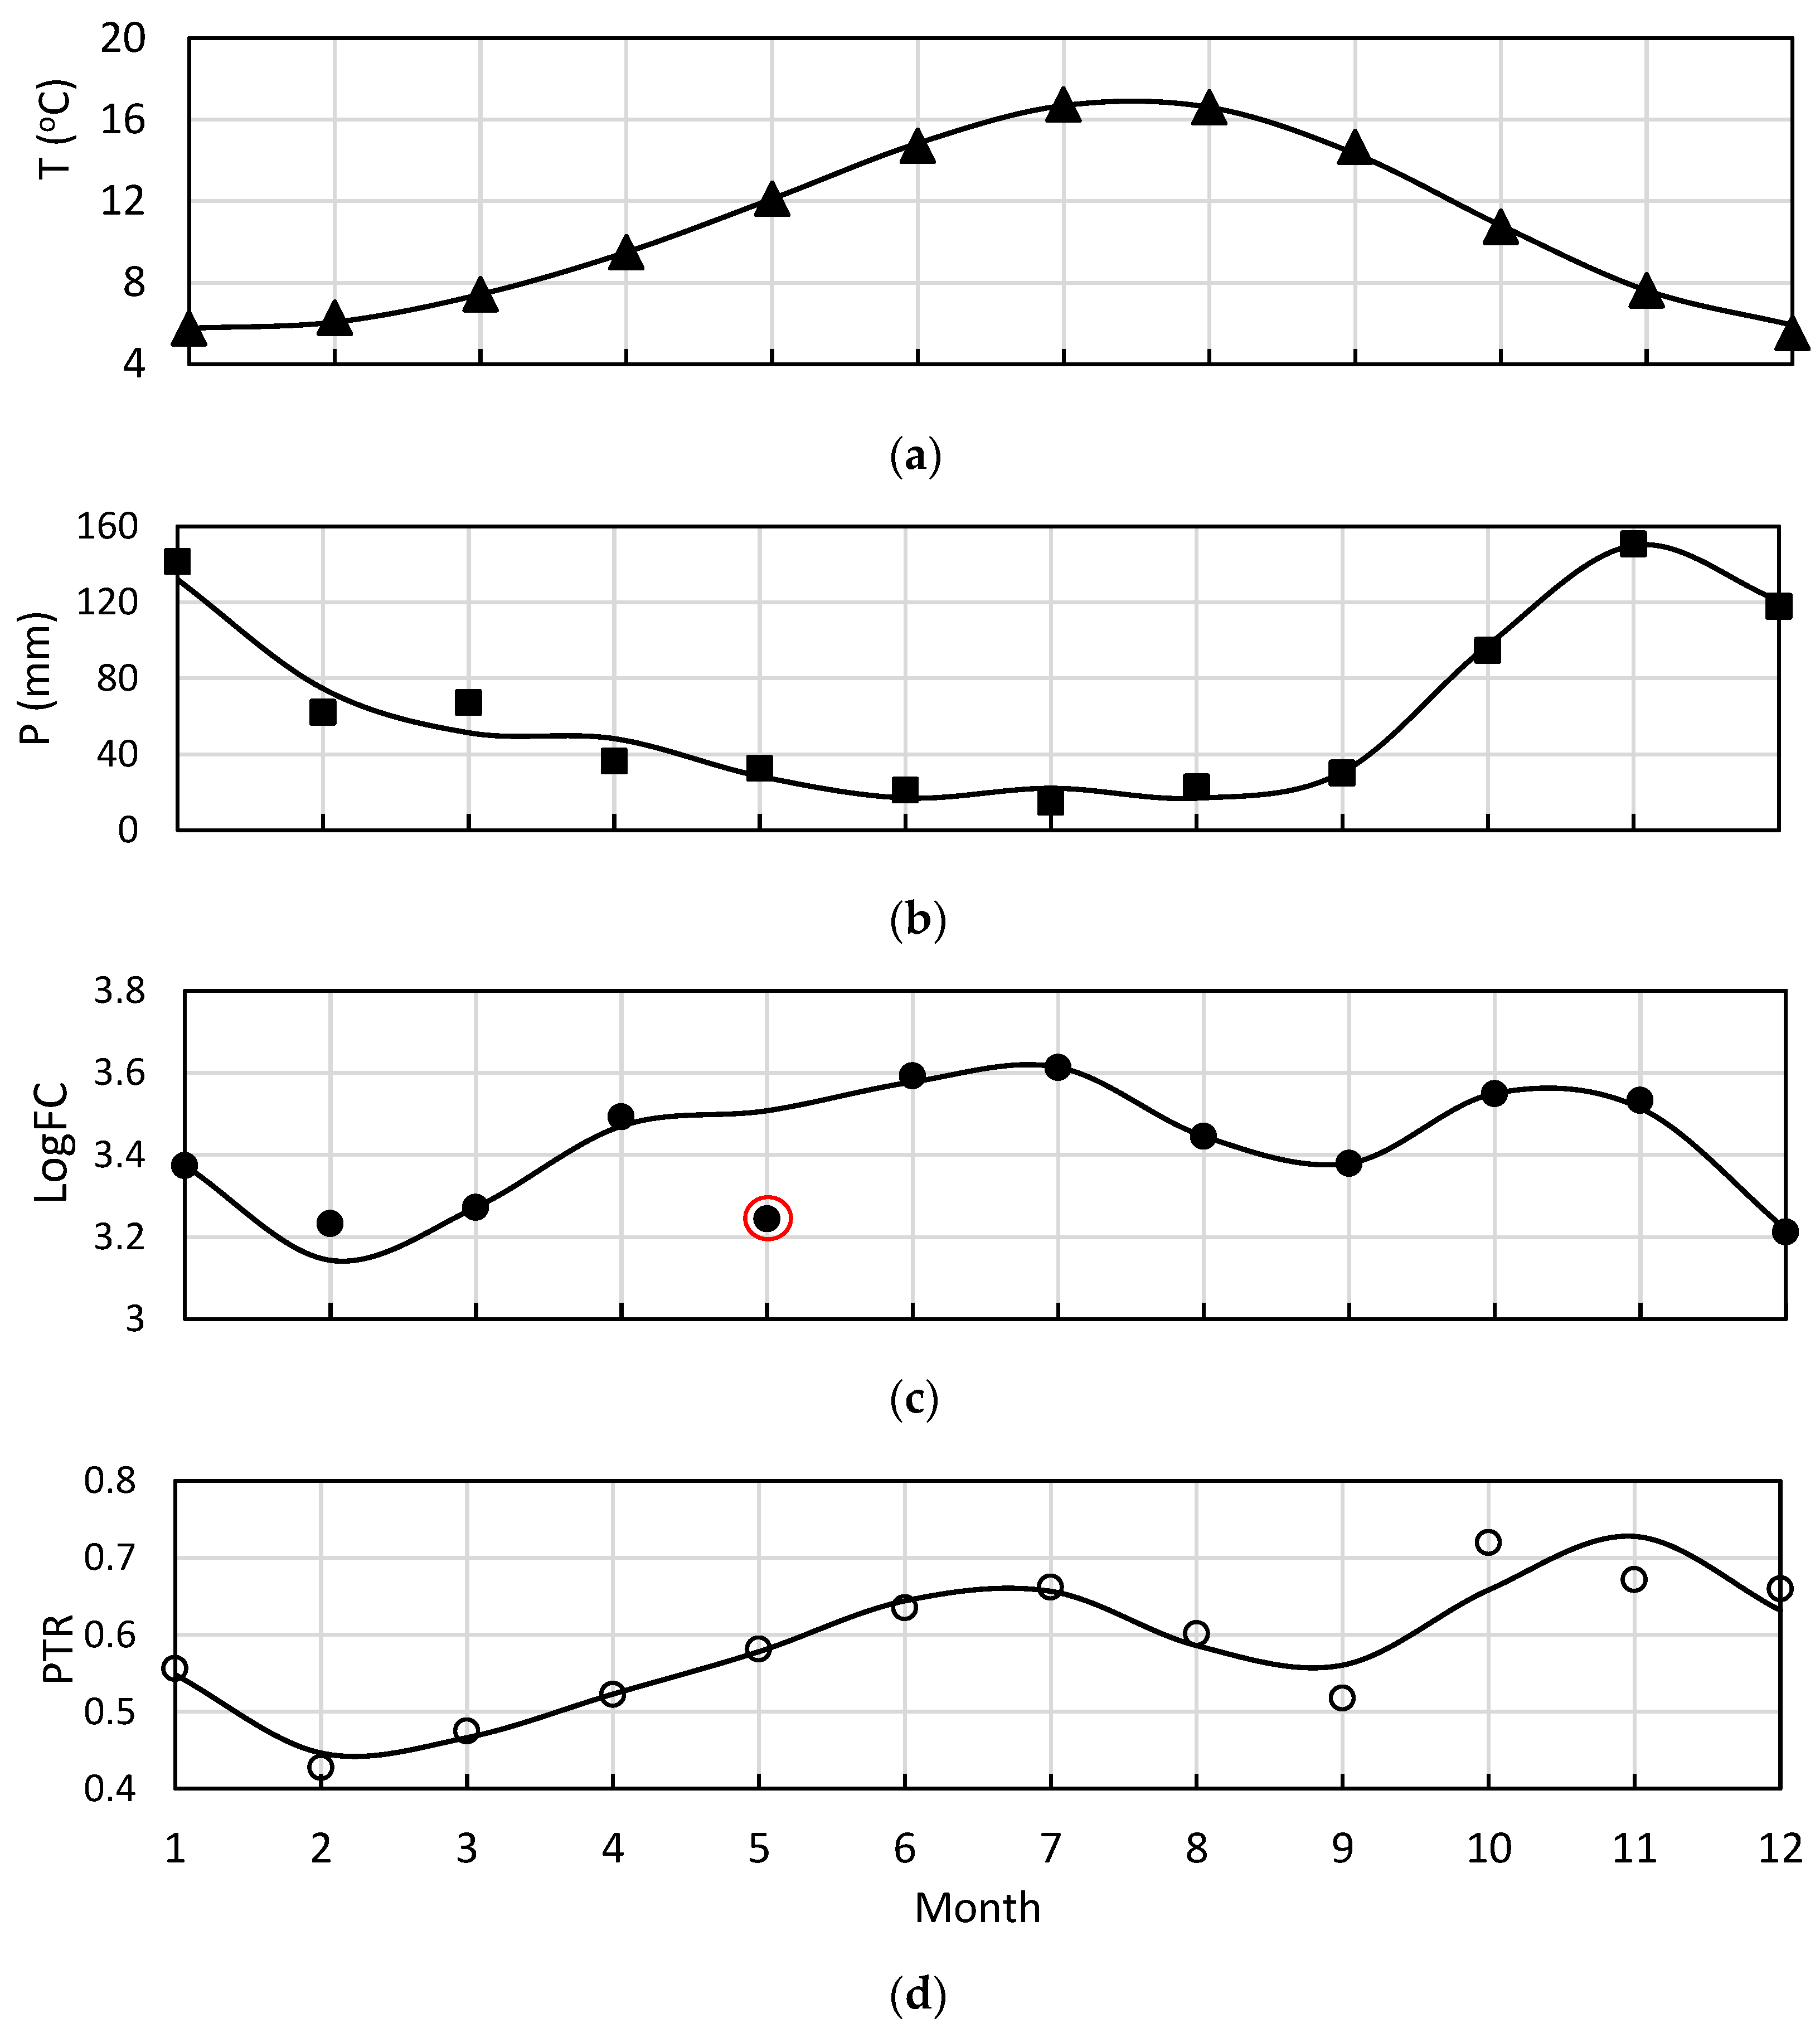
The Fourier model demonstrates an annual periodicity of fecal coliform with two peaks in July and October. Despite the extreme values observed in the 17 years’ historical data, the data follow the general trend of this periodicity as do the precipitation and temperature. No matter the temporal scale used, the Fourier analysis always produced a periodicity of 12 months.
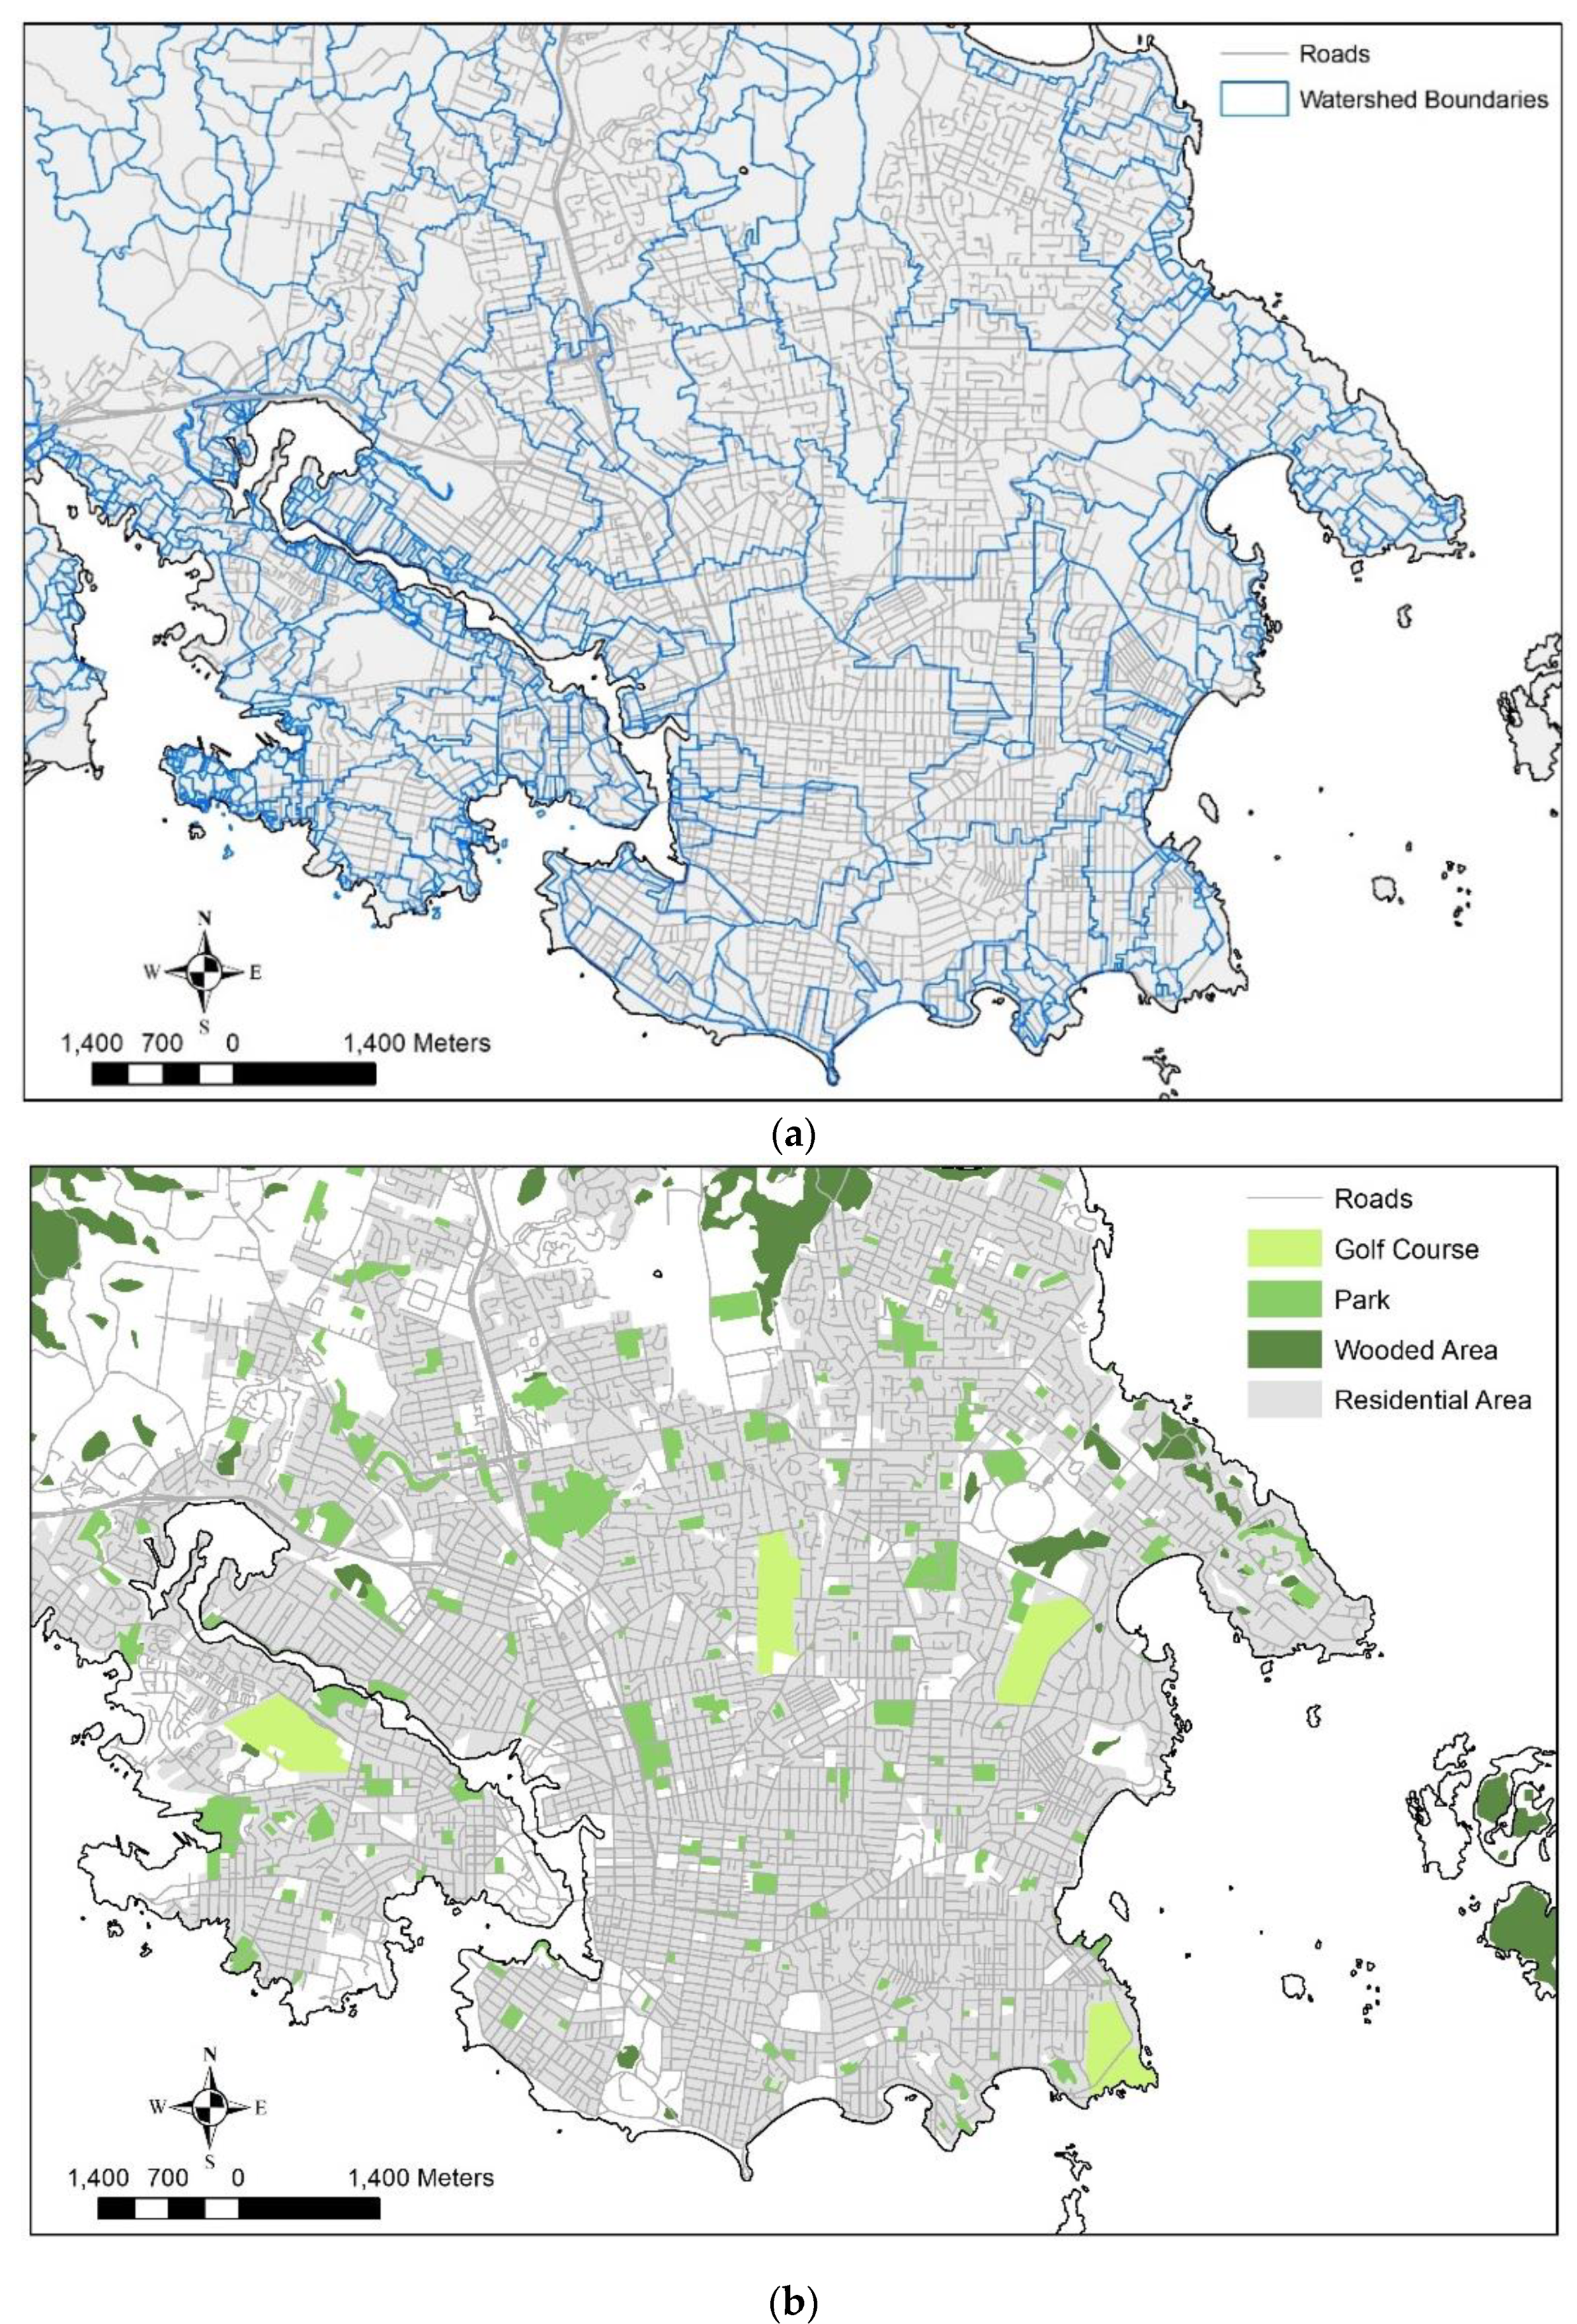
The correlation analysis showed that fecal coliform concentrations for all stations throughout the period have a significant correlation with many climatic variables including positive correlations with temperature, antecedent dry period and land use in the watershed, and negative correlations with precipitation and flowrate. Drainage area showed no significant correlations with bacterial contamination. But drainage area, amount of residential area in the drainage area as well as green space were all positively correlated with FC levels but only the amount of residential, or urban area, was significantly correlated. This suggests that the bacteria loading mostly originates from residential activity. The incredible variability in whether relationships were significant or not suggest that modelling or planning should be done on a location basis and not necessarily averaged across the region. Seasonal effects were also apparent and planning and prediction should be conducted differently in the two seasons. In particular, the drier, hotter season had higher levels of FC and therefore, should be the focus of future planning.
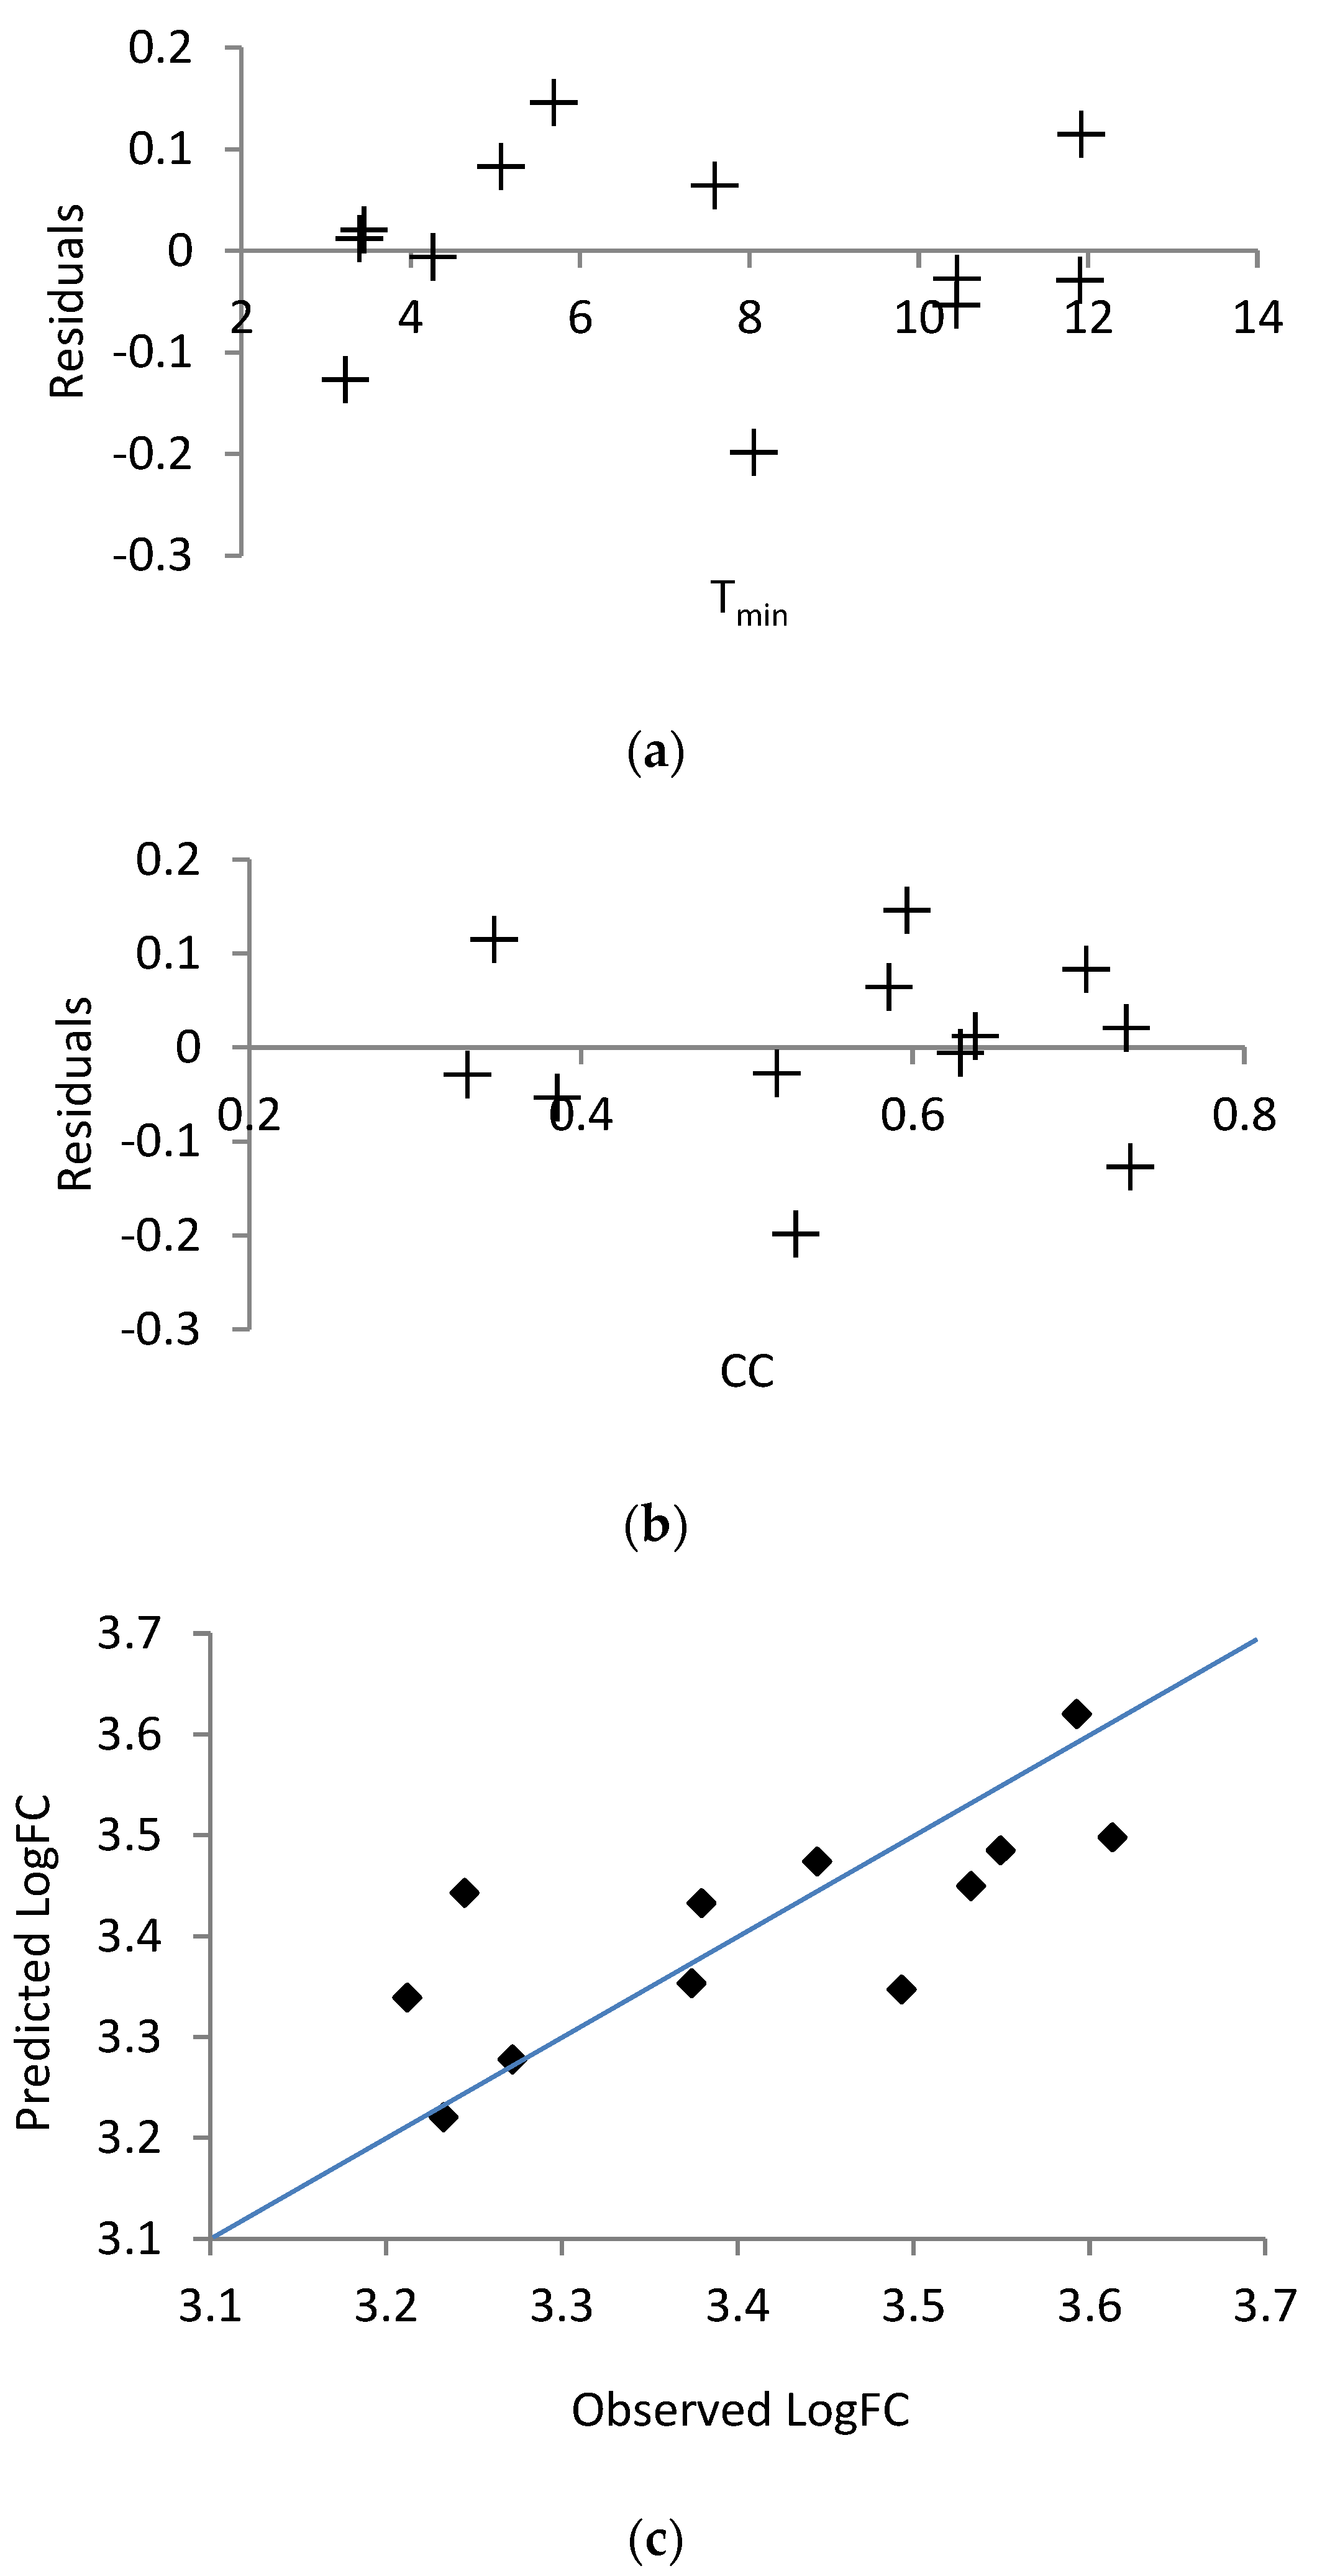
Linear regression developed a prediction model for LogFC in each month with a low adjusted R2 of under 0.5, but with significant or marginally significant variables of minimum monthly temperature and cloud cover. Multivariate logistic regression was used with classes representing the order of magnitude of LogFC. This type of regression showed very good model performance, which improved when considering the wet season separately from the dry season, and when looking at a individual months.
The authors recommend that when examining the influences of climate change on fecal coliforms, and possibly, on other types of bacterial contaminants in this region, that variables be distinguished by season, and possibly by month, as well as by location. In addition, the authors recommend that the CRD monitor FC more intensively at every month of the year, and in the fall season that includes October. The analysis should be updated whenever new data are made available. Since the land use was only represented by only two different types of land use (residential versus greenspace), the study should be expanded to other areas of the region that include forested and agricultural lands. The MLR model could be easily applied on the updated and expanded datasets.


