Assessment of Changes in Annual Maximum Precipitations in the Iberian Peninsula under Climate Change


Abstract
:1. Introduction
2. Materials and Methods
2.1. Base Data
2.2. Methodology
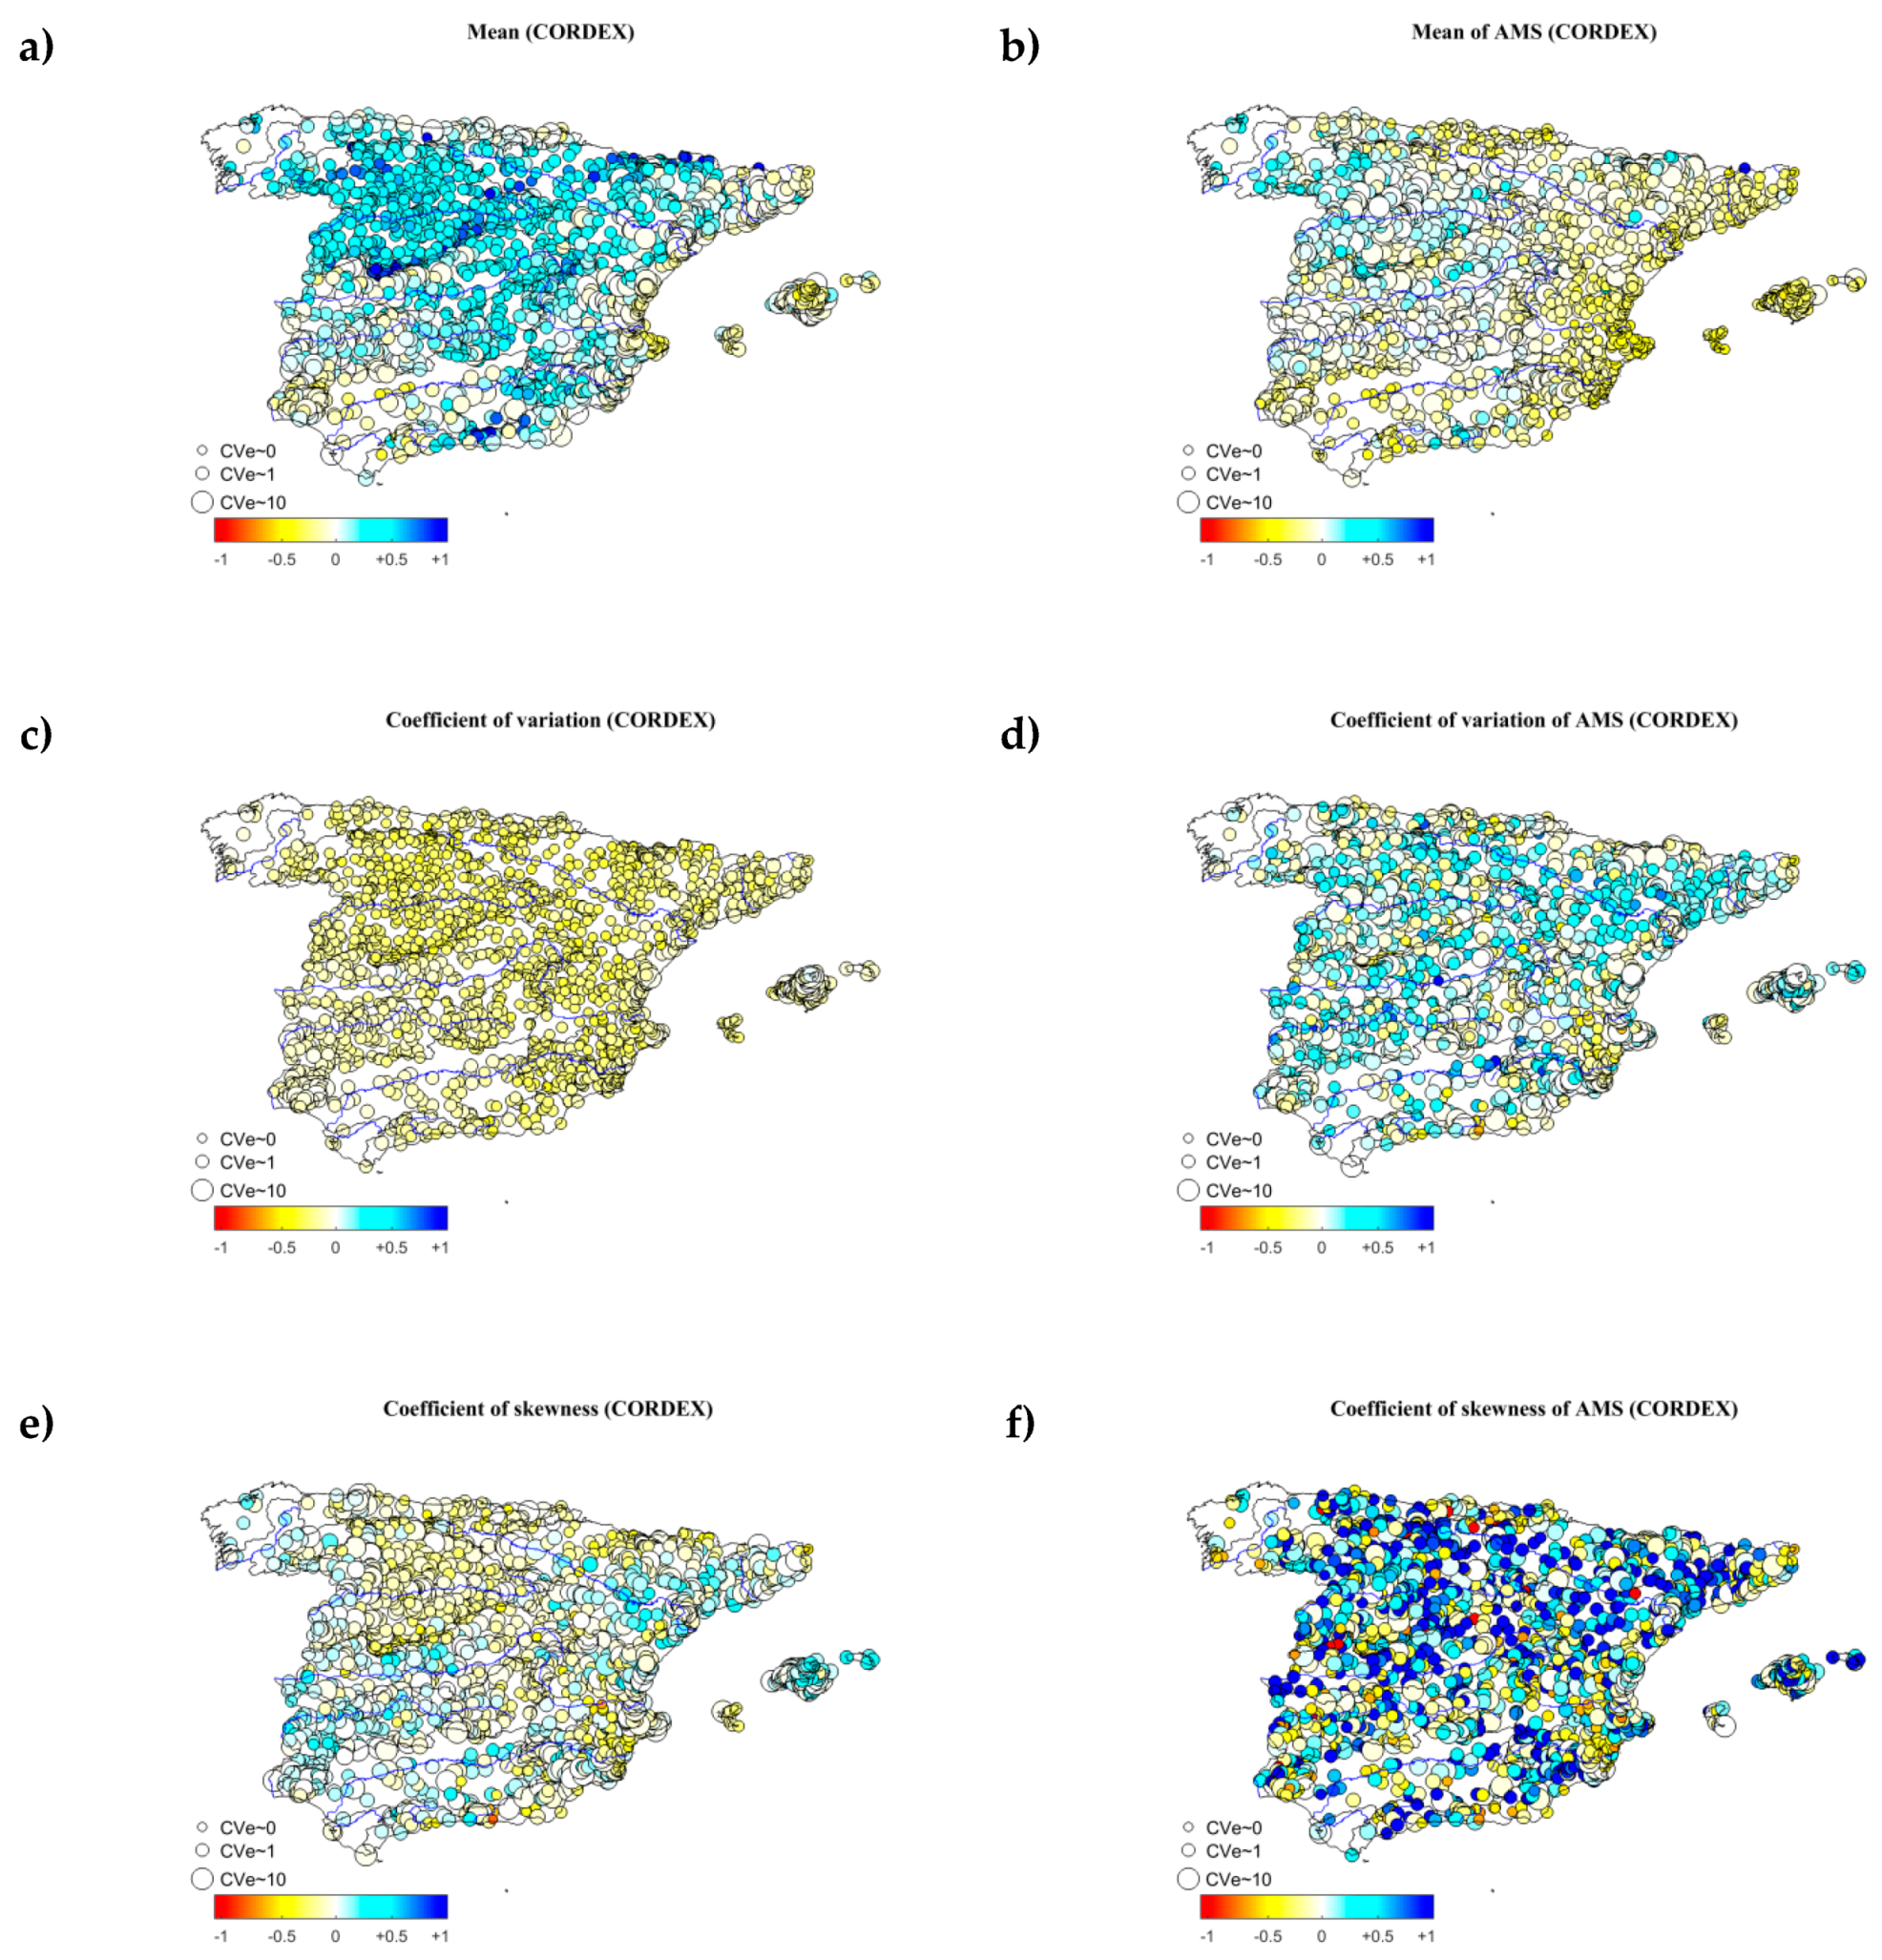
2.2.1. Comparison between Climate Model Simulations in the Control Period and Observations
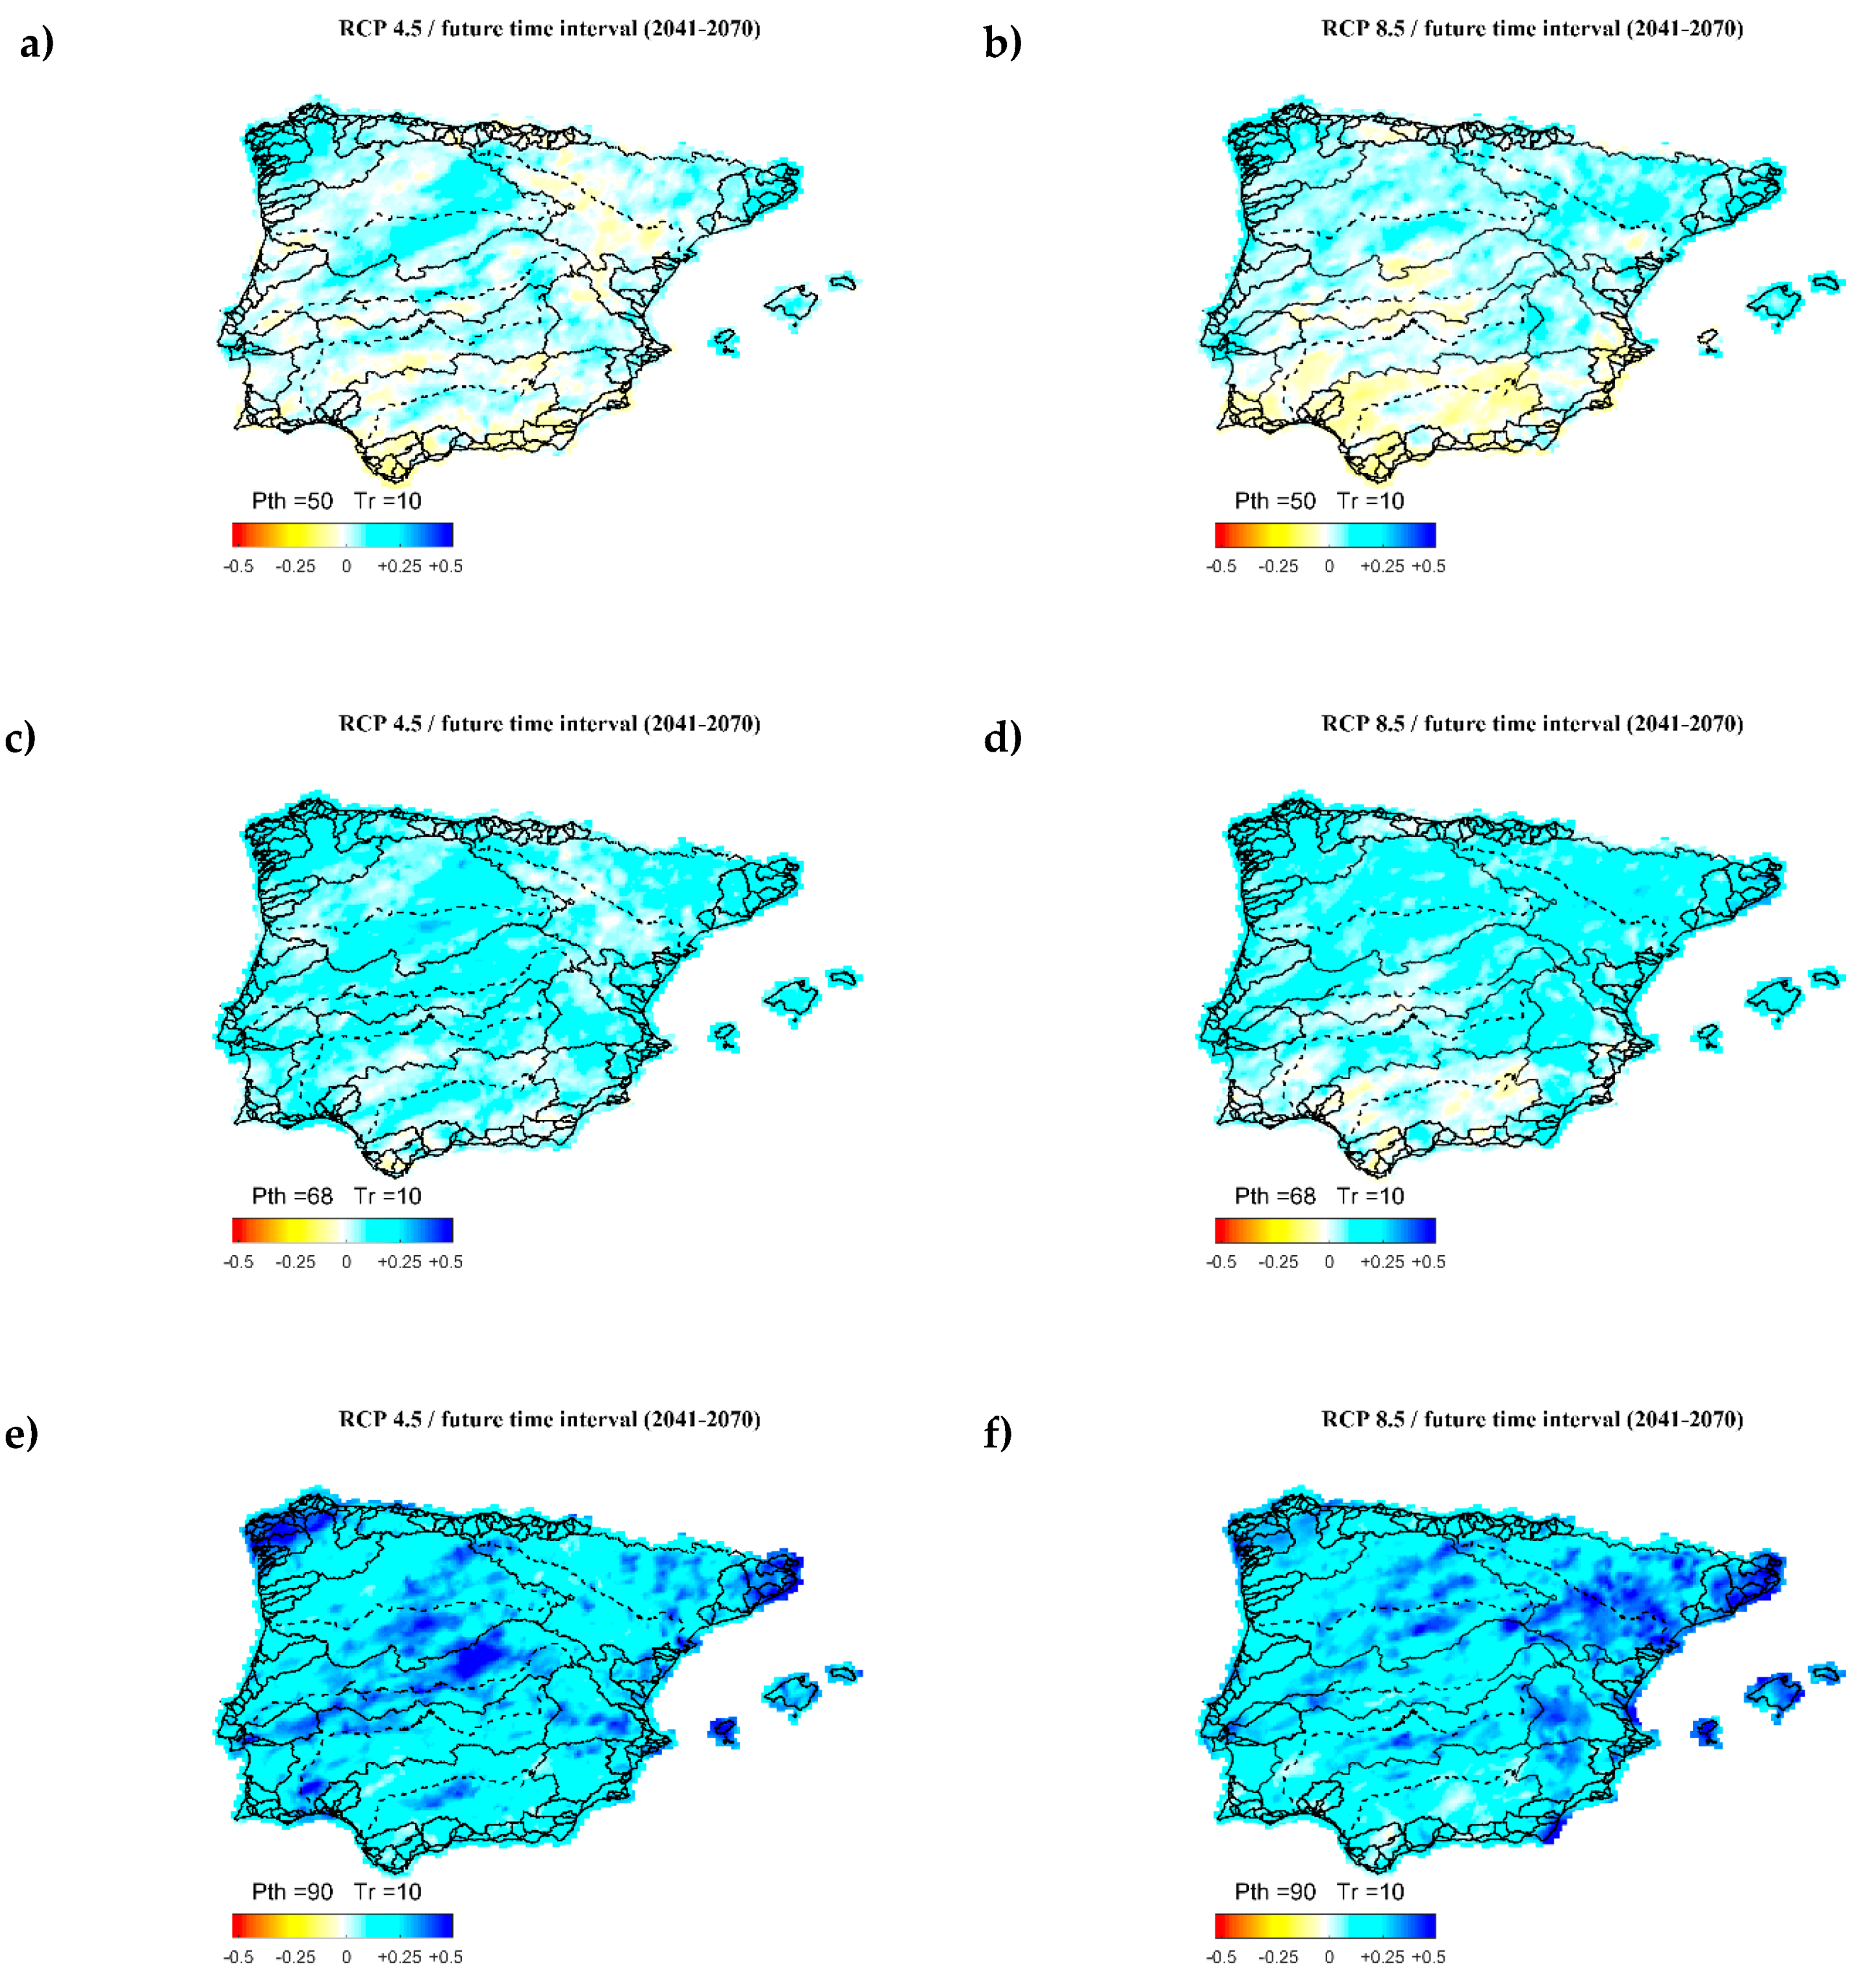
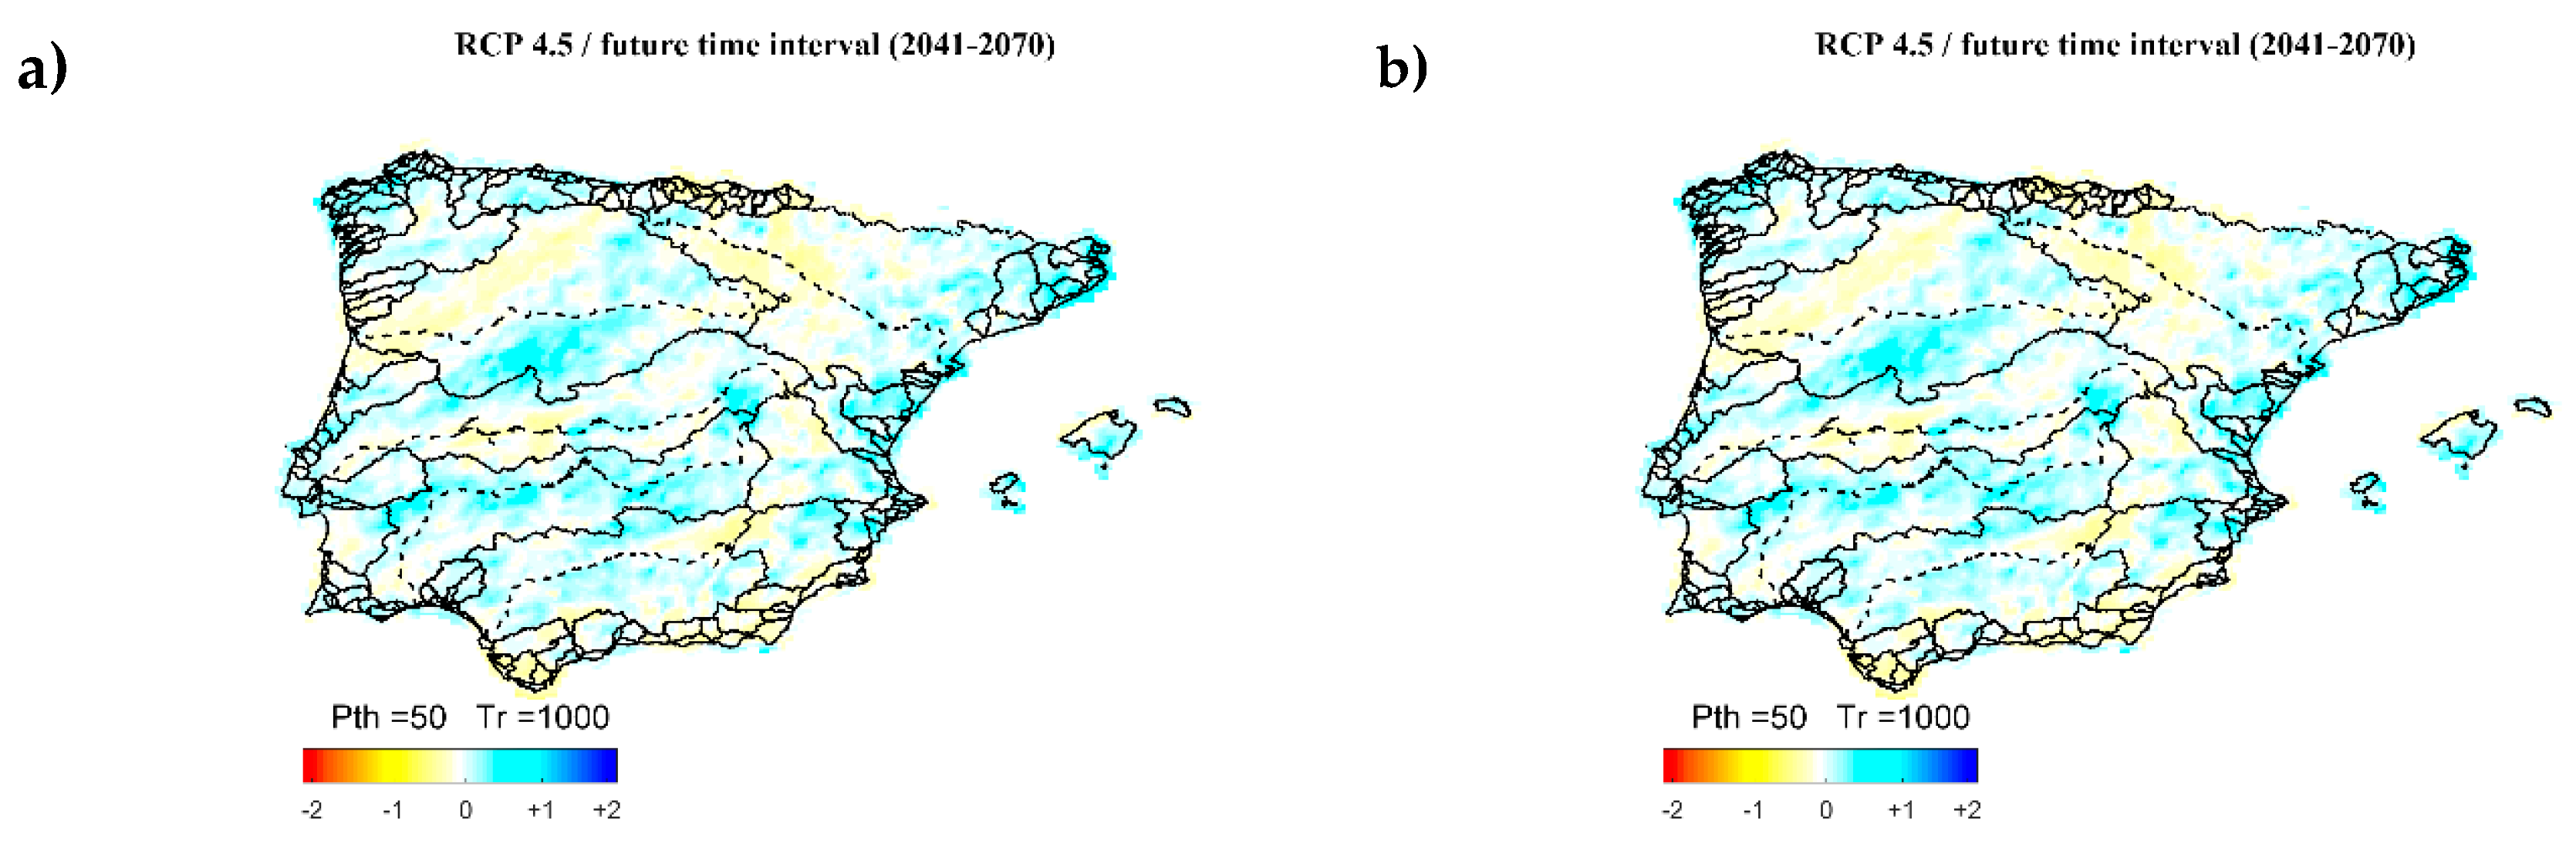
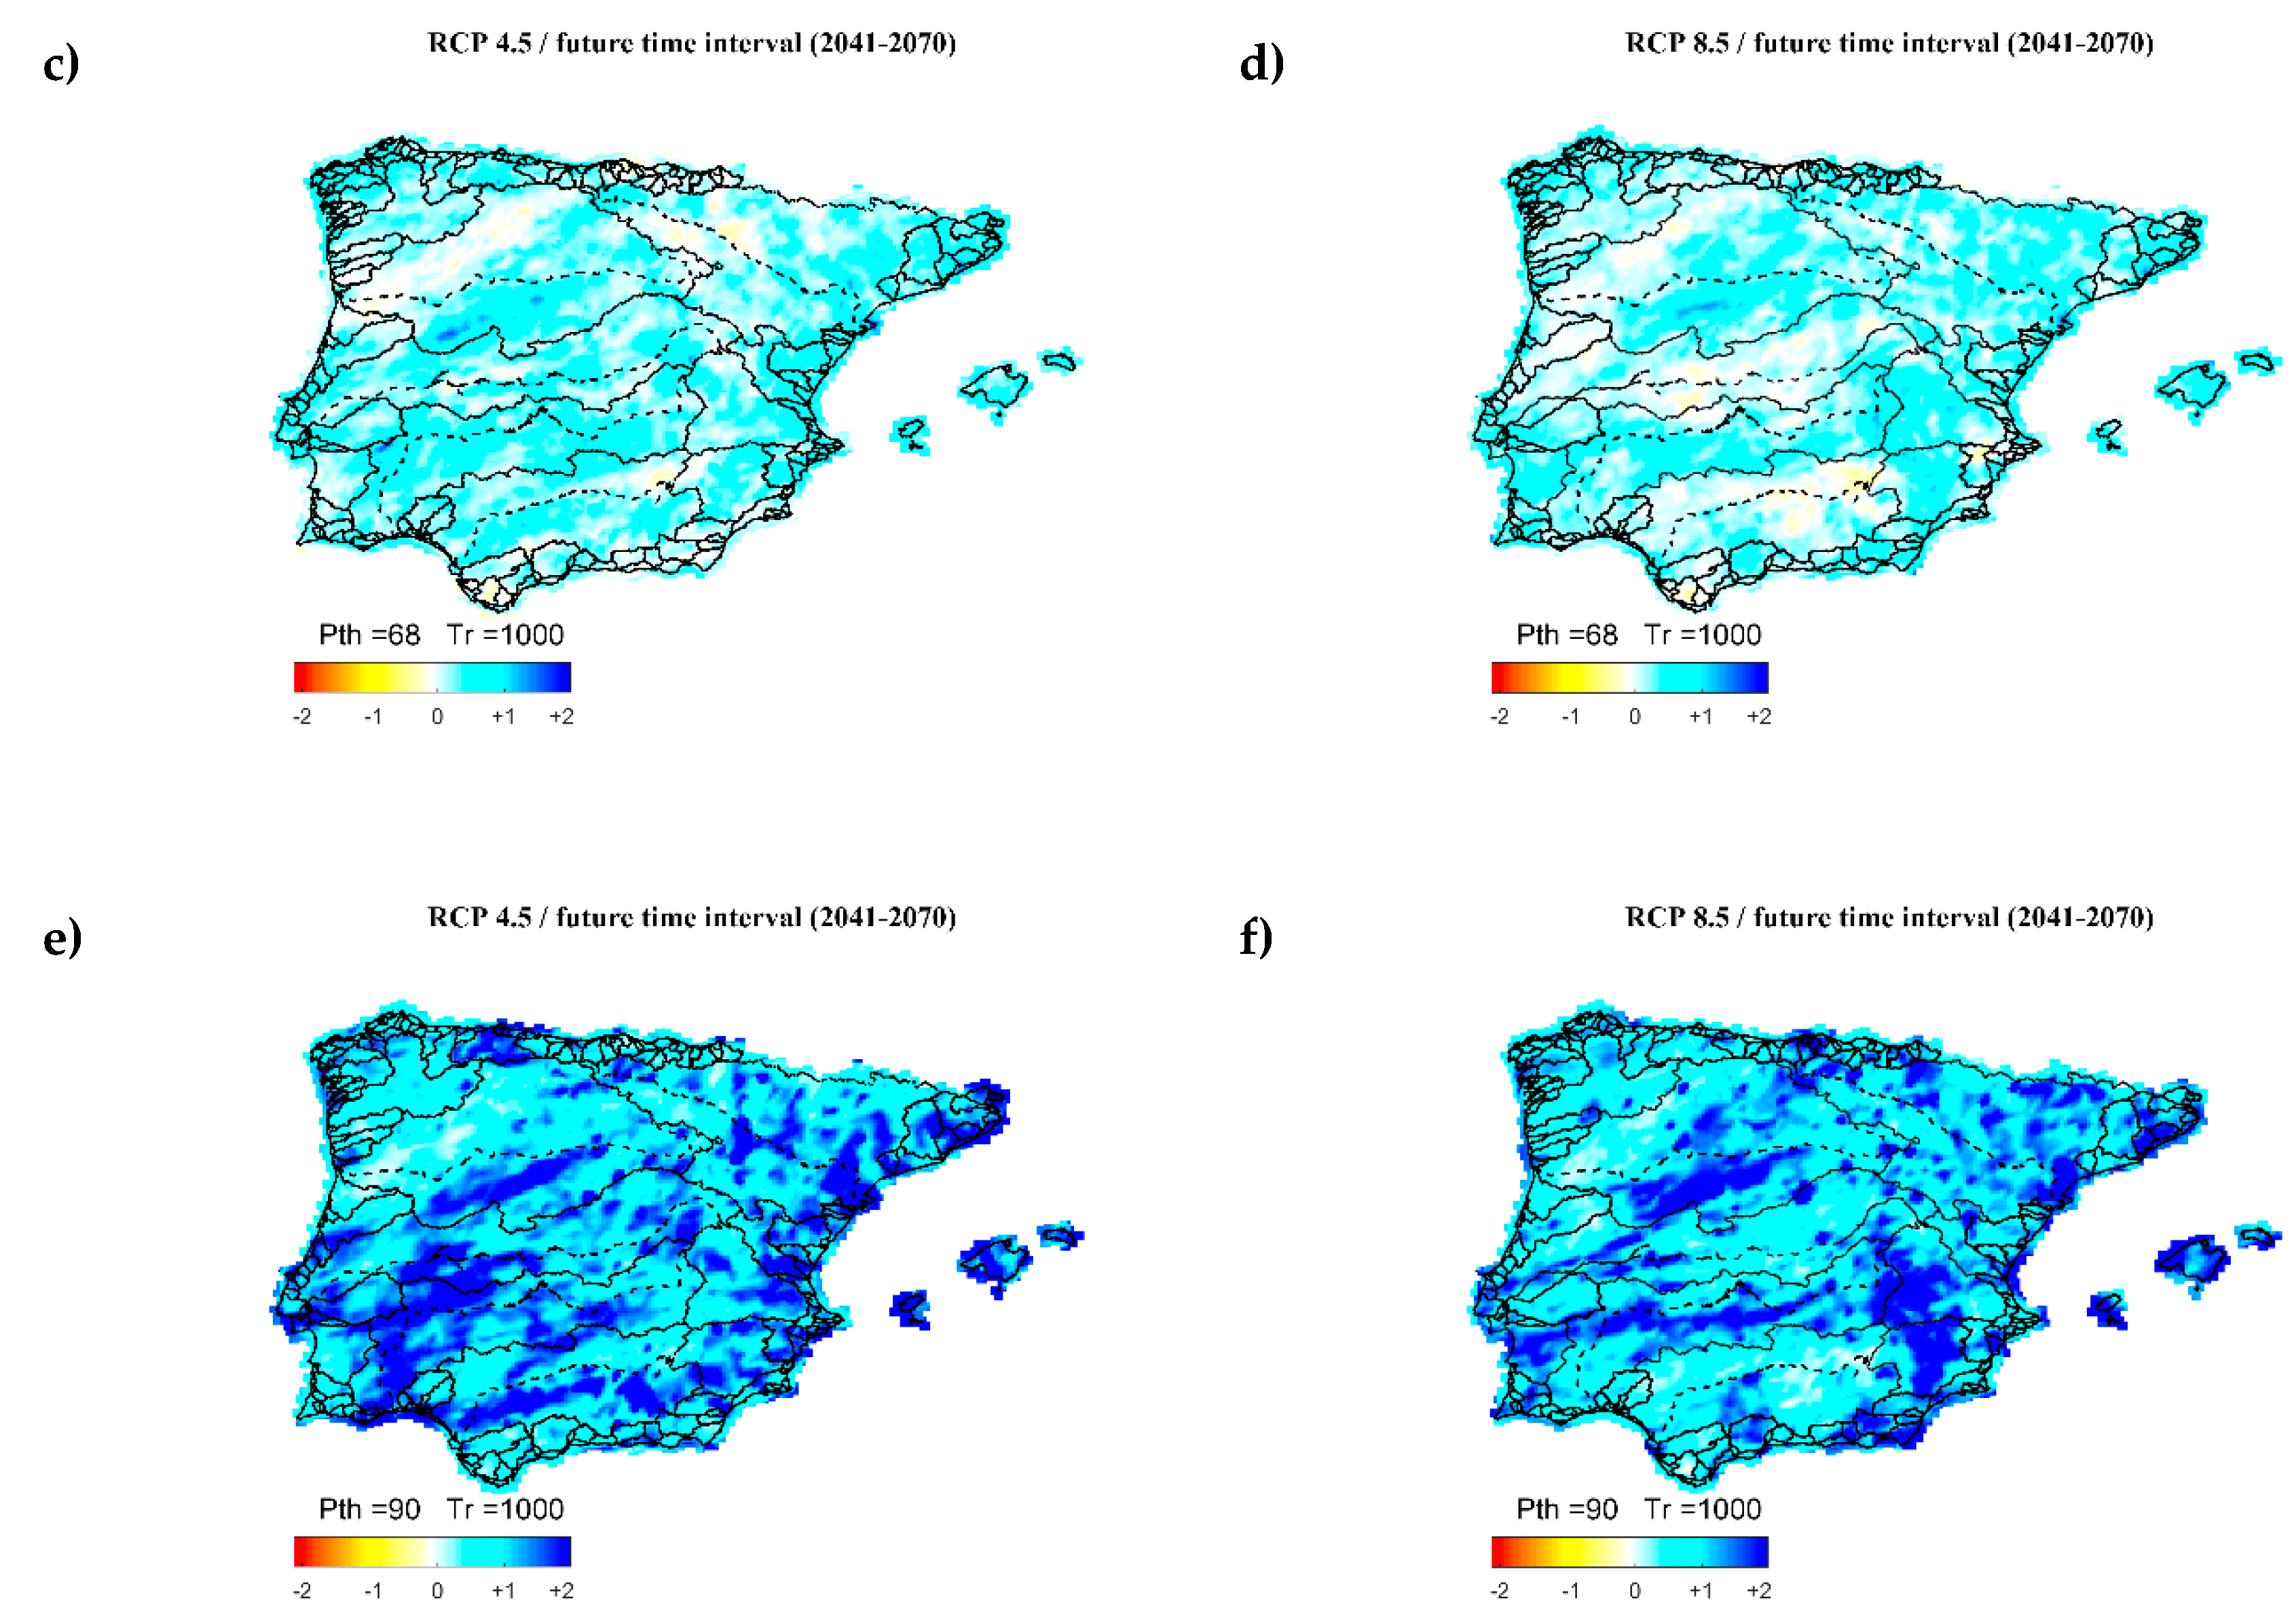
2.2.2. Relative Changes in Maximum Precipitations Expected in the Future
2.2.3. Uncertainty Assessment on Delta Changes
3. Results
3.1. Comparison between Climate Model Simulations in the Control Period and Observations
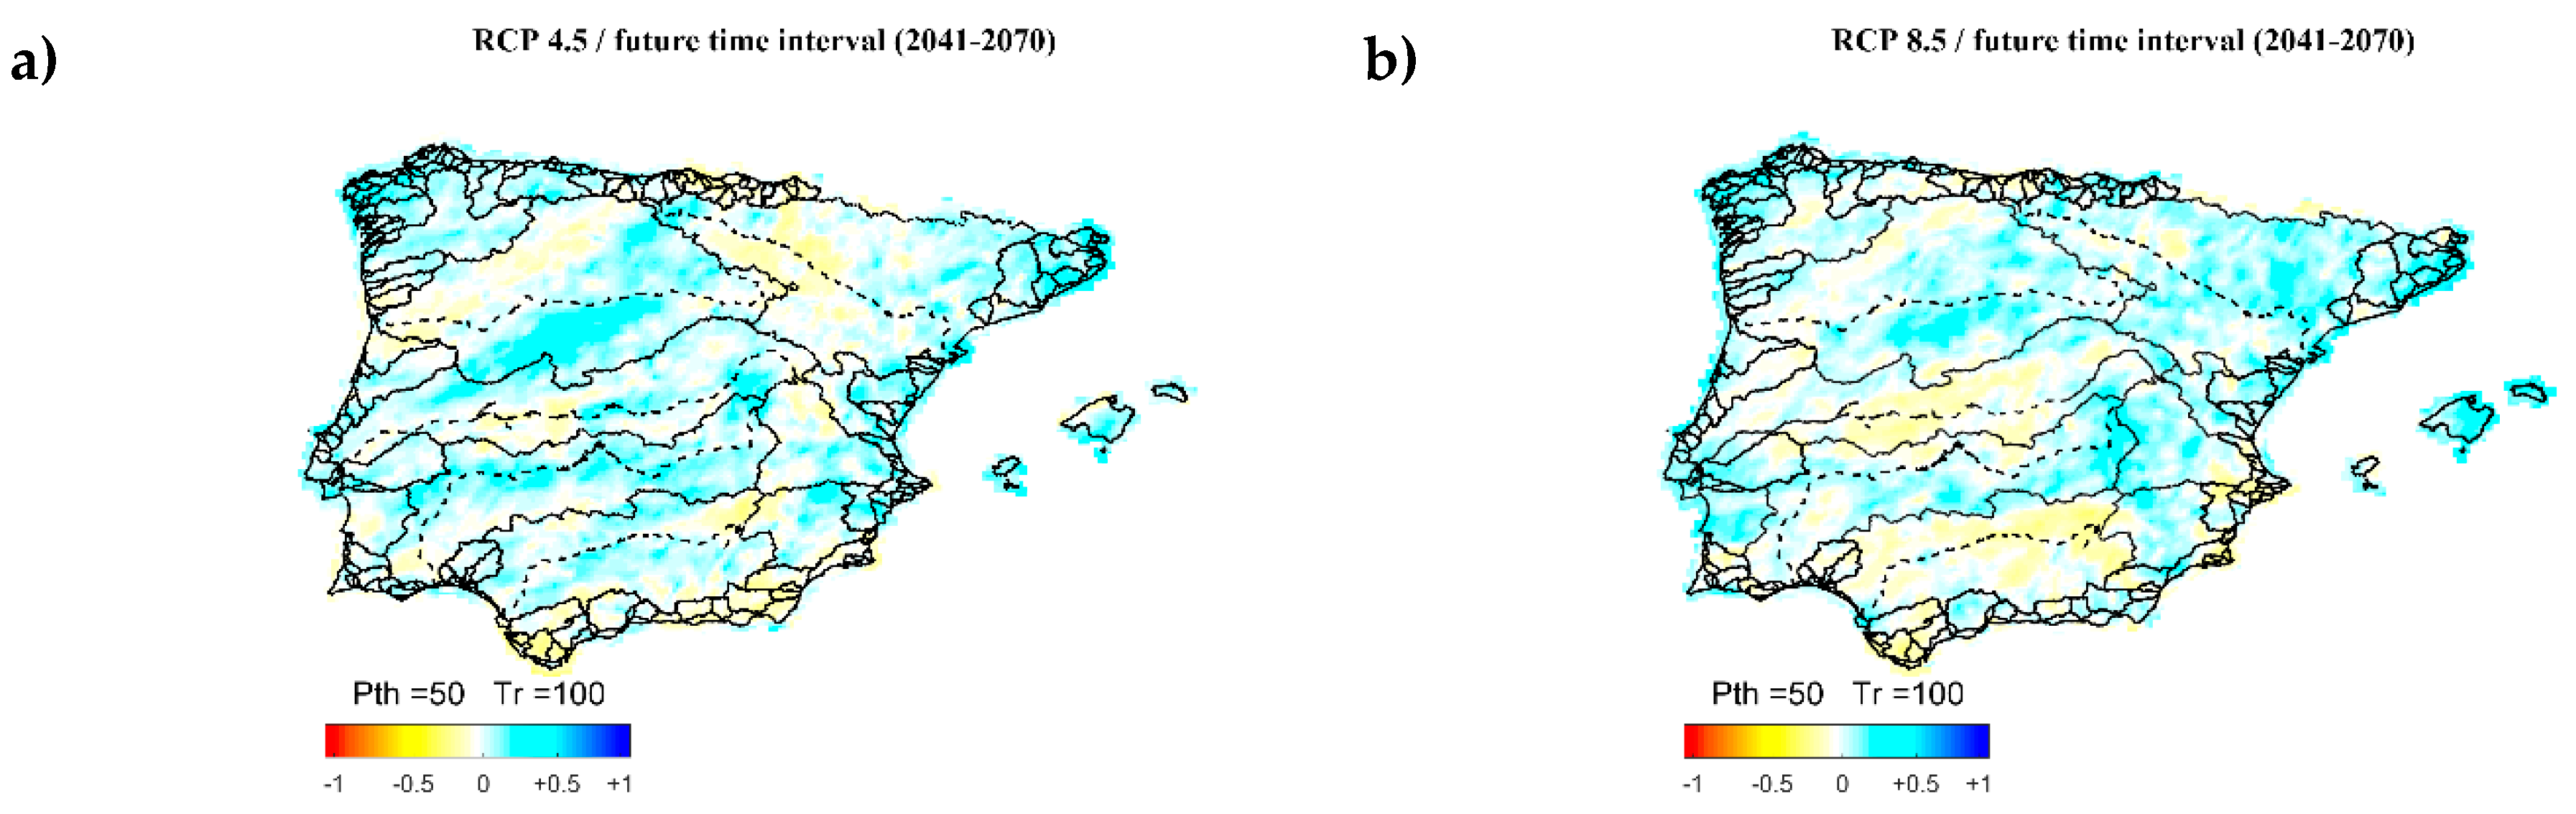
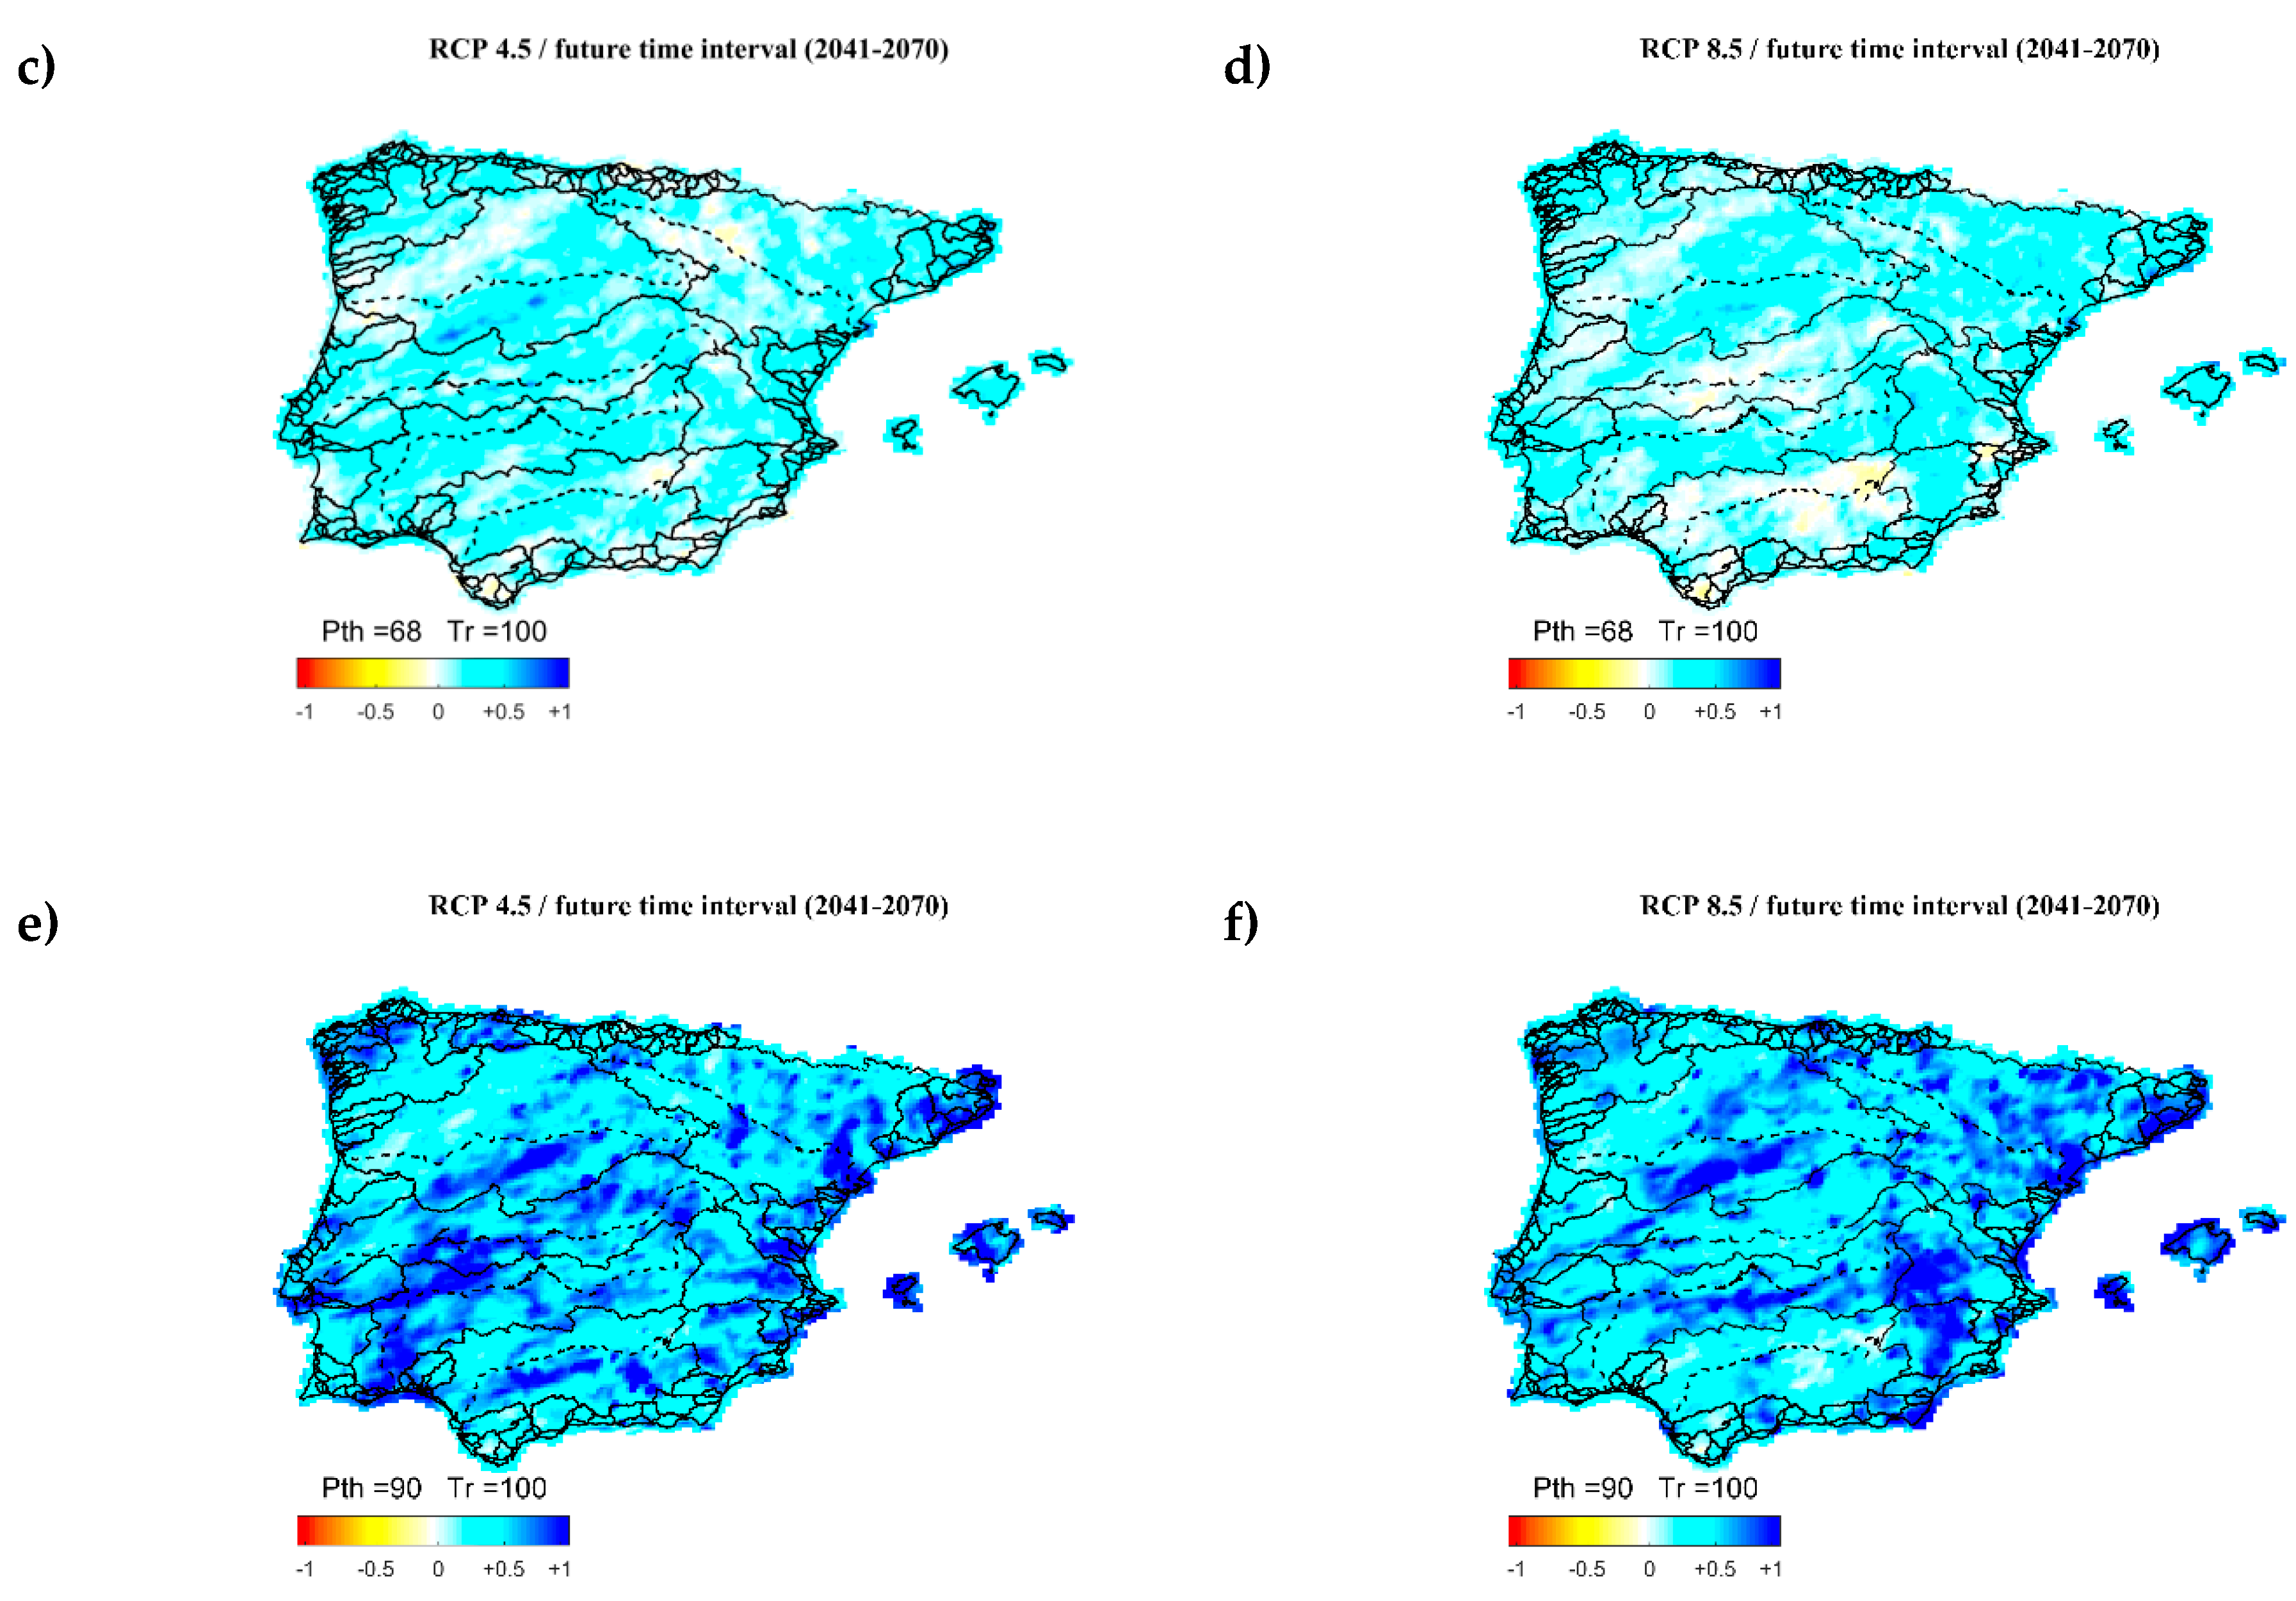
3.2. Expected Changes in Precipitation Quantilesin the Future
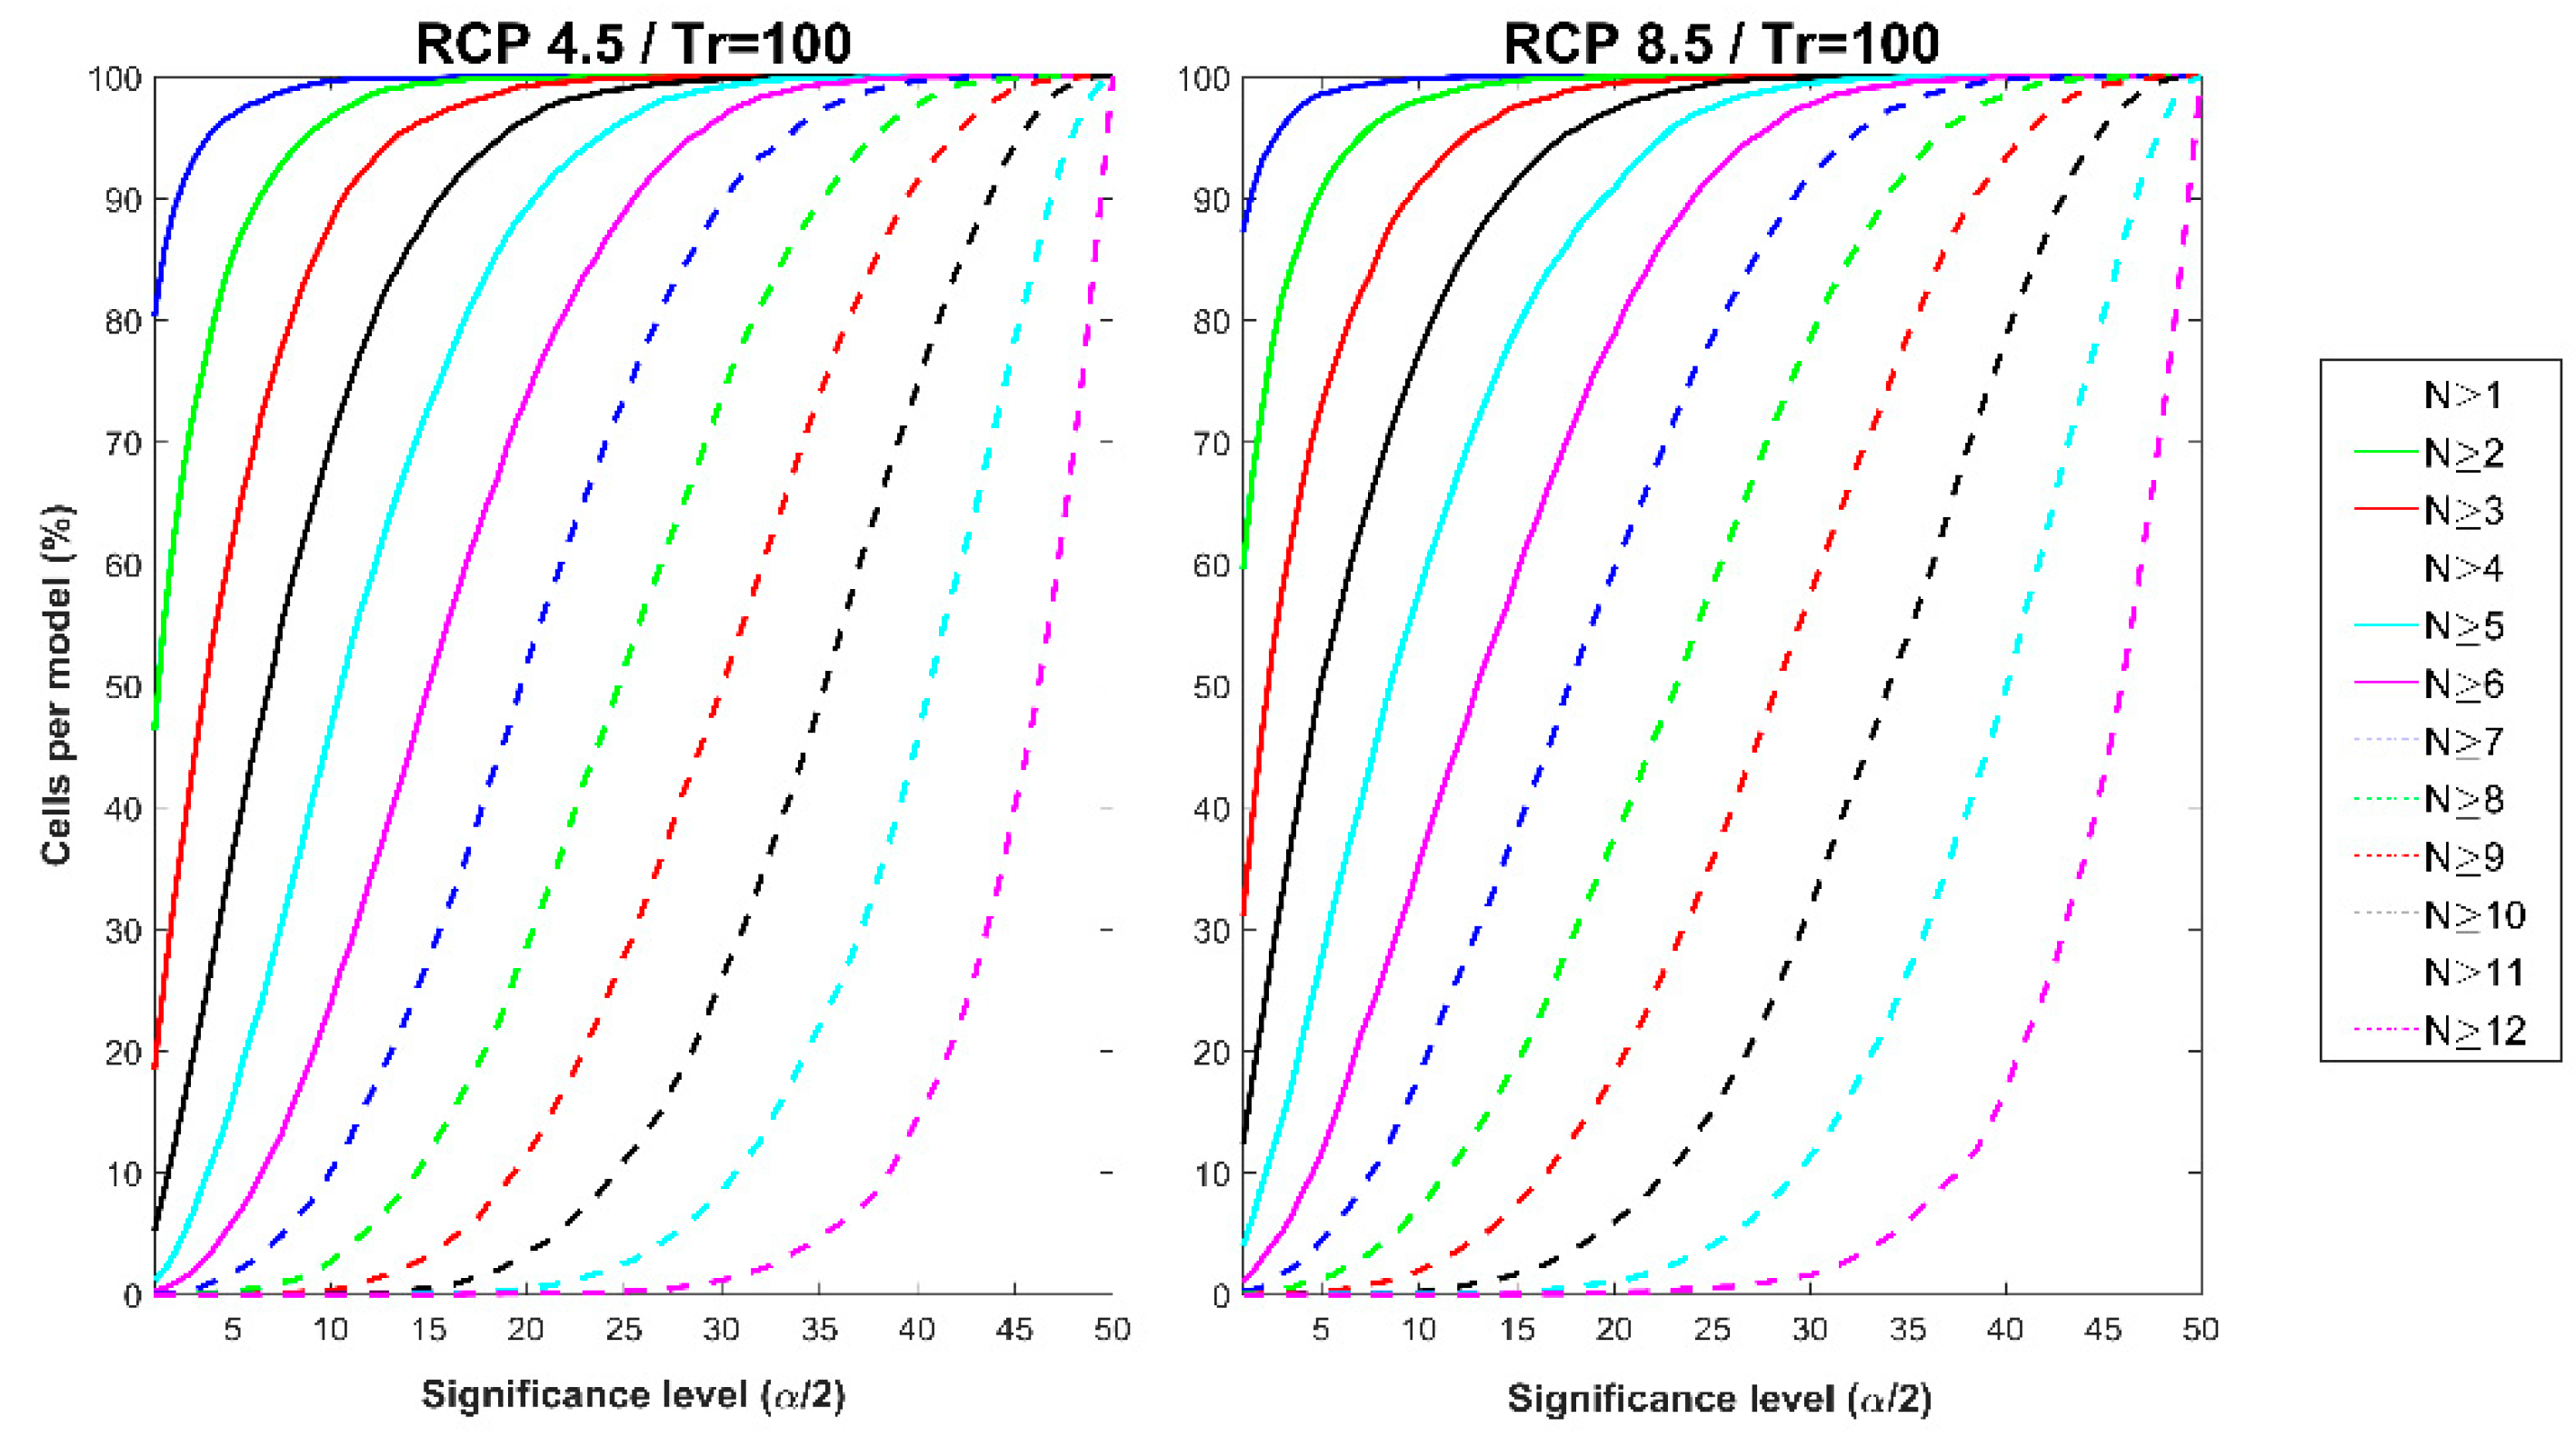
3.3. Uncertainty of Delta Changes in Precipitation Quantiles
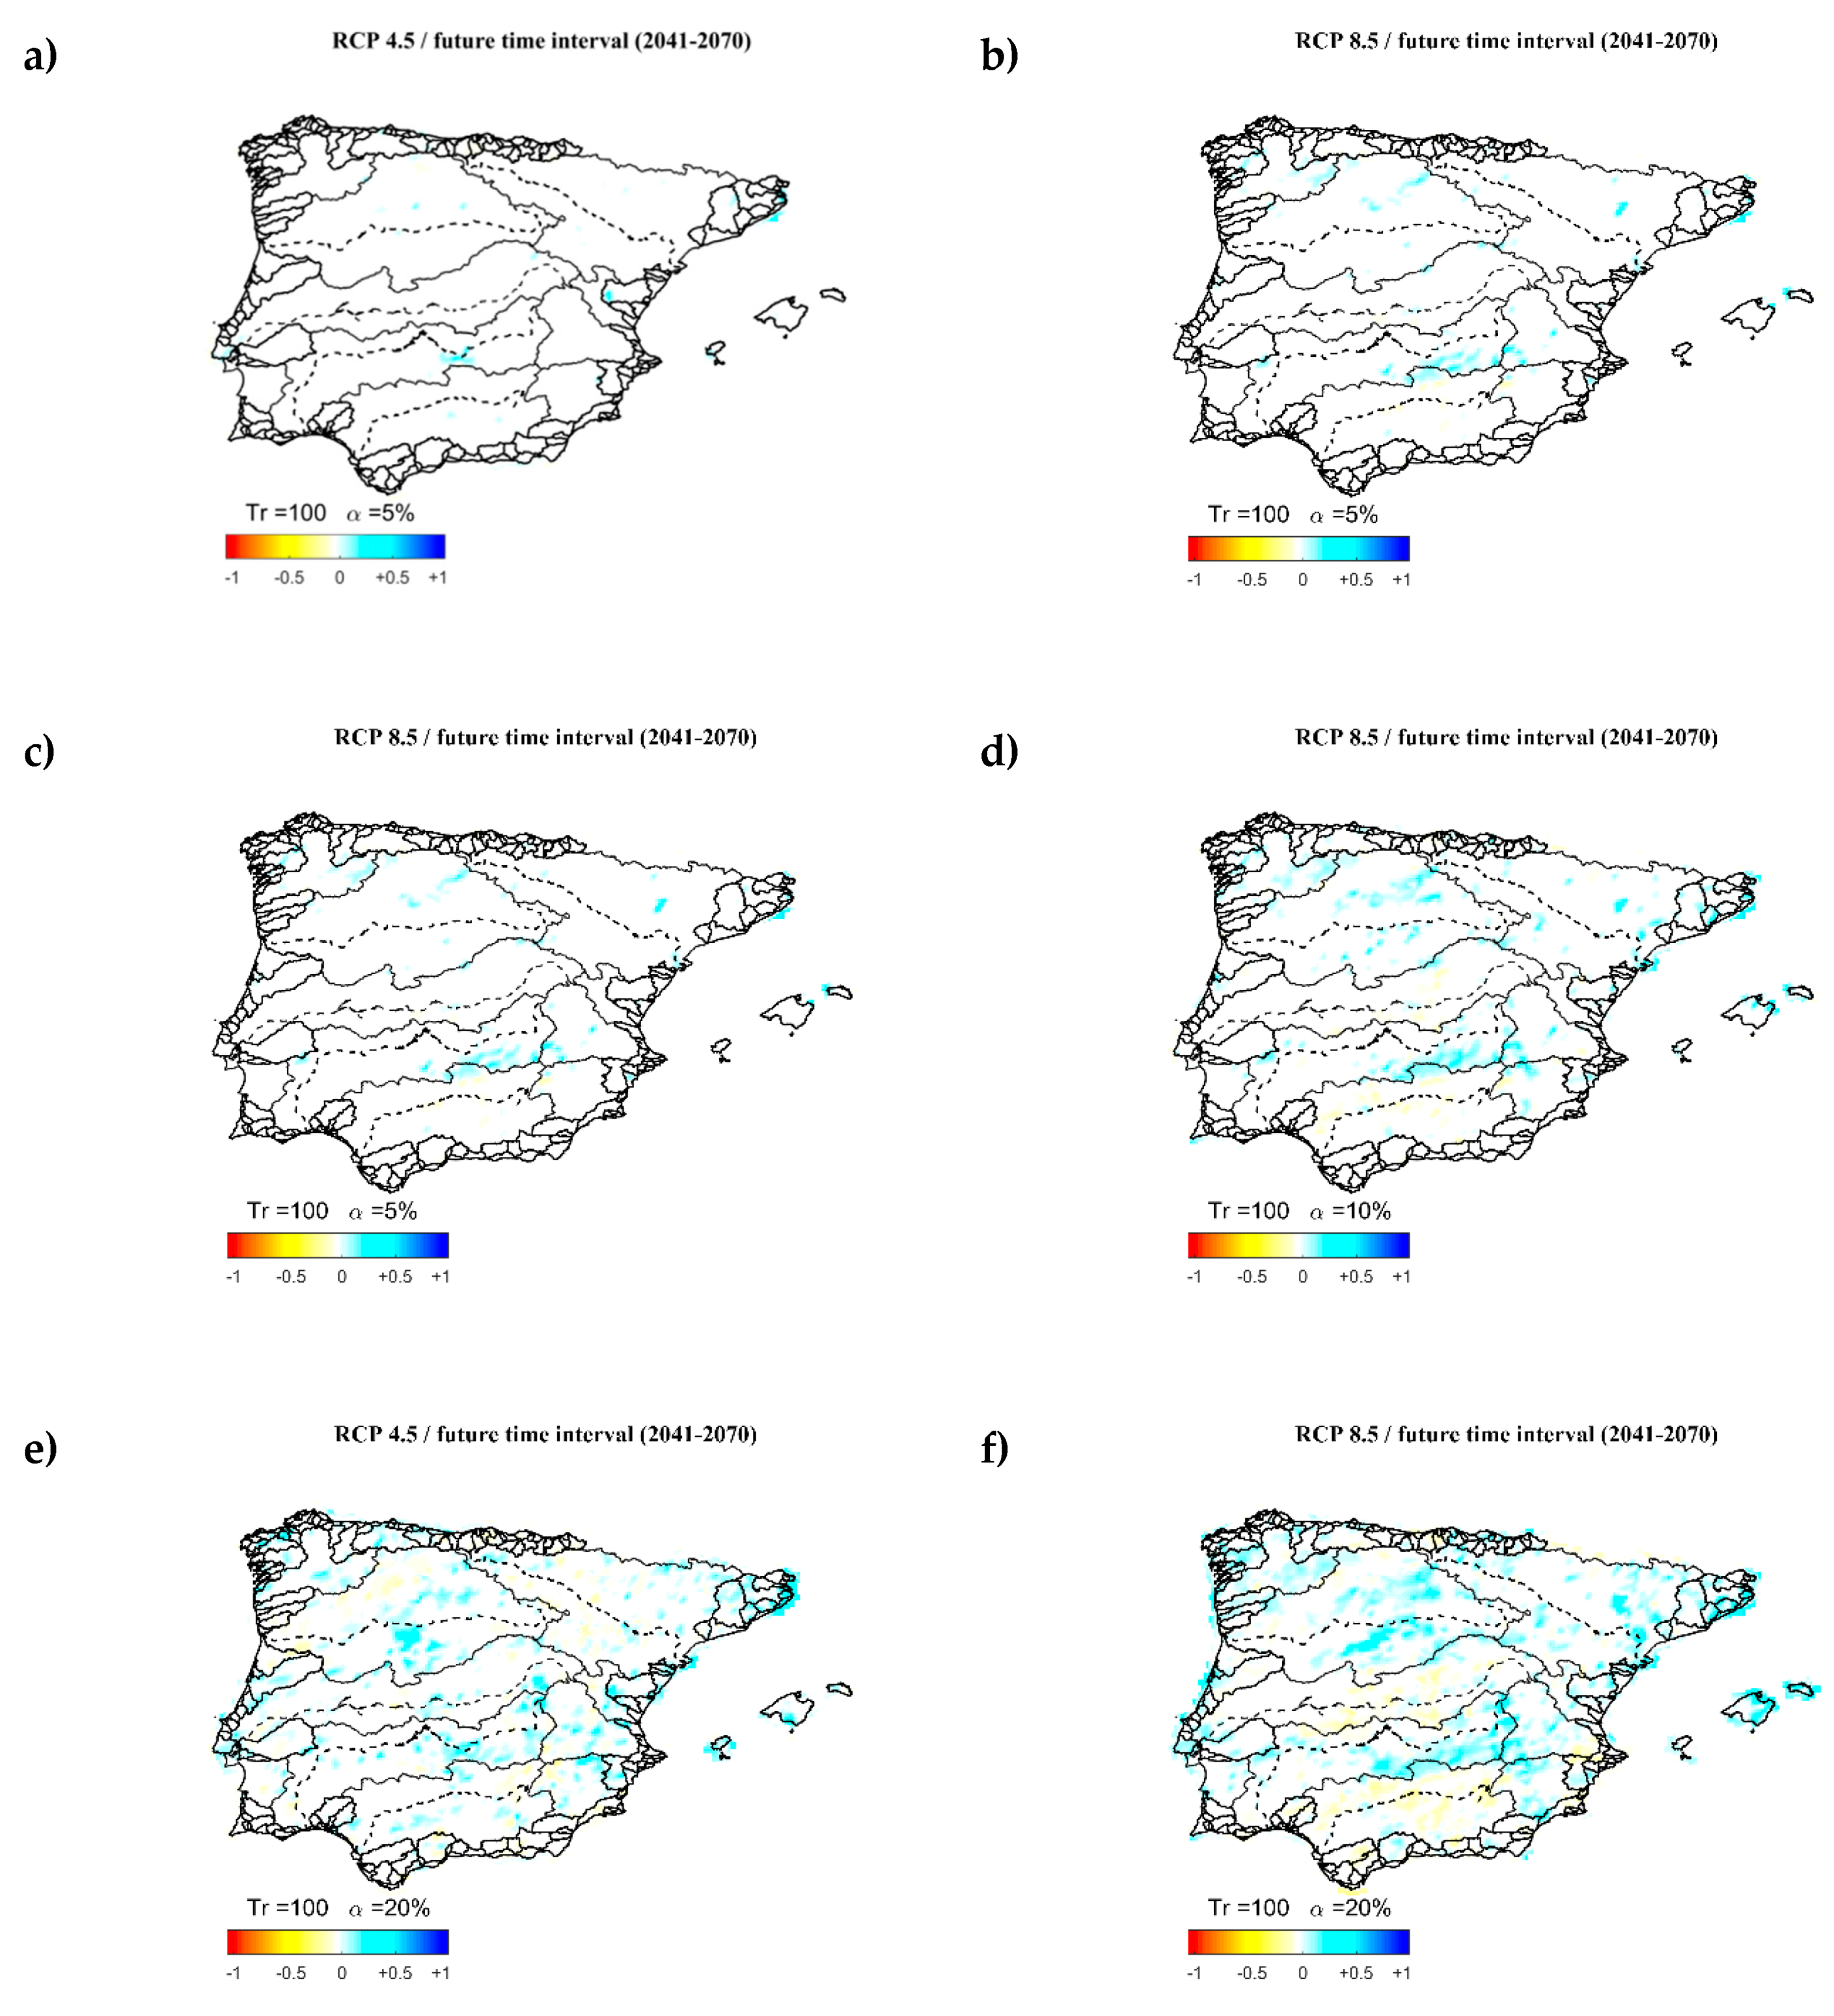
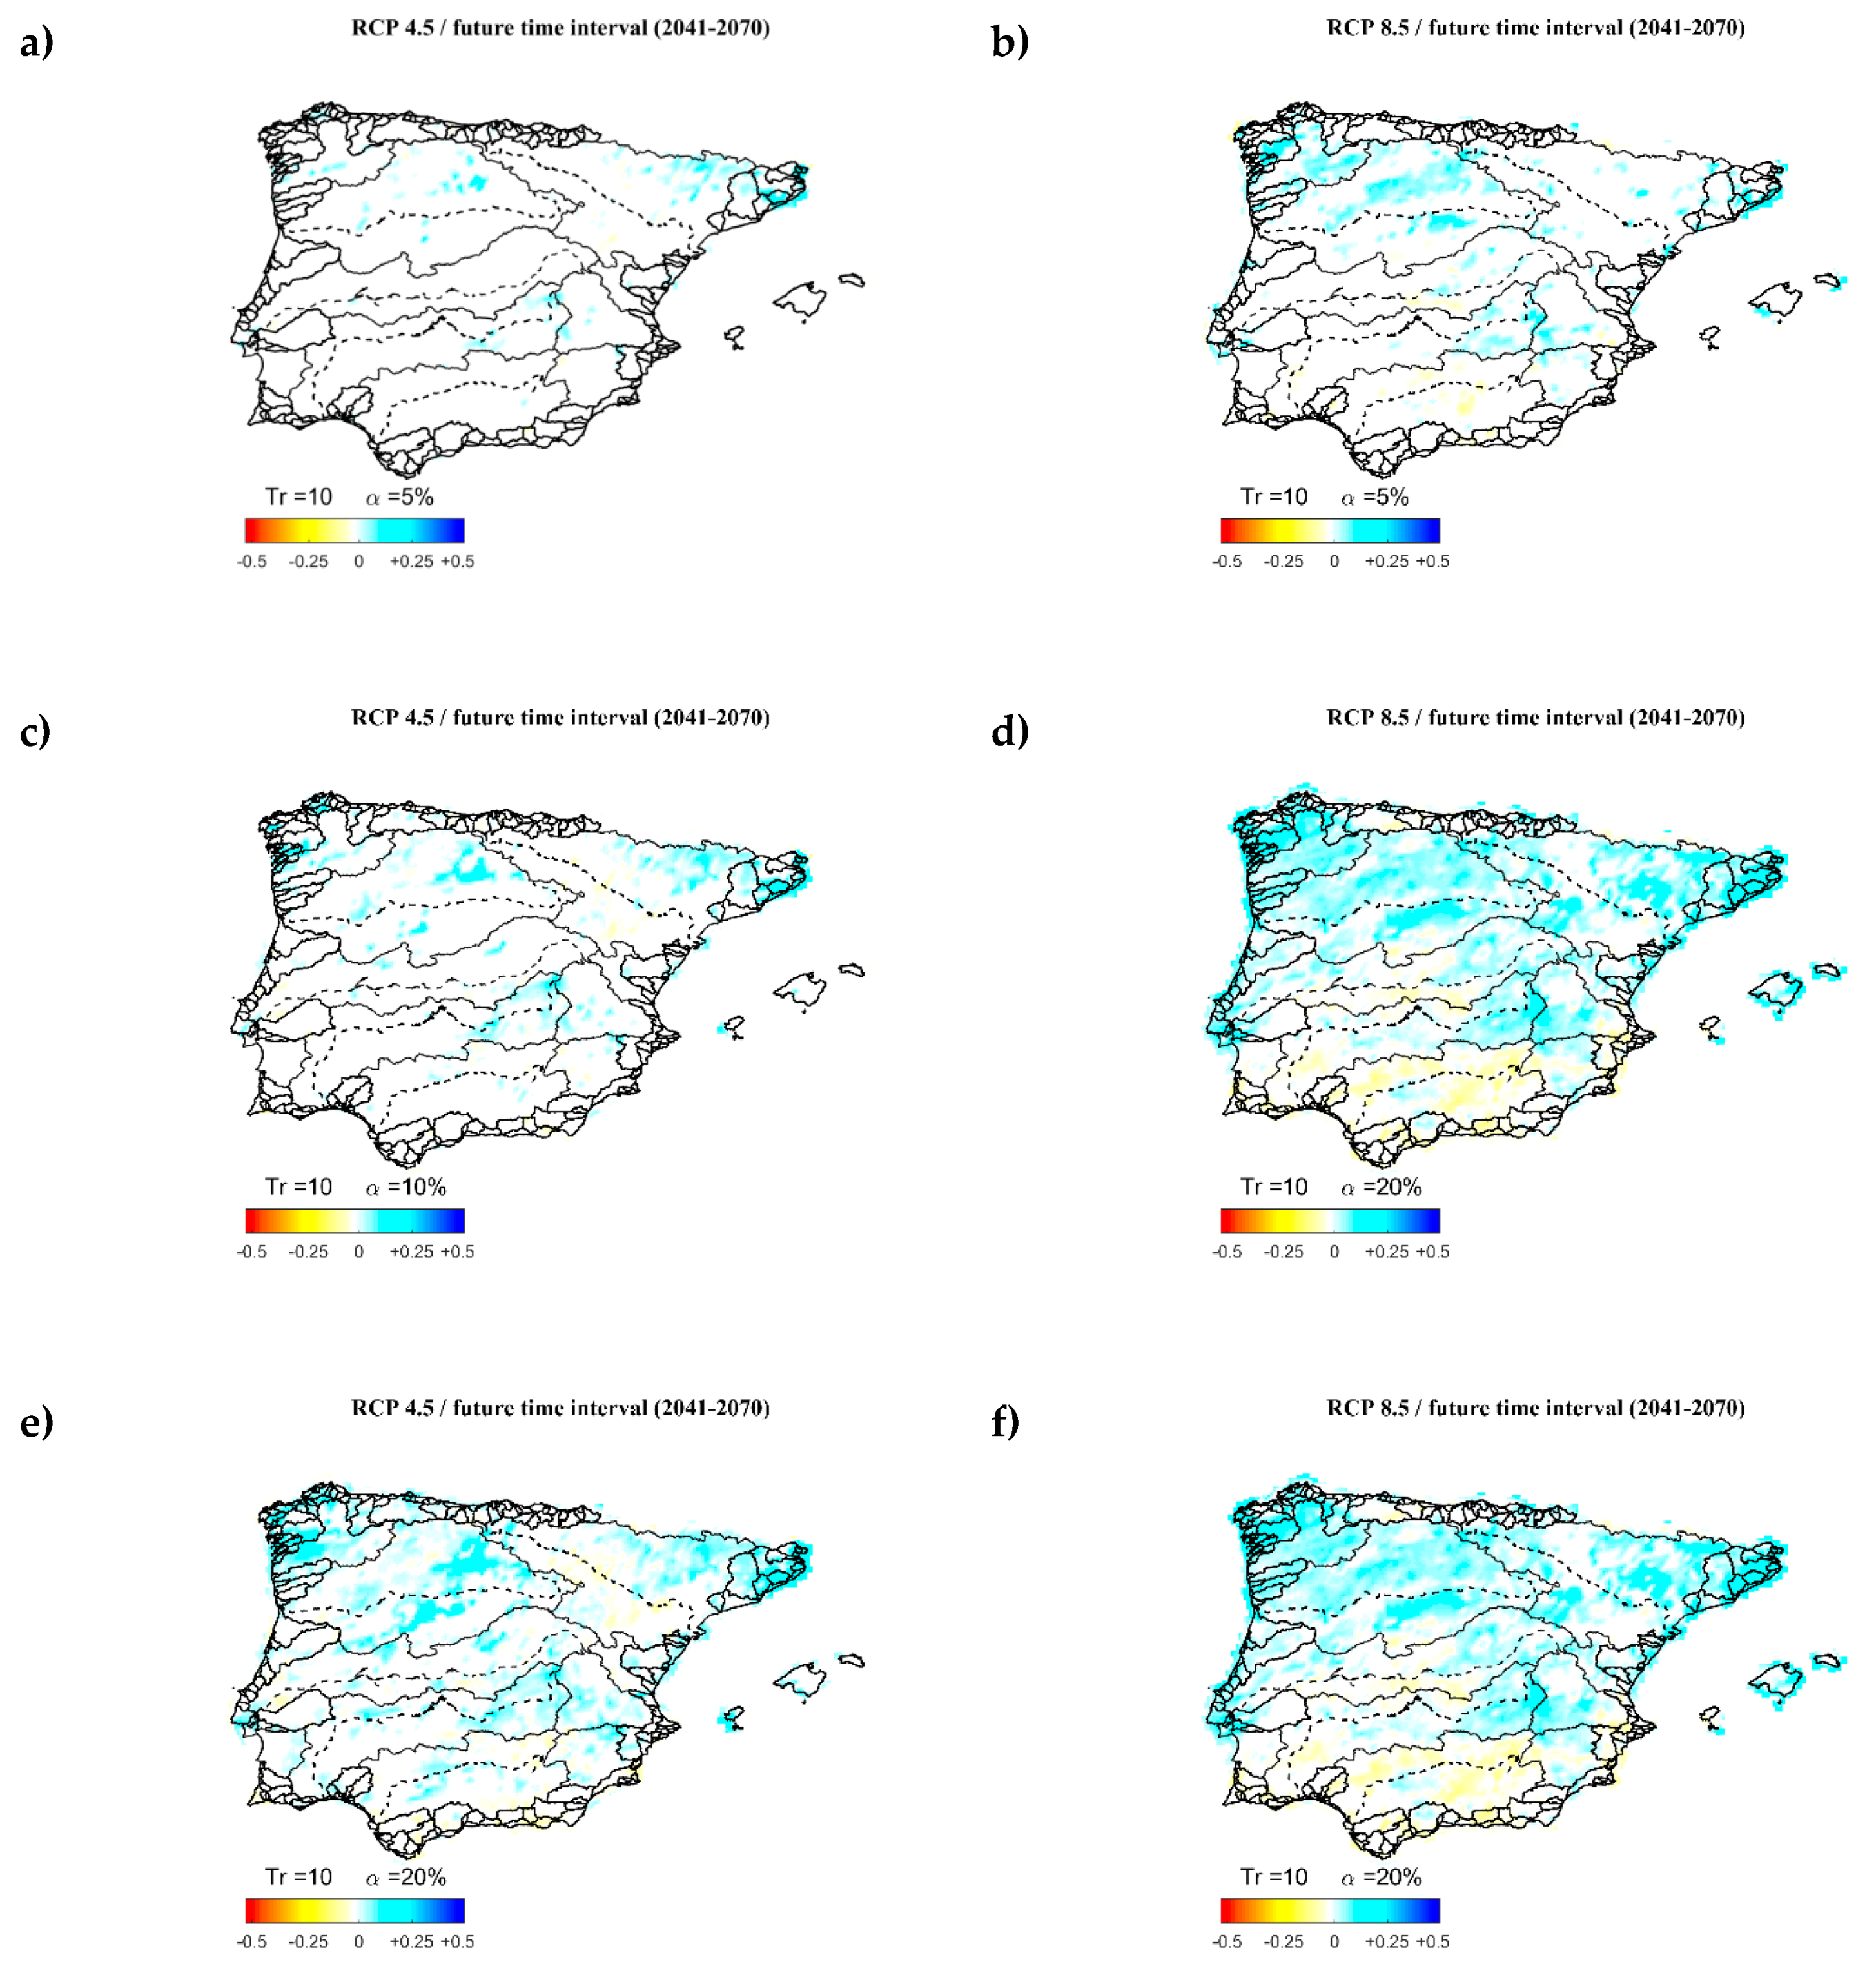
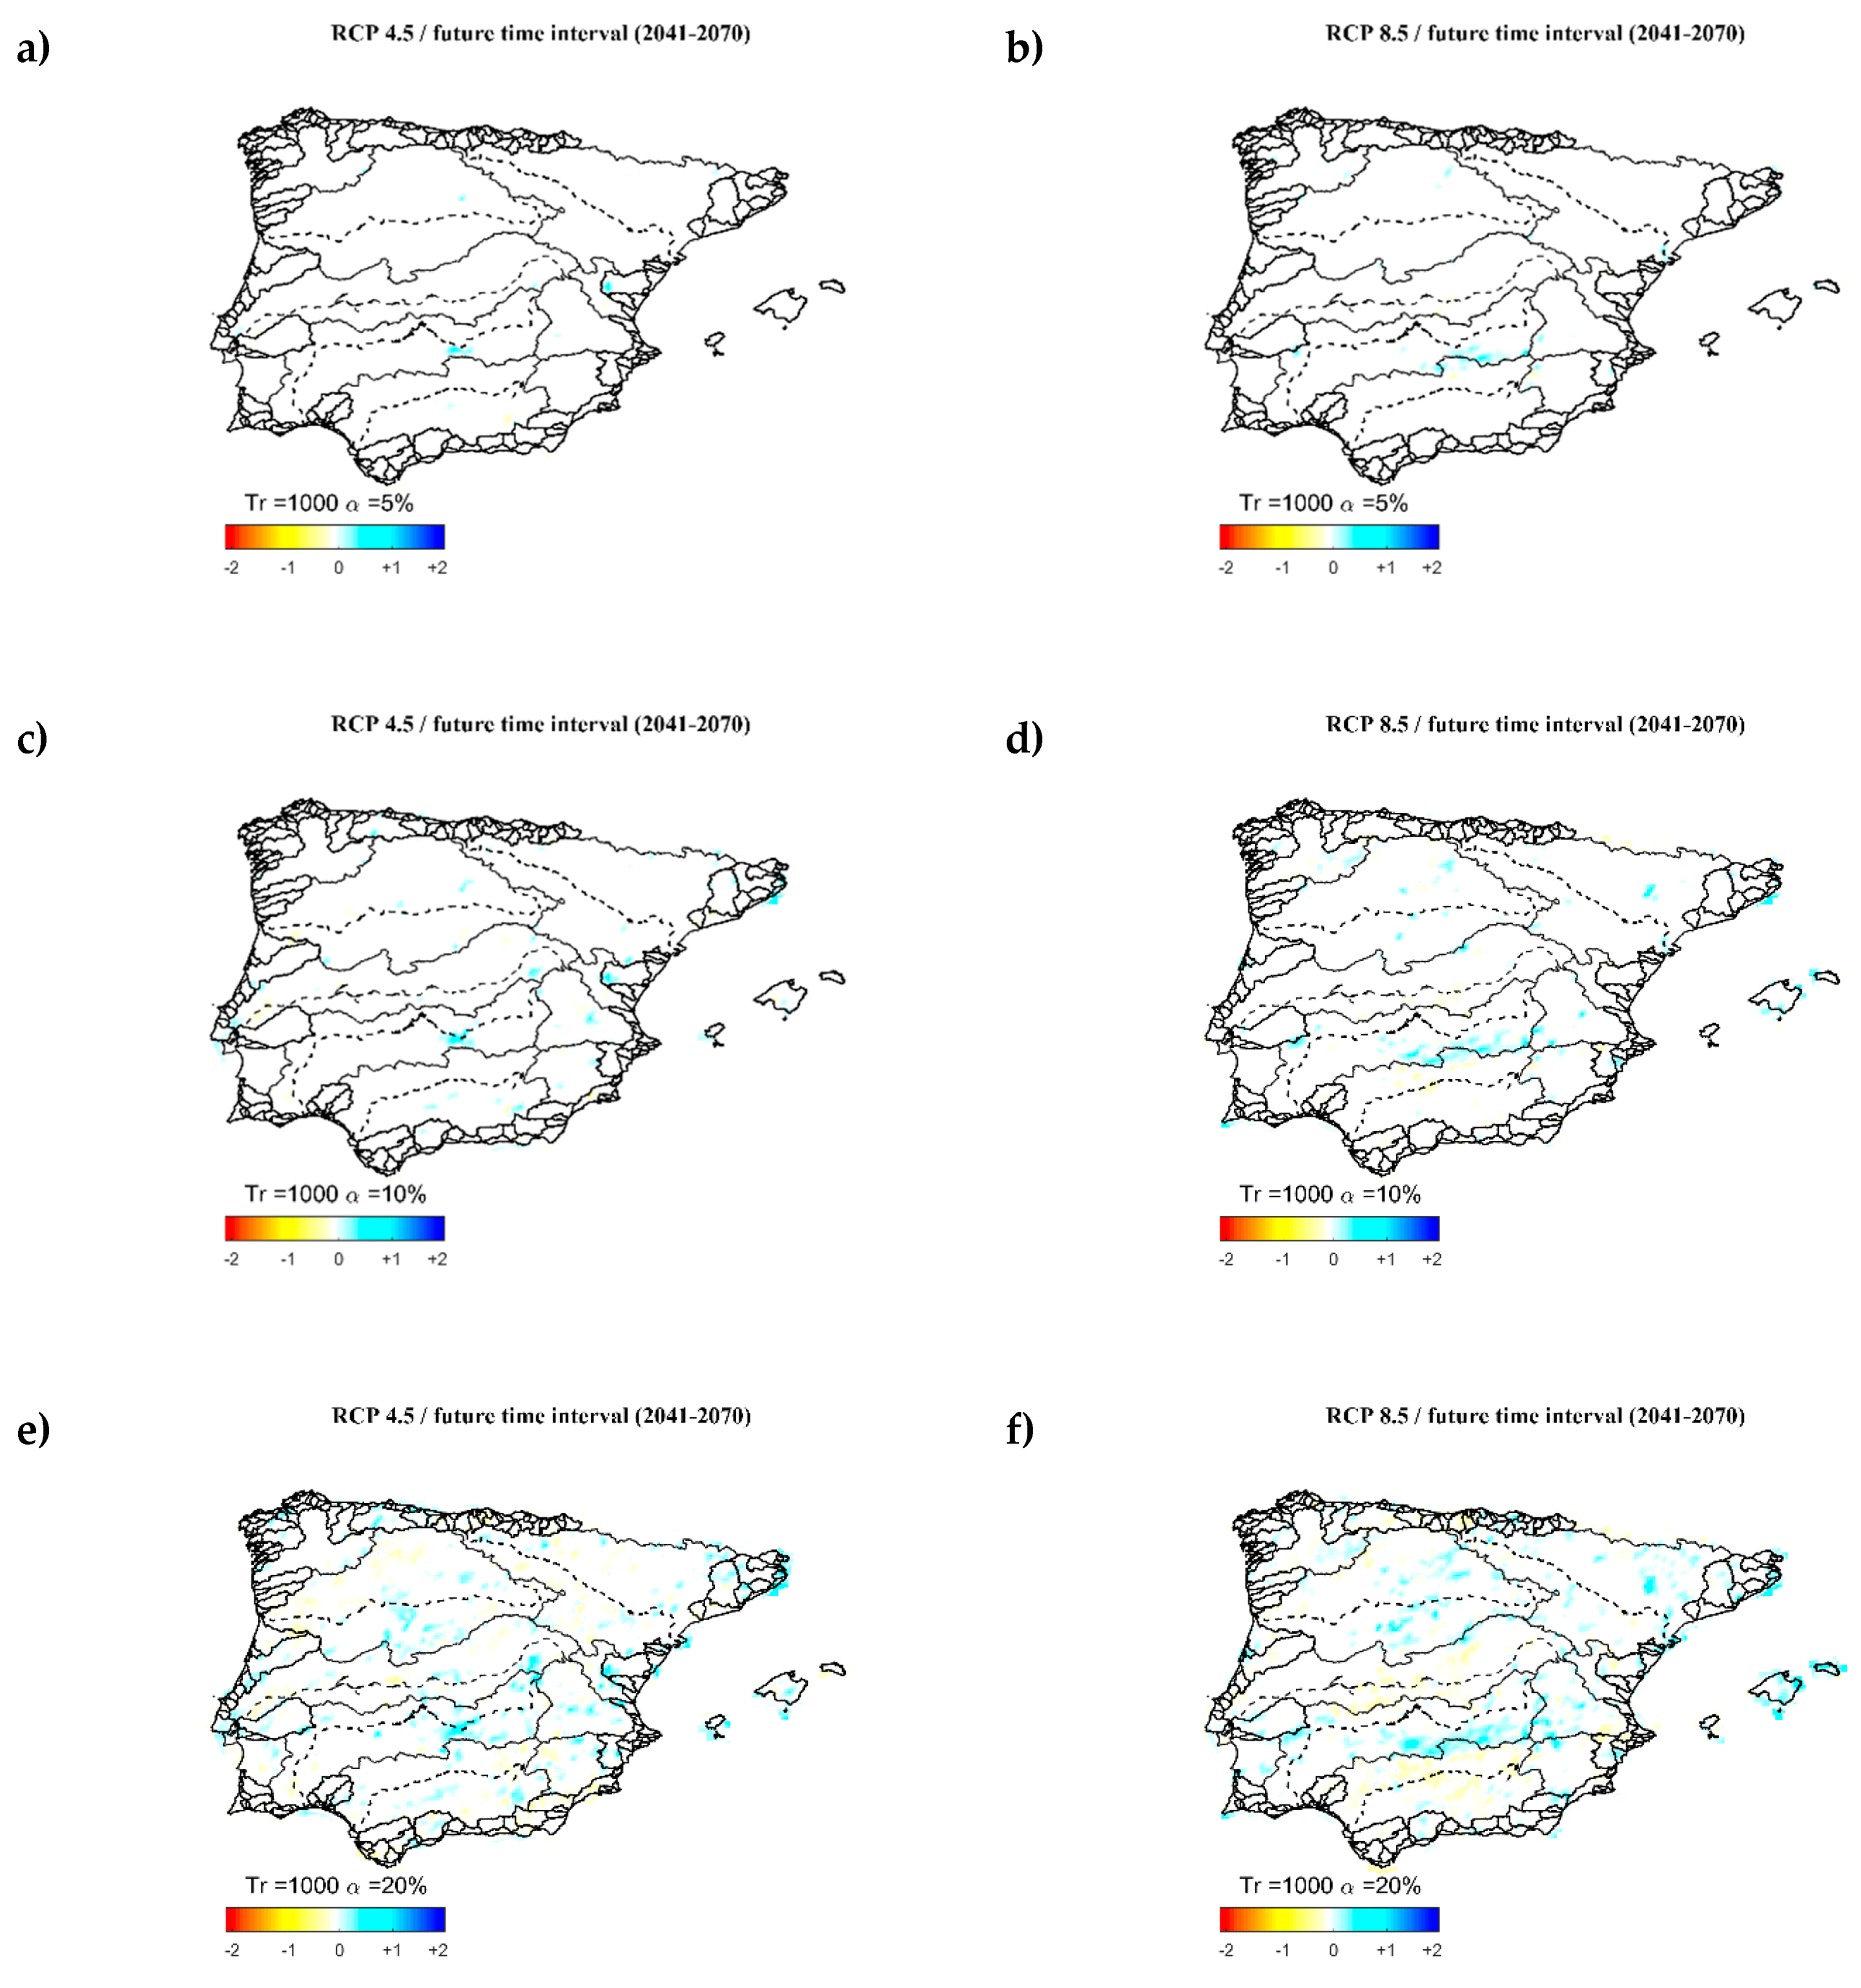
3.4. Spatial Layout of Significant Changes
4. Discussion and Conclusions
4.1. Model Biases
4.2. Uncertainty Thresholds
4.3. General and Significant Changes in Precipitation Quantiles
5. Patents
Supplementary Materials
Author Contributions
Funding
Acknowledgments
Conflicts of Interest
References
- Beniston, M.; Stephenson, D.B.; Christensen, O.B.; Ferro, C.A.T.; Frei, C.; Goyette, S.; Halsnaes, K.; Holt, T.; Jylhä, K.; Koffi, B.; et al. Future extreme events in European climate: An exploration of regional climate model projections. Clim. Chang. 2007, 81, 71–95. [Google Scholar] [CrossRef]
- Prein, A.F.; Gobiet, A.; Truhetz, H.; Keuler, K.; Goergen, K.; Teichmann, C.; Fox Maule, C.; van Meijgaard, E.; Déqué, M.; Nikulin, G.; et al. Precipitation in the EURO-CORDEX 0.11° and 0.44° simulations: High resolution, high benefits? Clim. Dyn. 2016, 46, 383–412. [Google Scholar] [CrossRef]
- Mascaro, G.; Viola, F.; Deidda, R. Evaluation of precipitation from EURO-CORDEX regional climate simulations in a small-scale Mediterranean site. J.Geophys. Res. Atmos. 2018, 123, 1604–1625. [Google Scholar] [CrossRef]
- Casanueva, A.; Kotlarski, S.; Herrera, S.; Fernández, J.; Gutiérrez, J.M.; Boberg, F.; Colette, A.; Christensen, O.B.; Goergen, K.; Jacob, D.; et al. Daily precipitation statistics in a EURO-CORDEX RCM ensemble: Added value of raw and bias-corrected high-resolution simulations. Clim. Dyn. 2016, 47, 719–737. [Google Scholar] [CrossRef]
- Frei, C.; Christensen, J.H.; Déqué, M.; Jacob, D.; Jones, R.G.; Vidale, P.L. Daily precipitation statistics in regional climate models: Evaluation and intercomparison for the European Alps. J. Geophys. Res. 2003, 108, 4124. [Google Scholar] [CrossRef]
- Jacob, D.; Bärring, L.; Christensen, O.B.; Christensen, J.H.; de Castro, M.; Déqué, M.; Giorgi, F.; Hagemann, S.; Hirschi, M.; Jones, R.; et al. An inter-comparison of regional climate models for Europe: Model performance in present-day climate. Clim. Chang. 2007, 81, 31–52. [Google Scholar] [CrossRef]
- Kotlarski, S.; Paul, F.; Jacob, D. Forcing a Distributed Glacier Mass Balance Model with the Regional Climate Model REMO. Part I: Climate Model Evaluation. J. Clim. 2010, 23, 1589–1606. [Google Scholar] [CrossRef]
- Kotlarski, S.; Keuler, K.; Christensen, O.B.; Colette, A.; Deque, M.; Gobiet, A.; Goergen, K.; Jacob, D.; Lüthi, D.; Meijgaard, E.V.; et al. Regional climate modelling on European scales: A joint standard evaluation of the EURO-CORDEX RCM ensemble. Geosci. Model Dev. Atmos. 2014, 7, 1297–1333. [Google Scholar] [CrossRef]
- Monjo, R.; Gaitán, E.; Pórtoles, J.; Ribalaygua, J.; Torres, L. Changes in extreme precipitation over Spain using statistical downscaling of CMIP5 projections. Int. J. Climatol. 2016, 36, 757–769. [Google Scholar] [CrossRef]
- Frei, C.; Schöll, R.; Fukutome, S.; Schmidli, J.; Vidale, P.L. Future change of precipitation extremes in Europe: Intercomparison of scenarios from regional climate models. J. Geophys. Res. 2006, 111, D06105. [Google Scholar] [CrossRef]
- Fowler, H.J.; Ekström, M.; Blenkinsop, S.; Smith, A.P. Estimating change in extreme European precipitation using a multimodel ensemble. J. Geophys. Res. 2007, 112, D18104. [Google Scholar] [CrossRef]
- Rajczak, J.; Pall, P.; Schär, C. Projections of extreme precipitation events in regional climate simulations for Europe and the Alpine Region. J. Geophys. Res. 2010, 118, 3610–3626. [Google Scholar] [CrossRef]
- Herrera, S.; Fita, L.; Fernández, J.; Gutiérrez, J.M. Evaluation of the mean and extreme precipitation regimes from the ENSEMBLES regional climate multimodel simulations over Spain. J. Geophys. Res. 2010, 115, D21117. [Google Scholar] [CrossRef]
- Giorgi, F.; Lionello, P. Climate change projections for the mediterranean region. Glob. Planet Chang. 2008, 63, 90–104. [Google Scholar] [CrossRef]
- Jacob, D.; Petersen, J.; Eggert, B.; Alias, A.; Christensen, O.B.; Bouwer, L.M.; Braun, A.; Colette, A.; Déqué, M.; Georgievski, G.; et al. EURO-CORDEX: New high-resolution climate change projections for European impact research. Reg. Environ. Chang. 2014, 14, 563–578. [Google Scholar] [CrossRef]
- Hosking, J.R.M.; Wallis, J.R.; Wood, E.F. Estimation of the generalized extreme-value distribution by the method of probability-weighted moments. Technometrics 1985, 27, 251–261. [Google Scholar] [CrossRef]
- Svensson, C.; Jones, D.A. Review of rainfall frequency estimation methods. J. Flood Risk Manag. 2010, 3, 296–313. [Google Scholar] [CrossRef] [Green Version]
- Ferrer, J.; Ardiles, L. Análisis estadístico de las series anuales de máximas lluvias diarias en España. Ing. Civ. 1994, 95, 87–100. [Google Scholar]


| ID | Acronym | GCM | RCM | Simulation Periods (Control/Future) |
|---|---|---|---|---|
| 1 | ICH-CCL | ICHEC-EC-EARTH | CCLM4-8-17 | 1951–2005/2006–2100 |
| 2 | MPI-CCL | MPI-ESM-LR | CCLM4-8-17 | 1951–2005/2006–2100 |
| 3 | MOH-RAC | MOHC-HadGEM2-ES | RACMO22E | 1951–2005/2006–2099 |
| 4 | CNR-CCL | CNRM-CM5 | CCLM4-8-17 | 1951–2005/2006–2100 |
| 5 | ICH-RAC | ICHEC-EC-EARTH | RACMO22E | 1951–2005/2006–2100 |
| 6 | MOH-CCL | MOHC-HadGEM2-ES | CCLM4-8-17 | 1951–2005/2006–2099 |
| 7 | IPS-WRF | IPSL-CM5A-MR | WRF331F | 1951–2005/2006–2100 |
| 8 | IPS-RCA | IPSL-CM5A-MR | RCA4 | 1971–2005/2006–2100 |
| 9 | MOH-RCA | MOHC-HadGEM2-ES | RCA4 | 1971–2005/2006–2099 |
| 10 | ICH-RCA | ICHEC-EC-EARTH | RCA4 | 1971–2005/2006–2100 |
| 11 | CNR-RCA | CNRM-CM5 | RCA4 | 1971–2005/2006–2100 |
| 12 | MPI-RCA | MPI-ESM-LR | RCA4 | 1971–2005/2006–2100 |
| Statistic | Abbreviation |
|---|---|
| Mean | Mean |
| Coefficient of variation | CV |
| Coefficient of skewness | CS |
| Mean of AMS | MeanMax |
| Coefficient of variation of AMS | CVMax |
| Coefficient of skewness of AMS | CSMax |
| RCP | 4.5 | ||||||||||||||||||||
|---|---|---|---|---|---|---|---|---|---|---|---|---|---|---|---|---|---|---|---|---|---|
| Return Period | 2 | 5 | 10 | 50 | 100 | 500 | 1000 | ||||||||||||||
| Future Time Interval | 11–40 | 41–70 | 71–95 | 11–40 | 41–70 | 71–95 | 11–40 | 41–70 | 71–95 | 11–40 | 41–70 | 71–95 | 11–40 | 41–70 | 71–95 | 11–40 | 41–70 | 71–95 | 11–40 | 41–70 | 71–95 |
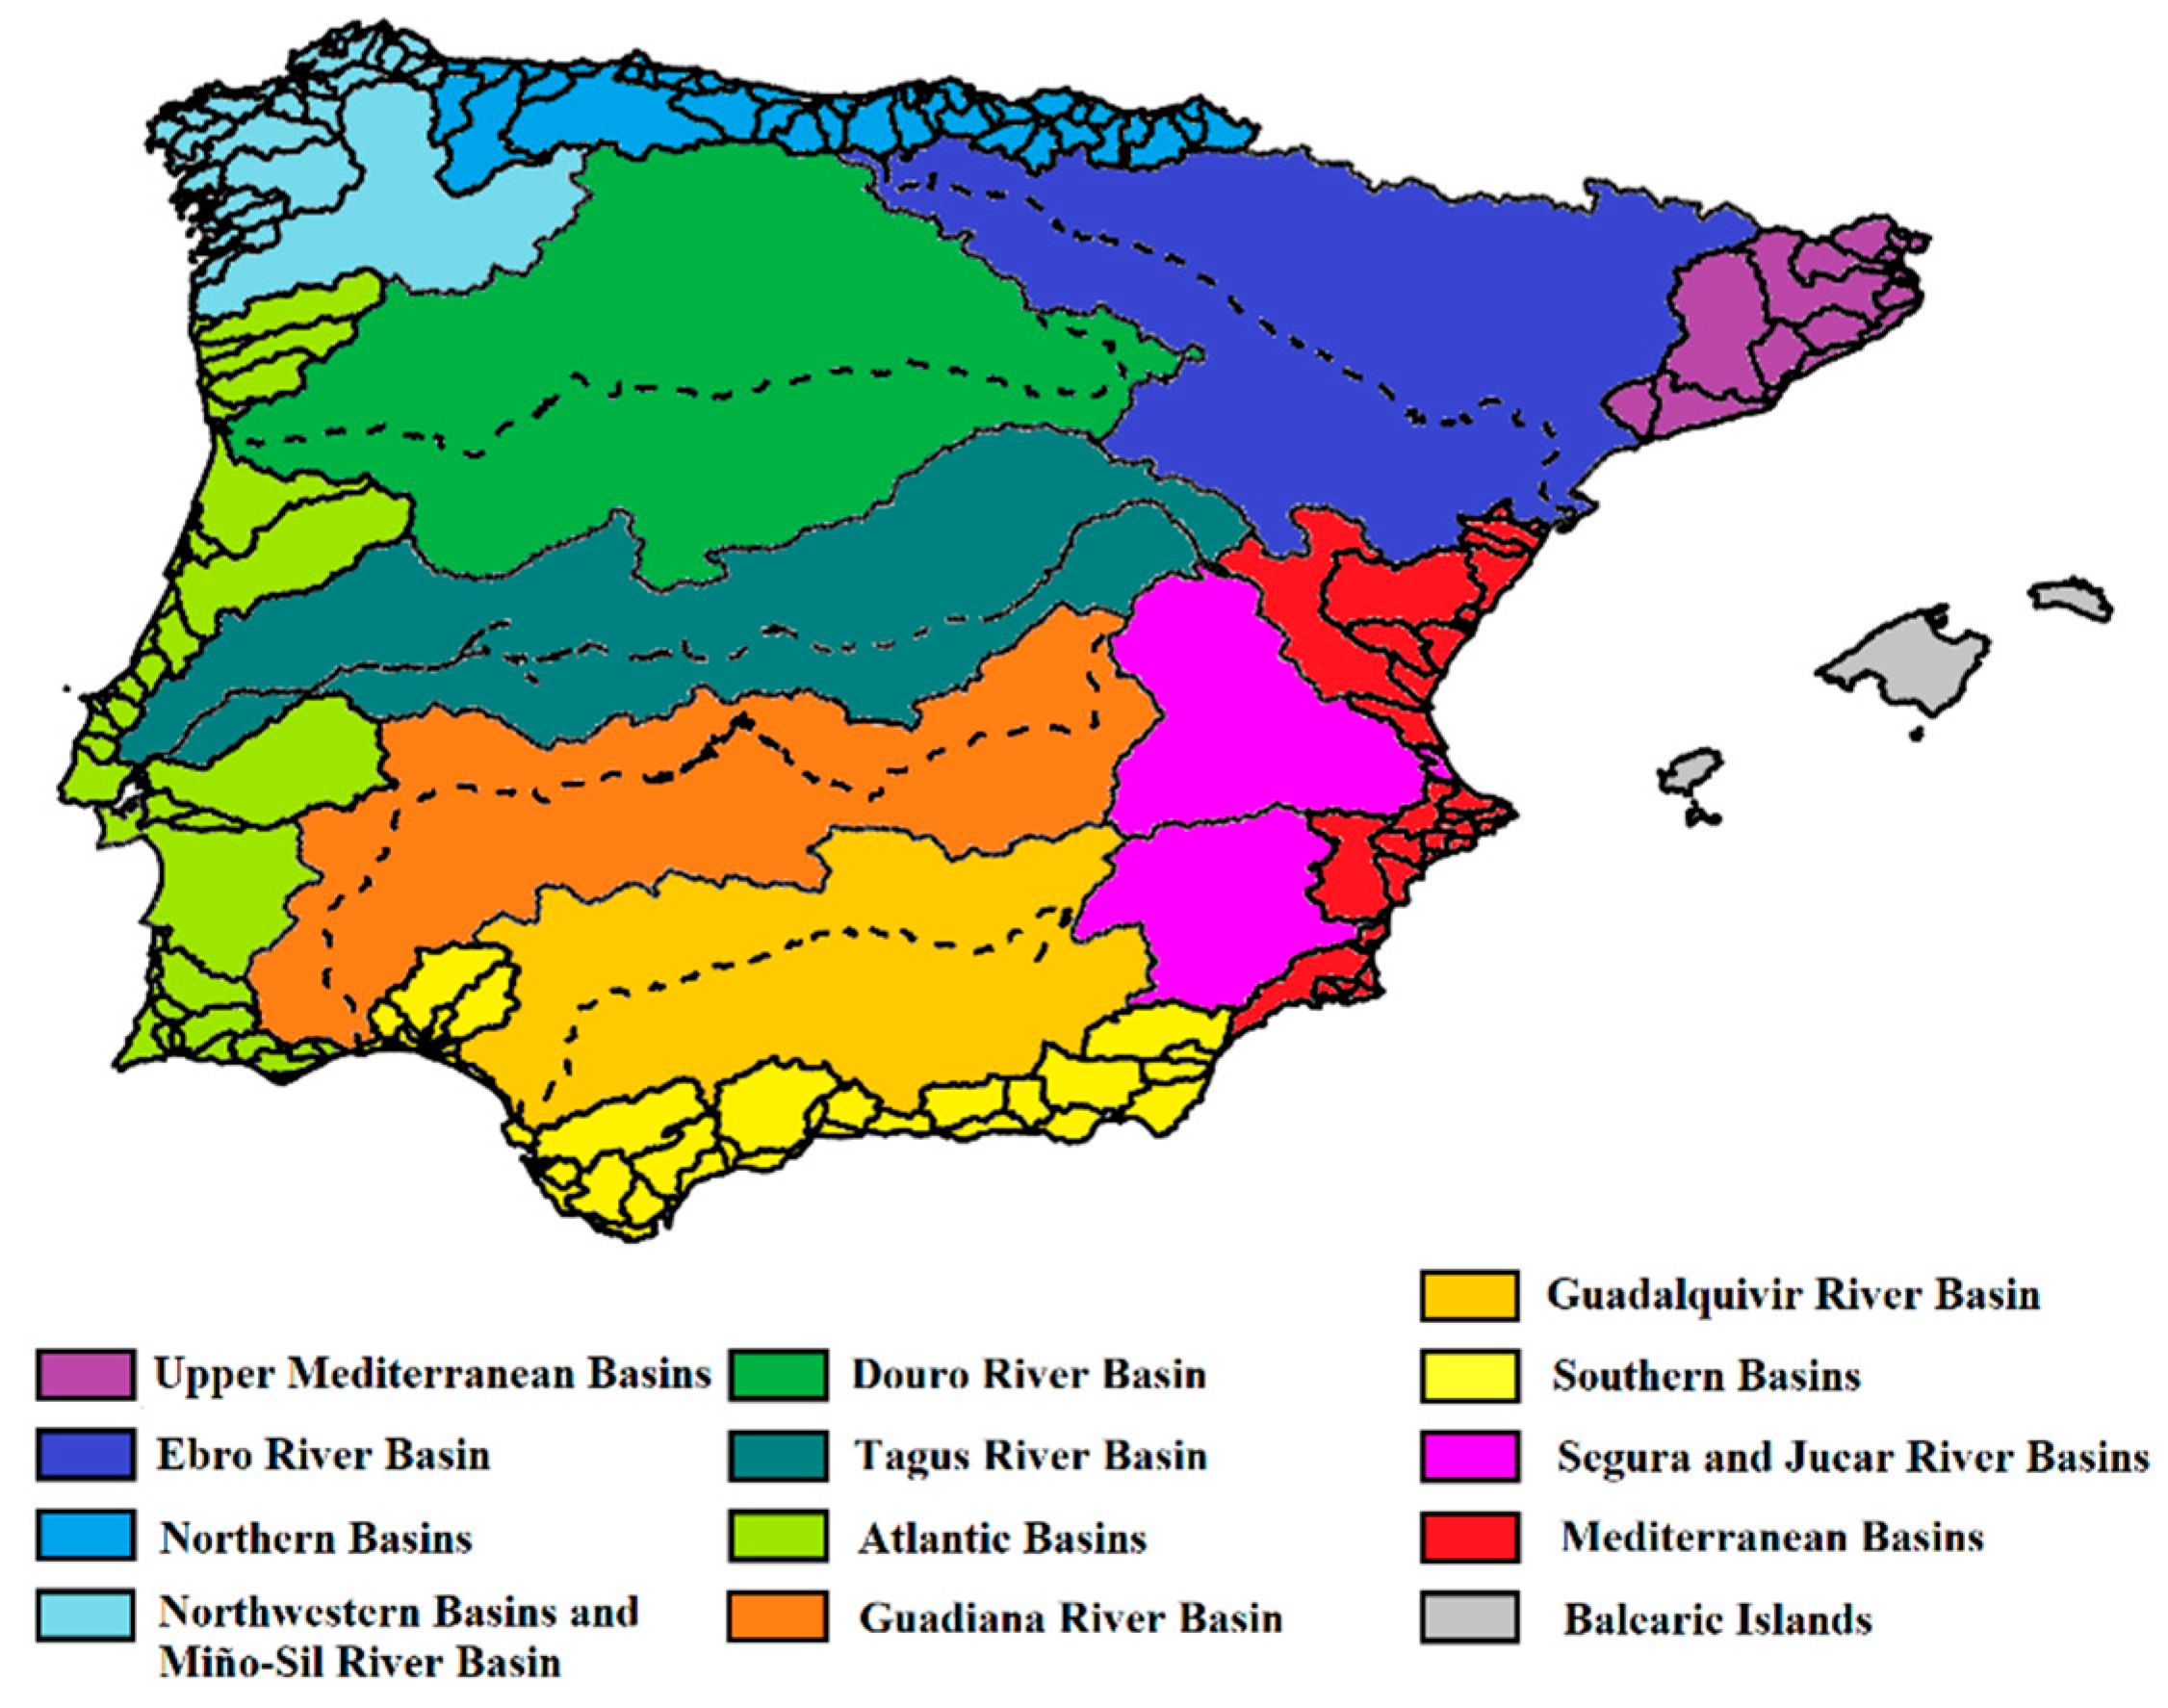
| Upper Mediterranean Basins | + | + | + | + | + | + | +/− | + | + | + | + | + | + | + | + | ||||||
| EbroRiver Basin | +/− | +/− | + | +/− | +/− | + | +/− | +/− | + | +/− | +/− | +/− | +/− | +/− | +/− | +/− | +/− | − | +/− | +/− | |
| Northern Basins | − | − | + | + | + | + | + | + | +/− | +/− | + | +/− | + | ||||||||
| Northwestern Basins and Miño-Sil River Basin | + | + | + | + | + | + | + | + | + | + | + | + | + | − | + | − | + | ||||
| Douro River Basin | + | + | + | + | + | + | + | + | + | + | +/− | + | + | +/− | + | +/− | +/− | + | +/− | +/− | + |
| Tagus River Basin | + | + | + | + | +/− | + | +/− | − | + | − | − | +/− | − | − | +/− | − | − | − | |||
| Atlantic Basins | + | + | +/− | + | +/− | + | − | − | |||||||||||||
| Guadiana River Basin | − | − | + | +/− | + | +/− | + | + | + | + | +/− | + | +/− | +/− | + | +/− | + | + | +/− | ||
| Guadalquivir River Basin | − | +/− | + | +/− | + | +/− | + | + | +/− | + | + | + | + | − | + | + | − | + | + | ||
| Southern Basins | − | − | − | − | − | − | − | +/− | − | − | − | − | − | − | − | − | |||||
| Segura and Jucar River Basins | − | +/− | +/− | − | + | + | − | + | + | − | + | + | + | + | +/− | + | +/− | − | + | +/− | |
| Mediterranean Basins | − | − | − | + | + | +/− | + | − | + | +/− | + | ||||||||||
| Balearic Islands | − | + | − | + | + | + | +/− | + | +/− | +/− | + | +/− | + | ||||||||
| RCP | 8.5 | ||||||||||||||||||||
|---|---|---|---|---|---|---|---|---|---|---|---|---|---|---|---|---|---|---|---|---|---|
| Return Period | 2 | 5 | 10 | 50 | 100 | 500 | 1000 | ||||||||||||||
| Future Time Interval | 11–40 | 41–70 | 71–95 | 11–40 | 41–70 | 71–95 | 11–40 | 41–70 | 71–95 | 11–40 | 41–70 | 71–95 | 11–40 | 41–70 | 71–95 | 11–40 | 41–70 | 71–95 | 11–40 | 41–70 | 71–95 |
| Upper Mediterranean Basins | + | + | + | + | + | + | + | + | + | + | + | + | + | + | +/− | + | + | + | + | ||
| EbroRiver Basin | +/− | + | +/− | +/− | + | + | +/− | + | + | +/− | + | + | +/− | + | +/− | +/− | +/− | +/− | − | +/− | +/− |
| Northern Basins | − | +/− | +/− | +/− | + | +/− | +/− | + | + | +/− | +/− | + | +/− | + | |||||||
| Northwestern Basins and Miño-Sil River Basin | + | + | + | + | + | + | + | + | + | +/− | + | + | +/− | + | + | +/− | +/− | + | +/− | +/− | + |
| Douro River Basin | + | + | + | + | + | + | + | + | + | + | + | + | + | + | + | +/− | +/− | + | + | +/− | + |
| Tagus River Basin | + | +/− | + | + | + | +/− | + | − | +/− | +/− | − | − | +/− | − | − | +/− | − | − | +/− | ||
| Atlantic Basins | +/− | +/− | +/− | +/− | +/− | + | + | +/− | + | + | + | + | − | + | + | − | + | ||||
| Guadiana River Basin | − | − | +/− | + | +/− | +/− | + | +/− | + | + | +/− | + | + | +/− | + | + | +/− | + | + | ||
| Guadalquivir River Basin | − | − | +/− | − | + | +/− | − | + | +/− | − | + | − | − | + | +/− | − | + | − | − | + | |
| Southern Basins | − | − | − | − | − | − | − | − | +/− | +/− | − | +/− | − | +/− | +/− | − | − | ||||
| Segura and Jucar River Basins | + | +/− | +/− | + | +/− | +/− | + | + | +/− | + | + | + | +/− | + | + | +/− | + | +/− | + | ||
| Mediterranean Basins | + | +/− | + | +/− | +/− | + | +/− | +/− | + | +/− | +/− | + | +/− | +/− | + | +/− | +/− | ||||
| Balearic Islands | + | − | + | + | + | + | + | + | +/− | + | + | +/− | + | + | +/− | + | + | + | + | ||
© 2019 by the authors. Licensee MDPI, Basel, Switzerland. This article is an open access article distributed under the terms and conditions of the Creative Commons Attribution (CC BY) license (http://creativecommons.org/licenses/by/4.0/).
Share and Cite
Garijo, C.; Mediero, L. Assessment of Changes in Annual Maximum Precipitations in the Iberian Peninsula under Climate Change. Water 2019, 11, 2375. https://doi.org/10.3390/w11112375
Garijo C, Mediero L. Assessment of Changes in Annual Maximum Precipitations in the Iberian Peninsula under Climate Change. Water. 2019; 11(11):2375. https://doi.org/10.3390/w11112375
Chicago/Turabian StyleGarijo, Carlos, and Luis Mediero. 2019. "Assessment of Changes in Annual Maximum Precipitations in the Iberian Peninsula under Climate Change" Water 11, no. 11: 2375. https://doi.org/10.3390/w11112375