1. Introduction
Heavy metal-containing water is a severe pollution issue that considerably affects the environment and animal and human health. Heavy metals can accumulate in the food chain and cause major human health problems if not managed and treated properly. Kim et al. classified heavy metals into two groups based on their toxicity: essential and non-essential heavy metals [
1]. Essential heavy metals including Cu, Fe, Co, and Zn are relatively less toxic at low concentration levels. They can act as cofactors in different biochemical and physiological functions in living organisms; however, they become toxic if they exceed the threshold level [
2]. On the other hand, non-essential heavy metals including Pb, Cd, Hg, and As are highly toxic and can be lethal even at low concentrations. Heavy metals severely affect the human nervous system and can cause headache, hypertension, fatigue, anaemia, and even cancer [
3,
4]. Lead and Cu(II) are listed on the United States Environmental Protection Agency (USEPA) priority control pollutants list due to their persistence and irreversible toxic characteristics [
1]. Rapid industrialisation increases the levels of heavy metal contamination in the environment [
5,
6]. Heavy metals are discharged from various industries such as those involving petroleum, mining, and electroplating (
Table 1). If untreated, heavy metals can accumulate in the receiving environment and directly or indirectly enter the food chain [
2,
7,
8]. According to the USEPA, the allowable levels of Pb(II) and Cu(II) in drinking water are 0.015 and 1.3 mg/L, respectively [
9].
Different methods, such as ion exchange, chemical precipitation, membrane filtration, coagulation, and flocculation, have been used for removal of heavy metals from wastewater. These methods are either ineffective or expensive when heavy metals are present in low concentrations. Other limitations of such methods are the complexity of the operation and large area requirement [
10]. Adsorption is considered as an effective and economic removal method for heavy metals in wastewater treatment. It offers simplicity and flexibility in both operation and design [
6,
11,
12,
13]. The utilization of biomaterials has many advantages over conventional methods, including low cost, minimization of chemical or biological sludge, the possibility of metal recovery, and the ability to regenerate bio sorbents [
14]. A variety of adsorbents, like graphene oxide [
15], the metal organic framework [
15], zeolites [
16,
17], activated biochar [
18], MXenes [
19], carbon nanotubes [
20], and activated carbon [
21], etc., have been reported for the removal of heavy metals from aqueous solutions. However, it should be noted that compared to agricultural-based biosorbents, these adsorbents are often expensive. Biosorption of heavy metals is an alternative economical method [
22,
23]. The criteria for selection of the ideal biosorbent should include its availability, non-toxicity, cost, metal-binding capacity, and regeneration [
24]. Biosorbents that require minimal processing or are abundant in nature are considered low-cost materials [
25].
Macroalga biomass can potentially stabilise heavy metals due to their small uniform particle size and presence of different metal binding sites on their cell walls [
26,
27,
28,
29,
30]. Red macroalgae (
Gracilaria changii) are abundant in the coastal areas of Oceania, Africa, and Asia [
31]. This seaweed species is the most abundant macroalgae in Malaysia [
32,
33,
34]. The utilisation of such a biomass resource would provide a sustainable way to control biomass degradation in the environment and thus reduce the related eutrophication problem in the oceans [
35]. This study aims to examine and optimise the performance of red macroalgae for the adsorption of Pb(II) and Cu(II) from aqueous solution through batch equilibrium procedure and response surface methodology (RSM).
RSM is a well-recognised mathematical and statistical tool that can be used to evaluate the effects of different factors on a response of interest. RSM is a powerful tool that measures regional optimal responses by using a sequence of designed experiments [
36]. In general, several steps are followed to implement RSM, starting with the selection of independent variables that significantly affect the desired response. The next step is to select an experimental design and conduct the experiments. The third step is to statistically analyse the obtained data and fit them to a polynomial function. The fourth step is to evaluate the model’s fit and finally determine the optimum values. RSM can be used to reduce the number of tests needed to find the optimum conditions. RSM consists of mathematical and statistical techniques based on fitting the experimental data with the empirical models. Central composite design (CCD) is the most commonly used experimental design performed within the experiment range [
36,
37]. The present study investigated the effects of four different adsorption factors, namely solution pH, initial metal ion, contact time, and biosorbent dosage, on removal of Pb(II) and Cu(II) ions. RSM was utilised to optimise the effects of initial metal ion, contact time, and biosorbent dosage on the biosorption process.
2. Materials and Methods
2.1. Collection, Purification, and Preparation of Red Alga Biomass
Red algae were collected from the Fishery Department of Langkawi. The biomass was washed repeatedly with tap water to remove any trapped impurities and rinsed with distilled water for additional purity. The washed biomass was sun dried for 2 days and oven dried at 70 °C for 24 h. The dried algae were ground using a mill (FRITSCH cutting mill combination PULVERISETTE 25/19) (FRITSCH, Pittsboro, North Carolina, NC, USA). The obtained powder was sieved within the range of 0.15–0.30 mm and stored in airtight bottle.
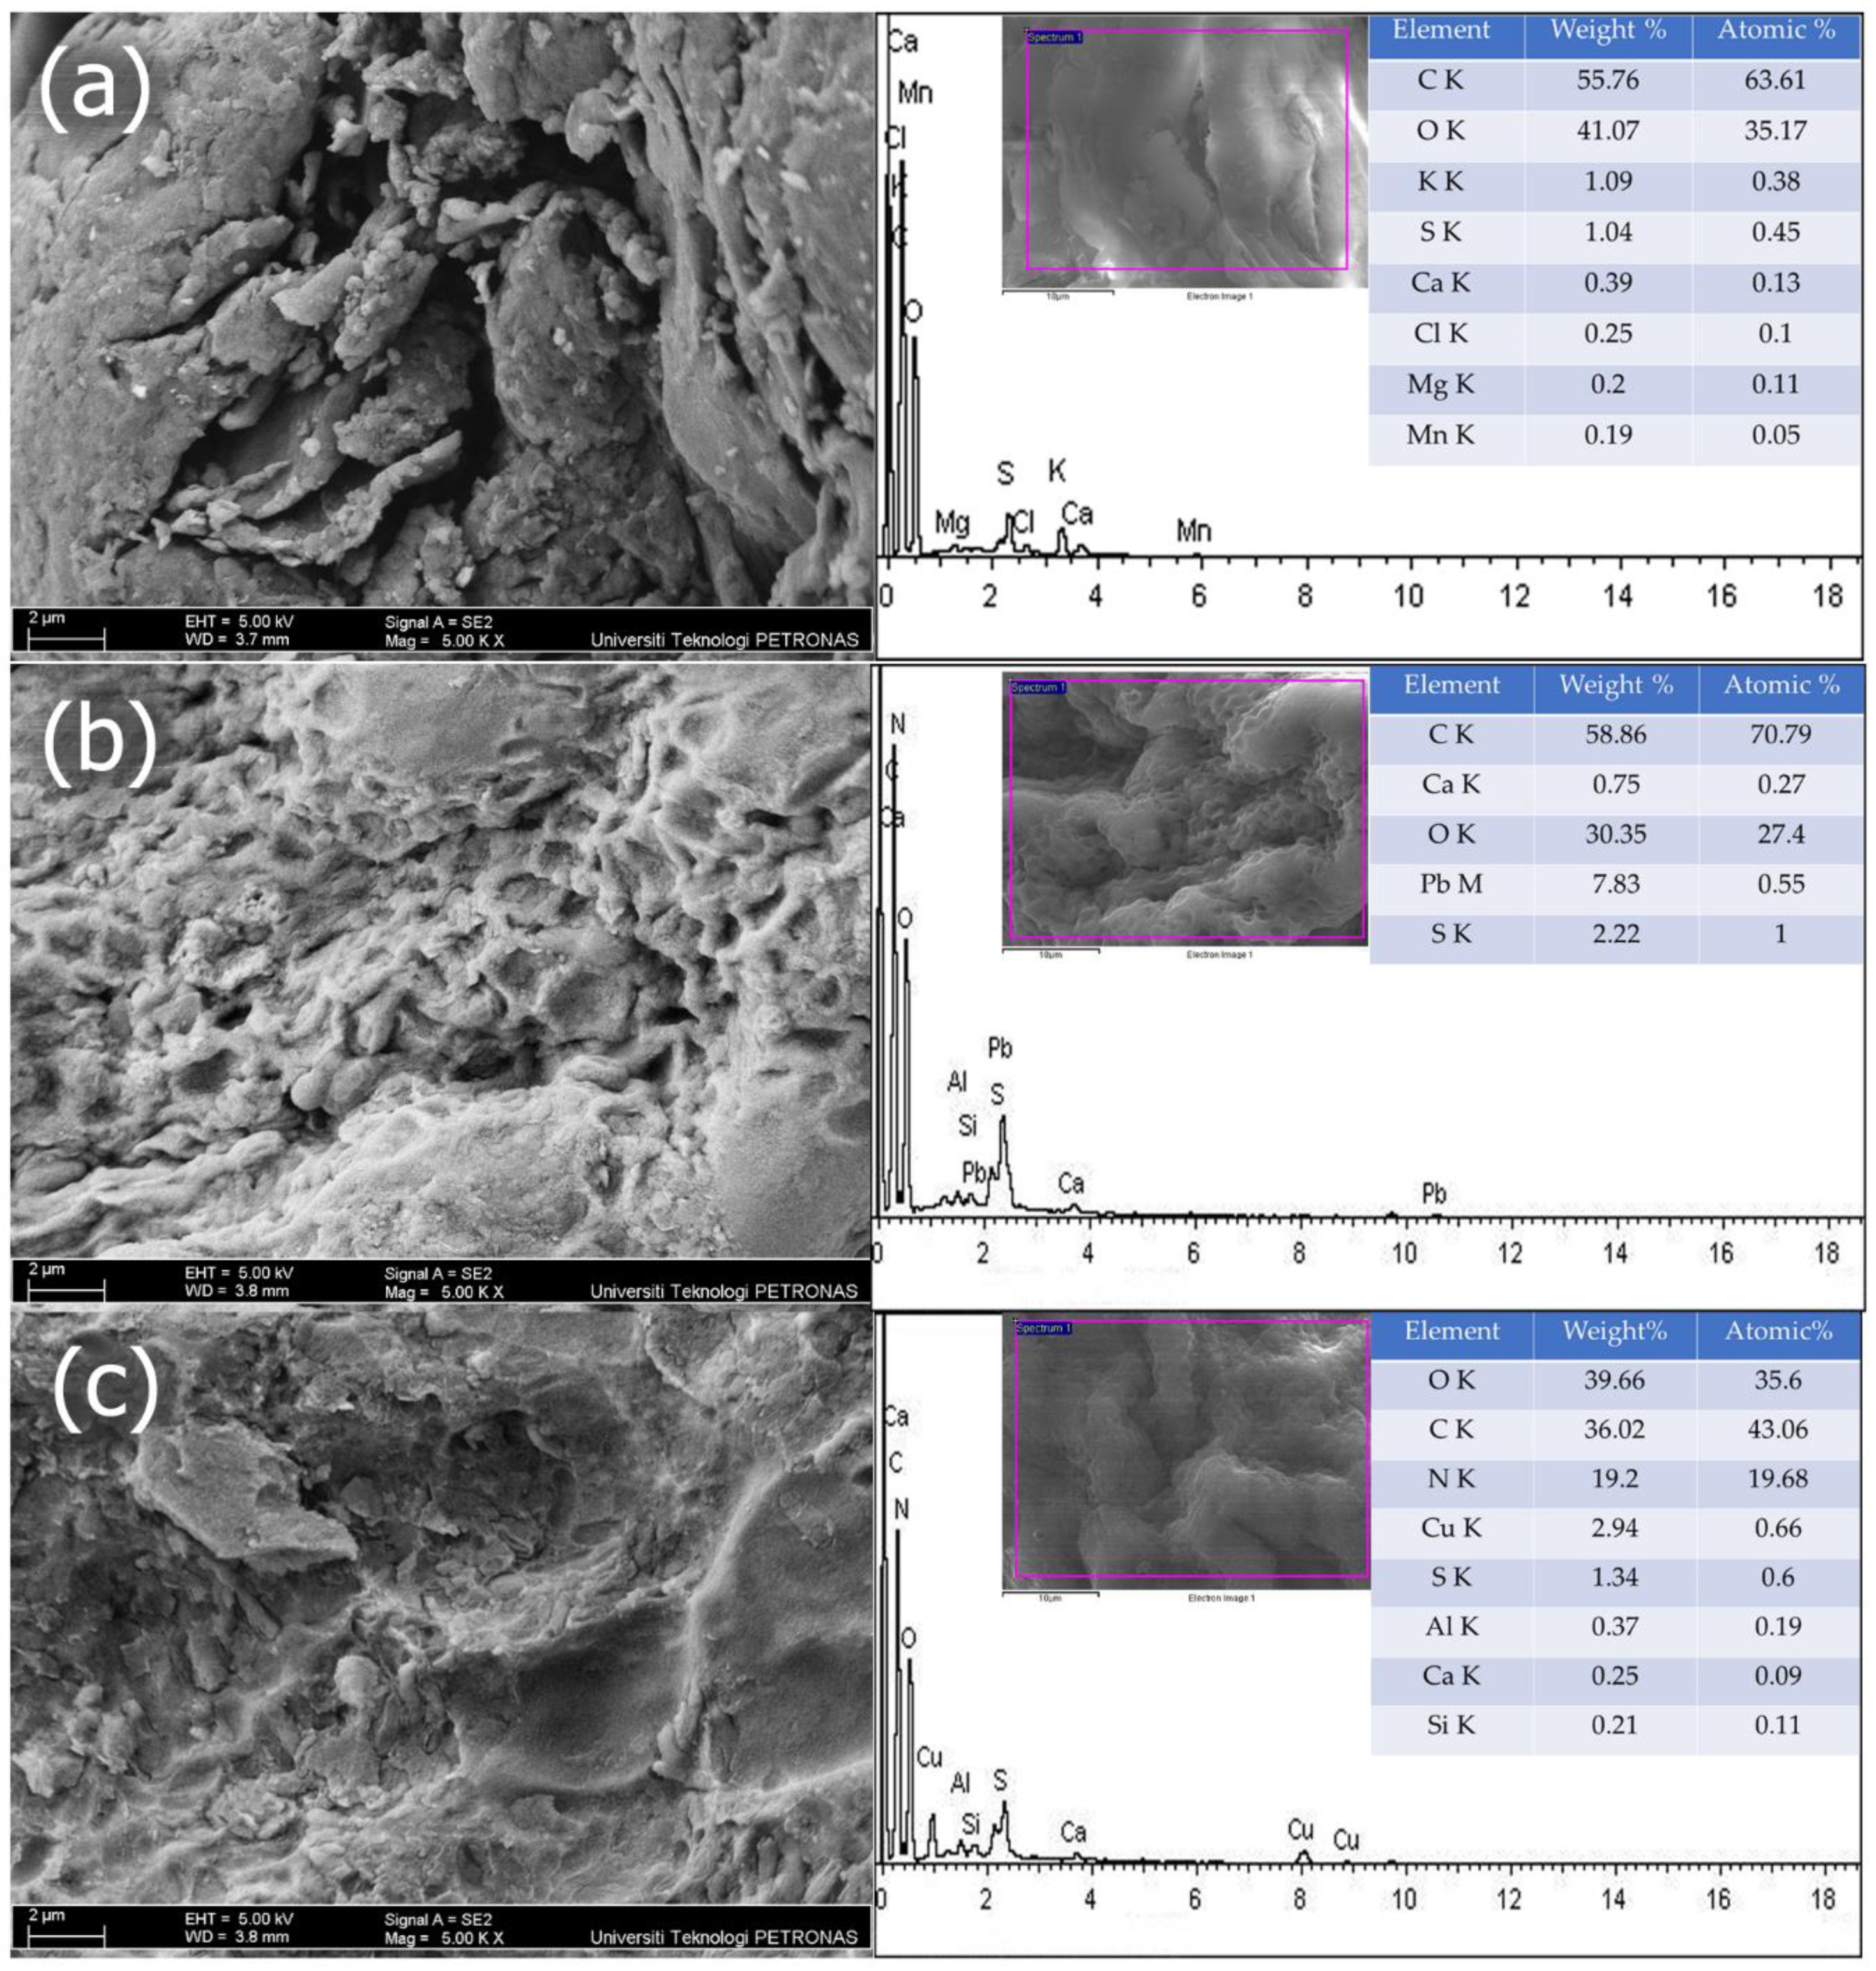
2.2. Alga Biomass Characterisation
Field-emission scanning electron microscopy with energy-dispersive X-ray (FESEM-EDX) spectroscopy (Carl-Zeiss AG, Oberkochen, Germany) was used to study the surface morphology of the biosorbent and its component. The biosorbent was subjected to analysis by the instrument before and after the biosorption of Pb(II) and Cu(II).
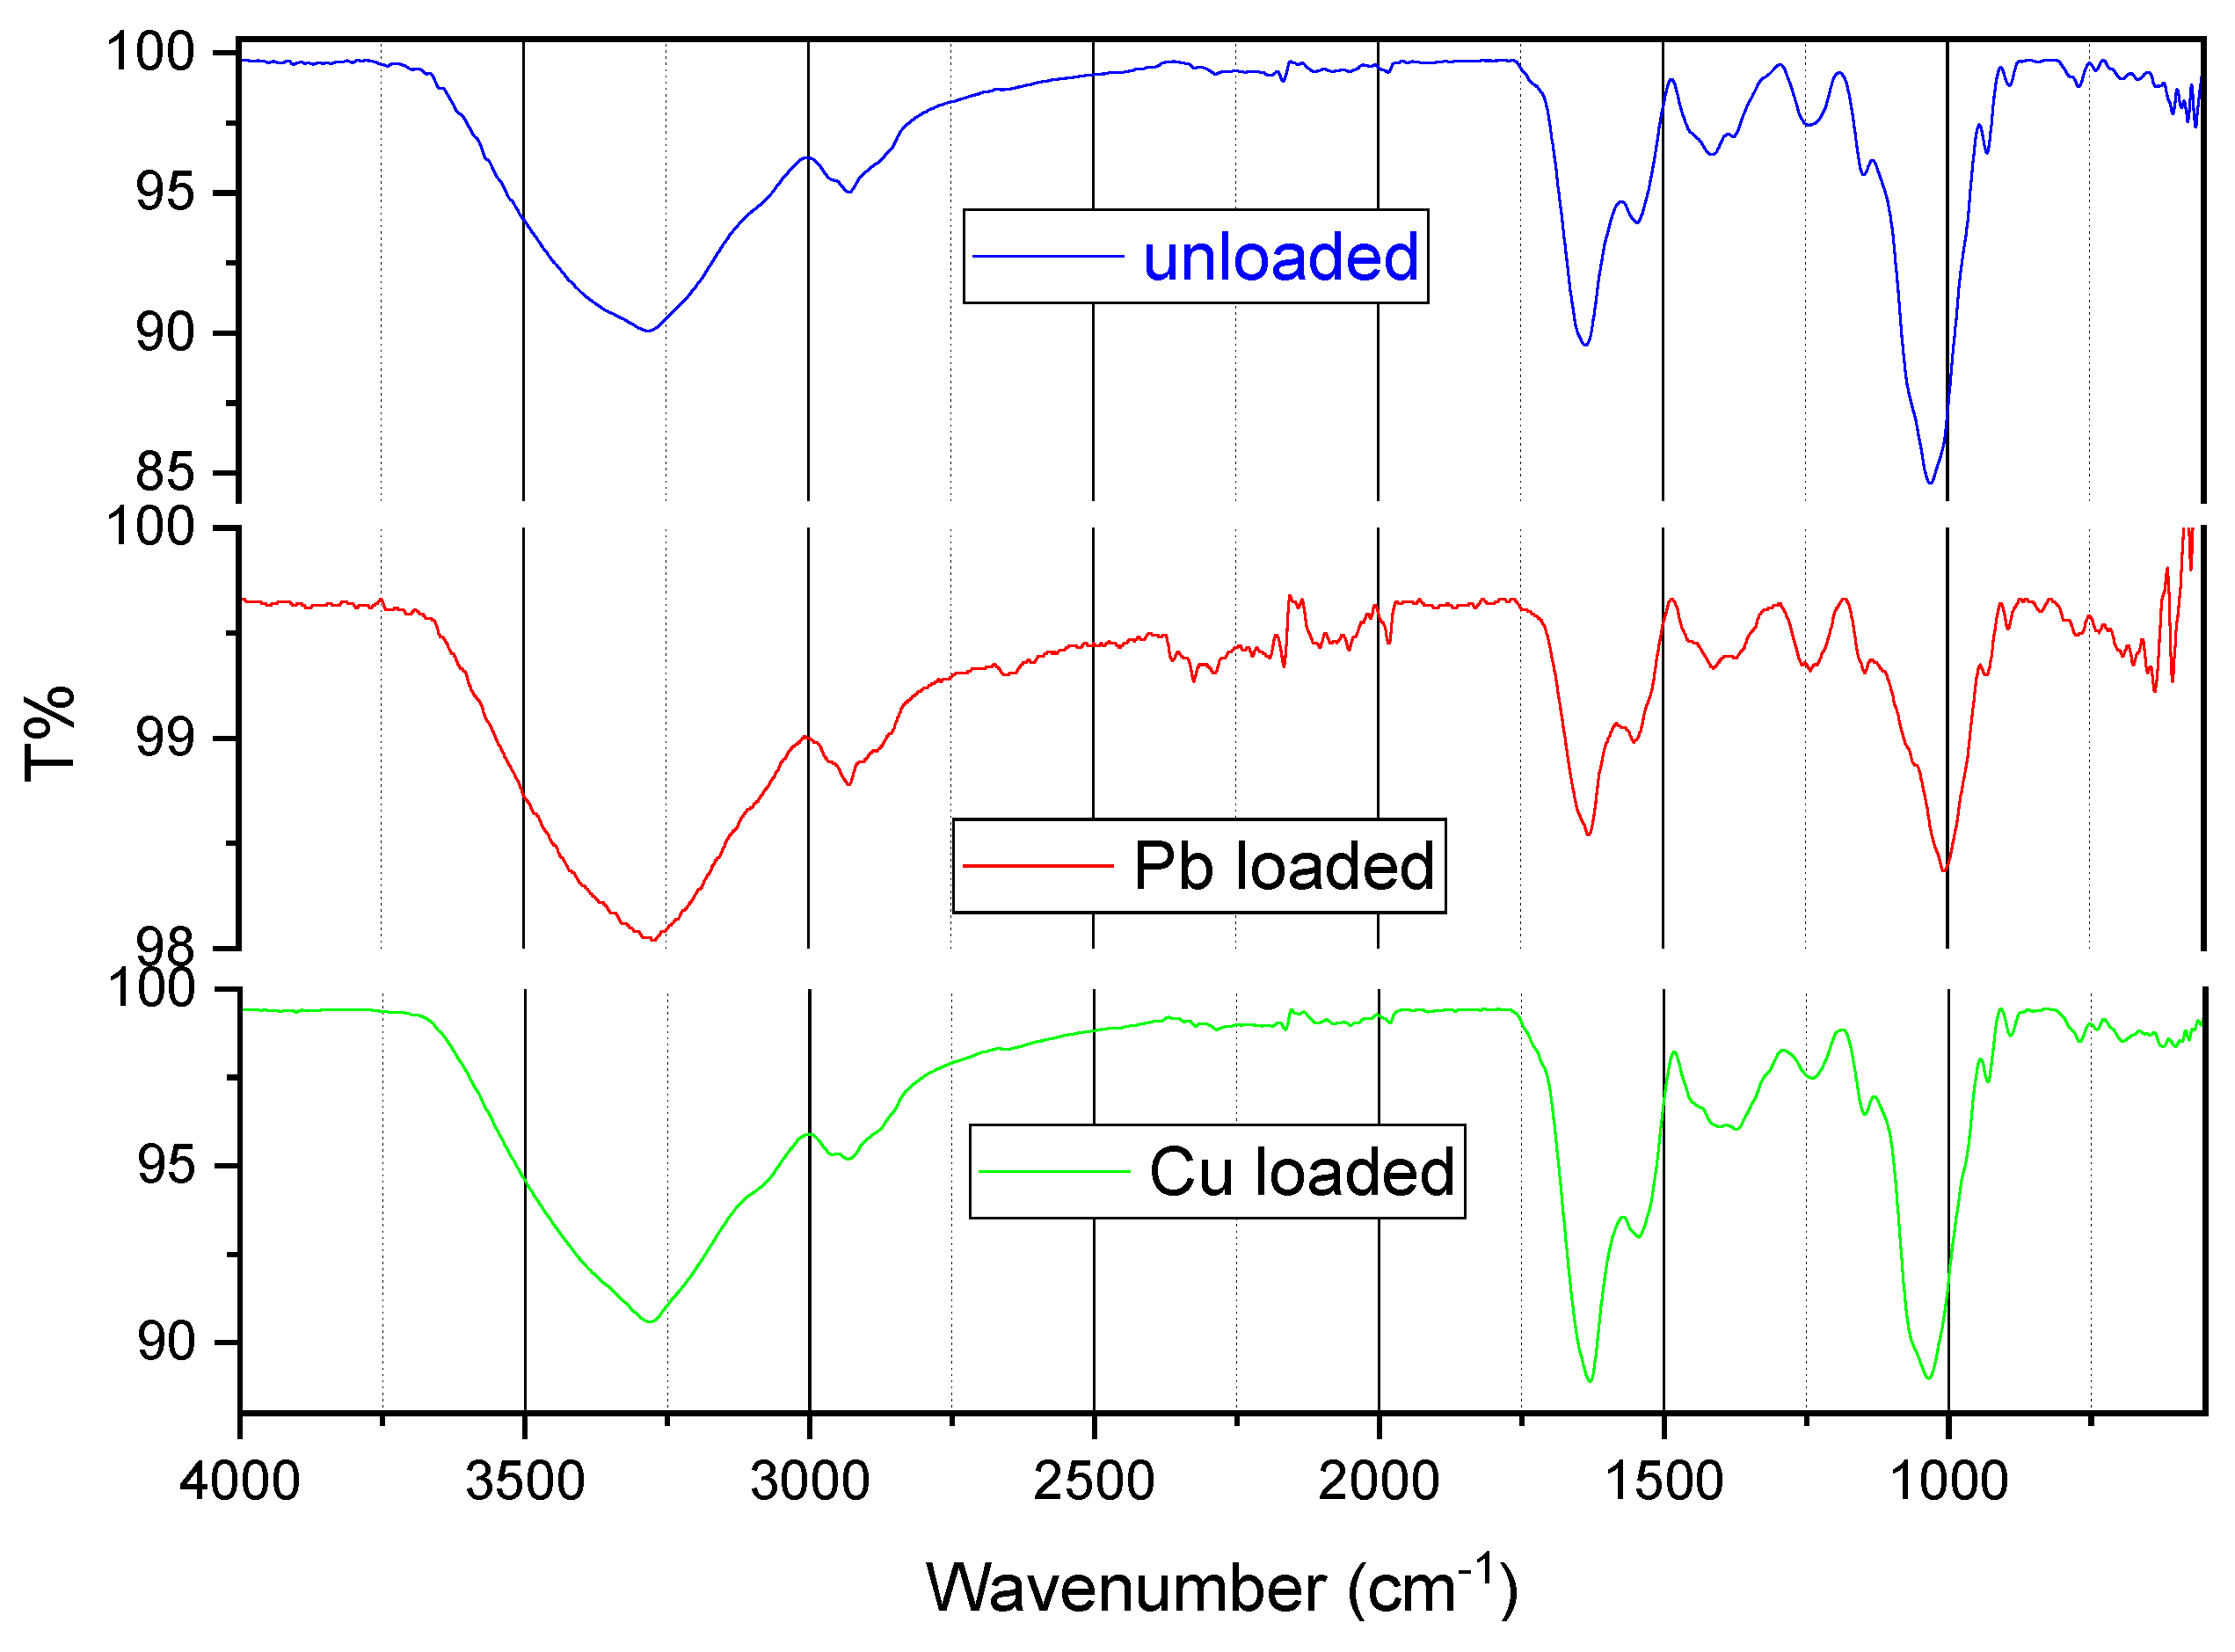
Fourier transform infrared (FTIR) spectroscopy (Perkin – Elmer, Waltham, Massachusetts, MA, USA) was used to detect changes in the vibration frequency in the biosorbent before and after biosorption. Infrared spectra were recorded within the range of 550–4000 cm−1. The spectral data were processed using Essential FTIR v3.5 (Operant LLC, Madison, Wisconsin, WI, USA).
2.3. Preparation of Synthetic Solution
Stock solutions of metals (1000 mg/L) were prepared by dissolving 1.598 g of Pb(NO3)2 or 3.802 g of Cu(NO3)2∙3H2O in 1 L of distilled water. The stock solutions were diluted to obtain different concentrations.
2.4. Batch Biosorption Experiment
All adsorption tests were carried out in 250 mL conical flasks containing 100 mL of each Pb(II) and Cu(II) solution. The tests were conducted by varying four factors, namely, pH (2–7), initial concentration (10, 40, 70, 100, and 130 mg/L), contact time (10, 45, 80, 115 and 150 min), and biomass dosage (0.1, 0.4, 0.7, 1, and 1.3 g/L), on metal biosorption. All the samples were agitated at 180 rpm at room temperature in orbital shaker (Protech model 722). Samples were collected at the predetermined interval and filtered through filter paper (Whatman No.1, 0.45
µm). The filtrates were examined for metal ion concentration by using flame atomic absorption spectrophotometer (AAS) model (Agilent 200 series AA systems, 240FS AA, Agilent technologies, Santa Clara, California, CA, USA). A similar procedure proposed by Lingamdinne was conducted for removal of metal ions [
38]. The experiments were conducted in triplicate to increase the precision and minimise error. Removal percentage was calculated using Equation (1) [
39]:
where
C0 and
Cf are the initial and final metal ion concentrations, respectively.
2.5. Design of Experiment
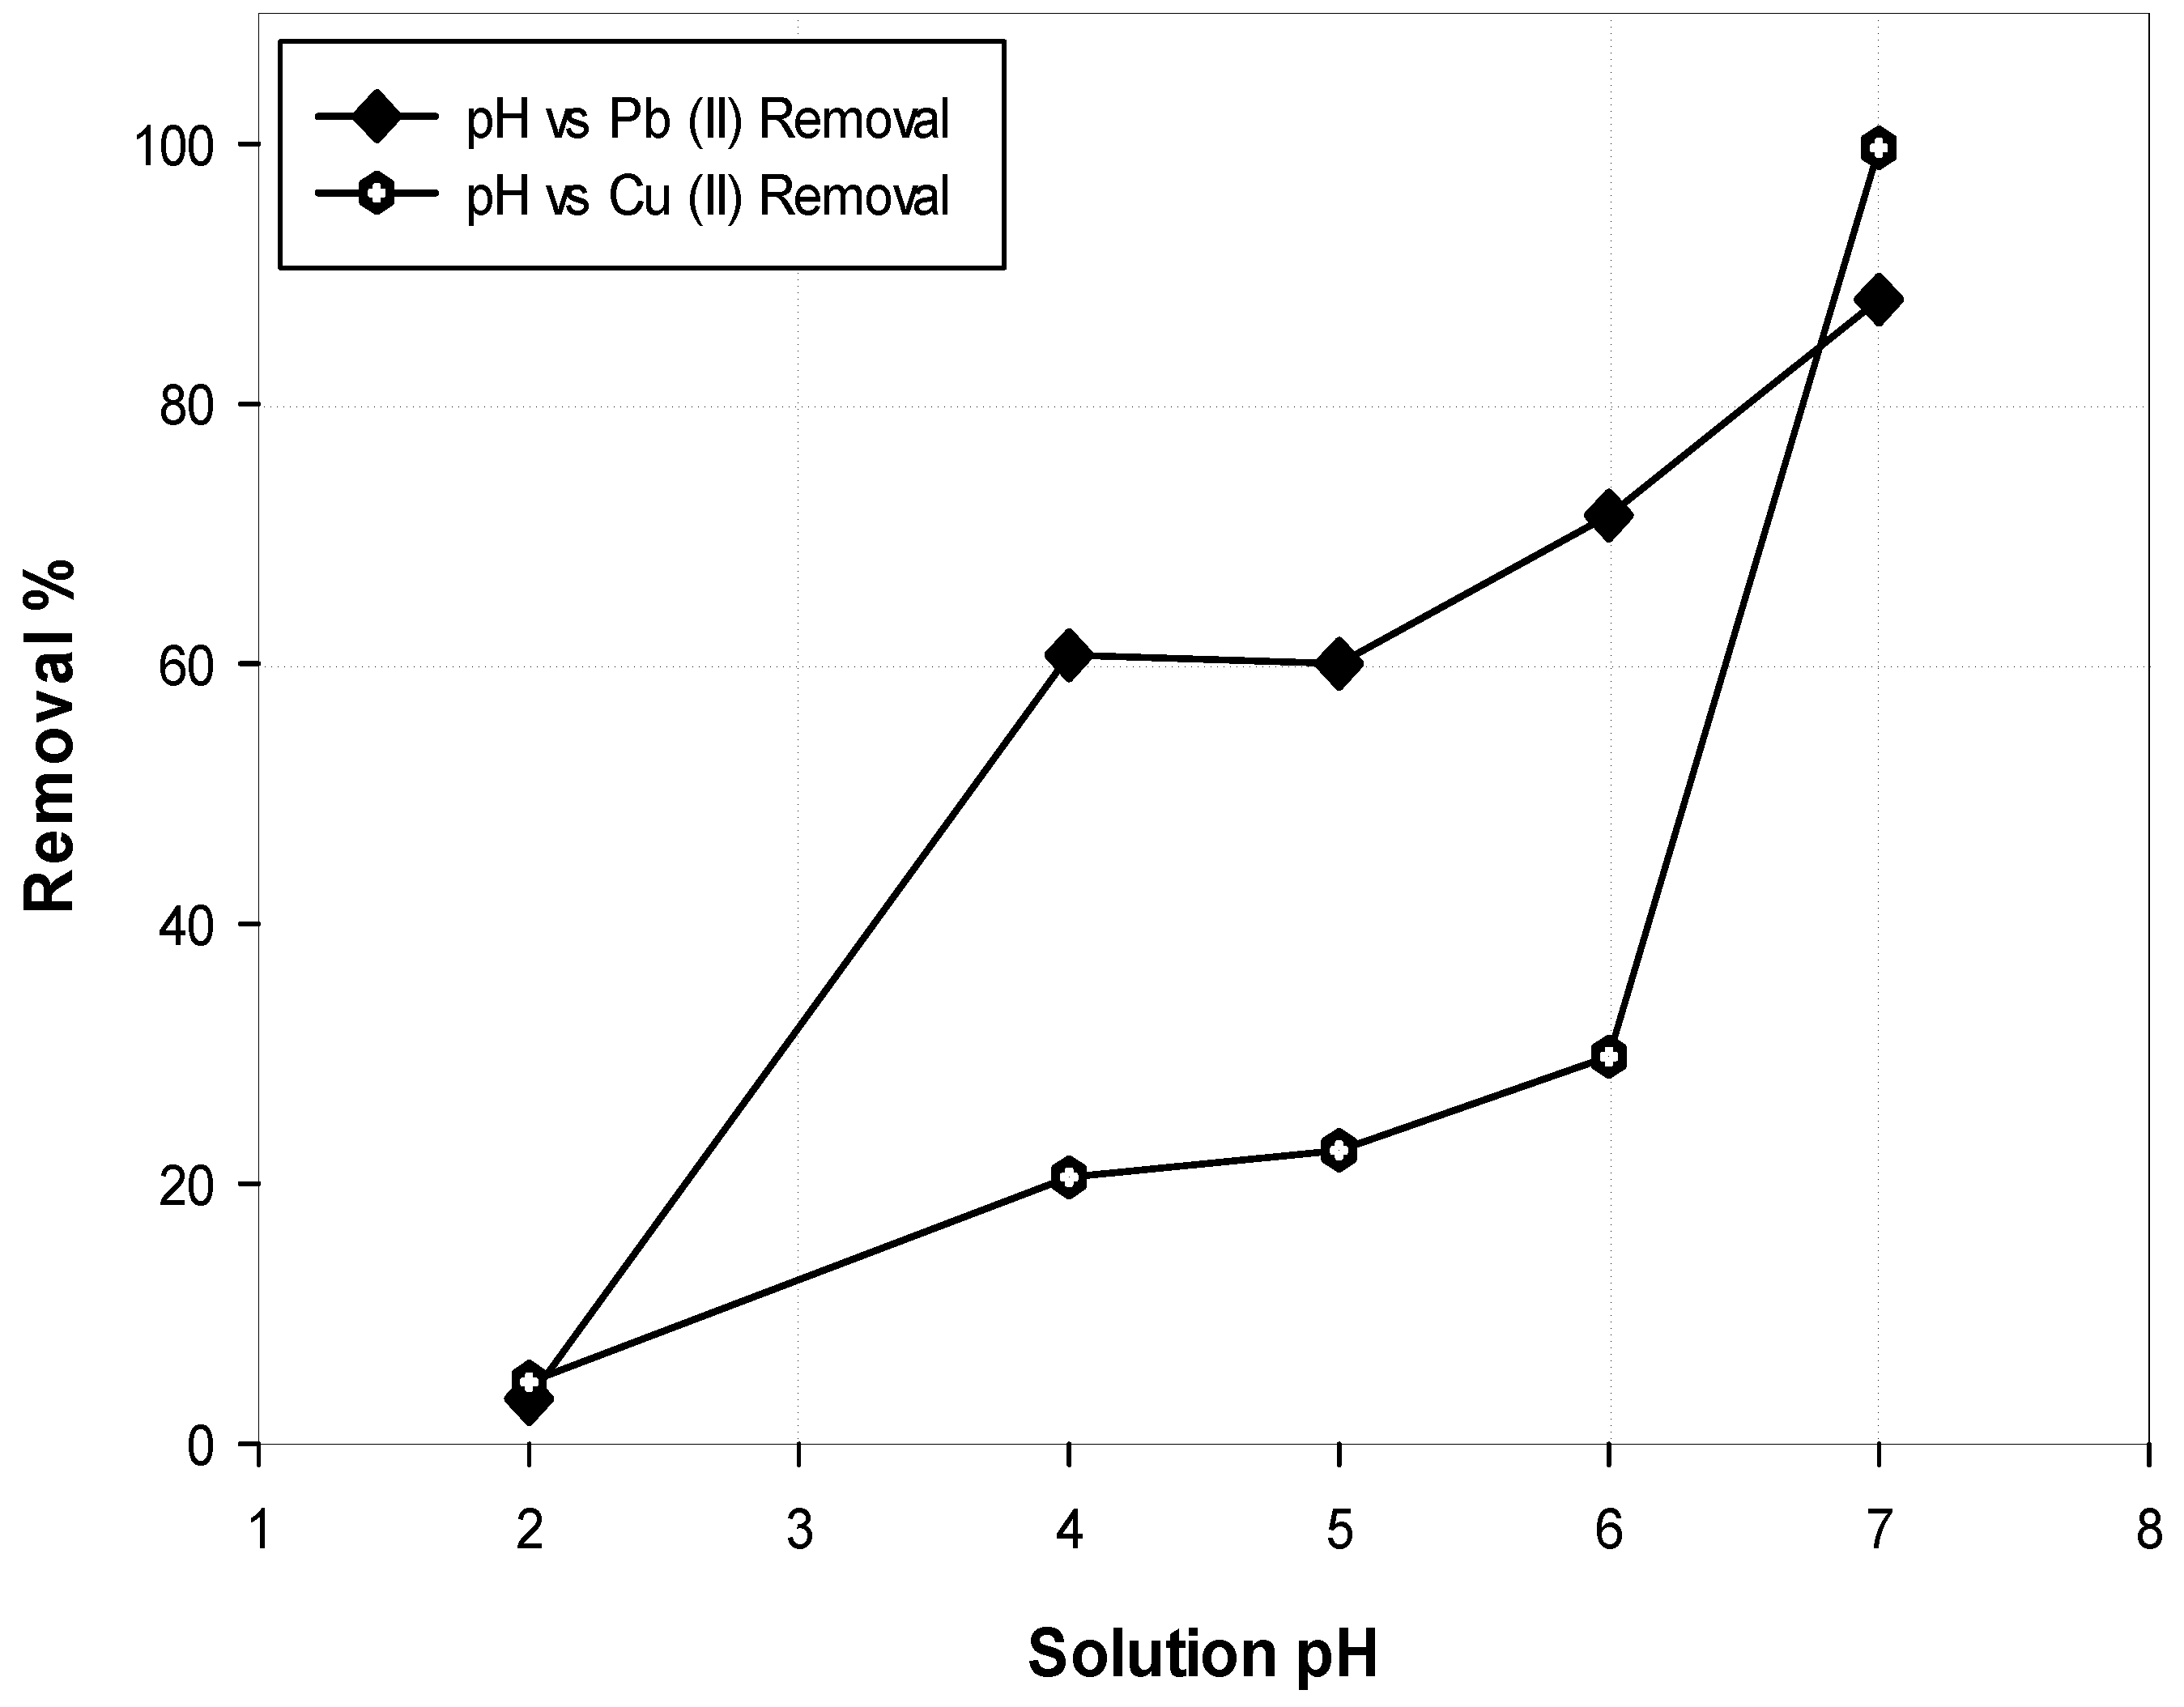
2.5.1. Effect of Solution pH
The effect of solution pH on the removal of metal ions was investigated by varying the pH within 2–7 while maintaining the ion concentration, contact time and dosage at 100 mg/L, 120 min and 1 g/L, respectively. The solution pH was adjusted by adding NaOH and HCl solutions. After shaking, the samples were filtered and examined using AAS.
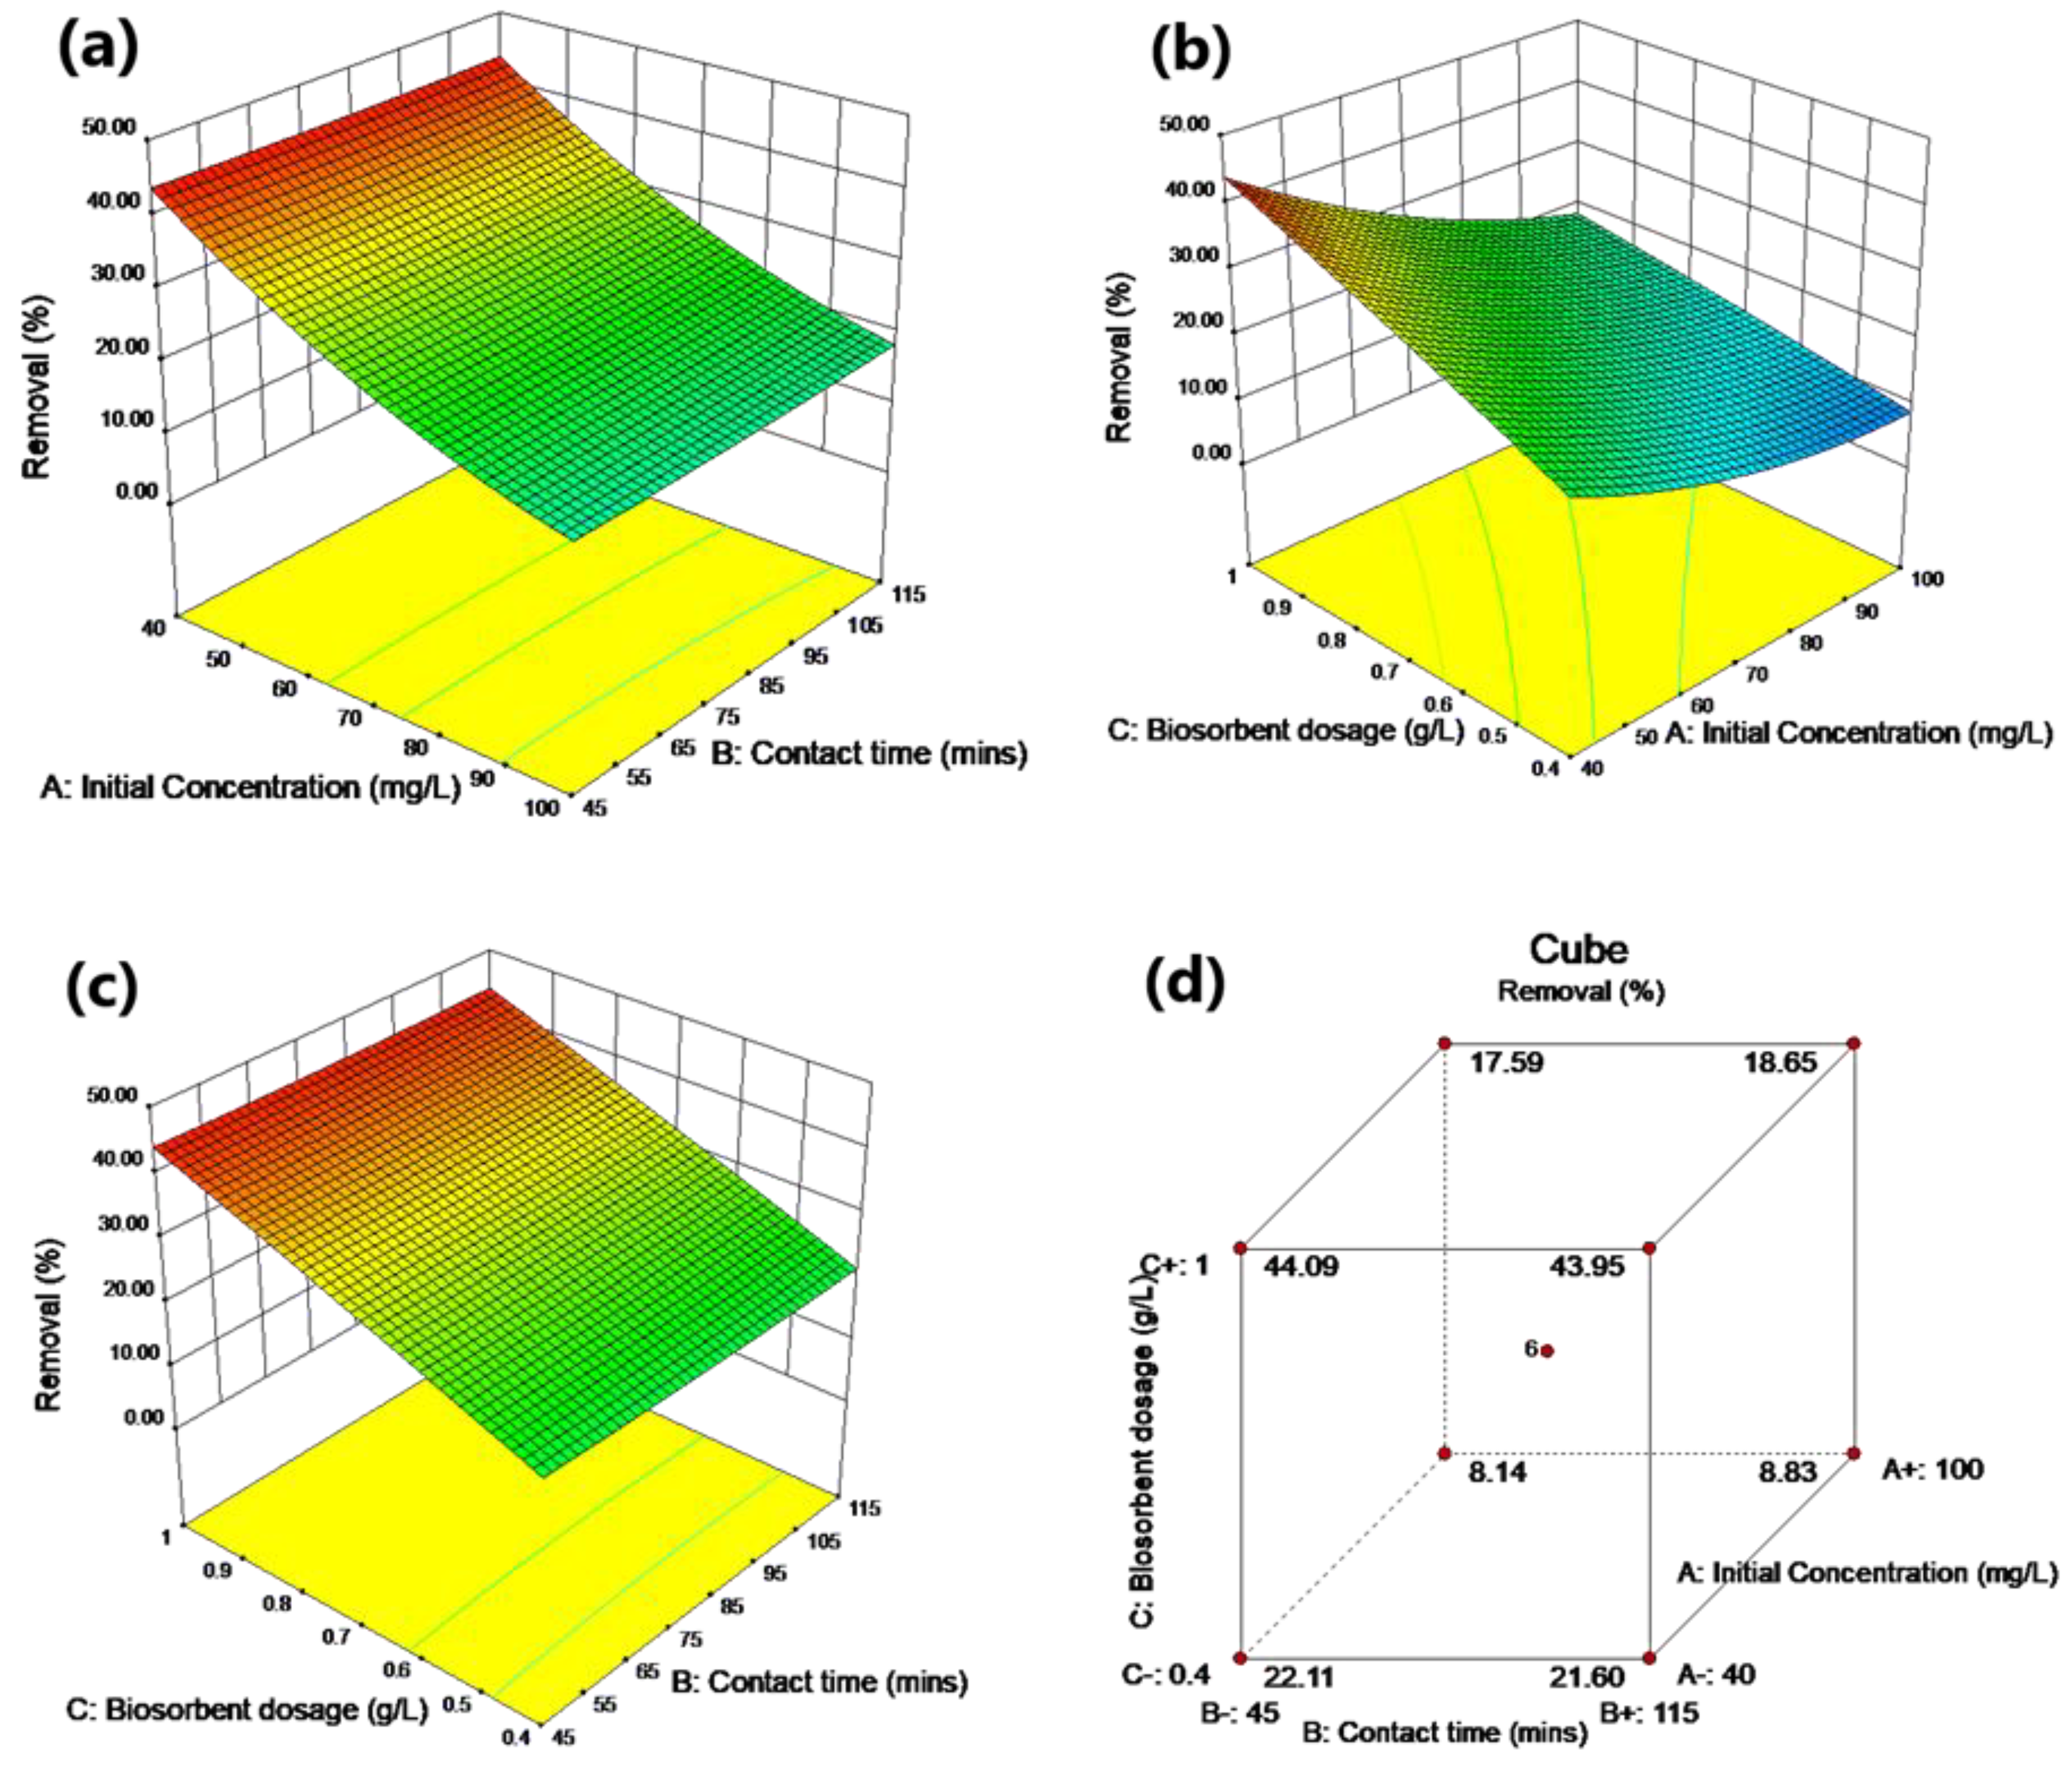
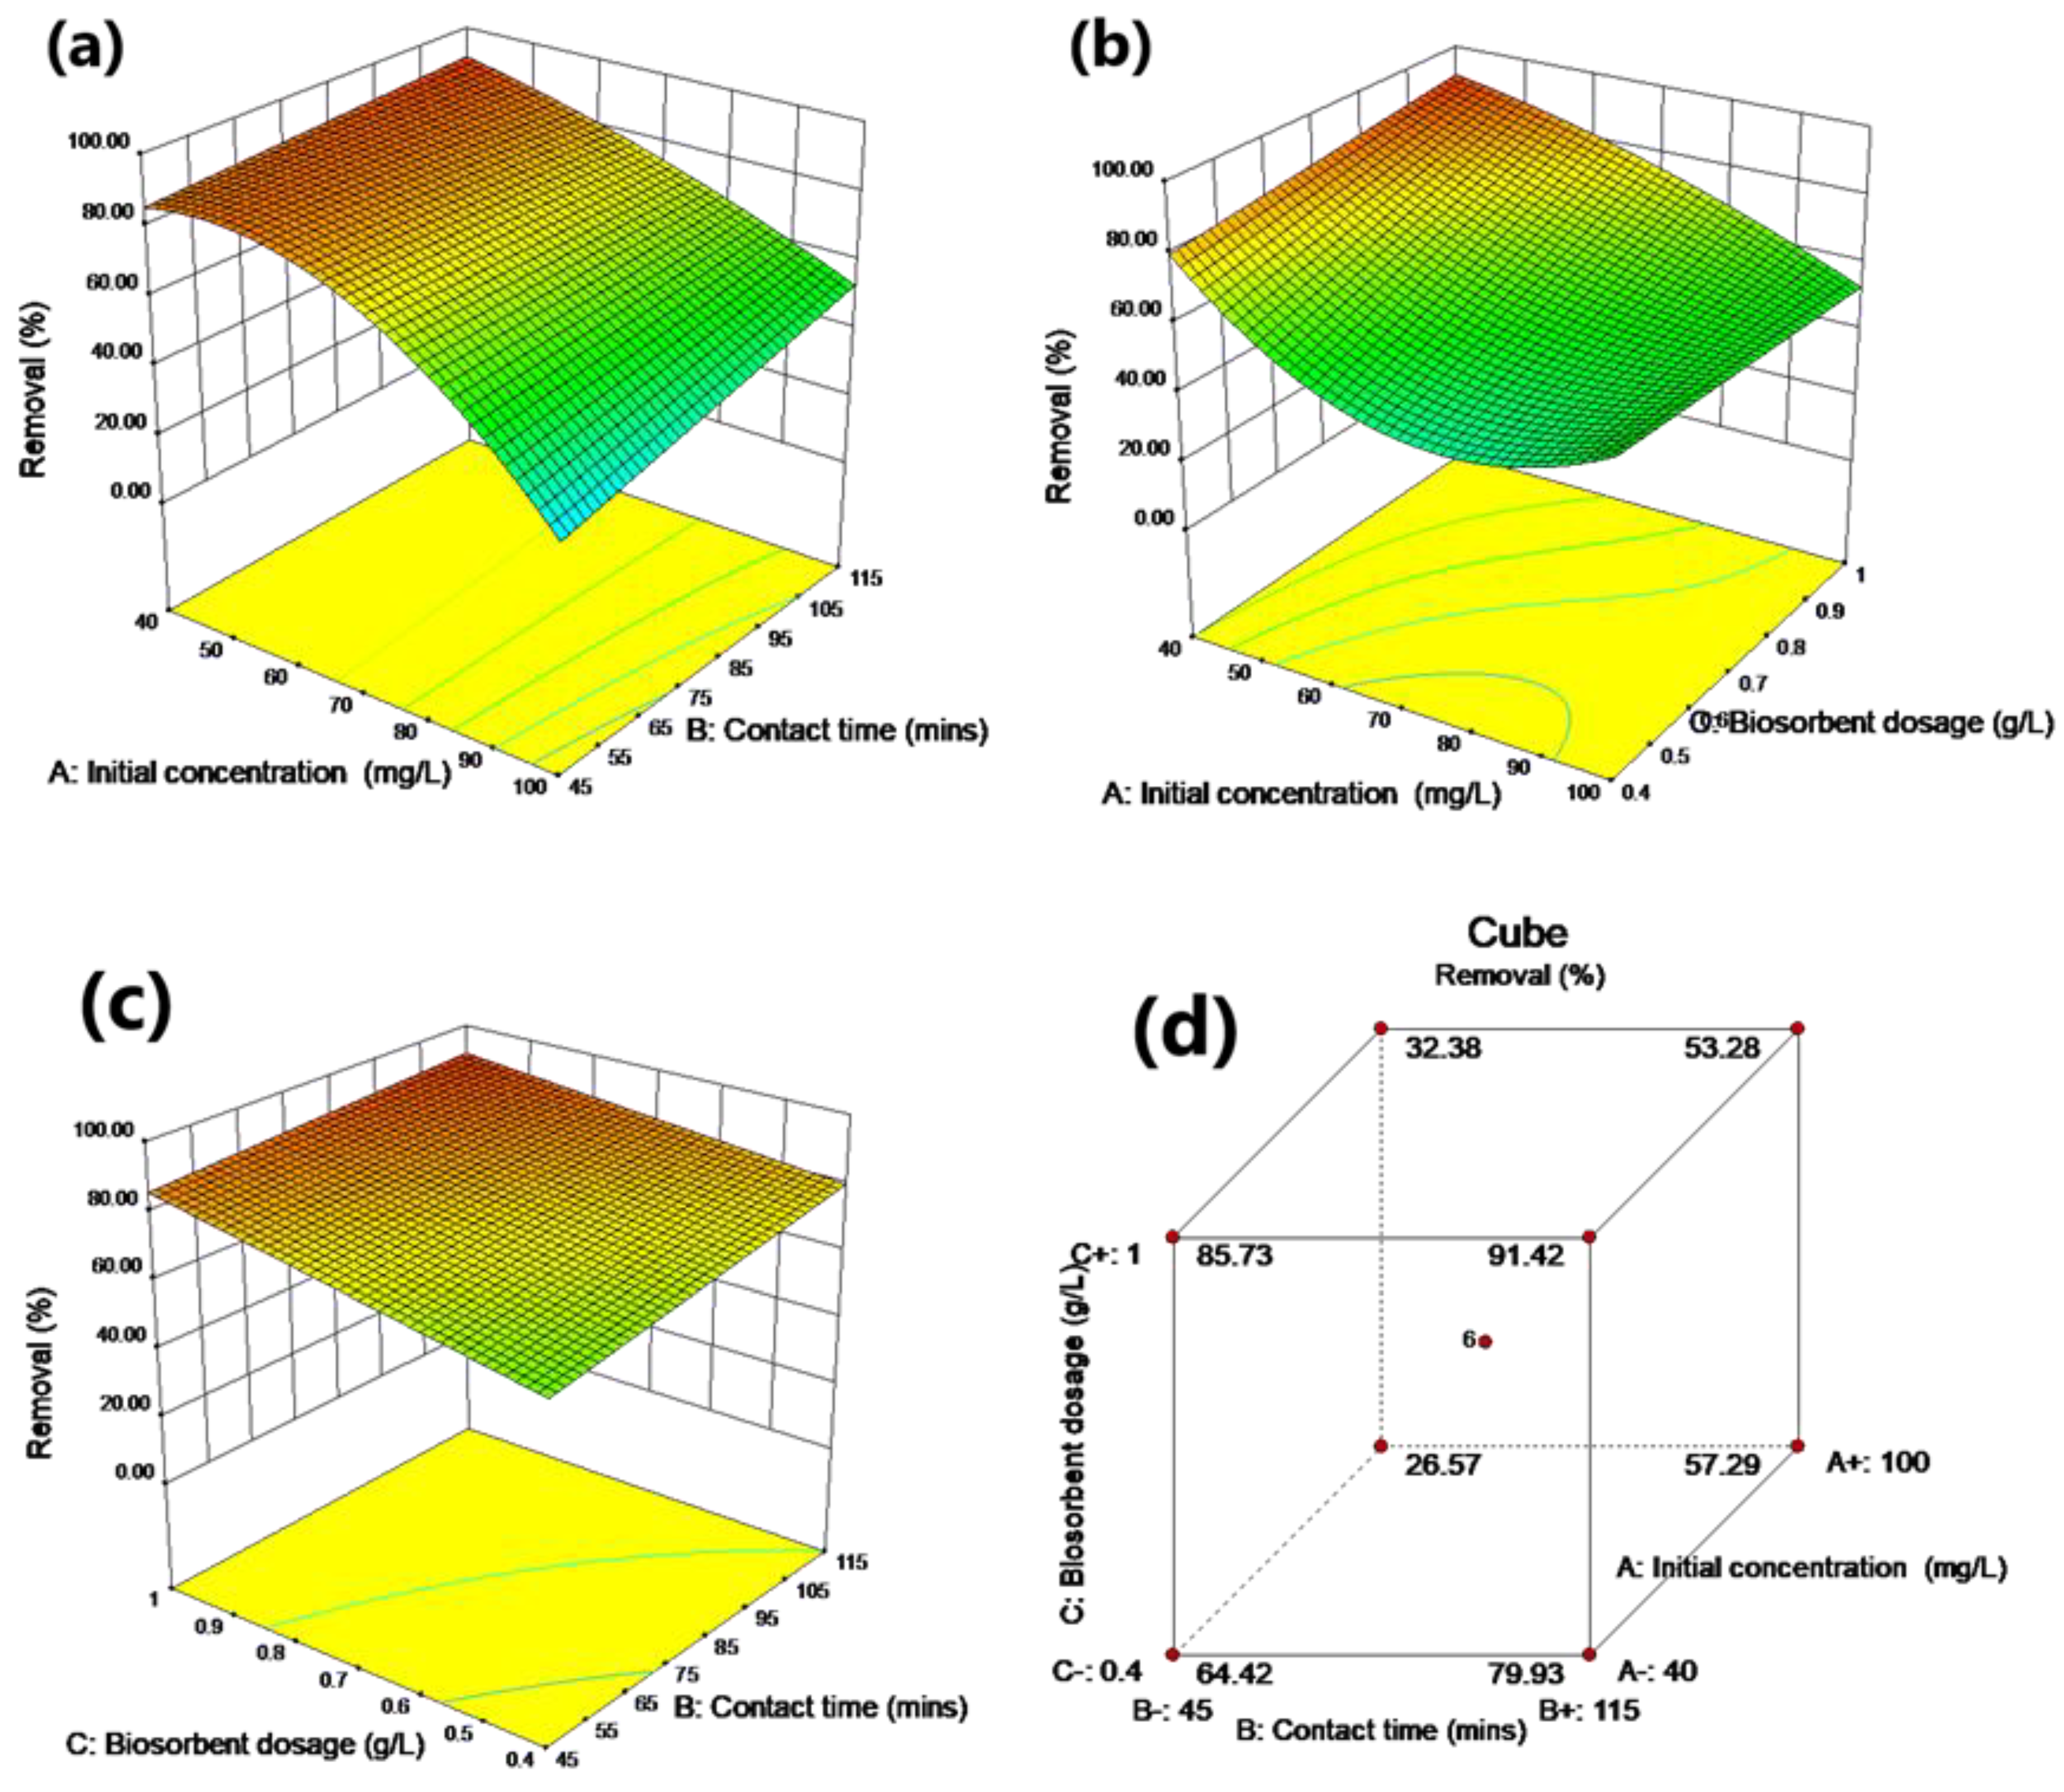
2.5.2. Experimental Design Using RSM
RSM was used to design the experiment to model and evaluate the effects of three independent variables (A: ion initial concentration, B: contact time and C: biosorbent dosage) on the response (R: metal removal percentage). Full factorial CCD was implemented. The CCD for the three independent variables was based on six axial points, eight factorial points and six replicates at the central point. The selected factors were varied at five levels (−α, −1, 0, 1, +α). The number of experiment runs was calculated based on Equation (2):
where
N is the number of runs,
K is the number of factors to be tested, and
C is the number of experiments conducted at the centre. The lower and higher limits of each factor are shown in
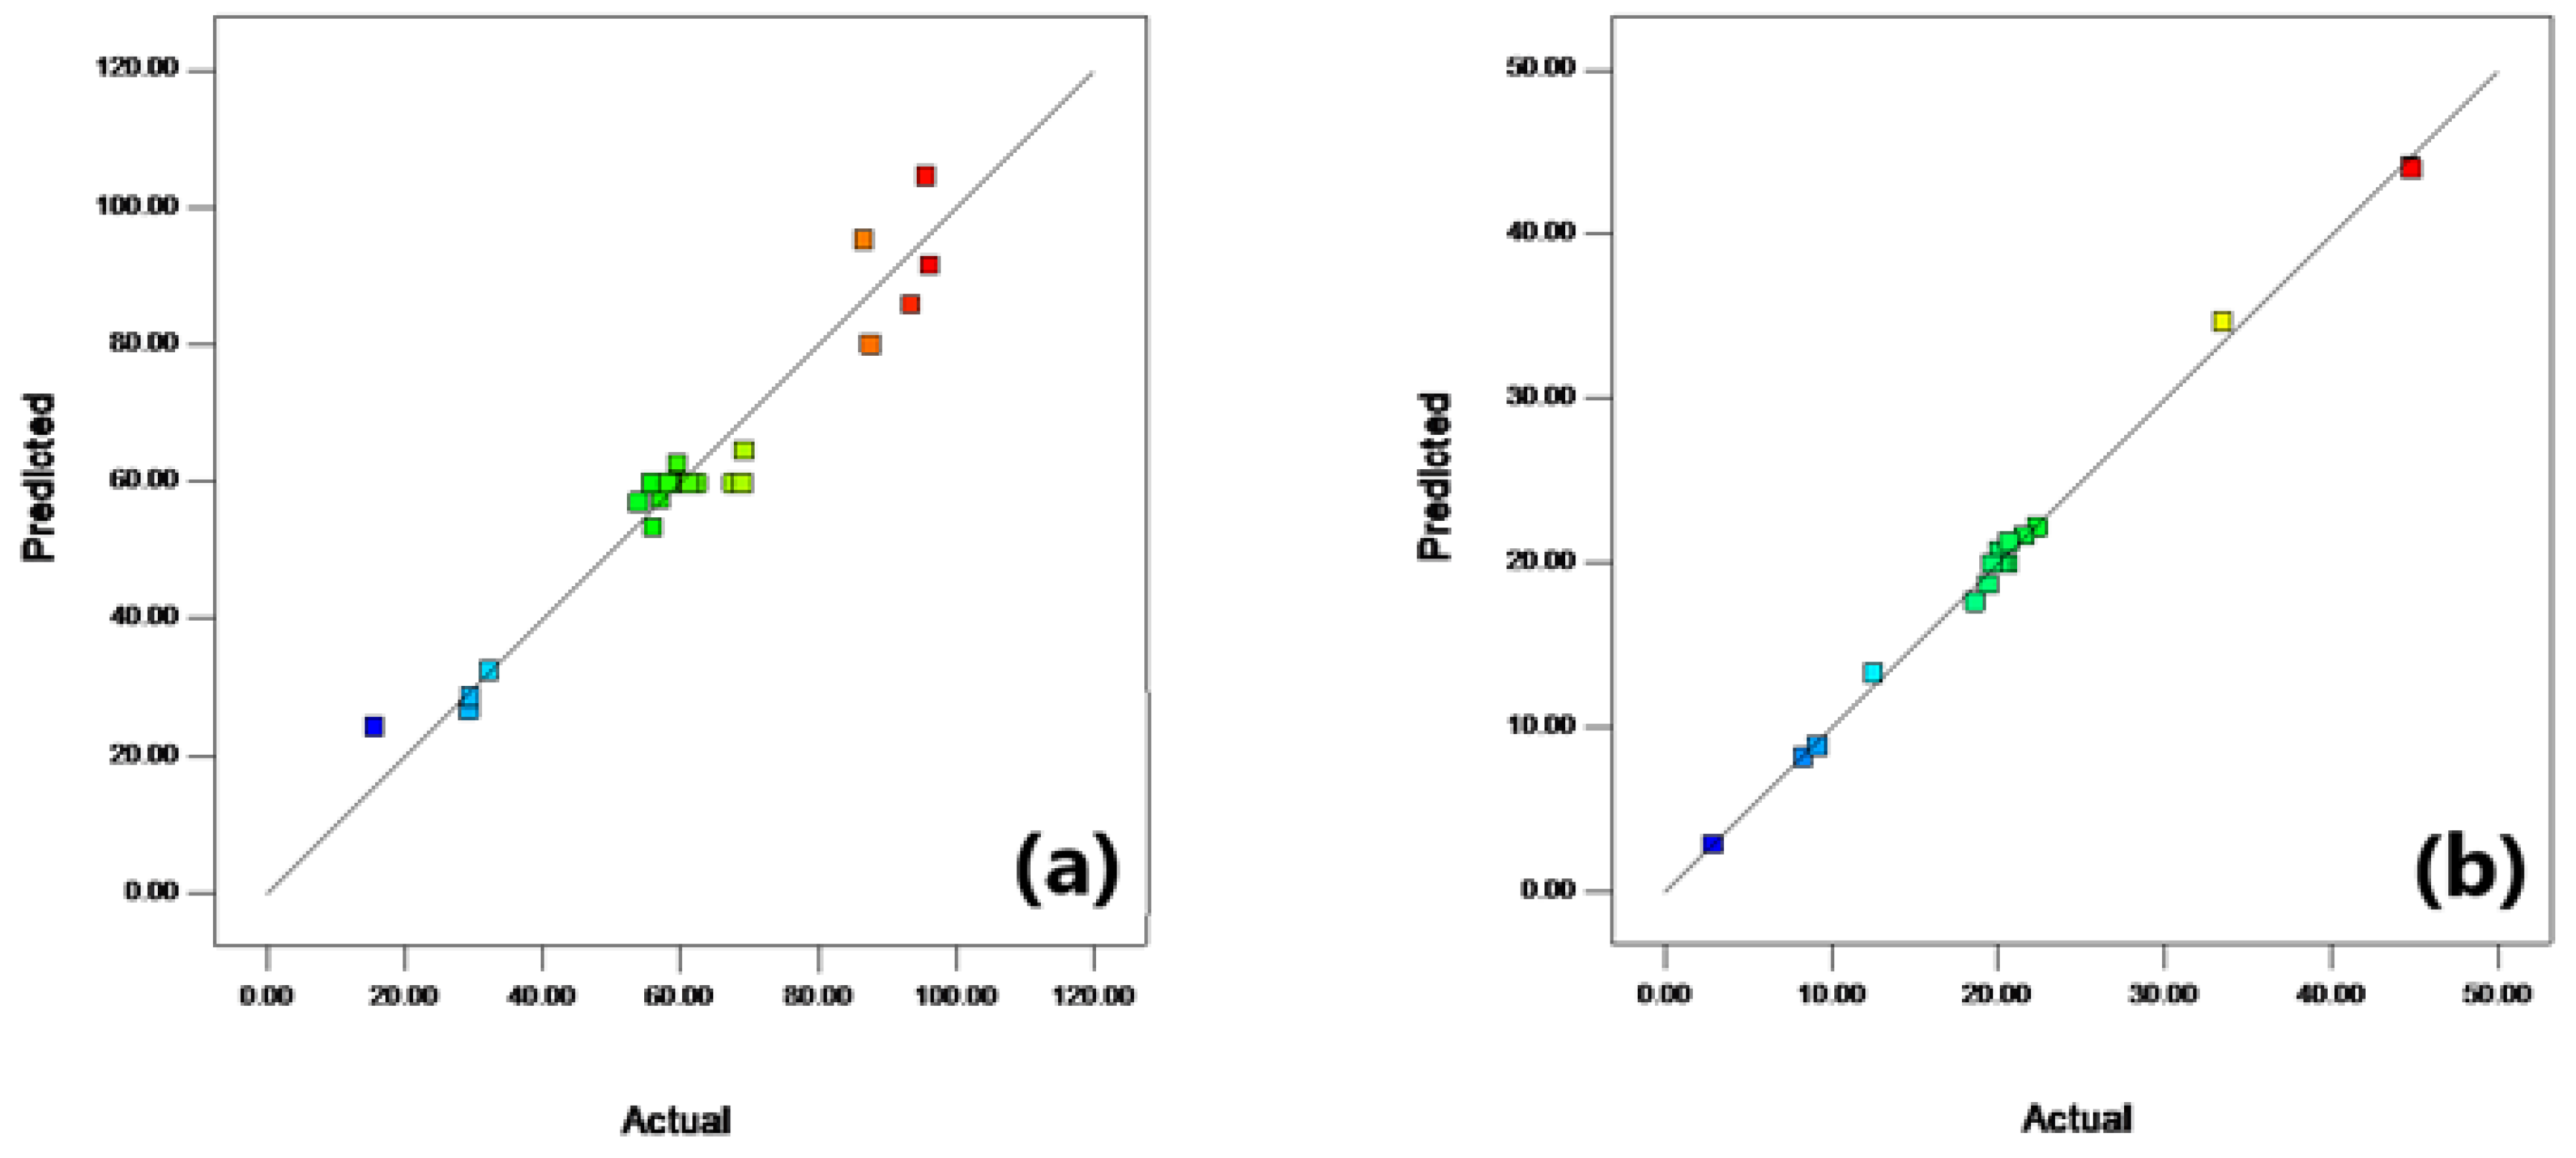
Table 2. The experiment data matrix was determined using State–Ease design expert v10.0.1. The obtained model was statistically analysed using analysis of variance (ANOVA). The interactions between variables were studied using surface contour plots.
2.6. Adsorption Isotherms
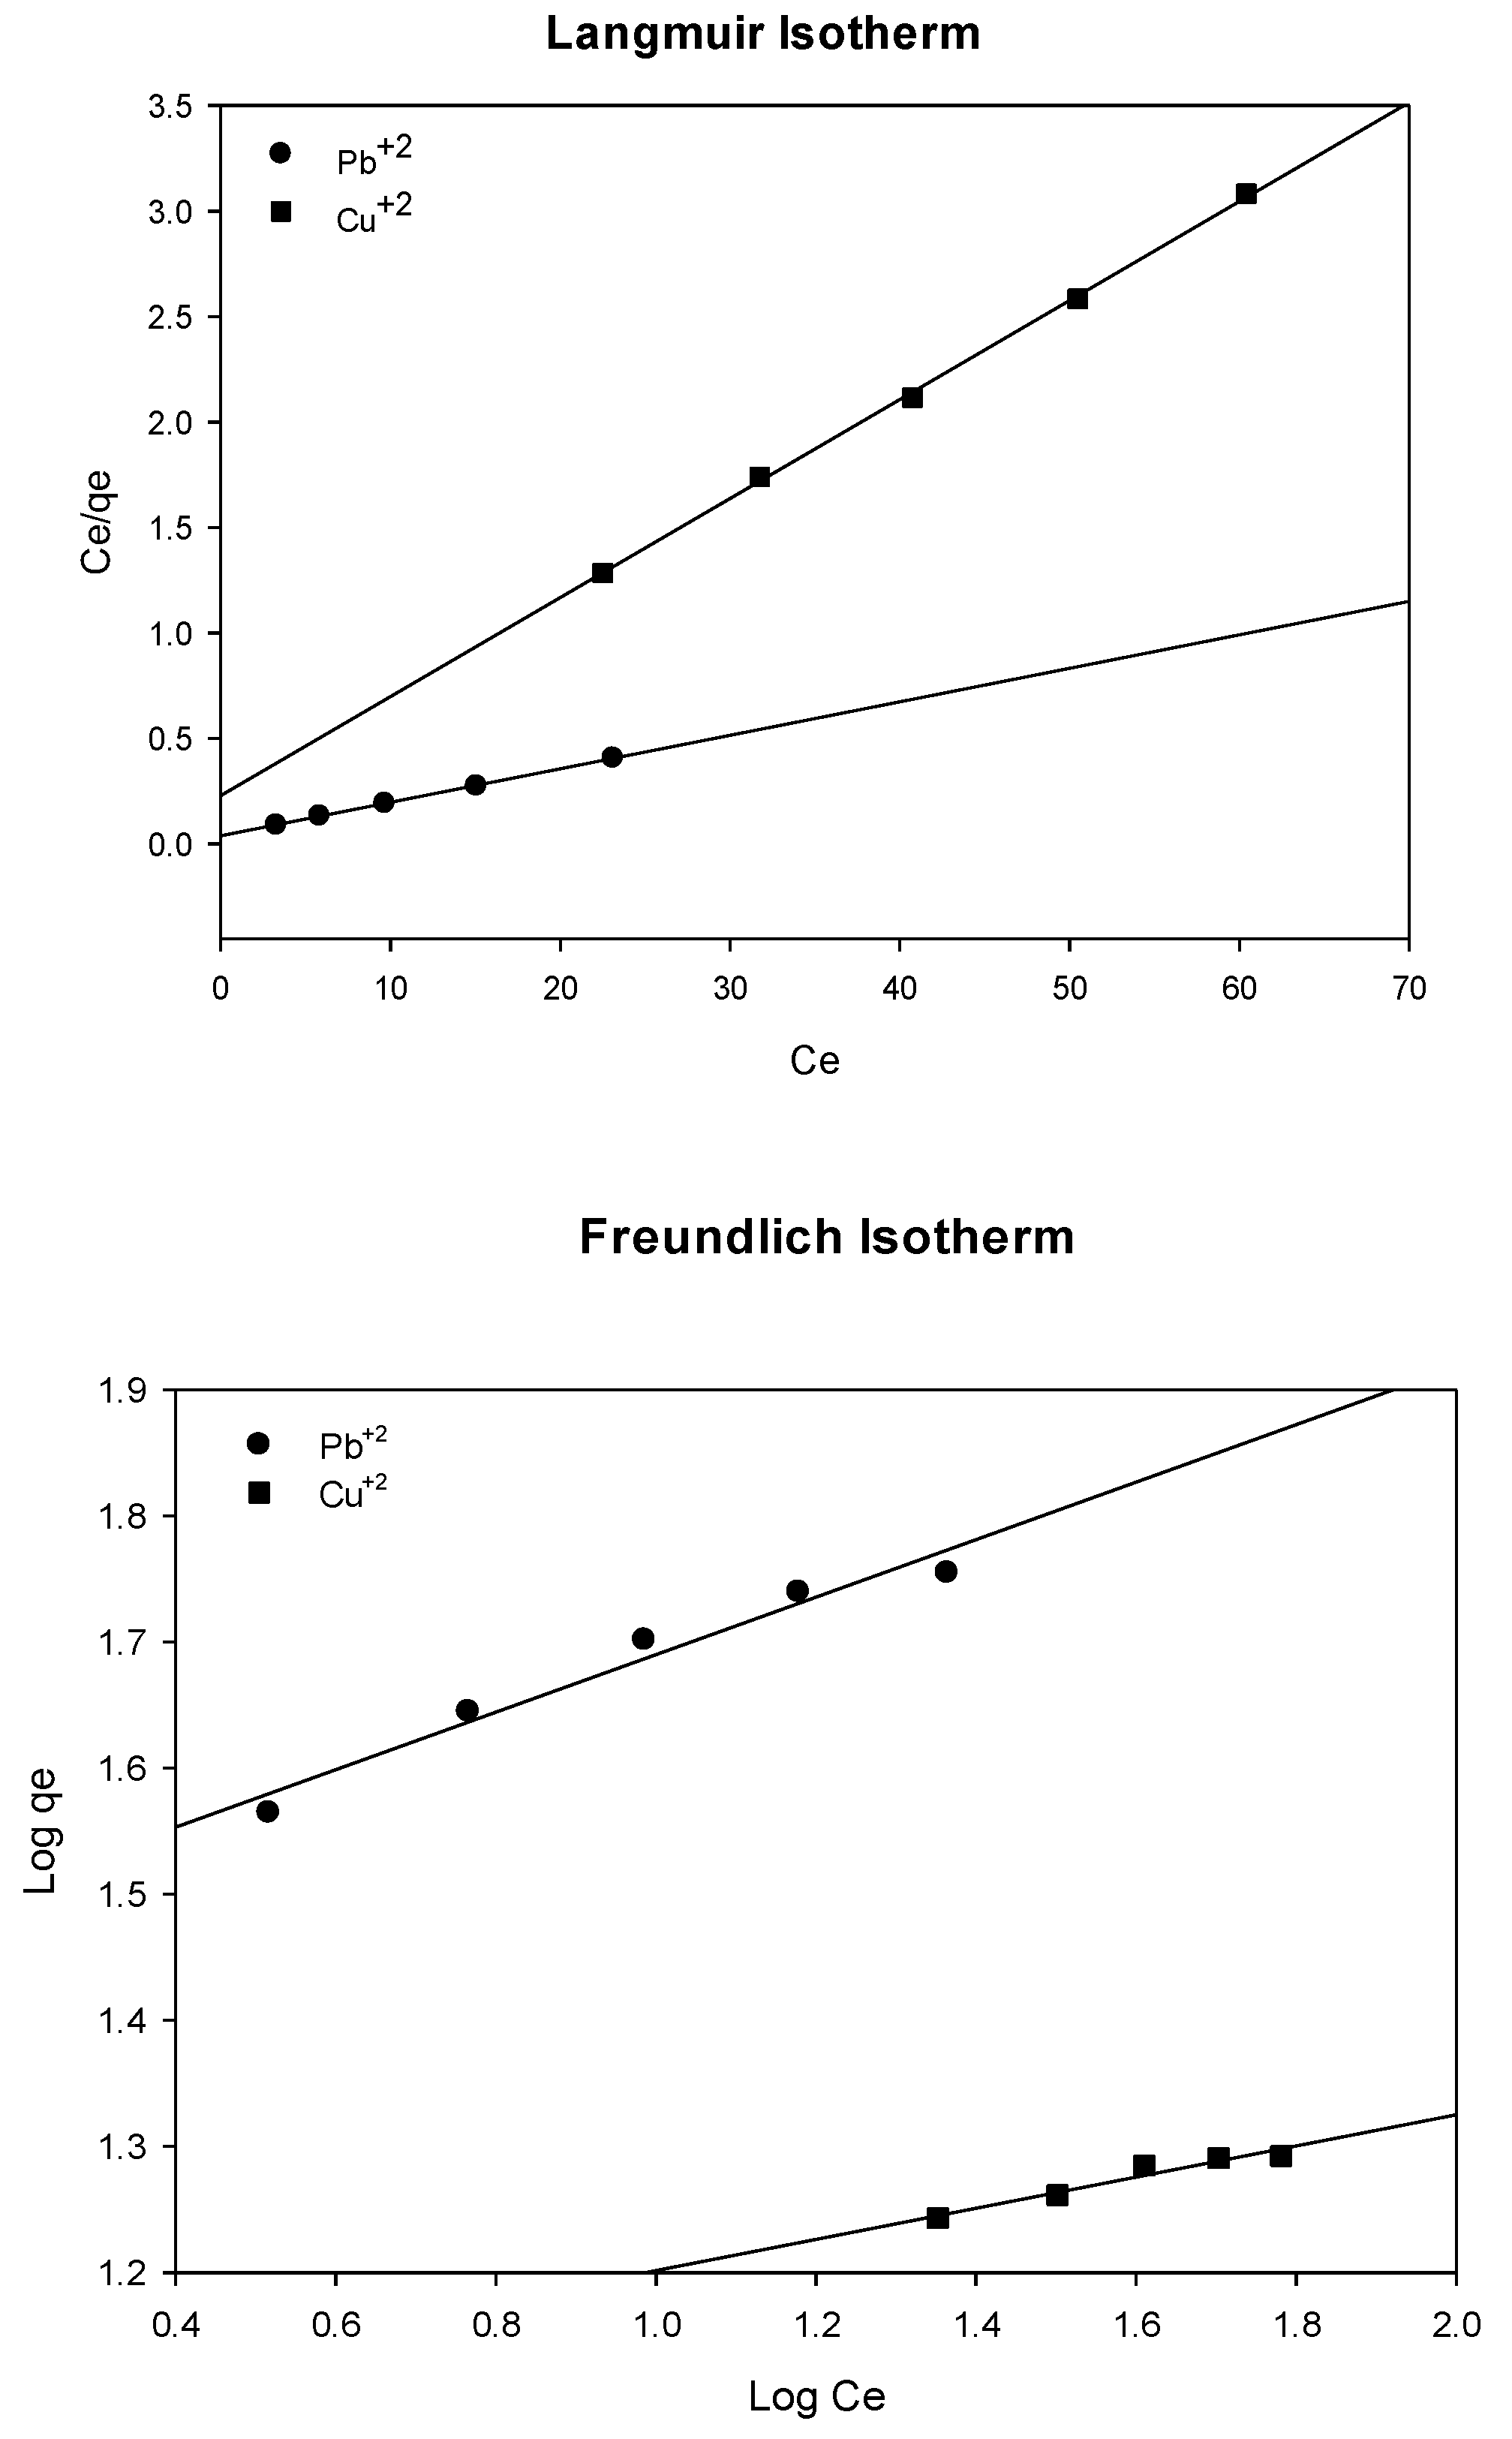
Adsorption isotherm models were utilised to examine the adsorption behaviour of metal ions on the adsorbent. Langmuir and Freundlich isotherms are the most commonly used in exploring the adsorption behaviour of metal ions. The Langmuir model assumes that the adsorption is a monolayer type and occurs on a homogeneous surface with a finite number of active sites, regardless of the existence of mutual interaction between the adsorbent molecules [
40]. The linearized Langmuir equation can be written in the following form:
where
Ce (mg/L) is the equilibrium concentration, and
qe (mg/g) is the amount of the adsorbed ion;
qm (mg/g) and
KL (L/mg) are the maximum adsorption capacity and rate of adsorption (Langmuir constant), respectively.
One of the essential characteristics of Langmuir isotherm modelling is the term of equilibrium dimensionless parameter (
RL), which can be calculated using Equation (4):
where
KL (L/mg) and
C0 (mg/L) are the Langmuir constant and initial ion concentration, respectively. The
RL value determines whether the adsorption is unfavourable (
RL > 1), favourable (0 <
RL < 1), linear (
RL = 1), and irreversible (
RL = 0) [
41].
The Freundlich model presumes that molecules are adsorbed on the heterogeneous surfaces based on different energy sites. The model considers the mutual interaction between adsorbate molecules. The linear form of the Freundlich equation can be used in the following form:
where
KF [(mg/g)/(L/mg)
1/n] and 1/
n are Freundlich constants related to capacity and favourability of the adsorption, respectively. The values of 1/
n within 0 and 1 indicate favourable adsorption.
n represents the intensity of adsorption.
2.7. Adsorption Kinetics
Adsorption kinetics models were utilised to examine to study the effect of contact time between adsorbent and adsorbate. The adsorption kinetics can strongly constrain the use of some adsorbents [
42]. Small adsorption kinetics leads to longer adsorption process time which can cause the adsorption to be inadequate [
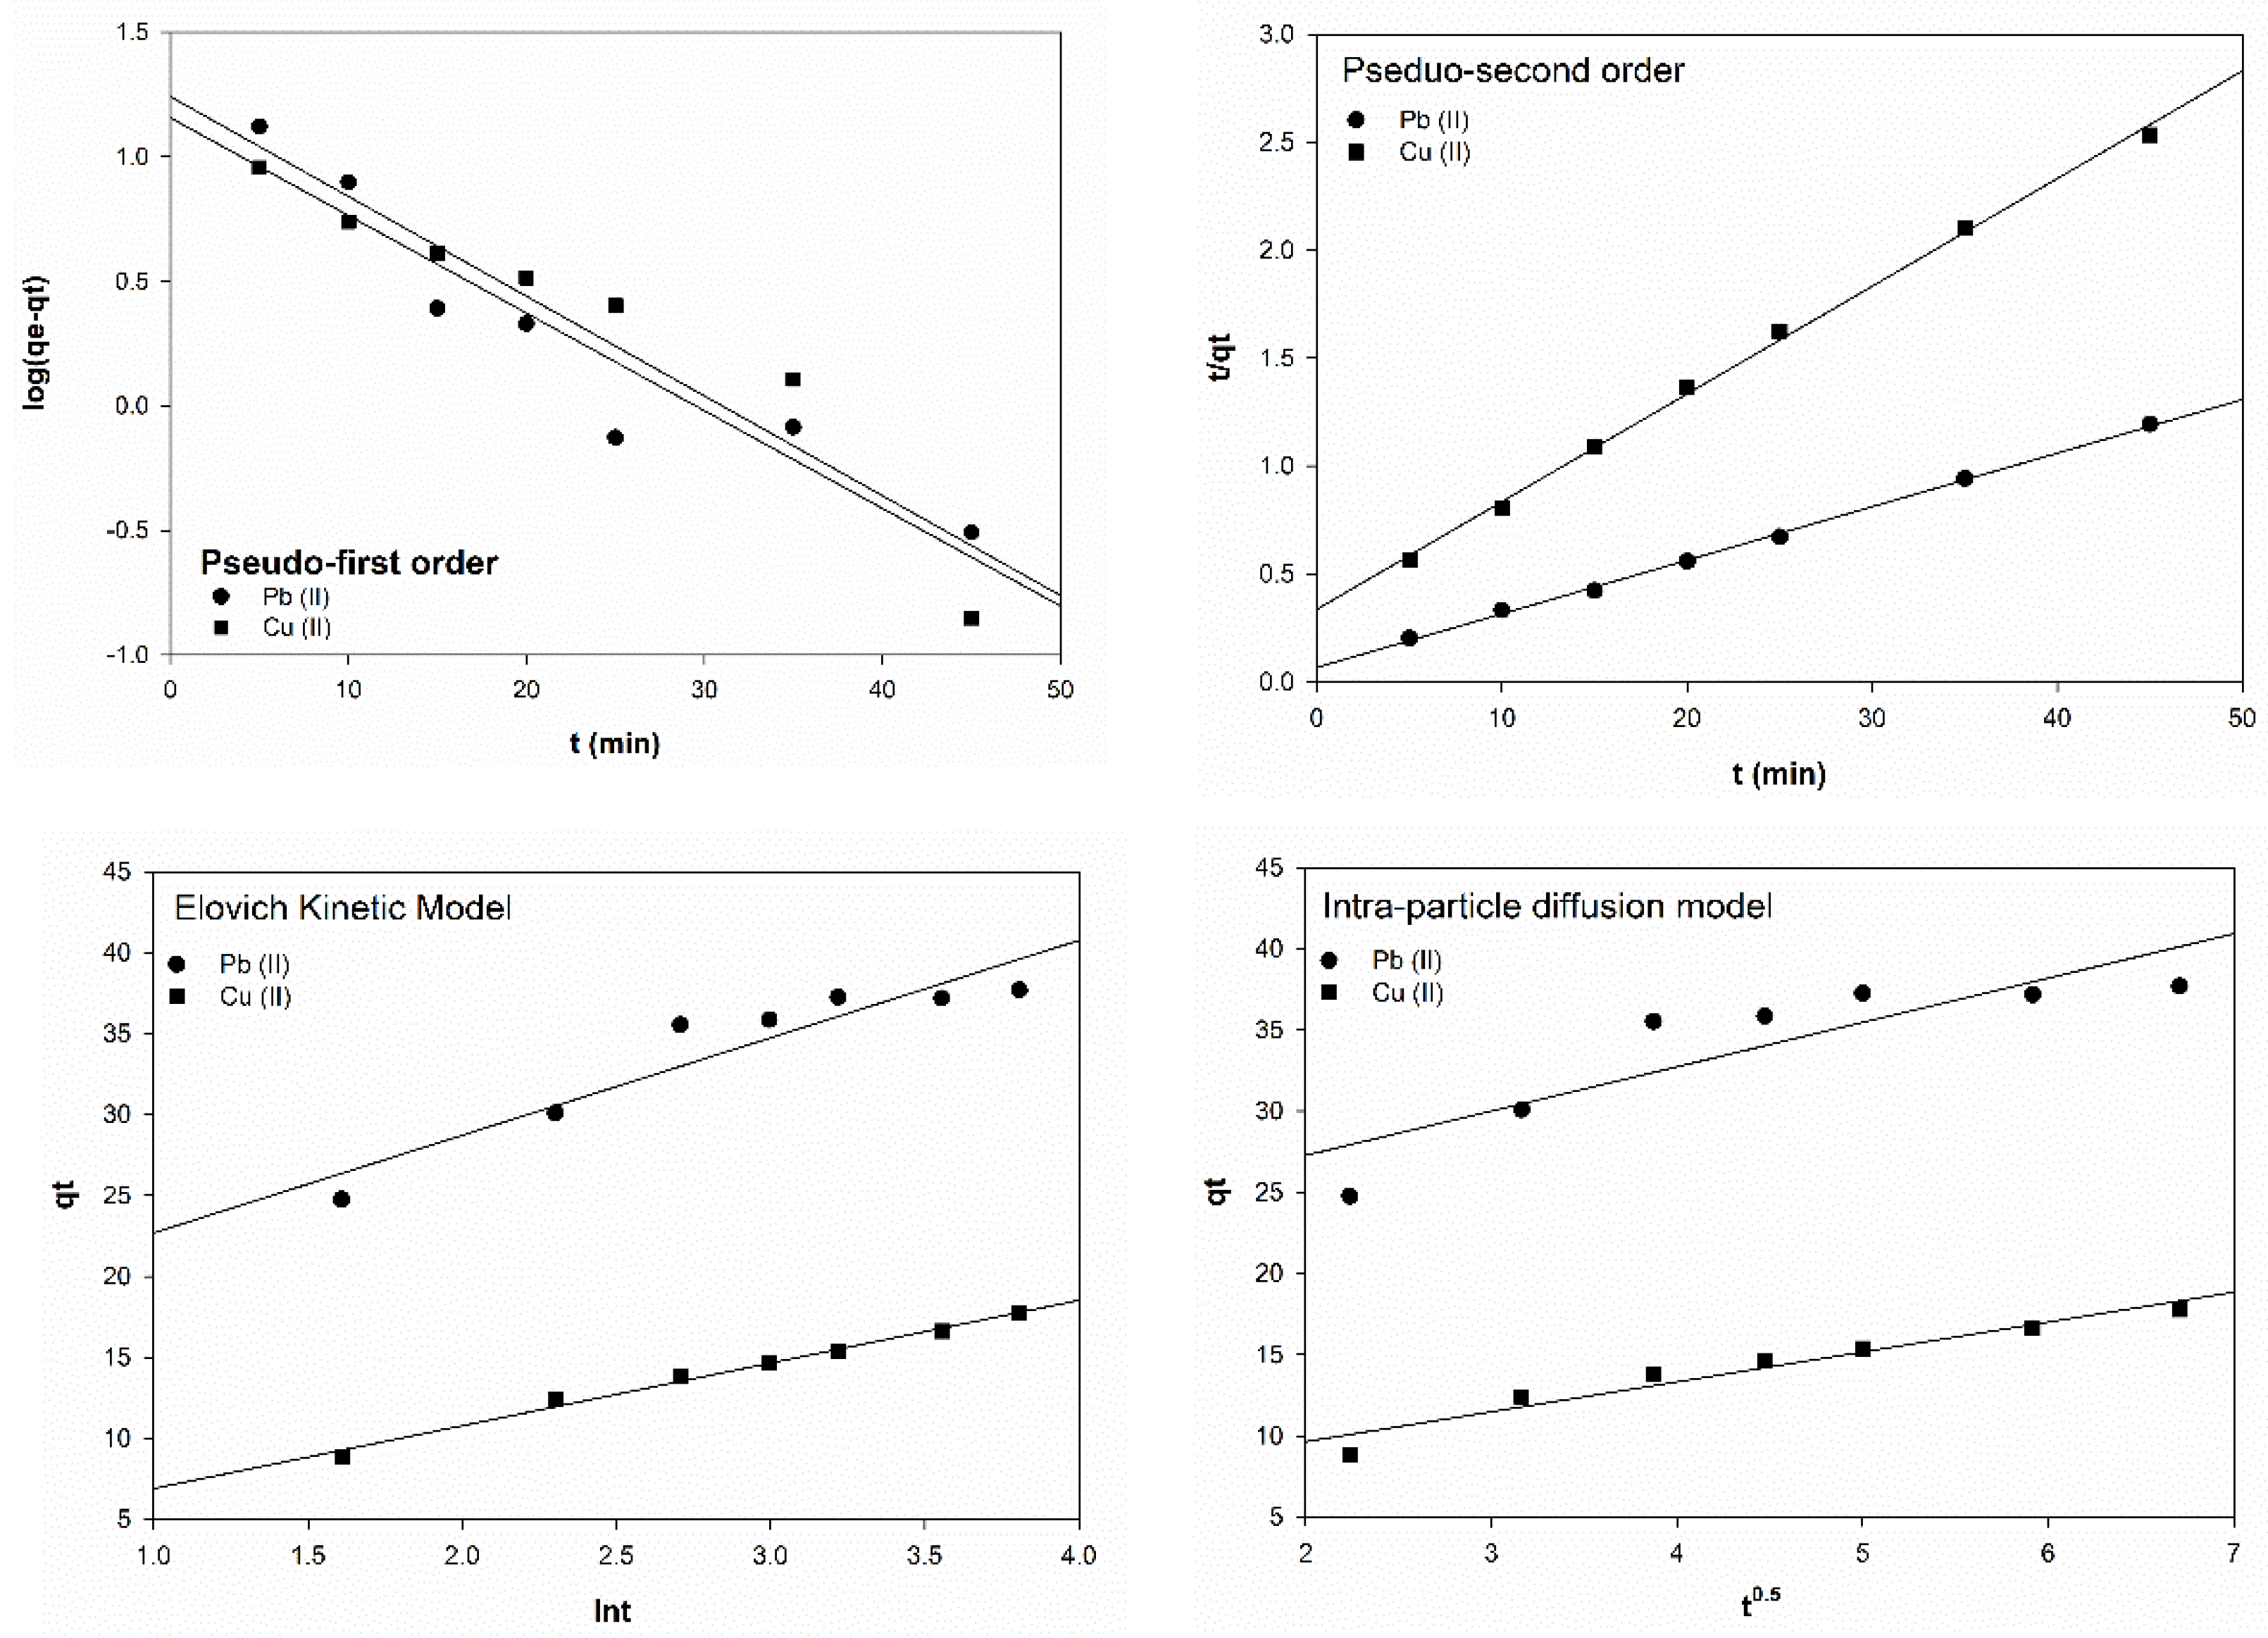
42]. In this study. Four different kinetics models were investigated, namely the pseudo-first-order, pseudo-second order, the Elovich, and the intra-particle diffusion kinetic models, and were used to test the experimental data.
The pseudo-first -order model is suitable for low concentration of adsorbate [
43]. The linearized form on this model can be expressed as follows:
where
qe and
qt is the metal uptake of
G. changii at equilibrium and at time t, respectively, and
k1 is the pseudo-first order model constant.
The linearized form of pseudo-second-order model can be expressed as follows [
42]:
where
qe and
qt is the metal uptake of
G. changii at equilibrium and at time t, respectively, and
K2 is the pseudo-second order model constant.
The Weber–Morris diffusion kinetic model was applied to the experimental data using the following form:
where
qt is the metal uptake of
G. changii at time
t (mg/g) and
ki is the diffusion rate constant (mg/g min
0.5). The Elovich kinetic model simplified equation can be written in the following form [
44]:
where
α and
β are the initial adsorption rage (mg/g min) and desorption constant (g/mg), respectively, and
qt is the metal uptake of
G. changii at time
t (mg/g).


