Article

Mapping Flood-Related Mortality in the Mediterranean Basin. Results from the MEFF v2.0 DB

1
Université de Montpellier 3, UMR GRED “Gouvernance, Risques, Environnement, Développement”. 34090 Montpellier, France
2
CNR-IRPI Research Institute for Geo-Hydrological Protection, 87036 Cosenza, Italy
3
Institute of Environmental Research and Sustainable Development, National Observatory of Athens, 15236 Athens, Greece
4
Department of Applied Physics, University of Barcelona, 08028 Barcelona, Spain
5
Grup de Climatologia, Hidrologia, Riscs i Paisatge, Universitat Illes Balears, 07122 Palma de Mallorca, Spain
6
Department of Meteorological Engineering, Faculty of Aeronautics and Astronautics, Samsun University, Samsun 55420, Turkey
7
HydroSciences Montpellier, CNRS, IRD, Université de Montpellier, 34090 Montpellier, France
*
Author to whom correspondence should be addressed.
Water 2019, 11(10), 2196; https://doi.org/10.3390/w11102196
Submission received: 26 July 2019 / Revised: 23 September 2019 / Accepted: 14 October 2019 / Published: 22 October 2019
(This article belongs to the Special Issue Damaging Hydrogeological Events)

Abstract

:
Recent events in Western Attica in Greece (24 deaths in November 2017), in the Balearic Islands (13 deaths in October 2018), and in southern France (15 deaths in October 2018) show that flood-related mortality remains a major concern in Mediterranean countries facing flash floods. Over the past several years, many initiatives have arisen to create databases on flood-related mortality. An international initiative started in 2011 pooling regional and national databases on flood mortality from region and/or countries bordering the Mediterranean Sea. The MEditerranean Flood Fatality Database (MEFF DB) brings together, in 2018, six Mediterranean regions/countries: Catalonia (Spain), Balearic Islands (Spain), Southern France, Calabria (Italy), Greece, and Turkey, and covers the period 1980–2018. MEFF DB is on progress and, every year, new data are included, but for this study, we kept only the preliminary data that were geolocated and validated on 31st of December 2018. This research introduces a new step in the analysis of flood-related mortality and follows the statistical description of the MEFF DB already published. The goals of this paper are to draw the spatial distribution of flood mortality through a geographical information system (GIS) at different spatial scales: country, NUTS 3 (Nomenclature of Territorial Units for Statistics. Level 3) regions, catchment areas, and grid. A fatality rate (F: number of deaths/year/million of inhabitants) is created to help this analysis. Then, we try to relate mortality to basic (human or physical) drivers such as population density, rainfall seasonality, or rainfall frequency across the Mediterranean Basin. The mapping of F shows a negative mortality gradient between the western and the eastern parts of the Mediterranean Sea. The south of France appears to be the most affected region. The maps also highlight the seasonality of flood-related deaths with the same west–east gradient. It confirms that flood mortality follows the climatological seasonal patterns across the Mediterranean Basin. Flood-related fatalities mainly occur during the early fall season in the western part of the Mediterranean area, while the Easter Basin is affected later, in November or during the winter season. Eastern Turkey introduces another pattern, as mortality is more severe in summer. Mortality maps are then compared with factors that potentially contribute to the occurrence of flood fatalities, such as precipitation intensity (rainfall hazard), to explain geographical differences in the fatality rate. The density of a fatal event is correlated to the population density and the rainfall frequency. Conversely, the average number of deaths per event depends on other factors such as prevention or crisis management.

1. Introduction

The reduction of the number of victims is a key objective in national and international public policies [1]. The European Floods Directive 2007 states the following: "Floods have the potential to cause fatalities, displacement of people and damage to the environment" [2]. Moreover, forecasting and disaster preparedness have been dedicated for a long time to saving human lives. In areas exposed to flash floods like Mediterranean regions, emergency services are, at first, responsible for rescuing people, before protecting material or environmental assets. A mortality analysis provides answers on the places of death and circumstances of deaths, and can help to enhance prevention efficiency. Information on loss of life can also serve as an indicator to test the effectiveness of prevention measures [3].
There are several degrees of analysis of flood-related deaths according to the selected spatial scale.
  • Globally, we find studies based on international databases, mainly the Emergency Events Database (EM-DAT) of the Center for Research on the Epidemiology of Disaster (CRED) (https://www.emdat.be/emdat_db/), as well as the Darmouth flood observatory DB (http://www.dartmouth.edu/%7Efloods/Archives/index.html), Desinventar (https://www.desinventar.org/) or Reliefweb (https://reliefweb.int/) [4,5,6]. Those databases are well-known and frequently used by researchers to get a global overview of mortality as they provide general data by event and, when available, the number of fatalities [7,8,9]. The approach is by event and at the scale of countries [10]. However, the location of disaster-related fatalities is not accurate enough to bring outcomes for decision makers at the regional and local level [11]. International databases on disaster impacts need reanalysis at the local level [12,13].
  • Faced with the shortcomings of these international databases, many initiatives came up in Europe and/or in the Mediterranean Basin to build a database on disaster impacts in the frame of research projects [3,14,15,16] (http://riskam.ul.pt/disaster/) or by national weather services [17,18]. The main concern of these efforts is the verification, the geographical location, and the collection of accurate information for each fatality.
  • On a third level of flood-related mortality analysis, potential human toll modeling has been developed for a long time in the case of dam failure [19] or dike break [20,21,22]. Modelling is often based on a former catastrophic event [23,24].
The present work deals with the first two levels of analysis. Given that there is a missing link between the global databases like EM-DAT and the local, but more accurate databases, we argue that it is necessary to gather, evaluate, and homogenise the different national or regional databases at the scale of Europe and/or Mediterranean Basin. Following this concept, the international Floodhymex initiative was launched in 2011 to collect data on disaster impacts around the Mediterranean Basin [25]. The first countries/regions that participated were Southern France, Catalonia, Balearic Islands, and Calabria. Floodhymex is a database containing information about the impacts of catastrophic floods that have affected those regions/countries between 1980 and 2015 (website to download FloodHymex: http://mistrals.sedoo.fr/?editDatsId=1150&datsId=1150&project_name=MISTRALS&q=floodhymex). The database “MEditerranean Flood Fatalities”, MEditerranean Flood Fatality Database (MEFF DB) in short, is an outcome of the Floodhymex collaboration and focuses only on flood-related fatalities in the four original regions/countries. Fatality data from Greece have been added in 2016 and Turkey in 2018.
The aim of the MEFF DB is twofold. Firstly, the collection of data on mortality due to flood contributes to improving prevention by shedding light on the profile of victims and the circumstances under which people die during flooding. The second aim is to use loss of life as an indicator of flood impacts, as well as an indicator of flood prevention efficiency. Indeed, collecting and comparing economic data over decades requires complex analysis that mitigates the relevance of historical comparisons. It is sometimes difficult to compare economic losses through decades and can also be difficult to detect all the material impacts of floods, as many of them are intangible or indirect [26,27]. Conversely, the collection and the analysis of mortality data provide a reliable and time-independent indicator. Indeed, a fatality that was reported in 1900 has the same “value” as a decease registered in 2000 or 2010. We assume that mortality is the result of both hazard extreme circumstances and human vulnerability (e.g., age or behavior) that led to a death. The data analysis is not focused on testing an existing hypothesis or building a model, but rather on analysing and explaining all the information that can be gathered from the sample of collected data.
The first version of the MEFF DB has already been described and its statistical analysis shows the main characteristics of the mortality across the Mediterranean Basin [28]. The goal of the current paper is to go deeper by providing a geographic analysis of data at the national and regional level using a geographical information system (GIS). The building of the MEFF DB is on progress and each year, new data from other countries are integrated. The MEFF DB is being gradually transformed into the “European Flood Fatalities DB” (EUFF DB) with the addition of European countries (Slovakia, Portugal, whole Italy) and Israel (for more information, please see the paper of Petrucci et al. [29] in this volume). The integration of those countries was not possible for this paper, as the homogenisation and the validation of the data in a GIS is particularly time-consuming. In this paper, we focus on Catalonia, Balearic Island, Calabria, Greece, and Turkey that was recently integrated following the standards of MEFF DB.
To distinguish from the previously published version, we named the present DB as MEFF v2.0. DB.
The goals of this paper are not to present all the characteristics of flood mortality (age, gender, and so on) in the studied area. The aim is to explore the spatial distribution of mortality at different levels. After reminding of the main features of the MEFF v2.0 DB, the paper introduces a flood fatality rate (F) to compare mortality among different countries. The flood fatality rate is analysed through different spatial scales, to draw the main features of flood mortality in the Mediterranean Basin. The fatality rate is then linked to potential drivers of mortality, such as hilly landscape or rainfall hazard, to see whether mortality is consistent with hazard data (e.g., geography of rainfall).

2. Materials and Methods

The overall methodology employed to build the MEFF v2.0 DB is displayed in Figure 1.

2.1. The Collection of Fatality Data

The method consists of systematically collecting descriptions of fatal events from existing databases, documentary sources, media websites, and newspaper archives. The information is verified from at least two sources. The location of the death is given at least at the municipal level. We consider that the census of flood-related deaths is complete during this period. Indeed, flood-related deaths are considered dramatic, so newspapers and, more recently, social media, do not miss out on such reports [3,14,30,31,32,33].
The key criterion to select a flood-related fatality is the causal relation between flooding and the death. Jonkman and Kelman define a “Flood fatality or flood-related fatality” as a “fatality that would not have occurred without a specific flood event. Synonyms and related terms include flood deaths, loss of life in floods, flood mortality and killed by flooding” [34] (p.76). Indirect and differed deaths (e.g., suicide) are not investigated [35]. The period covered by the study, 1980–2018, was chosen because it is rather homogeneous in terms of socio-economic conditions (housing type, car use, meteorological forecasts). The nature and quality of information for prior periods is weaker. As Zêzere et al. note [14] (p.530), “the importance given to human life and living conditions in (former) time was less compared to nowadays, namely in the less populated rural areas”. Moreover, considering the stating date of the DB (1980), the memories of disasters are still fresh. Moreover, for this period, direct flood witnesses may be still alive, which facilitates the cross-checking of information.

2.2. Structure of MEFF v2.0 DB

The MEFF v2.0 DB is the result of an inter-regional collaboration at the Mediterranean level on flood-related mortality. It can be downloaded from the following website: https://data.mendeley.com/datasets/rh9mx7fh7b/1.
The MEFF v2.0 DB puts together different kinds of information on the profile of dead people and the circumstances of deaths.
The MEFF v2.0 DB is composed of several variables that can be classified into different “sections” (Figure 1) [29]. The first section consists of nine fields describing spatial and temporal information on death: date and time (five fields) and location (four fields filling in the place of death at different administrative unit levels).
The second section (seven fields) provides the specific profiles of the victims, such as age, gender, residence or not in the area where death took place, and personal vulnerability (disabilities, homeless, and so on). The third section (five fields) describes the conditions and activities practiced by the victim at the time of death: whether the victim was inside or outside, the place of death (on the road, at the campsite, in a building, and so on), the conditions (by car, pedestrian, and so on), the activity practiced by the individual (at work, recreation, sleeping, and so on), and the “clinic” conditions of death (injured, thrown by waters, and so on).
The fourth section (four fields) relates to the attitude adopted by the victim for his/her safety (e.g., climbing onto the roof of a house) or, on the contrary, the eventual risk-taking (crossing a submerged bridge; driving on a road closed by the police; rescue attempt of an animal, vehicle, or person). A column also documents the cause of death (drowning, hypothermia, heart attack, and so on).
The fifth section (four fields) provides the GPS coordinates (longitude and latitude) of the exact place of death if known, or the centroid of the municipality of death. The sixth and final section (six fields) includes hydrologic and climatic data, where available, namely rainfall amount and river discharge.
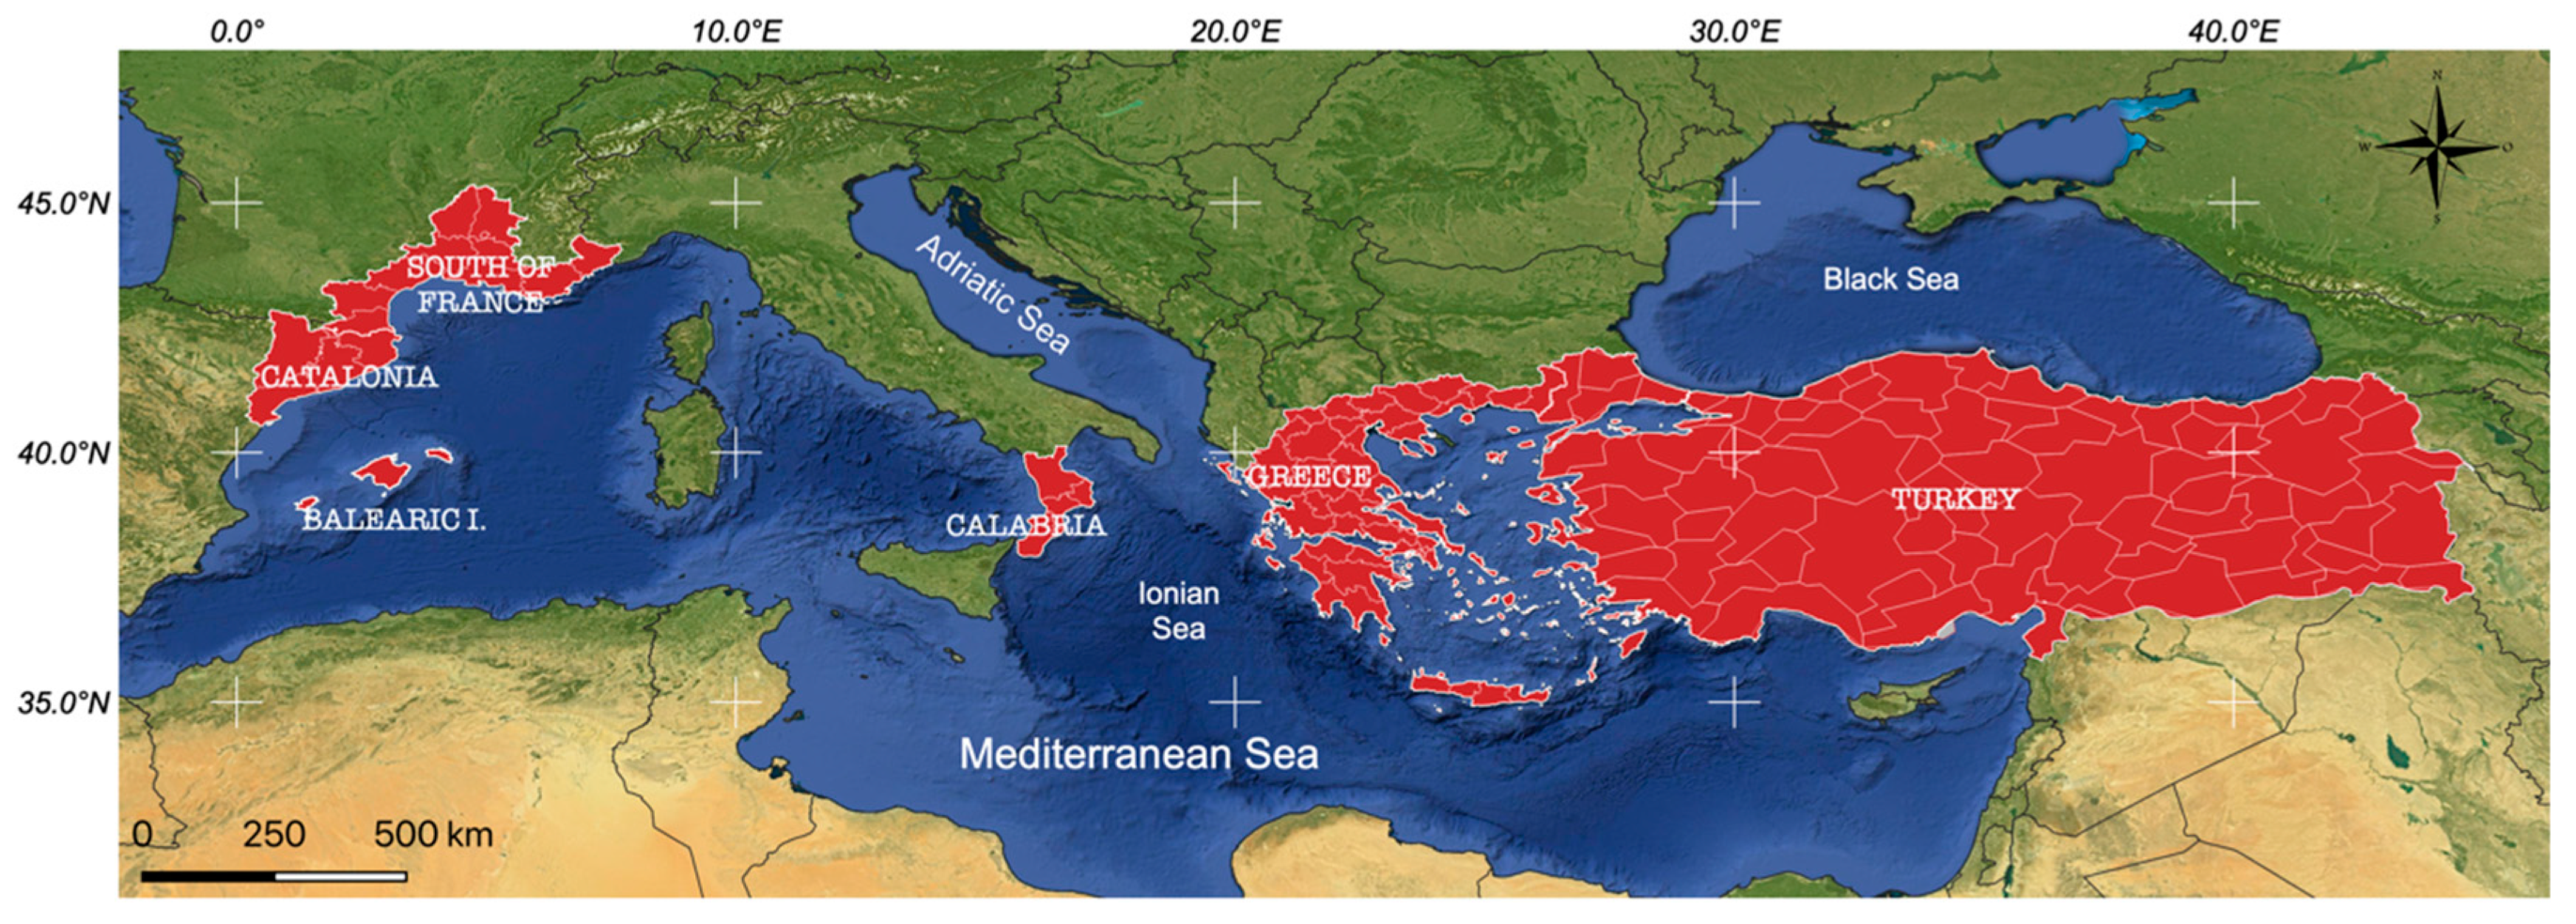
Currently, six Mediterranean regions cooperate in this research project: Southern France, Catalonia, Balearic Islands, Calabria (Italy), Greece, and Turkey (Figure 2). Data from Turkey have recently been integrated, and although those data still need deeper analysis, they represent a step towards extending this database to the entire Mediterranean Basin.

2.3. The Construction of the Fatality Rate

In order to smooth the effect of the exposed population, we defined and calculated a “fatality rate” that allows to compare the mortality at any spatial unit. The fatality rate is currently employed to account for the human impact of natural hazards on a given population [36,37,38]. We used the coefficient of 1,000,000 of inhabitants to be homogenous with the International System of Units. Some authors like Forzieri et al. [39] or Adhikari et al. [5] use “millions of inhabitants” as a reference. Other authors use 10,000 or 100,000 inhabitants [40]. We think that it depends on the scale of study [40] (p.149). The coefficient of 1,000,000 is adapted to the scale and the population of our study area.
For a specified area, the fatality rate, F, is calculated as follows:
F = ( N f × Pop 1 ) N y × 1,000,000 ,
  • F = fatality rate
  • Nf = total number of fatalities over the study period
  • Pop = population in 2000
  • Ny = number of years of the study period
The population is the whole population in 2000, that is, the median year of the studied period. Spatialized population data were collected from the SEDAC (SocioEconomic Data and Applications Center) (https://sedac.ciesin.columbia.edu/data/sets/browse). These data are based on the 2000 total population map of the Global Rural-Urban Mapping Project (GRUMP) version 1 (Figure 3). The GRUMP map corresponds to the national registers (UN) of the total population for 2000. The GRUMP method starts from the census data and distributes the population within each spatial unit using data from human settlement points and night lighting data from the United States Department of Defense. This method improves previous maps of the world population by recognizing that populations are not evenly distributed within census units [41]. It results in a dot plot file (.shp) with an attribute table of population values. Then, population data were aggregated at each scale of the MEFF v2.0 DB analysis: countries, regions, NUTS 3, catchment areas, grid cell, and so on.
The NUTS 3 administrative units come from the official nomenclature of the European Union and correspond to the “departments” in France or “provinces” in Spain (https://ec.europa.eu/eurostat/fr/web/gisco/geodata/reference-data/administrative-units-statistical-units/nuts) and “provinces” in Italy. The EU also provides the administrative regions of Turkey, although it does not belong to the EU. The area of NUTS 3 ranges from 67 km2 to 40,897 km2. The median size of the entire study area is 5438 km2. NUTS 3 regions are smaller in Greece (mean area: 2533 km2) and larger in Turkey (mean size: 9629 km2).
Nevertheless, the different population and size of each region biases the comparison. So, to limit those constraints, we built a randomized hex grid (tested for 50 × 50 km, i.e., a 2165 km2 mesh, and 20 × 20 km, i.e., a 346 km2 mesh). The choice of a hexagonal grid cell is justified by the multiple advantages of this division: isoperimetric optimum, constant distance between the center of each hexagonal cell and the center of the six adjacent hexagons, and that all neighboring cells always share the same length edges (meanwhile, a square touches the neighboring cells either by a side or by a corner) [42].
For the catchments areas, we also used the European Union nomenclature (https://www.eea.europa.eu/data-and-maps/data/european-river-catchments-1). The catchments were drawn following the catchment characterization model (CCM2) based on a Strahler ordering of rivers.
As the records of fatalities are integrated in a GIS at the level of municipality, we are able to map and analyse the spatial distribution of F, downscaling from the country level, NUTS 3 administrative unit, grid cell, and catchments.

3. Results

3.1. General Features

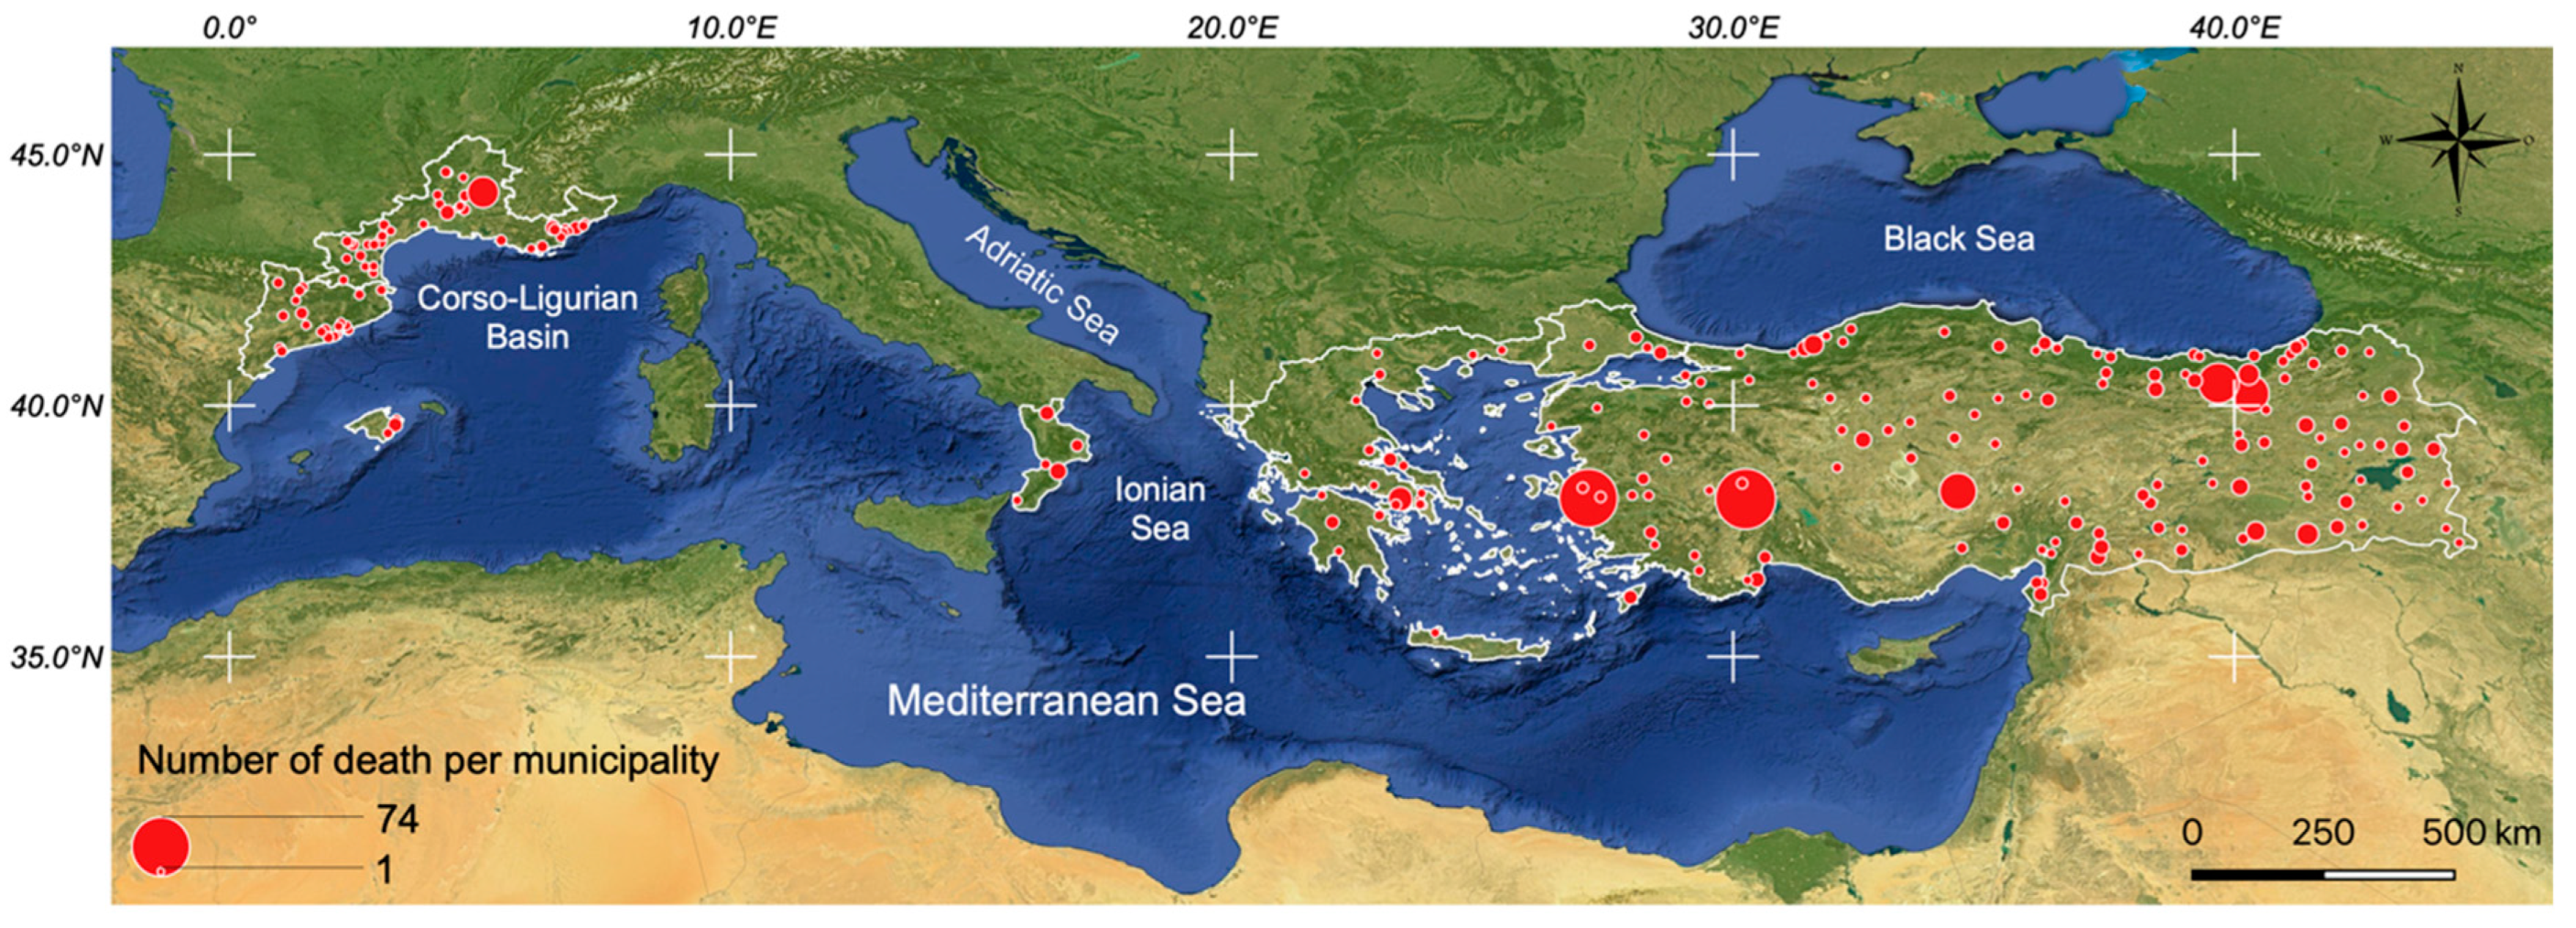
The MEFF v2.0 DB includes 1809 flood fatalities that occurred between 1980 and 2018. Table 1 and Figure 4 present the contribution of different countries to the human toll of floods in the study area.
The majority of fatalities (1242, i.e., 69%) occurred in Turkey, which also accounts for the highest part of the study area (77%) and its population (71%). Turkey contributes a great number of fatal events that occurred in the study area. Around 8 out of 10 major floods in terms of mortality occurred in Turkey, for example, the flood of 1995 (13 July) that triggered 75 deceases or the terrible flood of 27 March 1980 when 66 people died [43]. After Turkey, Southern France is the second region contributing to the human toll, with 275 fatalities, followed by Greece and Catalonia.

3.2. Fatality Rate at the National and Regional Level

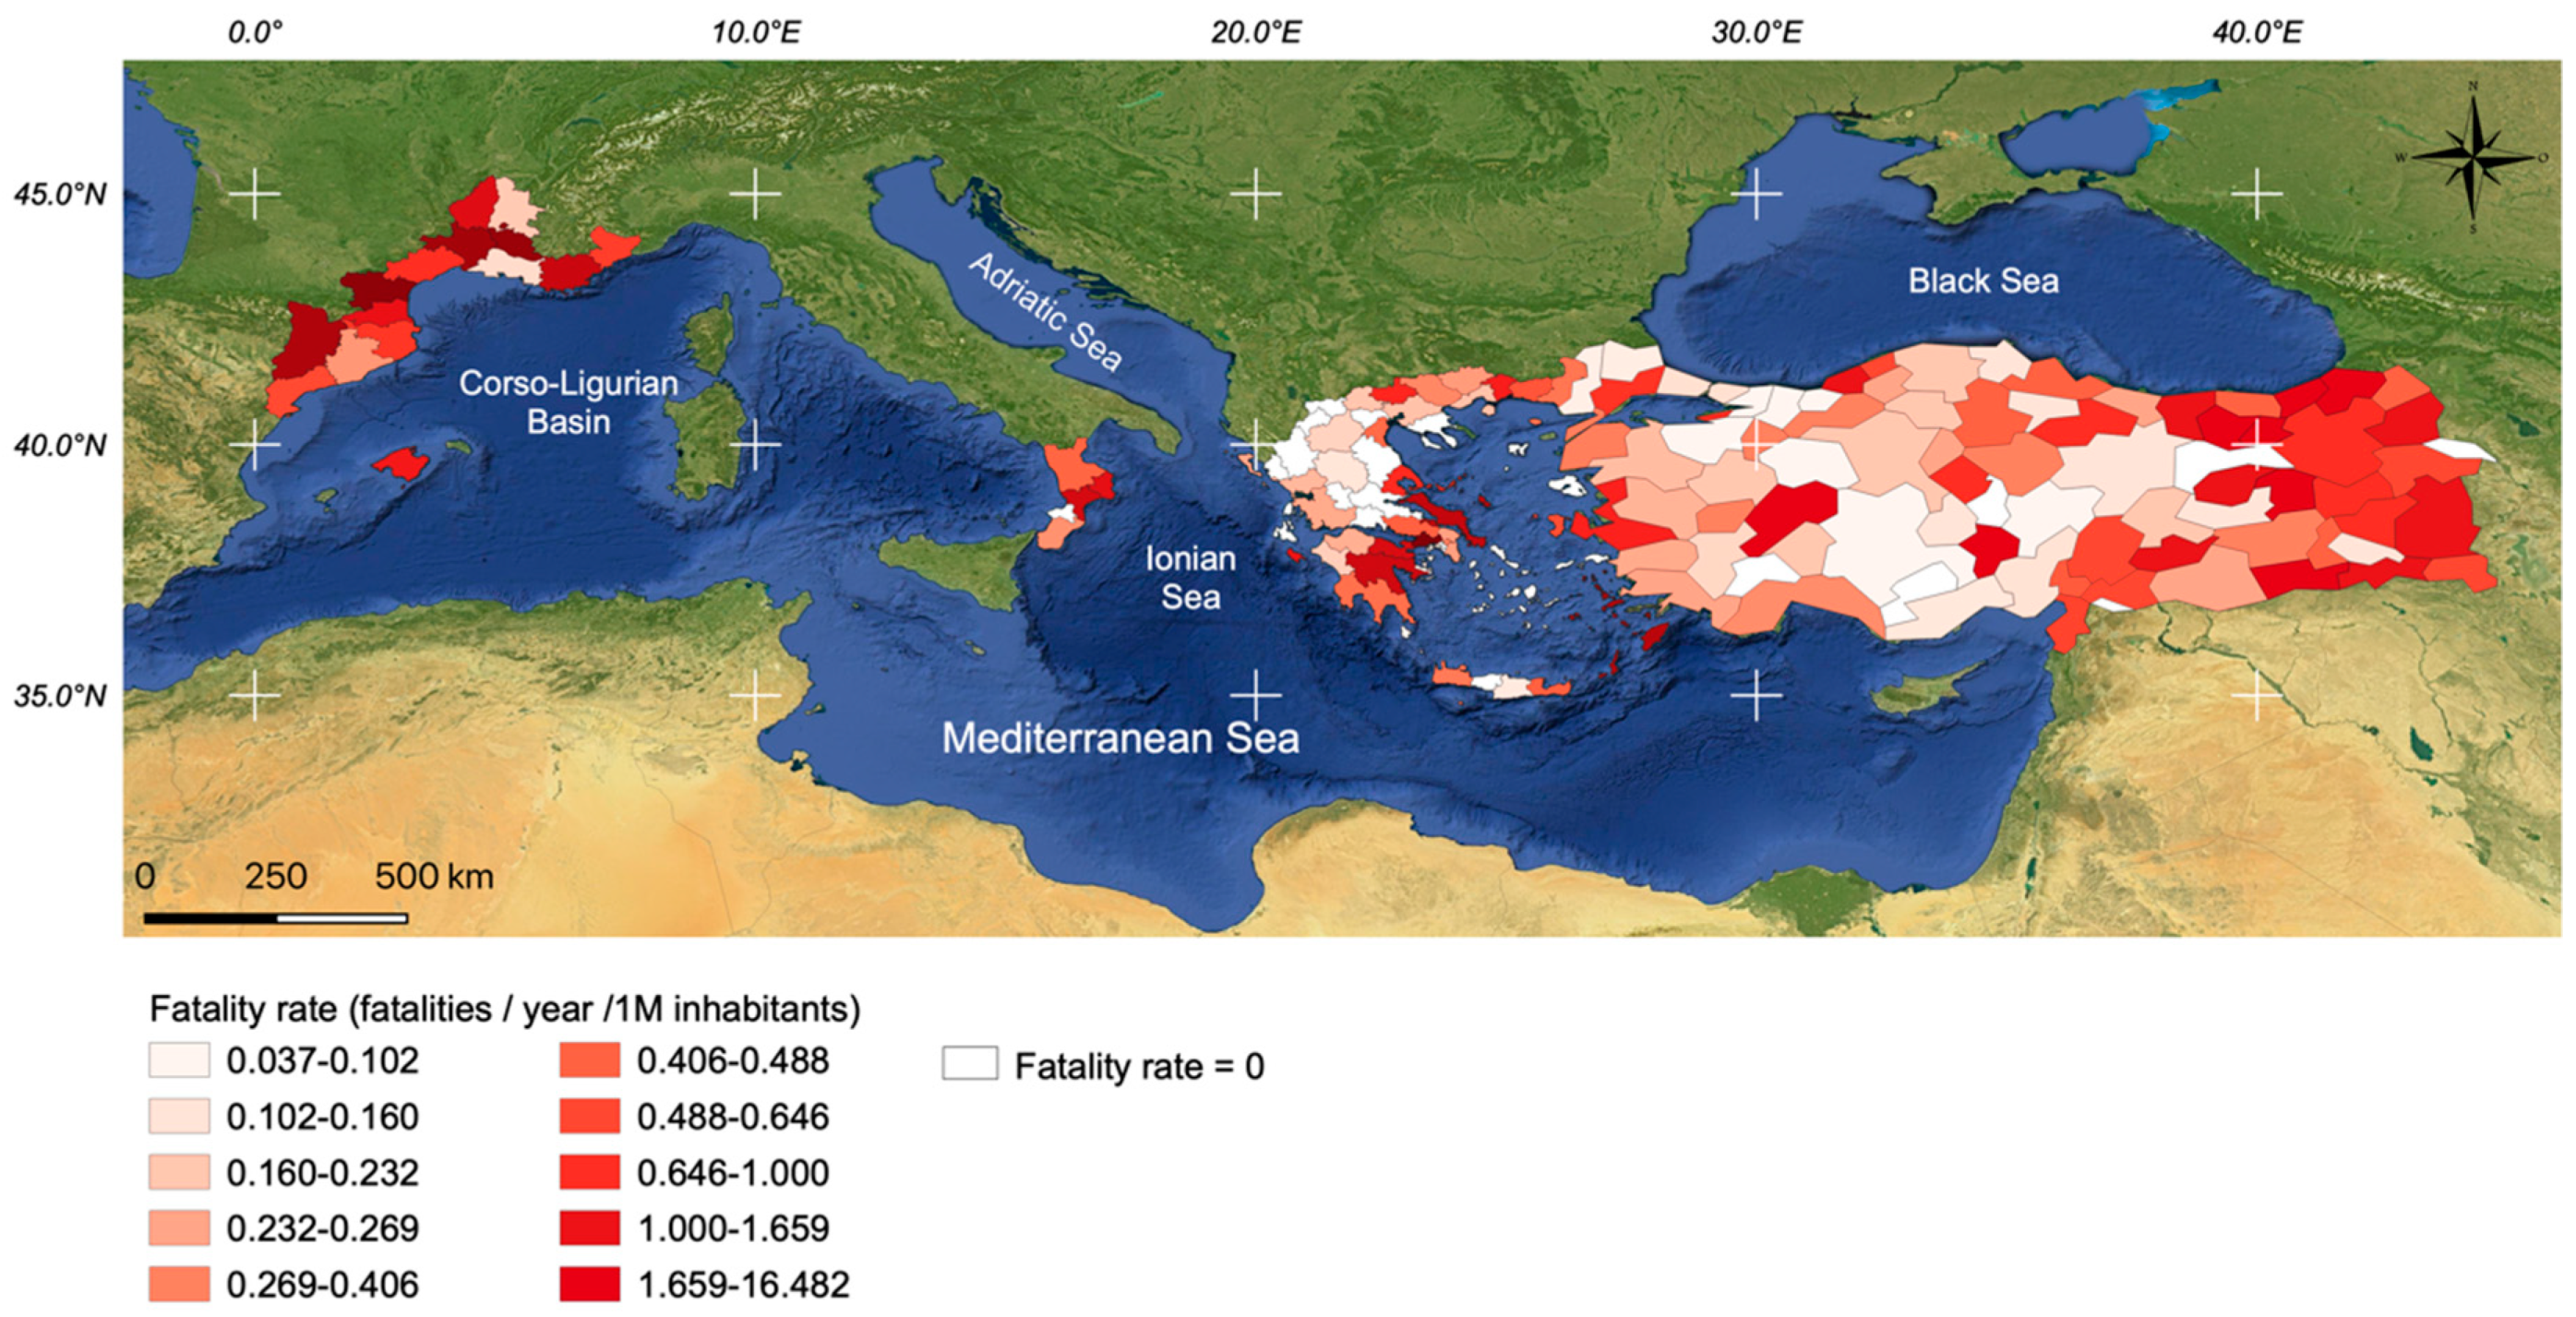
An overview of the fatality rate shows that, at the “national” level, F ranges from 0.314 (Greece) to 0.975 (Southern France). The mean F of the entire period and all the regions is 0.49 (Table 2). This means that, between 1980 and 2018, in the Mediterranean Basin, an average of one person per million died every two years because of flooding. F is roughly decreasing from the western towards the eastern part of the Mediterranean Sea, as the rate is close to 1 in France and under 0.5 in Greece or Turkey. However, this apparent opposition hides huge local contrasts.
The study area gathers 153 NUTS 3 administrative units, 128 of which exhibited flood fatalities during the study period. The F ranges from 0 to 16.5 in Bayburt (Turkey). The median value of F = 0.27, and this raises to F = 0.41 if we exclude F = 0. The map in Figure 5 shows higher values of F in the areas of the western Mediterranean Basin (Southern France, Catalonia, and Balearic Islands) included in the analysed database. In Southern France and Catalonia, F is rather homogeneous (standard deviation = 1.02) and high (mean F = 1.14). In Greece, standard deviation of F at NUTS 3 level is 0.66 and the mean is F = 0.36, which illustrates a wider dispersion of F.
In Greece, the national F rate is rather low, but F values are very contrasted among NUTS 3 regions. Western Attica (Greece) is the region with the highest fatality rate (4.22), while most of the inland regions are not deadly zones. We assume that, in general, Greece is less hit by deadly storms than southern France, for example (lower frequency of huge rainfall intensity). However, at the local level, urbanization or bad land use planning can explain contrasts between Attica and other Greek regions [17]. We might consider those results with caution because the size of administrative NUTS 3 units varies between countries. For instance, the "West Attica" unit (Greece) measures 1005 km2 and suffered from the floods of November 2017 in Mandra that caused 24 fatalities. Its population is 164,086 inhabitants, unlike the French NUTS 3 populations range from 291,000 to 1,827,719 for a 5387 km2 mean area.

3.3. Fatality Rate at the Local Level (Grid)

To smoothen the effect of NUTS 3 size over different countries, we aggregated data and we calculated F according to two meshes: a 20 km mesh and a 50 km mesh.

3.3.1. Large Size Grid

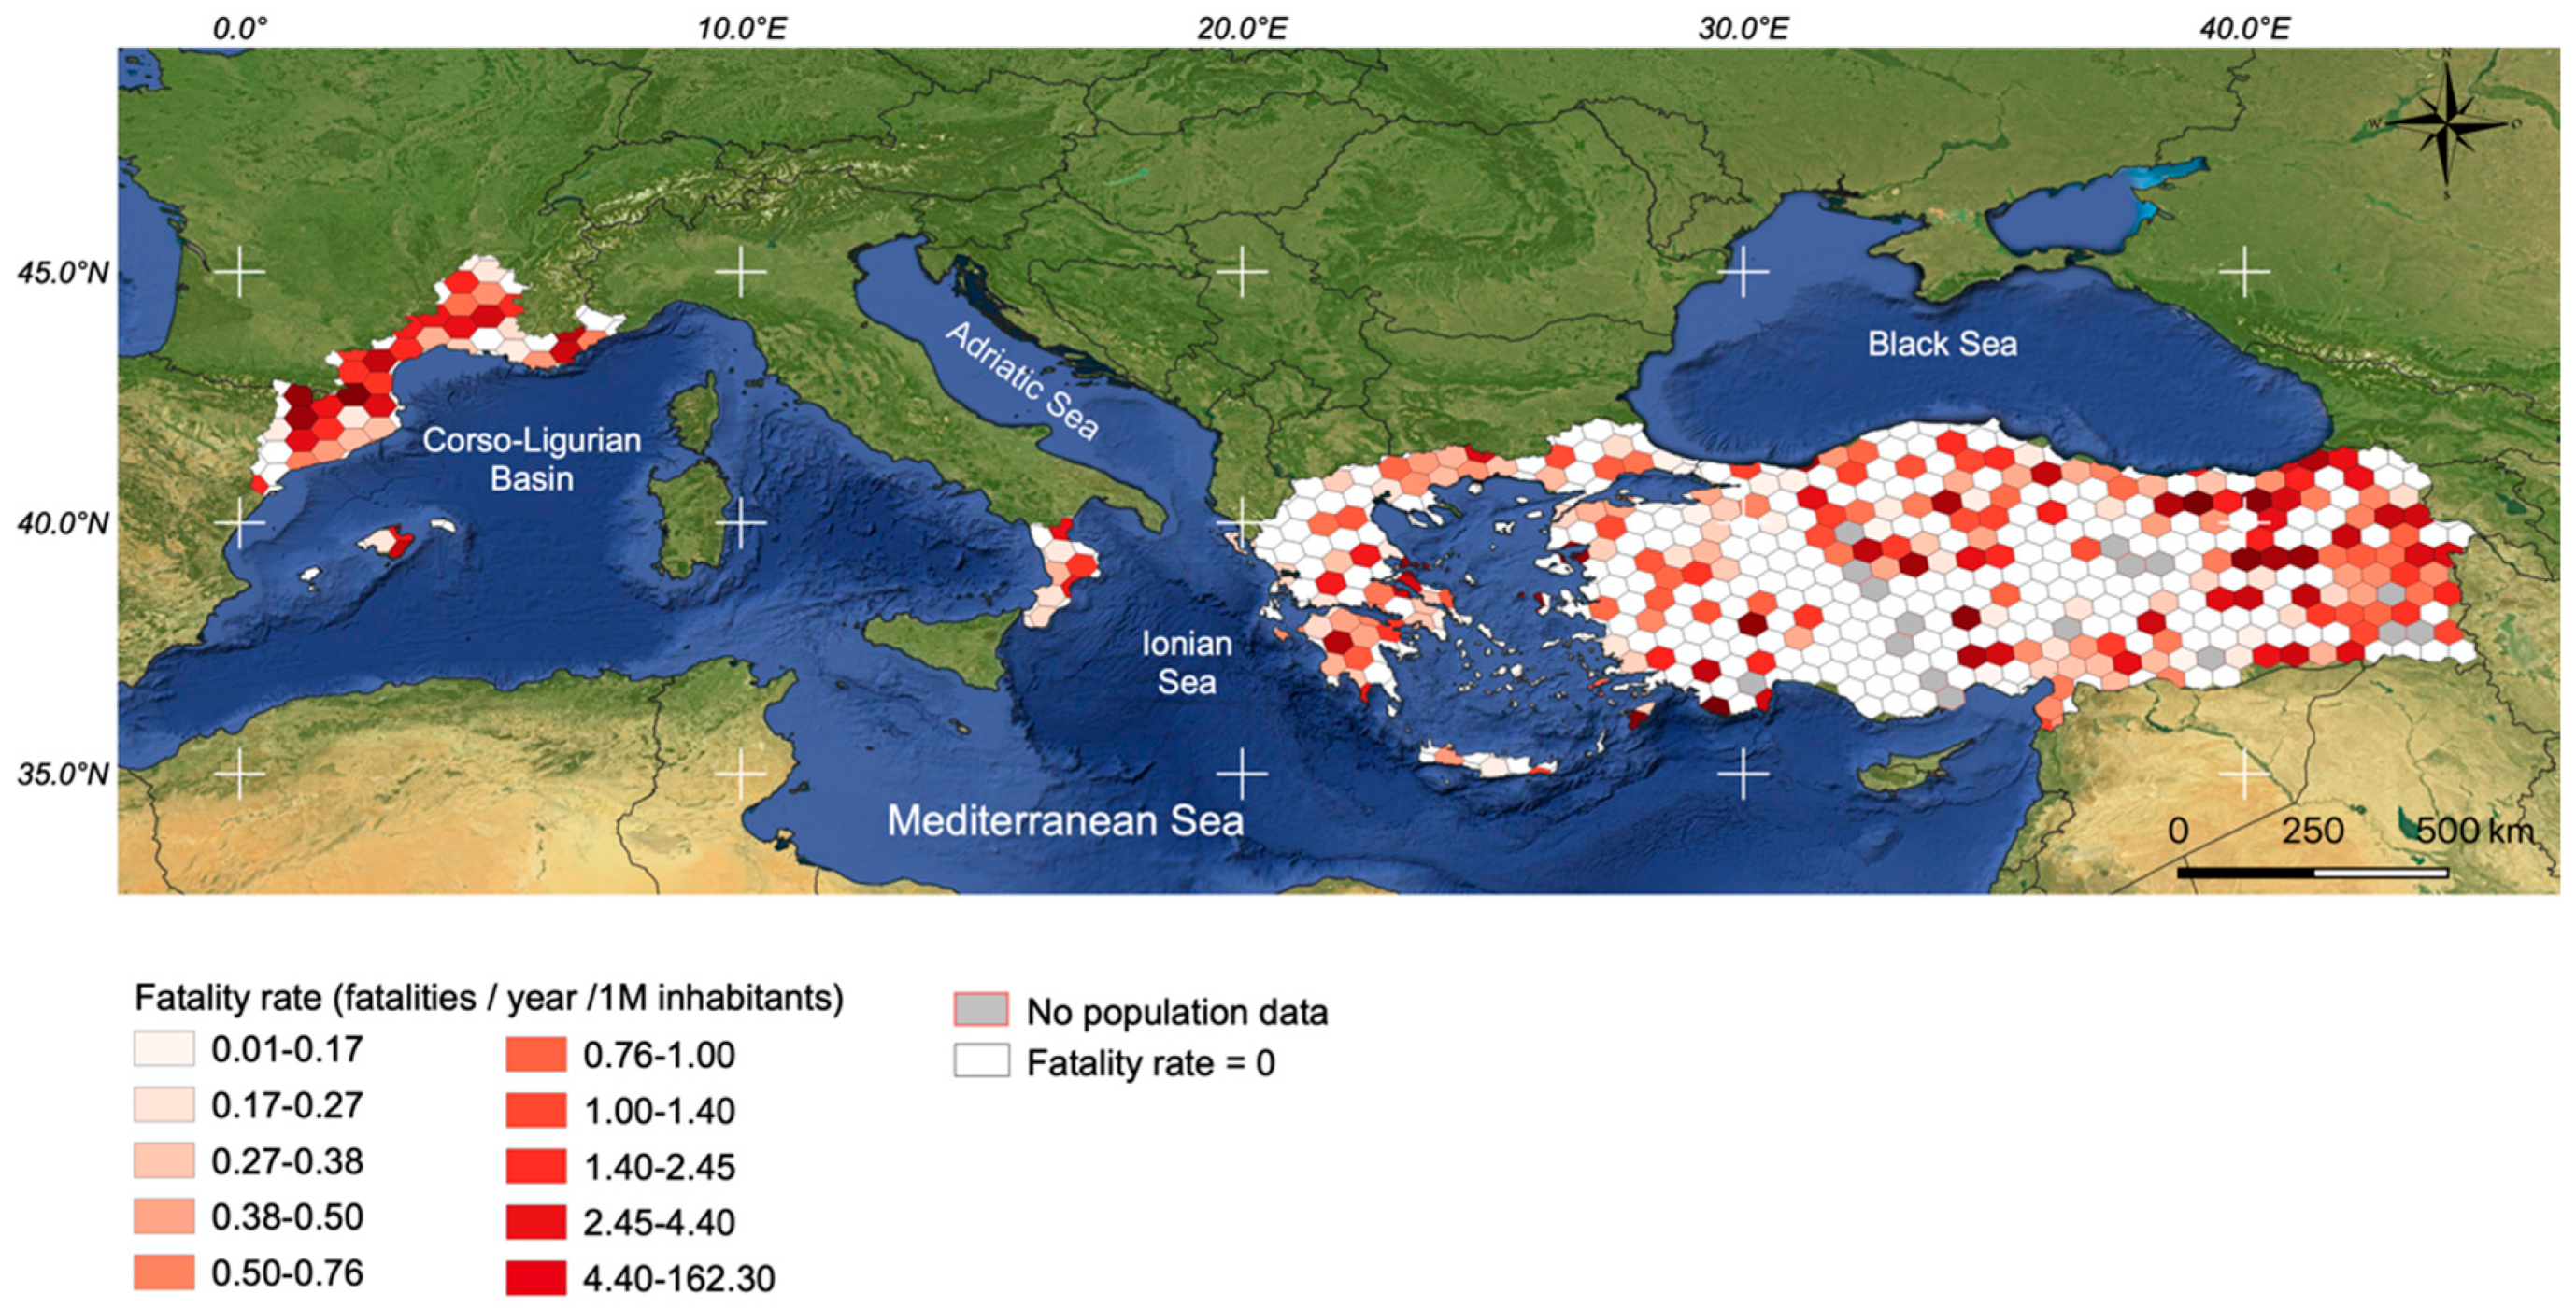
The 50 × 50 km hex grid mortality map shows the general trends in the geographical distribution of mortality at the Mediterranean Basin level. In the western basin (Catalonia and France), the fatality rate is rather homogenous and high. The spatial pattern of the flood mortality is more scattered in Calabria, Greece, and Turkey, more depending on the location of any huge flood event.
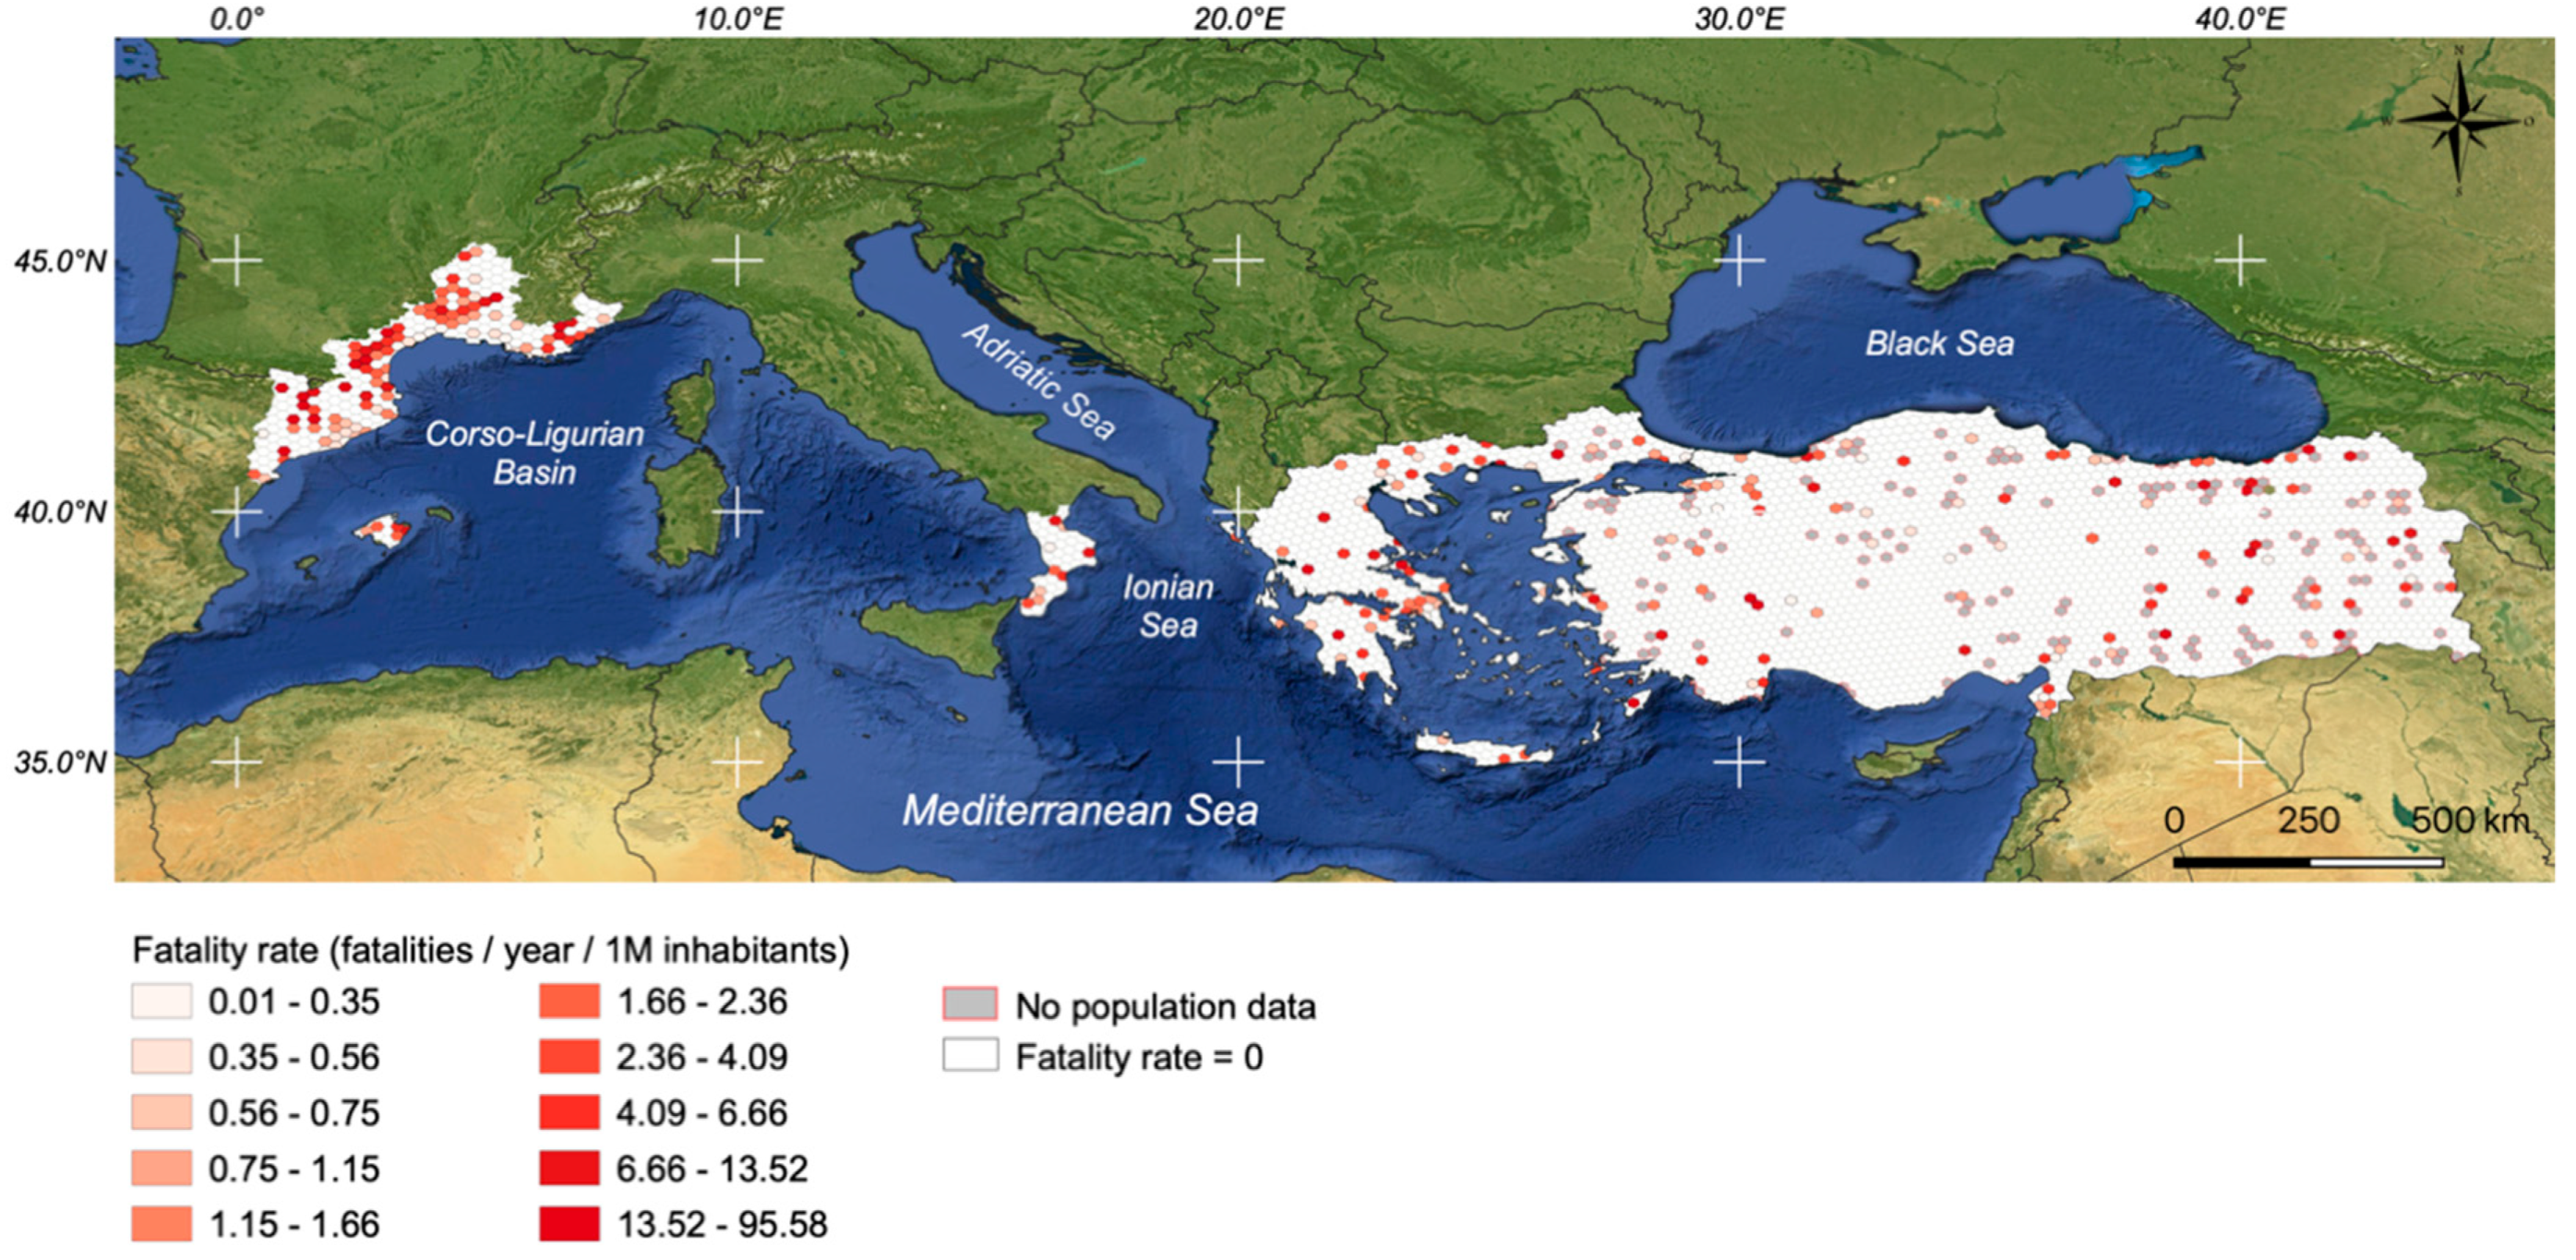
Of the ten grid cells with the highest F (F > 12), seven are in Turkey, especially Eastern Turkey (Figure 6). On the other hand, if Turkey is excluded, six of the ten highest F-cells (F > 4) are located in the western part of the basin (Southern France, Catalonia, Balearic Islands).

3.3.2. Small Size Grid

The 20 × 20 km size grid shows a variable distribution of mortality, highly dependent on the location of the flood events (Figure 7). In Calabria, Greece, and Turkey, the 20 × 20 km grid is not appropriate, as the number of fatalities is concentrated in some places.
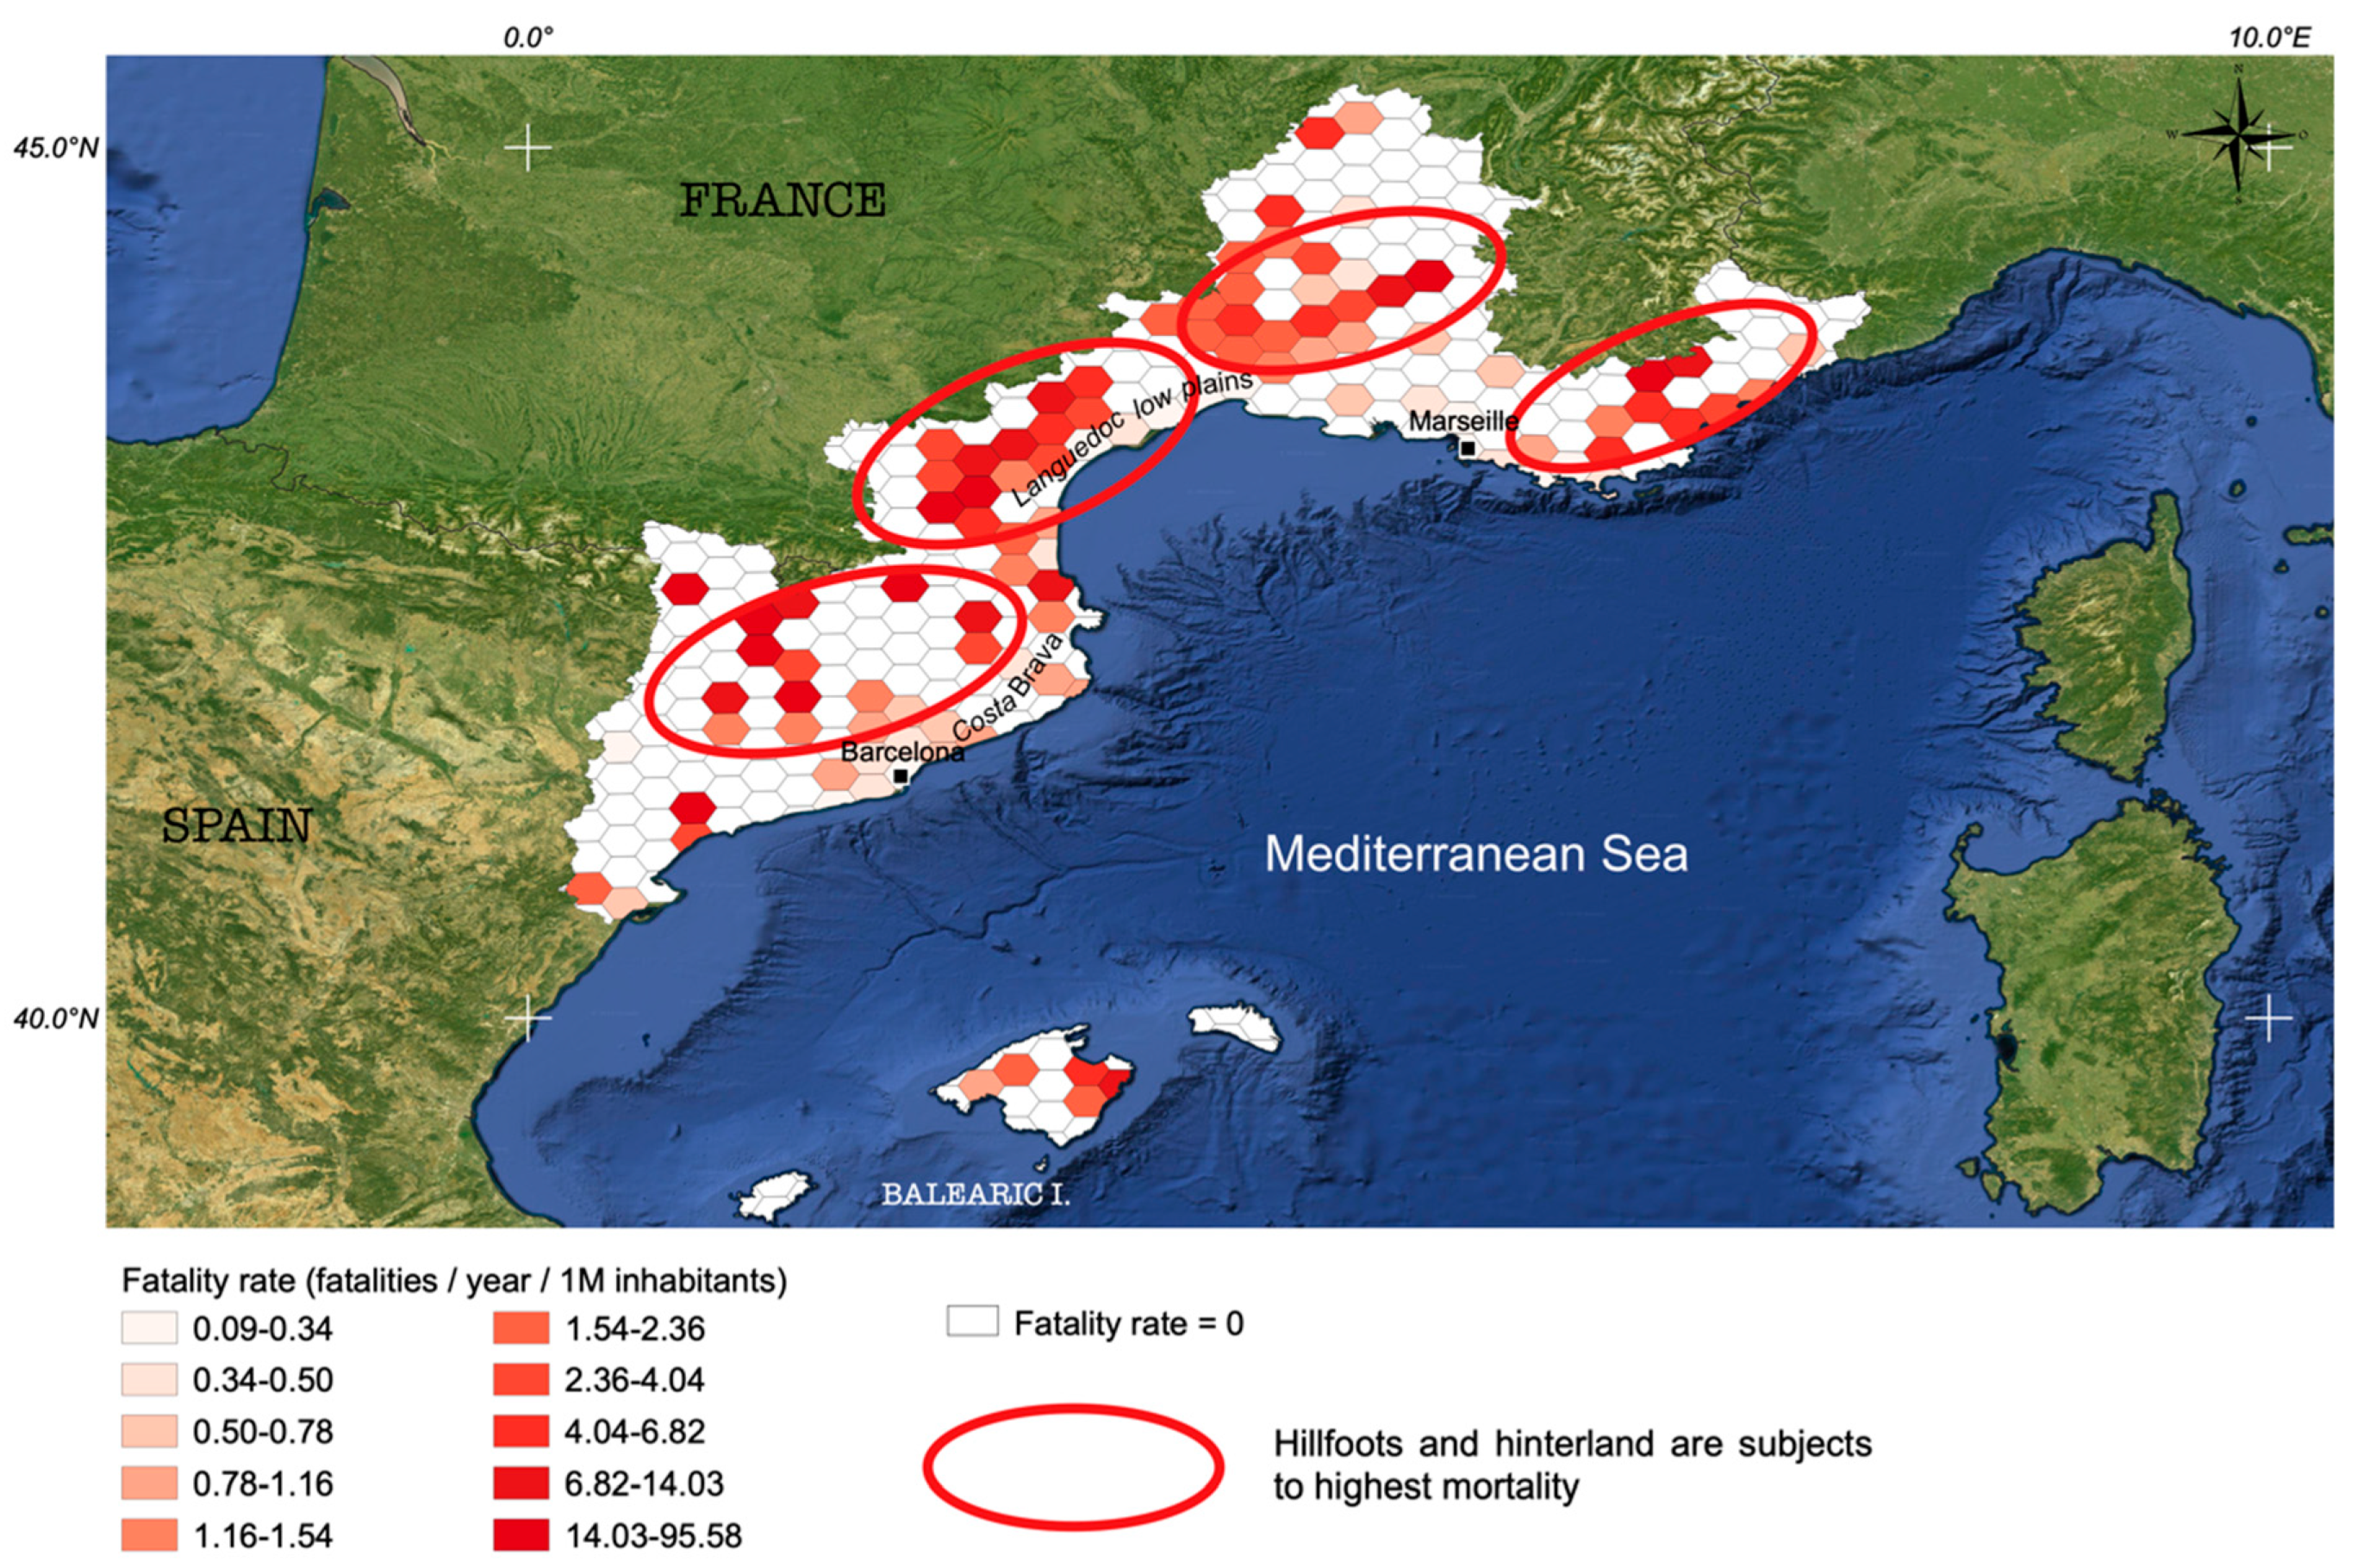
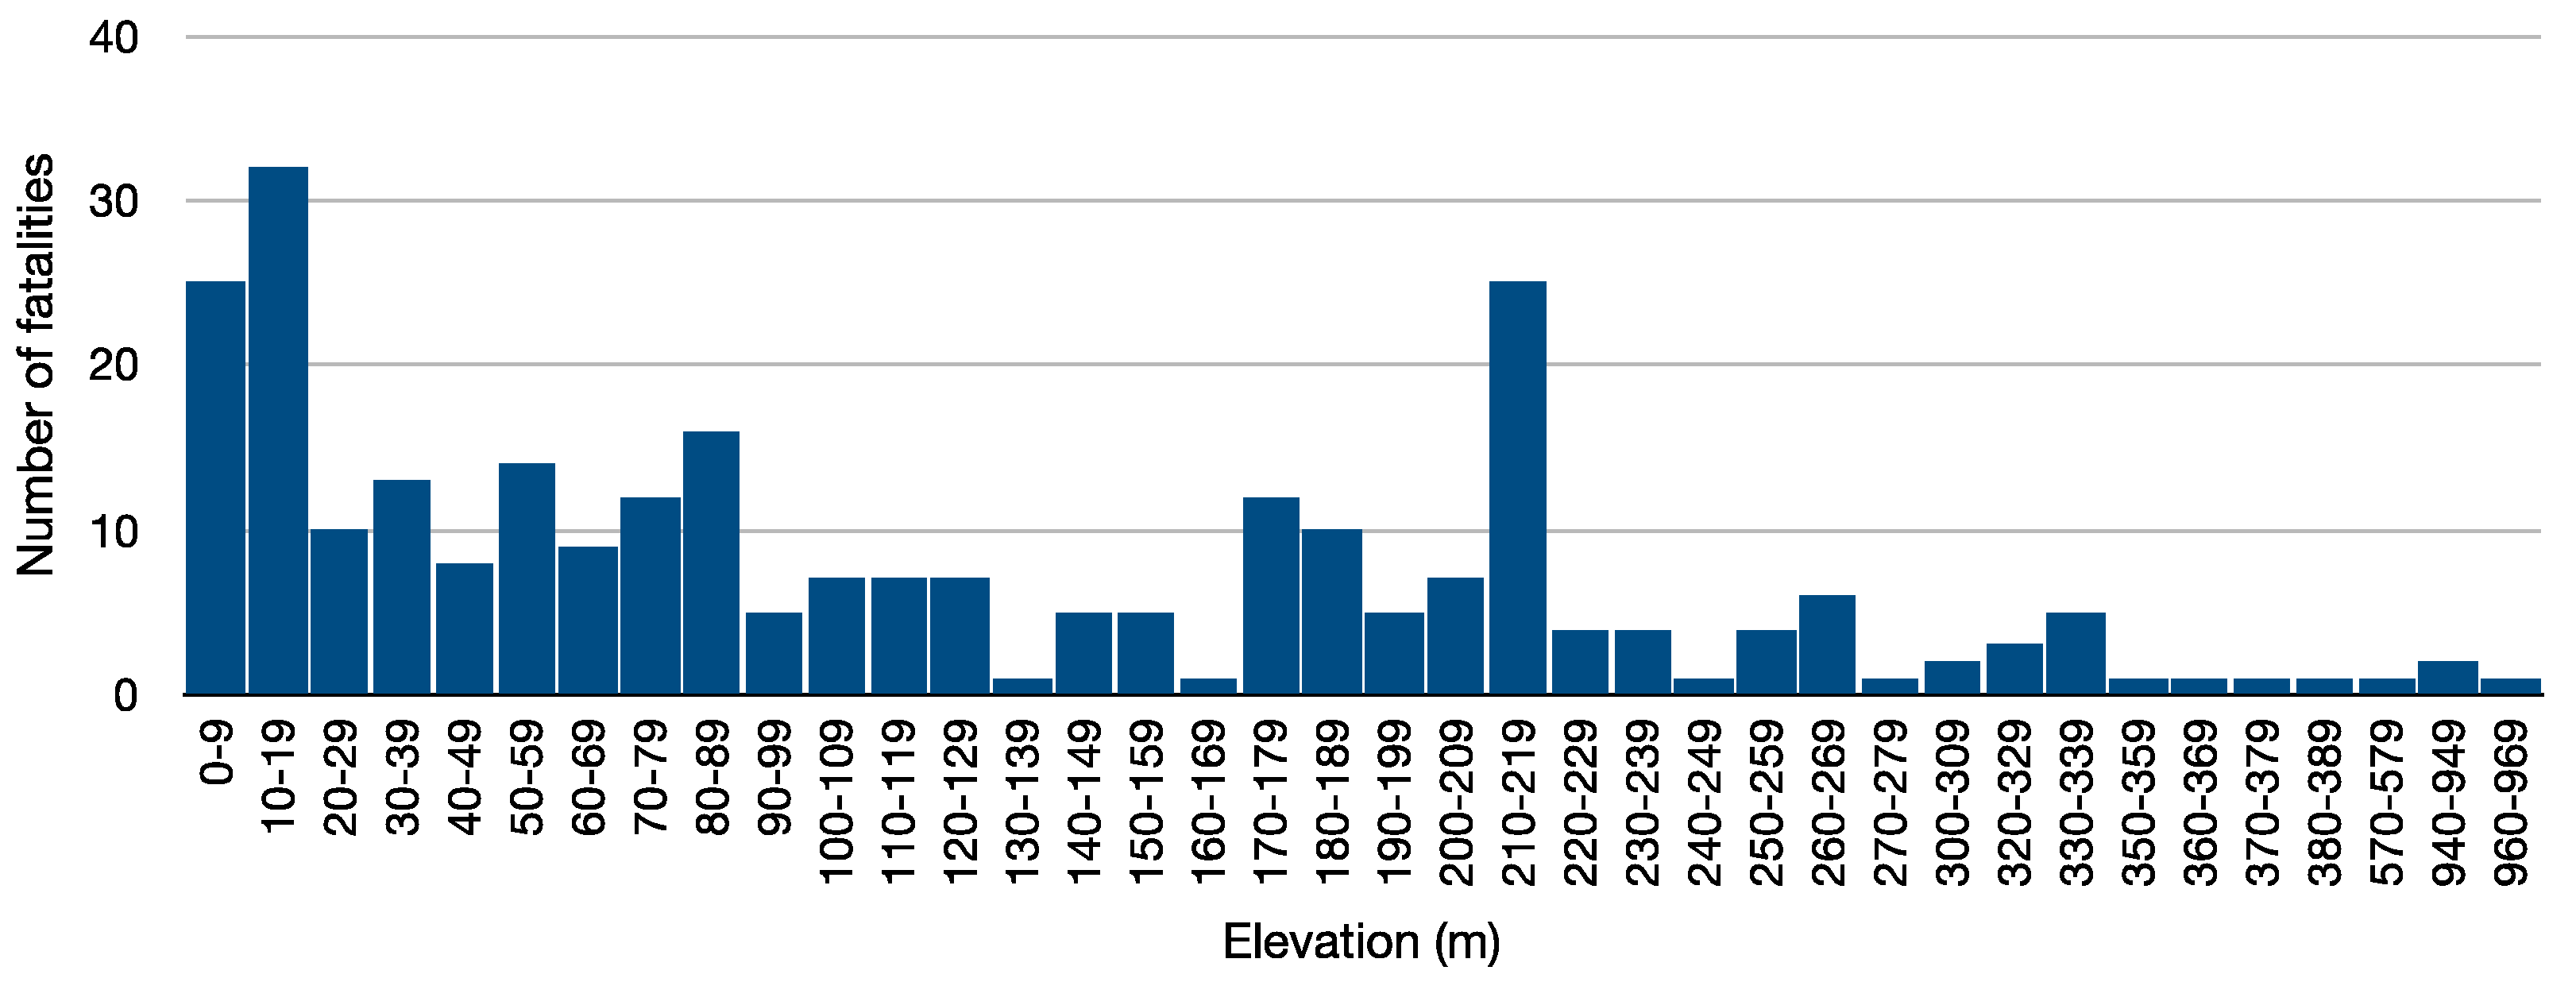
Conversely, this grid map is more relevant to smoothen the spatial variability of mortality at the local scale, where the density of fatalities is sufficient. Indeed, a focus on the western Mediterranean Basin provides a better understanding of the structure of mortality (Figure 8). The highest fatality rates are located in the Mediterranean hinterland, in particular in Southern France and Catalonia, that is, in the piedmonts areas, which combines the outlet of large rivers with high population densities [44]. In Southern France, for which we know the accurate altitude for each death, the number of fatalities is higher in low plains (altitude 0 to 20 m) (Figure 9). Nevertheless, as the population density is high near the coast, the F values are rather low, especially in Languedoc low plains. During major rainy periods, however, deaths also occur in foothills areas, where upstream valleys widen and urbanization is present (cf. flood events like Lamalou-les-Bains, 2014; Vaison-la-Romaine, 1992; Aude, 2018; Draguignan, 2010, among others). Such fatal events correspond to altitude zones of 50 m to 220 m (Figure 9). We can see the same opposition between the coastal zone and hinterland in Catalonia.
Indeed, around the Mediterranean Sea, we can divide catchments in three parts. Upstream, altitude is over 300 m and even if huge rainfall events are frequent, the density of the population is low and few people are living in flood prone zones. Flood fatalities occur mostly outdoors, for example, when people try to ford a river [35,45]. The median zone of catchments, namely piedmonts or foothills, is a zone of transit for stream flow generated upstream. The speed of flow is fast (3 to 7 km/h) and the density of the population is higher (30 to 60 inh/km2). Owing to the lack of flat field and the narrowness of the valleys, the population is concentrated around riverbeds. Low plains are also prone to flood risk, especially when dikes break, but the fatality rate is relatively low given the high population density (over 100 inh/km2). The piedmonts thus combine different factors of danger, especially high-speed flows and the lack of a place that leads to a dense occupation in valleys [46]. Flash floods on small coastal catchments are also very important, although F is low because of the great concentration of people in coastal villages and, consequently, the rate between fatalities and the local population is low [30].

3.4. Fatality Rate at the Catchment Level

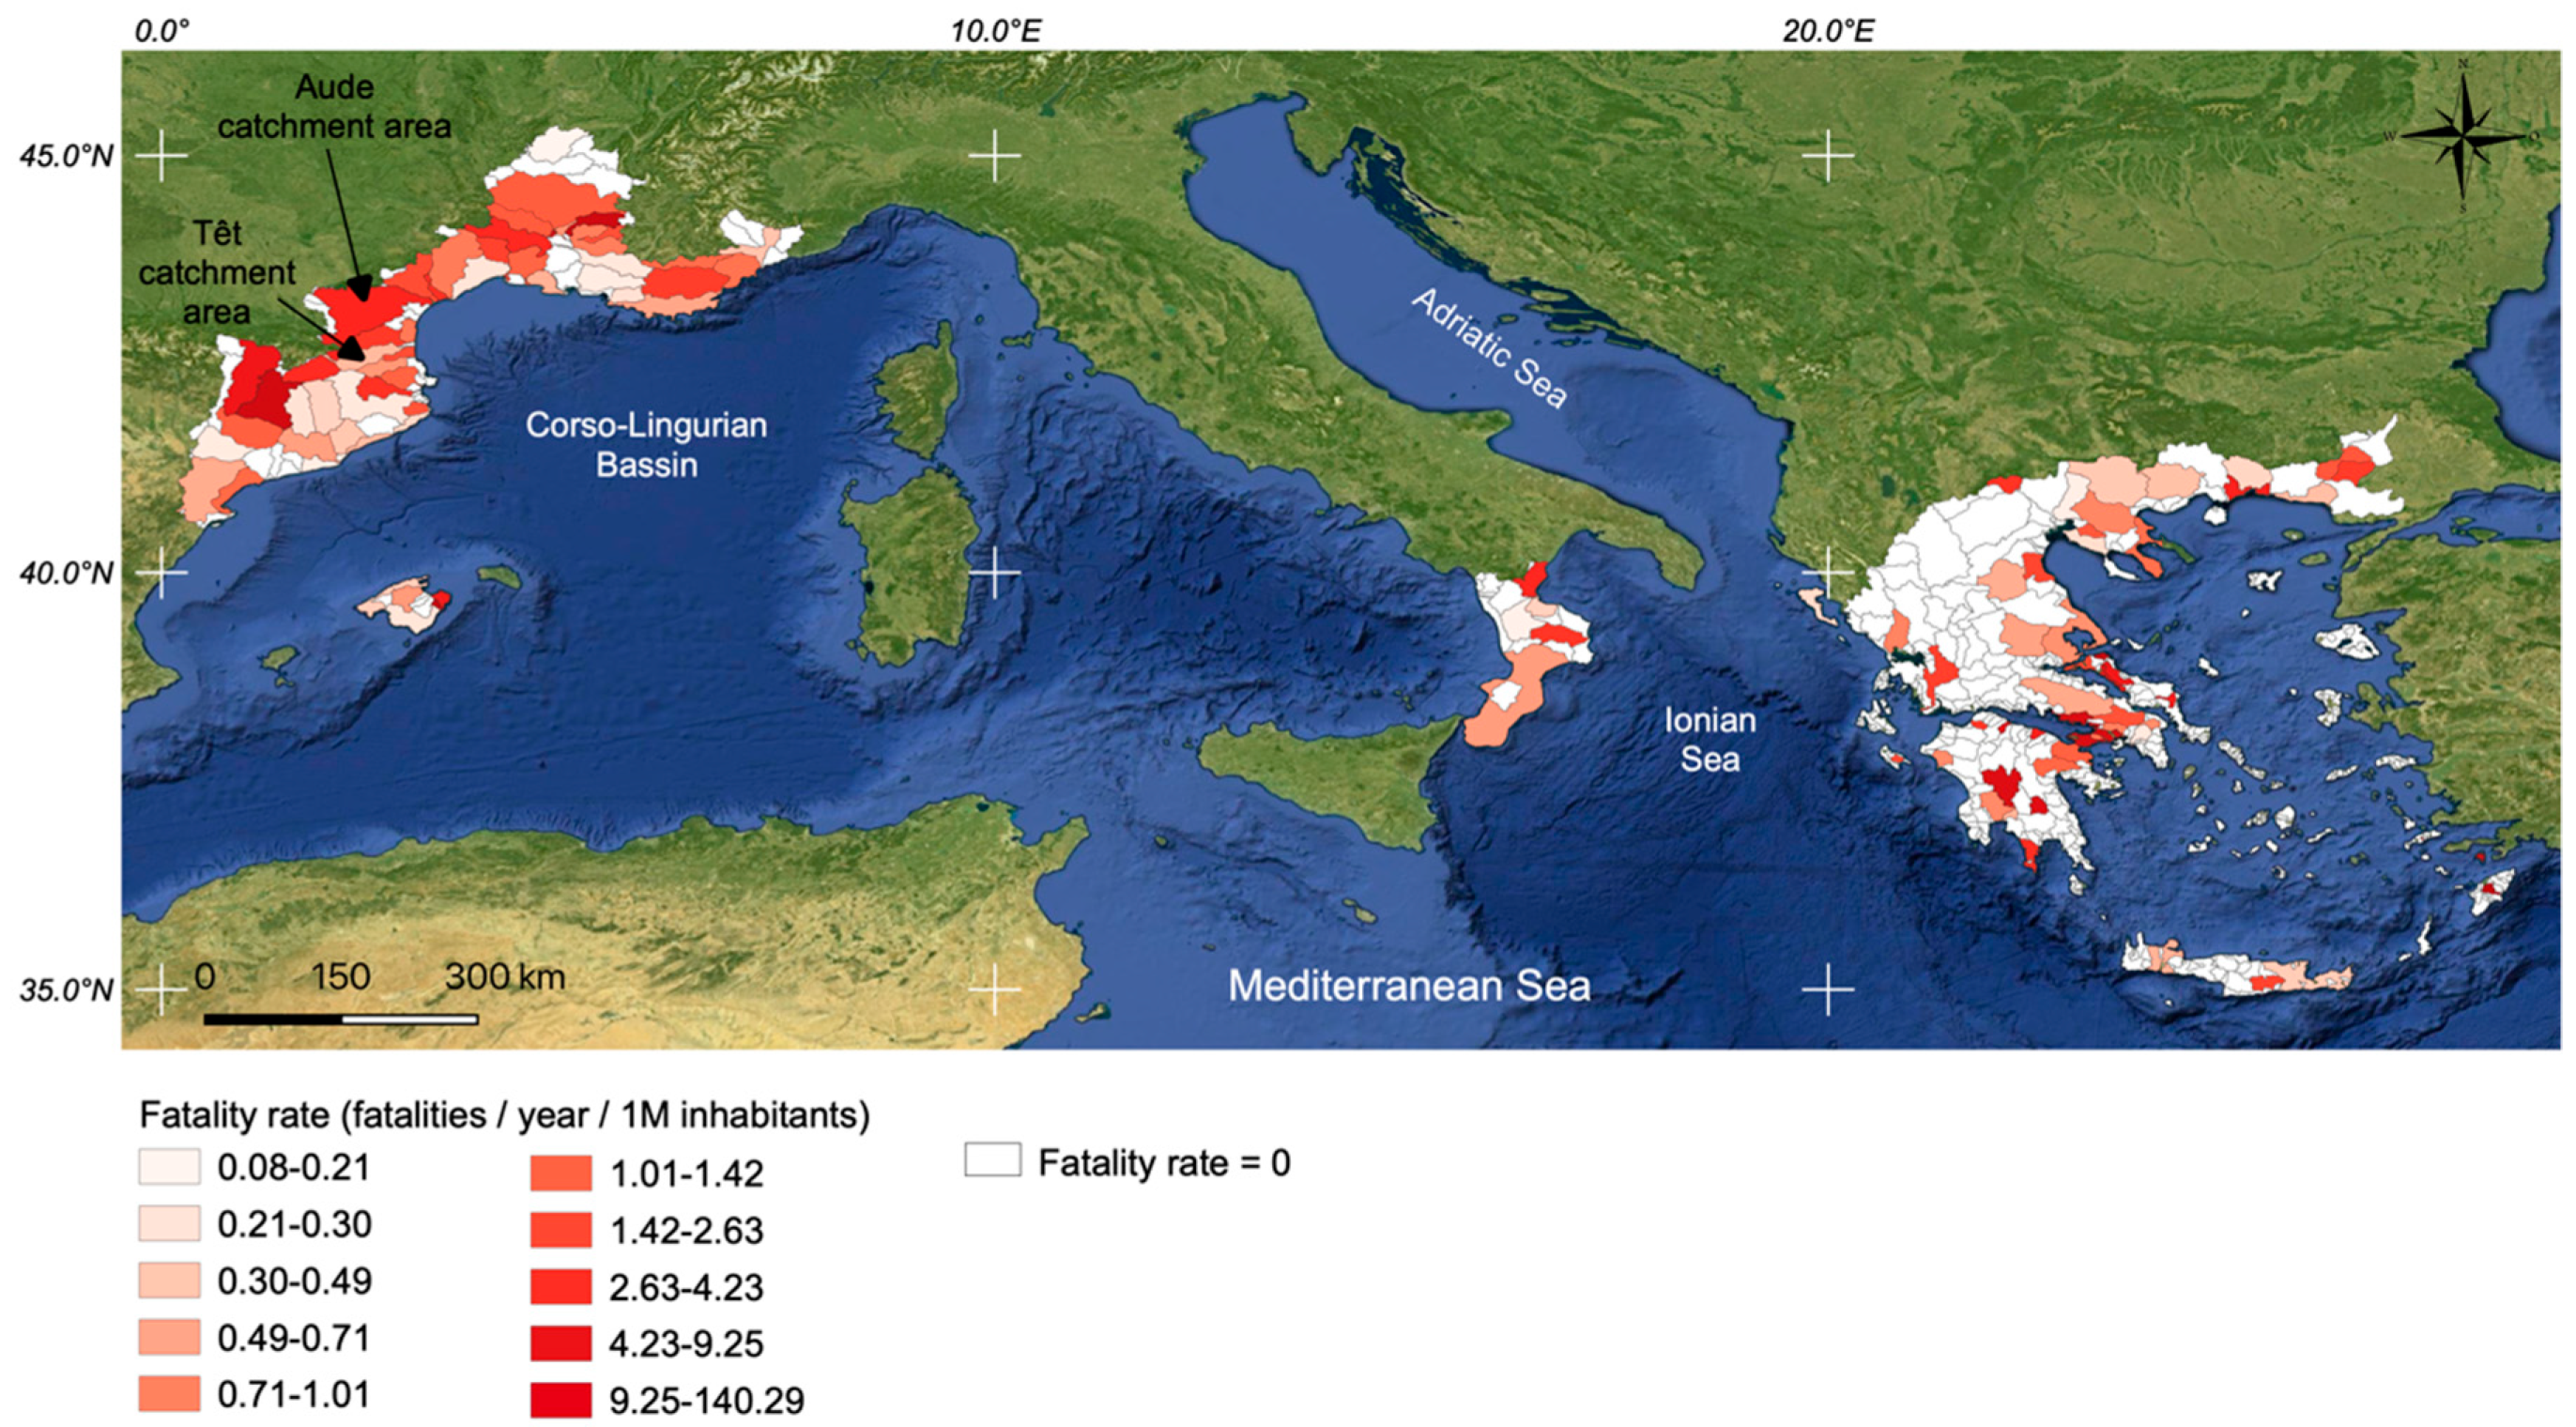
Another way to map mortality is to aggregate data at the spatial level of catchment (Figure 10). For people in charge with flood prevention in the frame of catchments, it would be interesting to know the frequency of fatal flood events in order to assess prevention measures. As in the 20 × 20 km grid, the map show that the catchments of the hinterland hills are highly exposed to mortality (Catalonia, France). Nevertheless, comments must be cautious. Owing to the short time period (39 years), the fatality rates in catchments are closely dependent on whether or not a major flood event occurred during the period in the catchment. The map shows huge discrepancies between catchments, including neighboring ones. For instance, in Southern France, the Aude River basin underwent 43 victims in five fatal flood events over the analysed period. F is 4.47. Conversely, in the neighboring basin of Têt river, F is 0.47 (Figure 10). The highest F rate at the catchment level reaches 140 in a small catchment of Rhodes Island in Greece. In this catchment area, there were nine fatalities for a scarce population of 1645 inhabitants. Regardless of the variability of the location of huge flood events, further investigations would be necessary to explain the differences in mortality between catchments. The average value of the slopes over the catchment could be determinant because the steeper the slope, the faster the flow speeds, which is an additional risk factor [3].

3.5. Spatial Discrepancies in Seasonality

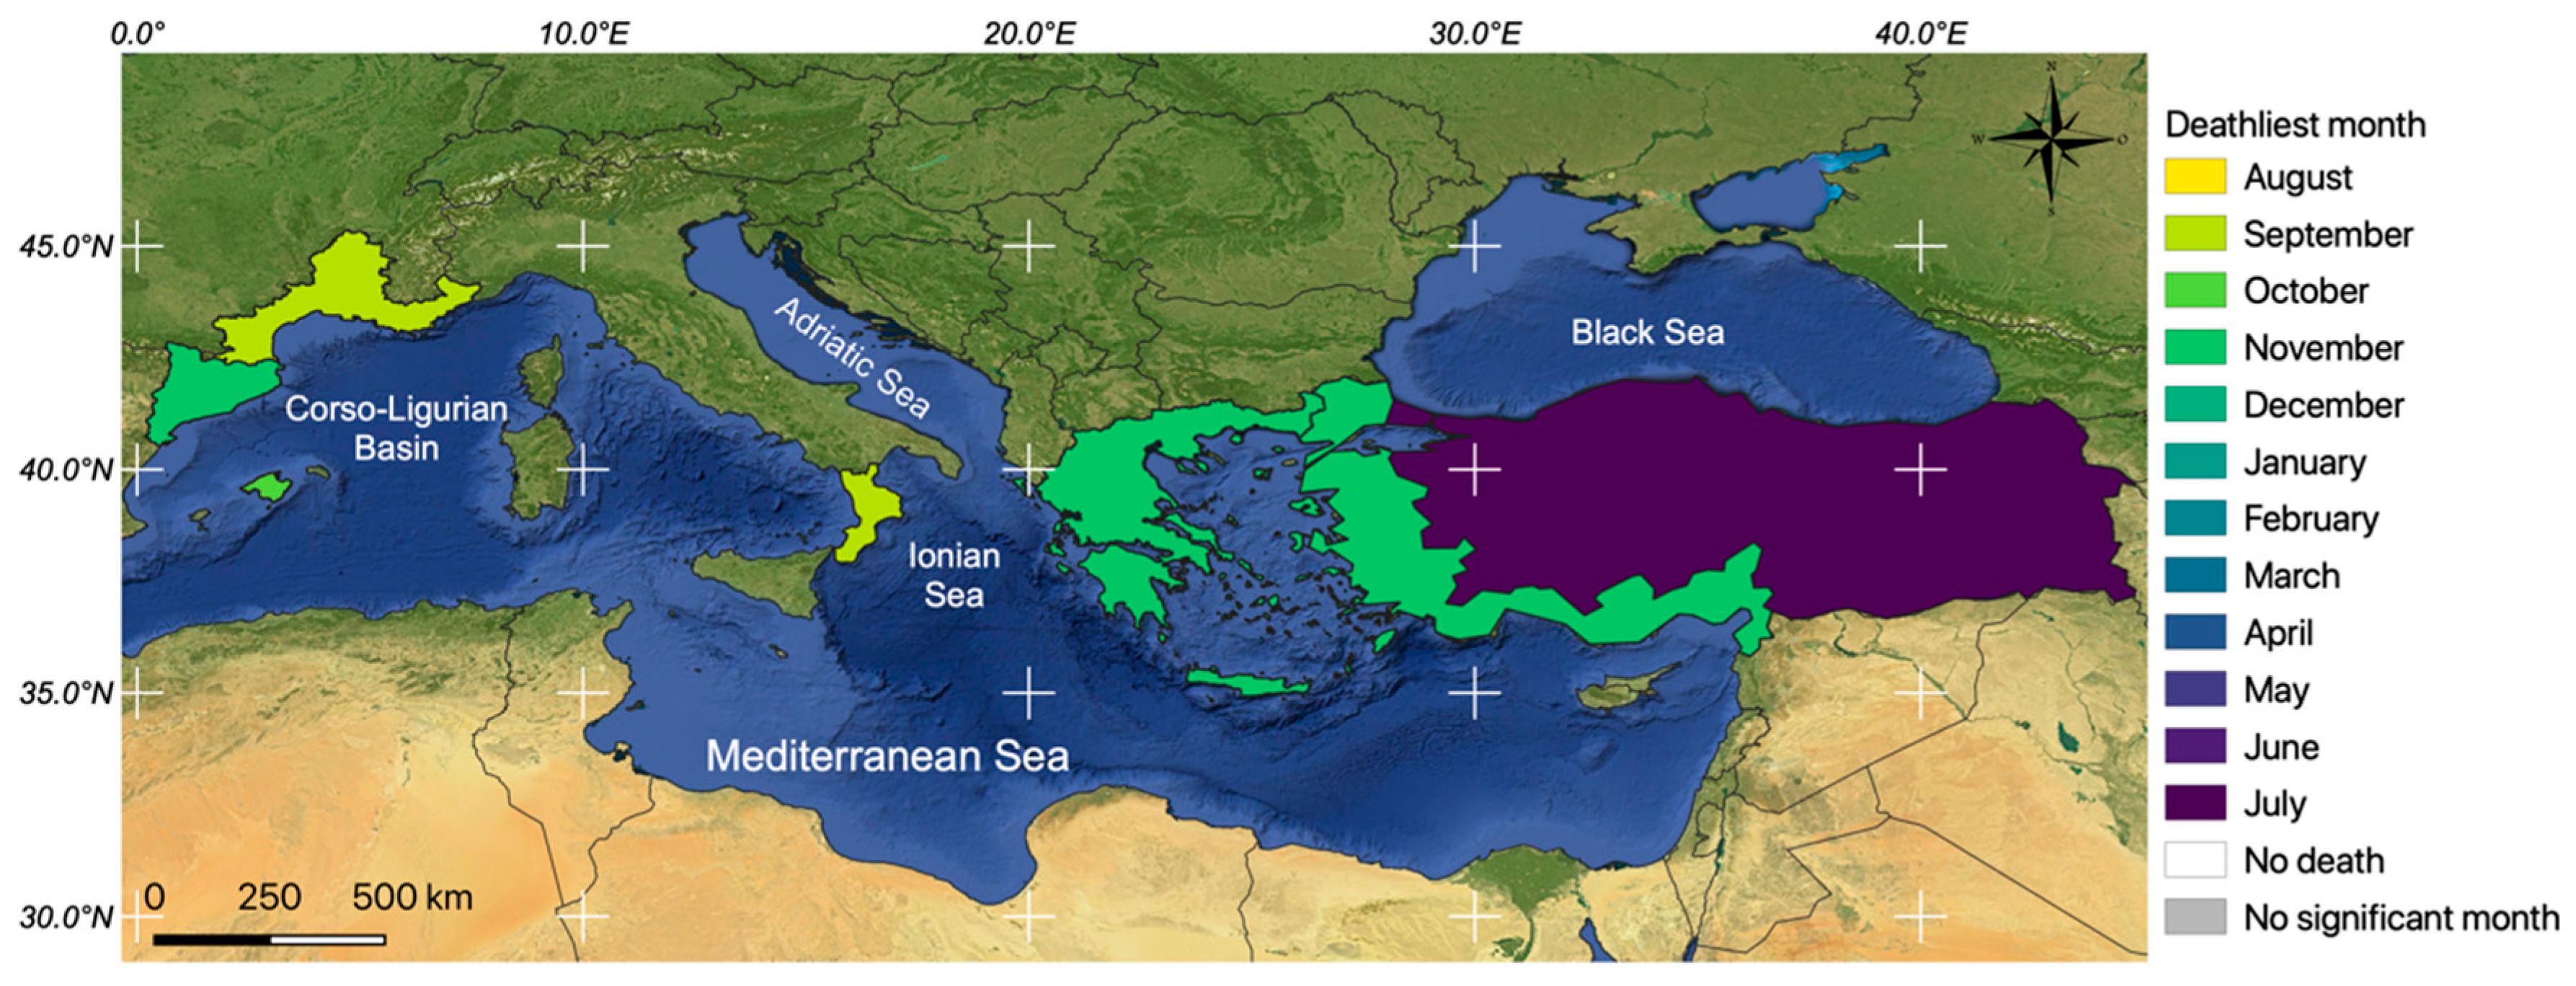
The west–east decrease of F at the regional level is coupled with a seasonal evolution. A different monthly distribution of fatalities is observed between the western and eastern Mediterranean Basin (Figure 11, Table 3). In the western basin, deaths are concentrated in September and October. September is the deadliest period in Southern France and Calabria, and October in the Balearic Islands. In Catalonia, the most fatal month is November. In Greece, the mortality peak is also in November, but a significant number of flood fatalities are also observed in winter, the season during which flood fatalities in Catalonia are very rare. These results are consistent with the preliminary study shown about floods’ distribution in the Mediterranean [47].
The monthly distribution of fatalities follows the frequency of huge events in the Mediterranean Basin [47]. The Mediterranean Sea acts as a source of heat and moisture that, in conjunction with the surrounding complex topography, plays an important role in the intensification of precipitation events [48]. Subsequently, the steep small catchments in the area favor the rapid concentration times, resulting in runoff that can rapidly induce devastating floods [49]. The western part of the Mediterranean is affected by storms and cyclonic activity earlier in autumn (September and October), while the storminess and cyclonic activity over the eastern Mediterranean increases later on in November and in winter [50,51]. In Southern France, data confirm that intense rainfall events are more frequent in September–October, which is consistent with monthly mortality (http://pluiesextremes.meteo.fr/france-metropole/IMG/sipex_pdf/saison_mois_plus.pdf). A fine-grained analysis could show differences within the regions themselves. Catalonia is mainly affected by flash floods produced by local convective activity that is developed on the sea or forced by littoral and prelittoral mountains, where short and torrential streams are born. As more than 60% of the population lives on the coast, and this percentage increases in summer due to tourism, local impacts are strong, producing some fatalities usually owing to imprudent behaviors [30]. Usually, summer events are produced by local and heavy precipitation that, with some exceptions, gives place to one or two fatalities. On the contrary, floods that trigger in autumn and winter are associated with organised long-lasting convective events or long periods of stratiform precipitation forced by synoptic conditions, in which embedded convection can be developed. Then, it can produce catastrophic and more extended events with a greater number of fatalities. During autumn, the warmer Mediterranean Sea favours instability that can be organised by a mesoscale low in the Catalan-Balear Sea. Then, Mesoscale Convective Systems can affect a more extended region, with total precipitation above 200 mm/24 h and more probabilities of having deaths. In some occasions, this kind of systems arrives to France (i.e., September 1992 and November 1999) [52].
Regarding the Balearic Islands, the maximum yearly precipitation occurs in fall, with slight differences between the Islands owing to its geographical characteristics. Those rainfall events are related with the cyclogenetic activity in the western Mediterranean, which is common in autumn. Amounts can easily reach 100 mm/24 h and even 200 mm or more, and some rainy days account for more than half of the monthly precipitation total. Moreover, fall is the season with the largest number of floods events and flood-related fatalities as a result of those rainfall totals.
Greece is characterised by a Mediterranean type climate. Papagiannaki et al. [53] show that autumn, and particularly November, shows the highest frequency of damaging rainfall events in 2005–2014 in Attica. During spring and summer, rainfall amounts are small over the major part of the country, with the exception of the mountainous areas of western and northern Greece, where thunderstorms are frequent [54]. Especially during summer, the eastern part of the country as well as the Aegean Sea are influenced by strong and dry northern winds, named etesians [55]. During autumn and winter, rainfall amounts are quite high over the western part of continental Greece and over the western part of Crete island, where they may reach or exceed 2000 mm/year. During the same period, yearly accumulations up to 400–600 mm are observed on average over the eastern part of continental Greece, while the islands of the Aegean Sea are much drier. Flash floods over Greece are associated with heavy precipitation produced by intense and sometimes explosive cyclone activity [56,57], but also by less intense cyclones with relatively long-lasting embedded mesoscale convective systems that interact with the complex topography of the area [58].
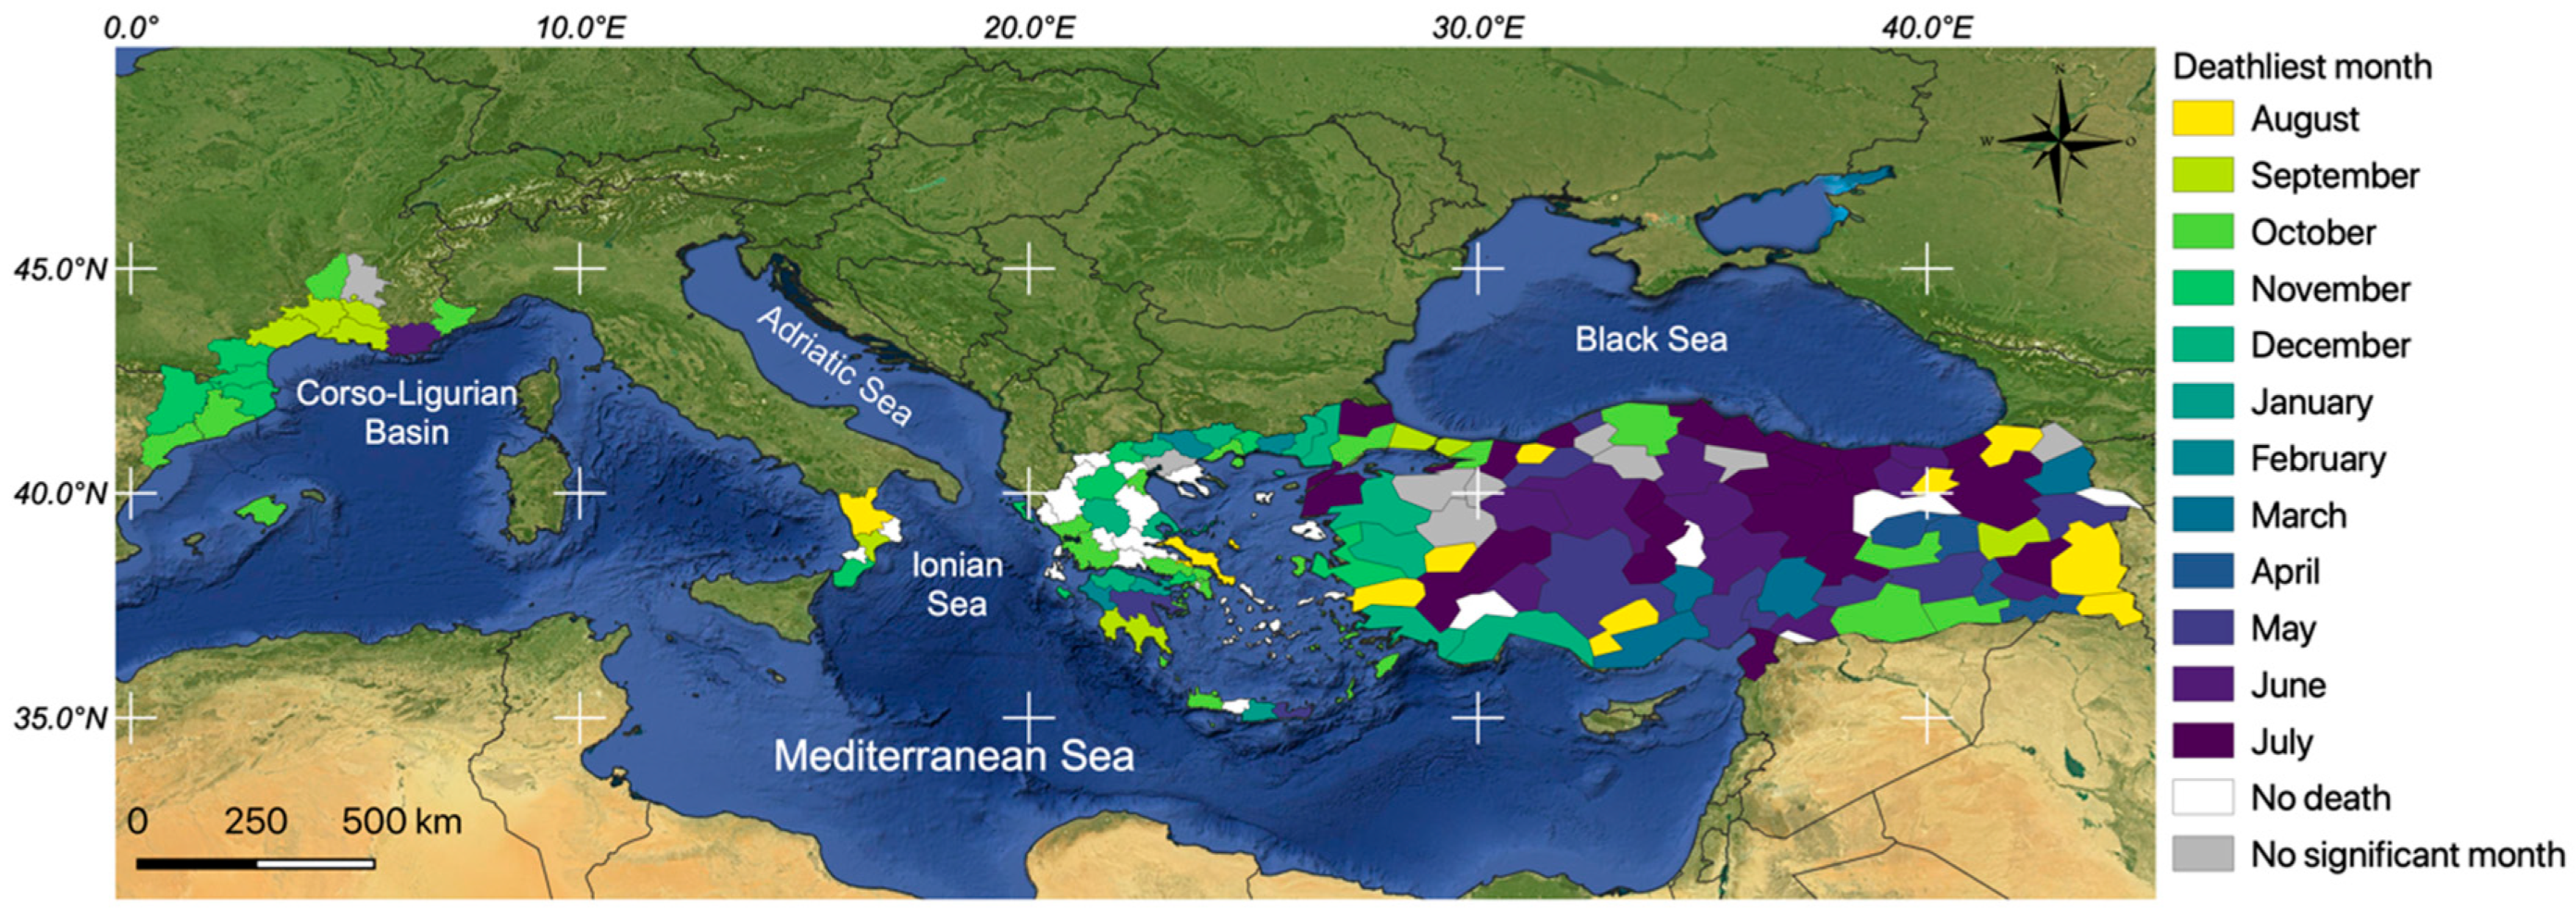
In Turkey, the monthly distribution of fatalities is scattered between the spring, summer, and fall seasons. To identify the different profile of mortality among the Turkish regions, we isolated the Mediterranean part of the country from the rest. On the Turkish Mediterranean coast, the month with the highest number of deaths is November (Figure 11, Figure 12 and Figure 13), which is consistent with what happens in Greece. In eastern Turkey, the maximum number of flood fatalities is in July. Deaths are the result of summer storms that can produce flash floods and are related to the diurnal cycle of convective activity. In eastern Turkey, 20% of annual precipitation falls in summer, while this percentage is only 5% on the western coast [59]. The thunderstorm activity, tornadoes, severe hail, and even lightning related fatalities all indicate a peak in late summer [50,60,61]. This distribution is consistent with the flood events distribution (including flash floods and surface water floods) [25,30,62].
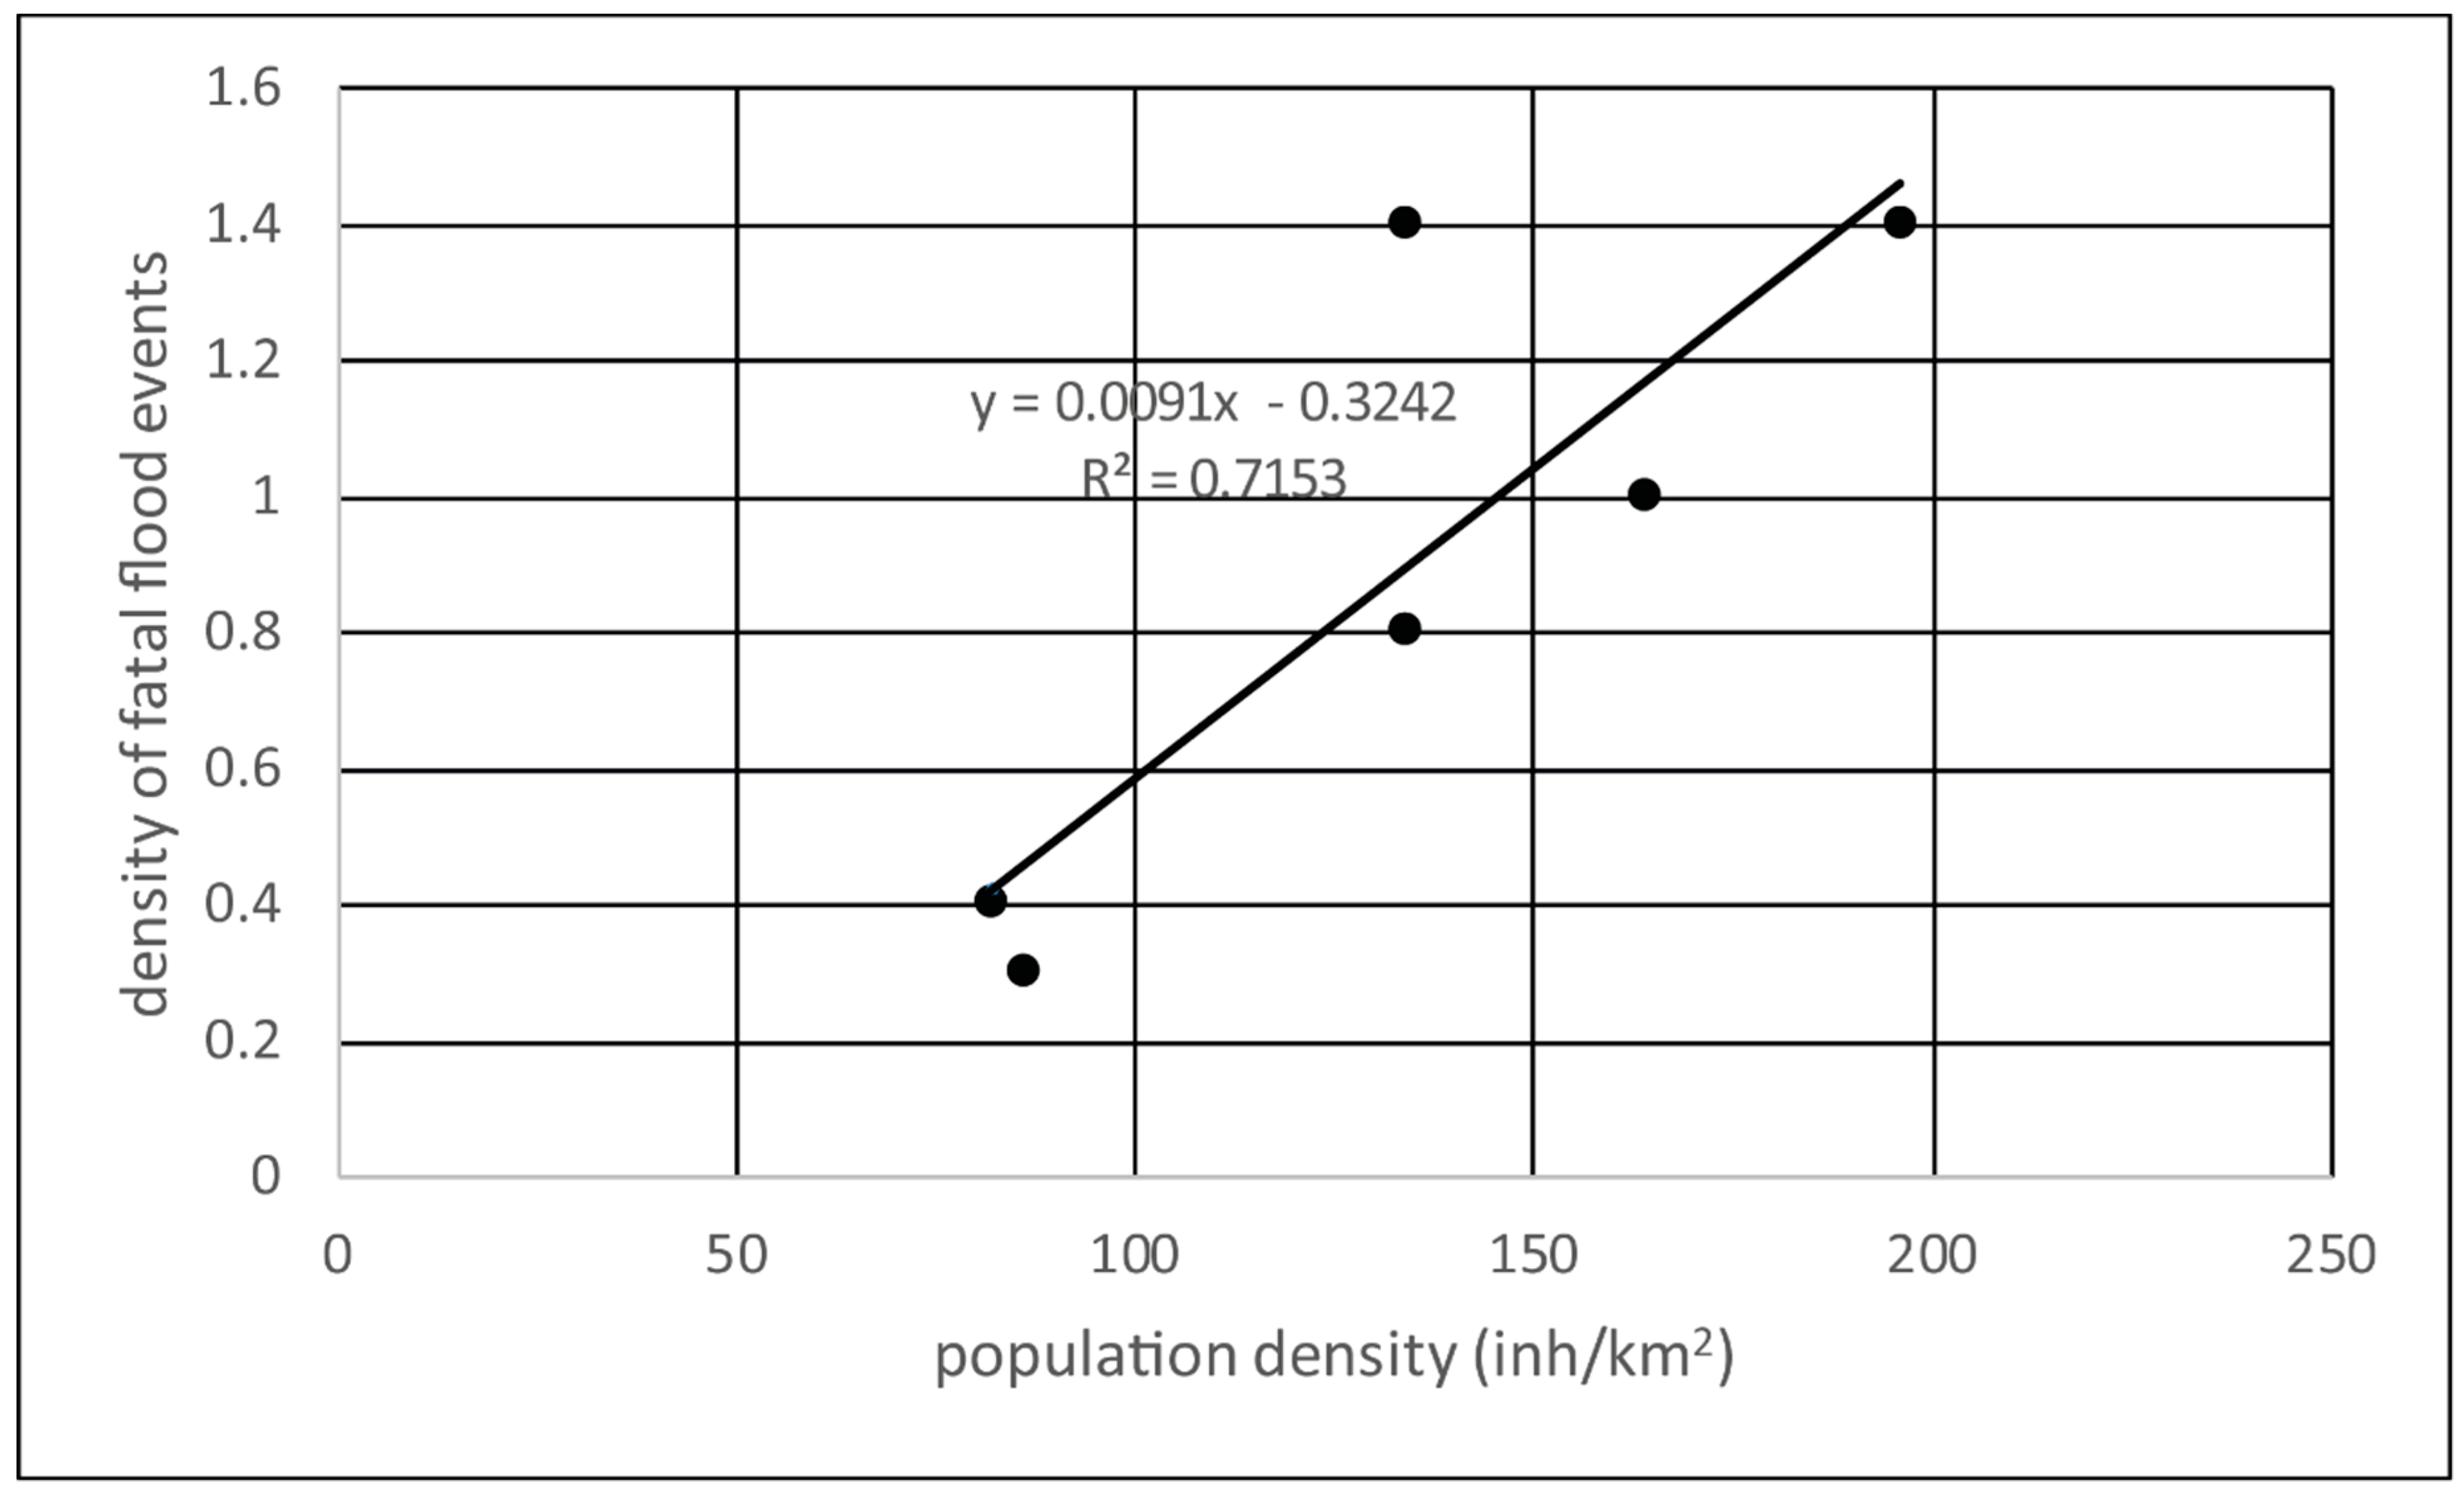
This west–eastern gradient is corroborated by the density of fatal events (we call a “fatal event” a flash flood event with at least one fatality). The 1809 deaths in the MEFF v2.0 DB correspond to 455 events, which means that, on average, each of the fatal events caused four victims. However, the density of fatal events differs from one region to another (Table 4). There is again a clear west–eastern gradient, with densities over 1 in the Occidental Mediterranean Basin (Catalonia, Balearic Islands, Southern France) and less than 1 in the eastern part (Calabria, Greece, Turkey).
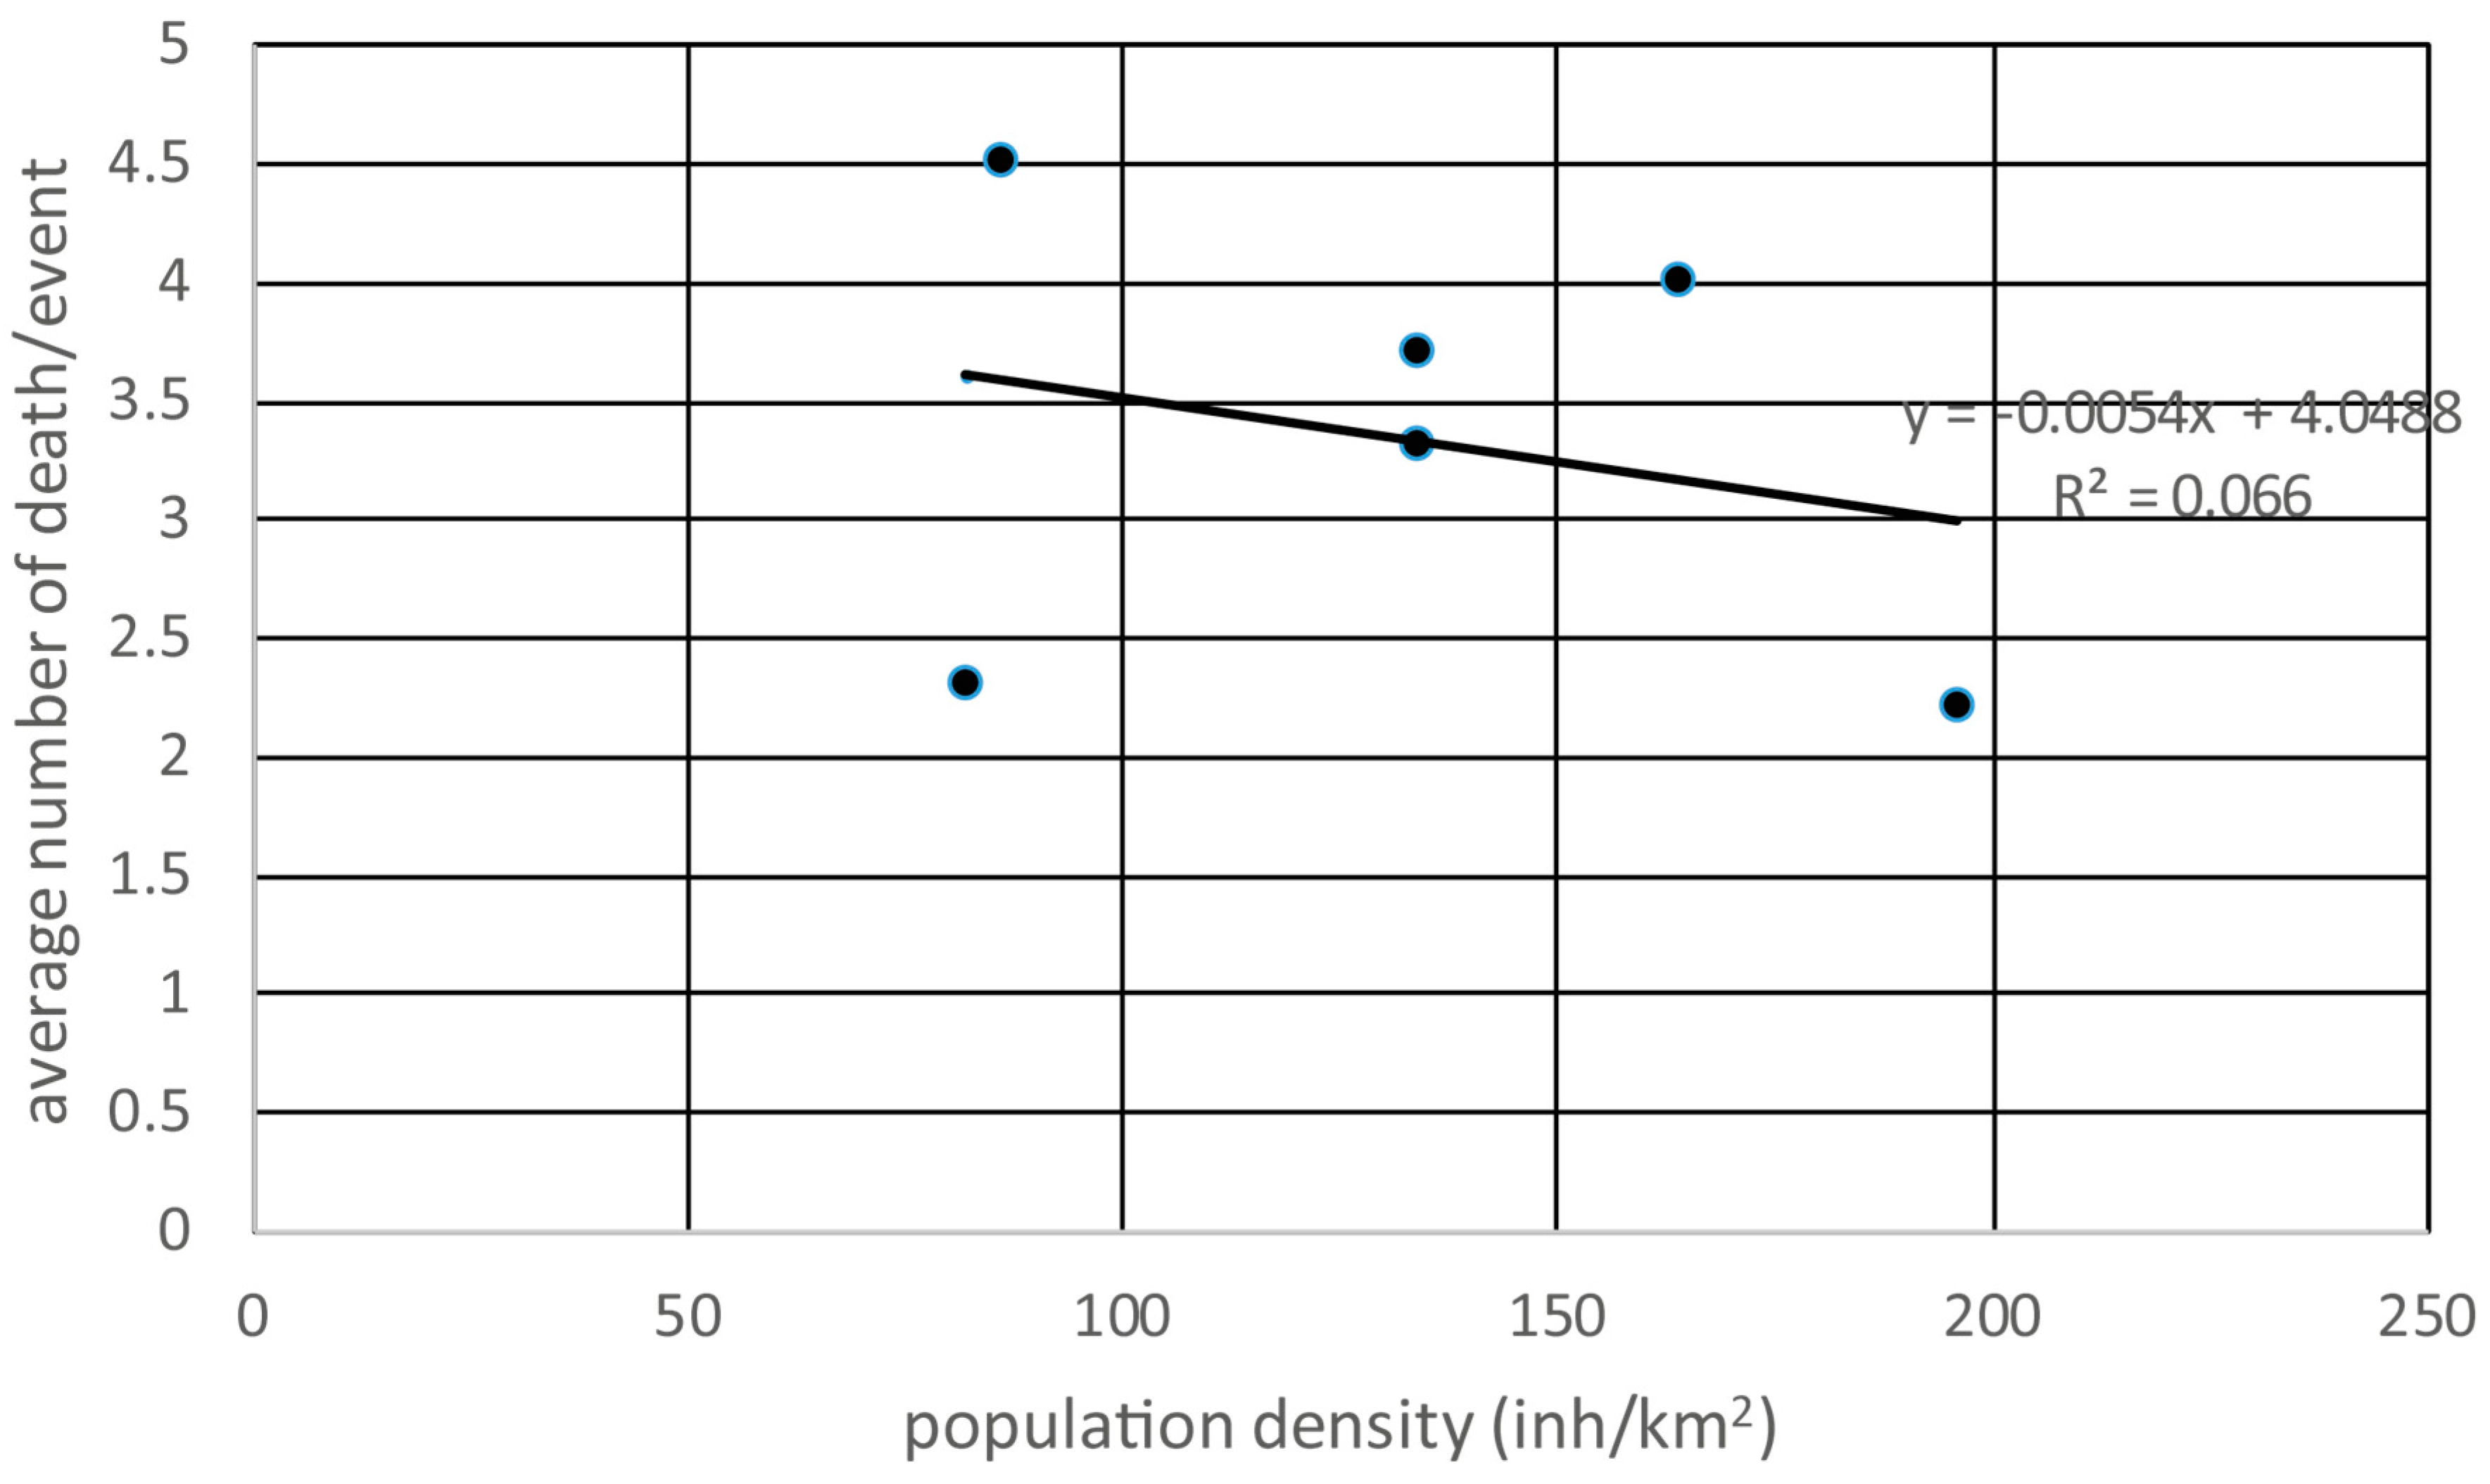
At the scale of the six study areas, the correlation between the density of fatal events and the population density is strong (R2 = 0.72) (Figure 14). This is a logical conclusion because the higher the population density, the more population is exposed. Conversely, the average number of deaths per event is not related to the population density (R2 = 0.066) (Figure 15). Just because a region is densely populated does not mean that the average number of deaths per event will be high. It means that other variables such as prevention, disaster preparedness, or flood warning influence the average death toll of flood events.
The same analysis was done in the mesh of NUTS 3 and grid, but the results are not relevant (correlation coefficient close to 0 regardless of the type of relationship)

3.6. Time Evolution of Mortality

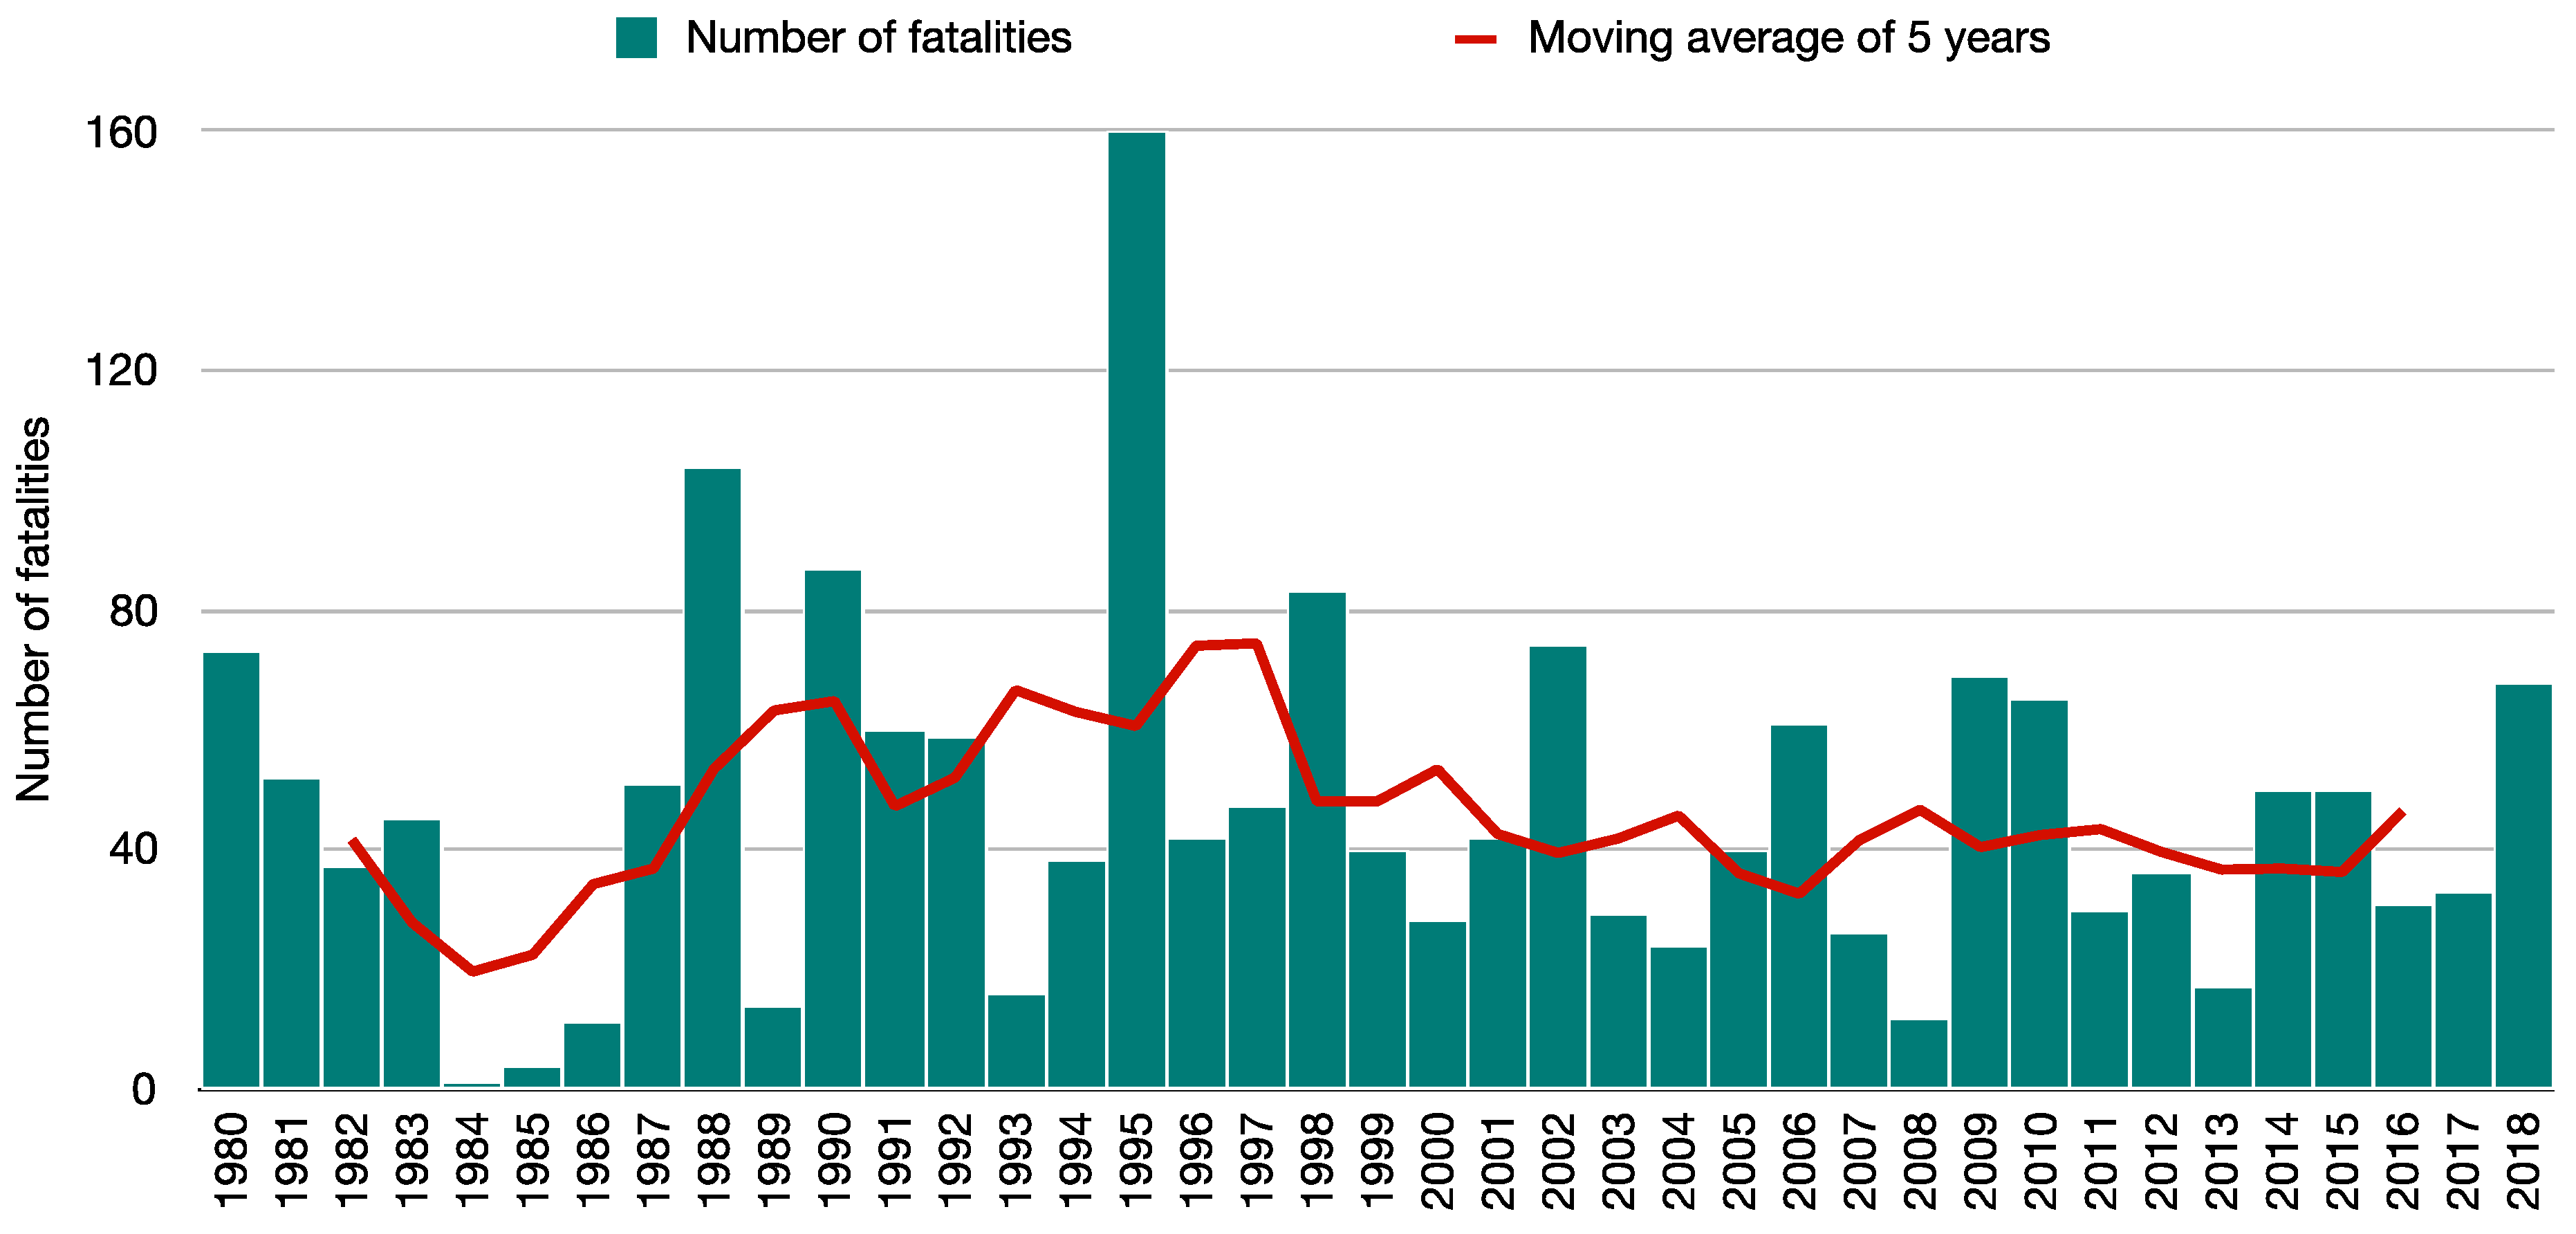
The annual number of flood fatalities in the MEFF v2.0 DB area shows significant temporal variations (Figure 16). The 1980s were less deadly in almost all of the countries (30 deaths annually on average over the study area). The year 1988 inaugurates a difficult period, with numerous catastrophic events, with on average 64 deaths per year between 1988 and 1998. In France, this high level of flood-related mortality increased flood-awareness, and culminated with the setup of the Plan de Prévention des Risques, in 1995, after the particularly dramatic floods in 1992–1994 [63]. Then, since the early 2000s, mortality has remained rather low (on average 40 deaths/year).
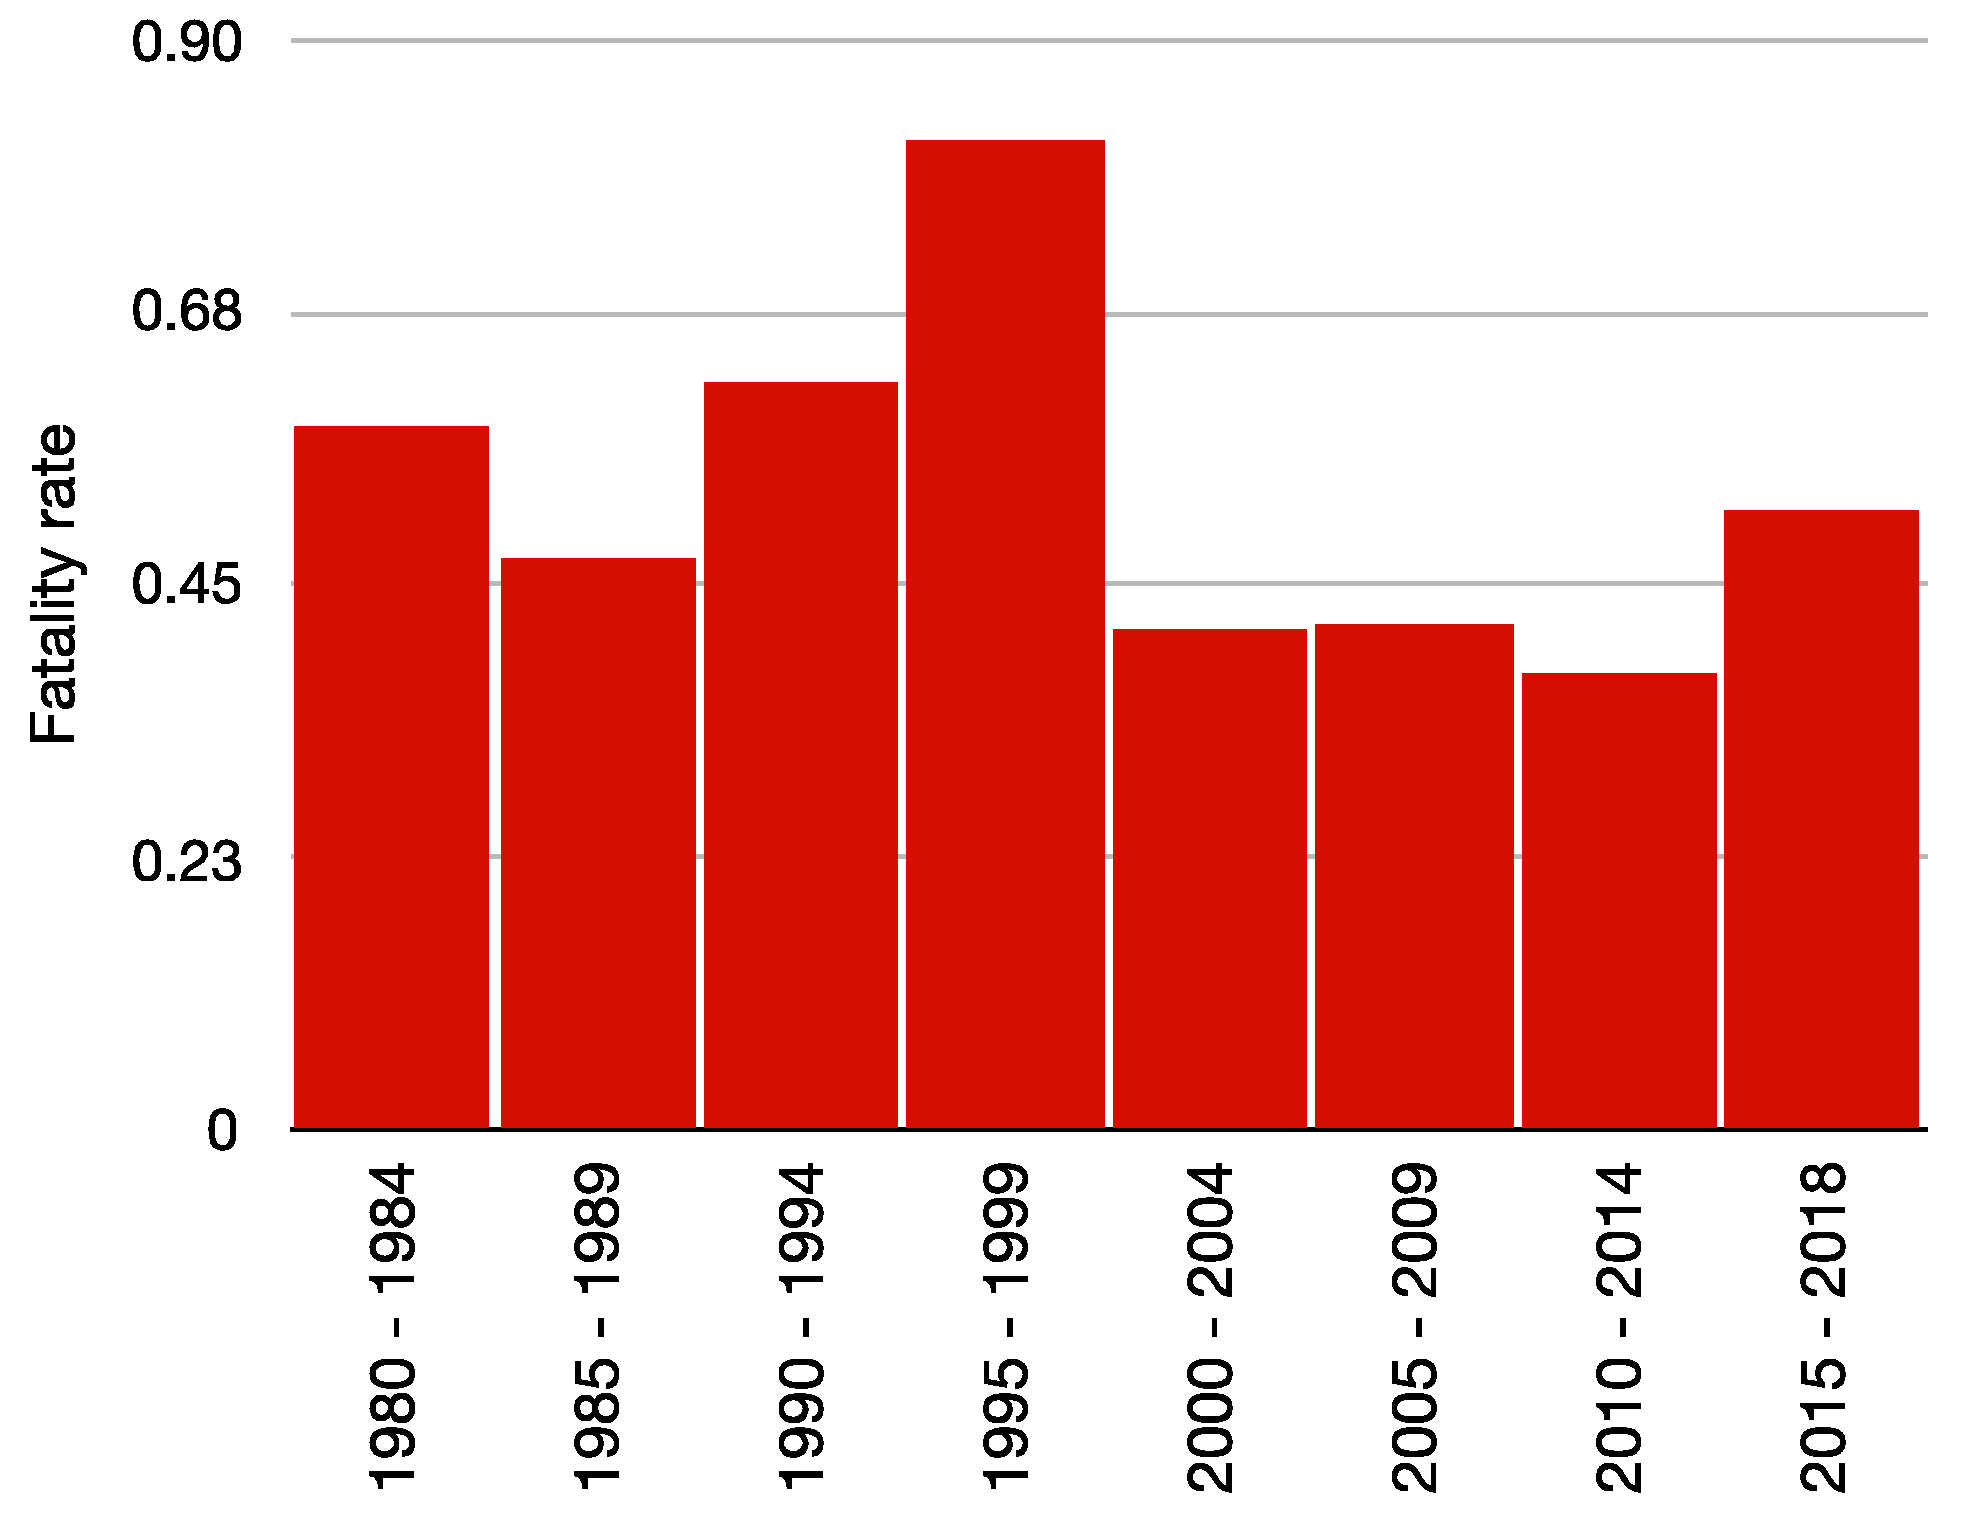
The moving average of F at a five-year time-step (Figure 17) reflects the trends identified with row data, that is, the rise of mortality, particularly in the 1990s (F = 0.7). Since the last twenty years, there has been a slight decline in the fatality rate (below 0.5 since 2000). However, during the last period 2015–2018, F has risen to 0.51 because of severe events in Southern France, Balearic Islands, Greece, Calabria, and Turkey. During this four-year period, we count 222 flood fatalities. This means that, despite that the trend of loss of life is generally decreasing, the fight against flood risk is not won yet.
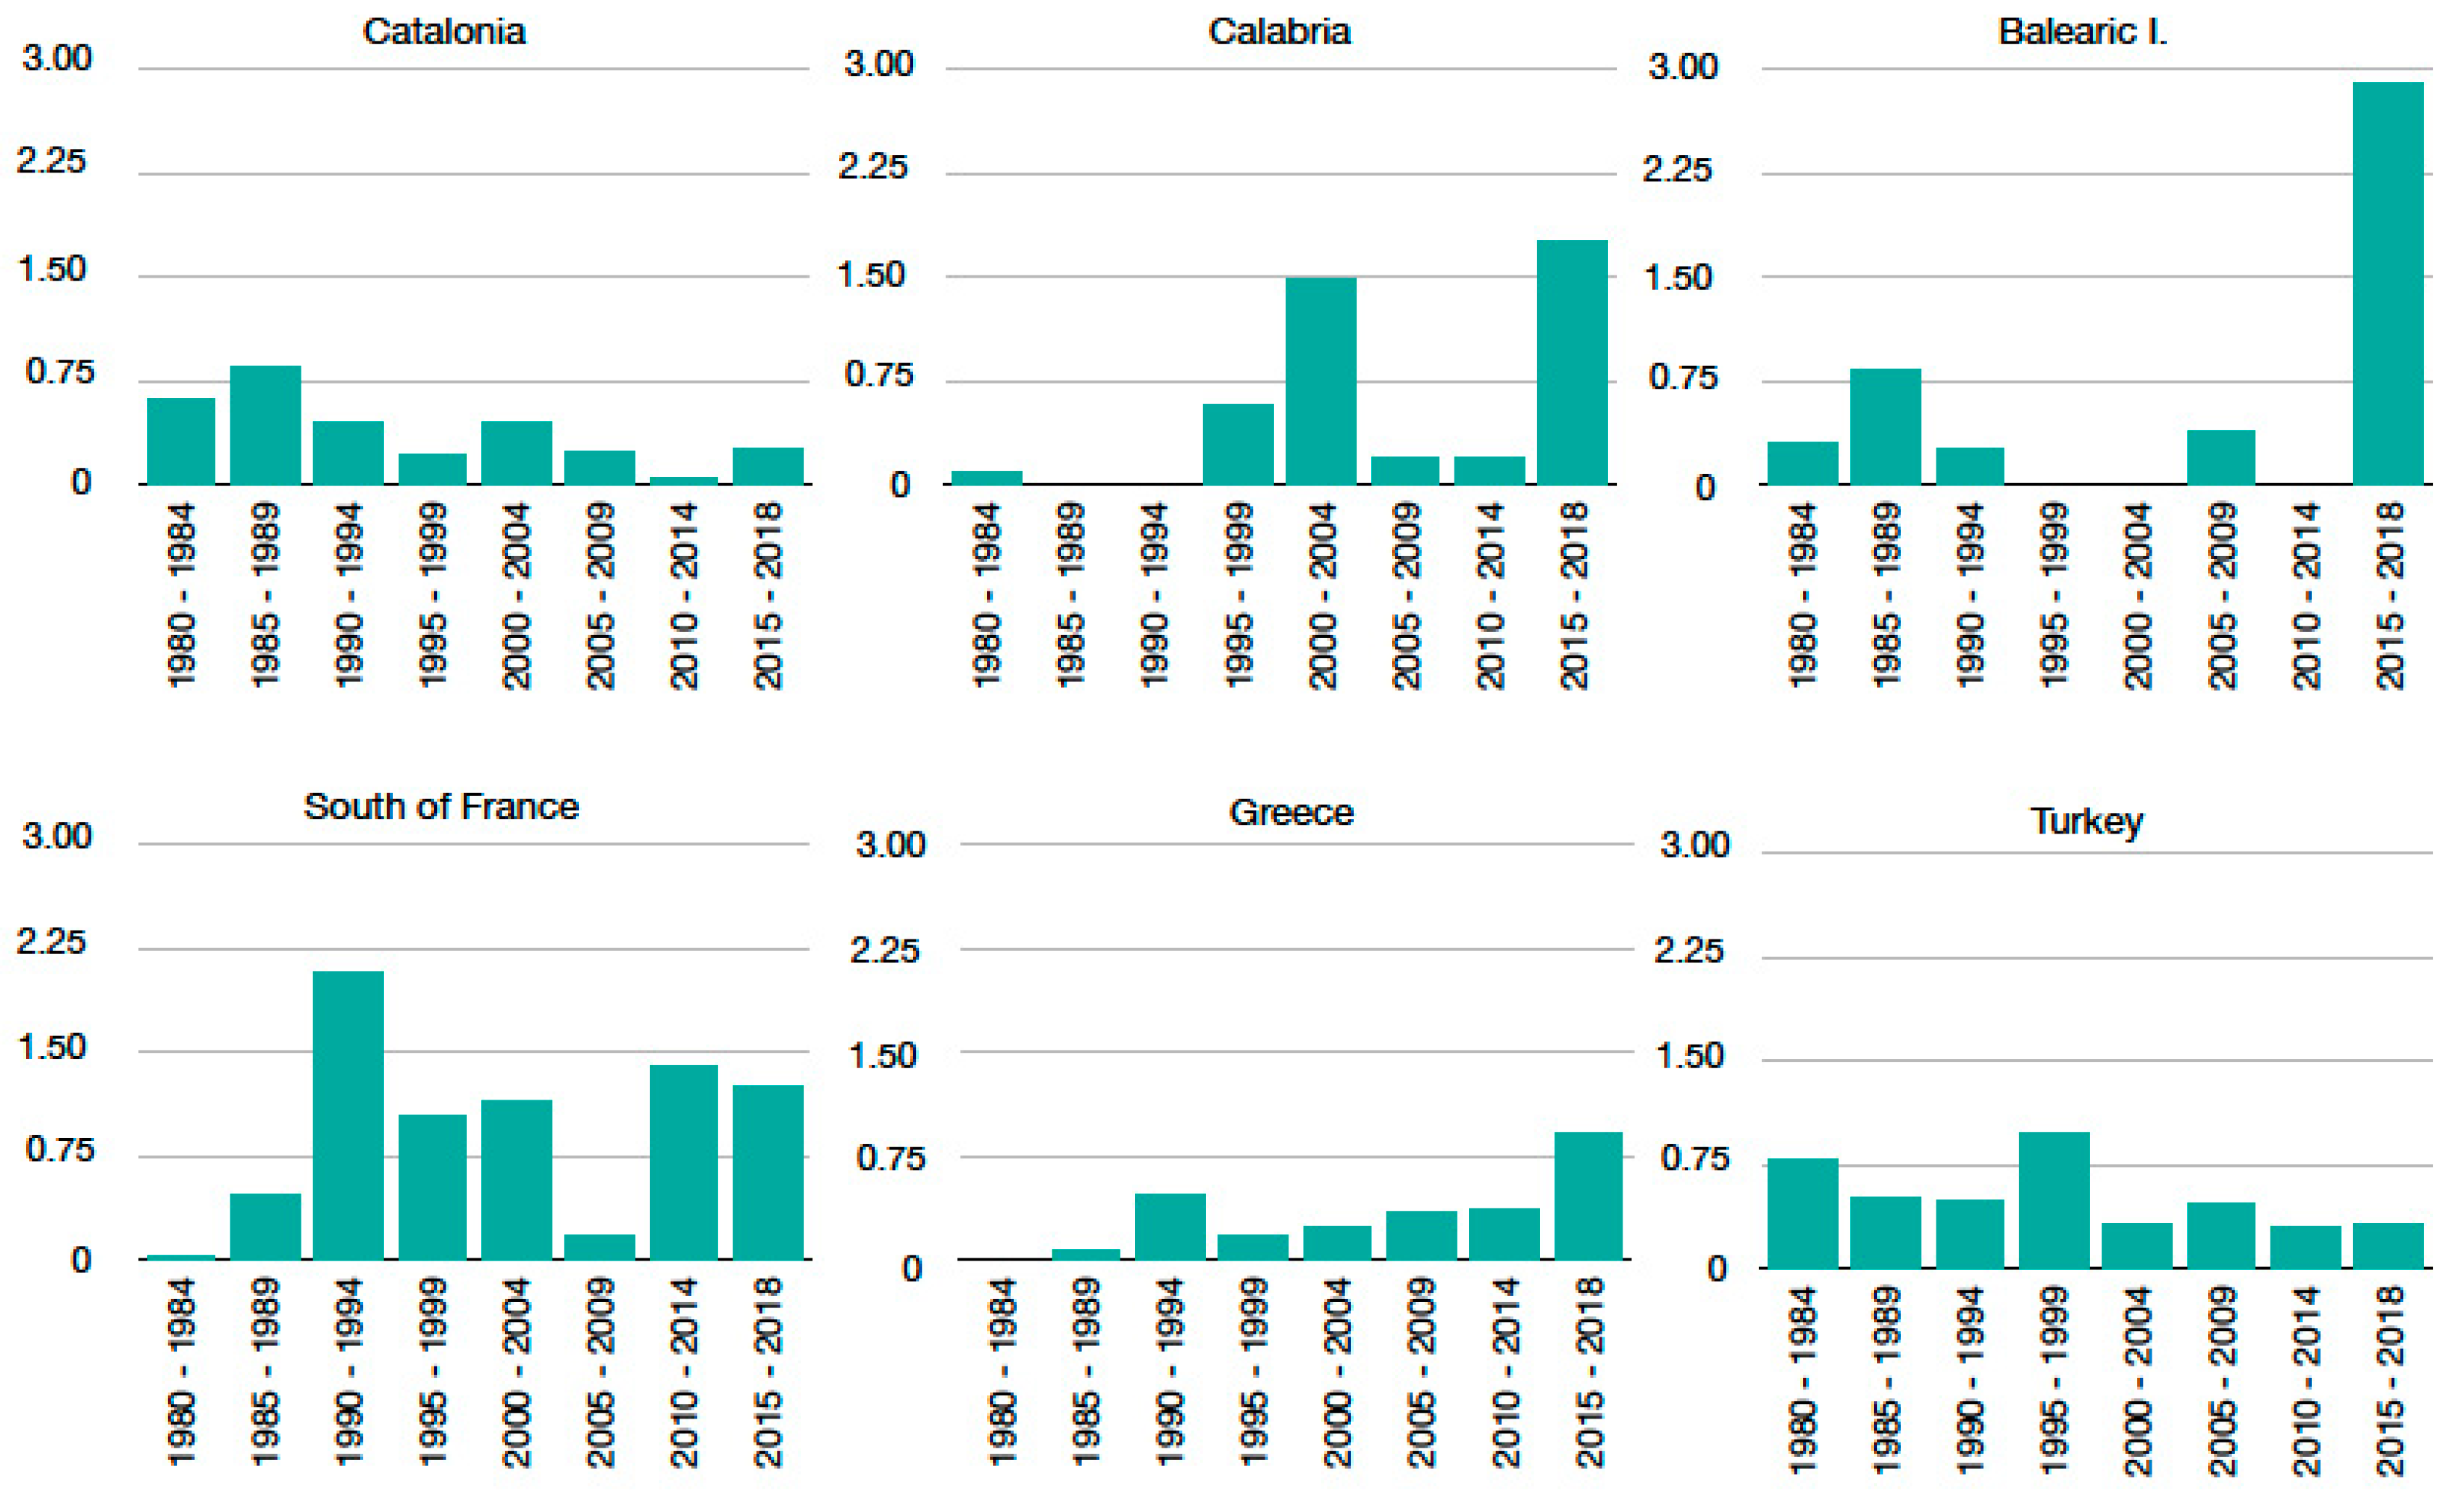
At the country level, the mortality shows a decreasing trend in the western Mediterranean Sea, in particular in Catalonia, where the fatality rate decreased from 0.63 to 0.26 (Figure 18 and Figure 19). Catalonia underwent deadly events in the 1980s and 1990s (1982, 1987, 1988, 1994, and so on), but since 2000, it seems to be less affected. Although very local convective events seem to increase in part of this region, they are usually not associated with deaths [30]. Then, this trend could be associated with a hazard change, but also with the improvement of flood prevention and management measures [47]. However, the case of Southern France seems very unstable, owing to recurrent fatal events (1992, 2002, 2010, 2015, 2018).
Conversely, flood-related mortality remains high in the eastern Mediterranean Basin, especially in Greece (1990, 1994, 2007, 2017, and so on), where the fatality rate has been constantly increasing since 1995 (F(1995) = 0.19 and F(2018) = 0.92), while the population is rather stable over the period (Figure 19).

3.7. Relationship with Extreme Rainfall

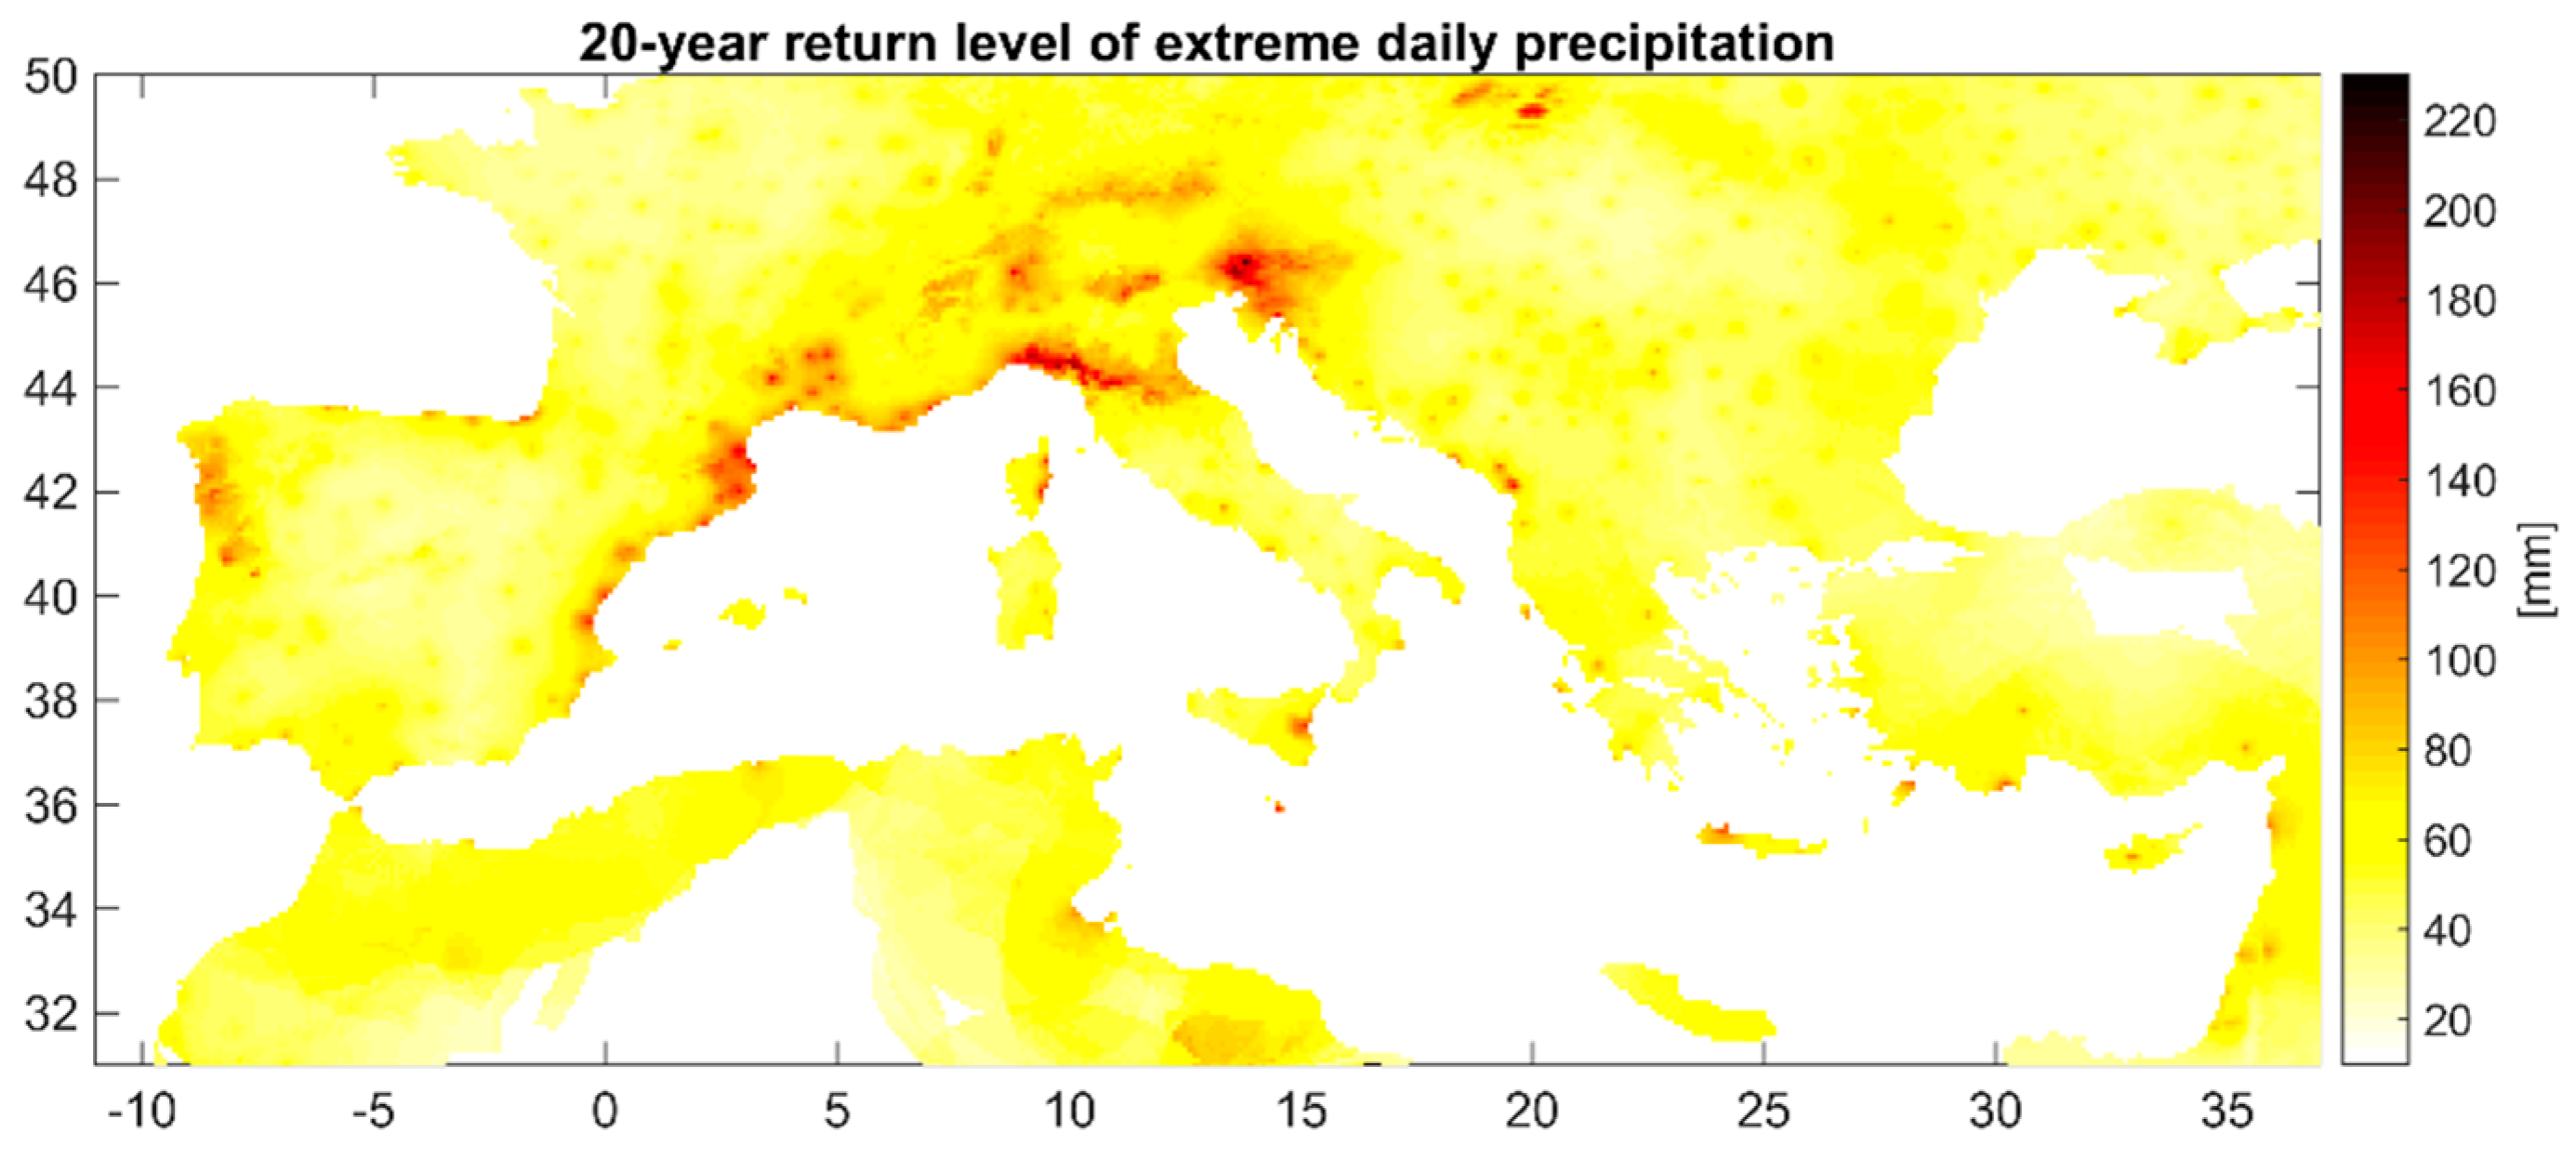
Eventually, another key question is the relationship of mortality with potential drivers of mortality. Does mortality reflect the geography of intense rainfall? Alternatively, are human factors such as density of population, vulnerability, or prevention measures more decisive? That is a key question that the present work has not addressed. Nevertheless, one of the first explanatory factors that should be examined is the frequency and intensity of severe rainfall events. The western–eastern gradient of F in the Mediterranean (Table 2, Figure 6) could be linked to a decrease in the frequency and intensity of severe rainfall between the western and eastern parts of the basin. Precipitation data provide evidence for this relationship (Figure 20). The thresholds of intense precipitation are higher in the western part of the basin: Catalonia, Southern France, and Liguria. A map of extreme daily precipitation has been produced with the EOBS dataset version 19.0e [64]. The EOBS dataset is a gridded interpolation of observed daily precipitation data and covers the period 1950 to 2018 with a resolution of 25 km. Only the grid points with at least 20 years of complete data were considered for the analysis. The annual maximum daily precipitation was extracted for each grid point and fitted with a general extreme value (GEV) distribution to compute the 20-year return period [65]. The precipitation map corresponding to a 20-year return period is plotted in Figure 20. The areas with the highest precipitation rates are located on the Ligurian coast in northern Italy, Slovenia, the Cevennes mountainous range in Southern France, and the Catalonian coast of northeast Spain. However, it must be noted that the EOBS dataset suffers from an uneven spatial coverage of the underlying meteorological stations used for the interpolation, resulting in spatial inhomogeneity of the estimated precipitation, as noted by Hofstra et al. [66]. Consequently, the results for North African countries, the Balkans, and Eastern Europe must be interpreted with care, as the station density in these areas is low. Nevertheless, the highest frequency of intense daily precipitation in Southern France could be an explanation of the high fatality rate in this region.
Other researches show that the specific peak discharges evaluated after huge floods are higher in western Mediterranean regions, especially on the coast between Catalonia and Liguria (Italy) [67,68].

4. Discussion

4.1. Data Uncertainty and Further Improvements of the MEFF DB

As mentioned earlier, MEFF is under continuous geographical development, covering every year areas of the Mediterranean and the wider European region. However, for the present study, we selected the six regions for which we already had homogenised and evaluated data for almost 100% of the recorded flood fatalities (Table 5). Only the geographical locations of one death in France and several in Turkey have not been identified. Thus, they were included in the general mortality list, but eliminated prior to the implementation of the GIS spatial analysis. Also, other data related to the victims, such as age, gender, death conditions, and so on, are not available for numerous cases. Therefore, although useful, a spatial analysis of these data would not be based on a sufficient sample to show geographical differences.
Furthermore, given that the NUTS 3 areas have different sizes and populations, we resorted to a gridded analysis, which is also adopted by other authors [69]. However, the lower the scale of analysis, the lower the sample size. Thus, it is not relevant to downscale the analysis beneath the 20 × 20 km2 mesh as the size of the mesh does not allow to smoothen the spatial variability of mortality.
This raises the problem of the weight of extreme events in the sample. The smaller the spatial unit, the heavier the deadliest event. The deadliest event in Balearic Islands accounts for 13 fatalities, that is, 65% of the whole human toll over the period. This percentage is 33% for Calabria (Table 6). Conversely, in larger regions, the number of events is higher, which allows limiting the weight of the extreme episodes (below 20%). In Southern France or in Catalonia, the high number of events enables to draw the spatial patterns of mortality.
This points out the question of the record duration. Many databases cover a longer period and start from the 19th century (e.g., the Disaster DB in Portugal [14,70]) or after the Second World War (1946) for the WSL DB that covers Switzerland (WSL: The Swiss Federal Institute for Forest, Snow, and Landscape Research. https://www.wsl.ch/en/services-and-products/data-monitoring-and-inventories/wsl-database-of-natural-hazard-fatalities-in-switzerland-since-1946.html) [18]. The MEFF v2.0 DB starts in 1980 because we consider that the period running from 1980 to nowadays is more homogeneous, as mentioned in the Methodology. Of course, a longer period could increase the sample, but the quality of information is lower for former periods [14,71]. In addition, until the 1970s, many European and Mediterranean countries had been affected by flood events that caused a disproportionately large number of deaths. The flooding of November 1967 in the metropolitan region of Lisboa (Portugal) represents half of the country’s flood victims for the period 1865–2010 [14,72]. In Catalonia, the September 1962 flash flood triggered 812 deaths, which has nothing in common with the impact magnitude of the events of the following decades [73,74]. Before 1980, different socio-economic conditions (less solid constructions; less reliable forecasts; different lifestyles, for example, for transports) could have a negative impact on flood death tolls [35,71]).

4.2. Broader Context and Comparisons

The comparisons of our results with existing studies on flood mortality at the global scale are difficult because databases, periods, and scale of analysis are not the same [5]. Hu et al. [4] find less than 500 flood-related deaths for Turkey in their sample (1976–2016), while the MEFF v2.0 DB includes more than 1200 for a quite similar period. Accurate comparisons between EM-DAT and full national DB (Disaster DB for Portugal [14]) show that the former underestimates the number of flood events mostly for former periods.
Comparisons with other databases at the national level in Europe are more intersecting. In Portugal, the mortality rates range from 0.2 in the northern region, which is less affected by intense rainfalls, to 0.7 (for 106 people) in the Lisboa region. Center and south Portugal exhibit intermediary rates [40]. The national flood mortality rate was around 0.2 and 0.25 in the decades 1982–1991 and 1992–2001, but fell to 0.11 during the period 2002–2010. Those rates are weaker than in Catalonia, Balearic Island, and Southern France, which confirms that the region between the eastern coast of Spain and Liguria suffers the most intense rainfalls [75,76,77].
The seasonality of mortality is consistent with the atmospheric circulation patterns in the Mediterranean Sea. In the western basin, heavy rainfalls are controlled by low pressures that shift early in the fall season onto the western Mediterranean Basin from the zonal westerly circulation [76]. In the eastern part of the Mediterranean Sea, heavy precipitation events are linked to low-pressure systems that separate from the mid-latitude atmospheric circulation and move since the early fall season to the Occidental Basin of the Mediterranean Sea. In the eastern Mediterranean Basin, rainfalls in late autumn and winter are linked to the Cyprus low [40,78].
Concerning flood mortality trends and their link to hazard evolution, the spatial analysis showed that mortality is roughly declining in the west of the Mediterranean, but increasing in the east. The decrease in flood mortality in Portugal during the last decade [40] is consistent with the decline we observed in the western part of the Mediterranean Basin.
The observed trends and predicted changes confirm the stability of monthly distribution patterns in the Mediterranean Basin [79]. In the future, the models may not anticipate the increase in the frequency of intense rain events neither fundamental changes in atmospheric circulation patterns. Conversely, they may rather forecast an increasing intensity of rainfall events in some areas like Southern France or Italy [76]. Other drivers of the mortality trends, especially socio-economic ones, should also be explored.

4.3. Enhancing the Calculation of F

Another perspective is to improve the F formula to be closer to the reality. A solution to account for the mortality of a region would be to relate mortality not with the whole population, but with the population at risk at the local scale [34]. Unfortunately, these data are not available in all the European countries, despite the requirements of the European Union [2]. The mapping of the flood prone areas is improving in Europe, particularly following the European directive of 2007 and regional initiatives like Inuncat in Catalonia [80]. Flood footprints are available, but the mapping is not exhaustive and accurate enough. Paprotny et al. [69] in the Hanze DB consider the footprints of events when the catchments are above 100 km2. However, studies in Southern France show that half of the flood-related deaths occur in catchments of less than 150 km2 [3]. For flash floods, it is important to work at a fine-grained scale.
Another research challenge would be to calculate F by event, that is, to calculate F for each event by confronting the number of fatalities with the flood footprint, its surface, and the population exposed. That is a great challenge already tested by other researchers [69], but it is a difficult challenge especially for flash floods. Indeed, as mentioned before, many flash flood-related fatalities occur in small catchments where river discharges are not always available [68]. It would be easier and more relevant to compare the fatality rate with rainfall intensity. A first step would be to relate the rainfall area (according to different thresholds of daily precipitation) with mortality and the number of people at risk. Some of this information is already integrated in the MEFF v2.0 DB, but it still needs improvement.

4.4. Enhancing the Explanation of Flood Mortality: Relationship with Other Variables

Flood-related mortality is an integrative indicator of flood impacts coming after numerous drivers (hazard characteristics, vulnerability, exposure, behaviors, and so on) [81,82]. The explanation of flood-related mortality is obviously related to multiple factors. Thus, perspectives are also to explore the relationships between mortality and its human and natural drivers, such as exposure and the presence/absence of prevention measures [69]. This is more feasible when the density of deaths is high, as in France or in Catalonia, and where socio-economic data are available.
The expected benefit of this database is also to provide elements for decision making. A best knowledge of flood-related deaths is useful for risk managers and policy makers, as well as for communities. At the European Union level, efforts are being made to improve prevention, information, and flood warning (https://ec.europa.eu/jrc/en/research-topic/floods). Local communities are encouraged to participate to emergency management using social media and new technologies (http://www.floodserv-project.eu/). The EFAS (https://www.efas.eu/) (European Flood Awareness System) allows to improve the real-time information in the case of a flood event. Efforts are also being made to improve flood risk governance in order to enhance prevention. Hopefully, all these efforts will result in lower mortality and our database will be able to measure this progress.

5. Conclusions

This paper focused on the spatial distribution of flood-related fatalities in the Mediterranean Basin through the MEFF DB. The added value of the MEFF DB is that the records of the dataset are not flood events (with an attributed number of fatality), but fatalities themselves. Similar databases like the DISASTER DB (http://riskam.ul.pt/disaster/) in Portugal are being integrated with the MEFF DB. An accurate mapping of fatality cases can be drawn thanks to the geolocation of each fatality case. Over the six regions/countries making up the MEFF DB, 1809 fatalities have been registered, of which 1763 are accurately located.
It appears that for the whole basin, the mean annual fatality rate is 0.5 fatalities per million inhabitants. The fatality rate has been mapped at different spatial levels (NUTS 3, grid, and catchment areas). Each level of analysis reveals specific geographical structures. Across the Basin and at the large mesh of the NUTS 3 administrative units, we observe a negative west–east gradient of F. F is around 1.0 in Southern France, 0.6 in the Balearic Islands, and below 0.5 in Greece and Turkey. We also observe a shifting of the mortality peak in the later fall season. The mortality peak occurs in early autumn in the western Mediterranean Sea and in November in the eastern Basin (Greece, Turkey). This spatial variability is consistent with what we know about the spatial-temporal distribution of intense rainfall events across the Mediterranean Basin. The case of Turkey is interesting, as this country covers several climatic areas [83]. The seasonal distribution of deaths shows that they mainly occur in summer in the eastern part of the Turkey and in autumn in the western part (Figure 11 and Figure 12). Therefore, this confirms the relationship between mortality and climate, especially through the seasonal distribution.
The density of fatal events is related to population density and to the geographic situation of each region. France and Catalonia undergo a high number of fatal events because they are located in the western part of the Mediterranean Basin, which is more exposed to huge rainfall events than the eastern Basin. Moreover, high population densities also explain the high number of fatal flood events. Nevertheless, those two drivers (rainfall frequency and dense population) do not influence the average number of deaths per event. The efficiency of prevention might influence this former feature, but accurate comparisons are required to argue on this assumption.
The 20 × 20 km mesh grid is relevant to show spatial discrepancies in flood-related mortality at the local level, where the density of fatalities is sufficient. In Southern France and Catalonia, F is highest in the hinterland areas, several kilometers back to the coastline. Conversely, maps do not result in relevant conclusions at the scale of catchments where F is too dependent on deadliest historical flood events.
The MEFF v2.0 DB is currently being supplemented by new data from other European/Mediterranean countries such as Portugal, Israel, and central–northern Italy (see the paper of Petrucci et al., in this Special Issue [29]). Many research teams had led a census of flood human impacts in different Mediterranean countries [70,84] or in Europe. Our vision is for the MEFF v2.0 DB to put together all those existing data on flood-related losses of life.
It seems necessary to put all efforts together to gather and homogenise mortality data in Europe and around the Mediterranean Basin. Even if the long-term trends of flood-related mortality show a slight decrease, recent events in France, Greece, or Balearic Islands remind us that forthcoming drivers, such as global warming and, more likely, population increase, lack of prevention, and the aging of the population, can lead to an increase in mortality in the future. We, as researchers, remain vigilant on the evolution of F as an indicator of the vulnerability of our society against flood risk.

Author Contributions

Methodology: F.V., O.P., V.B., and K.P.; GIS and database management: V.B., L.A., and Y.T.; Data gathering: all authors. Analysis: F.V. and V.B.; Writing—original draft preparation: F.V., V.B., and K.P.; Writing—review and editing: all authors.

Funding

ANR DEUFI and University of Paul Valéry Montpellier 3. This paper has been written in the framework of the HYMEX international project.

Acknowledgments

Thanks to Thomas Candela for his advice in GIS. We acknowledge the E-OBS dataset from the EU-FP6 project UERRA (http://www.uerra.eu) and the Copernicus Climate Change Service, as well as the data providers in the ECA&D project (https://www.ecad.eu). Paper written with fundings of M-CostAdapt (CTM2017-83655-C2-2-R) research project (MINECO/AEI/FEDER, UE).

Conflicts of Interest

The authors declare no conflict of interest. The funders had no role in the design of the study; in the collection, analyses, or interpretation of data; in the writing of the manuscript, or in the decision to publish the results.

References

  1. United Nations International Strategy of Disaster Reduction. Sendai Framework for Disaster Risk Reduction 2015–2030; (UNISDR), A/CONF.224/CRP.1, United Nations Office for Disaster Risk Reduction: Geneva, Switzerland, 2015. [Google Scholar]
  2. Protection, C. Directive 2007/60/EC of the European Parliament and of the Council of 23 October 2007 on the assessment and management of flood risks Text with EEA relevance. Off. J. L 2007, 288, 27–34. [Google Scholar]
  3. Vinet, F.; Boissier, L.; Saint-Martin, C. Flashflood-related mortality in southern France: First results from a new database. In Proceedings of the 3rd European Conference on Flood Risk Management, Québec, QC, Canada, 17–21 October 2016. [Google Scholar]
  4. Hu, P.; Zhang, Q.; Shi, P.; Chen, B.; Fang, J. Flood-induced mortality across the globe: Spatiotemporal pattern and influencing factors. Sci. Total Envion. 2018, 643, 171–182. [Google Scholar] [CrossRef]
  5. Adhikari, P.; Hong, Y.; Douglas, K.R.; Kirschbaum, D.B.; Gourley, J.; Adler, R. A digitized global flood inventory (1998–2008): Compilation and preliminary results. Nat. Hazards 2010, 55, 405. [Google Scholar] [CrossRef]
  6. Centre for Research on the Epidemiology of Disasters (CRED). CRED Crunch 54-Disasters 2018: Year in Review; CRED: Louvain, Belgium, 2019. [Google Scholar]
  7. Fang, J.; Li, M.; Shi, P. Mapping Flood Risk of the World. In World Atlas of Natural Disaster Risk; Shi, P., Kasperson, R., Eds.; Springer: Berlin, Germany, 2015; pp. 69–102. [Google Scholar]
  8. Shi, P.; Kasperson, R. World Atlas of Natural Disaster Risk; Springer: Berlin, Germany, 2015; p. 368. [Google Scholar]
  9. Wallemacq, P.; Below, R. The Human Cost of Natural Disasters: A Global Perspective; Centre for Research on the Epidemiology of Disaster: Brussels, Belgium, 2015. [Google Scholar]
  10. Jonkman, S.N. Global Perspectives on Loss of Human Life Caused by Floods. Nat. Hazards 2005, 34, 151. [Google Scholar] [CrossRef]
  11. Doocy, S.; Daniels, A.; Murray, S.; Kirsch, T.D. The Human Impact of Floods: A Historical Review of Events 1980–2009 and Systematic Literature Review. PLoS Curr. Disasters 2013, 5. [Google Scholar] [CrossRef] [PubMed]
  12. Zagheni, E.; Muttarak, R.; Striessnig, E. Differential mortality patterns from hydro-meteorological disasters: Evidence from cause-of-death data by age and sex. Vianna Yearb. Poplation Res. 2015, 13, 47–70. [Google Scholar]
  13. Haynes, K.; Coates, L.; Van Den Honert, R.; Gissing, A.; Bird, D.; Dimer de Oliveira, F.; D’Arcy, R.; Smith, C.; Radford, D. Exploring the circumstances surrounding flood fatalities in Australia–1900–2015 and the implications for policy and practice. Envion. Sci. Policy 2017, 76, 165–176. [Google Scholar] [CrossRef]
  14. Zêzere, J.L.; Pereira, S.; Tavares, A.O.; Bateira, C.; Trigo, R.M.; Queresma, I.; Santos, P.P.; Santos, M.; Verde, J. DISASTER: A GIS database on hydro-geomorphologic disasters in Portugal. Nat. Hazards 2014, 72, 503. [Google Scholar] [CrossRef]
  15. Boissier, L. La Mortalité Liée Aux Crues Torrentielles Dans Le Sud De La France: Une Approche De La Vulnérabilité Humaine Face A L’inondation. Ph.D. Thesis, Université Paul Valéry Montpellier 3, Montpellier, France, 2013. [Google Scholar]
  16. Guzzeti, F. Landslide fatalities and the evaluation of the landslide risk in Italy. Eng. Geol. 2000, 58, 89–107. [Google Scholar] [CrossRef]
  17. Diakakis, M.; Deligiannakis, G. Changes in flood mortality during the last 50 years in Greece. Bull. Geol. Soc. Greece 2013, 47, 1397–1406. [Google Scholar] [CrossRef]
  18. Badoux, A.; Andres, N.; Techel, F.; Hegg, C. Natural hazard fatalities in Switzerland from 1946 to 2015. Nat. Hazards Earth Syst. Sci. 2016, 16, 2747–2768. [Google Scholar] [CrossRef] [Green Version]
  19. DeKay, M.L.; McClelland, G.H. Predicting Loss of Life in Cases of Dam Failure and Flash Flood. Risk Anal. 2006, 13, 193–205. [Google Scholar] [CrossRef]
  20. Lumbroso, D.; Davison, M. Use of an agent-based model and Monte Carlo analysis to estimate the effectiveness of emergency management interventions to reduce loss of life during extreme floods. J. Flood Risk Manag. 2018, 11, S419–S433. [Google Scholar] [CrossRef]
  21. Jonkman, S.N. Loss of life models for sea and river floods. Flood Def. 2002, 1, 196–206. [Google Scholar]
  22. Jonkman, S.N. Loss of Life Estimation in Flood Risk Assessment; Therory and Applications; Sieca Repro: Delft, The Netherlands, 2007; p. 360. [Google Scholar]
  23. Jonkman, S.N.; Maaskant, B.; Boyd, E.; Lloyd Levitan, M. Loss of life caused by the flooding of New Orleans after hurricane Katrina: Analysis of the relationship between flood characteristics and mortality. Risk Anal. 2009, 29, 5. [Google Scholar] [CrossRef] [PubMed]
  24. Lumbroso, D.M.; Sakamoto, D.; Johnstone, W.; Tagg, A.; Lence, B.L. The development of a life safety model to estimate the risk posed to people by dam failure and floods. Dams and Reservoirs. Official journal of the British Dam Society. 2011. Available online: https://britishdams.org/about/bds-journal/ (accessed on 21 October 2019).
  25. Llasat, M.C.; Llasat-Botija, M.; Petrucci, O.; Pasqua, A.A.; Rossello, J.; Vinet, F.; Boissier, L. Towards a database on societal impact of Mediterranean floods within the framework of the HYMEX project. Nat. Hazards Earth Syst. Sci. 2013, 13, 1337–1350. [Google Scholar] [CrossRef] [Green Version]
  26. Parker, D.J. Floods; Routledge: London, UK, 2000; p. 748. [Google Scholar]
  27. Nussbaum, R. Observation and measurements of losses due to flooding. In Floods 1 the Risk Knowledge; Vinet, F., Ed.; ISTE Press: London, UK; Elsevier: Amsterdam, The Netherlands, 2017; Chapter 2; pp. 21–32. [Google Scholar]
  28. Petrucci, O.; Papagiannaki, K.; Aceto, L.; Boissier, L.; Kotroni, V.; Grimalt, M.; Llasat, M.C.; Llasat-Botija, M.; Rosselo, J.; Pasqua, A.; et al. MEFF: The database of Mediterranean Flood Fatalities (1980 to 2015). J. Flood Risk Manag. 2018, 12, e12461. [Google Scholar] [CrossRef]
  29. Petrucci, O.; Aceto, L.; Bianchi, C.; Bigot, V.; Brazdil, R.; Pereira, S.; Kahraman, A.; Kikiç, O.; Kotroni, V.; Llasat, M.C.; et al. Flood Fatalities in Europe, 1980–2018: Variability, Features, and Lessons to Learn. Water 2019, 11, 1682. [Google Scholar] [CrossRef]
  30. Llasat, M.C.; Marcos, R.; Turco, M.; Gilabert, J.; Llasat-Botija, M. Trends in flash flood events versus convective precipitation in the Mediterranean region: The case of Catalonia. J. Hydrol. 2016, 541, 24–37. [Google Scholar] [CrossRef] [Green Version]
  31. Diakakis, M.; Katsetsiadou, K.; Pallikarakis, A. Flood fatalities in Athens, Greece: 1880–2010. Bull. Geol. Soc. Greece 2016, 47, 1407–1416. [Google Scholar] [CrossRef]
  32. Antoine, J.M.; Desailly, B.; Gazelle, F. Les crues meurtrières, du Roussillon aux Cévennes. Ann. De Géographie 2001, 622, 597–623. [Google Scholar] [CrossRef]
  33. Ruin, I. Conduite à contre-courant. Les pratiques de mobilités dans le Gard: Facteurs de vulnérabilité aux crues rapides. Ph.D. Thesis, De Doctorat Université De Grenoble I, Université Joseph Fourier, Saint-Martin-d'Hères, France, 2007; p. 364. (In French). [Google Scholar]
  34. Jonkman, S.N.; Kelman, I. An analysis of the causes and circumstances of flood disaster deaths. Disasters 2005, 29, 75–97. [Google Scholar] [CrossRef] [PubMed]
  35. Vinet, F. Floods impacts on loss of life and human health. In Chapitre 3 Floods 1: Risk Knowledge; Vinet, F., Ed.; ISTE edition: London, UK, 2017; pp. 33–50. [Google Scholar]
  36. Tilev-Tanriover, S.; Kahraman, A.; Kadioglu, M.; Schultz, D.M. Lightning fatalities and injuries in Turkey. Nat. Hazards Earth Syst. Sci. 2015, 15, 1881–1888. [Google Scholar] [CrossRef] [Green Version]
  37. Ashley, W.S.; Gilson, C.W. A reassessment of U.S. lightning mortality. Bull. Am. Met. Soc. 2009, 90, 1501–1518. [Google Scholar] [CrossRef]
  38. Guzzetti, F.; Stark, C.P.; Salvati, P. Evaluation of flood and landslide risk to the population of Italy. Environ. Manag. 2005, 36, 15–36. [Google Scholar] [CrossRef]
  39. Forzieri, G.; Cascatti, A.; Silva, F.B.; Feyen, L. Increasing risk over time of weather-related hazards to the European population: A data-driven prognostic study. Lancet 2017, 1, e200–e208. [Google Scholar] [CrossRef]
  40. Pereira, S.S.; Diakakis, M.; Deligiannakis, G.; Zêzere, J.L. Comparing flood mortality in Portugal and Greece (Western and Eastern Mediterranean). Int. J. Disaster Risk Reduct. 2017, 22, 147–157. [Google Scholar] [CrossRef]
  41. Gao, J. Downscaling Global Spatial Population Projections from 1/8-death to 1-km Grid Cells. Ncar Tech. Nate 2017. [Google Scholar] [CrossRef]
  42. Badey, S. Atelier Archéomatique 17.1: l’analyse par maille: Un outil d’aide à l’analyse et de représentation cartographique quantitative. In École thématique. Les Ateliers Archéomatiques; MSH Val de Loire: Tours, France, 2017; p. 29. [Google Scholar]
  43. Biricik, A.S. Flood Disasters in Senirkent (13 July 1995–18,19 July 1996). Marmara Geogr. J. 1997, 1, 9–30. [Google Scholar]
  44. Conseil général de l’environnement et du développement durable (GCEDD). Retour d’expérience des inondations dans l’Aude du 14 au 17 octobre 2018. Rapport CGEDD n°012561-01, IGA n° 18105-RP, May 2019. p. 175. Available online: http://www.cgedd.developpement-durable.gouv.fr/IMG/pdf/012561-01_rapport_cle22f9dd.pdf (accessed on 21 October 2019). (In French).
  45. Diakakis, M. Have flood mortality qualitative characteristics changed during the last decades? The case study of Greece. Environ. Hazards 2016, 15, 148–159. [Google Scholar] [CrossRef]
  46. Pottier, N.; Penning-Rowsell, E.; Tunstall, S.; Hubert, G. Land use and flood protection: Contrasting approaches and outcomes in France and in England and Wales. Appl. Geogr. 2005, 25, 1–27. [Google Scholar] [CrossRef]
  47. Llasat, M.C.; Llasat-Botija, M.; Prat, M.A.; Porcù, F.; Price, C.; Mugnia, A.; Lagouvardos, K.; Kotroni, V.; Katsanos, D.; Michaelides, S.; et al. High impact floods and flash floods in Mediterranean countries: The FLASH preliminary database. Adv. Geosci. 2010, 23, 47–55. [Google Scholar] [CrossRef]
  48. Michaelides, S.; Karacostas, T.; Sánchez, J.L.; Retalis, A.; Pytharoulis, I.; Homar, V.; Romero, R.; Zanis, P.; Giannakopoulos, C.; Bühl, J.; et al. Reviews and perspectives of high impact atmospheric processes in the Mediterranean. Atmos. Res. 2018, 208, 4–44. [Google Scholar] [CrossRef]
  49. Garambois, P.A.; Larnier, K.; Roux, H.; Labat, D.; Dartus, D. Analysis of flash flood triggering rainfall for a process-oriented hydrological model. Atmos. Res. 2014, 137, 14–24. [Google Scholar] [CrossRef]
  50. Kotroni, V.; Lagouvardos, K. Lighting in the Mediterranean and its relation with sea-surface temperature. Environ. Res. Lett. 2016, 11, 034006. [Google Scholar] [CrossRef]
  51. Jansa, A.; Alpertn, P.; Arbogast, P.; Buzzi, A.; Ivancan-Picek, B.; Kotroni, V.; Llasat, M.C.; Ramis, C.; Richard, E.; Romero, R.; et al. MEDEX: A general overview. Nat. Hards Earth Syst. Sci. 2014, 14, 1965–1984. [Google Scholar] [CrossRef]
  52. Bechtold, E.B. The 12–13 November 1999 flash flood in southern France. Atmos. Res. 2001, 56, 171–189. [Google Scholar] [CrossRef]
  53. Papagiannaki, K.; Lagouvardos, K.; Kotroni, V. A database of high-impact weather events in Greece: A descriptive impact analysis for the period 2001–2011. Nat. Hazards Earth Syst. Sci. 2013, 13, 727–736. [Google Scholar] [CrossRef]
  54. Galanaki, V.; Kotroni, V.; Lagouvardos, K.; Argiriou, A. A ten-year analysis of lightning activity over the Eastern Mediterranean. Atmos. Res. 2015, 166, 213–222. [Google Scholar] [CrossRef]
  55. Kotroni, V.; Lagouvardos, K.; Lalas, D. The effect of the island of Crete on the Etesian winds over the Aegean Sea. Q. J. R. Meteorol. Soc. 2001, 127, 1917–1938. [Google Scholar] [CrossRef]
  56. Lagouvardos, K.; Kotroni, V.; Dobricic, S.; Nickovic, S.; Kallos, G. On the storm of 21–22 October 1994 over Greece: Observations and model results. J. Geophys. Res. 1996, 101, 26217–26226. [Google Scholar] [CrossRef]
  57. Lagouvardos, K.; Kotroni, V.; Defer, E. The 21–22 January 2004 explosive cyclogenesis over the Aegean Sea: Observations and model analysis. Q. J. R. Meteorol. Soc. 2007, 133, 1519–1531. [Google Scholar] [CrossRef]
  58. Kotroni, V.; Lagouvardos, K.; Kallos, G.; Ziakopoulos, D. Severe flooding over central and southern Greece associated with pre-cold frontal orographic lifting. Q. J. R. Meteorol. Soc. 1999, 125, 967–991. [Google Scholar] [CrossRef]
  59. Kadioglu, M. Regional variability of seasonal precipitation over Turkey. Int. J. Climatol. 2000, 20, 1743–1760. [Google Scholar] [CrossRef]
  60. Kahraman, A.; Markowski, P. Tornado climatology of Turkey. Mon. Weather Rev. 2014, 142, 2345–2352. [Google Scholar] [CrossRef]
  61. Kahraman, A.; Tilev-Tanriover, S.; Kadioglu, M.; Schultz, D.; Markowski, P. Severe hail climatology of Turkey. Mon. Wea. Rev. 2016, 144, 337–346. [Google Scholar] [CrossRef]
  62. Papagiannaki, K.; Lagouvardos, K.; Kotroni, V.; Bezes, A. Flash flood occurrence and relation to the rainfall hazard in a highly urbanized area. Nat. Hazards Earth Syst. Sci. 2015, 15, 1859–1971. [Google Scholar] [CrossRef]
  63. Ledoux, B. The French flood risk management model: Local territories facing State omnipresency. In Floods 2, Risk Management; Vinet, F., Ed.; John Wiley & Sons Ltd.: Hoboken, NJ, USA, 2017; Chapter 2; pp. 15–30. [Google Scholar]
  64. Haylock, M.R.; Hofstra, N.; Klein Tank, A.M.G.; Klok, E.J.; Jones, P.D.; New, M. A European daily high-resolution gridded data set of surface temperature and precipitation for 1950–2006. J. Geophys. Res. 2008, 113, D20119. [Google Scholar] [CrossRef]
  65. Coles, S. An Introduction to Statistical Modelling of Extreme Values. In Springer Series in Statistics; Springer: London, UK, 2001. [Google Scholar]
  66. Hofstra, N.; Haylock, M.; New, M.; Jones, P.D. Testing E-OBS European high-resolution gridded data set of daily precipitation and surface temperature. J. Geophys. Res. 2009, 114, D21101. [Google Scholar] [CrossRef]
  67. Gaume, E.; Bain, V.; Bernardara, P.; Newinger, O.; Barbuc, M.; Bateman, A.; Blaskovicova, L.; Bloschl, G.; Borga, M.; Dumitrascu, A.; et al. A compilation of data on European flash floods. J. Hydrol. 2009, 367, 70–78. [Google Scholar] [CrossRef] [Green Version]
  68. Gaume, E.; Borga, M.; Llasat, M.; Maouche, S.; Lang, M.; Diakakis, M. Mediterranean extreme floods. In The Mediterranenean Region under Climate Change; Universitat de Barcelona: Barcelona, Spain, 2016; pp. 133–144. [Google Scholar]
  69. Paprotny, D.; Sebastian, A.; Morales-Nápoles, O.; Jonkman, S.N. Trends in flood losses in Europe over the past 150 years. Nat. Commun. 2018, 9, 12. [Google Scholar] [CrossRef] [PubMed]
  70. Pereira, S.; Zêzere, J.L.; Quaresma, I.; Santos, P.P.; Santos, M. Mortality patterns of hydro-geomorphologic Disasters. Risk Analysis 2015, 36, 1188–1210. [Google Scholar] [CrossRef] [PubMed]
  71. Boudou, M. Approche Multidisciplinaire Pour La Caractérisation D’inondations Remarquables: Enseignements Tirés de Neuf Evénements en France (1910–2010); Université Paul Valéry: Montpellier, France, 2015. [Google Scholar]
  72. Trigo, M.T.; Ramos, C.; Pereira, S.S.; Ramos, A.M.; Zêzere, J.L.; Liberato, M.L.R. The deadliest storm of the 20th century striking Portugal: Flood impacts and atmospheric circulation. J. Hydrol. 2016, 541, 597–610. [Google Scholar] [CrossRef]
  73. Llasat, M.C.; Barriendos, M.; Barrera, A.; Rigo, T. Floods in Catalonia (NE Spain) since the 14th century. Climatological and meteorological aspects from historical documentary sources and old instrumental records. J. Hydrol. 2005, 313, 32–47. [Google Scholar] [CrossRef]
  74. Martín-Vide, J.P.; Llasat, M.C. The 1962 flash flood in the Rubí stream river (Barcelona, Spain). J. Hydrol. 2018, 566, 441–454. [Google Scholar] [CrossRef]
  75. Tarolli, P.; Borga, M.; Delrieu, G. Analysis of flash flood regimes in the North-Western and South-Eastern Mediterranean regions. Nat. Hazards Earth Syst. Sci. 2012, 12, 1255–1265. [Google Scholar] [CrossRef] [Green Version]
  76. Raymond, F.; Ullmann, A.; Camberlin, P. Précipitations intenses sur le Bassin Méditerranéen: Quelles tendances entre 1950 to 2013? Cybergeo Eur. J. Geogr. 2016, 32. [Google Scholar] [CrossRef]
  77. Llasat, M.C. Chapter 18: Storms and floods. In The Physical Geography of the Mediterranean Basin; Oxford University: Oxford, UK, 2009; pp. 504–531. ISBN 978-0-19-926803-0. [Google Scholar]
  78. Ziv, B.; Dayan, U.; Kushnir, Y.; Roth, C.; Enzel, Y. Regional and global atmospheric patterns governing rainfall in the southern Levant. Int. J. Climatol. 2005, 26, 55–73. [Google Scholar] [CrossRef]
  79. Lopez-Moreno, J.I.; Vicente-Serrano, S.M.; Gimeno, L.; Nieto, R. Stability of the seasonal distribution of precipitation in the Mediterranean region: Observations since 1950 and projections for the 21st century. Geophys. Res. Lett. 2009, 36, L10703. [Google Scholar] [CrossRef]
  80. Fleta, J.; Godé, L.; Gomá, J.L.; Gracia, A.; Gracia, J.; Martínez, J.; Marturià, J.; Palma, J.J.; Pardo, M.; De Paz, A.I.; et al. Flooding areas and risk analysis of Catalonia (inuncat plan). In Proceedings of the 5th European Congress on Regional Geoscience Cartography and Information Systems, Barcelona, Spain, 13–16 June 2006; pp. 458–500. [Google Scholar]
  81. Kahn, M.E. The death toll from natural disasters: The role of income, geography, and institutions. Rev. Econ. Stat. 2005, 87, 271–284. [Google Scholar] [CrossRef]
  82. Donner, W.; Rodríguez, H. Population composition, migration and inequality: The influence of demographic changes on disaster risk and vulnerability. Soc. Forces 2008, 87, 1089–1114. [Google Scholar] [CrossRef]
  83. Kottek, M.; Grieser, J.; Beck, C.; Rudolf, B.; Rubel, F. World Map of the Köppen-Geiger climate classification updated. Meteorol. Z. 2006, 15, 259–263. [Google Scholar] [CrossRef]
  84. Fehri, N.; Samaali, H.; Abaza, K.h. Les inondations catastrophiques du 13 octobre 2007 dans le secteur de Sabbelet Ben Ammar entre aléa climatique et responsabilité anthropique (Grand Tunis–Tunisie). Rev. Tunis. De Géographie 2009, 40, 31–55. [Google Scholar]
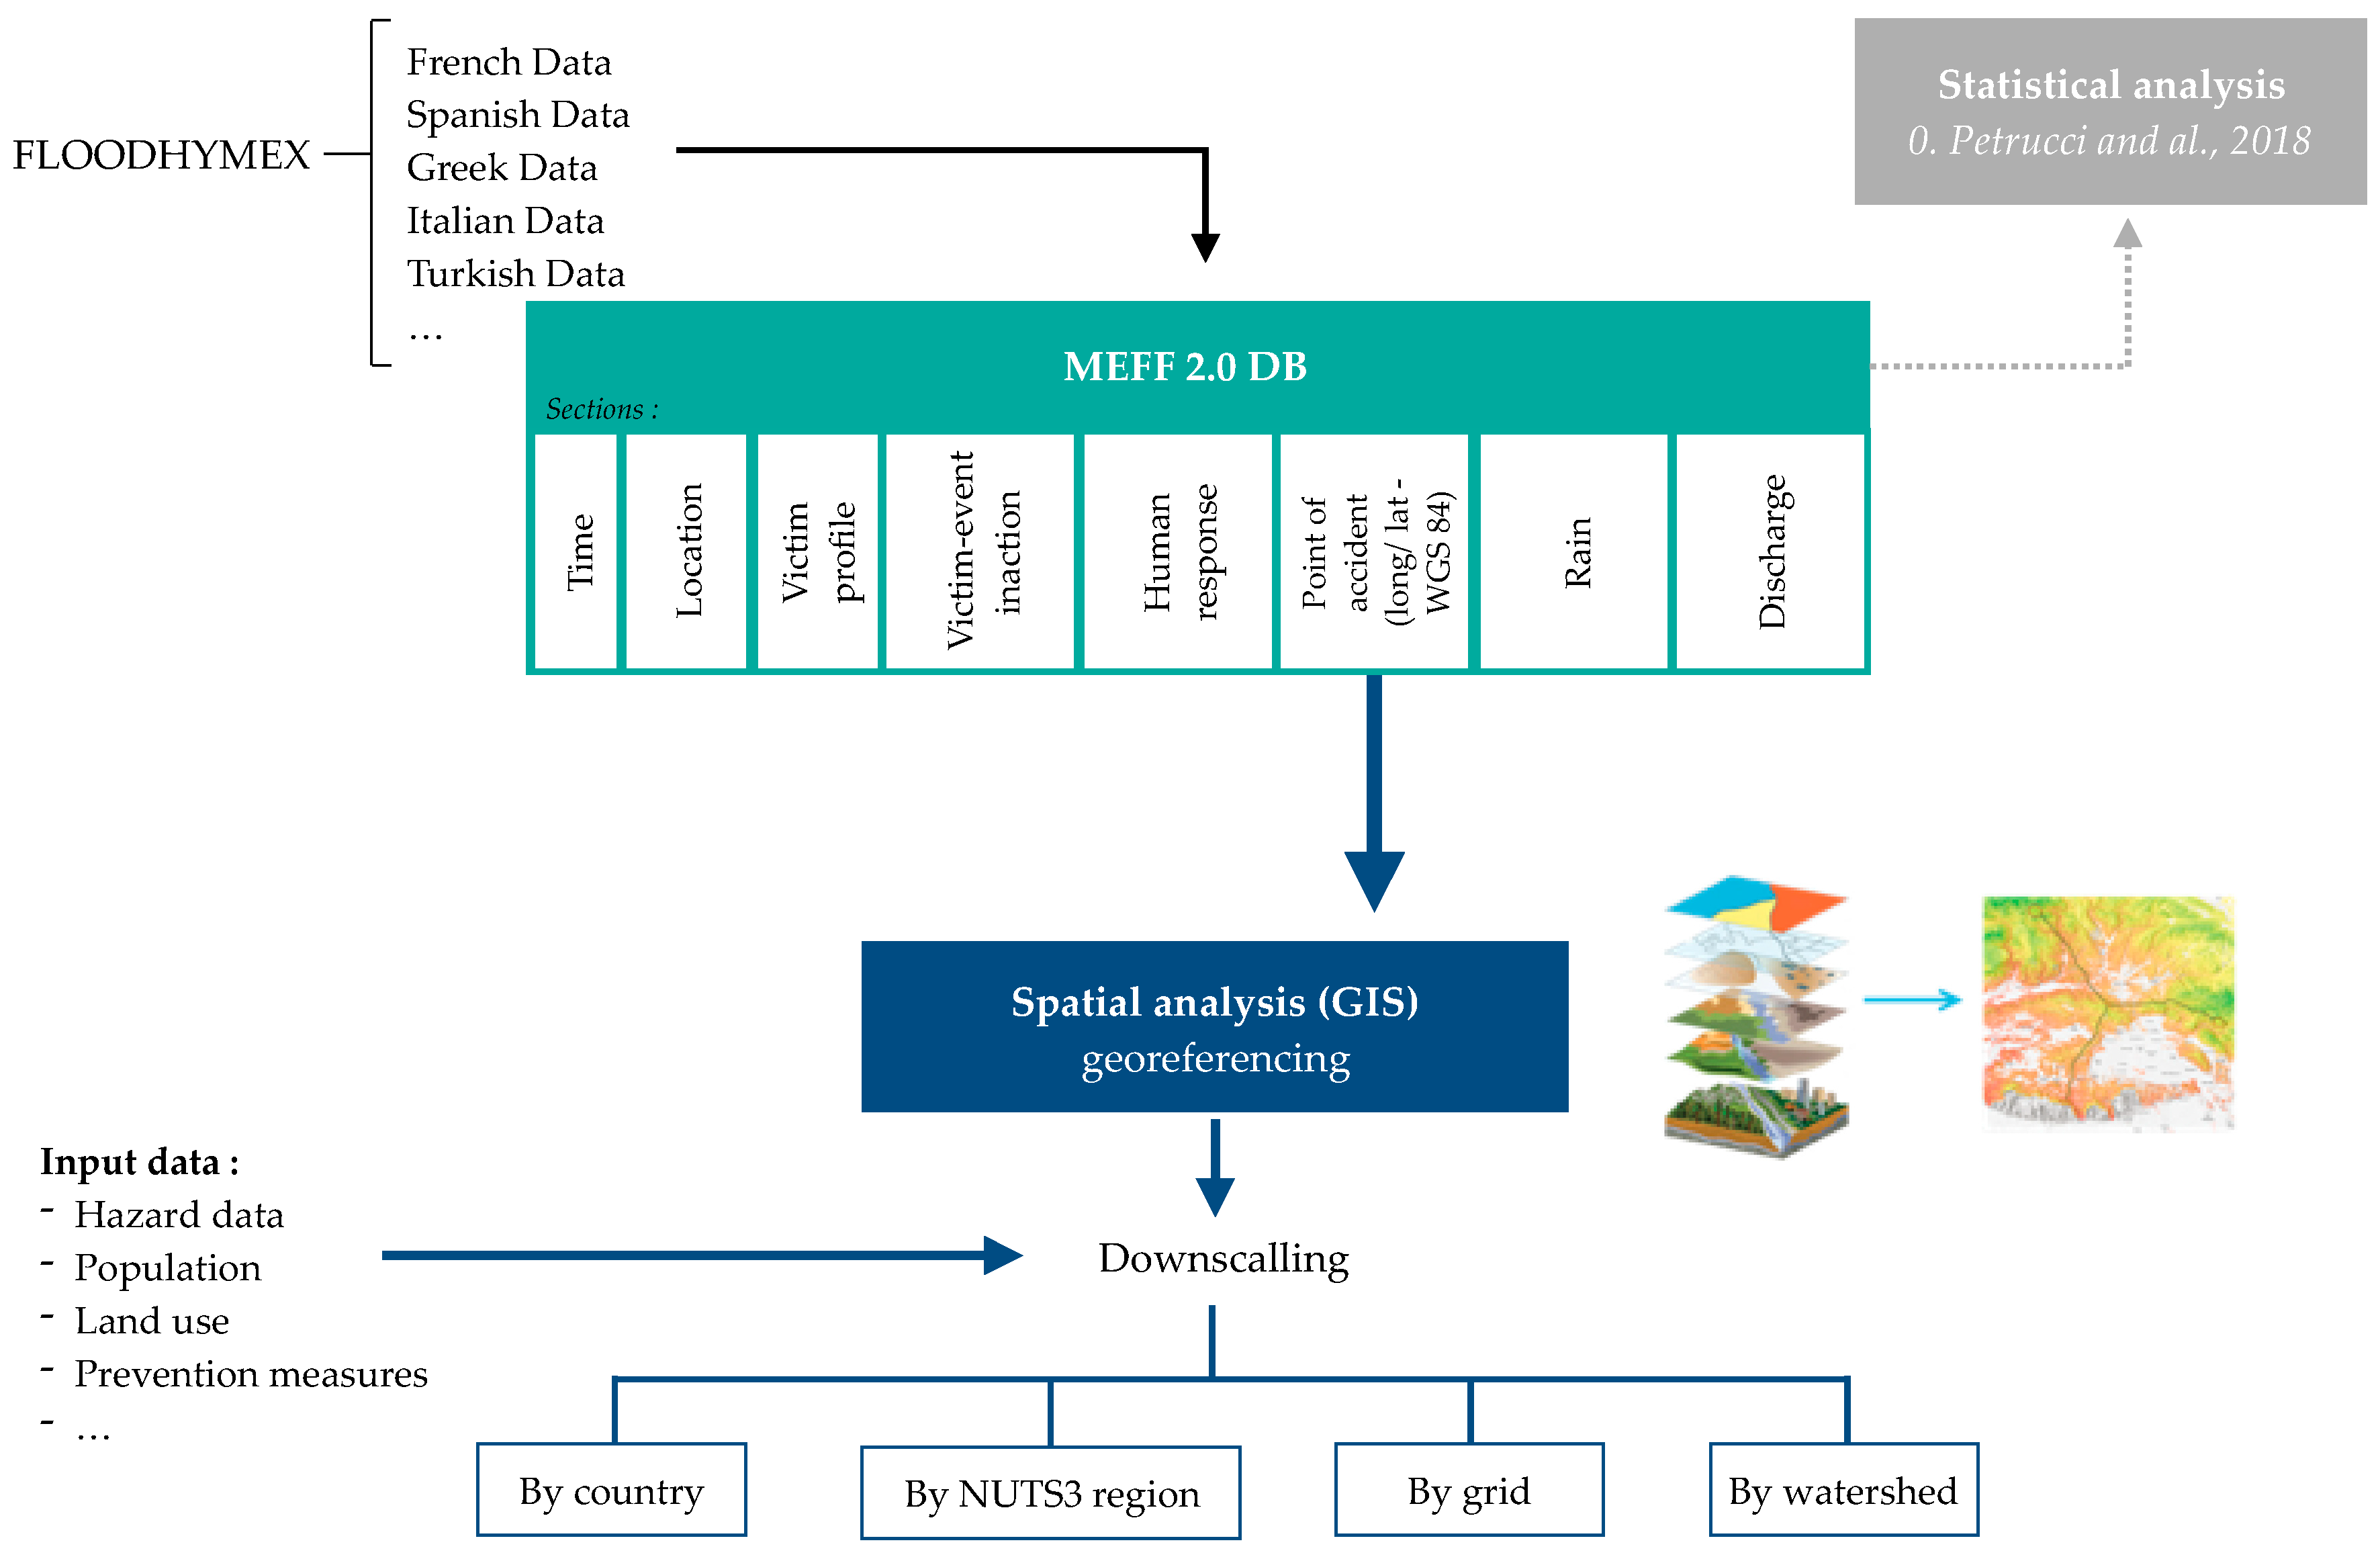
Figure 1. Methods and data for the analysis and valorization of the Mediterranean Flood Fatality Database v2.0 (MEFF v2.0 DB). Nomenclature of Territorial Units for Statistics. Level 3 (NUTS 3), Nomenclature of Territorial Units for Statistics Level 3; GIS, geographical information system.
Water 11 02196 g001
Figure 2. Countries/regions participating to the MEFF v2.0 DB.
Water 11 02196 g002
Figure 3. Population in Mediterranean Basin at NUTS 3 level (source: SEDAC, 2018).
Water 11 02196 g003
Figure 4. Map of flood fatalities at the municipality level.
Water 11 02196 g004
Figure 5. Fatality rate, F, by NUTS 3 regions, based on the decile classification excluding 0.00 values.
Water 11 02196 g005
Figure 6. Fatality rate by 50 × 50 km grid cell based on the quantile classification excluding 0.00 values.
Water 11 02196 g006
Figure 7. Fatality rate by 20 × 20 km hex grid cell based on the quantile classification excluding 0.00 values.
Water 11 02196 g007
Figure 8. A focus on the western Mediterranean Basin (Catalonia, Southern France, and Balearic Islands) with a hex 20 × 20 km grid, based on the decile classification excluding 0.00 values.
Water 11 02196 g008
Figure 9. Distribution of flood fatalities according to the altitude in Southern France (n = 274).
Water 11 02196 g009
Figure 10. Fatality rate by catchments based on the decile classification excluding 0.00 values.
Water 11 02196 g010
Figure 11. Monthly distribution of flood fatalities per country.
Water 11 02196 g011
Figure 12. Deadliest month per region.
Water 11 02196 g012
Figure 13. Deadliest month by NUTS 3 region.
Water 11 02196 g013
Figure 14. Relationship between the population density and the density of fatal events.
Water 11 02196 g014
Figure 15. Relationship between the average number of deaths per event and the population density.
Water 11 02196 g015
Figure 16. Evolution of the annual number of flood fatalities in the MEFF v2.0 DB area.
Water 11 02196 g016
Figure 17. Mean F per five-year periods (all MEFF v2.0 DB regions).
Water 11 02196 g017
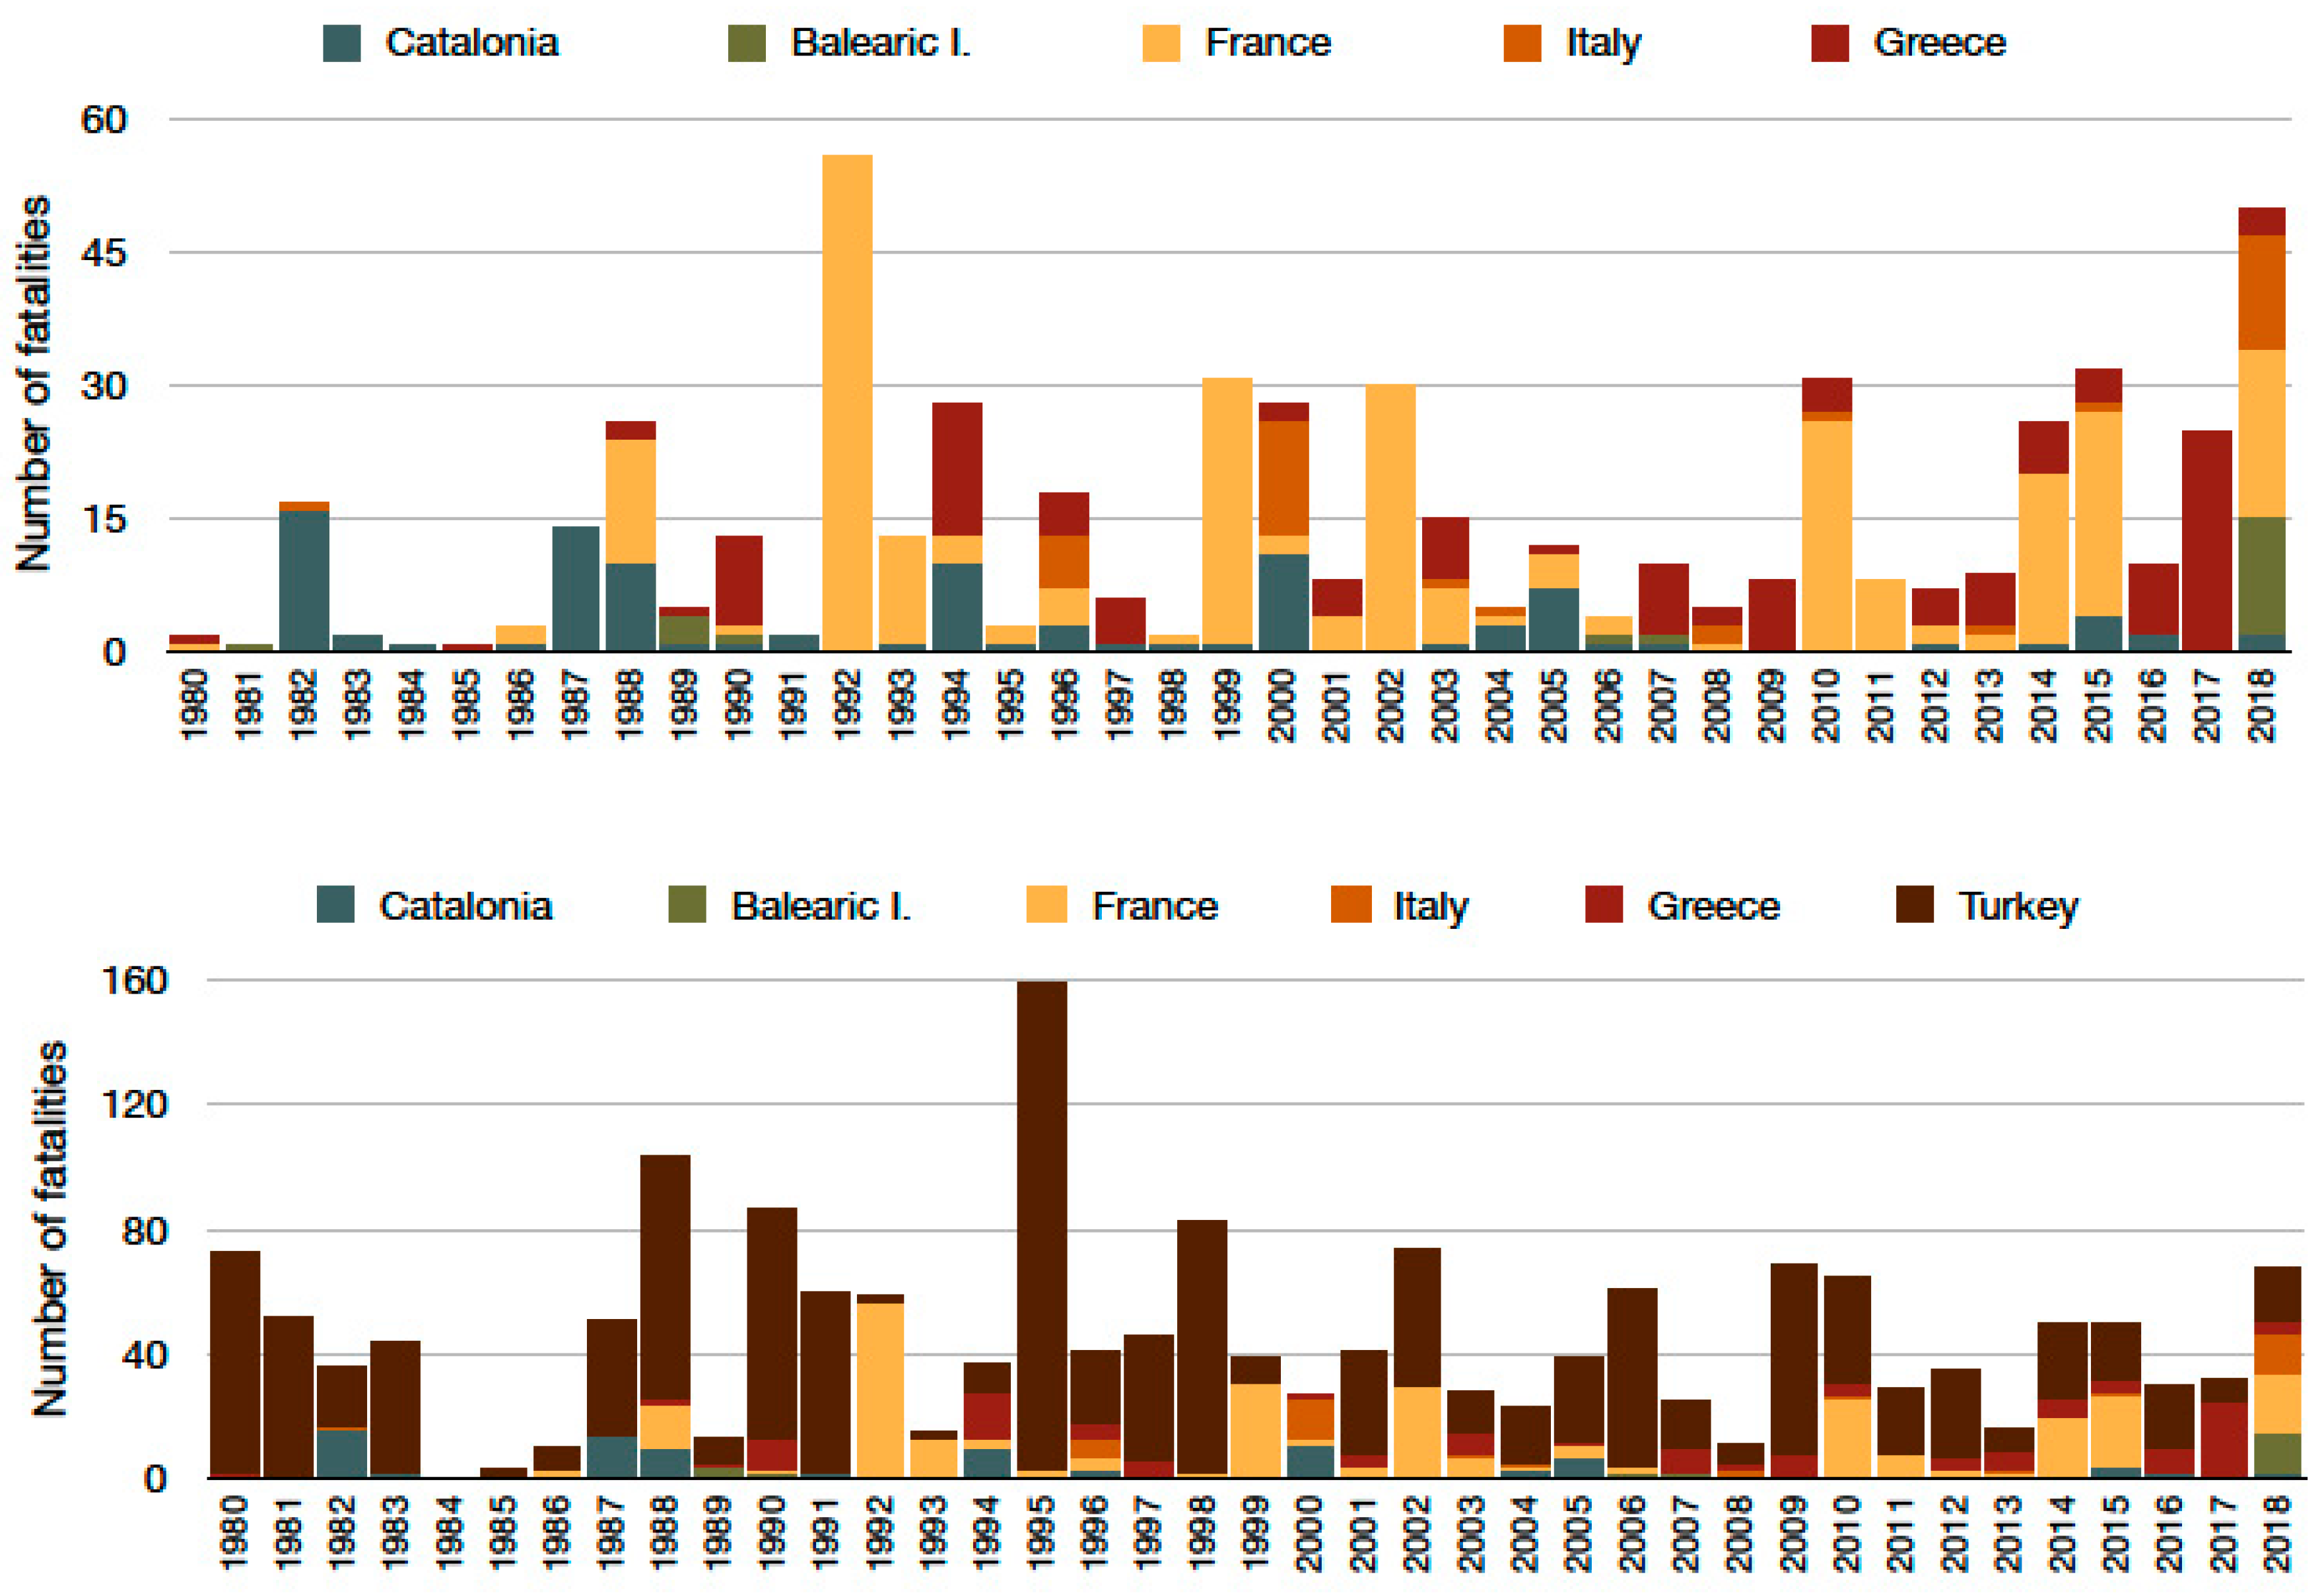
Figure 18. Yearly evolution of mortality by region (without Turkey above and including Turkey below) (we separated results with and without Turkey because the high number of deaths in Turkey does not allow seeing the distribution of annual mortality in the other countries).
Water 11 02196 g018
Figure 19. Five-year time step evolution of F per MEFF v2.0 DB regions.
Water 11 02196 g019
Figure 20. Twenty-year return period of extreme precipitation.
Water 11 02196 g020
Table 1. General features by country. NUTS3, Nomenclature of Territorial Units for Statistics Level 3.
Region (Country)Flood FatalitiesArea (km2)Population (2000)Population Density in 2000 (inh/km2)Number of NUTS 3
Catalonia (Spain)10032,1136,293,4401964
Balearic Islands (Spain)205030823,4011641
Southern France27553,8747,233,58013410
Calabria (Italy)4015,0882,028,6301345
Greece132131,75910,780,0008252
Turkey1242780,37566,890,0008681
Study area18091,018,23994,048,05192153
Table 2. Fatality rate (flood fatalities/year/1M inhabitants), F, per country (annual average for the period 1980–2018).
Region (Country)Number of Flood FatalitiesPopulation (2000)Fatality Rate, F
Catalonia (Spain)1006,293,4400.407
Balearic Islands (Spain)20823,4010.623
Southern France2757,233,5800.975
Calabria (Italy)402,028,6300.506
Greece13210,780,0000.314
Turkey124266,890,0000.476
Study area180994,048,0510.49
Table 3. Deadliest month per region.
Region (Country)Deadliest Month
Southern FranceSeptember
Calabria (Italy)September
Balearic Islands (Spain)October
Catalonia (Spain)November
GreeceNovember
Western TurkeyNovember
Eastern TurkeyJuly
Table 4. Density of fatal event per region.
Region (Country)Number of Fatal Events (1980–2018)Density of Fatal Event (Number of Fatal Event/1000 km2 in 39 Years)Average Number of Deaths Per EventPopulation Density in 2000 (inh/km2)
Catalonia (Spain)451.42.2196
Balearic Islands (Spain)514164
Southern France731.43.7134
Calabria (Italy)120.83.3134
Greece560.42.382
Turkey2640.34.586
Table 5. Number and percentage of fatalities with accurate and validated geolocation per country/region.
Region (Country)Number of Located Fatalities% of Located Fatalities
Catalonia (Spain)100100.0
Balearic Islands (Spain)20100.0
Southern France27499.6
Calabria (Italy)40100.0
Greece132100.0
Turkey119796.4
Table 6. Weight of the deadliest event for each case study.
Region (Country)Total Number of Events (1980–2018)Total Number of Fatalities (1980–2018)Death Toll of the Deadliest EventDate of the Deadliest Event
Number of Fatalities% of Fatalities by Country/Region
Catalonia (Spain)4510014146 November 1982
Balearic Islands (Spain)52013659 October 2018
Southern France73275491822 September 1992
Calabria (Italy)1240133310 September 2000
Greece56132241815 November 2017
Turkey264124275613 July 1995