Article

The Spatial Distribution of the Microbial Community in a Contaminated Aquitard below an Industrial Zone

1
Department of Environmental Hydrology & Microbiology (EHM), The Zuckerberg Institute for Water Research (ZIWR), The Jacob Blaustein Institutes for Desert Research, Ben-Gurion University of the Negev, Sede Boqer Campus 8499000, Israel
2
Geological Survey of Israel, Yesha’yahu Leibowitz 32, Jerusalem 9692100, Israel
*
Author to whom correspondence should be addressed.
Water 2019, 11(10), 2128; https://doi.org/10.3390/w11102128
Submission received: 4 September 2019 / Revised: 2 October 2019 / Accepted: 9 October 2019 / Published: 14 October 2019
(This article belongs to the Special Issue Water Flow, Solute and Heat Transfer in Groundwater)

Abstract

:
The industrial complex Neot Hovav, in Israel, is situated above an anaerobic fractured chalk aquitard, which is polluted by a wide variety of hazardous organic compounds. These include volatile and non-volatile, halogenated, organic compounds. In this study, we characterized the indigenous bacterial population in 17 boreholes of the groundwater environment, while observing the spatial variations in the population and structure as a function of distance from the polluting source. In addition, the de-halogenating potential of the microbial groundwater population was tested through a series of lab microcosm experiments, thus exemplifying the potential and limitations for bioremediation of the site. In all samples, the dominant phylum was Proteobacteria. In the production plant area, the non-obligatory organo-halide respiring bacteria (OHRB) Firmicutes Phylum was also detected in the polluted water, in abundancies of up to 16 %. Non-metric multidimensional scaling (NMDS) analysis of the microbial community structure in the groundwater exhibited clusters of distinct populations following the location in the industrial complex and distance from the polluting source. Dehalogenation of halogenated ethylene was demonstrated in contrast to the persistence of brominated alcohols. Persistence is likely due to the chemical characteristics of brominated alcohols, and not because of the absence of active de-halogenating bacteria.

Graphical Abstract

1. Introduction

Groundwater contamination, by persistent, bioaccumulative and bioactive compounds due to intensive industrialization is a critical environmental issue [1,2,3]. The wide range of chemical compounds complicates the attempts to protect aquifers from their contamination [4,5]. In addition to pollution from industry, agriculture, and the energy sector, personal care products, and pharmaceutical residues are emerging organic contaminants (EOC) in groundwater [6]. In a comprehensive review by Lapworth et al. (2012), EOCs, such as detergents, antioxidants, fire retardants, plasticizers, as well as antibiotics, anti-inflammatories and barbiturates, were detected in substantial levels between 10–104 ng/L in groundwater globally [7]. One of the largest groups of chemicals that cause environmental contamination are halogenated organic compounds [8]. Due to their high common resistance to degradation, they often accumulate in the environment, and their fate depends highly upon microbial degradation [6,7,8,9,10].
The microbial community structure in the ecosystem is critical for the biodegradation of pollutants to occur. In pristine aquifers, microbial diversity is explained by water chemistry, and therefore changes in geochemical conditions and contaminant content will affect the community structure [11,12,13]. Bacteria adaptation accelerates the biodegradation of organic chemicals, where shifts in community composition or abundances are one of the adaptive processes. For example, in a pilotscale aquifer, Ma et al. [14] presented clear shifts in the microbial community exposed to a chlorinated ethanol fuel plume. Interestingly, after community shifts led to biodegradation of the contaminant and a geochemical restoration of the aquifer, the microbial community structure was also restored. Long monitoring of a coal tar waste-contaminated groundwater ecosystem revealed that natural attenuation processes are accompanied by temporal changes in the microbial communities [15].
Nonetheless, the existence of a microbial potential in the ecosystem does not always lead to in situ biodegradation [11]. Multiple limitations, such as insufficient biomass, geochemical and hydraulic fluctuations, utilization of a wide range of substrates, competitive inhibition, or catabolite repression, can all inhibit biodegradation [16]. Therefore, integrated approaches, such as geochemical-molecular or isotopic-molecular approaches are used for the actual monitoring of biodegradation in natural environments. For example, Tarnawski et al. [17] followed the reductive dechlorination of chlorinated-ethenes in contaminated aquifers and presented an integrated long-term geochemical-microbial monitoring approach, in order to identify biogeochemical processes limiting or supporting biodegradation. Révész et al. [18], on the other hand, quantified the relevant bacterial groups along with in situ trichloroethylene (TCE) anaerobic biodegradation, while monitoring degradation through the use of stable carbon isotopes.
The Neot-Hovav industrial complex accommodates numerous chemical industries in the pharmaceutical, bromine-based organic compounds and agrochemicals. The complex is situated above the fractured Eocene chalk formation [19]. The fractures and joints in the chalk form an aquitard with preferable pathways for water flow and solute migration, thus transmitting contaminants from the surface to groundwater at relatively high fluxes in a short time [20,21]. For this reason, and due to inadequate treatment of industrial waste, the groundwater underlying the industrial area has been contaminated by numerous organic compounds: Volatile and non-volatile halogenated organic compounds, heavy metals, and halogen-containing salts [4,22,23].
In contrast to porous aquifers, the hydraulic heterogeneity in a fractured system is large, and strongly limits particle transport (like bacteria), solutes including electron donors and acceptors, as well as nutrients along the hydrologic gradients [24]. Thus, the effect of hydrologic discontinuity on microbial community structure and catabolic potential is still an open question. Furthermore, in polluted groundwater like Neot-Hovav, where hundreds of different compounds are present, a unique approach to the aggregated effect of inorganic and organic compounds upon microbial community composition and function should be used. In turn, the diversity and richness of the groundwater microbiota, as well as their metabolic potential, can provide a broader perspective on the “health” of the groundwater and the possibility for natural recovery or the need for active remediation management.
In this study, we examine how the extent and type of contamination above ground determine and affect the microbial community structure in the groundwater. For this cause, we investigated spatial changes in the microbial community of the polluted groundwater that underlies the Neot-Hovav industrial complex in relation to the industrial sources of specific halogenated pollutants. Changes in communal structure as a factor of groundwater quality were examined while providing a more sustainable approach to the understanding of these multi-contaminant, complex environments. Microbial activity of the groundwater bacterial communities was also tested through a series of biodegradation microcosm experiments in the lab with various brominated organic compounds like TBNPA-tribromoneopentyl alcohol, DBNPG-dibromoneopentyl glycol, BCE-bromo-chloro-ethane, EDB ethylene dibromide, and EDC ethylene dichloride. These compounds were chosen, as they are part of the wide contaminant palette that exist in the groundwater, and are produced and used in the industrial area.

2. Materials and Methods

2.1. Material

Tribromoneopentyl alcohol (TBNPA, >98% pure) was obtained from TCI chemicals, Japan; dibromoneopentyl glycol (DBNPG) from Israel Chemicals Ltd. (ICL Israel), 1-bromo-1-chloroethane (BCE), 1,2-Dibromoethane (EDB), and, 1,2-dichloroethane (EDC) (99.8% pure) were obtained from Sigma Aldrich (Rehovot, Israel). Methanol, acetone, di-propanol and acetonitrile were all HPLC grade (Supra-gradient, Bio-Lab, Israel).

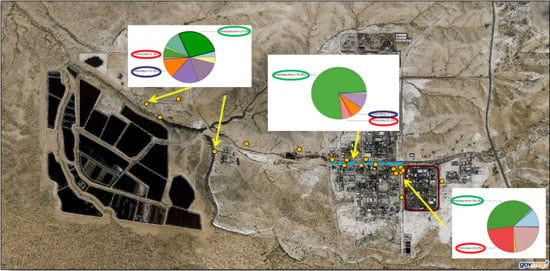
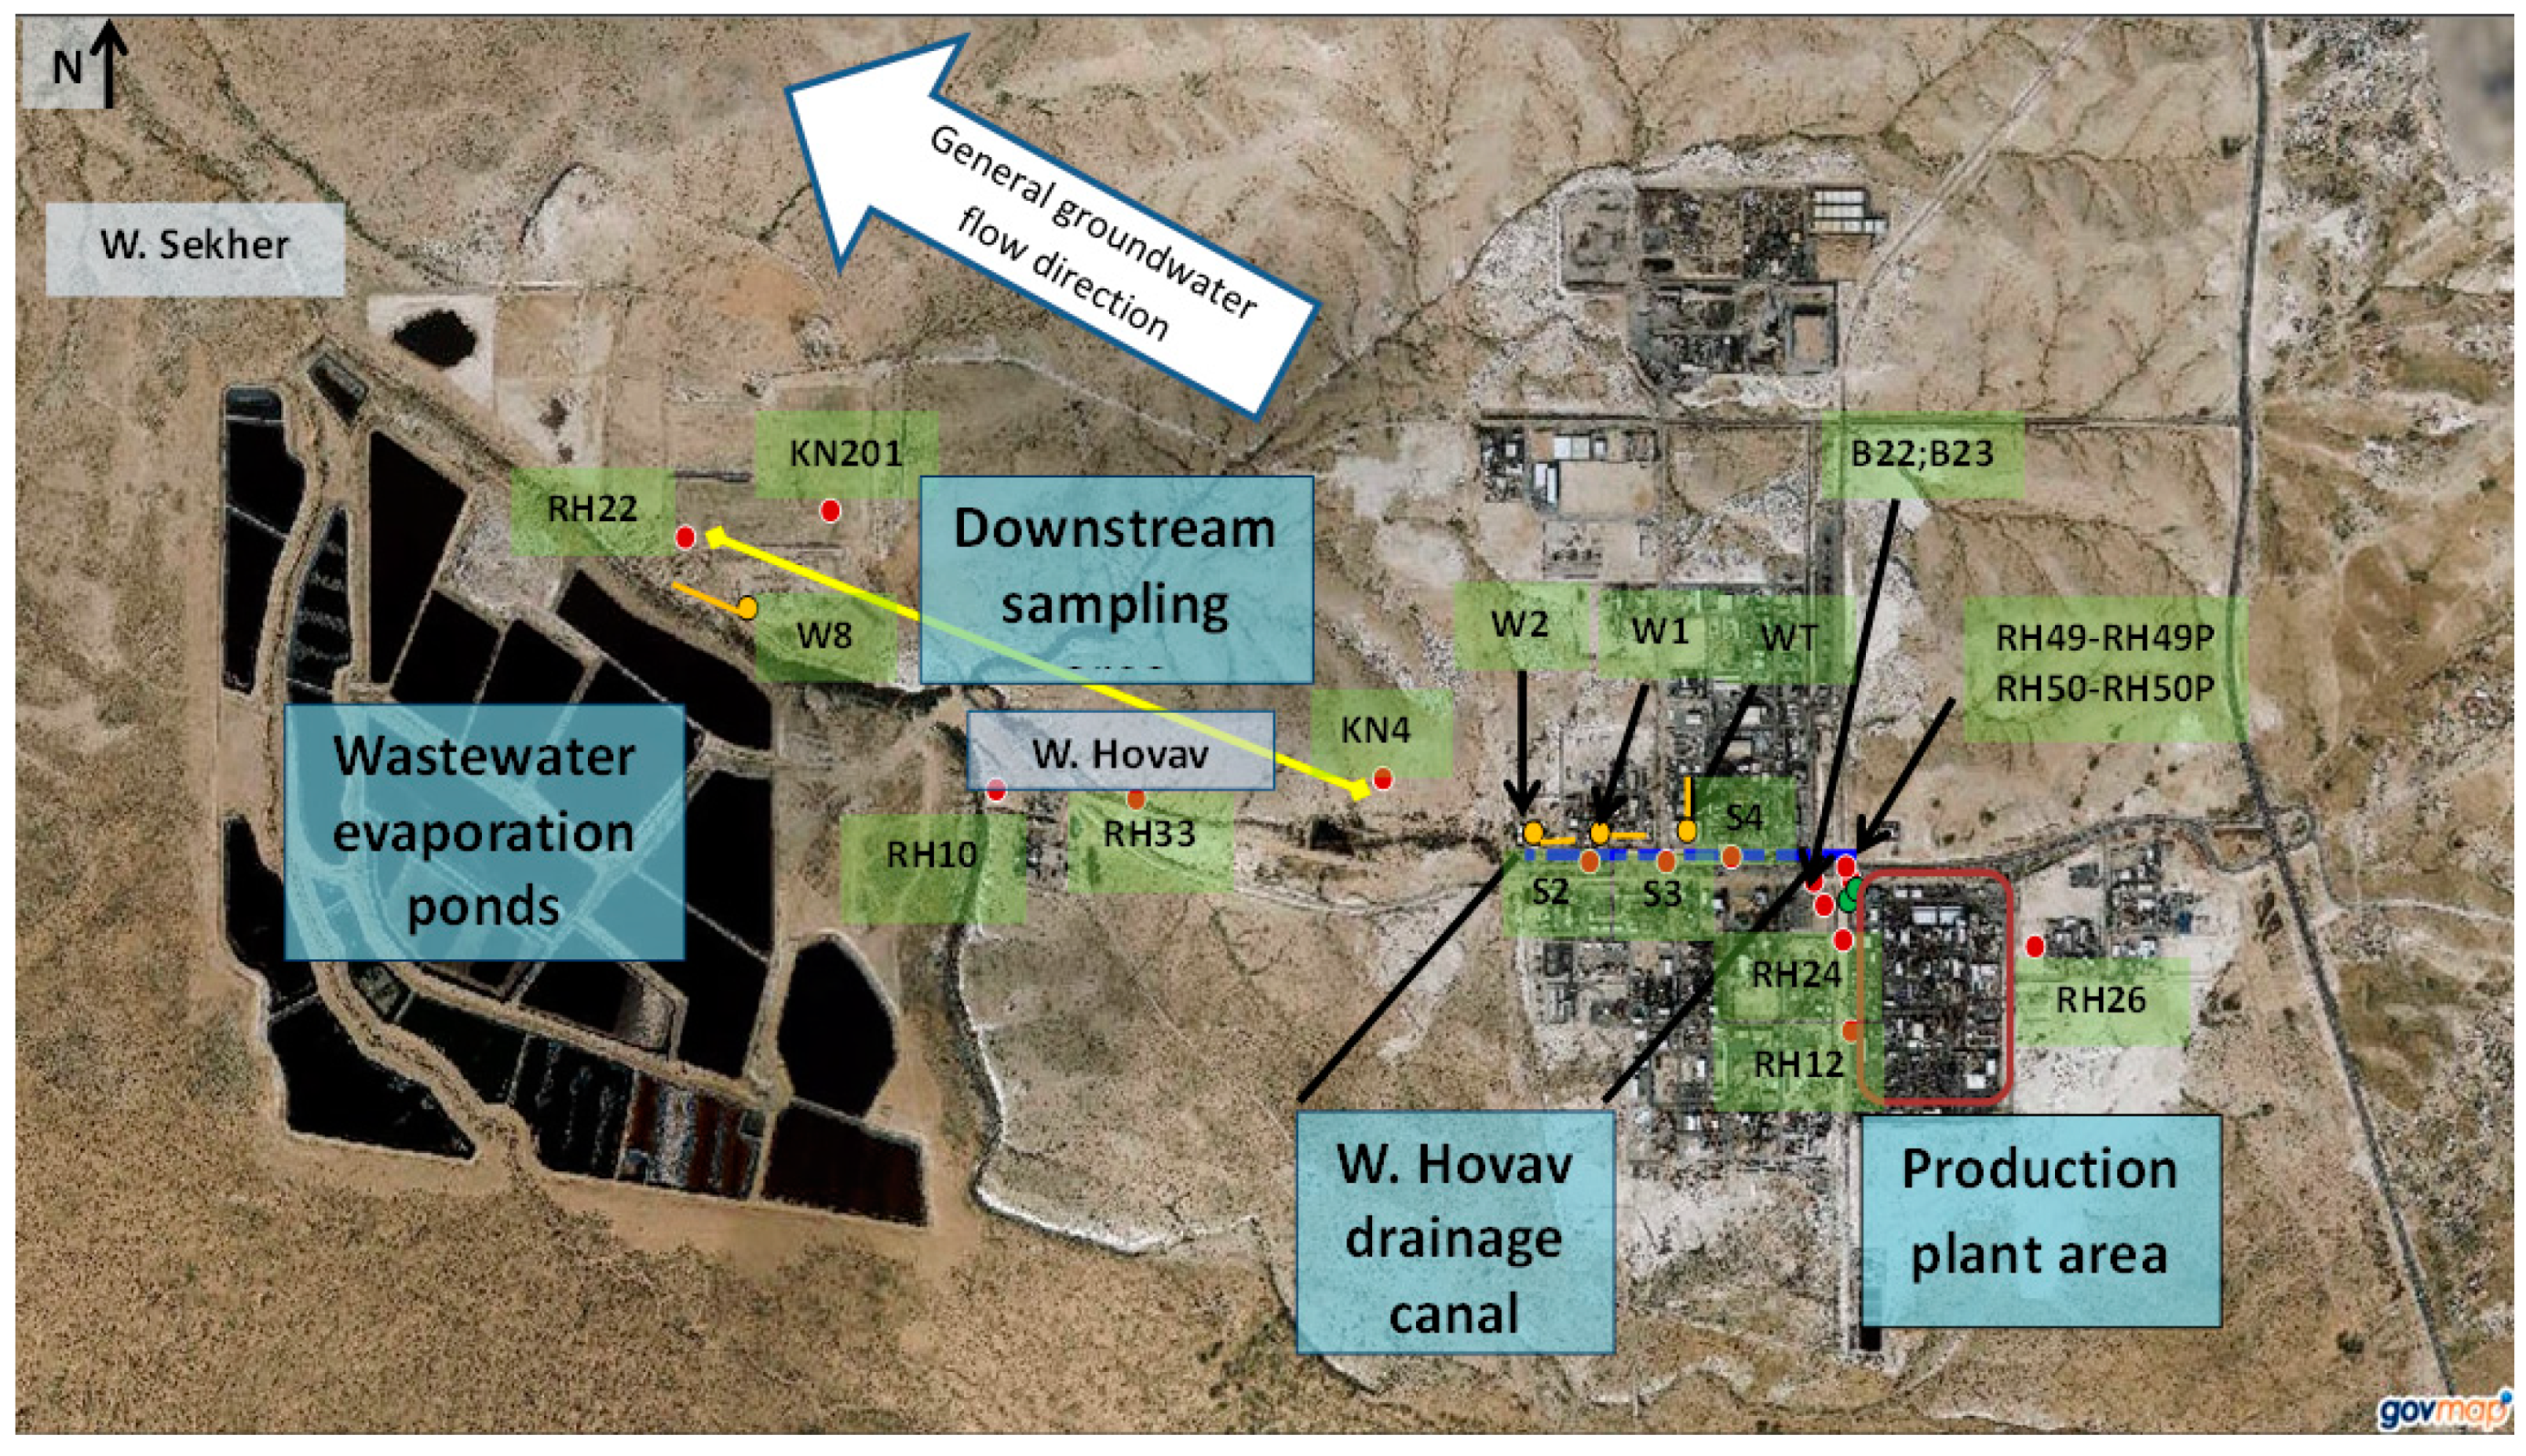
2.2. Study Area and Groundwater Sampling

The Neot Hovav industrial site (180,063, 560,798 Israel Transverse Mercator), hosts various chemical industrial plants that overlie an extensively fractured chalk aquitard in which the fractures were shown to play a major role in infiltration, groundwater flow and solute transport [20,21,25]. The groundwater underlying the industrial site is characterized by a slightly acidic to slightly alkaline pH range (6.0–8.5), high electrical conductivity (EC) (14.1–55.1 mS/cm), low dissolved oxygen (DO) concentrations (0.22–0.84 mg/L), and low metal concentrations (<5 µg/L).
In 2015, 17 boreholes were sampled for microbial biodiversity and dissolved organic carbon (DOC), with a spatial distribution from the production plant [20], and up to 3.5 km downstream of the industrial area. In spring 2016 the RH49 pumping well (RH49P) was sampled for establishing microcosms for TBNPA and DBNPG. In February 2019, RH49P was sampled for establishing microcosms BCE, EDB, and EDC degradation.
Based on the land uses in the site, the industrial area was divided into three parts: (1) Adjacent to the brominated organic compounds (BOC’s) production plant (groundwater depth: 30–50 m below ground). (2) Along Wadi Hovav—a dry riverbed that drains the erratic runoff in the industrial area (groundwater depth: 2–10 m below ground). (3) Downstream to the production plant, up to ca. 3.5 km from the plant (groundwater depth: 30–40 m below ground) (Figure 1). The area that is downstream to the production plant hosted in the past various wastewater treatment procedures that released along it the year’s contaminants to the sub-surface environment. For example, forced evaporation of effluents by sprinklers was practiced over hillslope located next to observation borehole KN4 until the late 1980s [26], and unlined wastewater evaporation ponds were used adjacent to borehole KN201 until 1982 [27]. The locations of the sampled boreholes are summarized in Table 1 [23]. See SI for a detailed description of groundwater sampling procedures.

2.3. DNA Extraction, PCR Amplification and Sequencing

Seventeen groundwater samples from September 2015 were extracted for total genomic DNA after filtration through 0.22 µm sterilized filters. DNA was extracted by using PowerSoil® kits (MoBio) (Carlsbad, CA, USA), with slight modifications to the manufacturer’s instructions: The 0.22 µm sterilized filters were added to the PowerBead Tubes instead of 0.25 g soil. In the elution, 100 µL of solution C6 was added in two steps (twice 50 µL), and centrifuged at 10,000× g for 30 s in-between. The 16S rRNA gene was amplified by the polymerase chain reaction (PCR) with the primers CS1-341F-CS2-806R for Bacteria and CS1_Arch344F-CS2_Arc806R for Archaea [28]. The thermocycler conditions for DNA amplification were: 5 min at 95 °C, followed by 26 cycles of 95 °C (30 s) → 55 °C (45 s) → 68 °C (30 s) and finalizing the reaction with 68 °C (7 min); a set of PCR products was run and visualized on agarose gel (2%) to verify product specificity. The DNA concentration was determined using a NanoDrop 1000 spectrophotometer (Thermo Scientific, Wilmington, NC, USA).
PCR products were sent to the DNA Services Facility, Research Resources Center, University of Illinois at Chicago (UIC), for sequencing of 16S rRNA using the Illumina MiSeq platform. Operational taxonomic units (OTUs) were assigned according to the company’s pipeline: Through the NGS analysis pipeline of the SILVA rRNA gene database project (SILVAngs 1.3) [29]. BLAST (version 2.2.30+) in combination with SILVA SSU or LSU Ref datasets were used for theclassification of reference sequences [30].

2.4. Data Analysis of Sequencing Results

Statistical analysis of the sequencing data was implemented using various R packages (version 3.3.1) [31]. The alpha biodiversity of the microbial community was estimated for each sample using the abundance-based diversity indices Shannon and Chao1, through the plot_richness function of the phyloseq package in R (version 1.14.0) [32]. Significant differences between diversity indices to the sample location were tested by the Kruskal-Wallis Analysis of Variance (ANOVA) by ranks test (STATISTICA software (version 10). Weighted UniFrac distances of the community data was calculated by the UniFracfunction of the phyloseq package, and the Bray-Curtis distance matrix by the bray function of the phyloseq and vegan (version 2.4.0) packages [33]. Nonmetric multidimensional scaling (NMDS) OTU-based community composition, based on Bray-Curtis and weighted UniFrac distances was conducted by the ordinate function in the phyloseq package, and by the metaMDS function of the vegan package. Significant differences in the microbial community composition between samples were tested by Permutational multivariate ANOVA (PERMANOVA) using the adonis function of the vegan package. Envfit function in the vegan package was applied to illustrate the correlations between environmental parameters and the microbial communities. Microbial phylotypes with their corresponding read counts were imported into METAGENassist [34] to analyze the metabolic features of the microbial communities.

2.5. Microcosm Experiments

The biodegradation potential of groundwater bacteria to degrade TBNPA, DBNPG, BCE, EDB, and EDC was tested in a 100 mL anaerobic groundwater microcosm batch experiment. In all experiments, a RH49P groundwater sample (two liters in a sterile polypropylene bottle) was retrieved from the continuously pumping RH49 borehole (Figure 1, RH49P) [35]. The TBNPA; DBNPG (50 mg/L)/or both TBNPA and DBNPG (25 mg/L each) experiment included three different supplied electron donors: H2 (1.7–3.8 mL), lactate (0.4 g/L), or acetate (6.8 g/L) to encourage degradation (i.e., each electron donor treatment was given to three bottles that contained 1-TBNBA; 2-DBNPG; and 3-TBNPA+DBNPG), and was done under anaerobic conditions. Three negative controls contained sterile (autoclaved) groundwater with TBNPA (50 mg/L); DBNPG (50 mg/L); or both TBNPA and DBNPG (25 mg/L each). The microcosms were sampled anaerobically at the beginning at a period of weeks, then months, and finally after three years. For BCE, EDB, and EDC (1 mM) microcosms, water was sampled from RH49P in February 2019 and lactate was added to all bottles (0.39 gr/L) (in duplicates). One bottle was autoclaved and served as a control. Samples were taken anaerobically every week. All bottles were held at room temperature and were constantly shaken.

2.6. Analytical Methods

TBNPA and DBNPG concentrations were determined by high performance liquid chromatography (HPLC; Agilent 1100 series, Palo Alto, CA, USA). BCE, EDB and EDC concentrations were determined by Gas Chromatograph-Mass Spectrometer (6890–5975 Agilent Palo Alto, CA, USA. Samples were automatically diluted 100 times, and 5 mL of the solution was purged for 11 min (He flow 40 mL/min). Desorption was performed at 190 °C for 4 min. For GC separation a DB-5 capillary column (30 m × 0.25 mm id × 0.25 μm) was used. The following conditions were applied: Split injection mode 20:1, injector temp. 220 °C; oven heating from 50 °C to 200 °C at a rate of 10 °C/min; He flow was 1 mL/min. The concentration was compared to chloroform as an internal standard. DOC was quantified by a Multi N/C 21005 (Analytic Jena, Jena, Germany).

3. Results

3.1. Molecular Analysis of the Groundwater Indigenous Bacterial Communities

3.1.1. Sequencing and Taxa Identification

The September 2015 16S rRNA amplicon sequencing of groundwater DNA from 17 sampled boreholes yielded 2,101,353 raw reads, with 1,629,795 quality reads (after filtering). The number of reads per sample ranged from 74,591 to 148,679, with a mean of 94,821 ± 18,101. Identification at different taxonomic levels of the normalized data yielded 67 phyla, 209 classes, 412 orders, 647 families, 1052 genera, and 1092 species. Identification at different taxonomic levels of the non-normalized data yielded 72 phyla, 230 classes, 457 orders, 726 families, 1216 genera, and 1271 species (See OTU table in SI). The dominant taxa (above 2.0% abundance) at the Phylum, Class and Family level are presented in Table 2.

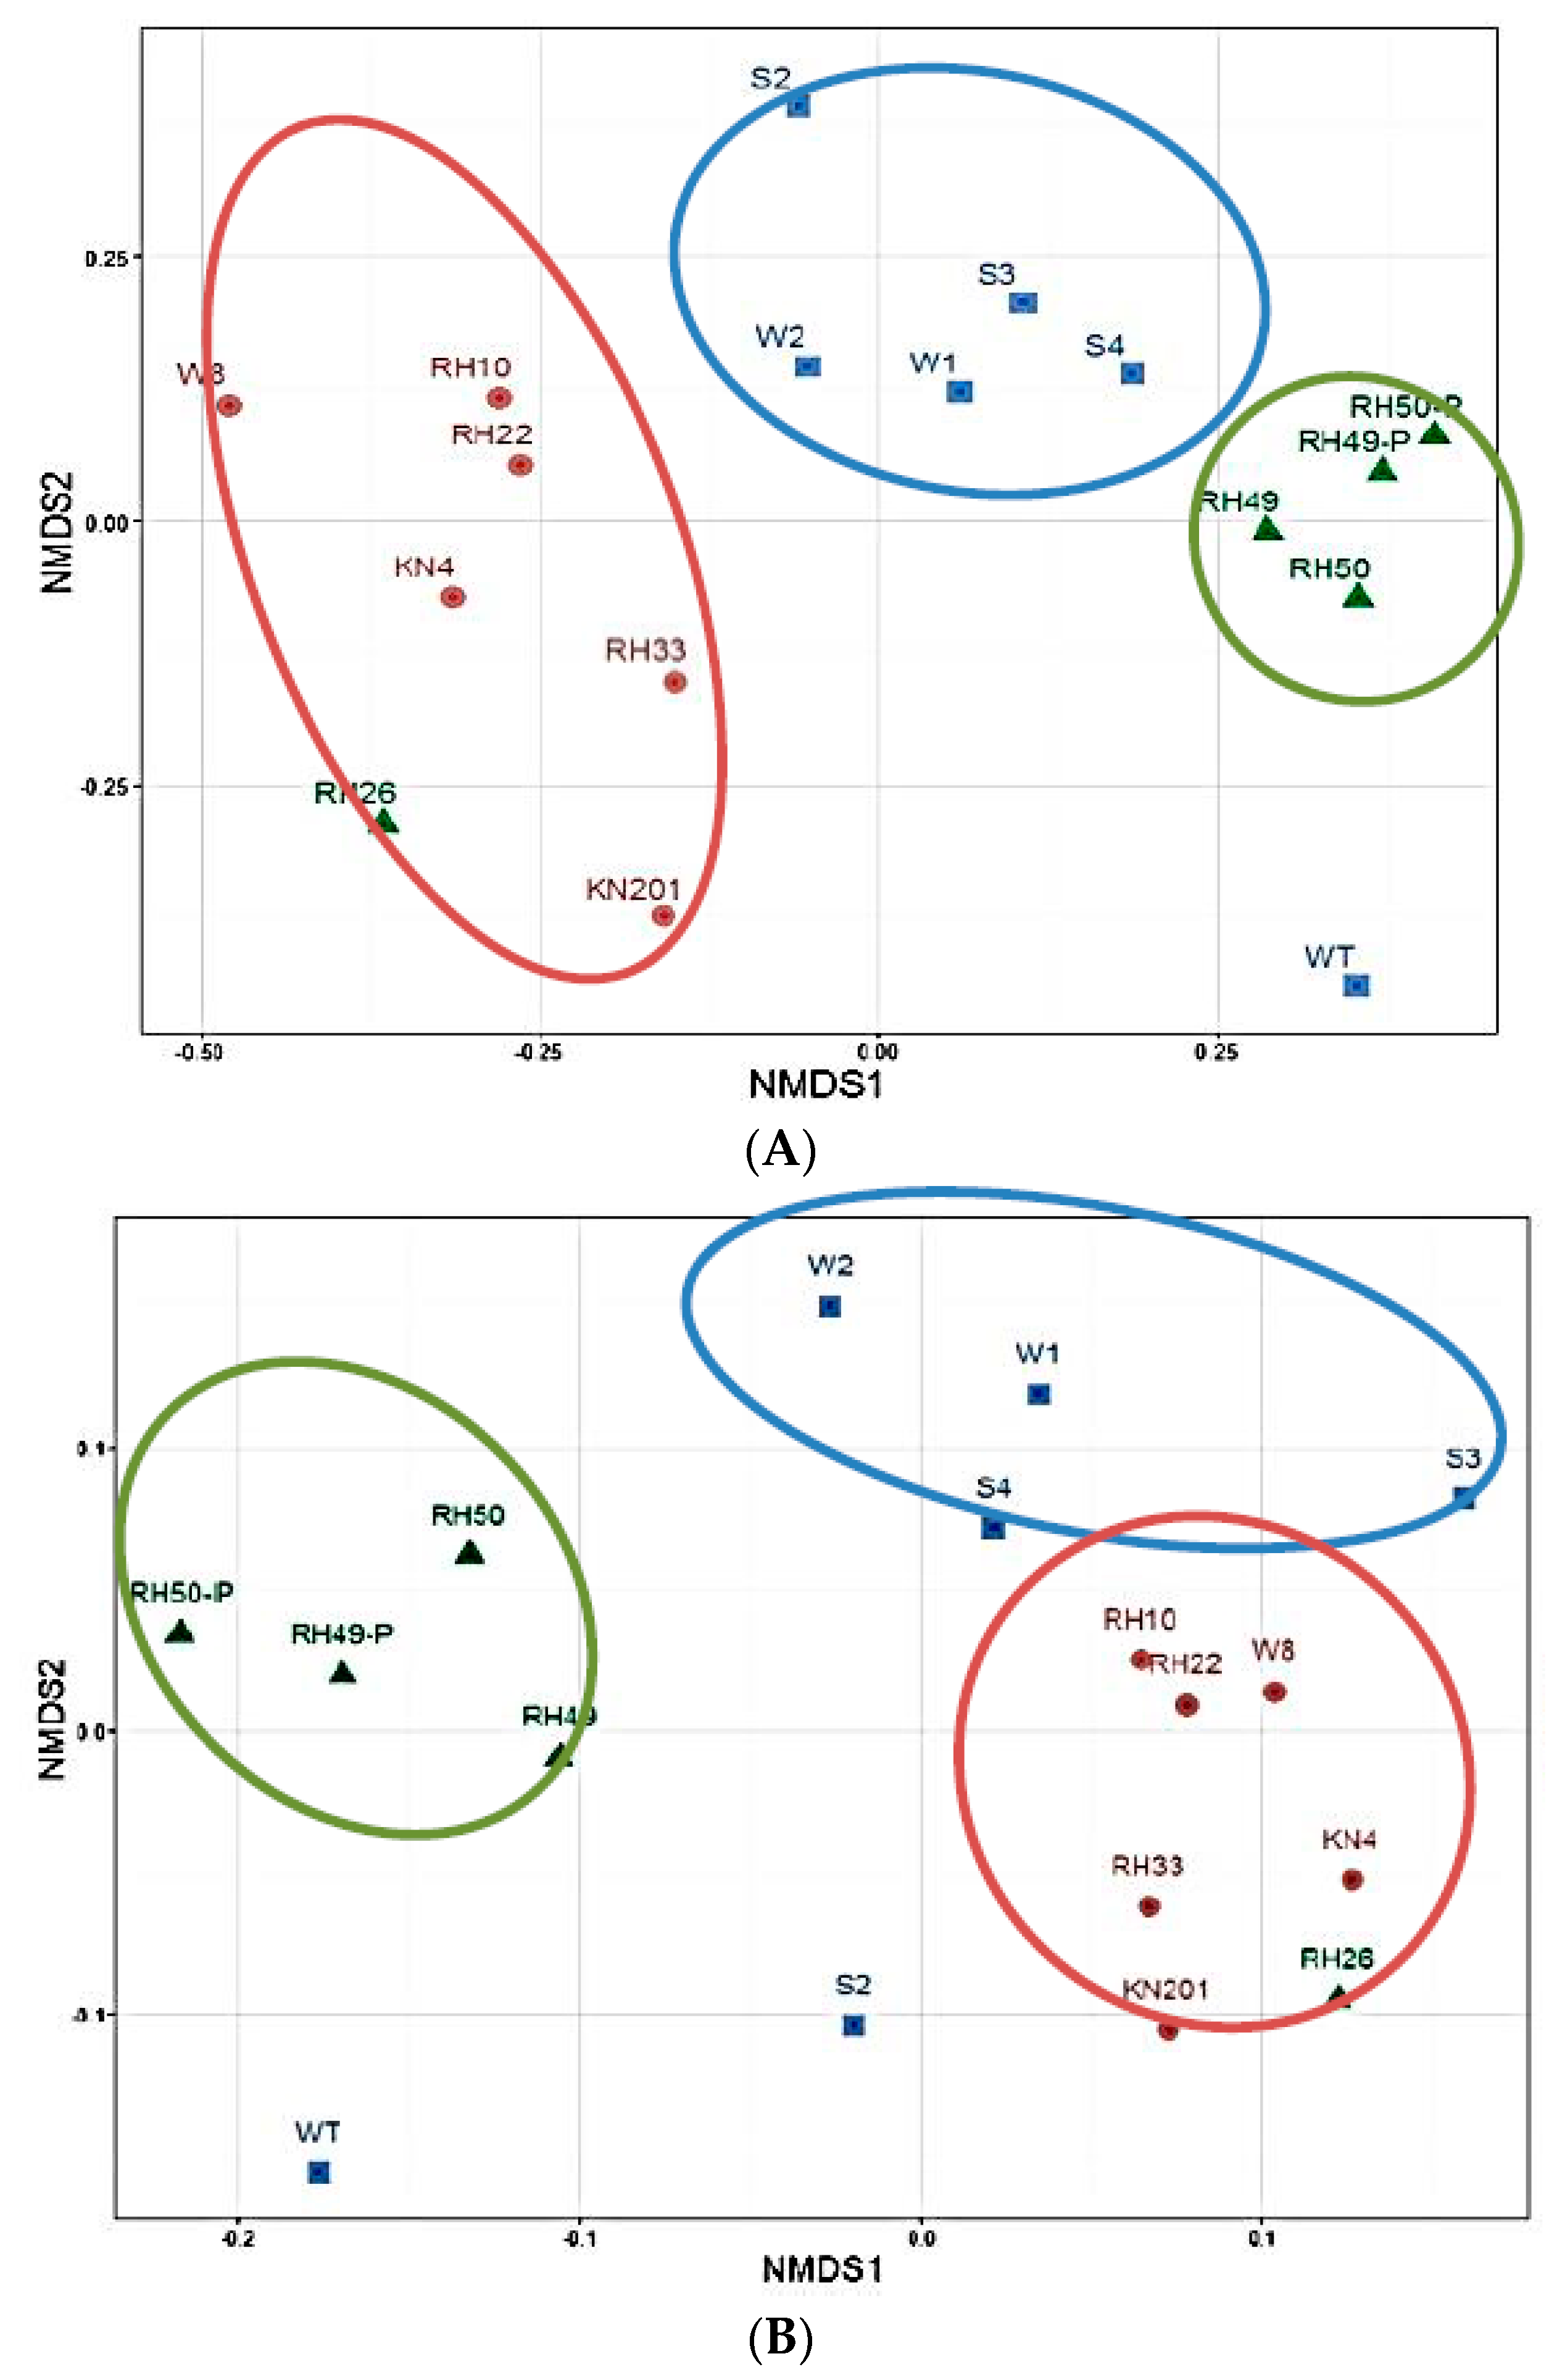
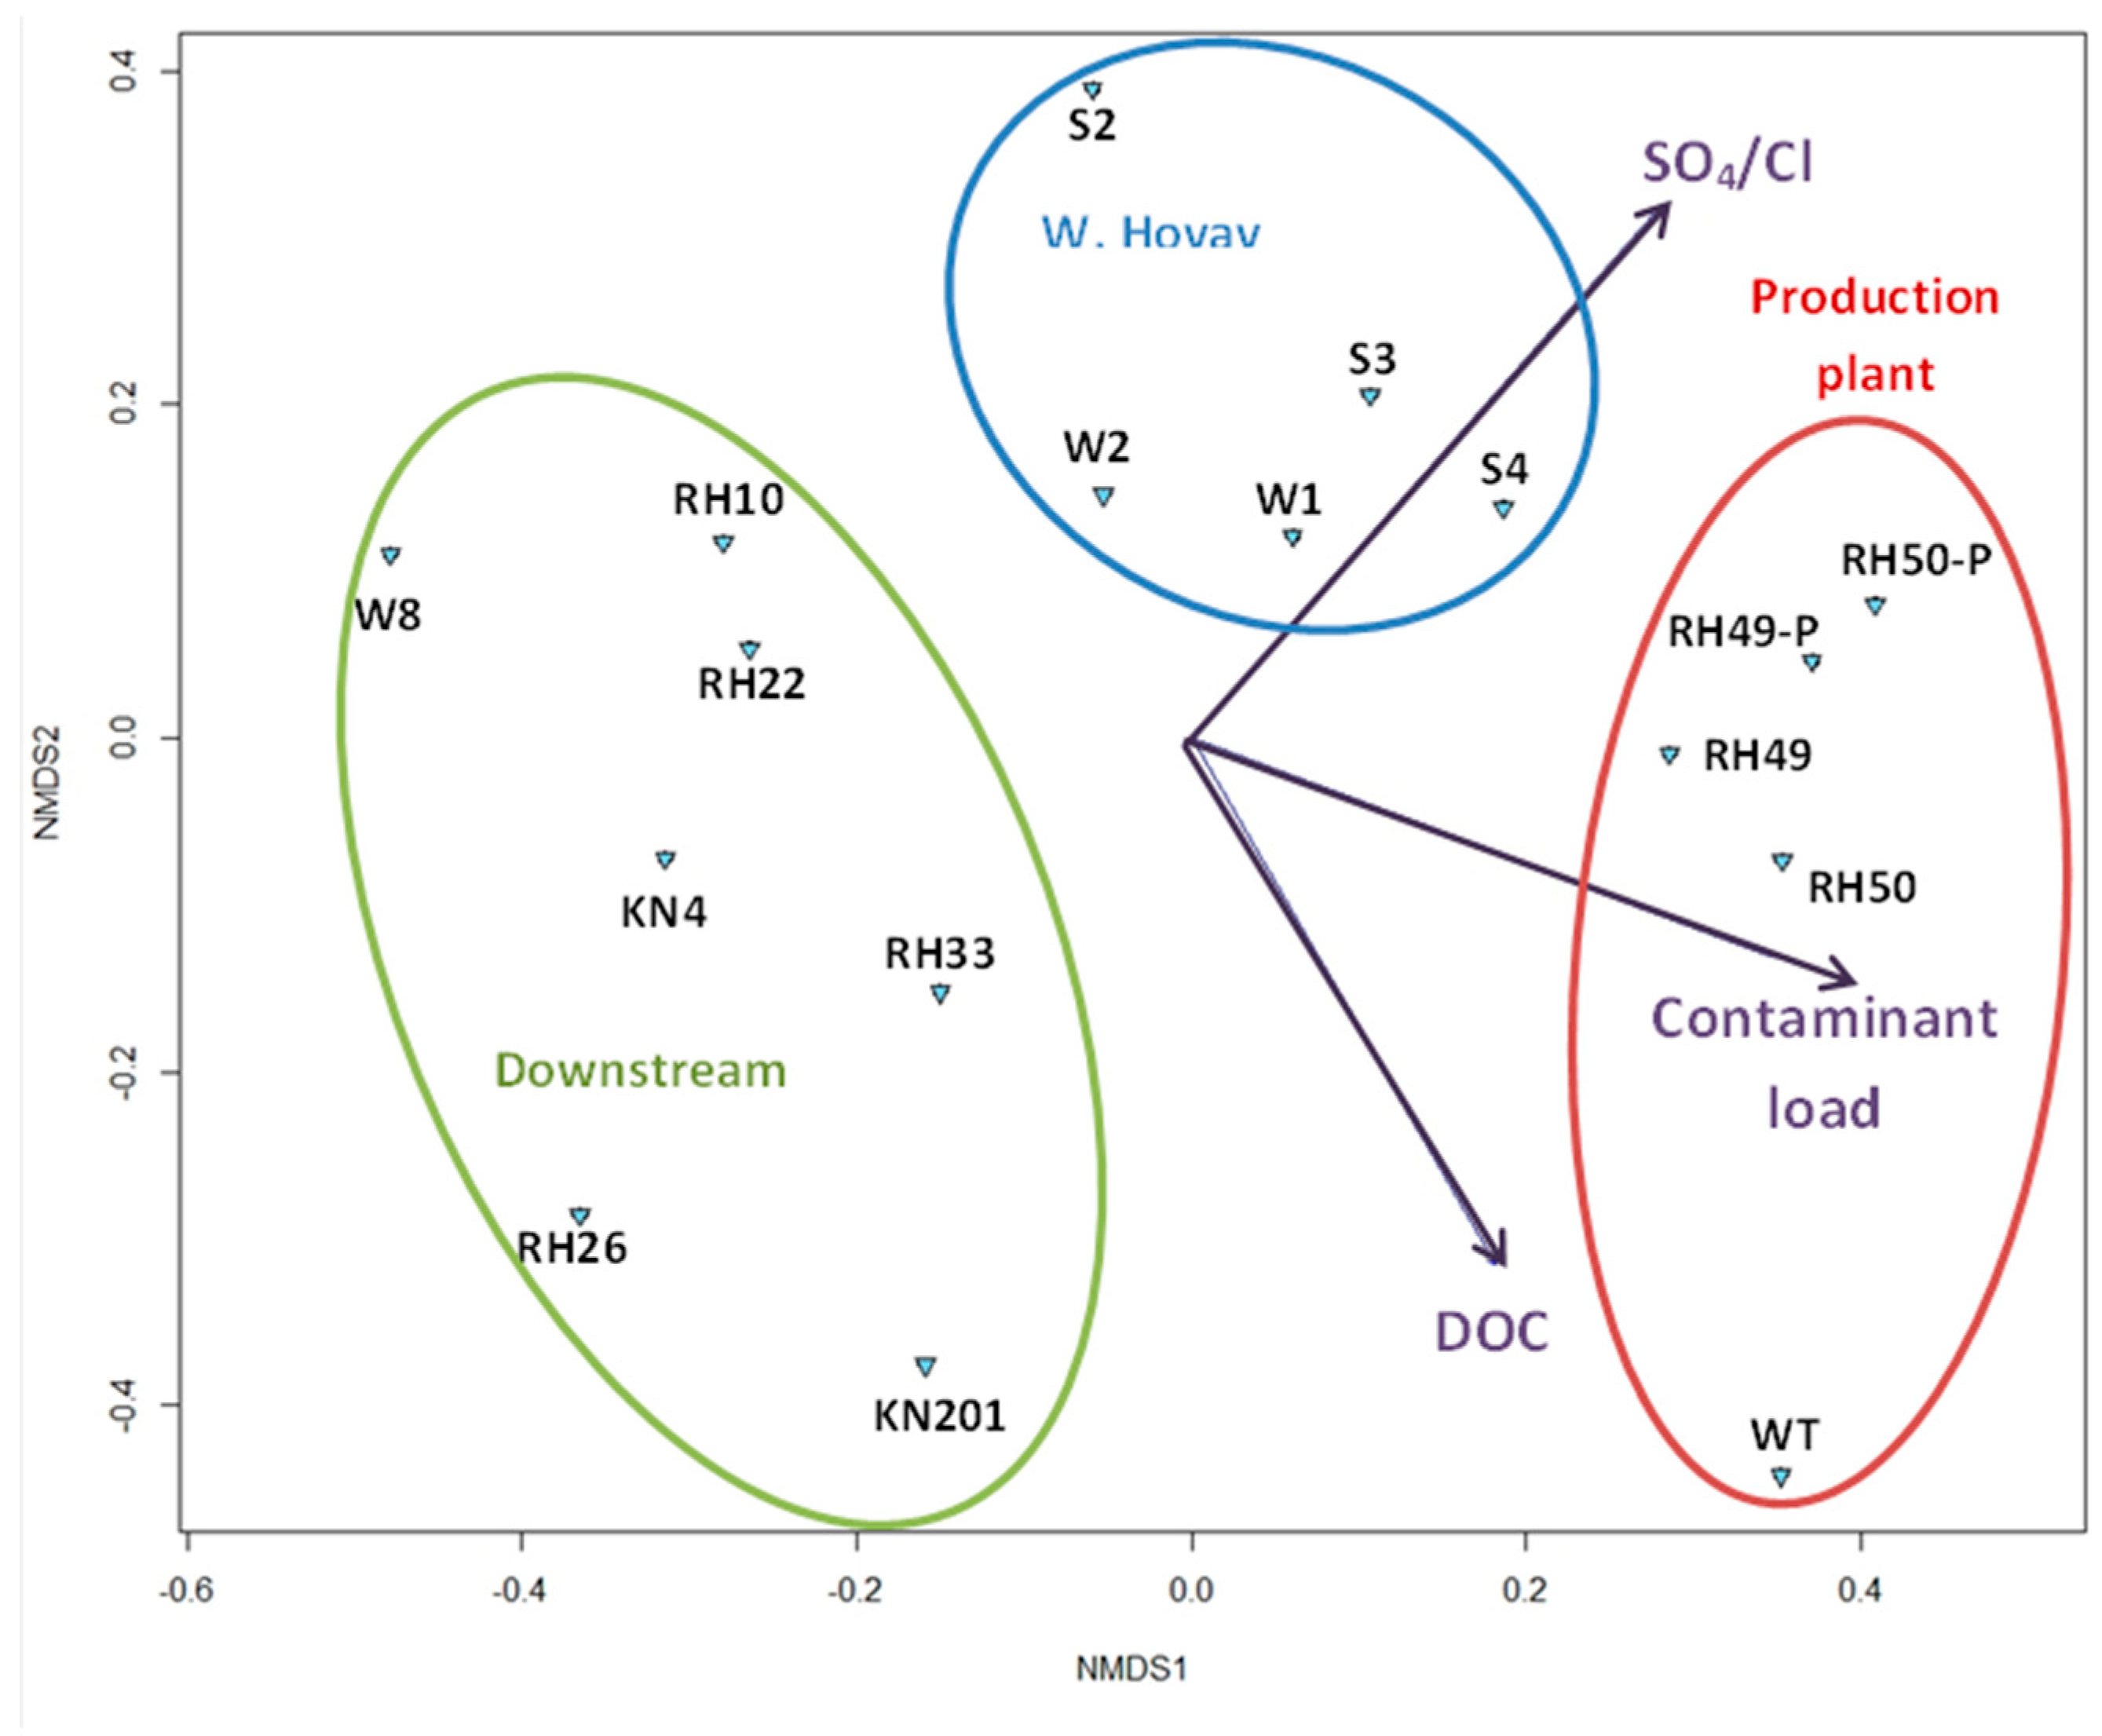
3.1.2. Overall Bacterial Community Structure and Relationship with Environmental Variables

Bacterial community structure and compositional differences among the different locations in the industrial area were determined by Nonmetric Multidimensional Scaling (NMDS) analysis with Bray-Curtis and weighted Unifrac distance matrices (Figure 2). Three clusters following spatial location: Production plant, Wadi Hovav, and Downstream, were found. Based on Bray-Curtis distances, which do not incorporate phylogenetic relatedness in community differences, bacterial composition differed significantly (p < 0.001, F2,14 = 1.99) with the three locations. NMDS analysis for Archaea also resulted in clustering (Figure S1).
The microbial communities found in boreholes WT, RH26, and S2 do not cluster with their geographical group (i.e., according to the area). Following the NMDS ordination clustering and the differences in groundwater composition found at both locations, for further analysis, the bacterial community of RH26 was classified as part of the downstream group, and WT as part of the production plant group. The contaminant load (defined as the sum of semi-volatile and volatile compounds that were detected) and DOC (Table 3, Table S1) may explain why WT and RH26 do not cluster with their geographical group (i.e., according to the area).
The effect of various environmental parameters: EC, pH, ion ratios, total nitrogen (TN), DOC, and contaminant load (Tables S2 and S3) on the 2015 groundwater microbial communities was tested, with the assistance of the Envfit function in the vegan package (R). From all tested parameters, only DOC, SO42−/Cl and contaminant load were found to have a significant influence (p = 0.05) on the groundwater microbial community structure (Figure 3). As the ordination used is unconstrained (NMDS), this correlation is not linear. The use of Envfit enabled the identification of environmental parameters with a significant effect on the groundwater microbial communities. This projection shows that in groundwater areas with high contaminant levels, this is the most dominant factor affecting the communal microbial structure. In areas where contamination is low, its effect is not significant, and in those areas the microbial variability is high, making it more challenging to identify the main environmental parameter/s if they exist.

3.1.3. Variations in Microbial Community Diversity

Bacterial α-diversity indices (Chao1, Observed, Shannon) were examined in the context of spatial location in the industrial area (Table S4). No significant correlation (Kruskal-Wallis, all p > 0.05) with the location in the industrial area was found (Table S5). The compositional shifts between the microbial communities in the different areas were mainly in terms of relative abundance, and not a microbial taxa turnover. Although not significant, the mean Observed and Chao1 diversities increase from the production plant to the downstream group. As for the Shannon index, the production plant has the highest value (Table 4).

3.1.4. Microbial Community Composition

The production plant area is dominated at the Phyla level by Proteobacteria (72.7%), Bacteriodetes (8.4%), and Firmicutes (6.0%), with all other phyla beneath 2%. The dominance of these three phyla in the most contaminated area can be attributed to their ability to adapt to contaminated and diverse environments [37,38,39]. With contaminant load decrease, more phyla with abundance greater than 2% appear in Wadi Hovav; Proteobacteria were (49.3%), Bacteriodetes (8.4%), six phyla had an abundance between 2–8%, and all the rest were <2%. In the downstream area Proteobacteria were (43.3%) dominated, eight phyla had an abundance of between 2–8% and the rest are below 2%. In addition, the percent of other phyla that were below 1% increase from the production plant downstream. Combining diversity with relative abundance data reveals that in the production plant area a lower amount of rare taxa exists. With distance from the production plant, as the contaminant load decreases, the amount of rare taxa increases (Figure 4).

3.2. Dehalogenation Potential of the Groundwater Microbial Community

The biodegradation potential and activity of the groundwater microbial community was tested by microcosm experiments with TBNPA, DBNPG, BCE, EDB, and EDC. Over the course of three years, no decrease in TBNPA and DBNPG was detected. The persistence of TBNPA and DBNPG, despite the presence of the right anaerobic bacteria, raised the question of whether the microbial community has the ability to dehalogenate other contaminates. For this purpose, BCE, EDB, and EDC anaerobic biodegradation was tested with fresh RH49P (February 2019) groundwater. For all three compounds, biodegradation was observed, clearly exhibiting the dehalogenation ability and potential of the groundwater microbial community (Figure 5). Significant loss of BCE was observed in the control bottle. Nevertheless, this is not due to degradation because the isotopic composition of carbon in this bottle remains stable (δ13C of −43.02‰), while in the active one a strong 13C enrichment of BCE was observed (Yankelzon et al. 2019 [40]).

4. Discussion

4.1. Site Hydrology

The studied site is characterized by vertical and horizontal permeable fractures [20,22,25,41,42]. While the directions of the major fracture systems under the industrial complex and downstream Wadi Hovav are the same, their orientation and density are entirely different underneath the downstream ponds [25,42]. It was proposed that active mixing between the different locations over the Neot Hovav aquitard occurs mainly through the vertical multi-layers fractures and less likely through horizontal flows within the bedding planes [4,25]. Therefore, the spatial variability in groundwater quality is controlled mostly by the sources located directly above the fractures. Indeed, as reflected in Table 3, contaminant loads varied from an average of 95.4 mg/L near-production area to 8.2 mg/L in Wadi-Hovav, and down to 0.2 mg/L in the pond/downstream area boreholes. Thus, three discrete zones in the site can disturb the microbial community of the groundwater. Because aquifers are physically and chemically heterogeneous in various extents, the relationship of microbial diversity and activity is expected with a variation of their characteristics of rock mineralogy, water organic content and pollution, hydraulic connectivity, and the physical features of the water flow paths.

4.2. Spatial Distribution of Microbial Community Affected by Environmental Parameters

From testing the correlation between environmental factors and microbial communities (Figure 3), it was seen that DOC, SO4/Cl, and contaminant load significantly influence the microbial community structure. In this analysis, the environmental values in the boreholes increase in accordance with the arrow direction. They reflect the historical and current input of industrial waste into the groundwater. Each area is characterized by the waste input of different industries, leading to a different contaminant load concentration as well as composition.
Indeed, the results in Figure 2 indicate that groundwater in each area contains a characteristic microbial community, probably due to its typical groundwater chemical (inorganic and organic) composition. Nevertheless, in both distance matrix ordinations, three outliers appear RH26, WT, and S2. These are due to a complex hydrological regime leading to the groundwater chemical composition of certain boreholes, which does not correlate to their geographical location [4]. It has been shown that microbial communities are largely affected by environmental parameters, including contaminant composition and concentration [37,38,39]. In the Neot Hovav aquitard, numerous organic contaminants are found [43]. Therefore, it is extremely challenging to isolate each component and test its specific effect on the microbial community. For that reason, the parameter “contaminant load” of each borehole was defined. This parameter takes into account all semi-volatile and volatile compounds that were detected at the site during a 2014 monitoring program. The contaminant load calculated from 2014 was compared to the 2015 DOC analysis (Table 3). Both parameters were found to follow a similar trend at the site, e.g., decreasing along the regional groundwater gradient from the production plant, through Wadi Hovav and downstream. Due to their similarity over time and space, both parameters were perceived relevant, and were used for the 2015 analysis, and may explain why WT and RH26 do not cluster with their geographical group (i.e., according to the area). In borehole WT, very high DOC (dissolved organic compound concentrations) was found, and in accordance, the bacterial community at this site does not cluster with any group. Furthermore, the WT water is affected mostly by pharmaceutical contamination that may drive the evolution of a unique community. The groundwater composition of RH26 is more characteristic of the downstream boreholes, and in accordance with the bacterial community of this borehole lies in the downstream cluster. Nevertheless, these parameters do not explain the difference in the S2 community. Following the NMDS ordination clustering and the differences in groundwater composition, during analysis the bacterial community of RH26 was classified as part of the downstream group and WT as part of the production plant group.

4.3. Possible Metabolic Features in the Microbial Communities Based on Spatial Location

Although 16S rRNA gene sequencing does not by itself provide metagenomics data (functionality, abundances, changes), a functional understanding of the microbial communities can be inferred by using the [34] database. Importantly, this analysis is based on DNA sequencing, thus presenting the potential functionality of the community and not their actual activity. The analysis (Figure S2) suggests that functional diversity is larger in the production plant in relation to Wadi Hovav and downstream areas. Bacteria genomes containing dehalogenation function (35.7%) and aromatic hydrocarbon degradation functions (28.4%) are most abundant in the groundwater sampled near the production plant. As for the anaerobic dehalogenating bacteria, the main abiotic parameters that will affect their activity is the availability of suitable electron donors. Competition on electron donors, particularly by sulfate reducers, can render the activity of obligatory reductive de-halogenaters in the groundwater.
These observations are expected due to the high contaminant load in this area, and the high concentrations of halogenated and aromatic compounds. In all areas, bacteria containing ammonia oxidation, nitrate reduction, and sulfate reduction metabolic pathways are abundant. The abundance of these metabolic routes is highest in the production plant area. The presence of sulfate reducers is indeed expected due to the sulfate content in the groundwater and anoxic conditions. Bacteria with an oxidative metabolism are less expected to be active in the site on the one hand, due to the lack of oxygen in the groundwater, and perhaps these are dormant functions. On the other hand, there are oxidizing functions that have been seen to occur under anaerobic conditions. For example, the ANAMMOX bacteria which were found in the groundwater promote ammonia oxidation, or sulfur-oxidizing bacteria may have the ability to reduce ferric iron using elemental sulfur as an electron donor [44], or grow on crude oil [45] under anaerobic conditions.
The quantity of unknown, predicted, metabolic pathways are lowest in the production plant area, and increases in Wadi Hovav and the downstream. This can be the result of database bias, stemming from the fact that most of the existing knowledge is derived from highly contaminated environments. Therefore, the bacteria that accommodate these environments dominate the database, relatively to the moderately-contaminated studied areas.

4.4. Pollution Extent Affects Community Diversity

In all diversity indices, the intergroup variance (range) increases from the production plant downstream, i.e., the high contaminant load in the production plant results in a less diverse community. Nevertheless, no linear correlation can be found between contaminant loads to diversity. These non-significant correlations are in agreement with the subsidy stress effect. From a certain level of anthropogenic disturbance, the whole ecosystem is depressed (i.e., production plant area), whereas in areas with a lower contamination load (i.e., Wadi Hovav and Downstream), its effect on the microbial community is less prominent [46]. In these areas, the dominant factor is contaminant composition and not loads. This is seen in the less-contaminated areas, Wadi Hovav and Downstream; at times low diversity indices occur in boreholes with low contaminant load, such as RH26, and vice versa, while high diversity indices occur in boreholes with relatively high contaminant load, such as S3. A recent report on the functional diversity of the microbial community in nitrate and uranium-polluted groundwater had suggested that diversity decreases with increasing pollution [47]. However, as in our study, the relationship between contaminates load (uranium) and functional genes richness was insignificant. In another study however, diversity in groundwater polluted with hydrocarbons in China, was lower than the downstream groundwater, likely due to the dominance of degrading bacteria [48].

4.5. Active Dehalogenation Potential

Analysis of the groundwater microbial communities at the site reveals that a large variation of organo-halide-respiring bacteria (OHRB) exists in all three areas. Moreover, the predicted metabolic functions (Figure S1) also point towards the existence of aerobic and anaerobic dehalogenation pathways in the communities. Five microbial genera commonly found in anoxic aquifers contaminated by halogenated compounds were found in the groundwater in all areas [49,50] (Table S6) [51]. Former studies in the Neot Hovav industrial area have also shown the presence of Desulfovibrio in stream sediment [52] and industrial wastewater, and of Dehalococcoides, Geobacter and Dehalobacter in groundwater [51,53]. Dehaloccocoides have been shown to reductively debrominate brominated diphenyl ethers, Tetrabromobisphenol A, and bromophenol blue [54]. They were also shown to reductively debrominate brominated compounds in saline environments [55], as well as dehalogenate brominated benzene-polluted groundwater as part of a bioaugmentation culture [56]. Desulfitobacterium was found in a 2-bromophenol 2-BP-degrading consortium, and additional studies have also exhibited the anaerobic debromination abilities of this genus [57]. Desulfovibrio, which was isolated from different environments in the industrial area (stream sediment and wastewater), also exhibited reductive debromination abilities [58]. A tetrabromobisphenol degrading culture was isolated from the sulfate-rich stream sediments in the industrial area and halorespiration of tribromophenol was seen [59].
Moreover, members of the community “supporting” the dehalogenating bacteria, e.g., species found in co-culture, co-metabolic, or other interactions with the organohalide respiring microorganisms, such as Spirochaeta, Pseudomonas, Pelobacter, Sedimentibacter and the candidate phyla OD1 are also found in the groundwater in relatively high abundances (Table S7) [52,60].
The microbial community in the four boreholes in the production plant area (RH49; RH49P; RH50; and RH50P) include the non-obligatory organo-halide respiring bacteria (OHRB) Firmicutes. Firmicutes are non-obligatory OHRB capable of utilizing a wide range of electron acceptors. Their metabolic versatility results in higher tolerance to high contamination levels, as seen in the production plant area. The abundance of Firmicutes in the production wells (RH49P, RH50P), which are constantly pumped to lower groundwater levels to the regular boreholes (RH49, RH50), which are not constantly pumped, was compared. This comparison resulted in a similar phenomenon for both borehole couples, a higher Firmicutes abundance in the regular boreholes than in the production well. 15.85% vs. 1.46% for RH49P and RH49 respectively, and 7.72% and 0.38% for RH50P and RH50 respectively.
The Clostridia class, harboring the Dehalobacter genus with unexplored dehalogenation potential [61], was also identified in these four boreholes. A similar picture rises in this comparison: 28 times more abundant in RH49P vs. RH49, and 25 times more abundant in RH50P vs. RH50. The presence of these classes with a high sulfate-reducing potential [62] is in accordance with the high sulfate concentrations which characterize the Neot Hovav groundwater. Between both wells, the non-production wells, e.g., RH49 and RH50, offer a better representation of the groundwater microbial community.
Over the course of three years of microcosm anaerobic incubation with water from RH49P, a decrease in TBNPA, and DBNPG concentrations were not detected. This is in accordance with the finding in Balaban et al., 2016 [35], that molecular oxygen was necessary for biodegradation to occur. But, when similar anaerobic microcosms with BCE, EDB and EDC were tested for dehalogenation, this occurred, thus demonstrating the dehalogenation abilities of the microbial groundwater community. In terms of degradation rate, EDB was the fastest with a first-order constant of 0.049 day−1, following by BCE 0.0265 day−1, and the slowest was degradation of EDC that was 0.0068 day−1. These results demonstrate that the groundwater community can degrade halogenated contaminants with a faster degradation of brominated, over-chlorinated compounds. Hence, the stability of TBNPA and DBNPG in the anaerobic microcosm, as well as in the anaerobic site water [35], is due to the chemical characteristics of these compounds and not because of the absence of active de-halogenating bacteria. Moreover, as the groundwater used for these experiments are from the RH49P (production) well, where the abundance of OHRB was found to be lower than in the non-production well (RH49), we can only assume that the presented activity is lower than that of the microbial community in the groundwater.

5. Conclusions

This study exhibits the importance of combining multiple techniques when addressing the natural bioremediation potential of a microbial community. When dealing with a site with multi-contaminants, it is crucial to test various pollutants’ fate, to gain a better understanding of this potential. In addition, this study exemplifies how the characteristics of the groundwater matrix govern the pollutant distribution, microbial community structure, and perhaps the natural bioremediation potential.
The complex microbial community that lies in the polluted groundwater within a chalk aquitard that underlies the Neot Hovav industrial site was presented. Hydrologic discontinuity in the aquitard results in spatial heterogeneity of hydro-chemical conditions in the site, leading to variations in microbial community structure. The connection between contaminant loads to bacterial community structure shows that the contamination differences in the distinct groundwater section under separate sections of the industrial site lead to the variation in the microbial community. High contaminant load leads to lower communal diversity and the presence of more tolerant bacteria. When contamination decreases, diversity increases, with pollutant mixture seemingly affecting community structure. Anaerobic de-halogenating activity and potential of the groundwater microbial community from the production plant area were exhibited. While three of the tested compounds were degraded, two were not, thus exemplifying the complication of remediating multi-contaminant locations.

Supplementary Materials

The following are available online at https://www.mdpi.com/2073-4441/11/10/2128/s1, Groundwater sampling procedure, Table S1: Contaminant load of the sampled boreholes. Taken from the Neot Hovav annual sampling report (Adar et al., 2015 [23]), Table S2: Electrical conductivity mS/cm (EC); dissolved oxygen mg/L (DO); pH values measured during the three sampling campaigns (2014–2016), Table S3: Chemical parameters of the sampled boreholes, Neot Hovav annual sampling report (Adar et al., 2015 [23]), Table S4: Diversity indices, Table S5: P values of diversity indices in relation to location in the industrial area. Tested by Kruskal-Wallis ANOVA by ranks (done in Statistica software), Table S6: Relative abundance in the groundwater of reductive dehalogenating microorganisms in the three areas of the industrial site, Table S7: Relative abundance in the groundwater of supporting dehalogenation microorganisms in the three areas of the industrial site, Figure S1: NMDS ordination for the archaeal microbial communities in the examined 17 boreholes using (a) the Bray-Curtis distance matrix, and (b) a weighted UniFrac distance matrix. Groups are categorized according to borehole location in the industrial area (symbols and colors), Figure S2: Comparison of metabolic groups in the bacterial communities in the three areas, as described using METAGENassist analysis.

Author Contributions

Conceptualization, Z.R., F.G. and A.B.; investigation, N.B. and I.Y.; data curation, N.B.; writing—original draft preparation, N.B.; writing—review and editing, Z.R., F.G., E.A. and A.B.; supervision, Z.R., F.G., E.A. and A.B.

Funding

This research was supported in part by the Israel Science foundation grant number 1482/16.

Acknowledgments

We acknowledge the assistance of Neot Hovav municipality and the help of Almog Gafni, Nadav Knossow in fieldwork and the assistance of Tali Bruner, Chen Adler, and Damiana Diaz Reck in lab work.

Conflicts of Interest

The authors declare no conflict of interest.

References

  1. Griebler, C.; Avramov, M. Groundwater ecosystem services: A review Christian. Freshw. Sci. 2015, 34, 355–367. [Google Scholar] [CrossRef]
  2. Rodríguez-Delgado, M.; Orona-Navar, C.; García-Morales, R.; Hernandez-Luna, C.; Parra, R.; Mahlknecht, J.; Ornelas-Soto, N. Biotransformation kinetics of pharmaceutical and industrial micropollutants in groundwaters by a laccase cocktail from Pycnoporus sanguineus CS43 fungi. Int. Biodeterior. Biodegrad. 2016, 108, 34–41. [Google Scholar] [CrossRef]
  3. An, D.; Xi, B.; Wang, Y.; Xu, D.; Tang, J.; Dong, L.; Ren, J.; Pang, C. A sustainability assessment methodology for prioritizing the technologies of groundwater contamination remediation. J. Clean. Prod. 2016, 112, 4647–4656. [Google Scholar] [CrossRef]
  4. Ezra, S.; Feinstein, S.; Yakirevich, A.; Adar, E.; Bilkis, I. Retardation of organo-bromides in a fractured chalk aquitard. J. Contam. Hydrol. 2006, 86, 195–214. [Google Scholar] [CrossRef]
  5. Postigo, C.; Barceló, D. Synthetic organic compounds and their transformation products in groundwater: Occurrence, fate and mitigation. Sci. Total Environ. 2015, 503, 32–47. [Google Scholar] [CrossRef]
  6. Montes-Grajales, D.; Fennix-Agudelo, M.; Miranda-Castro, W. Occurrence of personal care products as emerging chemicals of concern in water resources: A review. Sci. Total Environ. 2017, 595, 601–614. [Google Scholar] [CrossRef]
  7. Lapworth, D.J.; Baran, N.; Stuart, M.E.; Ward, R.S. Emerging organic contaminants in groundwater: A review of sources, fate and occurrence. Environ. Pollut. 2012, 163, 287–303. [Google Scholar] [CrossRef] [Green Version]
  8. Van Liedekerke, M.; Prokop, G.; Rabl-Berger, S.; Kibblewhite, M.; Louwagie, G. Progress in the Management of Contaminated Sites in Europe; Joint Research Centre: Ispra, Italy, 2014. [Google Scholar]
  9. Haggblom, M.M.; Bossert, I.D. Halogenated organic compounds—A global perspective. In Dehalogenation: Microbial Processes and Environmental Applications; Haggblom, M., Bossert, I., Eds.; Kluwer Academic Publishers: New York, NY, USA, Country, 2003. [Google Scholar]
  10. Birnbaum, L.S.; Staskal, D.F. Brominated flame retardants: Cause for concern? Environ. Health Perspect. 2004, 112, 9–17. [Google Scholar] [CrossRef]
  11. Alexander, M. Biodegradation and Bioremediation; Academic Press: San Diego, CA, USA, 1994. [Google Scholar]
  12. Poursat, B.A.J.; van Spanning, R.J.M.; de Voogt, P.; Parsons, J.R. Implications of microbial adaptation for the assessment of environmental persistence of chemicals. Crit. Rev. Environ. Sci. Technol. 2019, 49, 2220–2255. [Google Scholar] [CrossRef] [Green Version]
  13. Flynn, T.M.; Sanford, R.A.; Ryu, H.; Bethke, C.M.; Levine, A.D.; Ashbolt, N.J.; Santo Domingo, J.W. Functional microbial diversity explains groundwater chemistry in a pristine aquifer. BMC Microbiol. 2013, 13, 146. [Google Scholar] [CrossRef]
  14. Dojka, M.; Hugenholtz, P.; Haack, S.; Pace, N. Microbial diversity in a hydrocarbon-and chlorinated-solvent-contaminated aquifer undergoing intrinsic bioremediation. Appl. Environ. Microbiol. 1998, 64, 3869–3877. [Google Scholar] [PubMed]
  15. Yagi, J.M.; Neuhauser, E.F.; Ripp, J.A.; Mauro, D.M.; Madsen, E.L. Subsurface ecosystem resilience: Long-term attenuation of subsurface contaminants supports a dynamic microbial community. ISME J. 2010, 4, 131–143. [Google Scholar] [CrossRef] [PubMed]
  16. Meckenstock, R.U.; Elsner, M.; Griebler, C.; Lueders, T.; Stumpp, C.; Aamand, J.; Agathos, S.N.; Albrechtsen, H.J.; Bastiaens, L.; Bjerg, P.L.; et al. Biodegradation: Updating the concepts of control for microbial cleanup in contaminated aquifers. Environ. Sci. Technol. 2015, 49, 7073–7081. [Google Scholar] [CrossRef] [PubMed]
  17. Tarnawski, S.-E.; Rossi, P.; Brennerova, M.V.; Stavelova, M.; Holliger, C. Validation of an integrative methodology to assess and monitor reductive dechlorination of chlorinated ethenes in contaminated aquifers. Front. Environ. Sci. 2016, 4, 7. [Google Scholar] [CrossRef]
  18. Révész, K.M.; Lollar, B.S.; Kirshtein, J.D.; Tiedeman, C.R.; Imbrigiotta, T.E.; Goode, D.J.; Shapiro, A.M.; Voytek, M.A.; Lacombe, P.J.; Busenberg, E. Integration of stable carbon isotope, microbial community, dissolved hydrogen gas, and 2HH2O tracer data to assess bioaugmentation for chlorinated ethene degradation in fractured rocks. J. Contam. Hydrol. 2014, 156, 62–77. [Google Scholar] [CrossRef] [PubMed]
  19. Bahat, D. Early single-layer and late multi-layer joints in the lower Eocene chalk near Beer Sheva, Israel. Ann. Tect. 1988, 2, 3–11. [Google Scholar]
  20. Dahan, O.; Nativ, R.; Adar, E.M.; Berkowitz, B.; Weisbrod, N. On fracture structure and preferential flow in unsaturated chalk. Groundwater 2000, 3, 444–451. [Google Scholar] [CrossRef]
  21. Nativ, R.; Adar, E.; Assaf, L.; Nygaard, E. Characterization of the hydraulic properties of fractures in chalk. Groundwater 2003, 41, 532–543. [Google Scholar] [CrossRef]
  22. Nativ, R.; Adar, E.; Dahan, O.; Nissim, I. Water salinization in arid regions-observations from the Negev desert, Israel. J. Hydrol. 1997, 196, 271–296. [Google Scholar] [CrossRef]
  23. Adar, E.; Kaplan, A.; Gilerman, L. Groundwater Quality Monitoring in the Neot Hovav Industrial Complex; Monitoring report for the years 2012–2013, 2013–2014; Neot Hovav Industrial Council: Neot Hovav, Israel, 2015. (In Hebrew) [Google Scholar]
  24. Maamar, S.B.; Aquilina, L.; Quaiser, A.; Pauwels, H.; Michon-Coudouel, S.; Vergnaud-Ayraud, V.; Labasque, T.; Roques, C.; Abbott, B.W.; Dufresne, A. Groundwater isolation governs chemistry and microbial community structure along hydrologic flowpaths. Front. Microbiol. 2015, 6, 1–13. [Google Scholar]
  25. Weiss, M.; Rubin, Y.; Adar, E.; Nativ, R. Fracture and bedding plane control on groundwater flow in a chalk aquitard. Hydrogeol. J. 2006, 14, 1081–1093. [Google Scholar] [CrossRef]
  26. Arnon, S.; Ronen, Z.; Yakirevich, A.; Adar, E. Evaluation of soil flushing potential for clean-up of desert soil contaminated by industrial wastewater. Chemosphere 2006, 62, 17–25. [Google Scholar] [CrossRef] [PubMed]
  27. Nativ, R.; Nissim, I. Characterization of a desert aquitard-hydrologic and hydrochemical considerations. Groundwater 1992, 30, 598–606. [Google Scholar] [CrossRef]
  28. Takahashi, S.; Tomita, J.; Nishioka, K.; Hisada, T.; Nishijima, M. Development of a prokaryotic universal primer for simultaneous analysis of Bacteria and Archaea using Next-Generation sequencing. PLoS ONE 2014, 9, e105592. [Google Scholar] [CrossRef] [PubMed]
  29. Quast, C.; Pruesse, E.; Yilmaz, P.; Gerken, J.; Schweer, T.; Yarza, P.; Peplies, J.; Glockner, F.O. The SILVA ribosomal RNA gene database project: Improved data processing and web-based tools. Nucleic Acids Res. 2013, 41, 590–596. [Google Scholar] [CrossRef] [PubMed]
  30. Staley, C.; Unno, T.; Gould, T.J.; Jarvis, B.; Phillips, J.; Cotner, J.B.; Sadowsky, M.J. Application of Illumina next-generation sequencing to characterize the bacterial community of the Upper Mississippi River. J. Appl. Microbiol. 2013, 115, 1147–1158. [Google Scholar] [CrossRef]
  31. Team, R. RStudio: Integrated Development Environment for R; RStudio: Boston, MA, USA, 2012; Available online: https://rstudio.com/products/rstudio/ (accessed on 1 July 2016).
  32. McMurdie, P.J.; Holmes, S. phyloseq: An R package for reproducible interactive analysis and graphics of microbiome census data. PLoS ONE 2013, 8, e61217. [Google Scholar] [CrossRef]
  33. Oksanen, J.; Blanchet, F.G.; Kindt, R.; Legendre, P.; Minchin, P.; O’Hara, R.; Simpson, G.; Solymos, P.; Stevens, M.; Wagner, H. Vegan: Community Ecology Package, R Package Version 2.0-10; 2013. Available online: https://cran.r-project.org/web/packages/vegan/index.html (accessed on 1 July 2016).
  34. Arndt, D.; Xia, J.; Liu, Y.; Zhou, Y.; Guo, A.C.; Cruz, J.A.; Sinelnikov, I.; Budwill, K.; Nesbø, C.L.; Wishart, D.S. METAGENassist: A comprehensive web server for comparative metagenomics. Nucleic Acids Res. 2012, 40, 88–95. [Google Scholar] [CrossRef]
  35. Balaban, N.; Bernstein, A.; Gelman, F.; Ronen, Z. Microbial degradation of the brominated flame retardant TBNPA by groundwater bacteria: Laboratory and field study. Chemosphere 2016, 156, 367–373. [Google Scholar] [CrossRef]
  36. Adar, E. Groundwater Quality Monitoring in the Neot Hovav Industrial Complex; Neot Hovav Industrial Council: Neot Hovav, Israel, 2014. (In Hebrew) [Google Scholar]
  37. Weber, K.P.; Gehder, M.; Legge, R.L. Assessment of changes in the microbial community of constructed wetland mesocosms in response to acid mine drainage exposure. Water Res. 2008, 42, 180–188. [Google Scholar] [CrossRef]
  38. Singh, B.K.; Quince, C.; Macdonald, C.A.; Khachane, A.; Thomas, N.; Al-Soud, W.A.; Soren, J.S.; He, Z.; White, D.; Sinclair, A.; et al. Loss of microbial diversity in soils is coincident with reductions in some specialized functions. Environ. Microbiol. 2014, 16, 2408–2420. [Google Scholar] [CrossRef] [PubMed]
  39. Fan, M.; Lin, Y.; Huo, H.; Liu, Y.; Zhao, L.; Wang, E.; Chen, W.; Wei, G. Microbial communities in riparian soils of a settling pond for mine drainage treatment. Water Res. 2016, 96, 198–207. [Google Scholar] [CrossRef] [PubMed]
  40. Yankelzon, I.; Ronen, Z.; Gelman, F. Multi-elemental (δ13C, δ81Br and δ37Cl) isotope effects in biotic and abiotic degradation of 1-bromo-2-chloro-ethane. In Proceedings of the Isotopes 2019, The Cross-Disciplinary Conference on Stable Isotope Sciences, Raitenhaslach, Germany, 7–12 July 2019; pp. 114–115. [Google Scholar]
  41. Adar, E.; Nativ, R. Isotopes as tracers in a contaminated fractured chalk aquitard. J. Contam. Hydrol. 2003, 65, 19–39. [Google Scholar] [CrossRef]
  42. Nativ, R.; Adar, E.M.; Becker, A. Designing a monitoring network for contaminated ground water in fractured chalk. Groundwater 1999, 37, 38–47. [Google Scholar] [CrossRef]
  43. Nativ, R.; Adar, E. Evaluation of the Extent of Groundwater Contamination in the Ramat Hovav Industrial Park Area; Concluding Report 1995–1997; Neot Hovav Industrial Council: Neot Hovav, Israel, 1997. [Google Scholar]
  44. Brock, T.D.; Gustafson, J. Ferric Iron Reduction by Sulfur- and Iron-Oxidizing Bacteria. Appl. Environ. Microbiol. 1976, 32, 567–571. [Google Scholar]
  45. Kodama, Y.; Watanabe, K. Isolation and characterization of a sulfur-oxidizing chemolithotroph growing on crude oil under anaerobic conditions isolation and characterization of a sulfur-oxidizing chemolithotroph growing on crude oil under anaerobic conditions. Society 2003, 69, 107–112. [Google Scholar]
  46. Odum, E.P.; Finn, J.T.; Franz, E.H. Pertubation theory and the subsidy-stress gradient. Bioscience 1979, 29, 349–352. [Google Scholar] [CrossRef]
  47. He, Z.; Zhang, P.; Wu, L.; Rocha, A.M.; Tu, Q.; Shi, Z.; Wu, B.; Qin, Y.; Wang, J.; Yan, Q.; et al. Microbial functional gene diversity predicts groundwater contamination and ecosystem functioning. MBio 2018, 9, e02435-17. [Google Scholar] [CrossRef]
  48. Ning, Z.; Zhang, M.; He, Z.; Cai, P.; Guo, C.; Wang, P. Spatial pattern of bacterial community diversity formed in different groundwater field corresponding to electron donors and acceptors distributions at a petroleum-contaminated site. Water 2018, 10, 842. [Google Scholar] [CrossRef]
  49. Atashgahi, S.; Lu, S.; Smidt, H. Overview of known organohalide respiring bacteria—Phylogenetic diversity and environmental distribution. In Organohalide Respiring Bacteria; Adrian, L., Loffler, F., Eds.; Springer: Berlin/Heidelberg, Germany, 2016. [Google Scholar]
  50. Nijenhuis, I.; Nikolausz, M.; Köth, A.; Felföldi, T.; Weiss, H.; Drangmeister, J.; Grossmann, J.; Kästner, M.; Richnow, H.H. Assessment of the natural attenuation of chlorinated ethenes in an anaerobic contaminated aquifer in the Bitterfeld/Wolfen area using stable isotope techniques, microcosm studies and molecular biomarkers. Chemosphere 2007, 67, 300–311. [Google Scholar] [CrossRef]
  51. Lovley, D.R.; Ueki, T.; Zhang, T.; Malvankar, N.S.; Shrestha, P.M.; Flanagan, K.A.; Aklujkar, M.; Butler, J.E.; Giloteaux, L.; Rotaru, A.-E.; et al. Geobacter: The Microbe electric’s physiology, ecology, and practical applications. In Advances in Microbial Physiology; Academic Press: Cambridge, MA, USA, 2011; Volume 59, ISBN 9780123876614. [Google Scholar]
  52. Iasur-Kruh, L.; Ronen, Z.; Arbeli, Z.; Nejidat, A. Characterization of an enrichment culture debrominating tetrabromobisphenol A and optimization of its activity under anaerobic conditions. J. Appl. Microbiol. 2010, 109, 707–715. [Google Scholar] [CrossRef] [PubMed]
  53. Ben-Dov, E.; Brenner, A.; Kushmaro, A. Quantification of sulfate-reducing bacteria in industrial wastewater, by real-time polymerase chain reaction (PCR) using dsrA and apsA genes. Microb. Ecol. 2007, 54, 439–451. [Google Scholar] [CrossRef] [PubMed]
  54. Yang, C.; Kublik, A.; Weidauer, C.; Seiwert, B.; Adrian, L. reductive dehalogenation of oligocyclic phenolic bromoaromatics by Dehalococcoides mccartyi Strain CBDB1. Environ. Sci. Technol. 2015, 49, 8497–8505. [Google Scholar] [CrossRef] [PubMed]
  55. Futagami, T.; Morono, Y.; Terada, T.; Kaksonen, A.H.; Inagaki, F. Dehalogenation activities and distribution of reductive dehalogenase homologous genes in marine subsurface sediments. Appl. Environ. Microbiol. 2009, 75, 6905–6909. [Google Scholar] [CrossRef]
  56. Kuppusamy, S.; Palanisami, T.; Megharaj, M.; Venkateswarlu, K.; Naisu, R. Ex-situ remediation technologies for environmental pollutants: A critical perspective. In Reviews of Environmental Contamination and Toxicology; Voogt, P., Ed.; Springer: Cham, Switzerland, 2015. [Google Scholar]
  57. Rhee, S.K.; Fennell, D.E.; Häggblom, M.M.; Kerkhof, L.J. Detection by PCR of reductive dehalogenase motifs in a sulfidogenic 2-bromophenol-degrading consortium enriched from estuarine sediment. FEMS Microbiol. Ecol. 2003, 43, 317–324. [Google Scholar] [CrossRef]
  58. Villemur, R.; Lanthier, M.; Beaudet, R.; Lépine, F. The Desulfitobacterium genus. FEMS Microbiol. Rev. 2006, 30, 706–733. [Google Scholar] [CrossRef]
  59. Ronen, Z.; Abeliovich, A. Anaerobic-aerobic process for microbial degradation of tetrabromobisphenol A. Appl. Environ. Microbiol. 2000, 66, 2372–2377. [Google Scholar] [CrossRef]
  60. Luo, J.; Kurt, Z.; Hou, D.; Spain, J.C. Modeling aerobic biodegradation in the capillary fringe. Environ. Sci. Technol. 2015, 49, 1501–1510. [Google Scholar] [CrossRef]
  61. Maphosa, F.; Van Passel, M.W.J.; De Vos, W.M.; Smidt, H. Metagenome analysis reveals yet unexplored reductive dechlorinating potential of Dehalobacter sp. E1 growing in co-culture with Sedimentibacter sp. Environ. Microbiol. Rep. 2012, 4, 604–616. [Google Scholar]
  62. Muyzer, G.; Stams, A.J.M. The ecology and biotechnology of sulphate-reducing bacteria. Nat. Rev. Microbiol. 2008, 6, 441–454. [Google Scholar] [CrossRef]
Figure 1. Boreholes sampled in the Neot Hovav industrial site: Adjacent to the production plant; Along the Hovav drainage canal; and downstream to the production plant. Red circles—monitoring boreholes; orange circles-boreholes along drainage canal. Govmap https://www.govmap.gov.il/2016.
Water 11 02128 g001
Figure 2. Nonmetric multidimensional scaling (NMDS) ordination for the microbial communities in the examined 17 boreholes using (A) the Bray-Curtis distance matrix, and (B) the weighted UniFrac distance matrix. Groups are categorized according to borehole location in the industrial area (symbols and colors), green triangles represent the Production plan, blue squares, the Wadi Hovav; red circles indicate Downstream. Circles represent clustered groups according to borehole location in the industrial area. Distance matrix based on 16S rRNA Illumina sequencing. Stress: (A) 0.153 (B) 0.098.
Water 11 02128 g002
Figure 3. NMDS ordination based on the Bray-Curtis distance matrix, where stress was 0.153, correlated with groundwater parameters, which had a significant correlation (p = 0.05) with the microbial communities.
Water 11 02128 g003
Figure 4. Relative abundance (%) of dominant phyla (>1% abundance) in the three locations of the industrial area-production plant (blue bars); Wadi Hovav (red bars); and downstream (gray bars).
Water 11 02128 g004
Figure 5. Degradation of Dibromoethane (EDB), 1-bromo-1-chloroethane (BCE) and 1,2-dichloroethane (EDC) by fresh RH49 groundwater microbial community. Open and filled circles represent individual sample bottles and filled triangles represent autoclaved control bottles.
Water 11 02128 g005
Table 1. Location of sampled boreholes and their characterization.
BoreholeLocationComments
RH49, RH49P, RH50, and RH50PWest to the production plantSlanted borehole drilled through vertical fractures that lie beneath the BOC’s production plant
RH2630 m’ east to the production plant
W1, W2, S2, S3, and S4Along Wadi HovavDrains shallow groundwater within saturated fractures intersected by the Wadi Hovav Trench (an east-west trench)
WTDrains a north-south trench intersecting with Wadi Hovav
KN4Downstream of the production plantLocated at the downstream edge of the industrial area, on the northern bank of Wadi Hovav
RH33South to Wadi Hovav
RH10Upstream to the Wadi Hovav-Wadi Sekher confluence
KN201North to Wadi Sekher
W8In Wadi Sekher, north to the wastewater evaporation ponds. Drains a trench that drains polluted groundwater of Wadi Secker, including leaks from the wastewater ponds
RH22Located west to W8, on the northern bank of Wadi Sekher
Table 2. Taxa identification and abundances above 2.0% abundance at the Phylum, Class and Family level.
GeneraNameAbundance (%)
phylumProteobacteria54.2
Bacteriodetes7.3
OD15.8
Chloroflexi3.6
OP33.0
Firmicutes2.8
unclassified0.3
ClassGammaproteobacteria19.3
Epsilonproteobacteria10.4
Deltaproteobacteriav8.0
Alphaproteobacteria11.5
unclassified2.4
FamilyHelicobacteraceae7.0
Pseudomonadaceae4.6
Desulfobacteraceae3.8
Campylobacteraceae3.5
Piscirickettsiaceae2.8
Flavobacteriaceae2.7
Rhodobacteraceae2.5
Rhodospirillaceae2.5
unclassified36.3
Table 3. Mean contaminant load and dissolved organic carbon (DOC) of the three locations based on the ordination results. contaminant load-taken from the Neot Hovav annual sampling report for year 2014 [36]; DOC-2015 sampling.
Contaminant LoadDOC
LocationBoreholes in groupmeanRange (mg/L)meanRange (mg/L)
Production plantRH49P; RH50P; WT203.6103.7–297.4233.925–821
Wadi Hovav crossing the industrial areaW1; W2; S2; S3; S48.21.5–13.941.229–49
Downstream to the industrial areaRH26; KN4; RH10; RH22; RH33; W8; KN2010.20.0007–0.426.94.9–48
Table 4. Mean values of the Observed, Chao1 and Shannon diversity indices for each area in the industrial site.
LocationBoreholes in GroupObservedChao1Shannon
NMeanRangeMeanRangeMeanRange
production plantRH49; RH49P; RH50; RH50P; WT542473317–467855054016–62286.336.13–6.51
Wadi Hovav crossing the industrial areaW1; W2; S2; S3; S4547812769–628169523838–88776.175.38–6.71
Downstream to the industrial areaRH26; KN4; RH10; RH22; RH33; W8; KN201751153392–724174304621–99626.275.60–7.12

