Potential Impact of a Large-Scale Cascade Reservoir on the Spawning Conditions of Critical Species in the Yangtze River, China


Abstract
1. Introduction
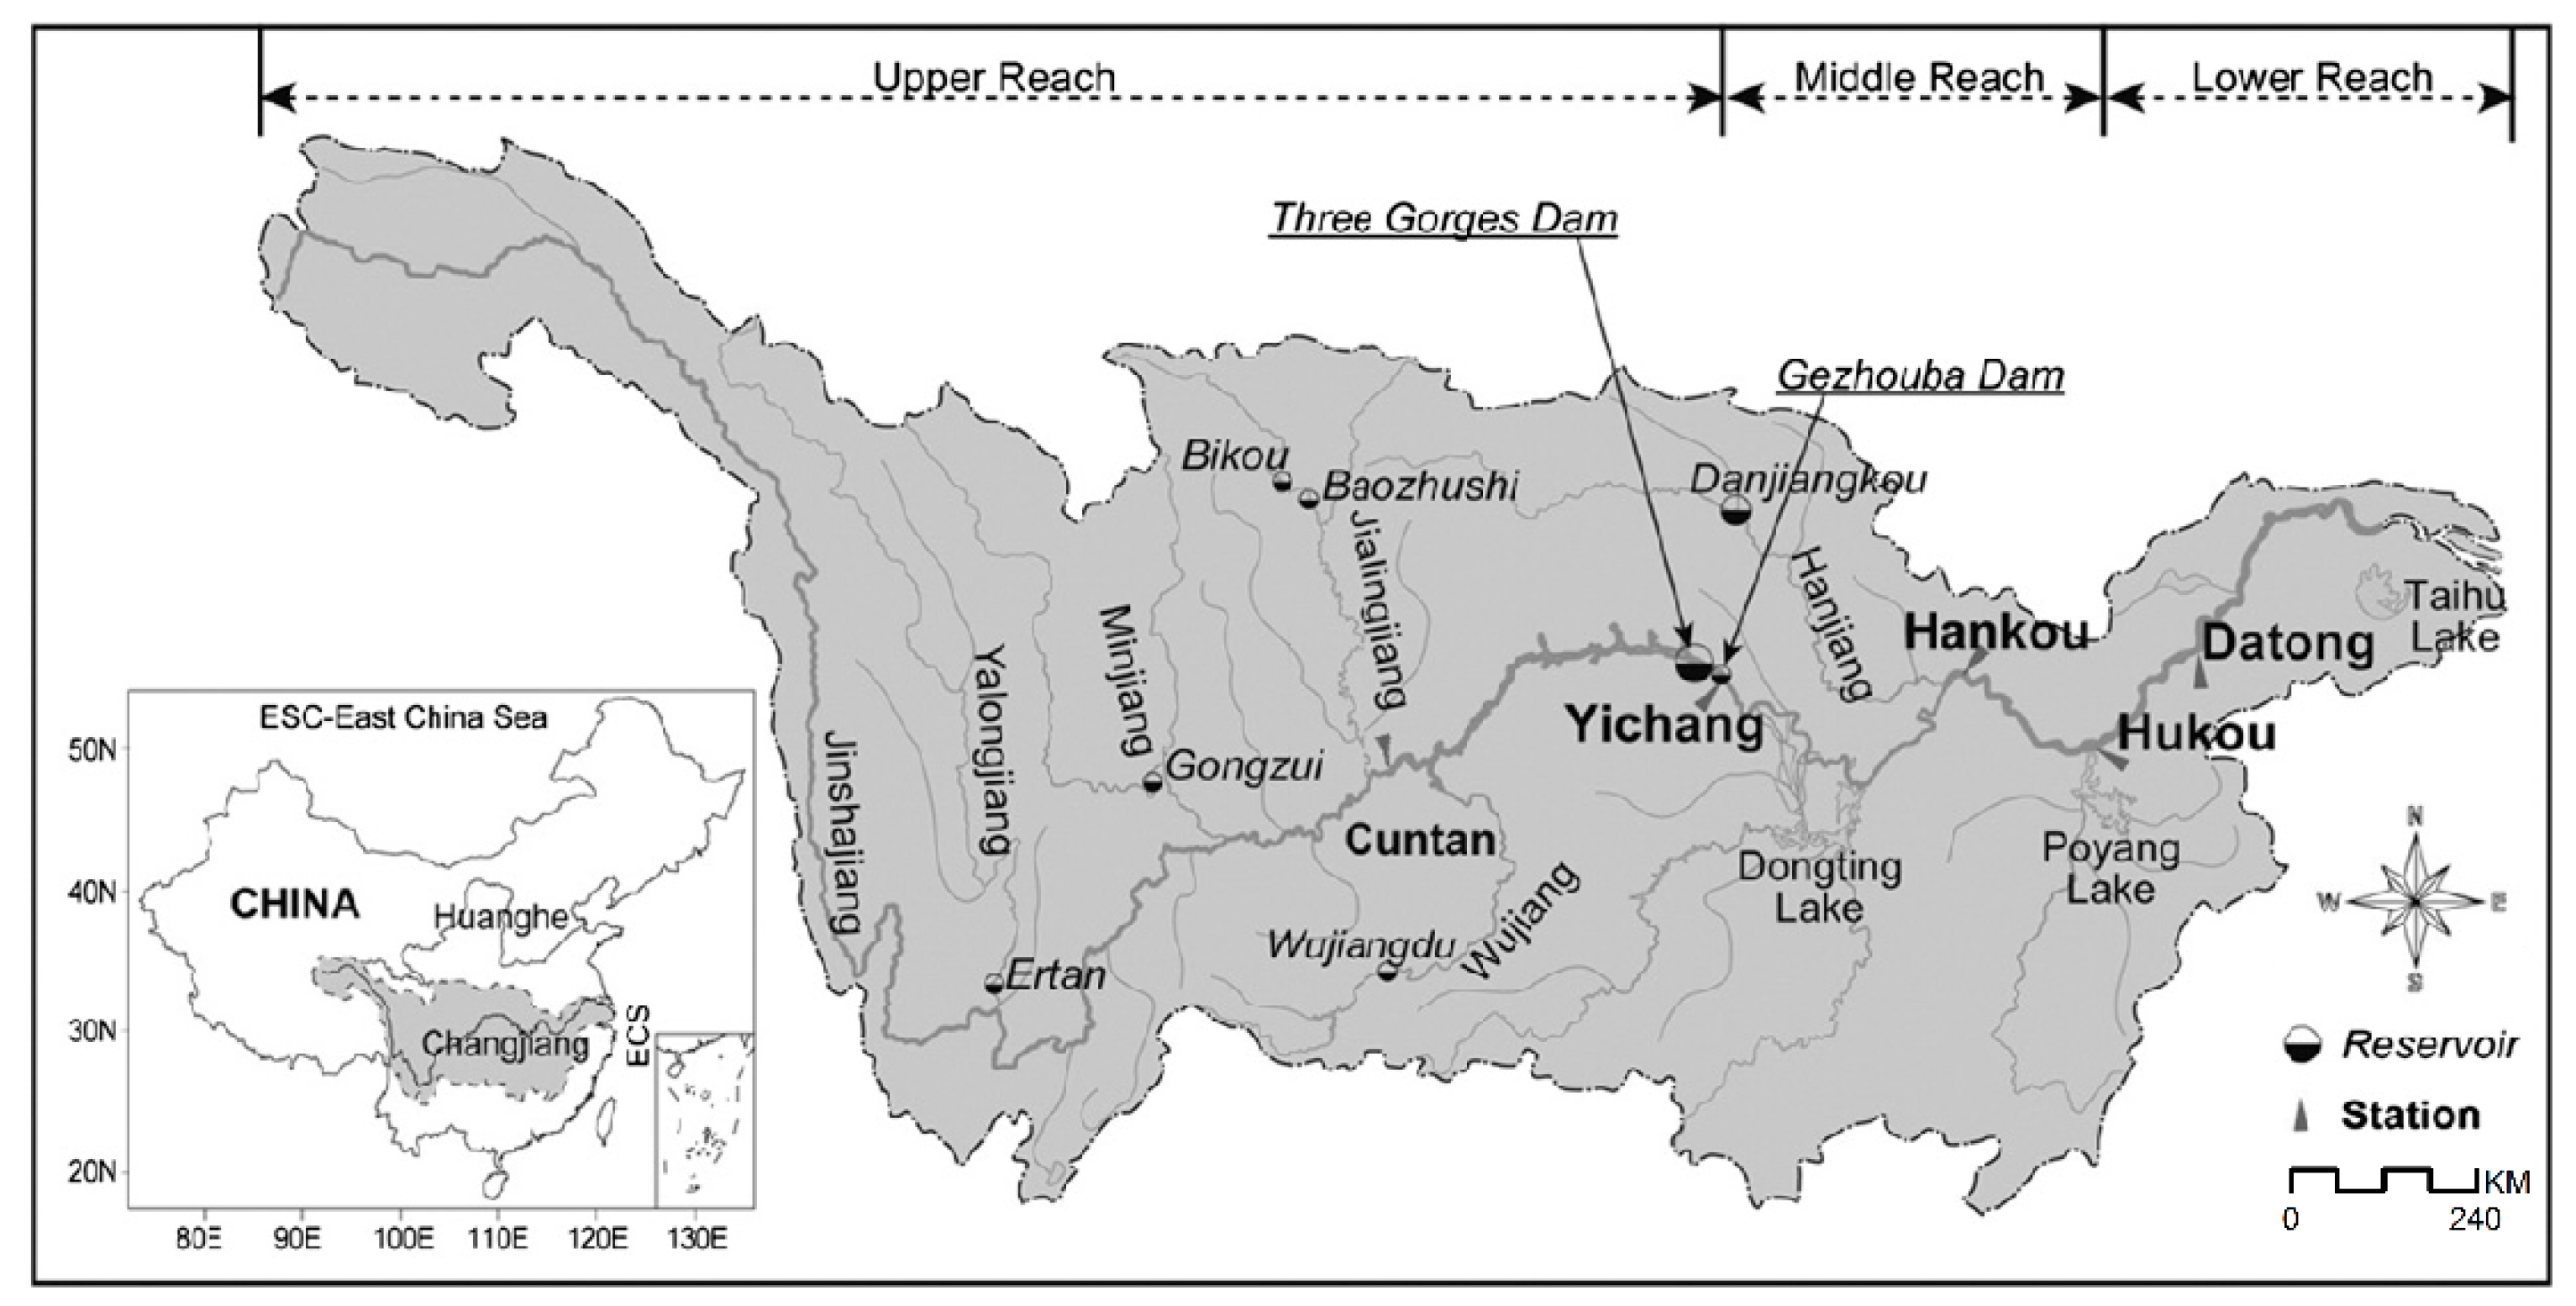
2. Study Region
3. Data and Methods
4. Results
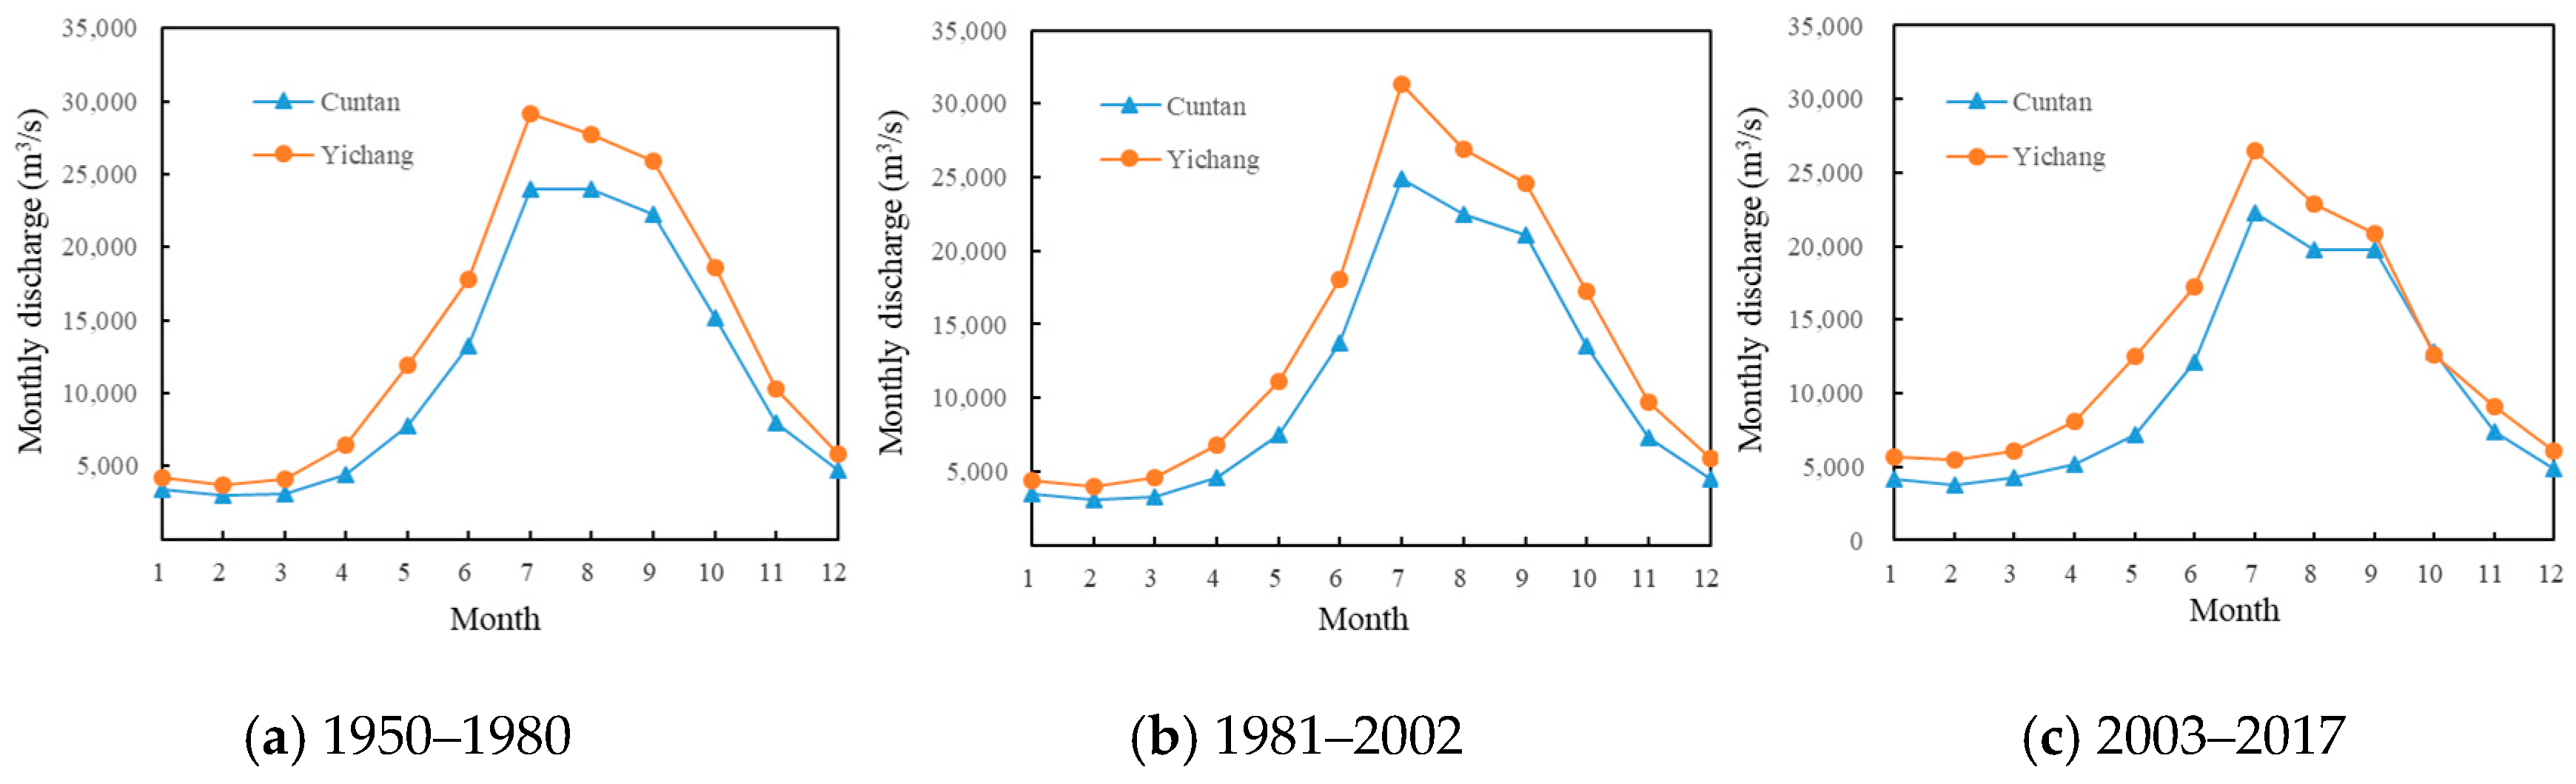
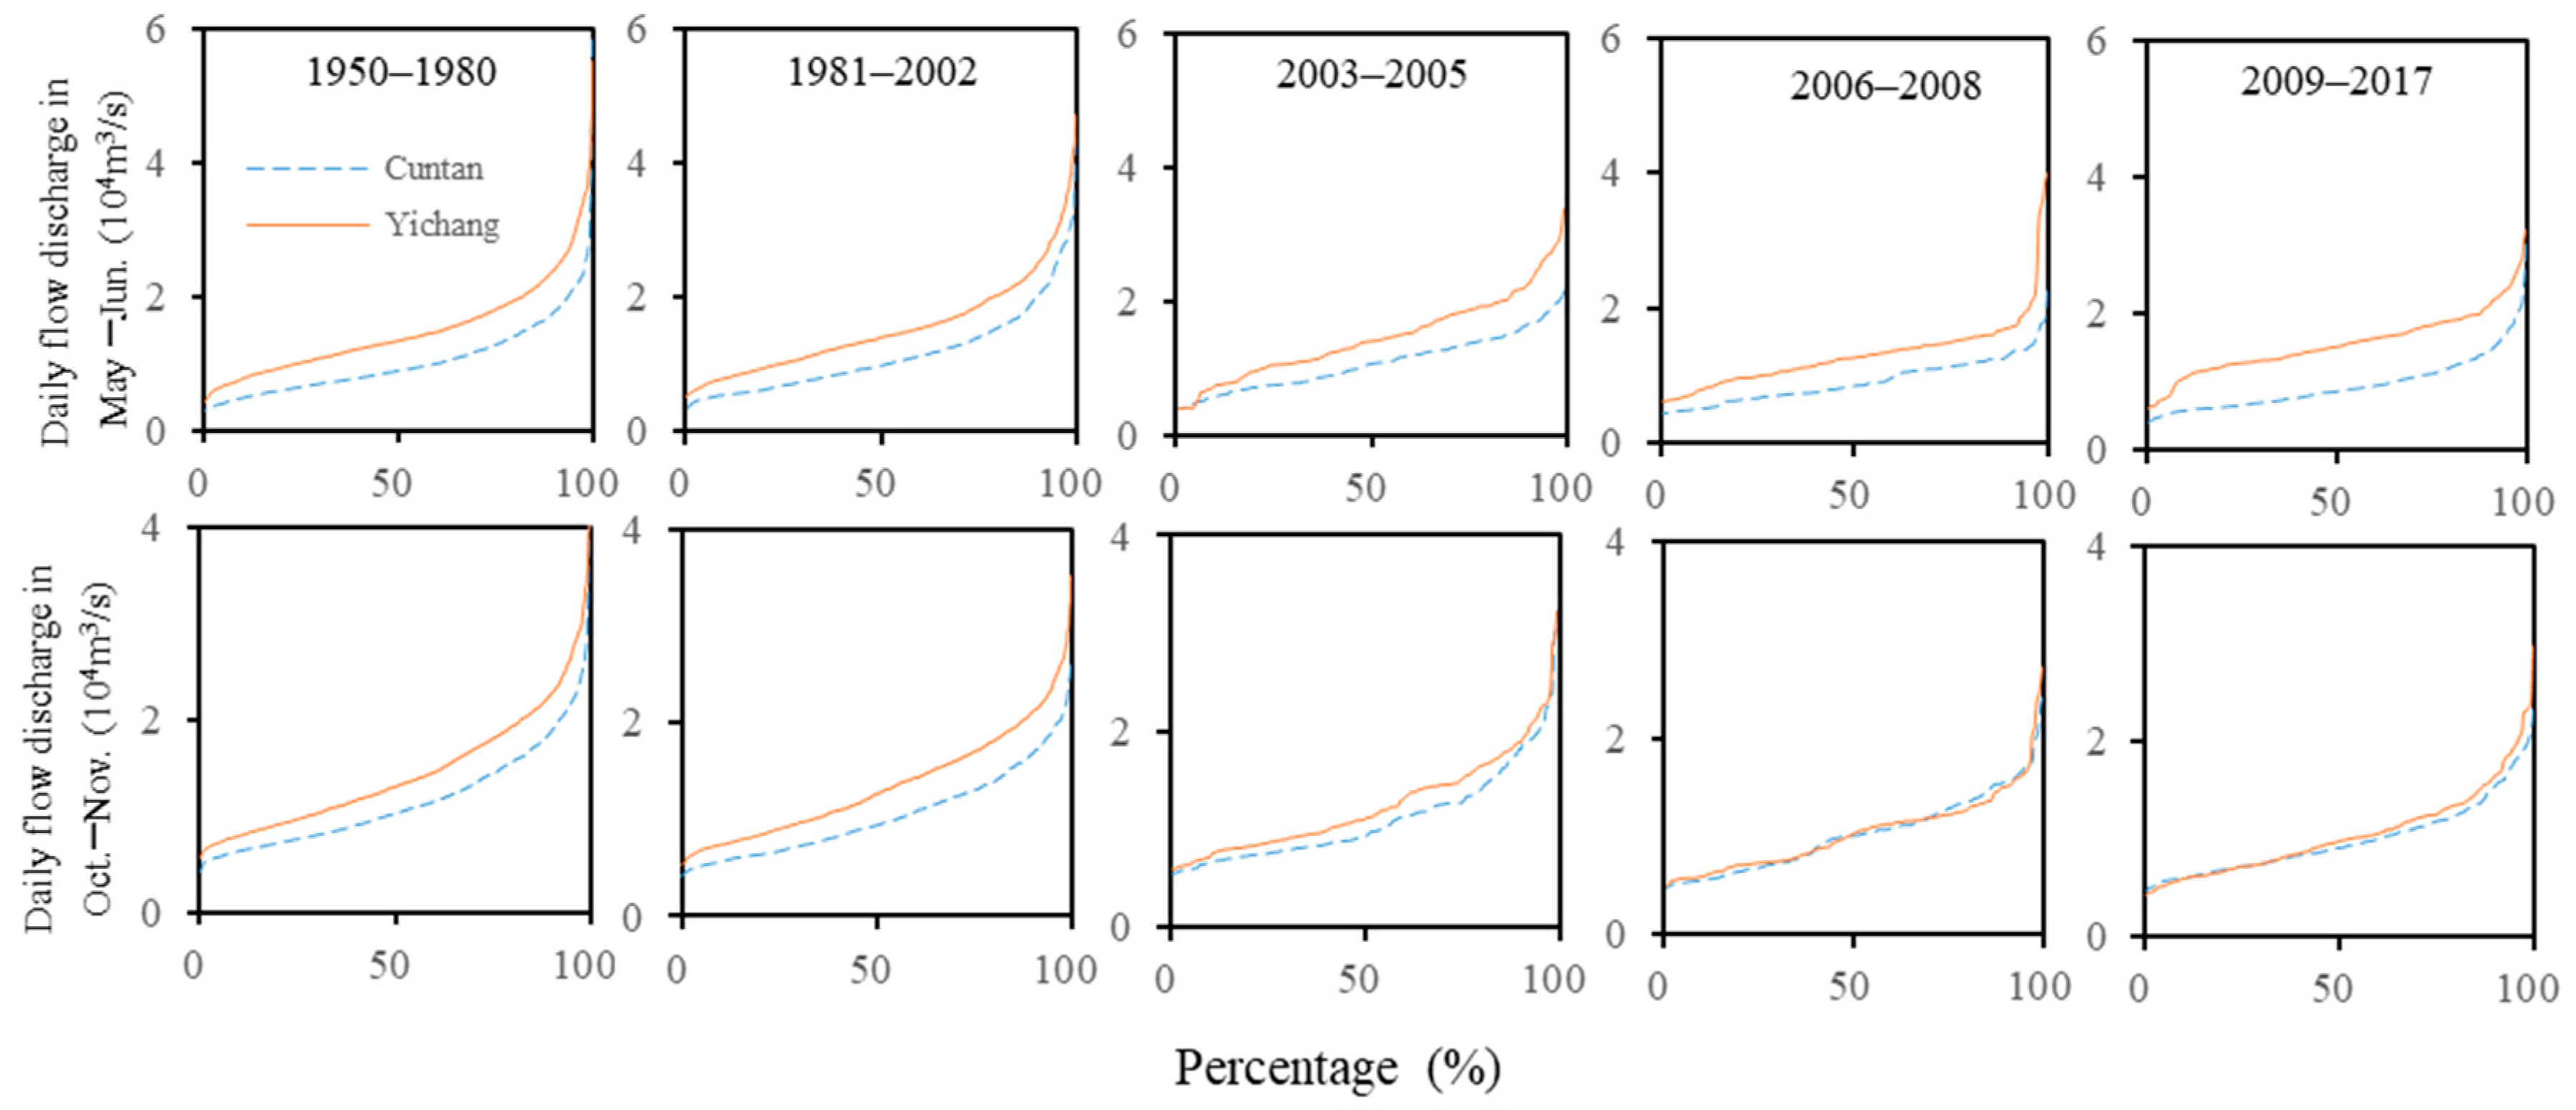
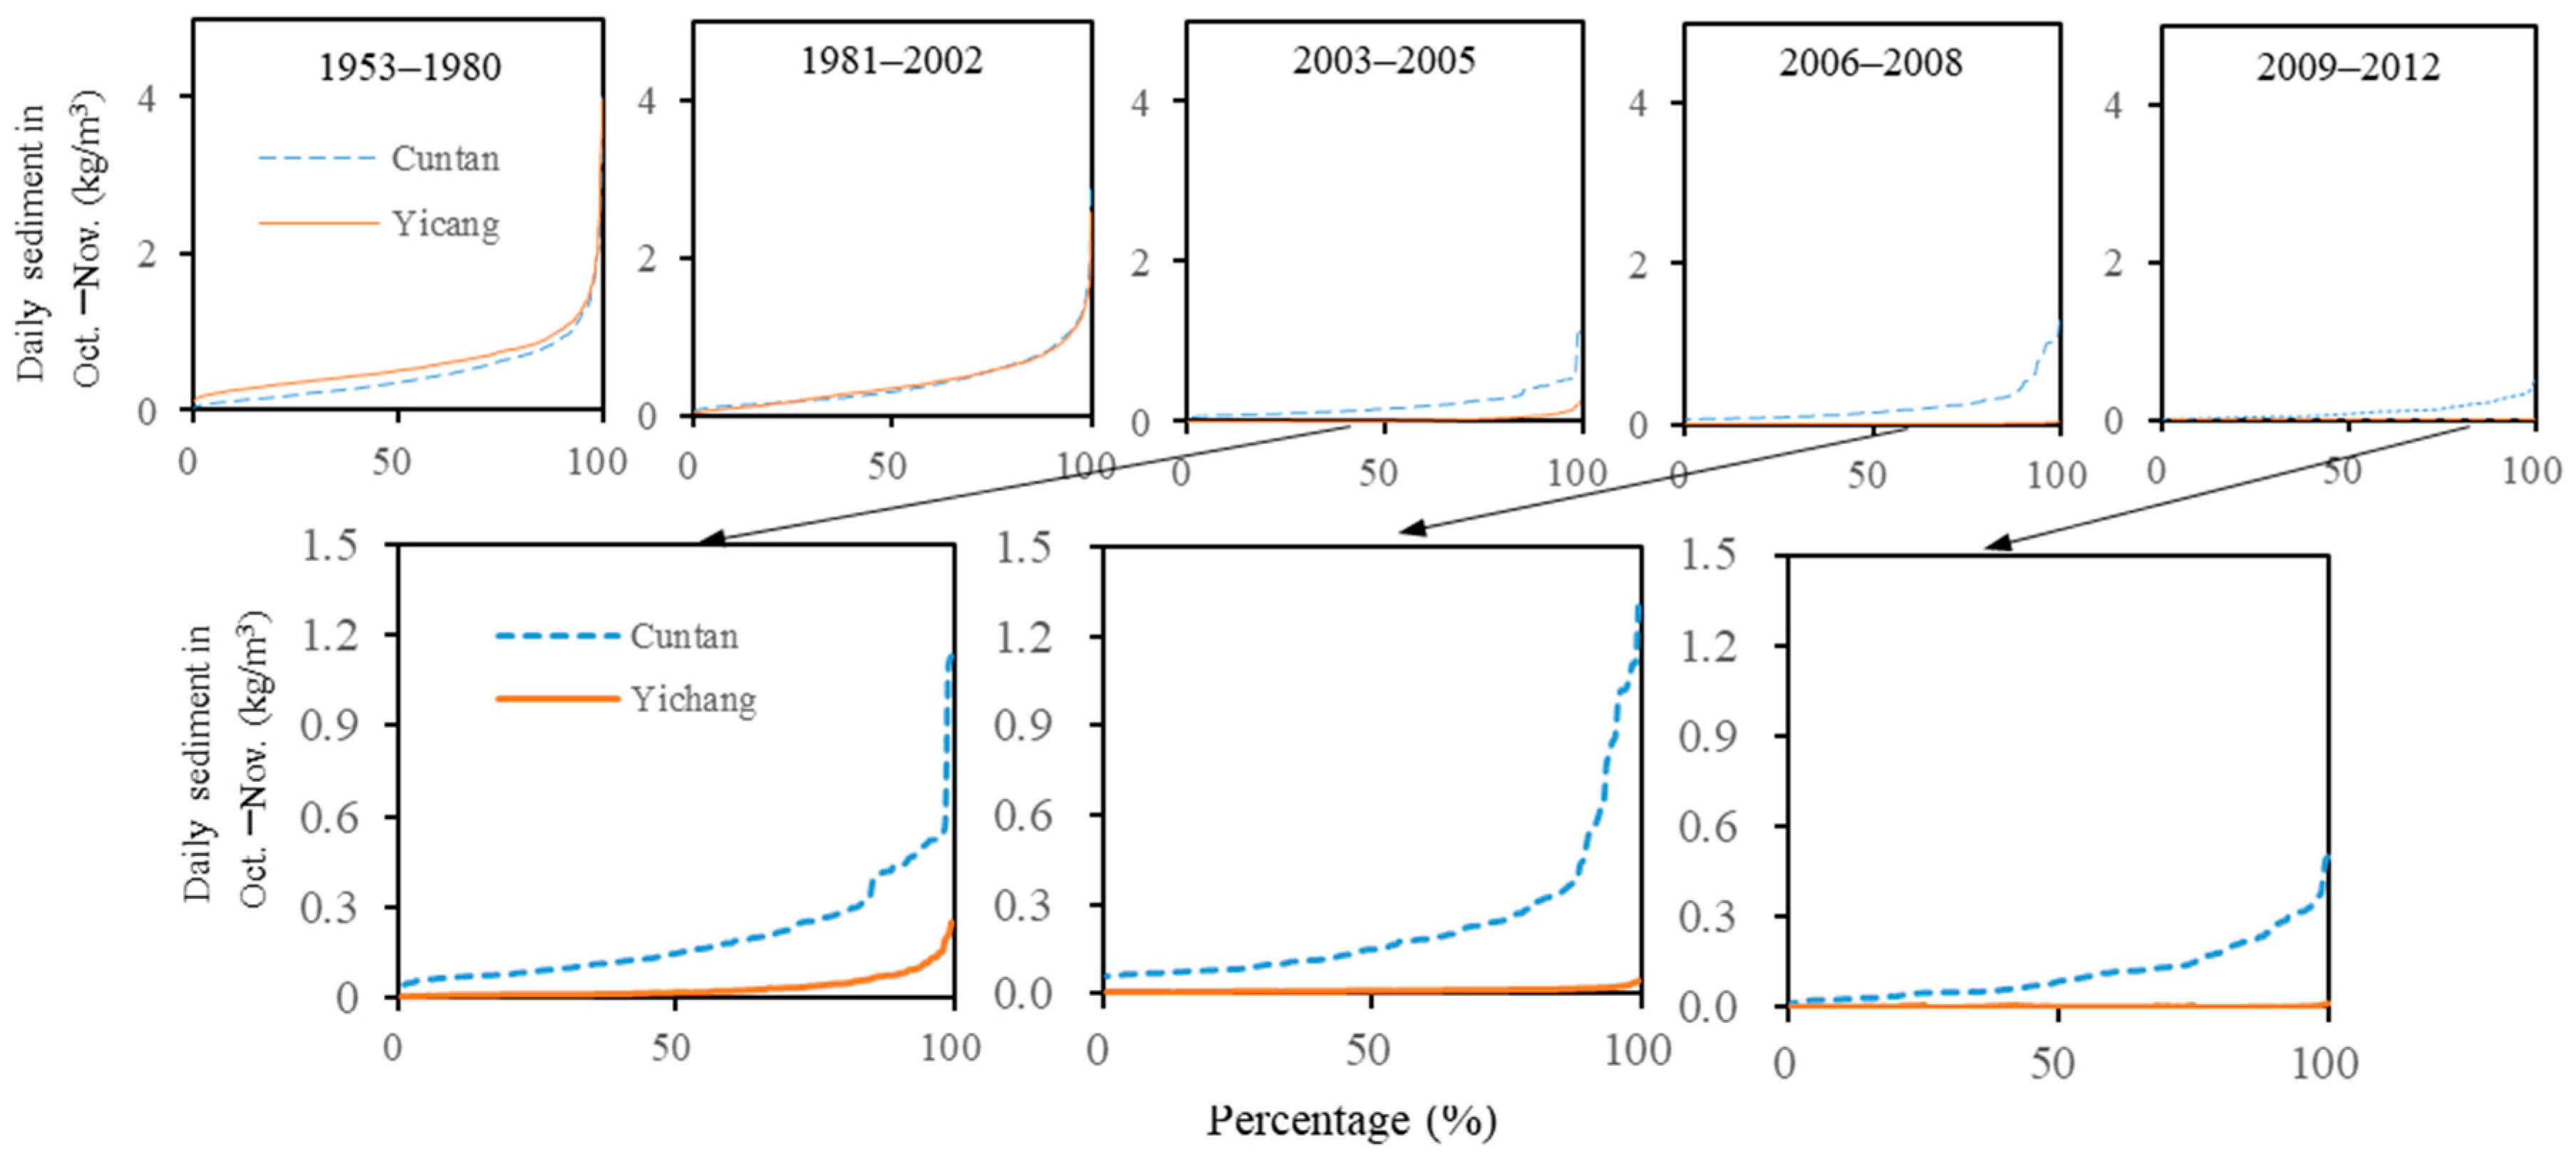
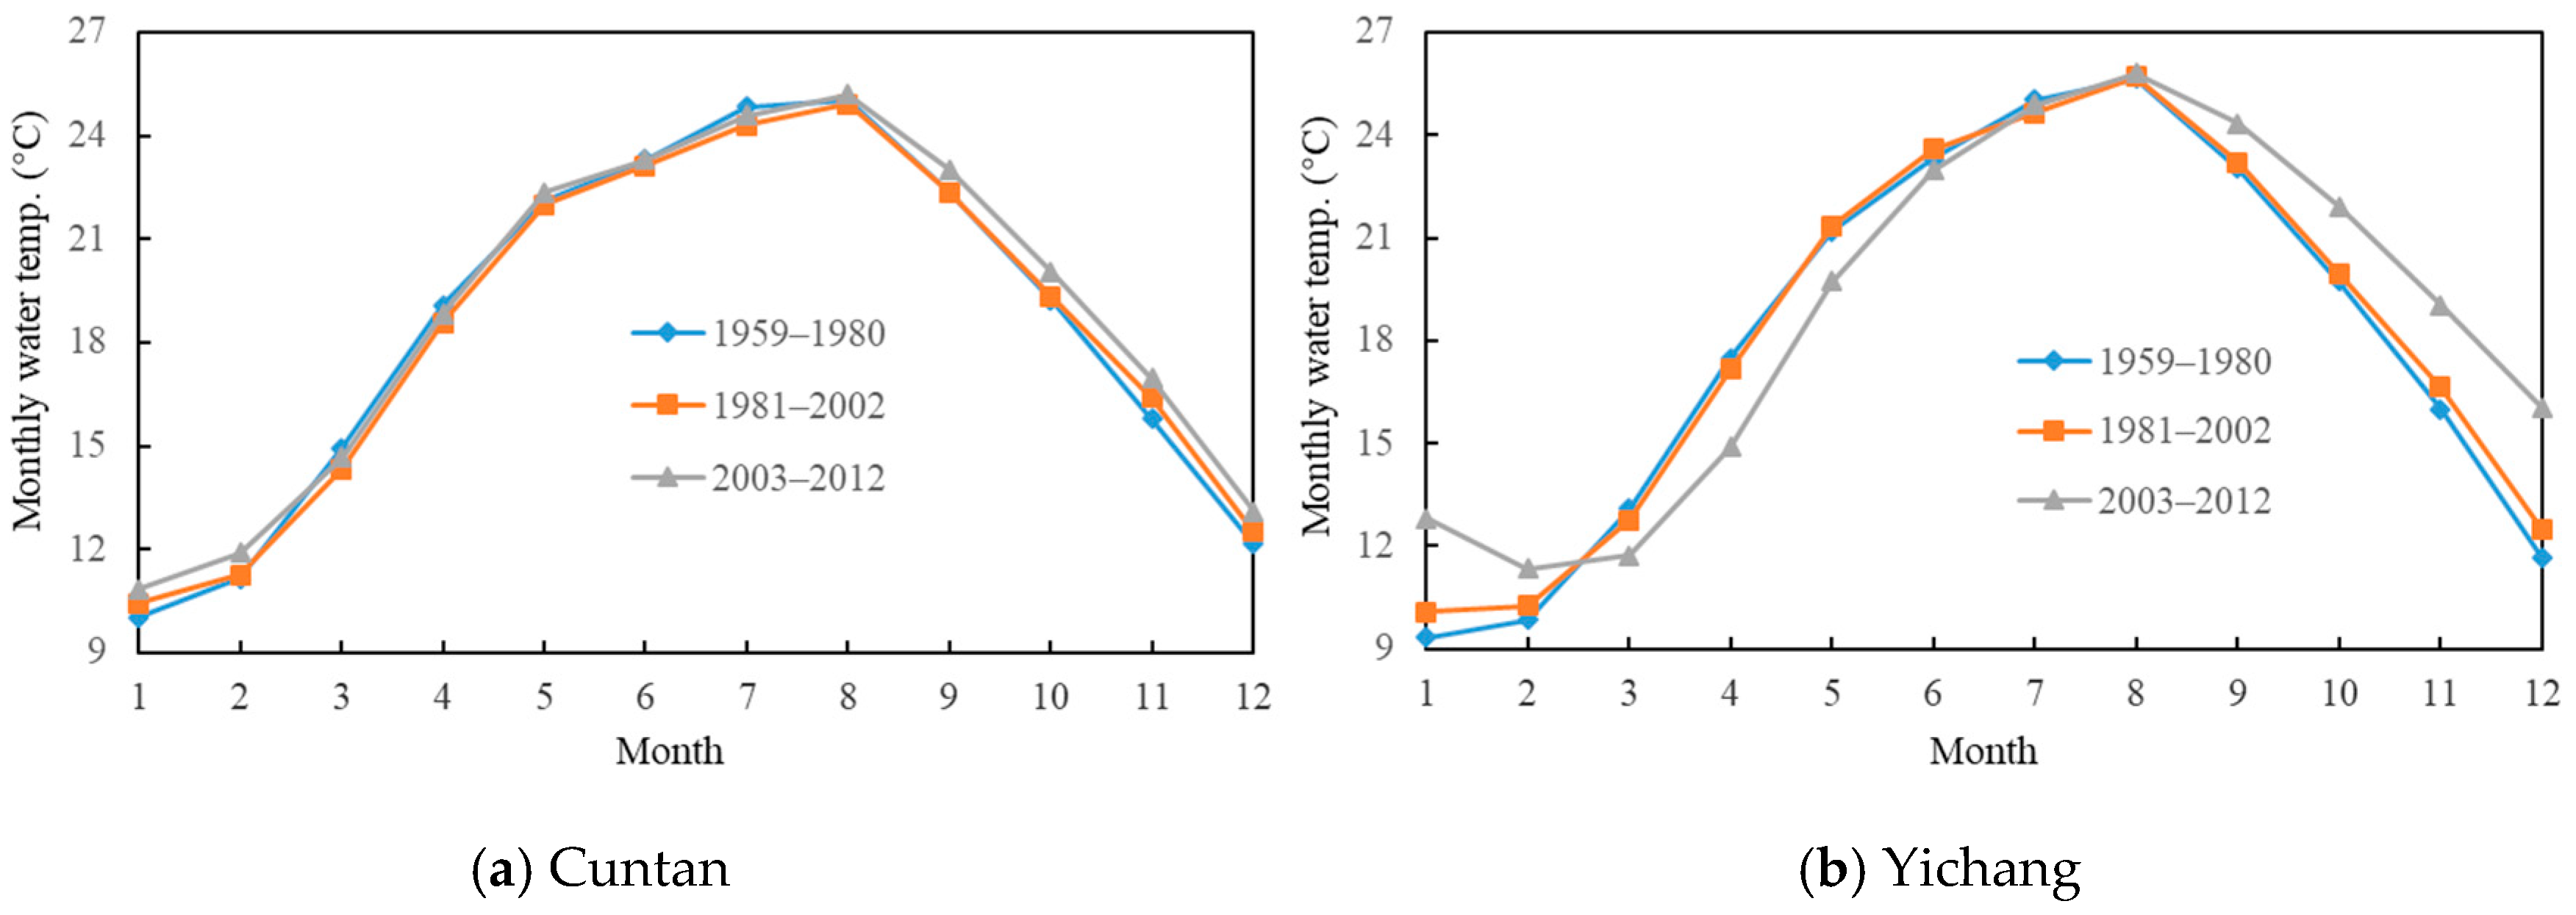
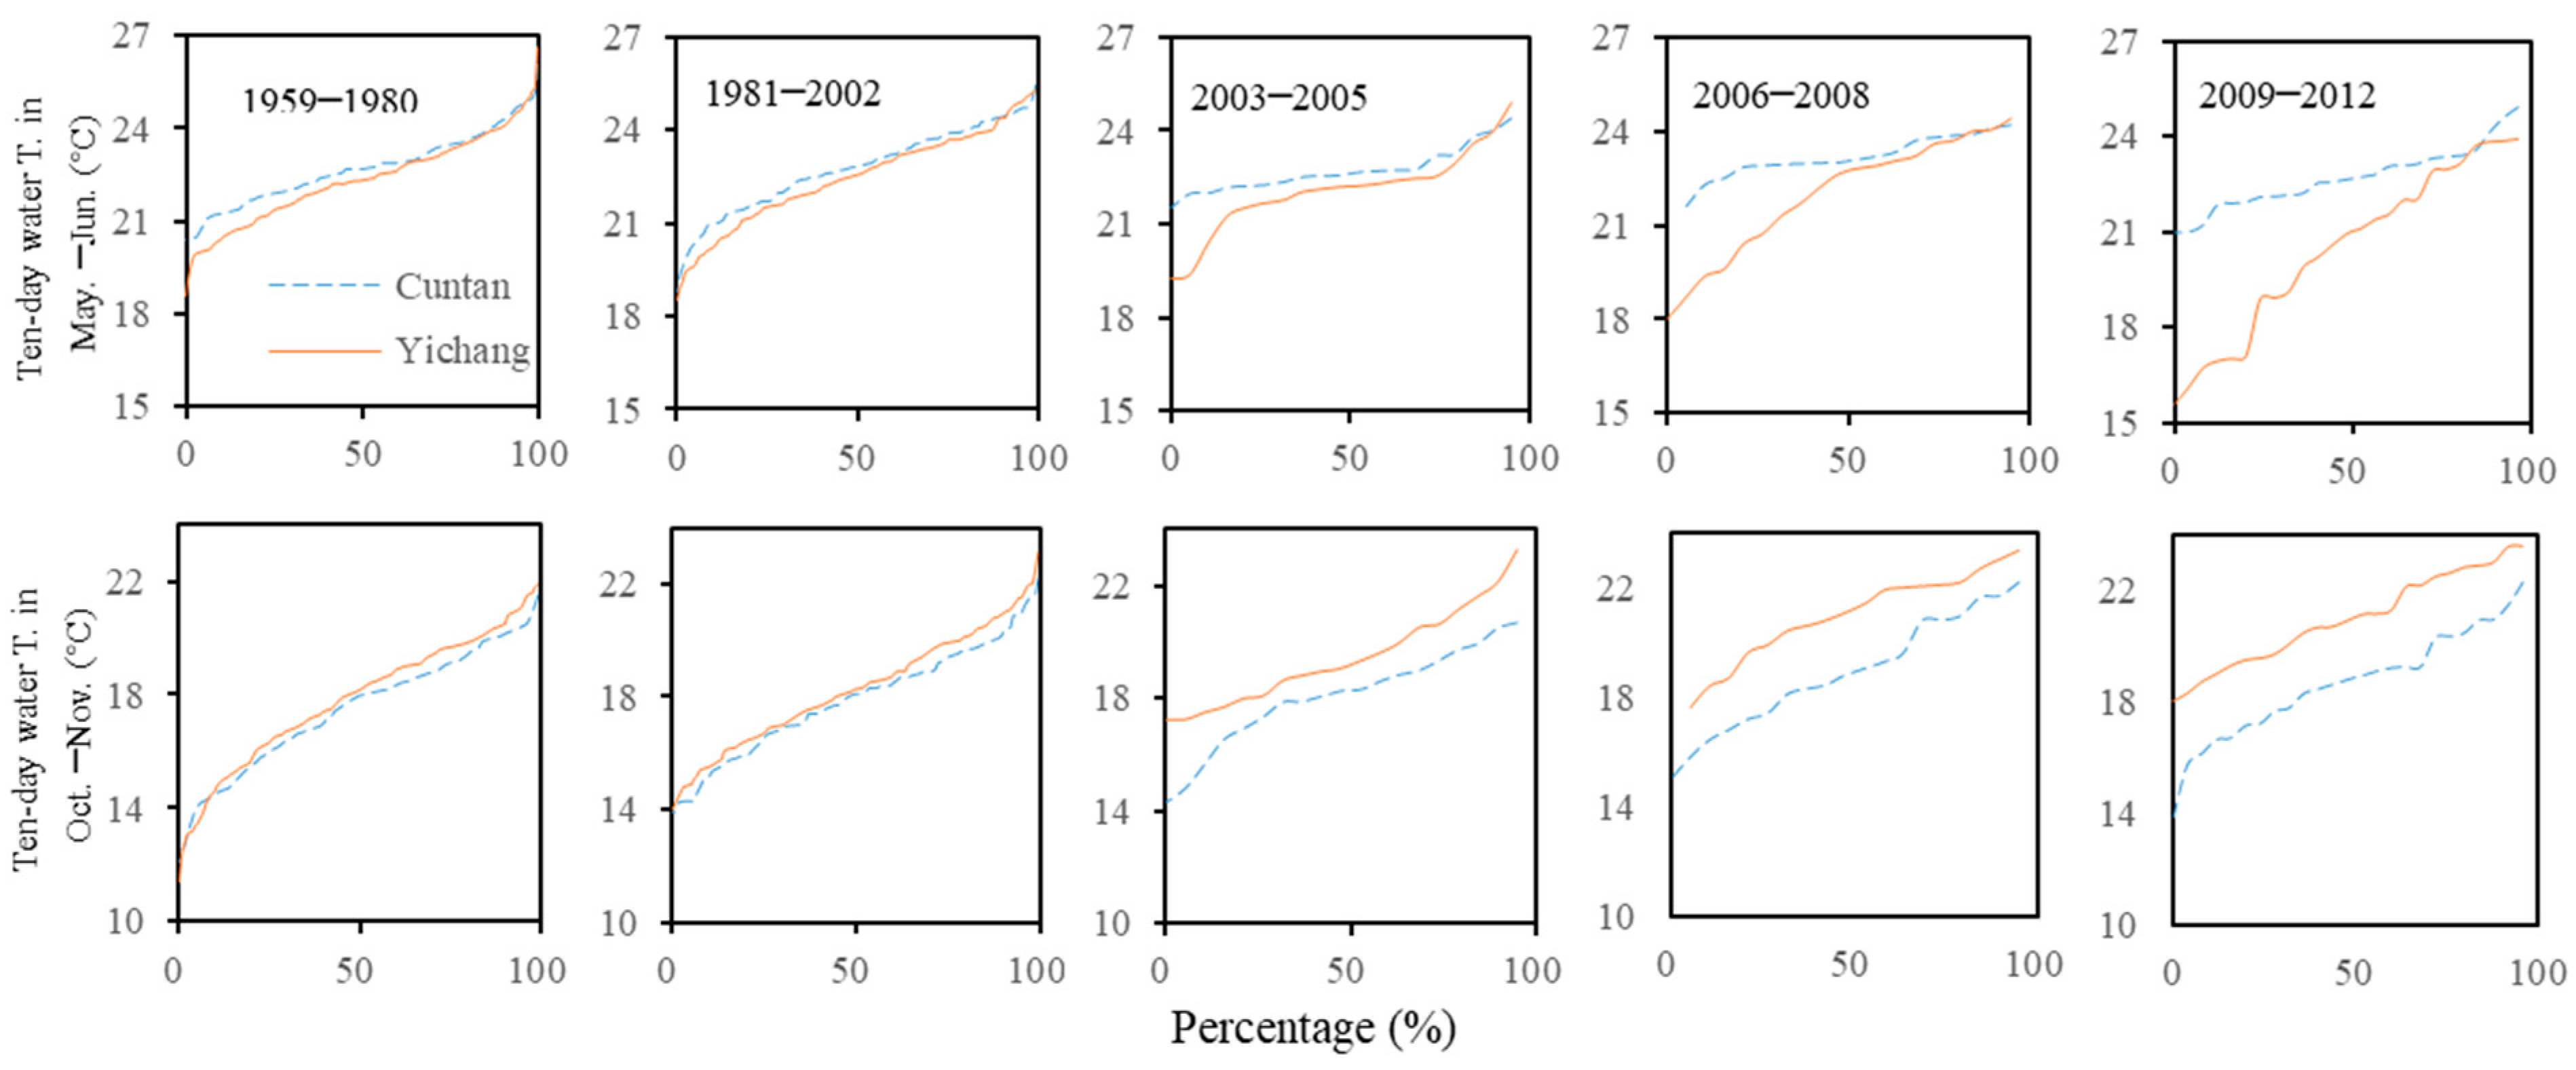
4.1. Alterations in Flow, Sediment, and Water Temperature Frequency Distributions
4.2. Alterations in the Satisfying Degree of Suitable Spawning Conditions
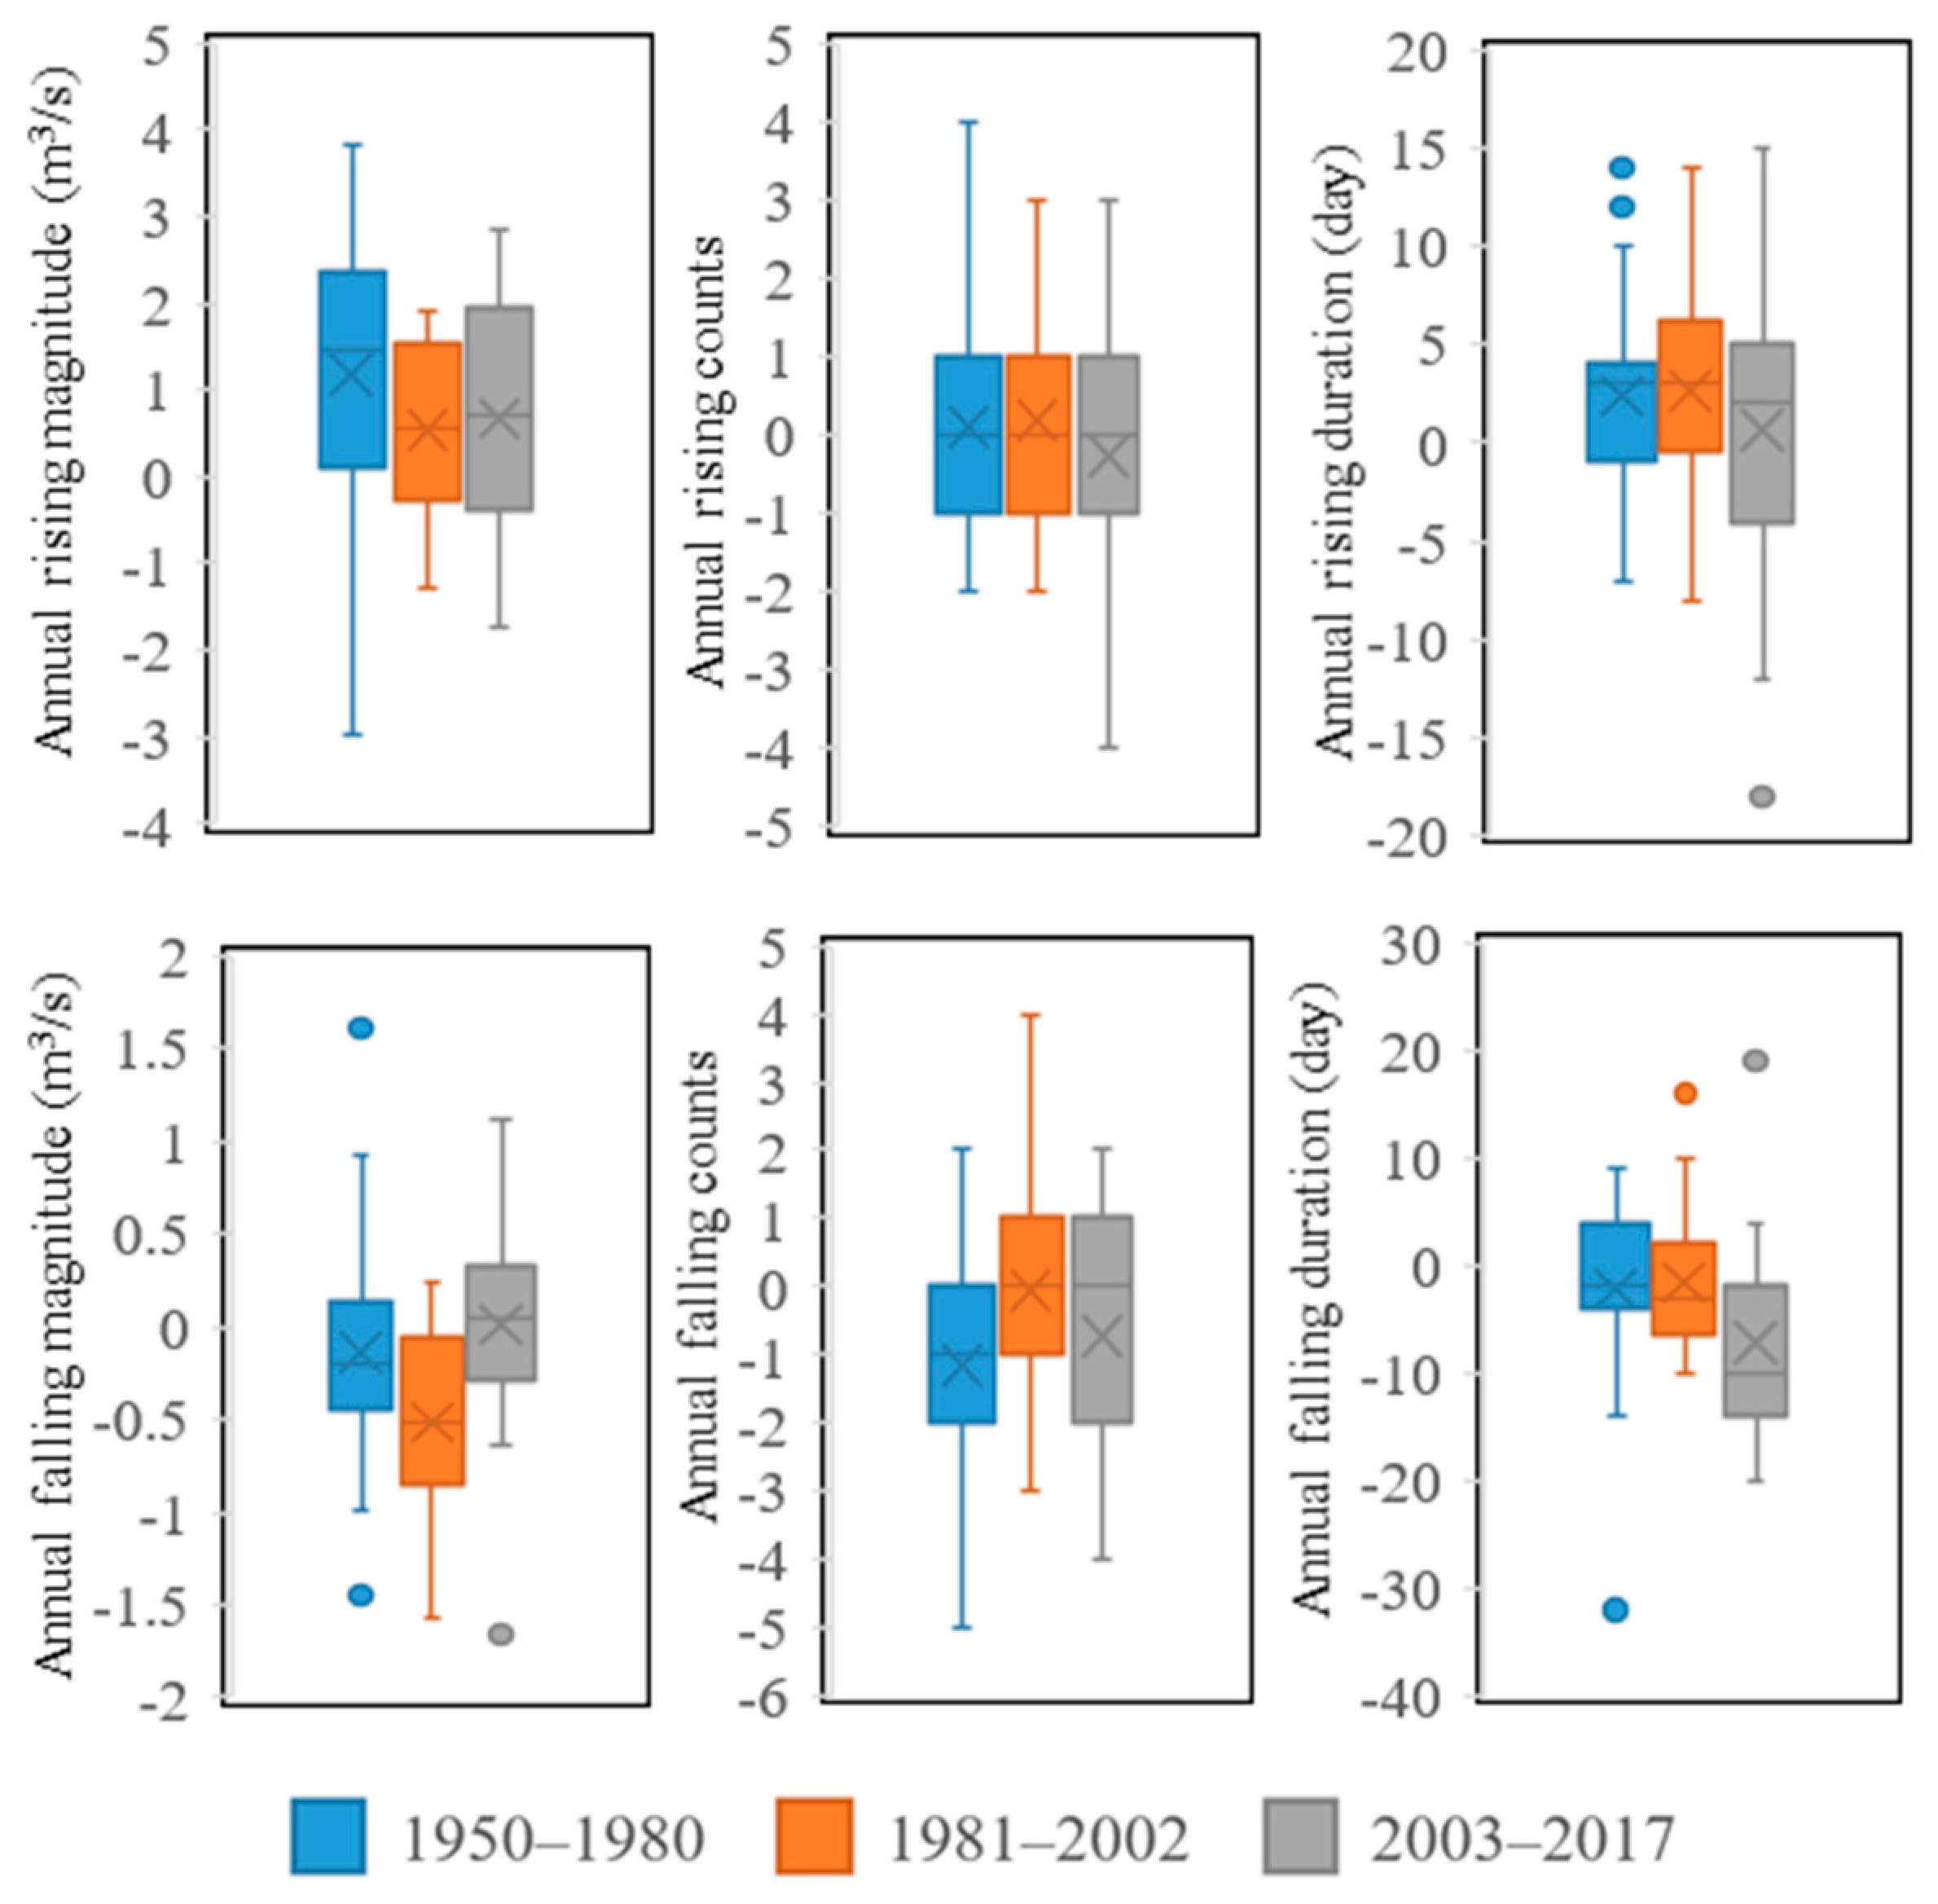
4.3. Alterations in Discharge Rising/Falling Characteristics
5. Discussion
6. Conclusions
Author Contributions
Funding
Acknowledgments
Conflicts of Interest
References
- Nilsson, C.; Reidy, C.A.; Dynesius, M.; Revenga, C. Fragmentation and flow regulation of the world’s large river systems. Science 2005, 308, 405–408. [Google Scholar] [CrossRef] [PubMed]
- Grill, G.; Lehner, B.; Thieme, M.; Geenen, B.; Tickner, D.; Antonelli, F.; Maced, H.E. Mapping the world’s free-flowing rivers. Nature 2019, 569, 215. [Google Scholar] [CrossRef] [PubMed]
- Wiatkowski, M. Influence of Słup dam reservoir on flow and quality of water in the Nysa Szalona river. Pol. J. Environ. Stud. 2011, 20, 469–478. [Google Scholar]
- Tebakari, T.; Yoshitani, J.; Suvanpimol, P. Impact of large-scale reservoir operation on flow regime in the Chao Phraya River basin, Thailand. Hydrol. Proc. 2012, 26, 2411–2420. [Google Scholar] [CrossRef]
- Wang, Y.; Zhang, N.; Wang, D.; Wu, J.; Zhang, X. Investigating the impacts of cascade hydropower development on the natural flow regime in the Yangtze River, China. Sci. Total Environ. 2018, 624, 1187–1194. [Google Scholar] [CrossRef] [PubMed]
- Li, Q.; Yu, M.; Lu, G.; Cai, T.; Xia, Z.; Ren, L. Impacts of the Gezhouba and the Three Gorges reservoirs on the sediment regime of the Yangtze River. J. Hydrol. 2011, 403, 224–233. [Google Scholar] [CrossRef]
- Shokri, A.; Haddad, O.B.; Mariño, M.A. Reservoir operation for simultaneously meeting water demand and sediment flushing: Stochastic dynamic programming approach with two uncertainties. J. Water Res. Plan. Manag. 2012, 139, 277–289. [Google Scholar] [CrossRef]
- Yang, H.F.; Yang, S.L.; Xu, K.H.; Milliman, J.D.; Wang, H.; Yang, Z.; Chen, Z.; Zhang, C.Y. Human impacts on sediment in the Yangtze River: A review and new perspectives. Glob. Planet. Chang. 2018, 162, 8–17. [Google Scholar] [CrossRef]
- Carron, J.C.; Rajaram, H. Impact of variable reservoir releases on management of downstream water temperatures. Water Resour. Res. 2001, 37, 1733–1743. [Google Scholar] [CrossRef]
- Liu, B.; Yang, D.; Ye, B.; Berezovskaya, S. Long-term open-water season stream temperature variations and changes over Lena river basin in Siberia. Glob. Planet. Chang. 2005, 48, 96–111. [Google Scholar] [CrossRef]
- Li, Q.; Li, H.; Yu, M. Impacts of Three Gorges-Gezhouba reservoir cascade on the heat flux regime of the Yangtze River. Concept. Model. Stud. Integr. Groundw. Surf. Water Ecol. Syst. 2011, 345, 207–212. [Google Scholar]
- Suen, J.P.; Eheart, J.W.; Herricks, E.E.; Chang, F.J. Evaluating the potential impact of reservoir operation on fish communities. J. Water Res. Plan. Man. 2009, 135, 475–483. [Google Scholar] [CrossRef]
- Wu, H.; Zeng, G.; Liang, J.; Chen, J.; Xu, J.; Dai, J.; Ye, S. Responses of landscape pattern of China’s two largest freshwater lakes to early dry season after the impoundment of Three-Gorges Dam. Int. J. Appl. Earth Obs. Geoinf. 2017, 56, 36–43. [Google Scholar] [CrossRef]
- Han, X.; Feng, L.; Hu, C.; Chen, X. Wetland changes of China’s largest freshwater lake and their linkage with the Three Gorges Dam. Remote Sens. Environ. 2018, 204, 799–811. [Google Scholar] [CrossRef]
- Zalewski, M. Ecohydrology—Process oriented thinking for sustainability of river basins. Ecohydrol. Hydrobiol. 2012, 12, 89–92. [Google Scholar] [CrossRef][Green Version]
- Wang, H.; Brill, E.D.; Ranjithan, R.S.; Sankarasubramanian, A. A framework for incorporating ecological releases in single reservoir operation. Adv. Water Resour. 2015, 78, 9–21. [Google Scholar] [CrossRef]
- Cury, P.; Roy, C. Optimal environmental window and pelagic fish recruitment success in upwelling areas. Can. J. Fish. Aquat. Sci. 1989, 46, 670–680. [Google Scholar] [CrossRef]
- Roy, C.; Cury, P.; Kifani, S. Pelagic fish recruitment success and reproductive strategy in upwelling area: Environmental compromises. S. Afr. J. Mar. Sci. 1992, 12, 135–146. [Google Scholar] [CrossRef]
- Baumgartner, G.; Nakatani, K.; Gomes, L.C.; Bialetzki, A.; Sanches, P.V.; Makrakis, M.C. Fish larvae from the upper Parana River: Do abiotic factors affect larval density? Neotrop. Ichthyol. 2008, 6, 551–558. [Google Scholar] [CrossRef]
- Gao, X.; Li, M.Z.; Lin, P.C.; Duan, Z.H.; Liu, H.Z. Environmental cues for natural reproduction of the Chinese sturgeon, Acipenser sinensis Gray, 1835, in the Yangtze River, China. J. Appl. Ichthyol. 2013, 29, 1389–1394. [Google Scholar] [CrossRef]
- Xu, W.; Qiao, Y.; Chen, X.J.; Cai, Y.P.; Yang, Z.; Liu, H.G. Spawning activity of the four major Chinese carps in the middle mainstream of the Yangtze River, during the Three Gorges Reservoir operation period, China. J. Appl. Ichthyol. 2015, 31, 846–854. [Google Scholar] [CrossRef]
- Yu, M.; Li, Q.; Lu, G.; Cai, T.; Xie, W.; Bai, X. Investigation into the Impacts of the Gezhouba and the Three Gorges Reservoirs on the Flow Regime of the Yangtze River. J. Hydrol. Eng. 2013, 18, 1098–1106. [Google Scholar] [CrossRef]
- Yi, Y.; Wan, Z.; Yang, Z. Impact of the Gezhouba and Three Gorges Dams on habitat suitability of carps in the Yangtze River. J. Hydrol. 2010, 387, 283–291. [Google Scholar]
- Wang, J.N.; Li, C.; Duan, X.B.; Luo, H.H.; Feng, S.X.; Peng, Q.D.; Liao, W.G. The relationship between thermal regime alteration and spawning delay of the four major Chinese carps in the Yangtze River below the Three Gorges Dam. River Res. Appl. 2014, 30, 987–1001. [Google Scholar] [CrossRef]
- Chang, T.; Lin, P.C.; Gao, X.; Liu, F.; Duan, Z.H.; Liu, H.Z. Using adaptive resolution imaging sonar to investigate Chinese sturgeon (Acipenser sinensis Gray, 1835) behaviour on its only spawning ground in the Yangtze River. J. Appl. Ichthyol. 2017, 33, 681–688. [Google Scholar] [CrossRef]
- Shen, Y.; Wang, P.; Wang, C.; Yu, Y.; Kong, N. Potential causes of habitat degradation and spawning time delay of the Chinese sturgeon (Acipenser sinensis). Ecol. Inform. 2018, 43, 96–105. [Google Scholar] [CrossRef]
- Ban, X.; Chen, S.; Pan, B.Z.; Du, Y.; Yin, D.C.; Bai, M.C. The eco-hydrologic influence of the Three Gorges Reservoir on the abundance of larval fish of four carp species in the Yangtze River, China. Ecohydrology 2017, 10, e1763. [Google Scholar] [CrossRef]
- Ban, X.; Du, Y.; Liu, H.Z.; Ling, F. Applying instream flow incremental method for the spawning habitat protection of Chinese sturgeon (Acipenser sinensis). River Res. Appl. 2011, 27, 87–98. [Google Scholar] [CrossRef]
- Chen, Y.B.; Wu, B.F. Impact analysis of the Three-Gorges Project on the spawning of Chinese sturgeon Acipenser sinensis. J. Appl. Ichthyol. 2011, 27, 383–386. [Google Scholar]
- Li, Q.; Yu, M.; Zhao, J.; Cai, T.; Lu, G.; Xie, W.; Bai, X. Impact of the Three Gorges reservoir operation on downstream ecological water requirements. Hydrol. Res. 2012, 43, 48–53. [Google Scholar] [CrossRef]
- Yang, S.L.; Milliman, J.D.; Xu, K.H.; Deng, B.; Zhang, X.Y.; Luo, X.X. Downstream sedimentary and geomorphic impacts of the Three Gorges Dam on the Yangtze River. Earth-Sci. Rev. 2014, 138, 469–486. [Google Scholar] [CrossRef]
- MWR (Ministry of Water Resources). Code of Hydrologica Data Compilation; China Water Conservancy and Hydropower Press: Beijing, China, 1999. [Google Scholar]
- Ke, F.E.; Wei, Q.W.; Zhang, G.L.; Hu, D.G.; Luo, J.D.; Zhuang, P. Investigation in the structure of spawning population of Chinese sturgeon (Acipenser sinensis Gray) and the estimate of stock. Freshw. Fish. 1992, 4, 7–11. [Google Scholar]
- Wei, Q.W. Reproductive Behavior Ecology of Chinese Sturgeon (Acipenser sinensis Gray) with Its Stock Assessment. Ph.D. Thesis, Chinese Academy of Sciences, Beijing, China, 2003. [Google Scholar]
- Qiao, Y.; Tang, X.; Brosse, S.; Chang, J. Chinese sturgeon (Acipenser sinensis) in the Yangtze River: A hydroacoustic assessment of fish location and abundance on the last spawning ground. J. Appl. Ichthyol. 2006, 22, 140–144. [Google Scholar] [CrossRef]
- Tao, J.P.; Qiao, Y.; Yang, Z.; Chang, J.B.; Dong, F.Y.; Wan, L. Estimation on the spawning population and spawning sizes of Chinese sturgeon (Acipenser sinensis) and trend analysis of their change in recent years. J. Hydroecol. 2009, 2, 38–43. [Google Scholar]
- Huang, Z.L. A New Method of Estimation on Populations of Chinese Sturgeon in the Yangtze River by Using Existing Fishing Data. Sci. Technol. Rev. 2013, 31, 18–22. [Google Scholar]
- Wu, J.M.; Wang, C.Y.; Zhang, H.; Du, H.; Liu, Z.G.; Shen, L.; Rosenthal, H. Drastic decline in spawning activity of Chinese sturgeon Acipenser sinensis Gray 1835 in the remaining spawning ground of the Yangtze River since the construction of hydrodams. J. Appl. Ichthyol. 2015, 31, 839–842. [Google Scholar] [CrossRef]
- Huang, Z.L.; Wang, L.H.; Ren, J.Y. Study on the spawning population fluctuation of Chinese sturgeons around the closure of Gezhouba Dam. Sci. Sin. Tech. 2017, 47, 871–881. (In Chinese) [Google Scholar]
- Guo, W. Research on Reservoir Ecological Operation Model for River Health. Ph.D. Thesis, Hohai University, Nanjing, China, 2008. [Google Scholar]
- Cressie, N.A.C.; Whitford, H.J. How to Use the Two Sample t-Test? Biom. J. 1986, 28, 131–148. [Google Scholar] [CrossRef]
- Haan, C.T. Statistical Methods in Hydrology; The Iowa State University Press: Iowa, IA, USA, 1977. [Google Scholar]
- Huang, Z.P. Hydrological Statistics; Hohai University Press: Nanjing, China, 2003. [Google Scholar]
- Lai, X.; Yin, D.; Finlayson, B.L.; Wei, T.; Li, M.; Yuan, W.; Yang, S.; Dai, Z.; Gao, S.; Chen, Z. Will river erosion below the Three Gorges Dam stop in the middle Yangtze? J. Hydrol. 2017, 554, 24–31. [Google Scholar] [CrossRef]
- Sun, G.; Yang, Y.; Jiang, W.; Zheng, H. Effects of an increase in reservoir drawdown rate on bank slope stability: A case study at the Three Gorges Reservoir, China. Eng. Geol. 2017, 221, 61–69. [Google Scholar] [CrossRef]
- Cai, Y.P.; Yang, Z.; Xu, W. Effect of Water Temperature Variation After Impoundment of the Three Gorges Reservoir on Natural Reproduction of the Four Major Chinese Carps. Adv. Eng. Sci. 2017, 49, 70–77. [Google Scholar]
- Du, L.X.; Niu, L.H.; Huang, T. Variations of the water temperature in Three Gorges Reservoir and its influences. Exp. Water Resour. Hydrop. 2017, 38, 58–63. [Google Scholar]
- MOA (Ministry of Agriculture). Chinese Sturgeon Rescue Plan (2015–2030); Ministry of Agriculture of the People’s Republic of China: Beijing, China, 2015.
- A new round of ecological dispatch test for the Three Gorges Reservoir. Available online: http://www.gov.cn/xinwen/2018-05/19/content_5292134.htm (accessed on 27 September 2019).
- Gao, X.; Fujiwara, M.; Winemiller, K.O.; Lin, P.; Li, M.; Liu, H. Regime shift in fish assemblage structure in the Yangtze River following construction of the Three Gorges Dam. Sci. Rep. 2019, 9, 4212. [Google Scholar] [CrossRef] [PubMed]


| Hydrological Item | Time Range | Time Scale | Unit |
|---|---|---|---|
| Flow discharge | 1950–2017 | daily | m3/s |
| Sediment concentration | 1953–2012 | daily | kg/m3 |
| Water temperature | 2001–2006, 2010–2012 | daily | °C |
| 1959–2000, 2007–2009 | ten-day |
| Fishes | Stations | Before 1980 | 1981–2002 | 2003–2005 | 2006–2008 | After 2009 |
|---|---|---|---|---|---|---|
| FMC | CT | 0.390 | 0.329 | 0.404 | 0.470 | 0.432 |
| YC | 0.341 | 0.326 | 0.311 | 0.415 | 0.177 | |
| YC/CT | 0.875 | 0.991 | 0.770 | 0.884 | 0.406 | |
| CS | CT | 0.298 | 0.292 | 0.273 | 0.404 | 0.350 |
| YC | 0.348 | 0.312 | 0.339 | 0.410 | 0.271 | |
| YC/CT | 1.168 | 1.069 | 1.240 | 1.014 | 0.776 |
| Fishes | Stations | Before 1980 | 1981–2002 | 2003–2005 | 2006–2008 | After 2009 |
|---|---|---|---|---|---|---|
| CS | CT | 0.751 | 0.775 | 0.699 | 0.645 | 0.451 |
| YC | 0.724 | 0.701 | 0.060 | 0.000 | 0.000 | |
| YC/CT | 0.964 | 0.905 | 0.086 | 0.000 | 0.000 |
| Fishes | Stations | Before 1980 | 1981–2002 | 2003–2005 | 2006–2008 | After 2009 |
|---|---|---|---|---|---|---|
| FMC | CT | 0.993 | 0.997 | 1.000 | 1.000 | 0.996 |
| YC | 0.985 | 0.996 | 0.989 | 0.940 | 0.717 | |
| YC/CT | 0.992 | 0.999 | 0.989 | 0.940 | 0.720 | |
| CS | CT | 0.387 | 0.397 | 0.546 | 0.339 | 0.348 |
| YC | 0.387 | 0.348 | 0.426 | 0.208 | 0.328 | |
| YC/CT | 1.000 | 0.876 | 0.780 | 0.613 | 0.941 |
© 2019 by the authors. Licensee MDPI, Basel, Switzerland. This article is an open access article distributed under the terms and conditions of the Creative Commons Attribution (CC BY) license (http://creativecommons.org/licenses/by/4.0/).
Share and Cite
Yu, M.; Yang, D.; Liu, X.; Li, Q.; Wang, G. Potential Impact of a Large-Scale Cascade Reservoir on the Spawning Conditions of Critical Species in the Yangtze River, China. Water 2019, 11, 2027. https://doi.org/10.3390/w11102027
Yu M, Yang D, Liu X, Li Q, Wang G. Potential Impact of a Large-Scale Cascade Reservoir on the Spawning Conditions of Critical Species in the Yangtze River, China. Water. 2019; 11(10):2027. https://doi.org/10.3390/w11102027
Chicago/Turabian StyleYu, Meixiu, Daqing Yang, Xiaolong Liu, Qiongfang Li, and Guoqing Wang. 2019. "Potential Impact of a Large-Scale Cascade Reservoir on the Spawning Conditions of Critical Species in the Yangtze River, China" Water 11, no. 10: 2027. https://doi.org/10.3390/w11102027
APA StyleYu, M., Yang, D., Liu, X., Li, Q., & Wang, G. (2019). Potential Impact of a Large-Scale Cascade Reservoir on the Spawning Conditions of Critical Species in the Yangtze River, China. Water, 11(10), 2027. https://doi.org/10.3390/w11102027