Article

Development of a Heterogeneity Analysis Framework for Collaborative Sponge City Management

1
Department of Hydraulic Engineering, Tsinghua University, Beijing 100084, China
2
School of Biological and Chemical Engineering, Nan Yang Institute of Technology, Nan Yang 473306, China
3
Department of Chemical & Materials Engineering, The University of Auckland, Auckland 1142, New Zealand
4
School of Chemistry and Chemical Engineering, Beijing Institute of Technology, Beijing 100081, China
*
Authors to whom correspondence should be addressed.
Water 2019, 11(10), 1995; https://doi.org/10.3390/w11101995
Submission received: 29 August 2019 / Revised: 19 September 2019 / Accepted: 21 September 2019 / Published: 25 September 2019

Abstract

:
Rapid urbanization, inappropriate urban planning and the changing climate in many countries have resulted in flooding, water shortage and water pollution around the world. Although the sponge city concept has been applied in both macro-scales and micro-scales to address those challenges, research on the heterogeneity of different cities for sponge city construction and the collaborative management between cities is insufficient. Therefore, this paper proposes a multivariate cluster analysis framework and conducts an empirical study using 96 Chinese cities. By considering the local infrastructure, economic development, water resource distribution, water quality and precipitation characteristics in each city, and integrating the principal component analysis and a self-organizing feature mapping network, this paper shows the potential of regional and interregional sponge city collaborative management. This will provide an opportunity for developing a new sponge city management mechanism and will promote the establishment of multi-functional departments for urban flood control and water quality improvement.

1. Introduction

The rapid urbanization and increasingly extreme weather events make urban flood a significant concern in scientific communities around the world [1]. For example, the construction of buildings, roads and grounds have removed the natural rainwater-retaining infrastructures (e.g., woodlands, green spaces, natural lakes and wetlands), created impermeable surfaces, changed their ecological and hydrological characteristics and caused floods [2]. The drastic water resource loss results in water shortage and decreases surface water quality, which is not only detrimental to people’s health but also to the aquatic ecosystem [3,4].
Traditional urban water management mainly focuses on the rapid-draining of rainwater to downstream rather than retaining and reusing it as a resource, and is thus considered unsustainable [5,6]. Therefore, several concepts and theories, such as the Best Management Practices (BMPs), Sustainable Drainage Systems (SuDS), Low Impact Development (LID) and Water Sensitive Urban Design (WSUD) have been developed for sustainable urban water management [7]. Those strategies are useful for reducing runoff and peak flow. However, challenges such as high construction cost, increasing demand for urban land, and low public perceptions hindered their application [8].
The principles and experiences of BMPs, LID and SuDS provided the basis for sponge city construction, which has drawn significant attention since 2010 [9]. A “Sponge city” works in a way that is similar to a sponge; it can absorb water in the event of heavy rainfall by using green measures such as water seepage brick, rainwater garden and sink green space, and can release water in time of drought [10]. As a result, the sponge city could minimize human’s influence on the regional hydrologic cycle, contribute to flood control and promote rainwater utilization.
As a result of the economic growth, urbanization and industrialization, China’s cities face increasingly severe problems that threaten their sustainability. From a government perspective, China’s top-down governmental structure takes advantage of solving urban water challenges. Therefore, the Chinese government launched a nationwide pilot Sponge City program in 2014 to reduce urban water runoff, improve water quality, and mitigate water storage and greenhouse gas emission (GHGs). The government targets to upgrade 20% of its urban areas using the sponge city concept by 2020, and an increase to 80% by 2030 [4]. Accordingly, the Chinese legislations require that all newly planned urban districts, industrial parks, development zones and residential areas should be designed and built in accordance with the new sponge city standards. Moreover, many pilot Sponge City programs have been launched since 2015 to recycle 70% stormwater [11].
The implementation of sponge cities can be divided into macro-scale and micro-scale developments. The macro-scale is the integration of regional natural hydrology systems with anthropic infrastructures, while the micro-scale represents the site-level design such as rain gardens and constructed wetlands. Previous studies have demonstrated the progress, challenges and opportunities of sponge city constructions. For example, Jia et al. [12] documented different technical pathways for sponge city construction, Wang et al. [7] evaluated the public’s perception and willingness to pay for the sponge city, Chan et al. [13] and Wang et al. [10] summarized the effectiveness of implementing sponge city for urban flood control. Many researchers also observed the considerable knowledge gaps in the cost of sustaining a sponge city, and in the quantitative evaluation of sponge city technologies and programs. By using Wuhan city as a case study, Dai et al. [14] recommended that the government should slow down the sponge city construction to catch up with stakeholders’ perception.
Most current studies focus on the application of advanced hydrological technologies in a single city by relying on provincial and national guidelines [15,16]. However, these guidelines only provide general advice. The adaptability of imitating the sponge city plan from another city is under doubt. For example, various conditions, such as the level of runoff, climatic, soil condition and population density might contribute to the sponge city failure [4]. At the same time, the pilot sponge city programs in China mainly focus on the central and southeastern China where the annual precipitation ranged from 410 to 1830 mm, while the western part of the country has been overlooked [11]. Moreover, few current studies focus on the heterogeneity and homogeneity of cities for sponge city design and construction. Therefore, this paper is to develop a framework to explore the heterogeneity between different cities. By using Principal Component Analysis (PCA) and Self-organizing Feature Map (SOM), regional sponge city management strategies could be proposed to address some barriers in current sponge city management.

2. Methodology

2.1. Framework Overview

A systematic framework based on PCA and SOM was developed by considering critical aspects involved in the sponge city construction. The heterogeneity between cities depends on not only their current surface water quality and stormwater management strategies, but also the total amount of locally available water resources, population density and financial ability of the local government. Figure 1 is an overview of the framework, where variations from the natural environment, local infrastructure, economic development, water resource distribution, water quality and precipitation characteristic were considered. Selected indicators were then screened based on their data availability and reliability. PCA was then employed to identify reasons for heterogeneity between cities and to reduce the inputs of SOM for more reliable classification.

2.2. Indicator Selection and Screening

The hydrology, climate, soil characteristics, as well as the urban planning policy are different for cities, while the national laws or regulations may not be applicable to the local context. The inappropriate guidance from the central government to the provincial and local councils might cause problems in planning, design, construction, operation and the evaluation of sponge city projects [4]. For example, the changing climate leads to high-intensity rainfall events in a short time, the climate zone of a city and the ratio of its impervious surface resulted in different water runoff amounts. As a result, cities with larger impervious surfaces have higher flooding risk [10]. In this study, indicators related to the economic, social and environmental development of different cities were selected for the homogeneity analysis. In general, the primary indicators are selected based on the identification of key aspects that might interact with the sponge city consumption [2,5], and the sub-indicators are selected based on data availability and reliability.
Although some indicators are crucial for the heterogeneity determination between cities, they were screened out because of their unavailability for a large number of cities and their low reliability.
For example, surface runoff coefficient is an integrated indicator to evaluate the catchment loss depending on the nature of land surface, slope and rainfall intensity. It is also affected by the degree of soil compaction, vegetation, and depression storage. However, it is not available for most cities as it is currently mainly estimated for small regions. Moreover, the practical approach for urban slope estimate requires a linkage between the results of regional studies and the site-specific assessments, which is also infeasible from the current literature or databases and is thus unreliable.

2.3. PCA

PCA is the linear conversion of a multivariable space into a new subspace, retaining maximum variance from its original space with the least number of dimensions possible [17]. To better understand the heterogeneity between cities, selected indicators for major cities in China (96 in total, based on the Chinese city tier system, name of each city is shown in the result section) were used as inputs for PCA in Matlab. It should be noted that the multiple evaluation indicators affecting the water resource relocation, water quality and urban flooding potential are not comparable in terms of the unit of measurement, data standardization is therefore necessary. Indicators contributing positively to the sponge city construction (such as the length of rainwater pipelines, green coverage of built-up areas, total water resources, etc.) were standardized by using Equation (1), and indicators negatively affecting the sponge city construction (for example the total amount of sewage discharge, the annual precipitation of more than 150 mm days, etc.) were processed by Equation (2).
x i j x m i n x m a x x m i n × 100 %
x m i n x i j x m i n x m a x × 100 %
where, xij is the indicator j for city i, xmax and xmin are the maximum and minimum j in all cities. A general procedure of PCA is described briefly below:
(1)
The raw data matrix is reorganized with each row representing observations from different years and each column representing values of each flow;
(2)
The new data matrix, X, is normalized to have zero mean based on its number of column, m;
(3)
The covariance matrix R is reconstructed based on the following equation, where M is the conjugate transpose operator,
R = 1 m 1 X M X
(4)
Singular-value decomposition (SVD) decomposition is performed on R as per Equation (4), where, Λ is the diagonal matrix of the eigenvalues of R in decreasing numerical order, and V is the matrix of the eigenvectors of R as columns.
R = V Λ V M
(5)
Matrix N is constructed by selecting the first “α” columns of V corresponding to the first principal eigenvalues. It is then used to transform the original space of variables to the reduced dimension subspace:
W = X N
The columns of matrix N are the selected eigenvectors and are called loadings. The W matrix is the reduced subspace of the original variable space; its vectors are called scores.

2.4. SOM

The extraction of principal components from PCA provides the basis for the homogeneity classification. Neural networks are widely used for classification because of their massive parallelism, distributed storage and processing, self-adaptation, high fault tolerance and robustness. There are dozens of different neural networks such as linear neural networks, multi-layer mapping BP networks, radial basis function RBF networks, feedback networks, self-organizing feature mapping networks, and Hopfield networks [18]. Among them, SOM has a strong advantage in clustering [19].
SOM is an unsupervised artificial neural network (ANN) used to produce a low-dimensional (typically two-dimensional), discretized representation of the input space of the training samples [20]. It differs from other artificial neural network methods in that it uses a proximity function to maintain the topological properties of the input space. At the beginning of the training, the input neurons participate in each other’s competitive activities. The neuron node with the largest output is the winner. The winning node has the ability to suppress other competitors and activate its neighboring nodes, and then define all nodes within a radius centered on the winning node and adjust their similar weight matrix [21]. As the training continues, the radius of the winning node will decrease until the winning node itself is included. That is to say, in the initial stage of training, not only the weight of the winning node is adjusted, but also the geometric neighbors in a large area around it are adjusted accordingly [22]. As the training process progresses, the weight matrix associated with the winning output node gets closer to the pattern class it represents. Then, the winner node needs to be fine-tuned to adjust the weight matrix. At the same time, only the nodes with similar topological neighbors are adjusted accordingly.
Based on Matlab “nnstart” toolkit, this research used the self-organizing map neural network to evaluate the heterogeneity of sponge city constructions by using the first ten PCs from the PCA model (reasons explained in Section 3.2). The map size of the SOM was set to be four because a smaller network (i.e., 3 × 3) could not adequately present the regional classification, while there were many similar clusters in an extensive network (5 × 5).

3. Results and Discussion

3.1. Indicator Selection

The sponge city construction is a complex system. To make the indicators scientific, representative, comparable and adaptable, a two-layer indicator system was used and shown in Table 1. It should be noted that each sub-indicator representing precipitation has 12 variables (from January to December) to describe its temporal difference. Therefore, 102 sub-indicators reflecting characteristics regarding the natural environment, economic development, infrastructure construction, water pollutant, water resources and precipitation characteristics were selected for 96 cities. The data used were directly derived from the 2017 China Statistical Yearbook, the China Urban Construction Statistical Yearbook, 2017 China City Statistical Yearbook, China Water Statistics Yearbook 2017 and the China Meteorological Data Network.

3.2. PCA Result

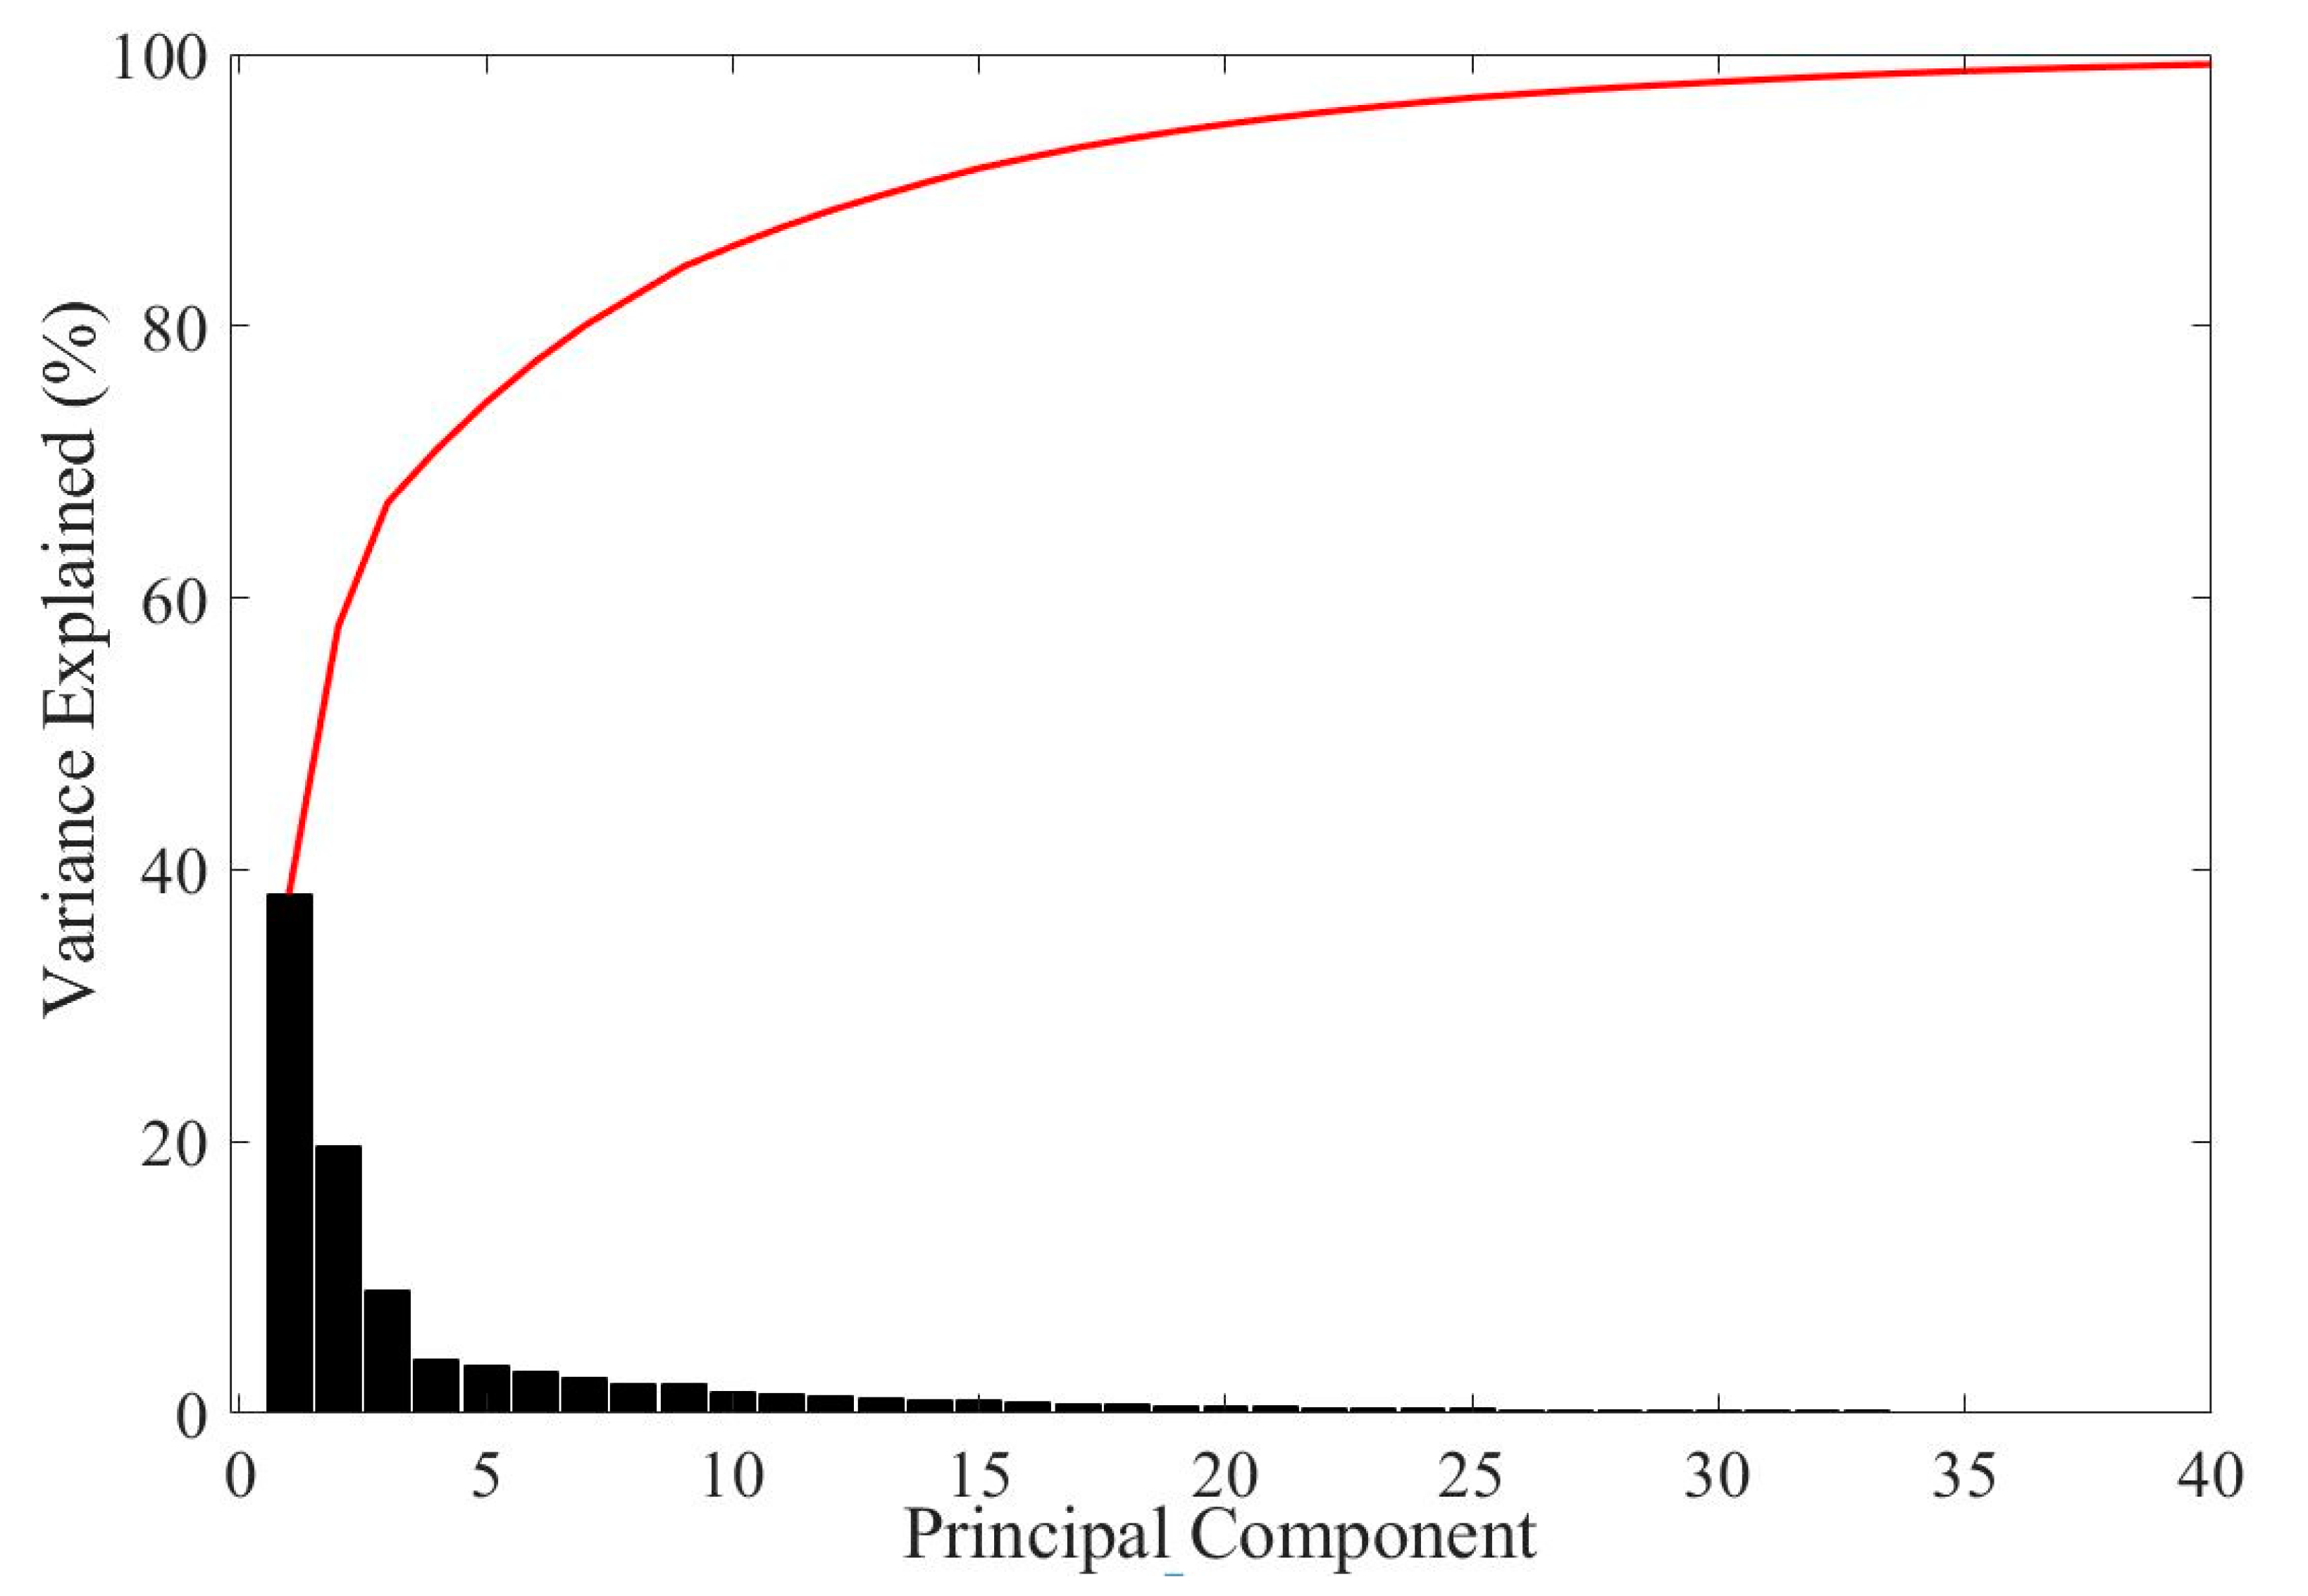
PCA can generate a series of independent and uncorrelated new variables (principal components) by getting rid of the irrationality weight judgment, which can then be used for the comprehensive score evaluation. A Pareto chart with the percentage of variance explained by each principal component is shown in Figure 2. The first two principal components could explain 58% data variations in the indicator system, while the first six principal components explain 75% and the first ten could explain 85% of the total variations. Therefore, the first two principal components in a 2D basis were not able to provide sufficient information for the classification, but were still useful for a quantitative explanation of reasons for the heterogeneity among different cities.
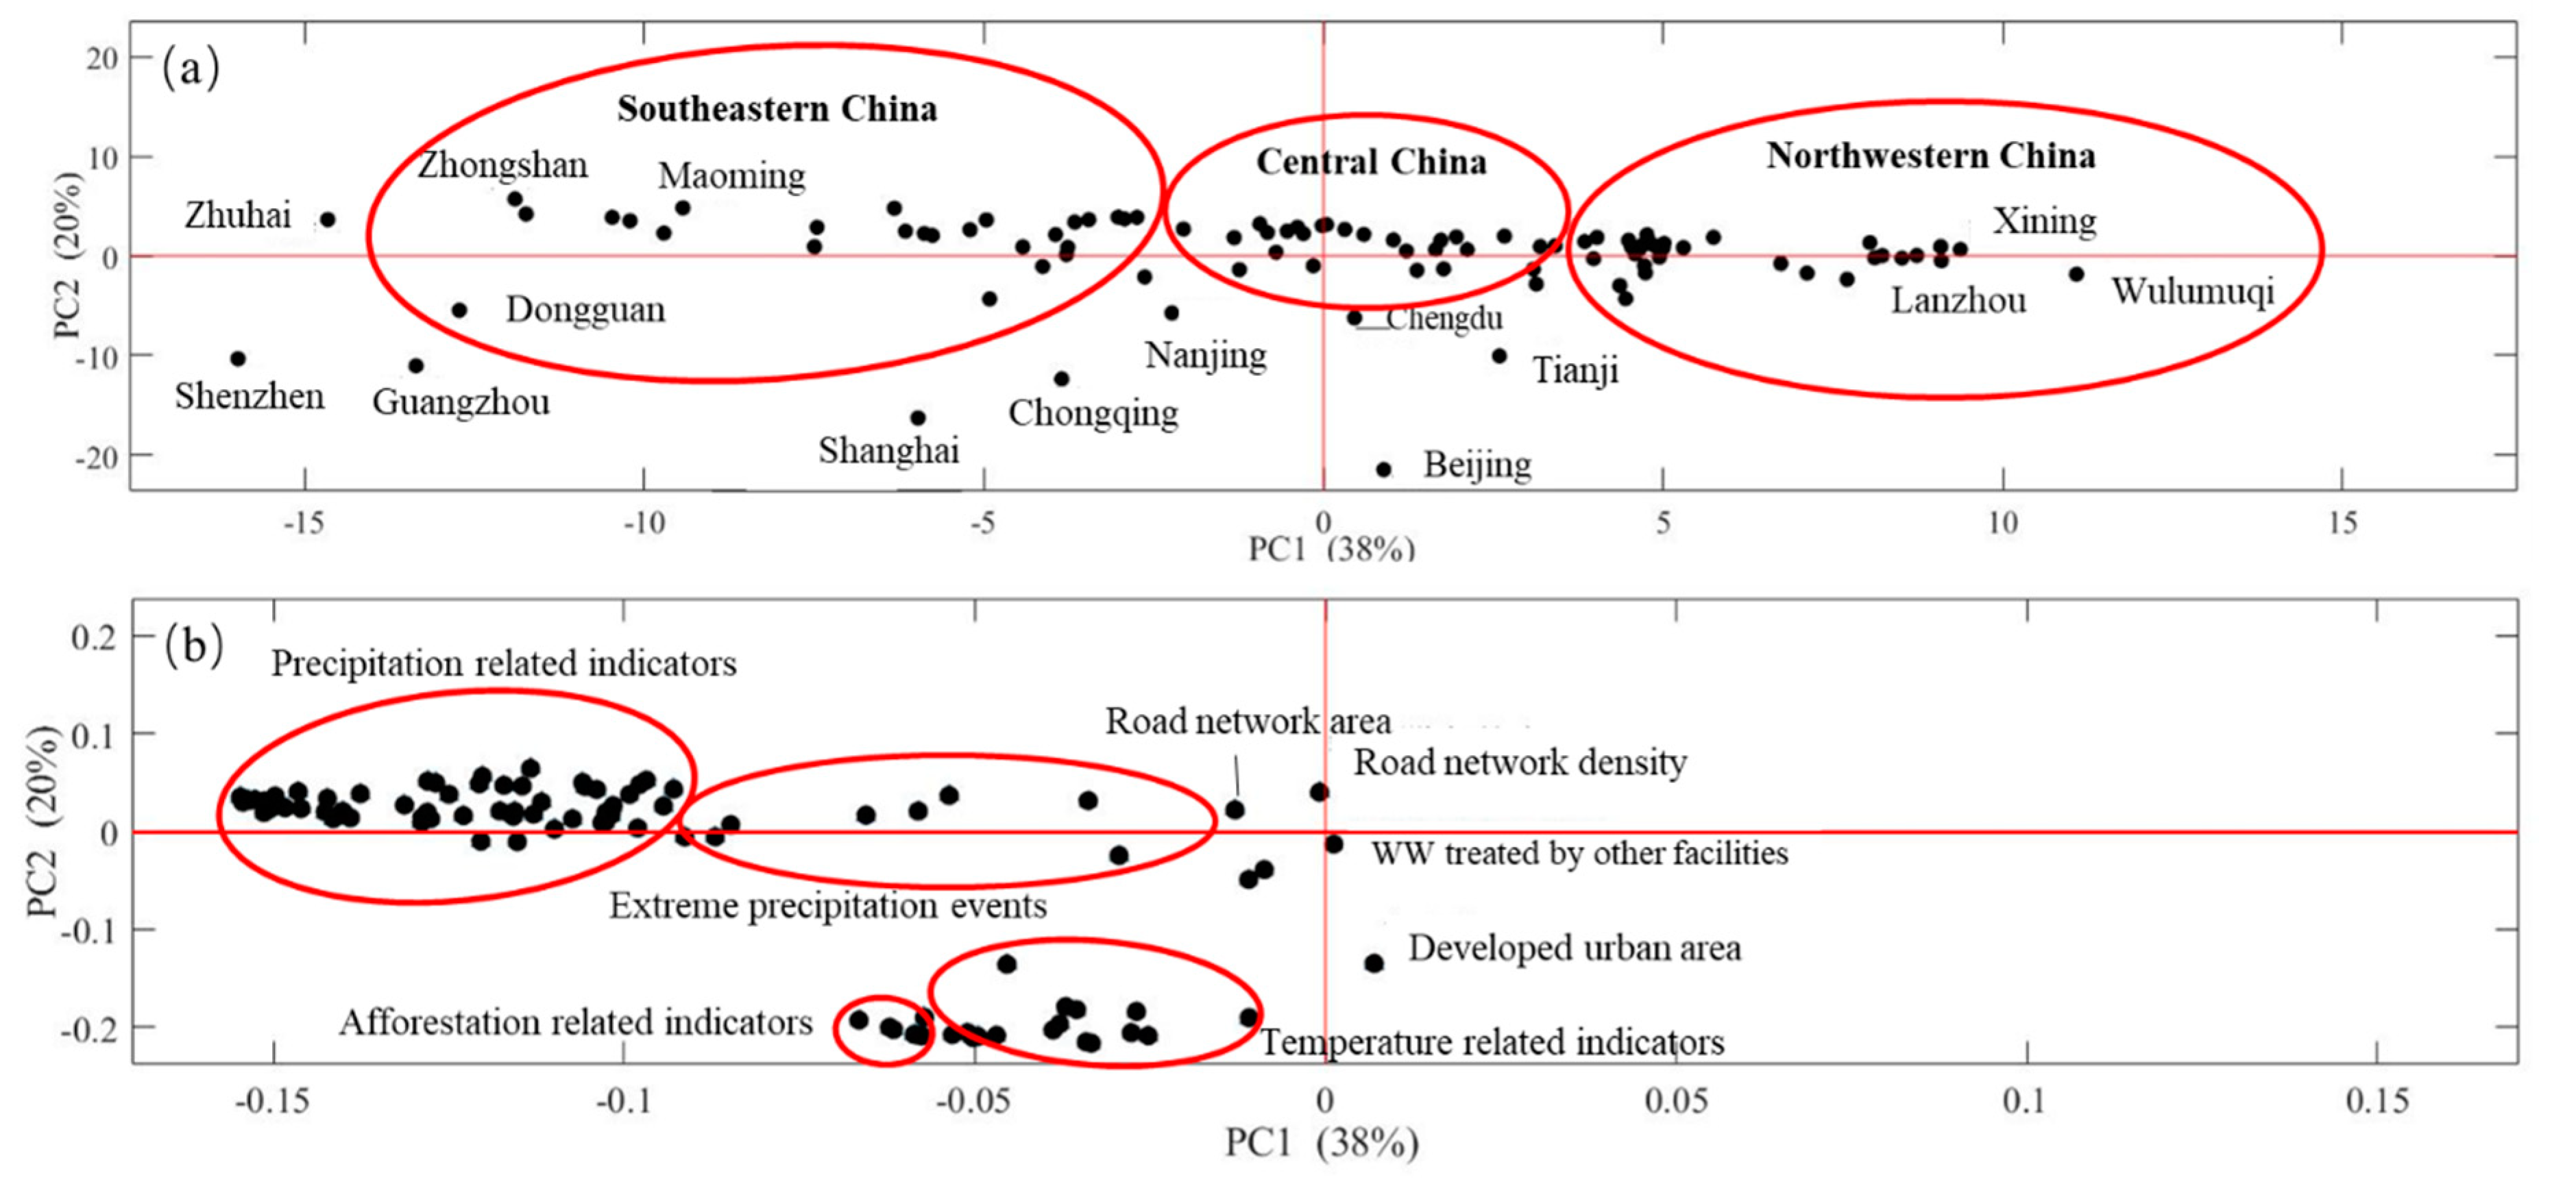
The score and loading plots of PCA are shown in Figure 3. As can be seen from Figure 3a, cities in the southeast and the northwest have similar PC2 (the second principal component) but different PC1 (the first principal component) value, while Shanghai and other southeastern cities have a similar PC1 but different PC2 value. Therefore, the 96 selected cities could be grouped based on their location and are shown as the southeastern, central, northeastern in Figure 3a. Such difference could be explained by combing the score (Figure 3a) and the loading (Figure 3b) plot. In the PCA, loadings (or variables) near the coordinate origin (“X = 0” or “Y = 0”) have a lower influence on the overall heterogeneity. Therefore, the separation of cities from the southeast and the northwest are mainly caused by their precipitation characteristics and developed urban area (i.e., similar to the separation between Shenzhen and Beijing). While the difference between Shanghai and other southeast cities are caused by the urban afforestation area and temperature. During sponge cities construction, intense precipitation and extremes precipitation events will increase the urban flood risk. However, this is less likely to take place in the northwestern, which should be considered during the planning and designing stage. Similarly, the highly urban afforestation ratio and higher temperature make Shanghai more adaptable to heavy rains than Beijing because of its potential lower runoff coefficient, which should also be accounted for during the sponge city construction.

3.3. SOM

The schematic diagram of SOM training is shown in Figure 4, with sub-indicators listed in Table 1 as input. Seven indicators are removed during the model construction because their values for all cities are zero, making the model not able to converge.
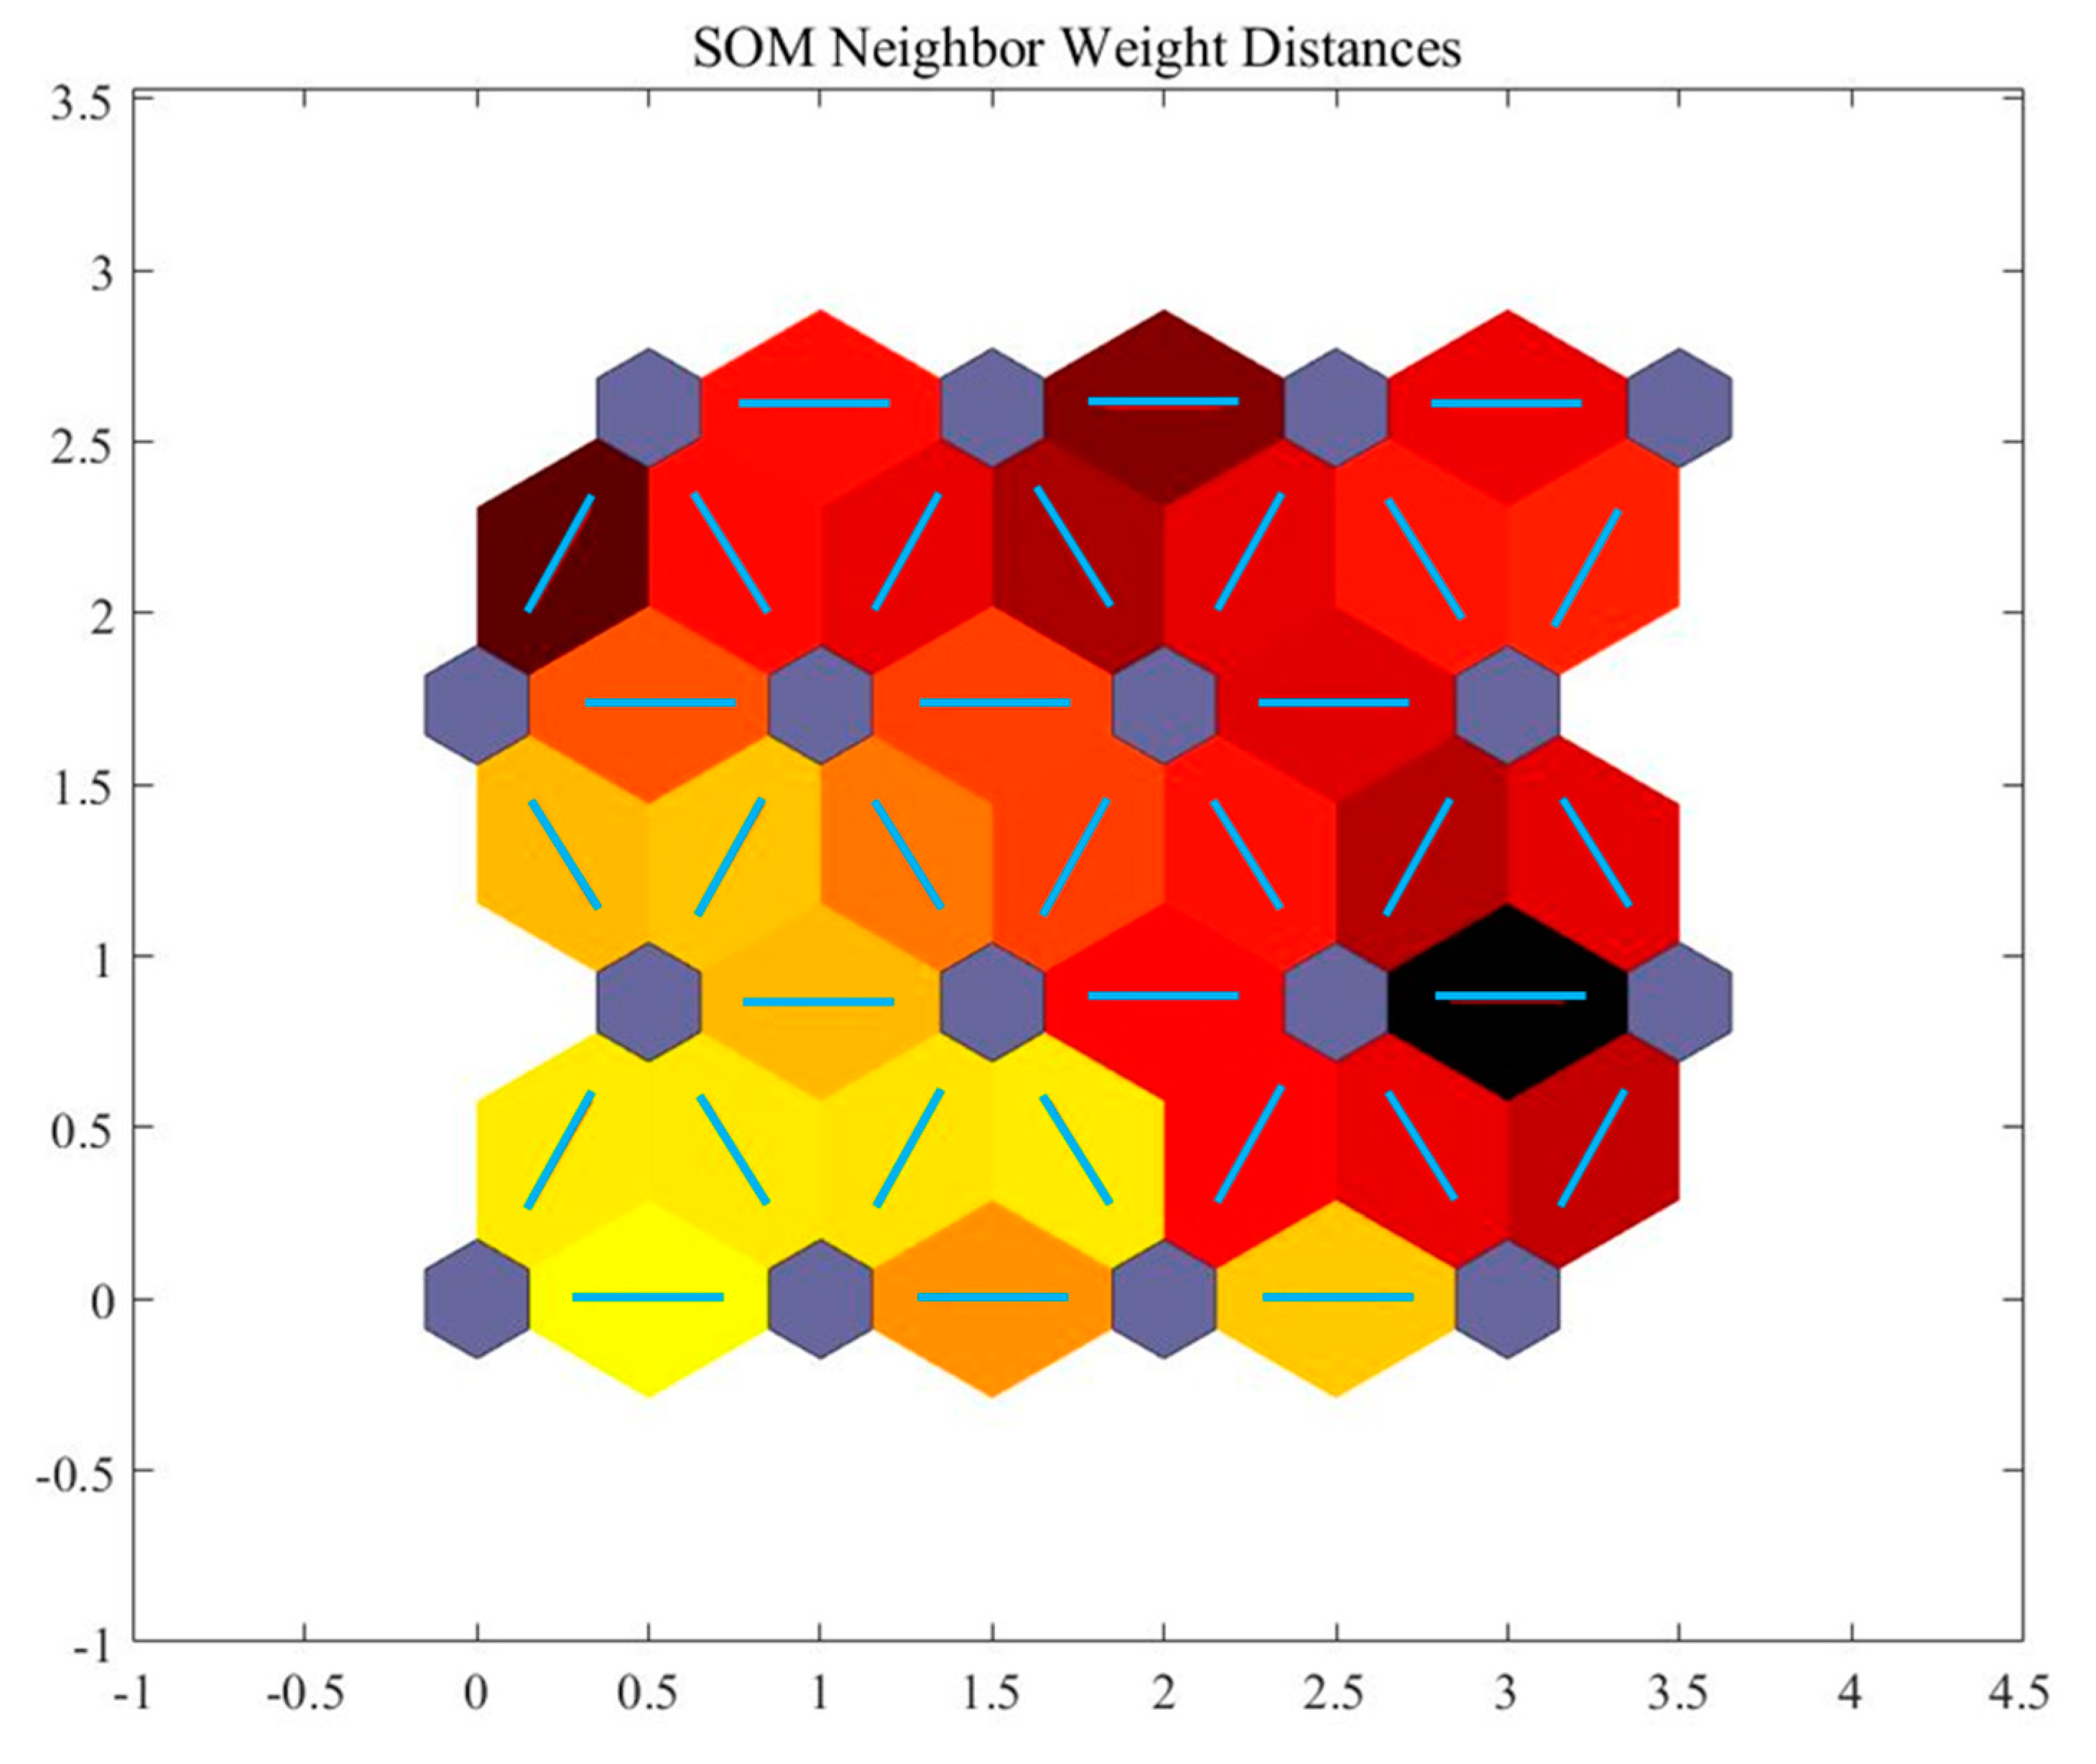
The default topology of the SOM is a hexagon. It classified cities based on their distance between the neighboring neurons. The distance between neighbors is shown in Figure 5. The grey hexagons are the neuron node, the blue lines indicate the connection between the neurons, and the color blocks between them are the weight vectors representing the degree of proximity. In color from yellow to black, the darker the block, the farther it is between the two blocks.
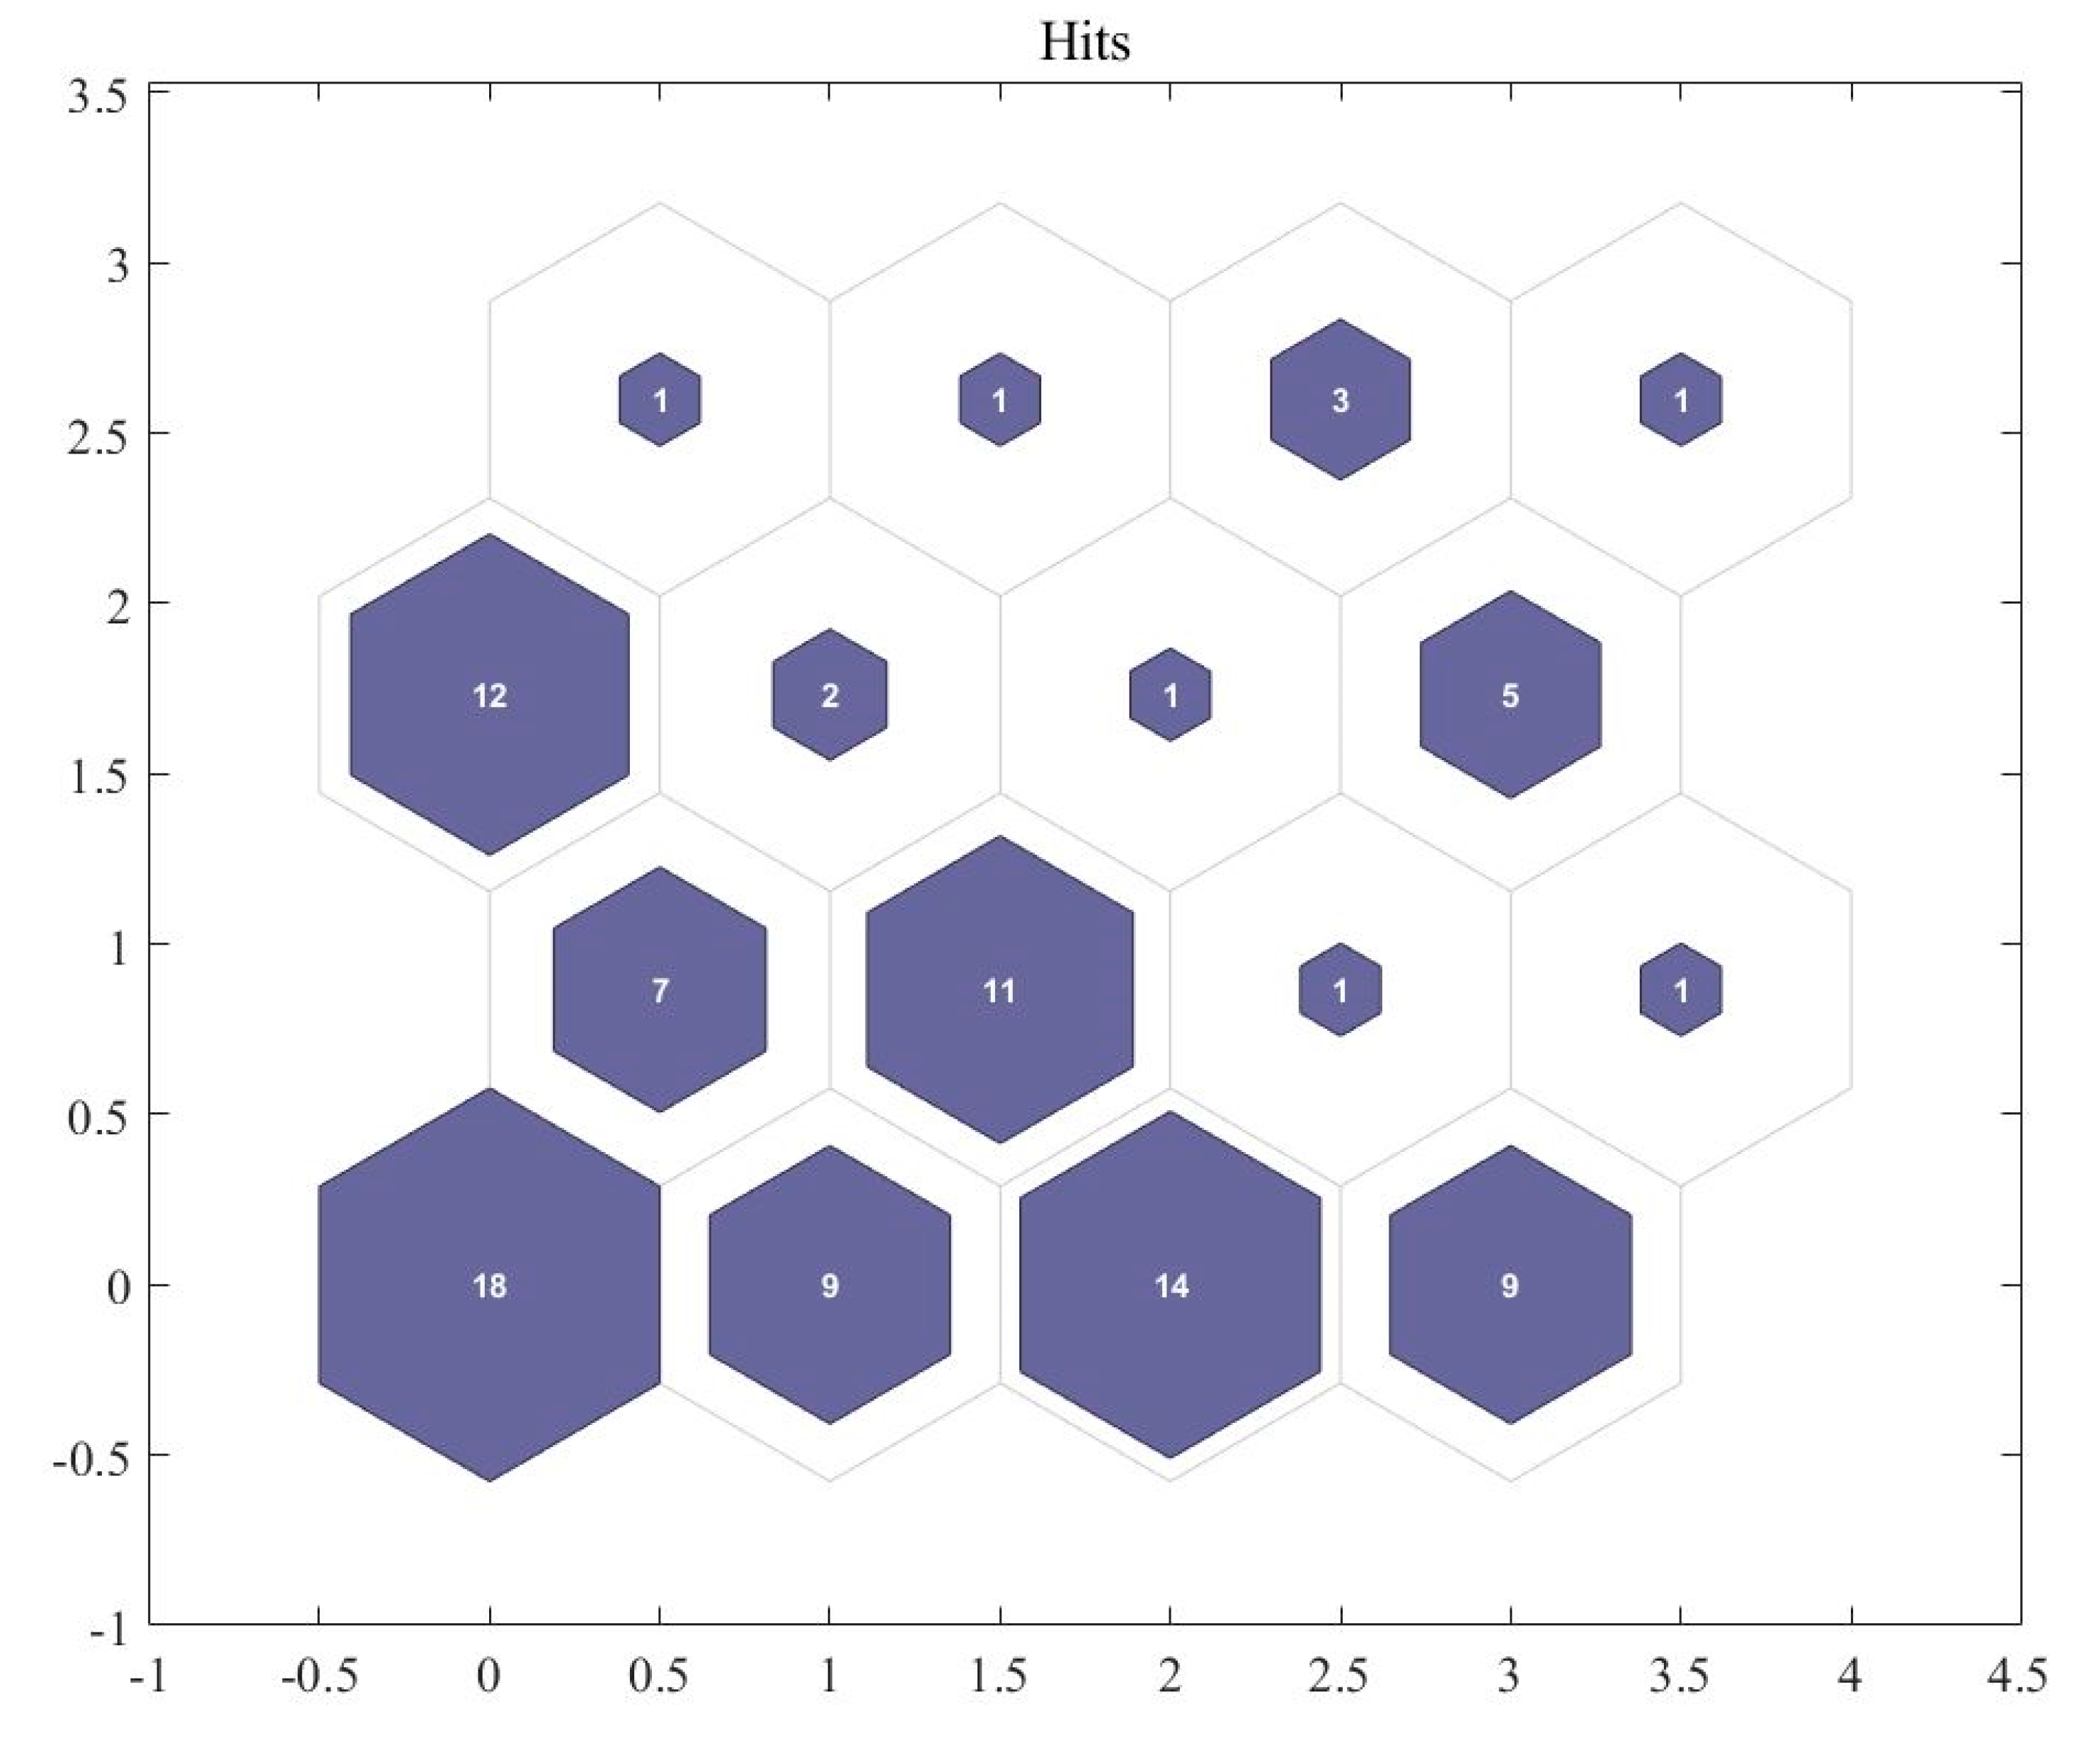
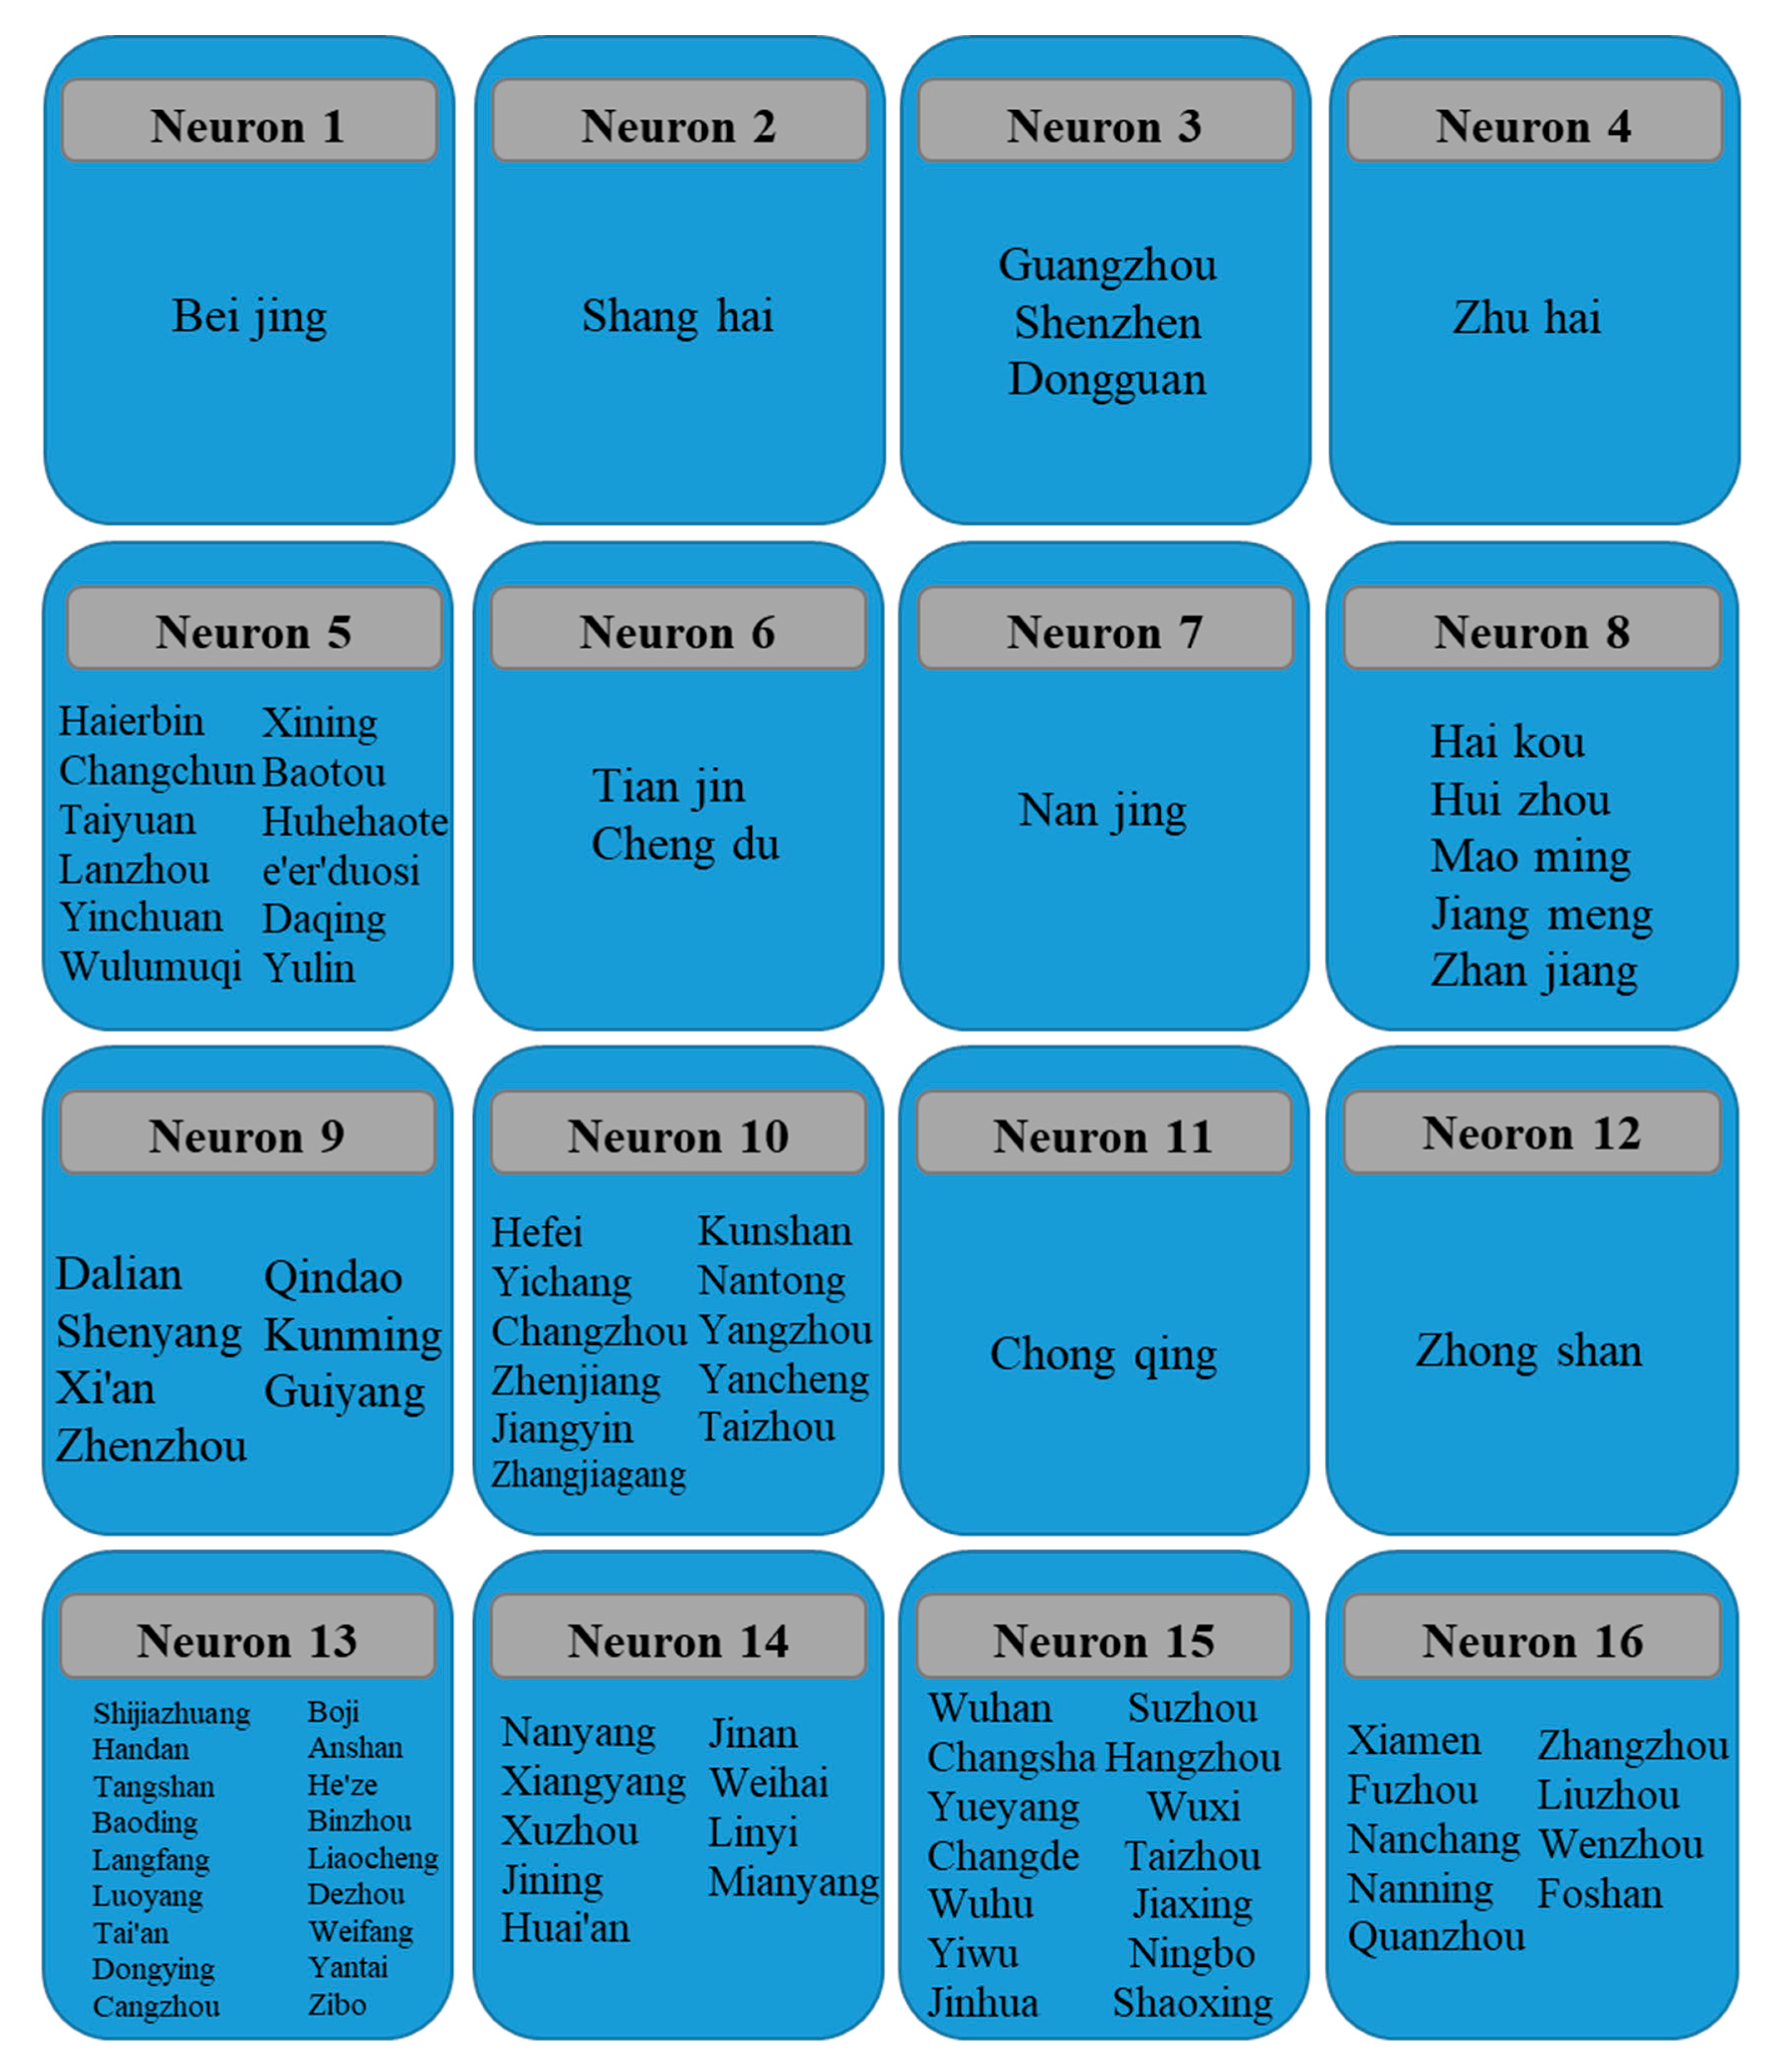
Figure 6 shows the location of neurons and indicates how much training data is associated with each neuron, namely the number of cities being grouped in each cluster. The 4 × 4 topology gives a total number of 16 neurons in this study. The maximum number of hits associated with any neuron is 18, indicates that there are 18 input vectors (cities) in the cluster. By numbering neurons in the SOM cluster from left to right (first row from 1 to 4, and second row from 5 to 8, and so on), classifications of different cities in each neuron are shown in Figure 7.
As can be seen, cities in the same geographical region with similar meteorological conditions could be clustered into the same neuron. For example, Lan zhou, Xi ning and Ying chuan in northwestern china are clustered in Neuron 5 due to their semi-arid continental monsoon climate, characterized by dryness and abundant sunshine. Su zhou, Hang Zhou and Ning Bo in the southwest are wet and rainy in spring, hot and humid in summer, cool and clear in autumn, and dry and cold in winter, together with the similar economic development level and urban infrastructure level, they are clustered in one group in neuro 15. However, the consistency caused by geographical connectivity is not absolute, which might be affected by the number of extreme precipitation events level of social and economic development. For example, Zhuhai and Guangzhou are in the same province but are clustered into different neurons. The combination of SOM and PCA indicates that extreme precipitation events are the main reason for such difference. Similarly, the separation of Shanghai and Nanjing in different neurons are mainly caused by their afforestation ratio and the road network density.
On the other hand, the homogeneity of cities in different geographical regions can be consistent. For example, Nan Yang, Xiang Yang and Xu Zhou (from neuron 14) belong to different provinces (He Nan, Hu Bei and Jiang Su, respectively), but are clustered in the same cluster. This is reasonable not only because of their similar social and economic development level, but also due to the fact that they locate along the Huai River basin, which is a transitional belt between the humid and the semi-arid region in China.
Although with different meteorological conditions, cities at the same administrative level also show certain commonness, just as the score of Zhengzhou and Shenyang city are consistent and stable, which is mainly determined by the complex social and economic interference rather than the meteorological conditions. This indicates that collaborative sponge city management mechanism could be established even for cities in different regions, which is also applicable to other countries and regions that face similar urban water problems.
Overall, the SOM proves that multiple indicators relevant to the natural environment, social economics and the infrastructure of sponge cities show regional clustering features, and could identify the heterogeneity of different cities. Therefore, collaborative management strategies and control elements relevant to the management of sponge cities can be correlated in the future.

4. Implications

Sponge city construction is a complex system in which many variables, such as hydrology, land-use systems, urban development and biodiversity need to be accounted for. Such a large number of variables make the evidence-based research, especially quantitative analysis of the soil composition, plant species and urban surface runoff characteristics crucial [23]. Whilst we acknowledge that indicators and data used in this study are not an exhaustive literature survey, it is a comprehensive one, and their relative scores should be indicative of the heterogeneity of different cities.
However, the regional data supporting sponge city implementation is still limited (e.g., construction and maintenance costs) and thus make stakeholders unwilling to spend money on integrating sponge city solutions [24,25]. For example, green infrastructures can provide multiple benefits besides stormwater management [26]. However, insufficient data make the quantitative evaluation difficult and therefore these benefits are not considered in most previous research [5,27,28], leading to the resistance to change. Such data limitation becomes a hindrance to empowering the public to create change and participate in public-private partnerships supporting sponge city projects [10,11]. Moreover, data uncertainty might be a severe challenge that can risk the failure of the sponge city concept. Such a challenge might be addressed by advanced modelling and data management techniques such as the Bayesian network and the Monte Carlo simulation, which are suggested for future research.
Although major cities in China were used in the case study, the authors believe that urban water challenges are similar for most developing counties. As such, the current work is crucial for sustainable urban water management in more cities regarding regional cooperation. The results suggest that more attention should be paid to the top-level, regional collaborative management strategies during sponge city construction. For example, instead of the administrative boundaries, it is necessary to formulate sponge city management strategies for cities with similar ecological conditions and adjacent geographical spaces, which might be more efficient to improve the efficiency of macro-level sponge city management.
Previous research indicates that local authorities should lead the sponge city construction and be responsible for adaptation actions to be taken in the early stages of policy processes [29]. However, unclear relevant actors within the local authority are also confronted with unclear leadership, with urban planners being potential leaders during sponge city construction. The combination of the planning and implementing stage will help water professionals influence and encourage implementations of sustainable solutions [30], but their early involvement cannot guarantee a change to sustainable alternatives. Therefore, the cooperation and linkage between different administrative departments and stakeholders should be strengthened during the design, construction and management stage. Such cooperation should include not only the related functional departments, but also the linkage of control objectives and management elements. Moreover, up to date information technologies such as artificial intelligence and internet of things should be integrated with the sponge city construction and management, which will help to improve the overall efficiency of sponge city management [31].

5. Conclusions

This study developed a framework to prove the rationality of collaborative sponge city management by cluster analysis. The results show that the 96 selected cities could be clustered into 16 groups by considering their difference among the natural environment, local infrastructure, economics, water resource distribution, water quality and precipitation characteristics. The integration of PCA and SOM could visibly explore the heterogeneity and homogeneity of different cities. The constructed feature maps are topologically ordered, and the spatial location of a neuron corresponds to the features of input pattern and can meaningfully present the characteristics of different cities. It proves that those cities show the characteristics of regional clustering under diverse climatic and ecological conditions. Moreover, it shows the potential of interregional sponge city collaborative strategies even for regions and cities with very distant space. This will provide an opportunity for developing regional and interregional sponge city cooperation mechanism and will promote the establishment of multi-functional departments for sustainable urban water management.

Author Contributions

Conceptualization, Y.F.H., G.Q.W. and B.L.; Methodology, B.L. and Y.F.H.; Software, B.L. and S.L.D.; Validation, S.L.D., Y.F.H. and G.Q.W.; Formal Analysis, B.L. and S.L.D.; Investigation, B.L. and S.L.D.; Resources, Y.F.H. and G.Q.W.; Data Curation, Y.F.H.; Writing-Original Draft Preparation, B.L. and S.L.D.; Writing-Review & Editing, Y.F.H. and G.Q.W.; Visualization, S.L.D.; Supervision, Y.F.H. and G.Q.W.; Project Administration, Y.F.H.; Funding Acquisition, G.Q.W.

Funding

This research was funded by [China Postdoctoral Science Foundation] grant number [2018M641373].

Acknowledgments

The authors would like to acknowledge Wei Yu from The University of Auckland for suggestions on data analysis and visualization.

Conflicts of Interest

The authors declare no conflict of interest.

References

  1. Zevenbergen, C.; Fu, D.; Pathirana, A. Transitioning to Sponge Cities: Challenges and Opportunities to Address Urban Water Problems in China. Water 2018, 10, 1230. [Google Scholar] [CrossRef]
  2. Ren, N.; Wang, Q.; Wang, Q.; Huang, H.; Wang, X. Upgrading to urban water system 3.0 through sponge city construction. Front. Environ. Sci. Eng. 2017, 11, 9. [Google Scholar] [CrossRef]
  3. Li, B.; Udugama, I.A.; Mansouri, S.S.; Yu, W.; Baroutian, S.; Gernaey, K.V.; Young, B. An exploration of barriers for commercializing phosphorus recovery technologies. J. Clean. Prod. 2019, 229, 1342–1354. [Google Scholar] [CrossRef]
  4. Nguyen, T.T.; Ngo, H.H.; Guo, W.; Wang, X.C.; Ren, N.; Li, G.; Ding, J.; Liang, H. Implementation of a specific urban water management—Sponge City. Sci. Total Environ. 2019, 652, 147–162. [Google Scholar] [CrossRef]
  5. Barbosa, A.; Fernandes, J.; David, L. Key issues for sustainable urban stormwater management. Water Res. 2012, 46, 6787–6798. [Google Scholar] [CrossRef] [PubMed]
  6. Chen, Y.; Samuelson, H.W.; Tong, Z. Integrated design workflow and a new tool for urban rainwater management. J. Environ. Manag. 2016, 180, 45–51. [Google Scholar] [CrossRef] [PubMed] [Green Version]
  7. Wang, Y.T.; Sun, M.X.; Song, B.S. Public perceptions of and willingness to pay for sponge city initiatives in China. Resour. Conserv. Recycl. 2017, 122, 11–20. [Google Scholar] [CrossRef]
  8. Filatova, T. Market-based instruments for flood risk management: A review of theory, practice and perspectives for climate adaptation policy. Environ. Sci. Policy 2014, 37, 227–242. [Google Scholar] [CrossRef]
  9. Ellis, J.B.; Lundy, L. Implementing sustainable drainage systems for urban surface water management within the regulatory framework in England and Wales. J. Environ. Manag. 2016, 183, 630–636. [Google Scholar] [CrossRef] [PubMed]
  10. Wang, H.; Mei, C.; Liu, J.; Shao, W. A new strategy for integrated urban water management in China: Sponge city. Sci. China Technol. Sci. 2018, 61, 317–329. [Google Scholar] [CrossRef]
  11. Li, H.; Ding, L.; Ren, M.; Li, C.; Wang, H. Sponge City Construction in China: A Survey of the Challenges and Opportunities. Water 2017, 9, 594. [Google Scholar] [CrossRef]
  12. Jia, H.; Wang, Z.; Zhen, X.; Clar, M.; Yu, S.L. China’s sponge city construction: A discussion on technical approaches. Front. Environ. Sci. Eng. 2017, 11, 18. [Google Scholar] [CrossRef]
  13. Chan, F.K.S.; Griffiths, J.A.; Higgitt, D.; Xu, S.; Zhu, F.; Tang, Y.-T.; Xu, Y.; Thorne, C.R. “Sponge City” in China—A breakthrough of planning and flood risk management in the urban context. Land Use Policy 2018, 76, 772–778. [Google Scholar] [CrossRef]
  14. Dai, L.; van Rijswick, H.F.M.W.; Driessen, P.P.J.; Keessen, A.M. Governance of the Sponge City Programme in China with Wuhan as a case study. Int. J. Water Resour. Dev. 2018, 34, 578–596. [Google Scholar] [CrossRef]
  15. Hering, J.G.; Waite, T.D.; Luthy, R.G.; Drewes, J.E.; Sedlak, D.L. A Changing Framework for Urban Water Systems. Environ. Sci. Technol. 2013, 47, 10721–10726. [Google Scholar] [CrossRef] [PubMed]
  16. Mei, C.; Liu, J.; Wang, H.; Yang, Z.; Ding, X.; Shao, W. Integrated assessments of green infrastructure for flood mitigation to support robust decision-making for sponge city construction in an urbanized watershed. Sci. Total Environ. 2018, 639, 1394–1407. [Google Scholar] [CrossRef] [PubMed]
  17. Li, B.; Huang, H.M.; Boiarkina, I.; Yu, W.; Huang, Y.F.; Wang, G.Q.; Young, B.R. Phosphorus recovery through struvite crystallisation: Recent developments in the understanding of operational factors. J. Environ. Manag. 2019, 248, 109254. [Google Scholar] [CrossRef]
  18. Qazi, A.; Fayaz, H.; Wadi, A.; Raj, R.G.; Rahim, N.; Khan, W.A. The artificial neural network for solar radiation prediction and designing solar systems: A systematic literature review. J. Clean. Prod. 2015, 104, 1–12. [Google Scholar] [CrossRef]
  19. Astel, A.; Tsakovski, S.; Barbieri, P.; Simeonov, V. Comparison of self-organizing maps classification approach with cluster and principal components analysis for large environmental data sets. Water Res. 2007, 41, 4566–4578. [Google Scholar] [CrossRef]
  20. Kalteh, A.; Hjorth, P.; Berndtsson, R. Review of the self-organizing map (SOM) approach in water resources: Analysis, modelling and application. Environ. Model. Softw. 2008, 23, 835–845. [Google Scholar] [CrossRef]
  21. Tsai, W.-P.; Huang, S.-P.; Cheng, S.-T.; Shao, K.-T.; Chang, F.-J. A data-mining framework for exploring the multi-relation between fish species and water quality through self-organizing map. Sci. Total Environ. 2017, 579, 474–483. [Google Scholar] [CrossRef] [PubMed]
  22. Nguyen, T.T.; Kawamura, A.; Tong, T.N.; Nakagawa, N.; Amaguchi, H.; Gilbuena, R. Clustering spatio–seasonal hydrogeochemical data using self-organizing maps for groundwater quality assessment in the Red River Delta, Vietnam. J. Hydrol. 2015, 522, 661–673. [Google Scholar] [CrossRef]
  23. Xia, J.; Zhang, Y.; Xiong, L.; He, S.; Wang, L.; Yu, Z. Opportunities and challenges of the Sponge City construction related to urban water issues in China. Sci. China Earth Sci. 2017, 60, 652–658. [Google Scholar] [CrossRef]
  24. Chaffin, B.C.; Shuster, W.D.; Garmestani, A.S.; Furio, B.; Albro, S.L.; Gardiner, M.; Spring, M.; Green, O.O. A tale of two rain gardens: Barriers and bridges to adaptive management of urban stormwater in Cleveland, Ohio. J. Environ. Manag. 2016, 183, 431–441. [Google Scholar] [CrossRef] [PubMed]
  25. Dhakal, K.P.; Chevalier, L.R. Managing urban stormwater for urban sustainability: Barriers and policy solutions for green infrastructure application. J. Environ. Manag. 2017, 203, 171–181. [Google Scholar] [CrossRef]
  26. Jiang, Y.; Zevenbergen, C.; Ma, Y. Urban pluvial flooding and stormwater management: A contemporary review of China’s challenges and “sponge cities” strategy. Environ. Sci. Policy 2018, 80, 132–143. [Google Scholar] [CrossRef]
  27. Porse, E.C. Stormwater Governance and Future Cities. Water 2013, 5, 29–52. [Google Scholar] [CrossRef] [Green Version]
  28. Prosser, T.; Morison, P.J.; Coleman, R.A. Integrating stormwater management to restore a stream: Perspectives from a waterway management authority. Freshw. Sci. 2015, 34, 1186–1194. [Google Scholar] [CrossRef]
  29. Kuller, M.; Bach, P.M.; Roberts, S.; Browne, D.; Deletic, A. A planning-support tool for spatial suitability assessment of green urban stormwater infrastructure. Sci. Total Environ. 2019, 686, 856–868. [Google Scholar] [CrossRef]
  30. Qiao, X.-J.; Kristoffersson, A.; Randrup, T.B. Challenges to implementing urban sustainable stormwater management from a governance perspective: A literature review. J. Clean. Prod. 2018, 196, 943–952. [Google Scholar] [CrossRef]
  31. Zhang, C.; He, M.; Zhang, Y. Urban Sustainable Development Based on the Framework of Sponge City: 71 Case Studies in China. Sustainability 2019, 11, 1544. [Google Scholar] [CrossRef]
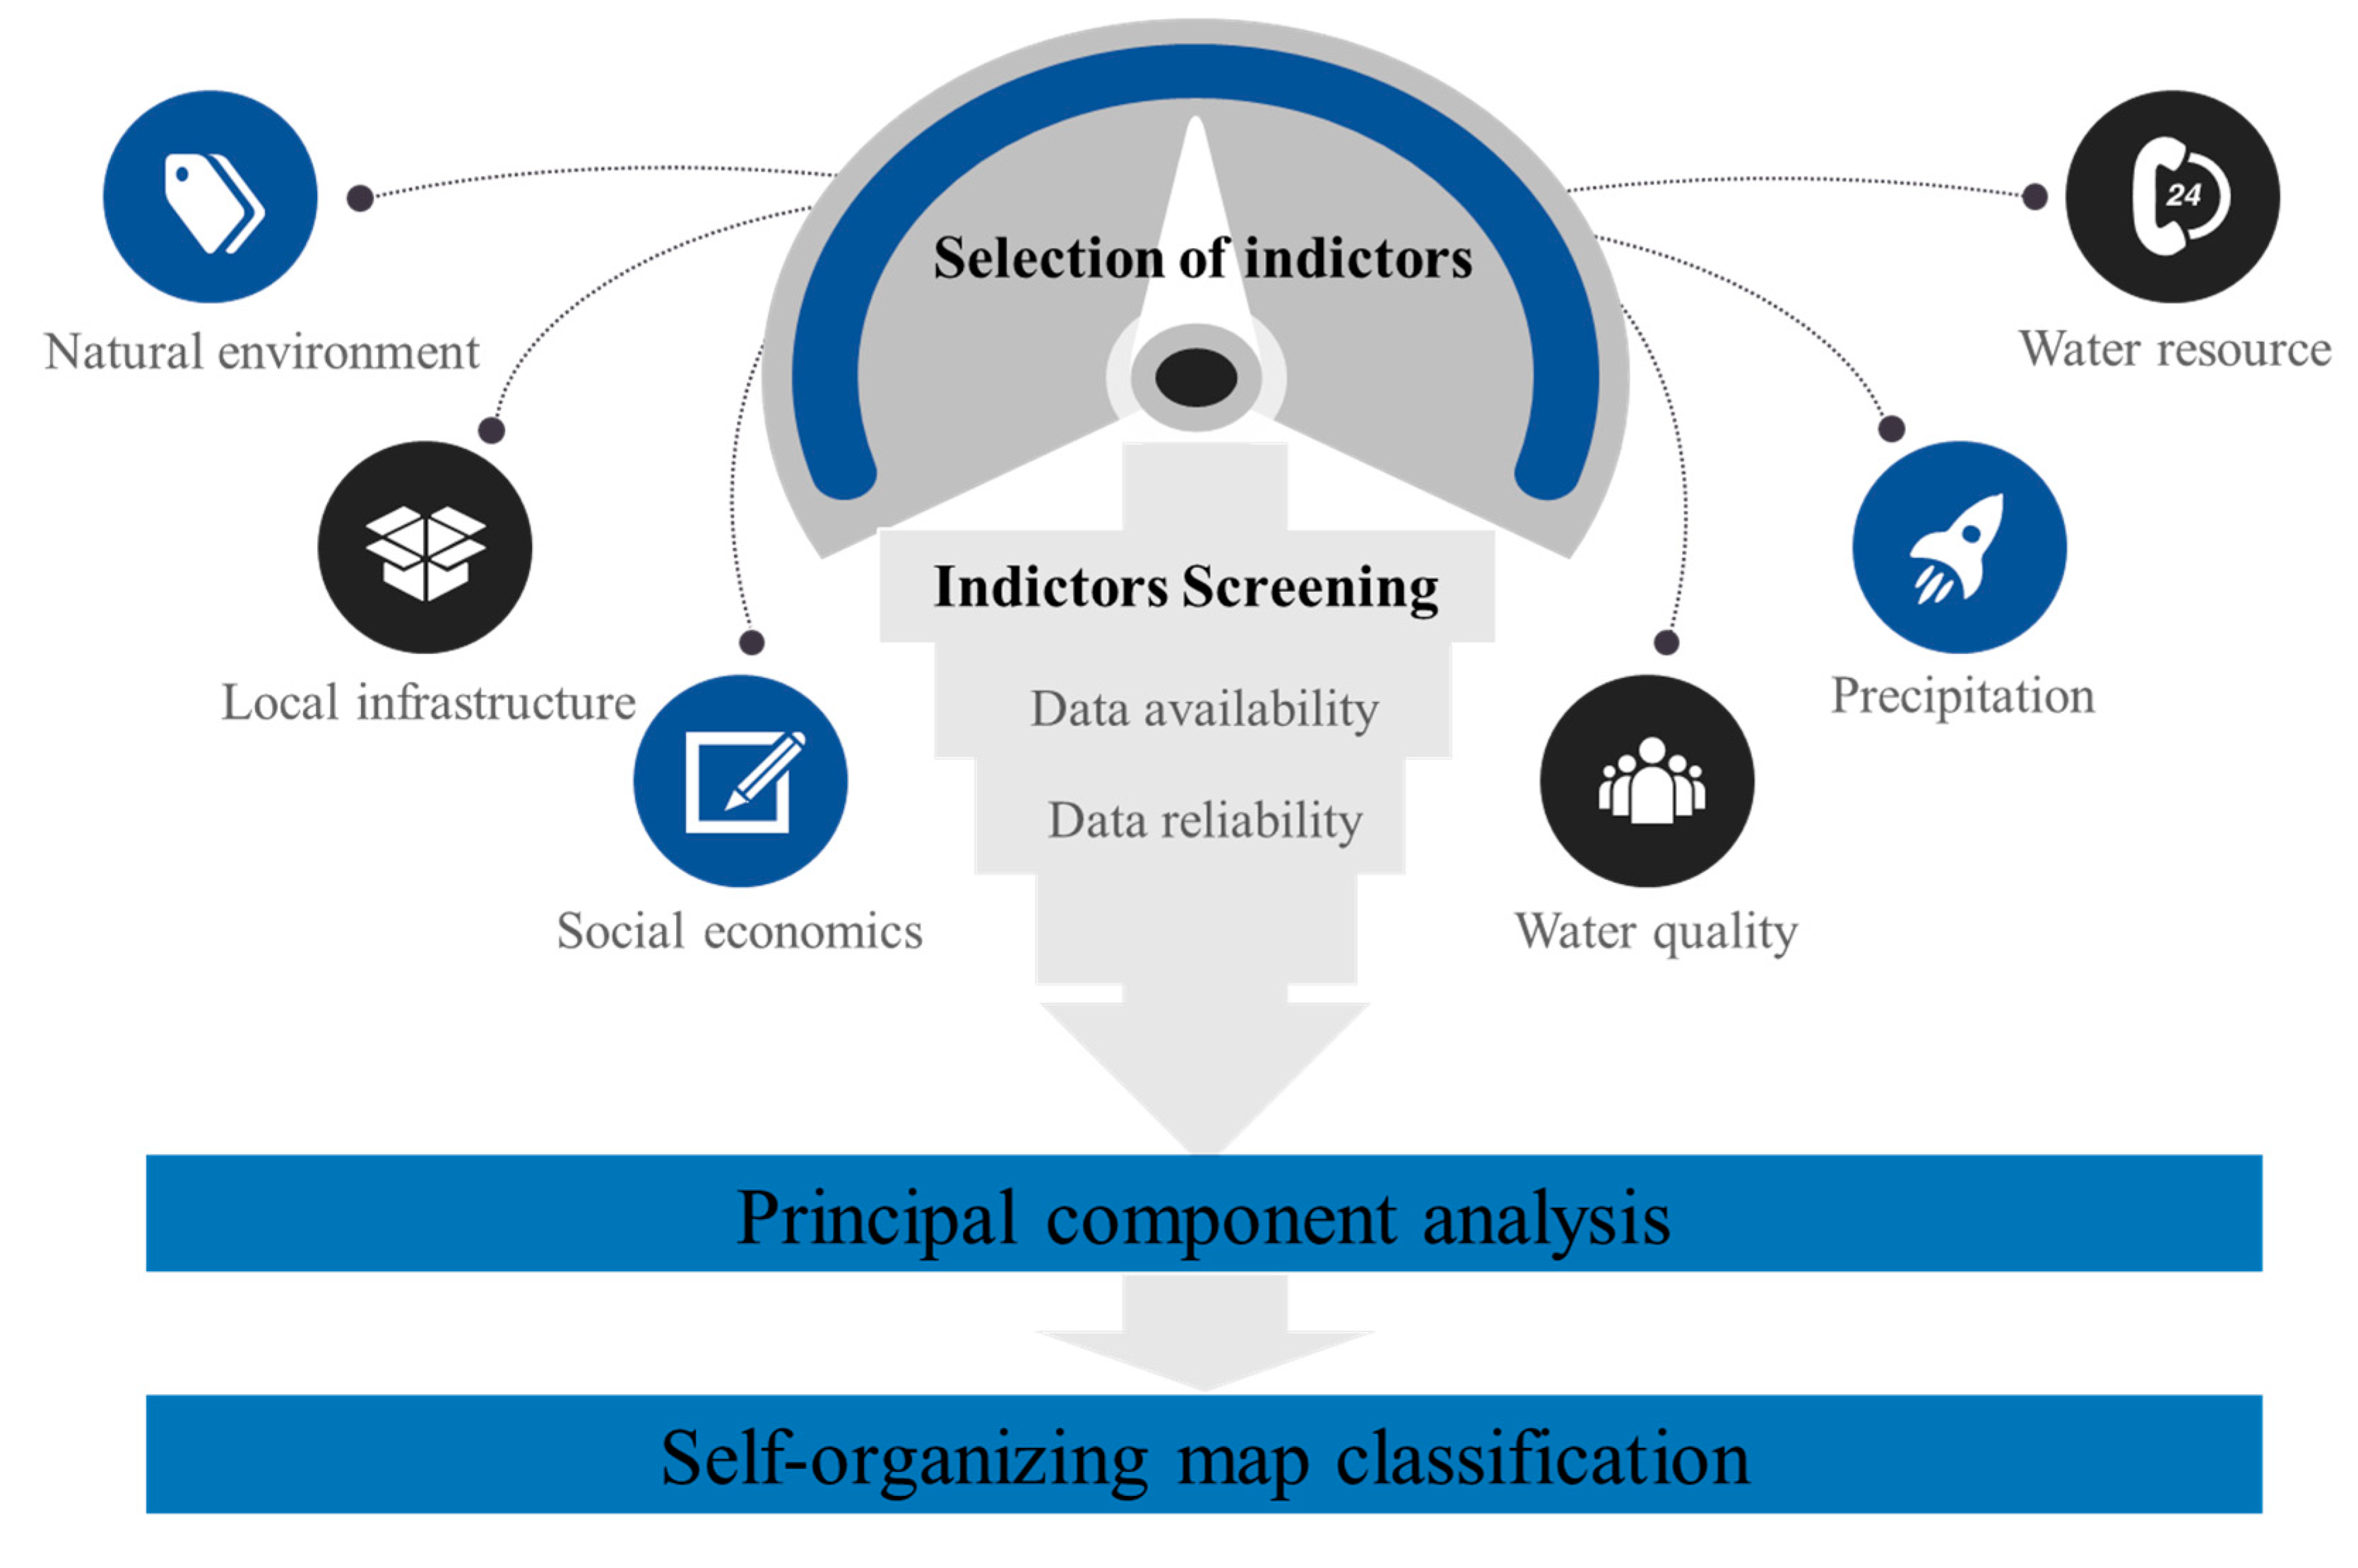
Figure 1. Proposed sponge city management framework.
Water 11 01995 g001
Figure 2. Percentage variance explained by different principal components.
Water 11 01995 g002
Figure 3. Principle component analysis (PCA) score (a) and loading (b) plots.
Water 11 01995 g003
Figure 4. Schematic diagram of the Self-organizing Feature Map (SOM) training model.
Water 11 01995 g004
Figure 5. Weight distance map between SOM neighboring neurons.
Water 11 01995 g005
Figure 6. Result of SOM clustering.
Water 11 01995 g006
Figure 7. SOM cluster for different cities.
Water 11 01995 g007
Table 1. Index system for heterogeneity analysis.
Primary IndicatorSub IndicatorPrimary IndicatorSub Indicator
Natural environmentUrban afforestation areaSocial developmentGDP per captia
Urban afforestation in parksUrban area
Afforestation area in DAUrban population
Afforestation ratio in DACBD area
InfrastructureRoad network density in DACBD population
Road area in DAArea of developed area
Drainage density in DAUrban temporary population
Length of sewage pipes Water resourcesTotal water supply
Length of rainwater pipes Domestic water usage
Length of combined pipesTotal water resources
Number of WWTPPrecipitationMean monthly rainfall
Capacity of WWTPMean monthly temperature
Capacity of other facilitiesMaximum one day rainfall
Water pollutantTotal WW dischargedNDR larger than 10 mm
Total WW treated by WWTP NDR larger than 50 mm
WW treated by other facilitiesNDR larger than 100 mm
Amount of sewage produced NDR larger than 150 mm
Amount of sewage treated
DA: Developed area, WWTP: Wastewater treatment plant, WW: Wastewater, NDR: Number of days with rainfalls.