Economic Evaluation of Adaptation Pathways for an Urban Drainage System Experiencing Deep Uncertainty


Abstract
:1. Introduction
2. Materials and Methods
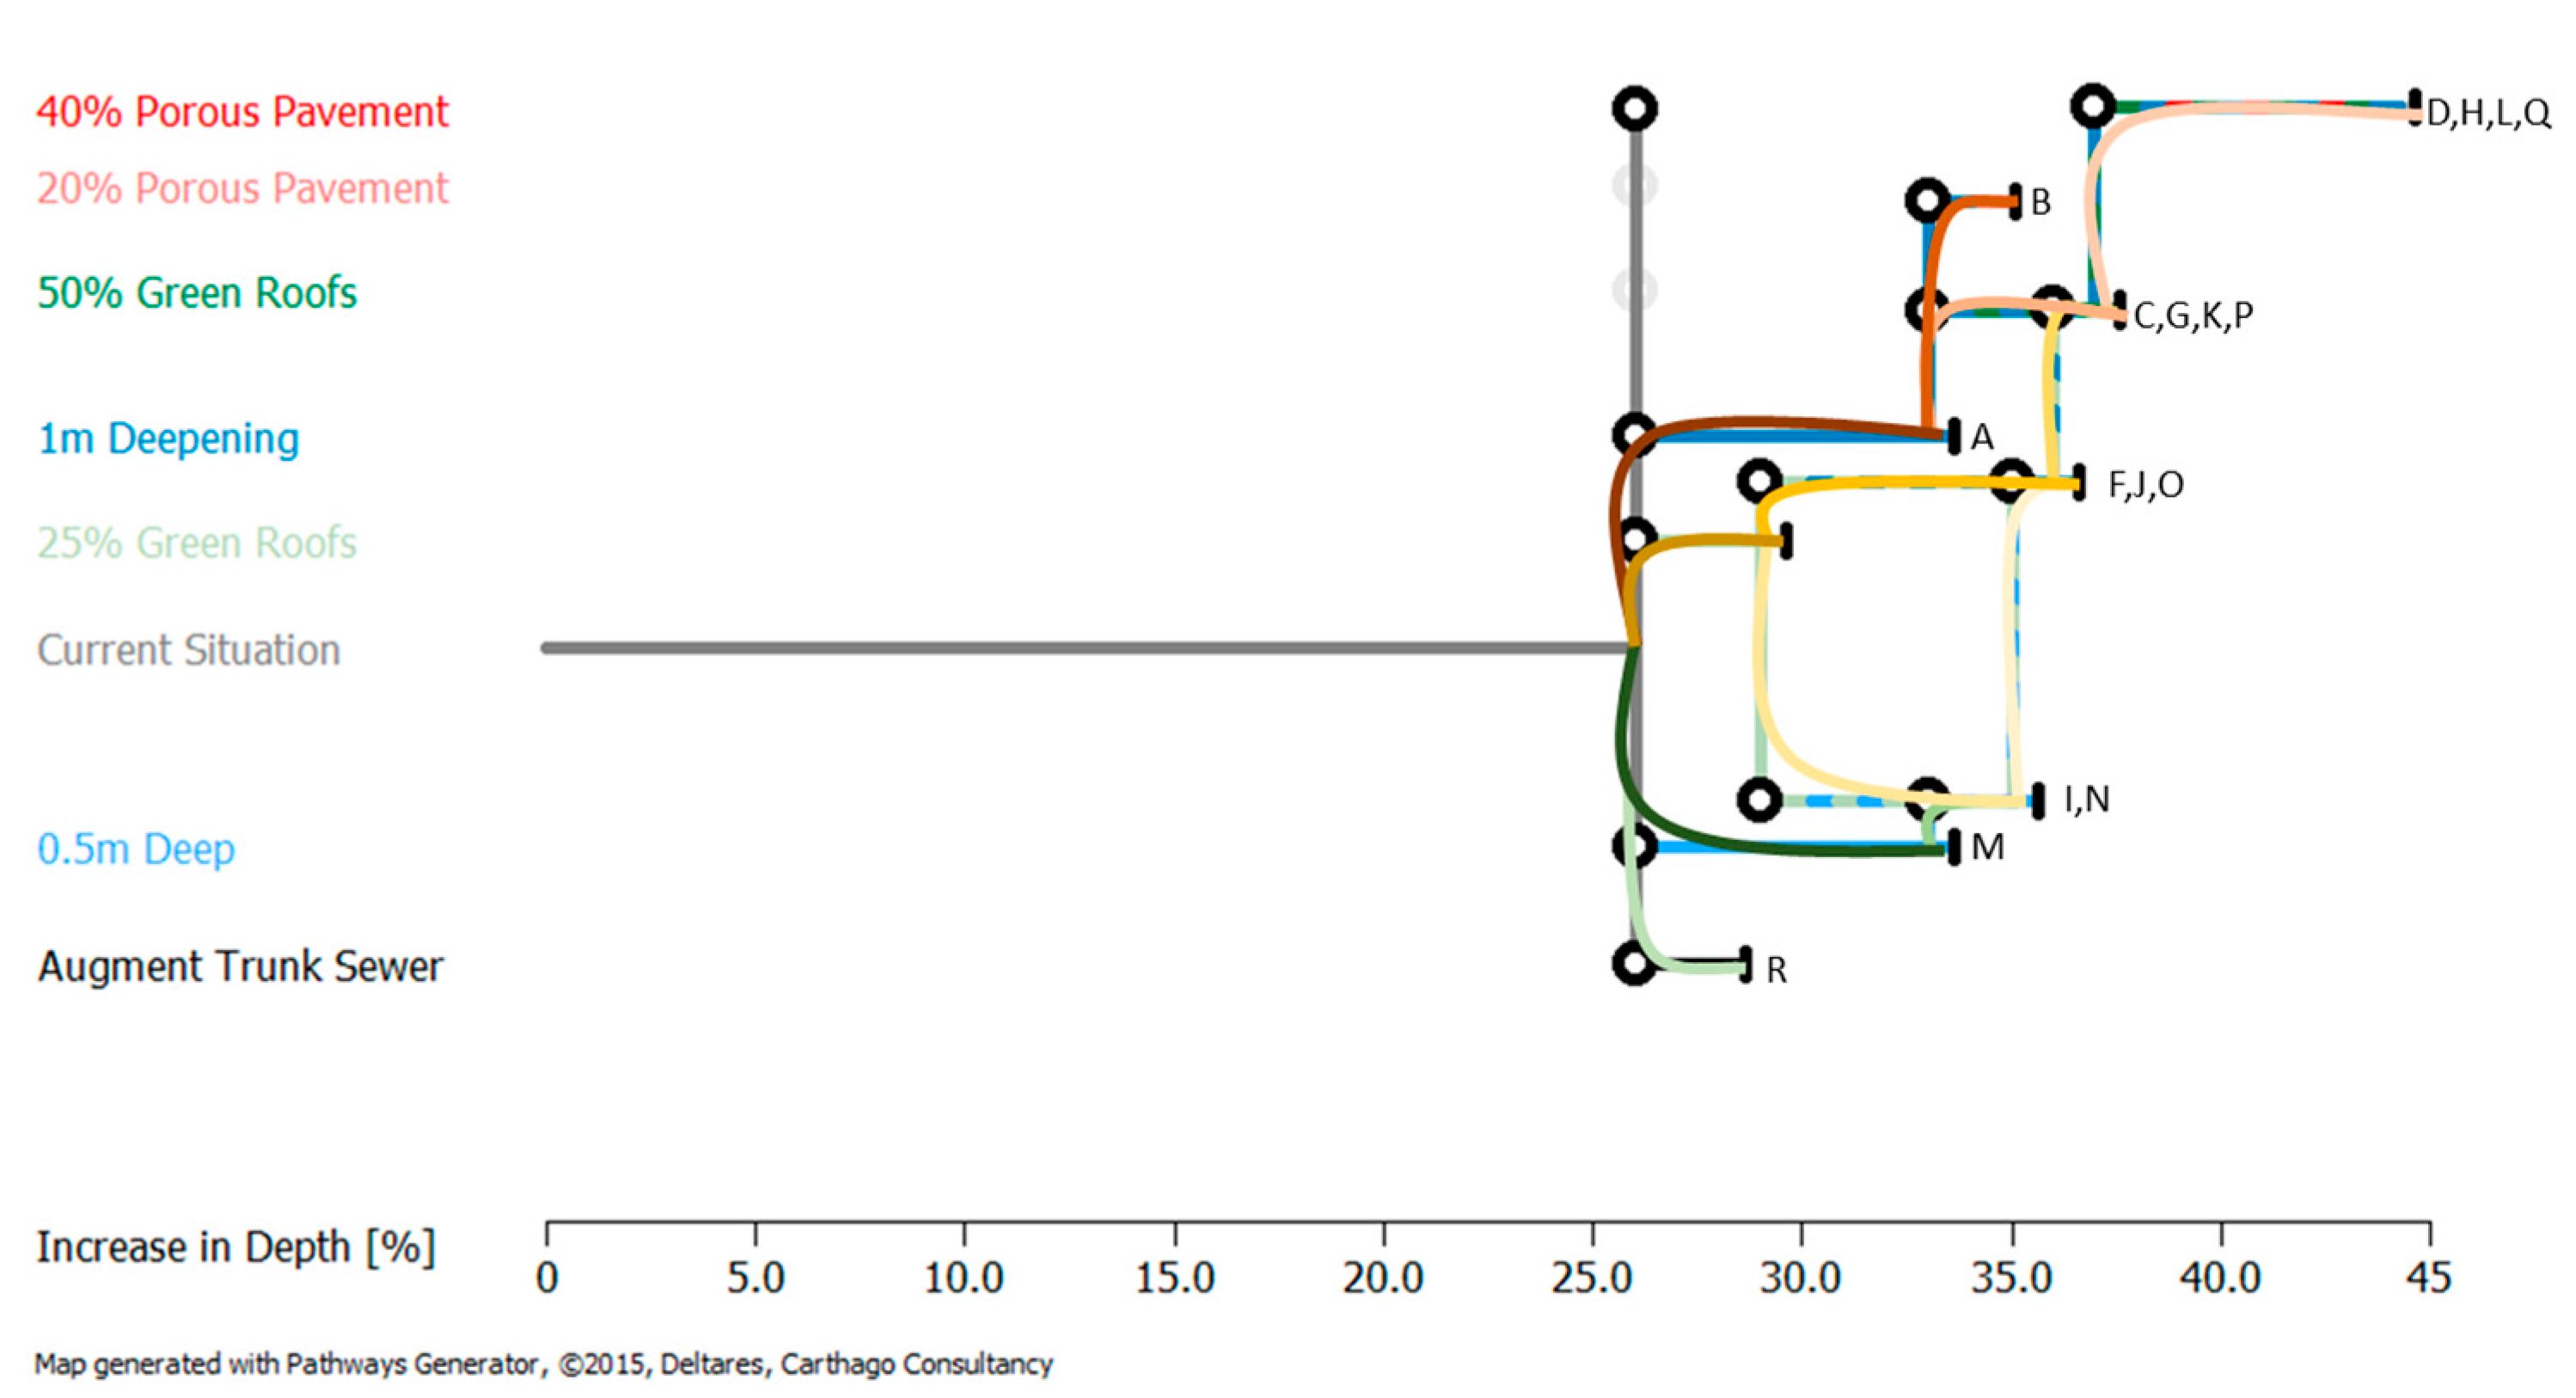
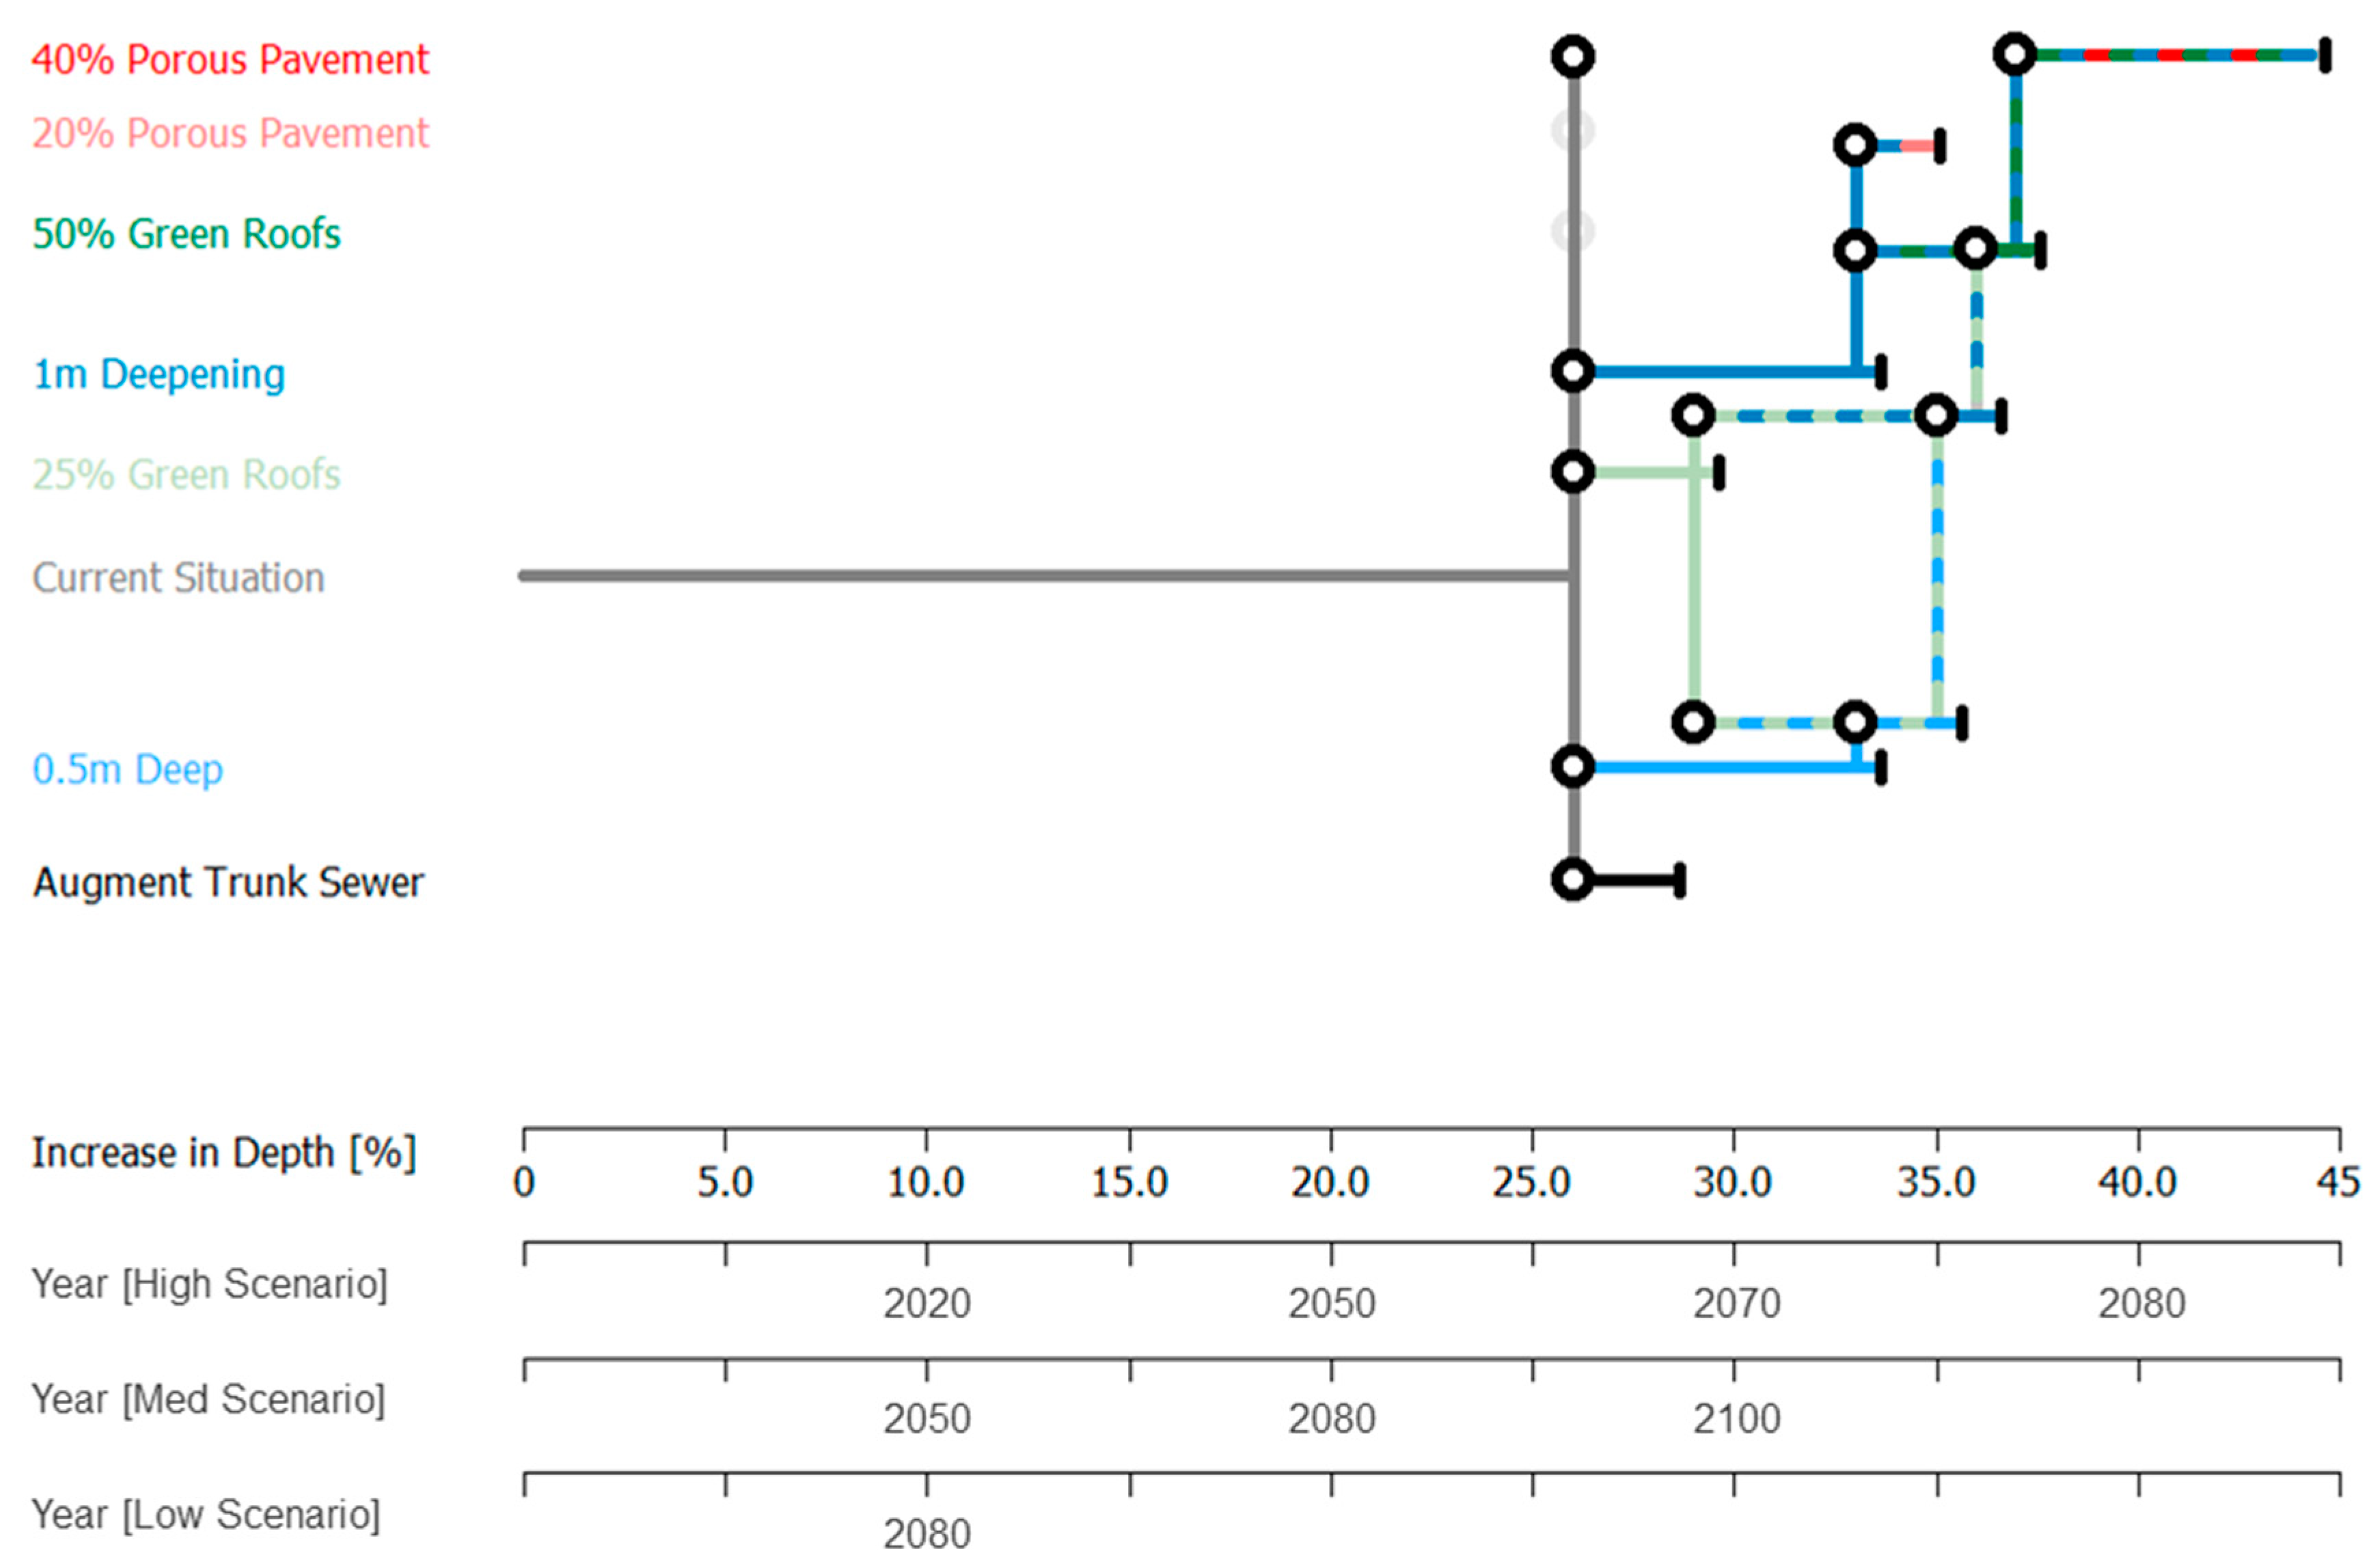
2.1. Adaptation Pathways
2.2. Framework for the Economic Assessment of Pathways
Flood Protection Benefits
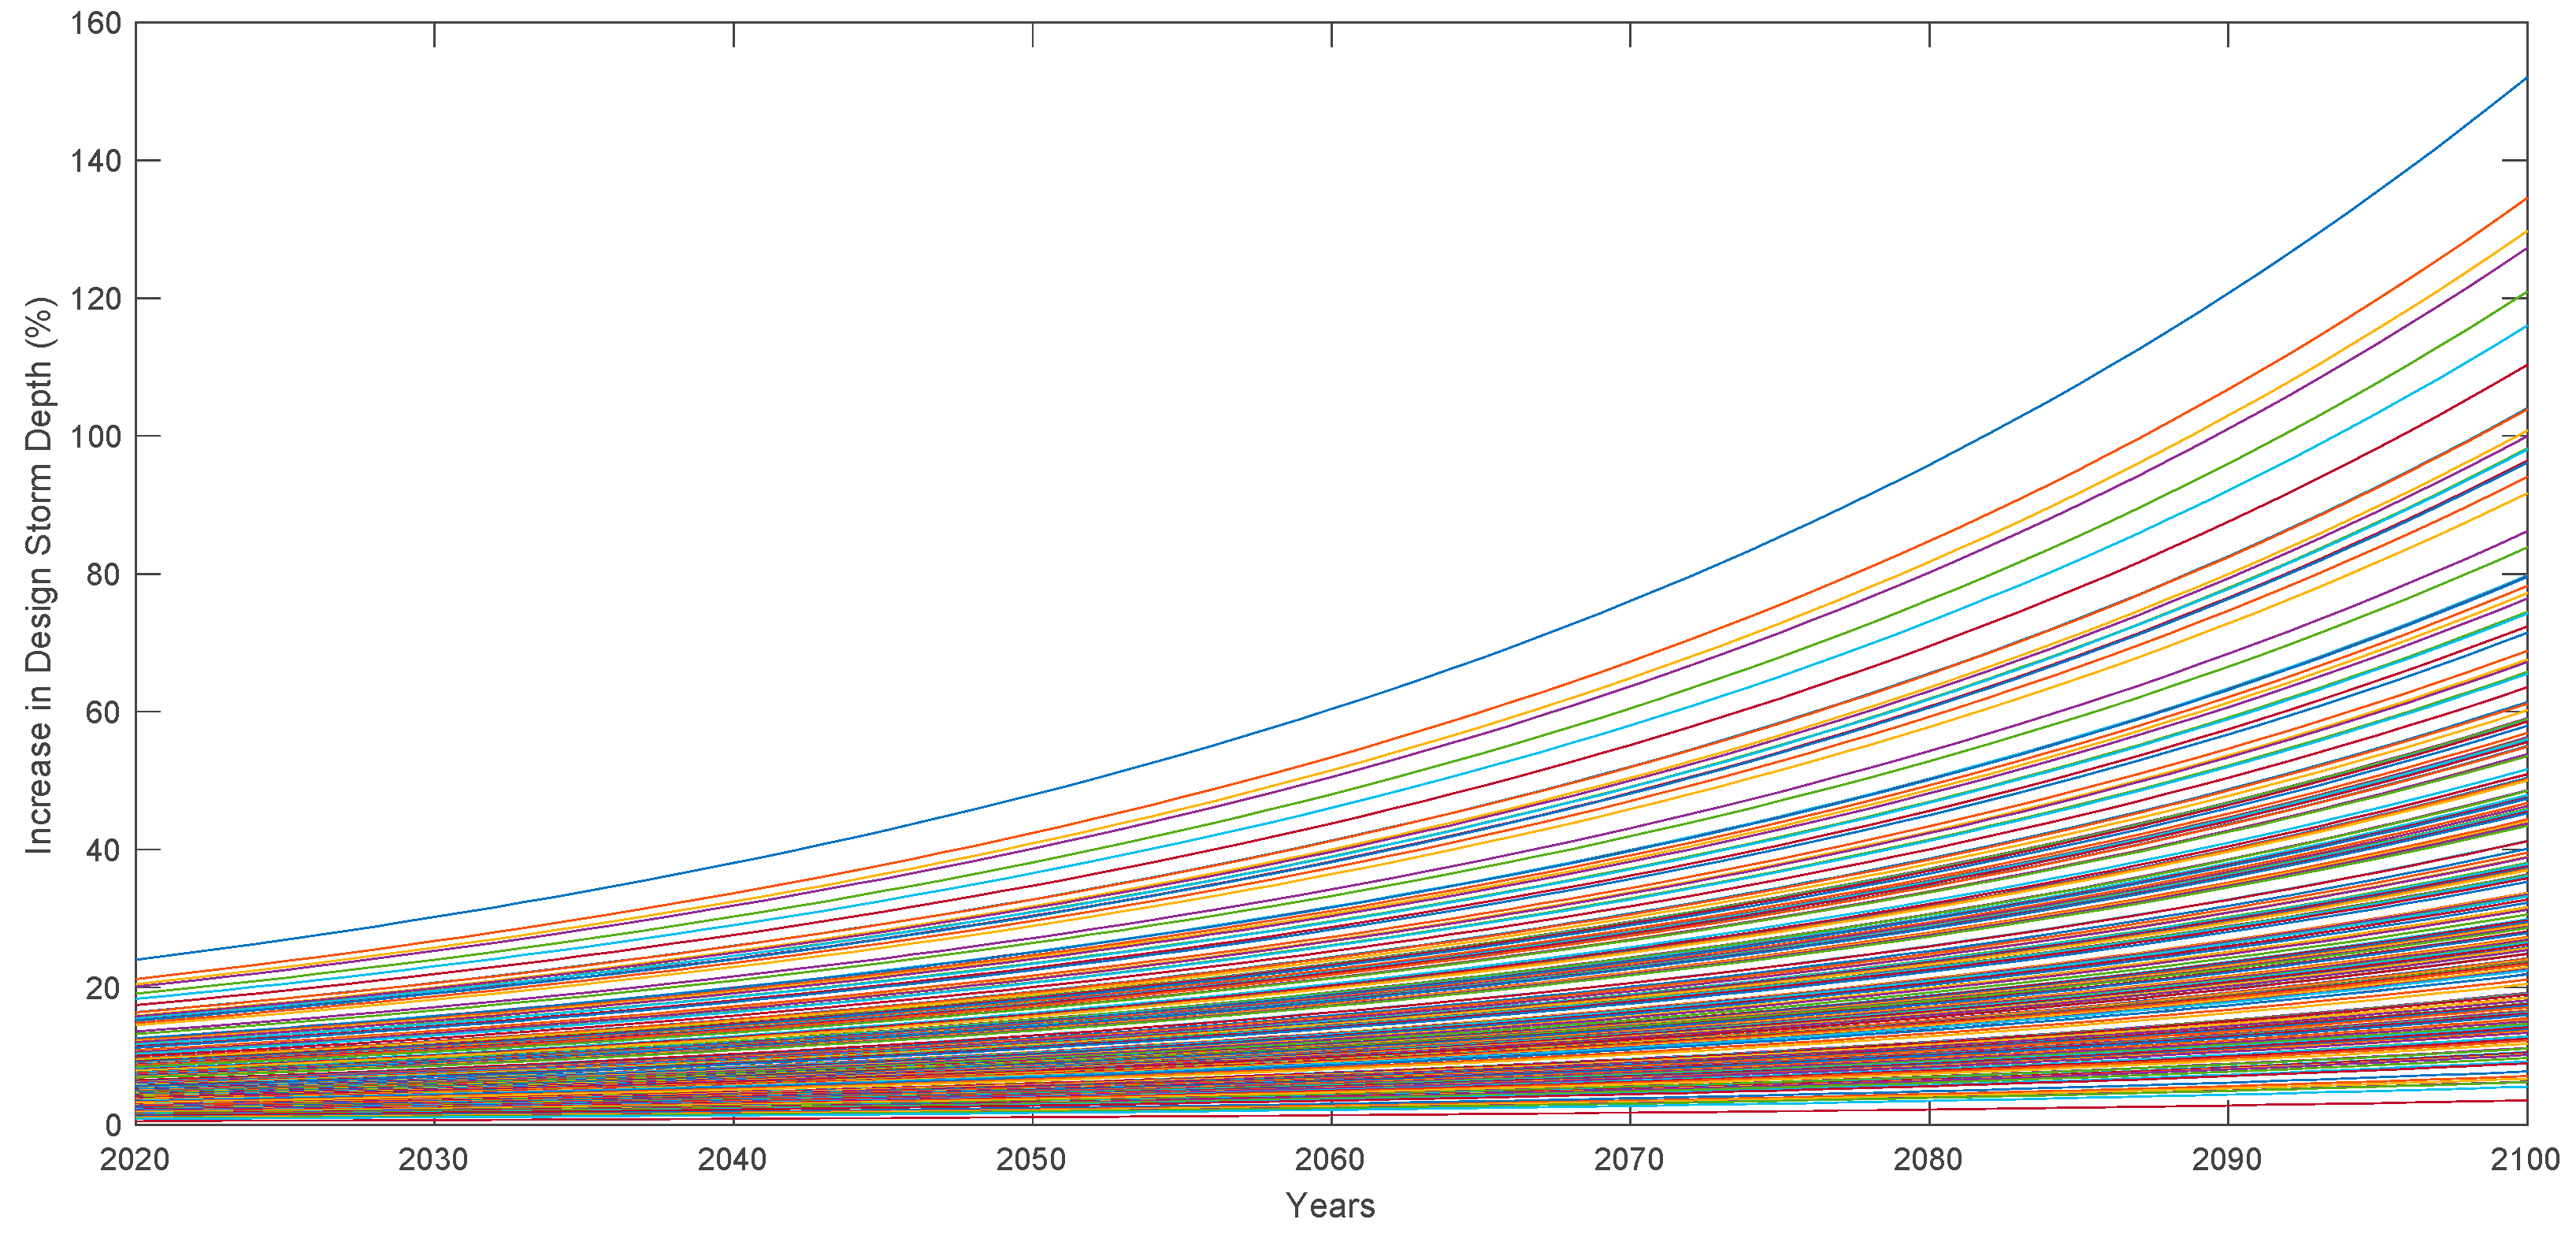
2.3. Conversion to Time
2.4. Cost Estimation
2.5. Ecosystem Benefits
2.6. Financial Analyses
2.6.1. Discounted Cash Flow
2.6.2. Benefit Cost Ratio
2.6.3. Jensen’s Inequality
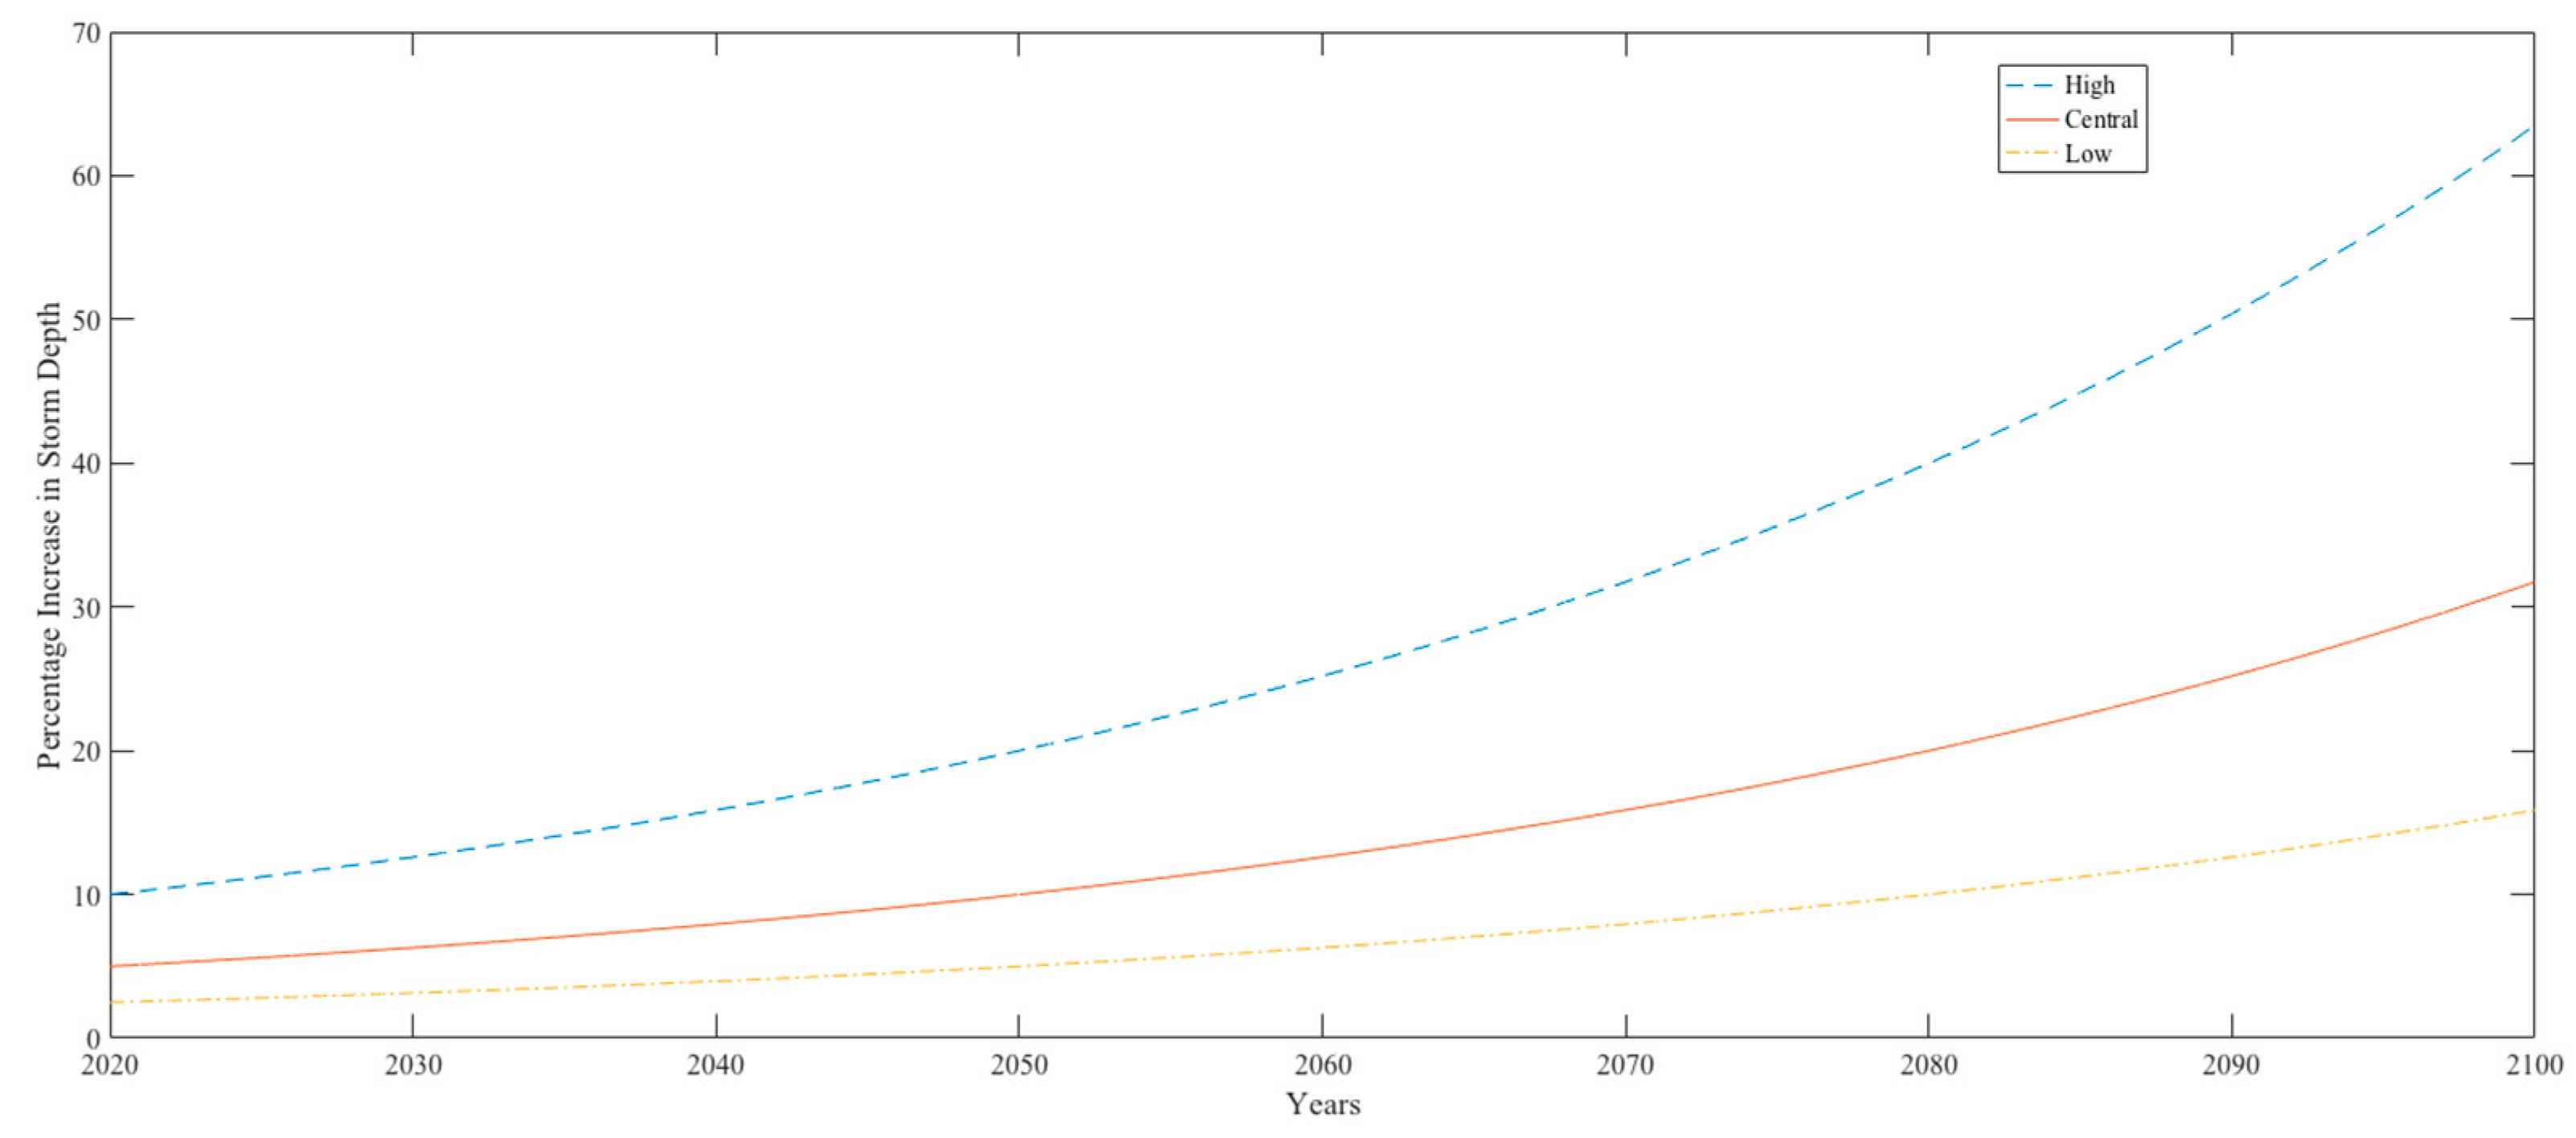
2.6.4. Economic Evaluation of Pathways Under Uncertainty
3. Results and Discussion
3.1. Deterministic Evaluation
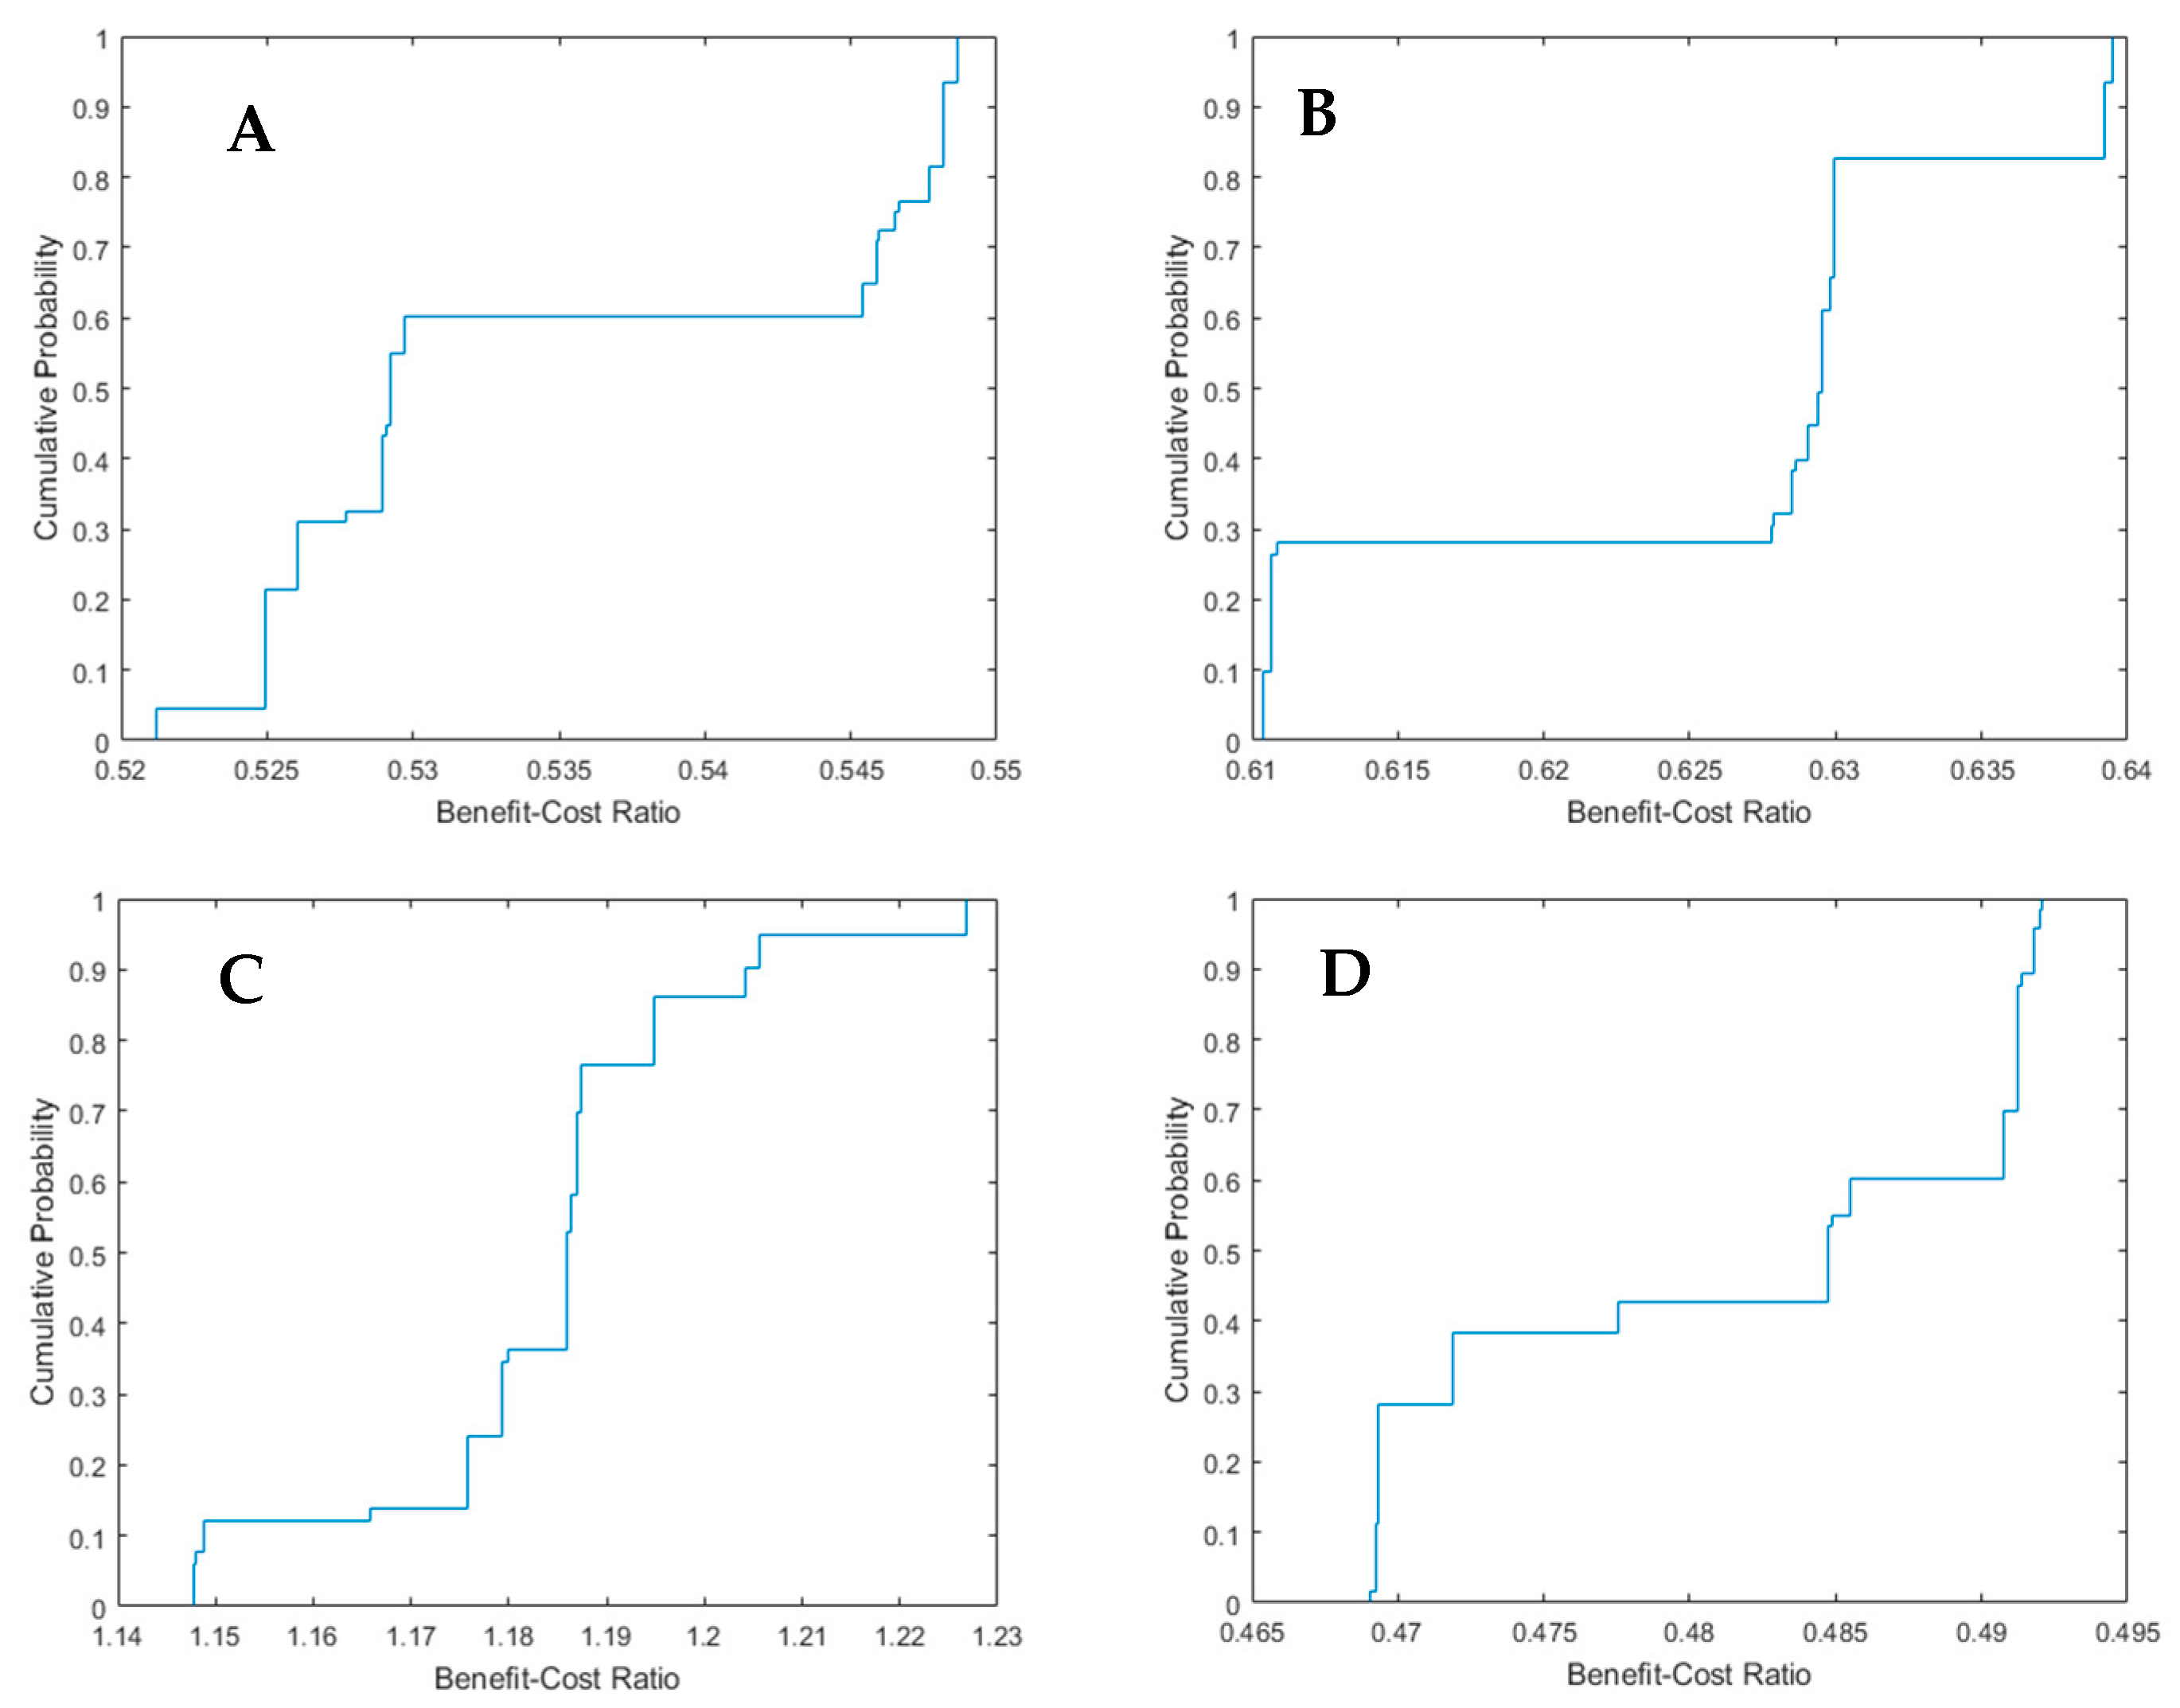
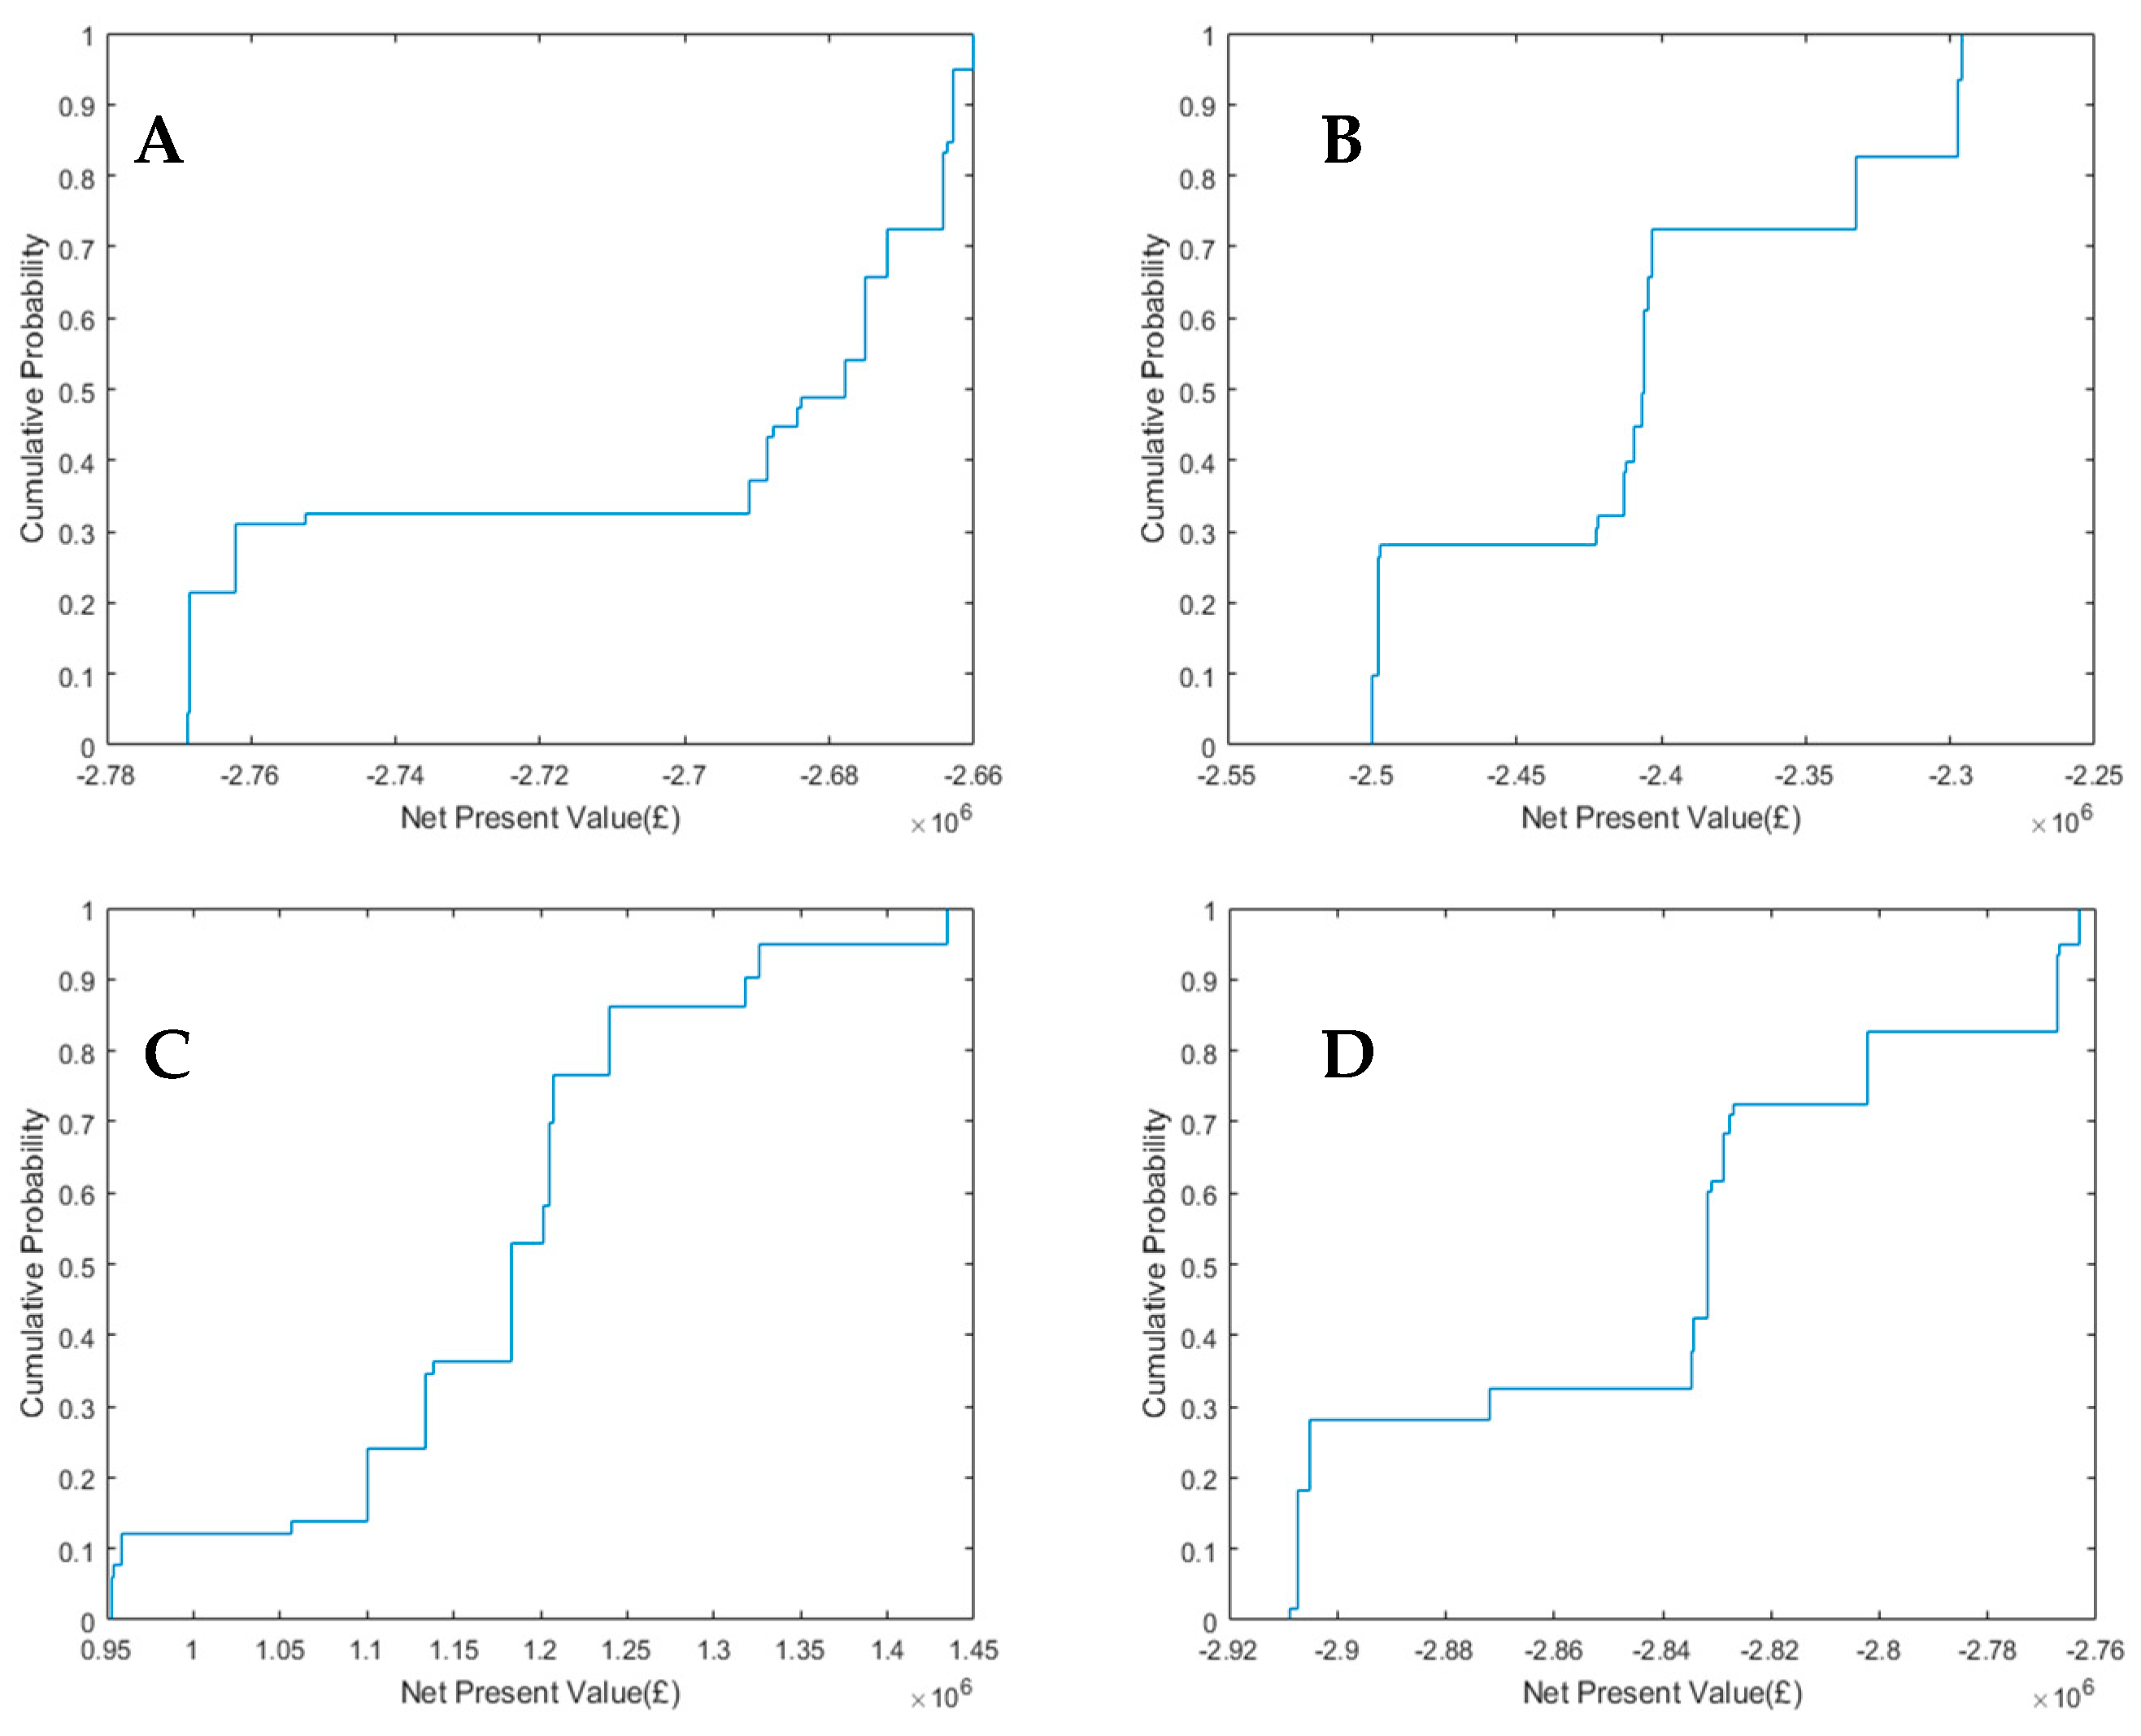
3.2. Evaluation Under Uncertainty
4. Conclusions
Author Contributions
Funding
Acknowledgments
Conflicts of Interest
References
- Intergovernmental Panel on Climate Change. IPCC, 2007: Summary for Policymakers; IPCC: Geneva, Switzerland, 2007. [Google Scholar]
- Intergovernmental Panel on Climate Change. Climate Change and Water: IPCC Technical Paper VI; IPCC: New York, NY, USA, 2008. [Google Scholar]
- Jenkins, G.; Murphy, J.M.; Sexton, D.M.H.; Lowe, J.A.; Jones, P.; Kilsby, C.G. UK Climate Projections Briefing Report; Met Office Hadley Centre: Exeter, UK, 2009. [Google Scholar]
- Walker, W.E.; Haasnoot, M.; Kwakkel, J.H. Adapt or perish: A review of planning approaches for adaptation under deep uncertainty. Sustainbility 2013, 5, 955–979. [Google Scholar] [CrossRef]
- Bryant, B.P.; Lempert, R.J. Thinking inside the box: A participatory, computer-assisted approach to scenario discovery. Technol. Forecast. Soc. Chang. 2010, 77, 34–49. [Google Scholar] [CrossRef]
- Zhang, S.; Babovic, V. A Real Options Approach to Design and Architect Water Supply Systems Using Innovative Water Technologies Under Uncertainty. J. Hydroinform. 2012, 14, 13–29. [Google Scholar] [CrossRef]
- Reeder, T.; Ranger, N. How do you adapt in an uncertain world? Lessons from the Thames Estuary 2100 project. In World Resources Report Uncertainty Series; World Resources Institute: Washington, DC, USA, 2011. [Google Scholar]
- Kwakkel, J.H.; Walker, W.E.; Marchau, V.A.W.J. Adaptive Airport Strategic Planning. Eur. J. Transp. Infrastruct. Res. 2010, 10, 249–273. [Google Scholar]
- Babovic, F.; Mijic, A.; Madani, K. Decision making under deep uncertainty for adapting urban drainage systems to change. Urban Water J. 2018. [Google Scholar] [CrossRef]
- Babovic, F.; Mijic, A. The Development of Adaptation Pathways for the Long Term Planning of Urban Drainage Systems. J. Flood Man. 2019, in press. [Google Scholar]
- Lawrence, J.; Haasnoot, M. Environmental Science & Policy What it took to catalyse uptake of dynamic adaptive pathways planning to address climate change uncertainty. Environ. Sci. Policy 2017, 68, 47–57. [Google Scholar]
- Lawrence, J.; Bell, R. A Hybrid Process to Address Uncertainty and Changing Climate Risk in Coastal Areas Using Dynamic Adaptive Pathways Planning, Multi-Criteria Decision Analysis & Real Options Analysis: A New Zealand Application. Sustainbility 2019, 11, 46. [Google Scholar]
- Environment Agency. Adapting to Climate Change: Advice for Flood and Coastal Erosion Risk Management Authorities; Environment Agency: Bristol, UK, 2016.
- Penning-Rowsell, E.; Priest, S.; Parker, D.; Morris, J.; Tunstall, S.; Viavattene, C.; Chatterton, J.; Owen, D. Flood and Coastal Erosion Risk Management: A Manual for Economic Appraisal; Routledge: Oxon, UK, 2013. [Google Scholar]
- AECOM. Spon’s Civil Engineering and Highway Works Price Book 2012, 26th ed.; Spon Press: London, UK, 2012. [Google Scholar]
- H.R Wallingford. Whole Life Costing for Sustainable Drainage; HR Wallingford: Wallingford, UK, 2004. [Google Scholar]
- Royal Haskoning DHV. Costs and Benefits of Sustainable Drainage Systems; Royal Haskoning: Peterborough, UK, 2012. [Google Scholar]
- Digman, C.J.; Horton, B.; Ashley, R.M.; Gill, E. BeST (Benefits of SuDS Tool) W045d BeST—User Manual; Ciria: London, UK, 2016. [Google Scholar]
- MWH. Demonstrating the Multiple Benefits of SuDS—A Business Case; Ciria: London, UK, 2013. [Google Scholar]
- Lowe, J. Intergenerational Wealth Transfers and Social Discounting: Supplementary Green Book Guidance; HM Treasury: London, UK, 2008.
- Defra. Surface Water Management Plan Technical Guidance; Defra: London, UK, 2010.
- Savage, S. The Flaw of Averages: Why We Underestimate Risk in the Face of Uncertainty; Wiley: Hoboken, NJ, USA, 2009. [Google Scholar]
- Jensen, J.L.W.V. Sur les fonctions convexes et les inegalites entre les valeurs moyennes. Acta Math. 1906, 30, 175–193. [Google Scholar] [CrossRef]
- De Neufville, R.; Scholtes, S. Flexibility in Engineering Design; MIT Press: Boston, MA, USA, 2011. [Google Scholar]
- Taleb, N.N.; Canetti, E.; Kinda, T.; Loukoianova, E.; Schmieder, C. A New Heuristic Measure of Fragility and Tail Risks: Application to Stress Testing; International Monetary Fund: Washington, DC, USA, 2012. [Google Scholar]
- Trigeorgis, L. Real Options: Managerial Flexibility and Strategy in Resource Allocation; MIT Press: Cambridge, UK, 1996. [Google Scholar]
- Buurman, J.; Babovic, V. Adaptation Pathways and Real Options Analysis: An approach to deep uncertainty in climate change adaptation policies. Policy Soc. 2016. [Google Scholar] [CrossRef]
- Wong, M.K. Flexible Design: An Innovative Approach for Planning Water Infrastructure Systems Under Uncertainty; Massachusetts Institute of Technology: Cambridge, MA, USA, 2013. [Google Scholar]
- Environment Agency. Flooding in England: A National Assessment of Flood Risk; Environment Agency: Bristol, UK, 2009.


| Path | Order of Adaptations |
|---|---|
| A | 1 m Lake Deepening |
| B | 1 m Lake Deepening & 20% Porous Pavements |
| C | 1 m Lake Deepening & 50% Green Roofs |
| D | 1 m Lake Deepening & 50% Green Roofs & 40% Porous Pavements |
| E | 25% Green Roofs |
| F | 25% Green Roofs & 1 m Lake Deepening |
| G | 5% Green Roofs & 1 m Lake Deepening & 25% Green Roofs |
| H | 25% Green Roofs & 1 m Lake Deepening & 25% Green Roofs & 40% Porous Pavement |
| I | 25% Green Roofs & 0.5 m Lake Deepening |
| J | 25% Green Roofs & 0.5 m Lake Deepening & 0.5 m Lake Deepening |
| K | 25% Green Roofs & 0.5 m Lake Deepening & 0.5 m Lake Deepening & 25% Green Roofs |
| L | 25% Green Roofs & 0.5 m Lake Deepening & 0.5 m Lake Deepening & 25% Green Roofs & 40% Porous Pavements |
| M | 0.5 m Lake Deepening |
| N | 0.5 m Lake Deepening & 25% Green Roofs |
| O | 0.5 m Lake Deepening & 25% Green Roofs & 0.5 m Lake Deepening |
| P | 0.5 m Lake Deepening & 25% Green Roofs & 0.5 m Lake Deepening & 25% Green Roofs |
| Q | 0.5 m Lake Deepening & 25% Green Roofs & 0.5 m Lake Deepening & 25% Green Roofs & 40% Porous Pavement |
| R | 10% Increase in Sewer Diameter |
| Path | CAPEX/Unit | OPEX/Unit | Total CAPEX | Total OPEX |
|---|---|---|---|---|
| Deepen Lake by 0.5 m | £5.41/m3 [14] | £0.5/m3 [16] | £66,000 | £6100 |
| Deepen Lake by 1 m | £5.41/m3 [14] | £0.5/m3 [16] | £132,000 | £12,200 |
| Convert 25% of roofs to green roofs | £47/m2 [16] | £0.15/m2 [17] | £1,770,000 | £48,750 |
| Convert 50% of roofs to green roofs | £47 /m2 [16] | £0.15/m2 [17] | £3,540,00 | £97,500 |
| Convert 20% of pavement to porous pavements | £54 /m2 [17] | £0.16/m2 [16] | £1,700,000 | £5000 |
| Convert 40% of pavement to porous pavements | £54/m2 [17] | £0.16/m2 [16] | £3,400,000 | £100,000 |
| Increase diameter of trunk sewer by 10% | - | - | £2,340,000 | £1800 |
| Adaptation Option | Ecosystem Service Delivered | Annual Value of Individual Service | Total Value of Annual Services |
|---|---|---|---|
| Convert 25% of roofs to green roofs | Air Quality | £10,000 | £160,000 |
| Reduction in Building Energy Demand | £150,000 | ||
| Convert 20% of pavement to porous pavements | Ground Water Recharge | £17,000 | £17,000 |
| Path | Net Present Value | Benefit-Cost Ratio |
|---|---|---|
| A | £15,300 | 1.06 |
| B | −£1,140,000 | 0.21 |
| C | −£1,330,000 | 0.55 |
| D | −£2,660,000 | 0.53 |
| E | −£987,000 | 0.50 |
| F | −£268,000 | 0.89 |
| G | −£965,000 | 0.74 |
| H | −£2,300,000 | 0.64 |
| I | £3,120,000 | 2.33 |
| J | £3,170,000 | 2.31 |
| K | £2,470,000 | 1.68 |
| L | £1,130,000 | 1.18 |
| M | £138,000 | 2.12 |
| N | −£777,000 | 0.44 |
| O | −£737,000 | 0.50 |
| P | −£1,720,000 | 0.36 |
| Q | −£2,770,000 | 0.48 |
| R | −£2,230,000 | 0.02 |
| Path | Expected Net Present Value | Standard Deviation of NPV | Expected Benefit-Cost Ratio | Standard Deviation of BCR |
|---|---|---|---|---|
| A | £13,000 | £3500 | 1.05 | 0.014 |
| B | −£1,170,000 | £22,000 | 0.21 | 0.006 |
| C | −£1,370,000 | £32,000 | 0.55 | 0.012 |
| D | −£2,700,000 | £44,000 | 0.53 | 0.010 |
| E | −£1,000,000 | £52,000 | 0.48 | 0.032 |
| F | −£260,000 | £26,000 | 0.89 | 0.011 |
| G | −£1,000,000 | £61,000 | 0.70 | 0.018 |
| H | £2,400,000 | £71,000 | 0.63 | 0.010 |
| I | £3,250,000 | £127,000 | 2.39 | 0.054 |
| J | £3,320,000 | £125,000 | 2.37 | 0.052 |
| K | £2,510,000 | £122,000 | 1.70 | 0.033 |
| L | £1,170,000 | £114,000 | 1.18 | 0.018 |
| M | £130,000 | £5000 | 2.11 | 0.028 |
| N | −£760,000 | £33,000 | 0.47 | 0.032 |
| O | −£690,000 | £24,000 | 0.54 | 0.023 |
| P | −£1,720,000 | £23,000 | 0.36 | 0.008 |
| Q | −£2,840,000 | £49,000 | 0.48 | 0.010 |
| R | −£2,240,000 | £5300 | 0.01 | 0.003 |
| Path | Difference in NPV | Normalised Deviation from ENPV | Difference in BCR | Normalised Deviation from EBCR |
|---|---|---|---|---|
| A | £2400 | 0.70 | −0.009 | 0.64 |
| B | −£29,000 | 1.34 | −0.005 | 0.73 |
| C | −£40,000 | 1.24 | −0.006 | 0.51 |
| D | −£39,000 | 0.88 | 0.006 | 0.59 |
| E | −£39,000 | 0.75 | −0.024 | 0.74 |
| F | £6200 | 0.24 | 0.003 | 0.27 |
| G | −£100,000 | 1.80 | −0.034 | 1.87 |
| H | −£110,000 | 1.53 | −0.013 | 1.31 |
| I | £130,000 | 1.03 | 0.058 | 1.07 |
| J | £150,000 | 1.24 | 0.060 | 1.16 |
| K | £40,000 | 0.33 | 0.020 | 0.61 |
| L | £40,380 | 0.36 | 0.005 | 0.26 |
| M | −£5200 | 1.03 | −0.018 | 0.64 |
| N | £19,000 | 0.57 | 0.028 | 0.88 |
| O | £43,000 | 1.81 | 0.044 | 1.92 |
| P | £3600 | 0.16 | 0.000 | 0.05 |
| Q | −£73,000 | 1.47 | −0.003 | 0.34 |
| R | −£4300 | 0.81 | −0.002 | 0.81 |
© 2019 by the authors. Licensee MDPI, Basel, Switzerland. This article is an open access article distributed under the terms and conditions of the Creative Commons Attribution (CC BY) license (http://creativecommons.org/licenses/by/4.0/).
Share and Cite
Babovic, F.; Mijic, A. Economic Evaluation of Adaptation Pathways for an Urban Drainage System Experiencing Deep Uncertainty. Water 2019, 11, 531. https://doi.org/10.3390/w11030531
Babovic F, Mijic A. Economic Evaluation of Adaptation Pathways for an Urban Drainage System Experiencing Deep Uncertainty. Water. 2019; 11(3):531. https://doi.org/10.3390/w11030531
Chicago/Turabian StyleBabovic, Filip, and Ana Mijic. 2019. "Economic Evaluation of Adaptation Pathways for an Urban Drainage System Experiencing Deep Uncertainty" Water 11, no. 3: 531. https://doi.org/10.3390/w11030531
APA StyleBabovic, F., & Mijic, A. (2019). Economic Evaluation of Adaptation Pathways for an Urban Drainage System Experiencing Deep Uncertainty. Water, 11(3), 531. https://doi.org/10.3390/w11030531