Article

A Comparison of Three Types of Permeable Pavements for Urban Runoff Mitigation in the Semi-Arid South Texas, U.S.A

1
Department of Environmental Engineering, Texas A&M University-Kingsville, Kingsville, TX 78363, USA
2
Department of Civil Engineering, University of Texas Rio Grande Valley, Edinburg, TX 78539, USA
3
Research, Applied, Technology, Education and Service, Inc., Rio Grande Valley, Edinburg, TX 78540, USA
*
Author to whom correspondence should be addressed.
Water 2019, 11(10), 1992; https://doi.org/10.3390/w11101992
Submission received: 30 July 2019 / Revised: 20 September 2019 / Accepted: 23 September 2019 / Published: 24 September 2019
(This article belongs to the Special Issue Advances of Low Impact Development Practices in Urban Watershed)

Abstract

:
This study examines the hydrologic and environmental performance of three types of permeable pavement designs: Porous Concrete Pavement (PCP), Permeable Interlocking Concrete (PICP), and Interlocking Block Pavement with Gravel (IBPG) in the semi-arid South Texas. Outflow rate, storage, Normalized Volume Reduction (NVR), Normalized Load Reductions (NLR) of Total Suspended Solids (TSS), and Biochemical Oxygen Demand (BOD5) were compared to results obtained from adjacent traditional pavements at different regional parking lots. A notable percentage of peak flow attenuation of approximately 31–100% was observed when permeable pavements were constructed and implemented. IBPG was capable to hold runoff from rainfall depths up to 136 mm prior to flooding. PCP was the most satisfactory in reducing surface runoff (NVR: 2.81 × 10⁻³ ± 0.67 × 10⁻³ m3/m2/mm), which was significantly (p < 0.05) higher (98%) than the traditional pavement. PCP was also very effective in TSS removal (NLR: 244 × 10−5 ± 143 × 10−5 kg/m2/mm), which was an increase of over 80% removal than traditional pavement. IBPG (NLR: 7.14 × 10⁻⁵ ± 7.19 × 10⁻⁵ kg/m2/mm) showed a significantly (p < 0.05) higher (46%) BOD5 removal over traditional pavement. These results demonstrate that the type of permeable pavement and the underlying media can significantly influence the runoff reduction and infiltration in this climatic region.

1. Introduction

The Lower Rio Grande Valley (LRGV) is located at the southernmost tip of semi-arid South Texas, separating Mexico from the United States. Due to rapid urbanization, a significant portion of the total LRGV regional runoff is being exacerbated by impervious and traditional practices, including asphalt commercial and industrial parking lots in different cities. This uncontrolled overflow eventually finds its way toward the Arroyo Colorado water body, which serves as a floodway and provides the region with fresh water. The water quality of this watershed does not support optimum living conditions for aquatic life due to low dissolved oxygen levels. Consequently, the Arroyo watershed has been impaired by elevated sediments and organic loadings associated with urban stormwater runoff [1]. A regional effort was established to initiate the Arroyo Colorado Watershed Protection Plan. A major goal was to incorporate various sustainable on-site stormwater treatment facilities known as Low Impact Development (LID) practices in the LRGV. LID implementation will help prevent on-site flooding and filter non-point source pollutant loadings before draining into the local storm sewer and the watershed [2].
Permeable pavement has been widely accepted as one of many LID eco-technologies that increases on-site stormwater infiltration and facilitates runoff storage within an aggregate reservoir [3,4]. In addition, permeable pavements can help recharge groundwater, contribute to healthy ecosystems, and provide opportunities for stormwater capture and reuse [3,5,6]. The most commonly used permeable pavements include the following surface paving materials: Porous Concrete (PC), Porous Asphalt (PA), Permeable Interlocking Concrete Pavers (PICP), Concrete Grid Pavers (CGP), and Plastic Reinforcing Grid Pavers [4,7].
PC is one of the most useful types of surface paving material. It consists of Portland cement binder, coarse aggregates, water, and admixtures. More durable than PA, it is widely recognized as a low-cost life cycle option available among the choices in the market [8]. The air voids within its matrix are usually increased by the omission of fine aggregates to facilitate the infiltration through the pavement system [5,8,9]. Designed to act like an underground detention basin, stormwater infiltrates the void spaces within the concrete–aggregate matrix of PC [5].
Another useful form of permeable pavement, PICP, consists of manufactured precast concrete block units that are arranged in an interlocking manner [8,9]. This material is highly durable and attractive, easily functioning as a repairable permeable pavement system that requires low maintenance. Further, this type of pavement is available in many different shapes, sizes, and combinations [5,8]. When two interlocking blocks are placed together, void spaces form at the midpoint and corner of the paver; they are often filled with crushed stone, pea gravel, or topsoil for turf plantation [5,9,10].
A number of field-based studies have been carried out over the decades to assess hydrologic and water quality performance of permeable pavement systems [7,9,11,12,13,14,15,16,17,18,19]. Permeable pavement has been examined intensively, especially on the northeast coast of the USA or in cold climatic regions, where storms produce freezing rain, snow, sleet, or a wintry mix of various precipitation types [9]. The performance of a permeable pavement system is mainly influenced by factors, such as pavement type, the thickness of the pavement layer, particle size distributions, and the porosity of the bedding materials. In addition to other hydrological and pavement conditions, factors such as rainfall depth, antecedent moisture contents, pavements age, and maintenance could have an impact on the performance of permeable pavement systems [5,20].
By assessing hydrologic and water quality performance, various field studies have examined the effectiveness of different permeable pavements types. In Wilmington, North Carolina, no runoff was recorded from the PC surface for rainfall events below 30 mm [11]. A study explained an interesting outcome in terms of rainfall intensity requirement, which should be more than 20 mm/h to generate a significant volume of surface runoff on a PICP surface [15]. Previous studies have found that Porous Concrete Pavement (PCP) and PICP can reduce peak flows by 60%–74% and 77%–89%, respectively, for maximum rainfall ranging between 152 and 183 mm [13,21]. A recent study in Northeast Ohio investigated the median peak flow reduction from PCP and PICP (constructed over low permeability soils) to be approximately 98% and 70%–100%, respectively, for rainfall events ranging between 2.5–89.2 mm [22]. Another field study in Georgia observed 93% less runoff from PC than traditional asphalt pavement [23]. Some studies have found the PCP underdrain exfiltration volume was 31%–100% of surface runoff volume for rainfall depths below 97 mm [11,24]. Another study found that when PICP was employed, the exfiltration volume was 24%–47% of the surface runoff volume at rainfall depths of 22.6 mm [25]. In Kingston, NC, a study evaluated three types of permeable pavements: PCP, PICP, and Concrete Grid Pavement (CGP). The results demonstrated that PICP and CGP have higher storage capacity over PCP [13]. A recent study in the state of California, USA, discussed the prospect of using fully permeable pavement (where all pavement layers are highly permeable) to enhance the infiltration and storage of the stormwater runoff [26]. Another recent study in California suggested that the thickness of the base aggregate layer of 0.15–2.9 m would be adequate to capture a range of rainfall depths over the course of the wet season [27]. The performance of PICP in terms of peak flow reduction is affected by the variation in rainfall magnitudes [28]. Another study examined the functionality of permeable pavement in the cold climates of coastal New Hampshire. This pavement resulted in a reduction of peak flows by 90% [19]. The effectiveness of PICP was also examined in southwest Calgary, Alberta, which showed a moderate range (30%–50%) of peak flow reduction, even when the temperature was below 0 °C [18]. Previous studies have shown that permeable pavements were capable of removing a significant amount of suspended solids, ranging from 90%–96% [29]. One PICP system was successful in trapping over 90% of runoff sediments within its paving and bedding aggregate layers [30]. A porous asphalt pavement with a Permeable Friction Course overlay removed 90% of total suspended solids as compared to conventional pavement [31]. Previous studies demonstrated that porous pavement can be capable of reducing Total Suspended Solids (TSS) by 64%–87% from stormwater runoff [32,33]. Although sediments enhance clogging within paver voids, proper maintenance that includes sweeping, pressure washing, or a combination of both can enhance declogging and maximize the life span of porous pavement [34,35]. Some recent studies also demonstrated a significant removal (68%) of inorganic nitrogen species from PCP and PICP, especially when their design was modified to enhance denitrification process [36,37].
Previous studies have recommended the assessment of runoff reduction and the water quality improvement aspect of permeable pavements through continued field data collection in different climatic conditions and geographic locations [38]. Additionally, climate change and changing rainfall patterns will influence the future performance of permeable pavement systems [39]. In southern semi-arid climatic regions, such as the LRGV in South Texas, summers are hot and humid with a daily average temperature above 32.2 °C for most of the year due to currents in the Gulf of Mexico [40]. Tropical storms in the coastal region of the LRGV are abundant during summer months. The region experiences deep drought-like weather in mid-summer, and peak precipitation occurs in the spring and fall. Snowfall and freezing rain are rare in the cooler and drier winter months [41,42]. Dissimilar storm patterns have emerged between the east and the south-coast of USA, producing two conflicting scenarios of assessing runoff. These specific scenarios may add new zone-specific and much-needed knowledge about the performance of permeable pavement systems under different scenarios. Therefore, the goal of this field study was to evaluate the design performance of three different types of permeable pavement in terms of peak flow, runoff volume reduction, and water quality improvement in the semi-arid climatic region of the LRGV with a detailed investigation of parameters that can affect performance. The information generated through this evaluation should provide planners and developers with more reliable predictive runoff reduction for these pavements to be applied in watershed management and development planning.

2. Materials and Methods

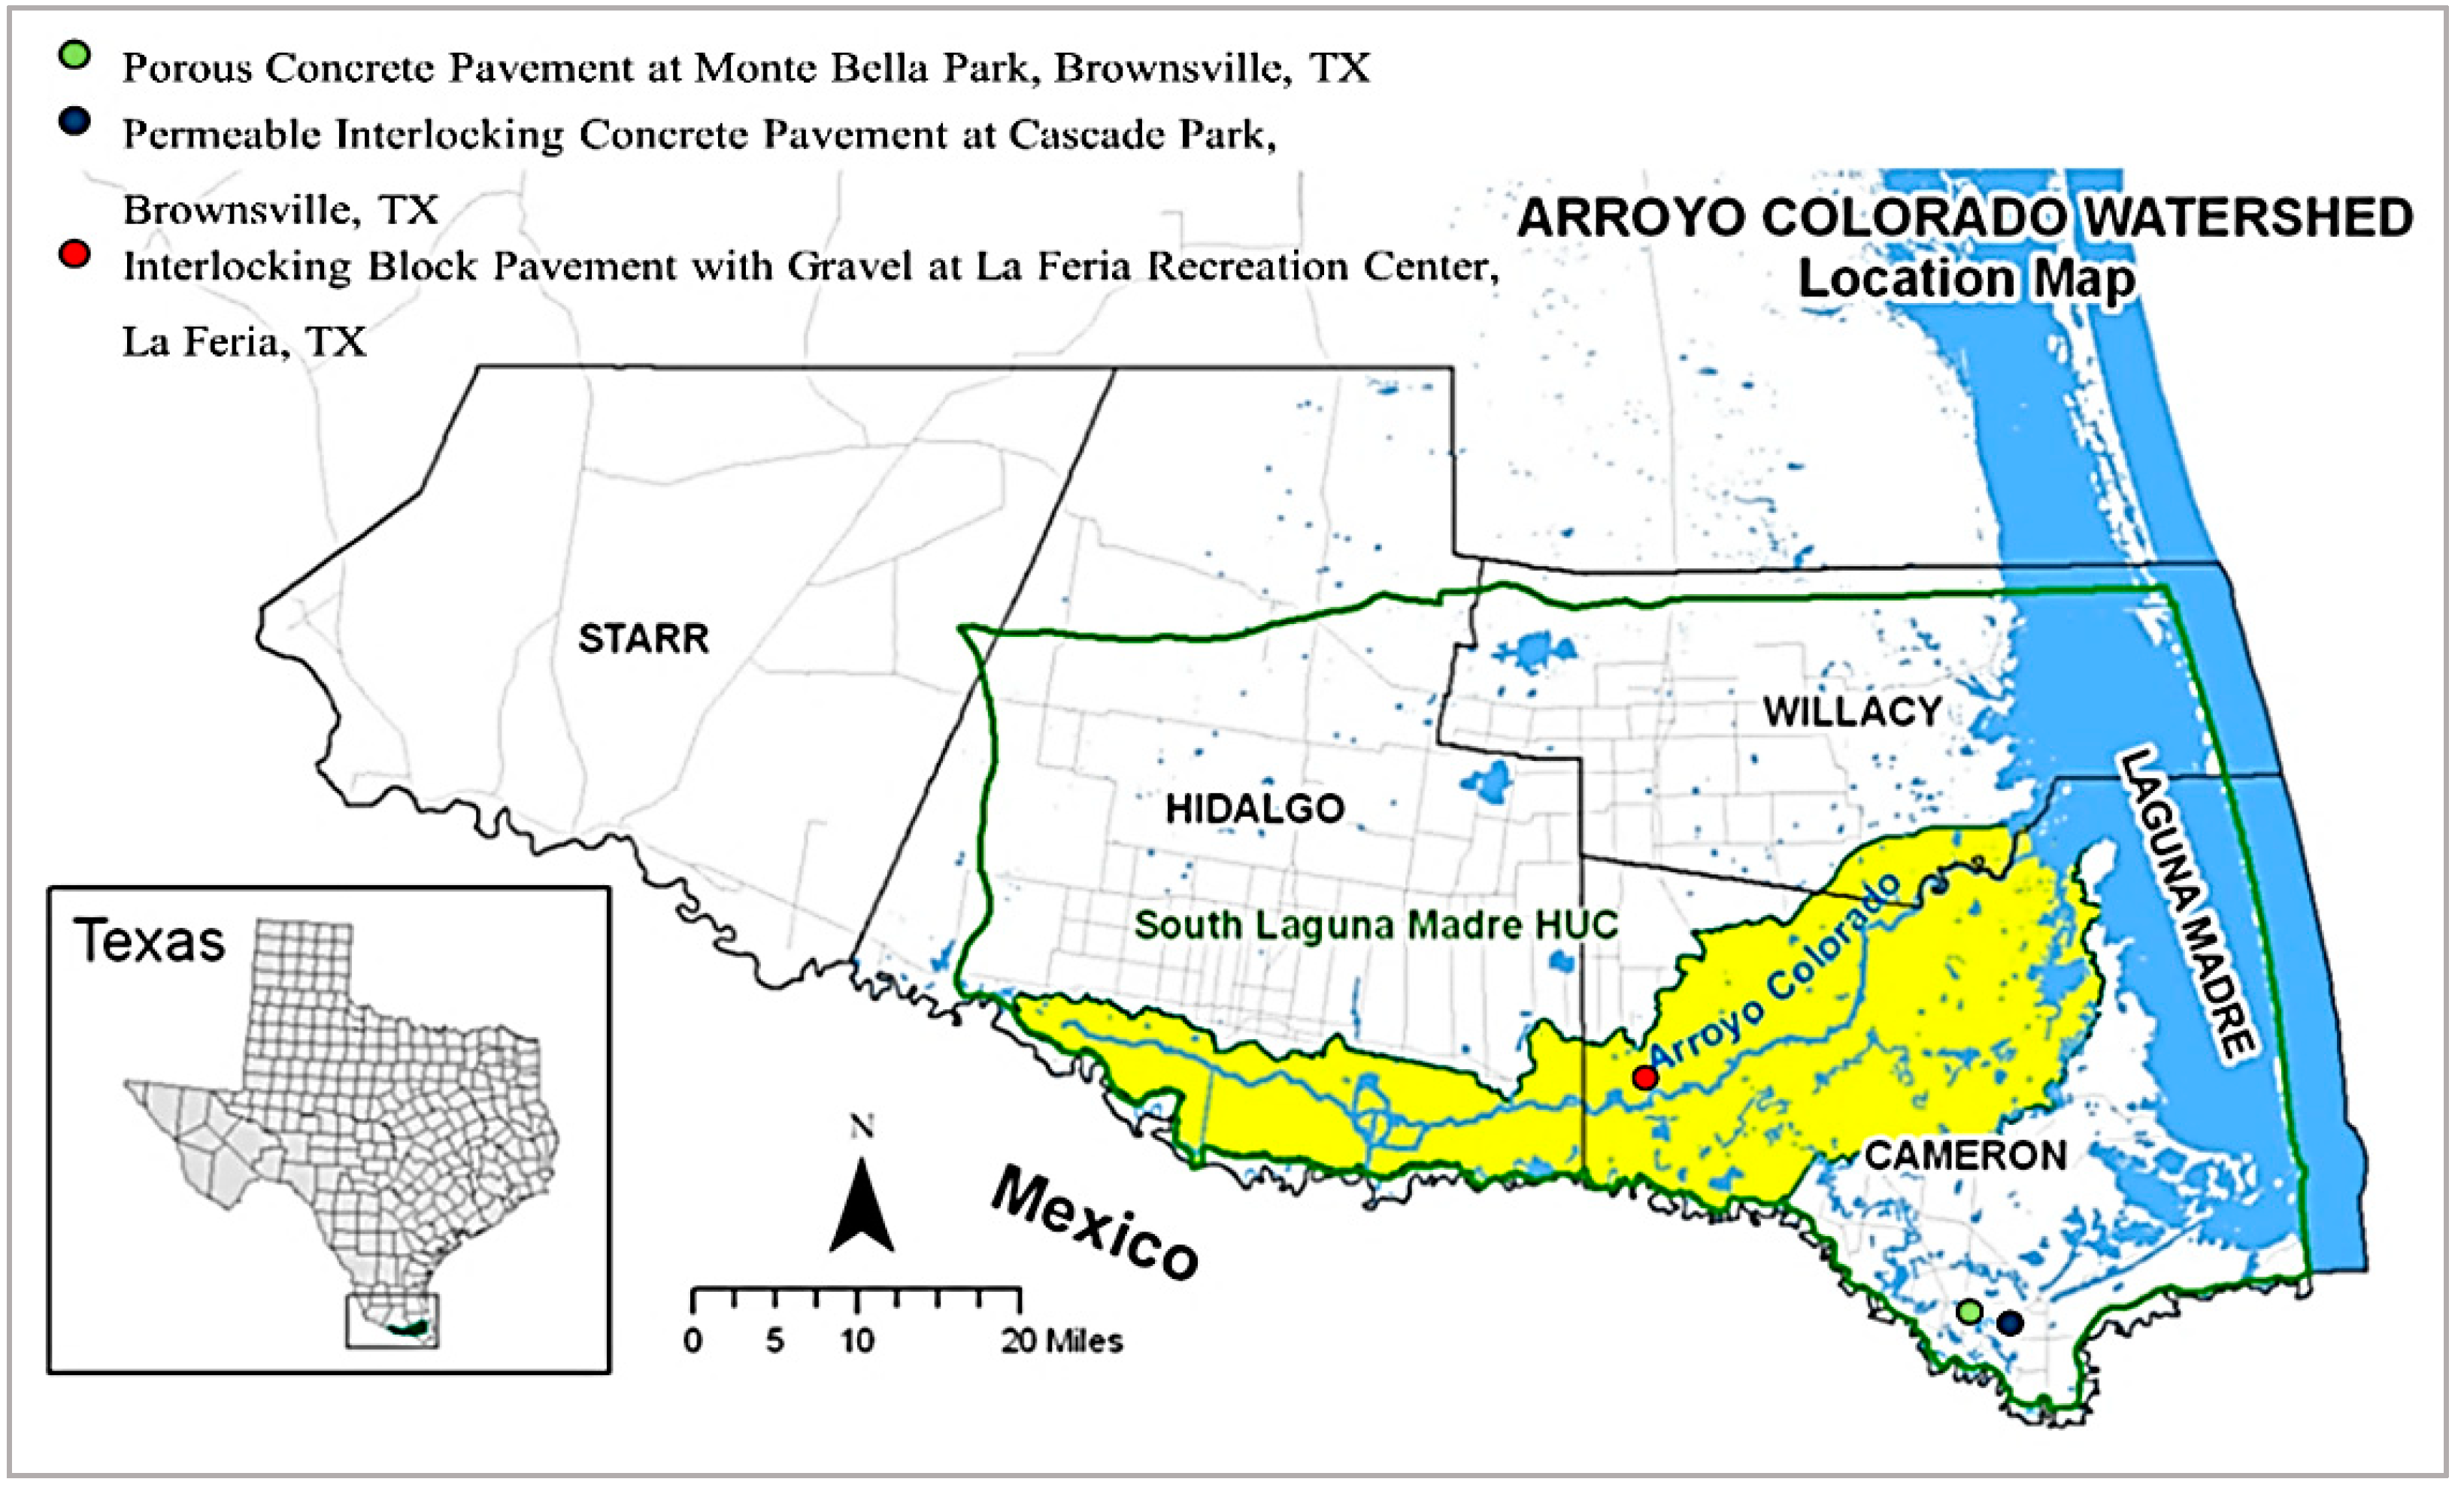
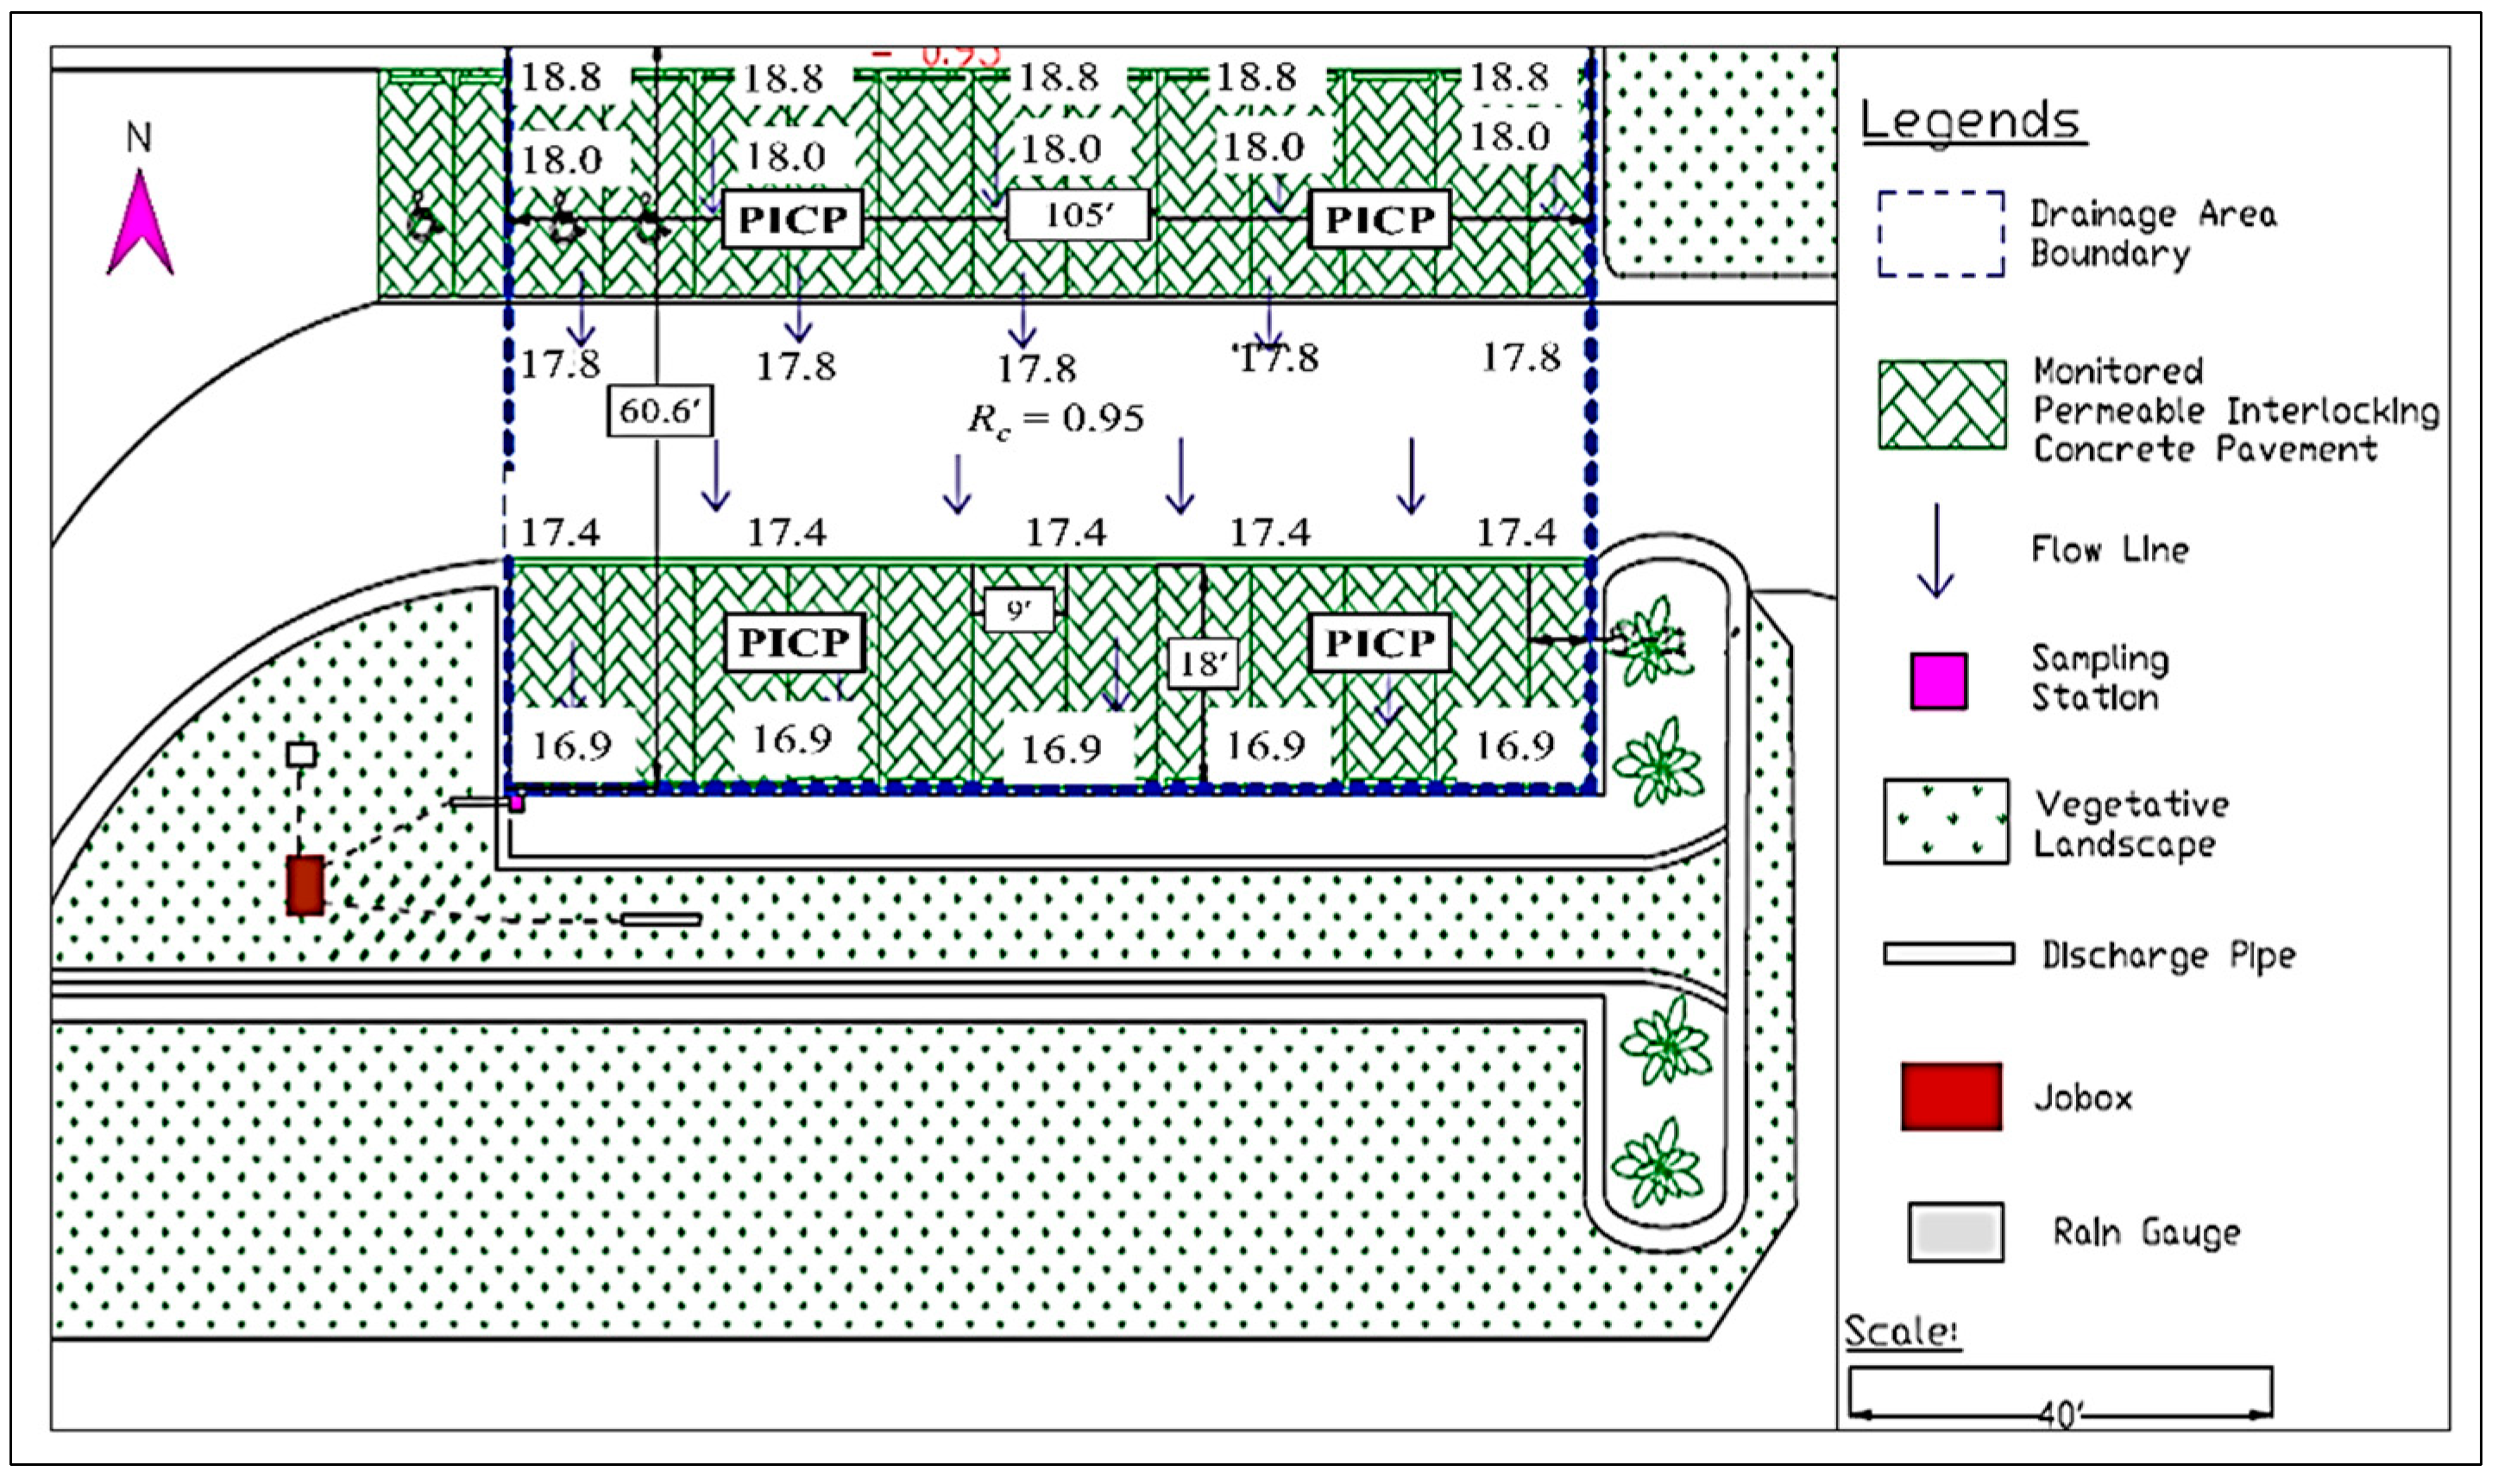
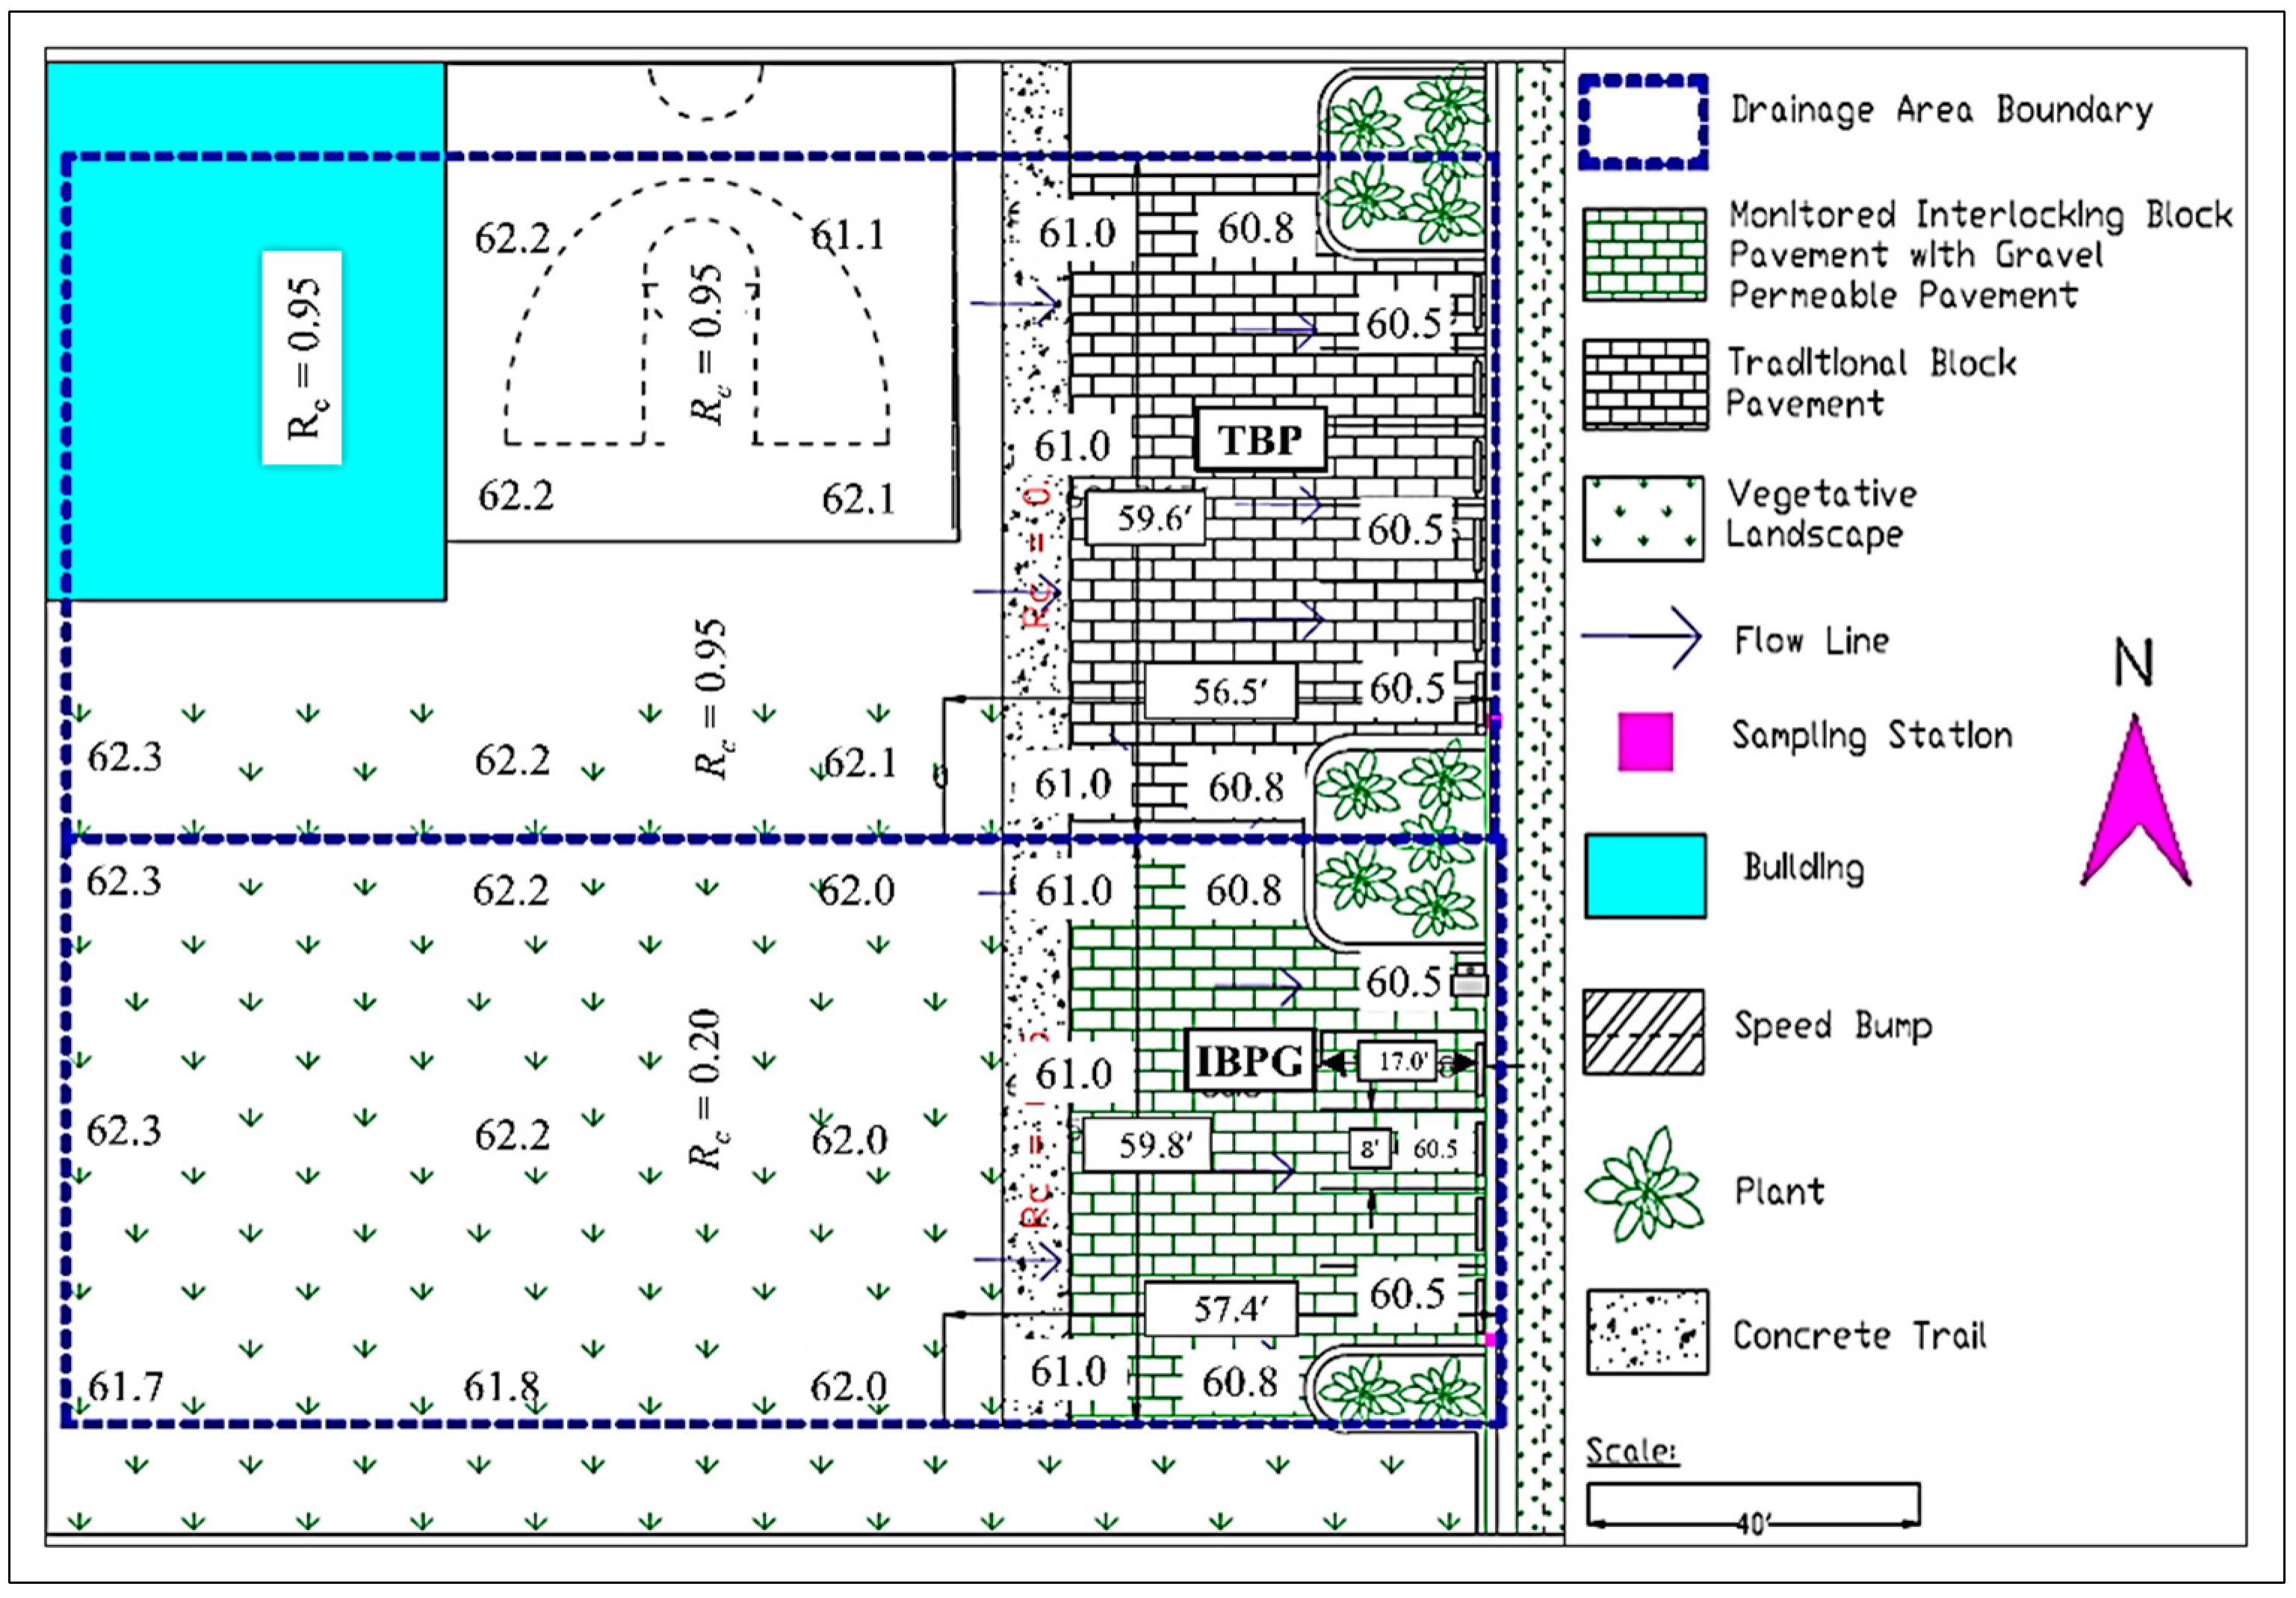
2.1. Site Description

Under the Texas Commission for Environmental Quality (TCEQ) sponsored LRGV LID implementation project, several permeable pavements were utilized in different cities within the LRGV. In this study, three sites were chosen, where three different types of permeable pavements and two adjacent traditional pavements were monitored in terms of runoff reduction and water quality improvement aspects. Table 1 shows the types of monitored permeable pavements and field-measured attributes of the study areas within the (TCEQ) LID Implementation Project in the LRGV of Texas. Figure 1 and Figure 2 show the geographic locations and top surface of the three different monitoring sites for permeable pavements within this project.
The City of Brownsville (COB) finished the construction of a parking lot facility with porous concrete at the Monte Bella Trail Park on February 2014. The parking lot was divided into three sections with two parking spaces in each (Figure 3). Each PCP section was isolated by the pavement crown provided in the driveway to prevent receiving any runoff outside of the drainage area boundary. The drainage area was divided into different source areas (e.g., traditional driveway and concrete trail) from where the runoff drained into the monitored section through the curb cut. All monitoring and supplementary equipment (such as rain gauges, flow meters, autosamplers, and solar panels) were installed on the site in September 2014.
The Cameron County Drainage District#1 (CCDD#1) completed the construction of PICP in the parking lot of Cascade Park on February 2014. The main objective was to retain and treat the stormwater runoff and water quality by reducing pollutant loadings as much as possible. Within the drainage site, the driveway (204 m2) and concrete trail (42 m2) were constructed with traditional asphalt and concrete. They were graded in such a way as to direct the runoff towards the PICP stalls through the curb cut (Figure 4). There was no traditional type of pavement monitored in this parking lot. All monitoring and supplementary equipment were installed at the site in September 2014.
The City of La Feria (COLF) Recreation Center completed the construction of an innovative permeable block pavement on November 2013, which replaced regular blocks with concrete-brick blocks. When these concrete-brick blocks were arranged in an interlocking manner, enlarged cell openings were formed in the pattern filled with pea gravel to improve the infiltration rate. The remainder of the lot area was finished with Traditional Block Pavement (TBP) and was paved with traditional concrete brick blocks. The IBPG unit consisted of five stalls and driveway access, whereas the TBP covered fourteen stalls and a proportional driveway area. The section of TBP (242 m2) located adjacent to the IBPG was chosen for monitoring and comparison purposes with respect to IBPG performance. Each monitored pavement section was graded downward so that the overflow was directed toward the dedicated curb cuts and into the discharge pipe. This section also receives some portions of runoff from the nearby 40 m2 of the concrete trail and 537 m2 of the vegetative landscape (Figure 5). All monitoring and supplementary equipment were installed at the site in May 2014.

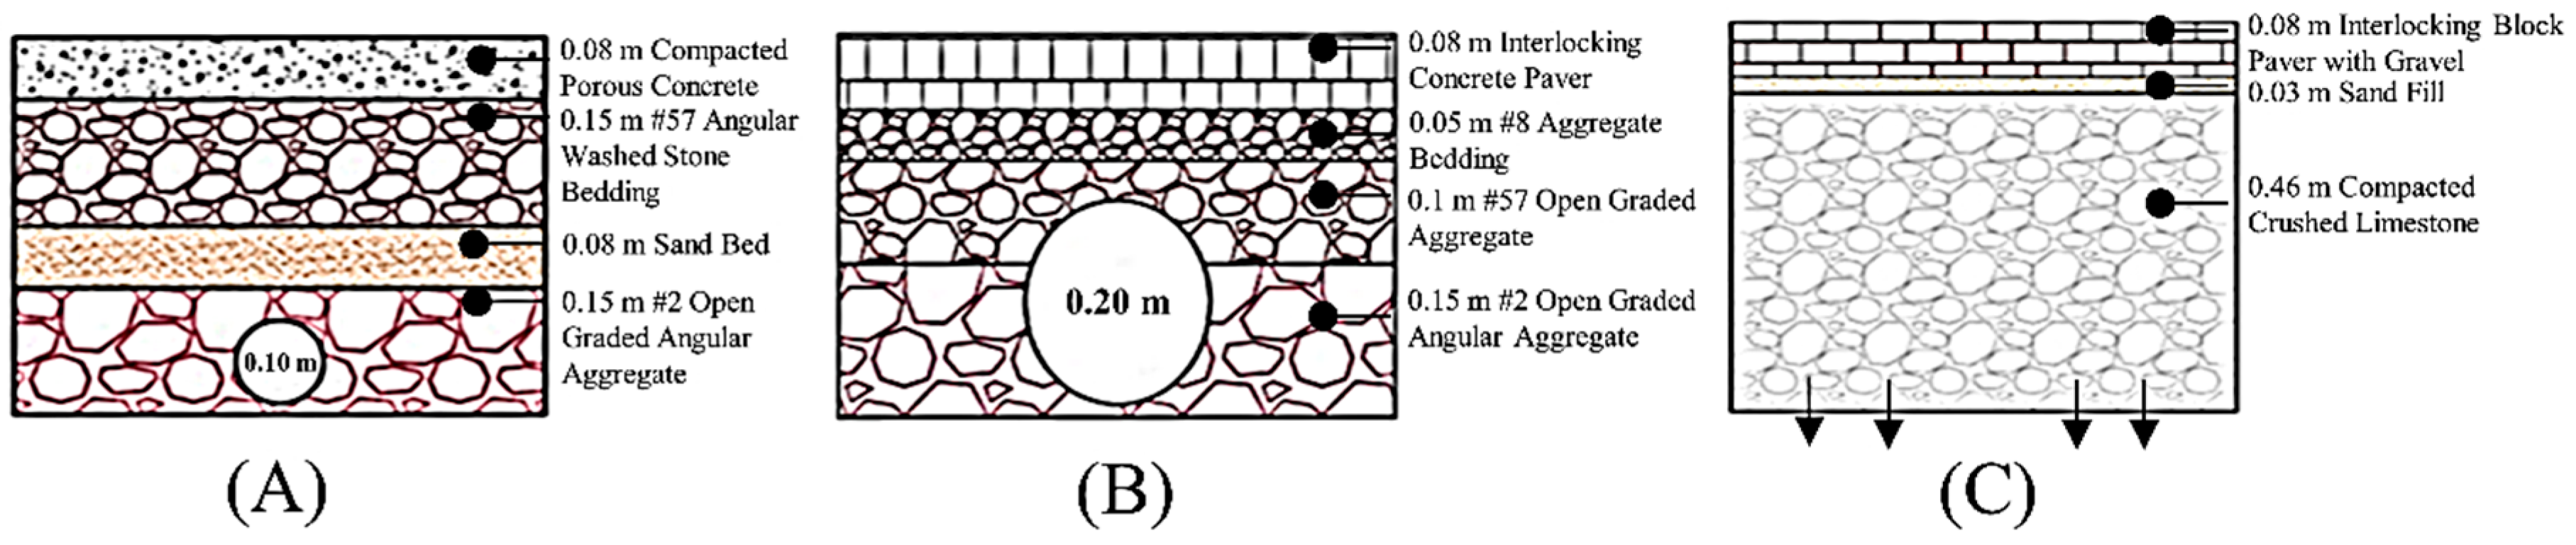
2.2. Pavements Cross Section

After infiltration, the runoff is detained in the base porous media reservoir underneath the PCP before draining to the local storm inlet through a 0.1 m diameter underdrain pipe (Figure 6A). The estimated storage capacity of the existing PCP design was nearly 7 m3. The generated runoff was drained to a dedicated overflow discharge pipe through two curb cuts in a corner. The overflow pipes contained a Thel-mar weir at the downstream of the inlet, which was used to measure the runoff flow rate from the observed PCP section. For the PICP, permeable linear joints or openings allow the stormwater to infiltrate into a bedding layer of crushed stone, followed by a 0.25 m base reservoir consisting of #57 open-graded aggregate. The approximate storage capacity of the existing PICP design was estimated at 48 m3. The large size of the underdrain pipe (0.2 m diameter) was preferred to facilitate rapid drainage from the system (Figure 6B). Regardless of under-drainage, the IBPG design was actually meant to retain stormwater runoff within the top 0.46 m of the base reservoir. Therefore, there was no provision for the underdrain pipe in its design. The only mechanism that governed minimizing runoff was the deep percolation through the subgrade (Figure 6C). The estimated storage capacity of the existing design was nearly 40 m3. From the geotechnical report of this project, the subgrade soil was found to be sandy clay with a seepage rate of 1.27 mm/h.

2.3. Characterization of Pavement Materials

For all the permeable pavements, the surface infiltration rate was measured in the field by a Double Ring Infiltrometer with inner and outer diameters of 0.3 and 0.6 m, respectively. The porosity of base aggregates was measured in the laboratory by following ASTM C830-00 Test standard procedure. Table 2 presents the field and laboratory test results of the characterization parameters of the pavement surfaces and base reservoir materials.

2.4. Runoff Monitoring and Analysis

Within the LRGV LID implementation project, the runoff flow rate at the outfall of each pavement was monitored, sampled, analyzed, and evaluated for a certain period of time. The overall field evaluation procedure was conducted in accordance with the TCEQ approved Quality Assurance Protocol Plan for the LRGV LID implementation project. All instruments or devices used in obtaining rainfall and flow data were calibrated prior to use as needed by following the manufacturer’s instructions. From the initial examination of the raw data, it was suggested that rainfall depths above 2 mm or higher over a 1 h period were adequate to generate a significant volume of runoff. In this study, all monitored permeable pavements were designed to capture and store the runoff volume from a minimum corresponding rainfall depth of 70 mm over a 24 h period. The total inflow volume towards a respective pavement section is the summation of the direct rainfall volume onto the pavement surface (calculated from the measured rainfall depth, multiplied by the area of pavement section) and runoff volume from surrounding drainage sources (e.g., vegetation, asphalt pavement, concrete trail, paved playground, and building roof). The inflow through the pavement section was estimated from rainfall measured by a rain gauge (ISCO 674: Tripping bucket type) installed on the property. When runoff drains towards the curb cut, it enters the overflow discharge pipe and reaches the tip where the Thel-mar weir was placed. Two flow meters (ISCO Signature flow meter with multiple sensor connectivity) were used and connected to the bubbler-level sensors to measure the flow rate at 2 min time interval from the outfall of the discharge pipe of the respective pavement sections. Outflow volume was calculated by multiplying the flow rate with time duration. These flow meters were programmed to send a flow alert to the project team when the flow depth would reach above the notch up to a certain level. The storage volume of each pavement was assessed by calculating the difference between inflow and outflow volume.
Equations (1)–(5) show the equations used to calculate the total inflow volume into the pavement surface, % peak flow reduction, total outflow volume at the pavement’s outfall, total volume stored into pavements, and Normalized Volume Reductions (NVR) from monitored permeable and traditional pavements.
  V i = R ( A p + C 1 A 1 + C 2 A 2 + C 3 A 3 )      
where Vi = Total Inflow Volume onto Pavement Surface (m3); R = Rainfall Depth (mm); Ap = Permeable Pavement Area (m2); A1, A2, A3 = Areas from Surrounding Drainage Sources (m2); and C1, C2, C3 = Runoff Coefficients of Surrounding Drainage Sources.
The flow rate of runoff at the outlets of the pavements was measured by bubbler flow meters. The following equation was used to calculate the % peak flow reduction for all monitored permeable pavements:
%   P e a k   F l o w   R e d u c t i o n = ( T P P F P P P F T P P F ) × 100
where TPPF = Normalized peak flow rate at the outfall of traditional pavement (m3/s) and PPPF = Normalized peak flow rate at the outfall of traditional pavement (m3/s)
The following equations were used to calculate the volume of runoff from all of the monitored pavements,
V o = q 0 × t
where Vo = Total Runoff Volume (m3), q0 = oufflow rate (m3/s), and t = Flow Duration (s)
S t o r a g e   V o l u m e ,   S = V i   V o
N o r m a l i z e d   V o l u m e   R e d u c t i o n   ( N V R ) = ( m 3 m 2 · mm ) =   V i V o A p × R

2.5. Water Quality Analysis

The runoff sample from the first flush was collected manually through a discreet approach (grab sampling) from the designated catchment basin (0.3 m × 0.3 m × 0.3 m). This catchment basin was located at the curb cut and connected to the overflow discharge pipe of each respective pavement section. Samples were labeled with an indelible marker and were preserved in a designated container. Later, samples were transported to the Ana-Lab Corp. (a National Environmental Laboratory Accreditation Conference Institute-certified lab) in Brownsville, Texas, for the water quality analysis. The integrity of the samples was confirmed from the beginning of sampling to transport, receipt, preparation, and analysis of samples. All samples were analyzed for two major water quality parameters, Total Suspended Solids (TSS) and 5-day Biochemical Oxygen Demand (BOD5). This study did not emphasize comparative nitrogen removal study as the monitored IBPG was designed primarily for subgrade infiltration to mitigate runoff [5,43]. Equation (6) was used to calculate Normalized Load Reduction from monitored permeable and traditional pavements:
N o r m a l i z e d   L o a d   R e d u c t i o n   ( N L R )   ( kg m 2 · mm )   =     ( V i V o ) C / ( A p × R )
where C = Pollutant Concentration (kg/m3)
Table 3 summarizes the monitoring period and number of flow and water quality samples collected during the period from the three different types of permeable pavements.
All calculated NVR and NLR values were checked using the Kolmogorov–Smirnov test to see whether these data follow the characteristics of a normal distribution. If these data did not follow the pattern of a normal distribution, any significant difference in results between two pavements was statistically evaluated by using the Mann–Whitney U test or the Wilcoxon Rank-sum Test.

3. Results and Discussion

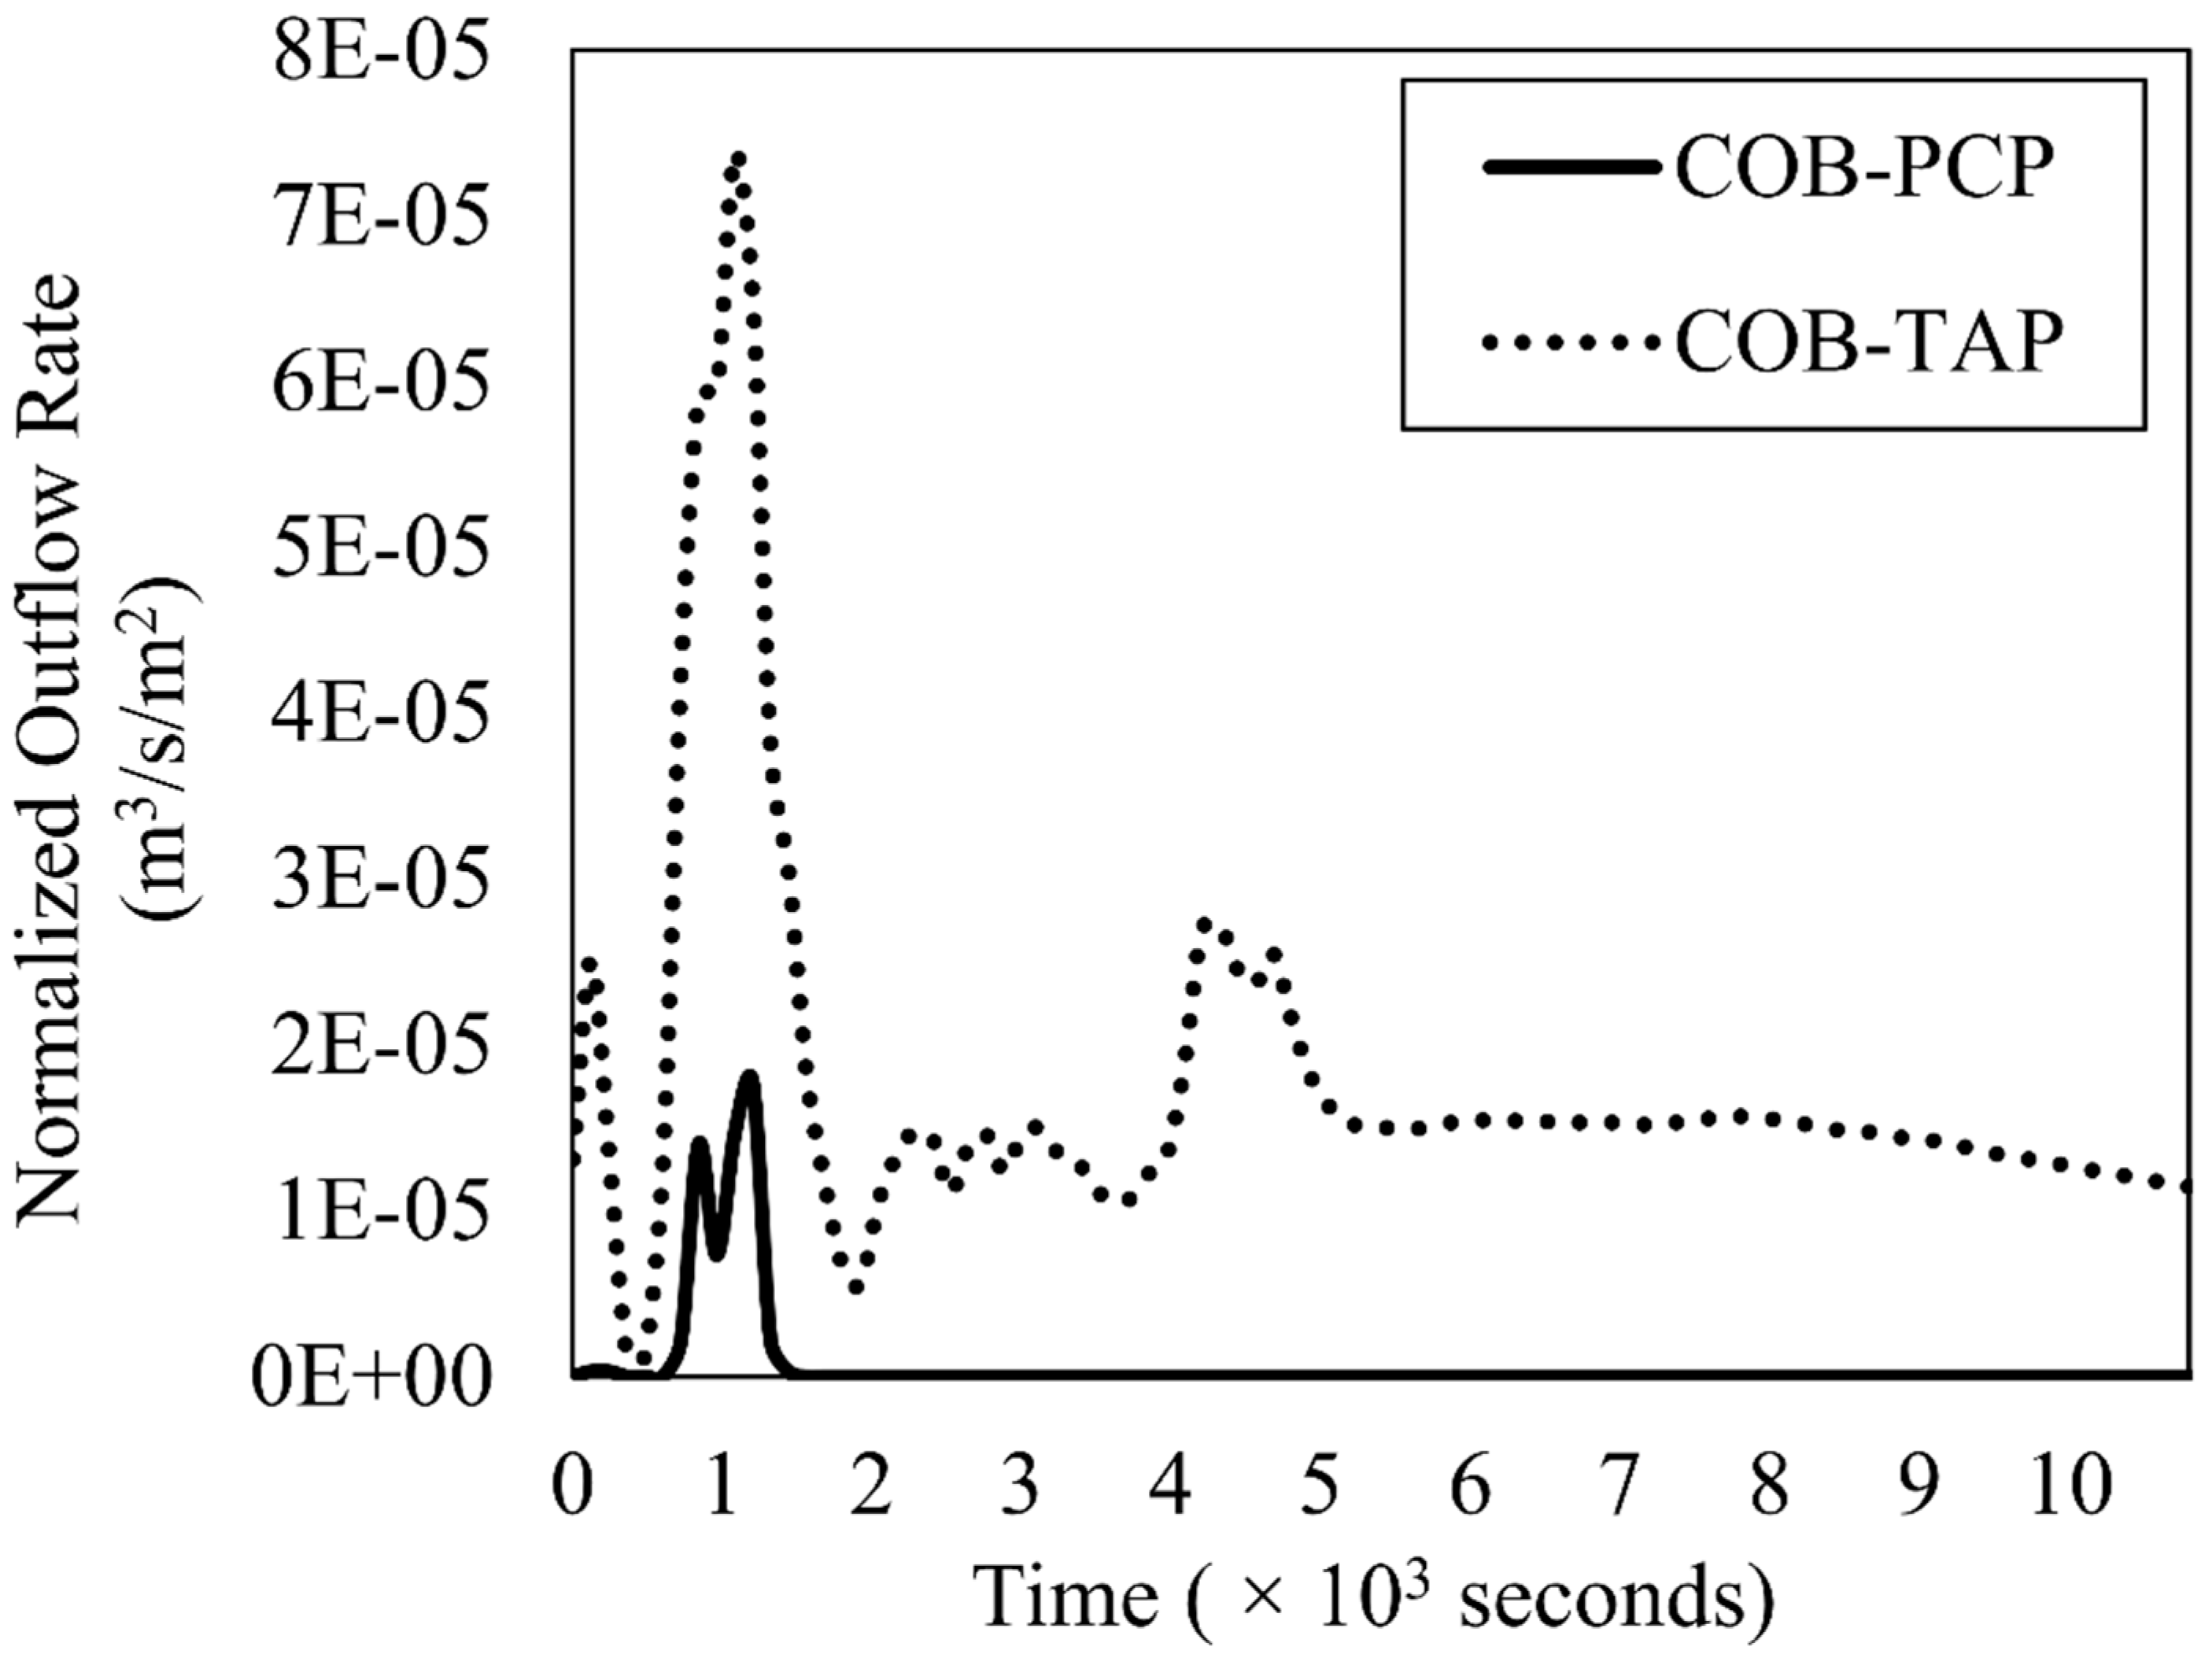
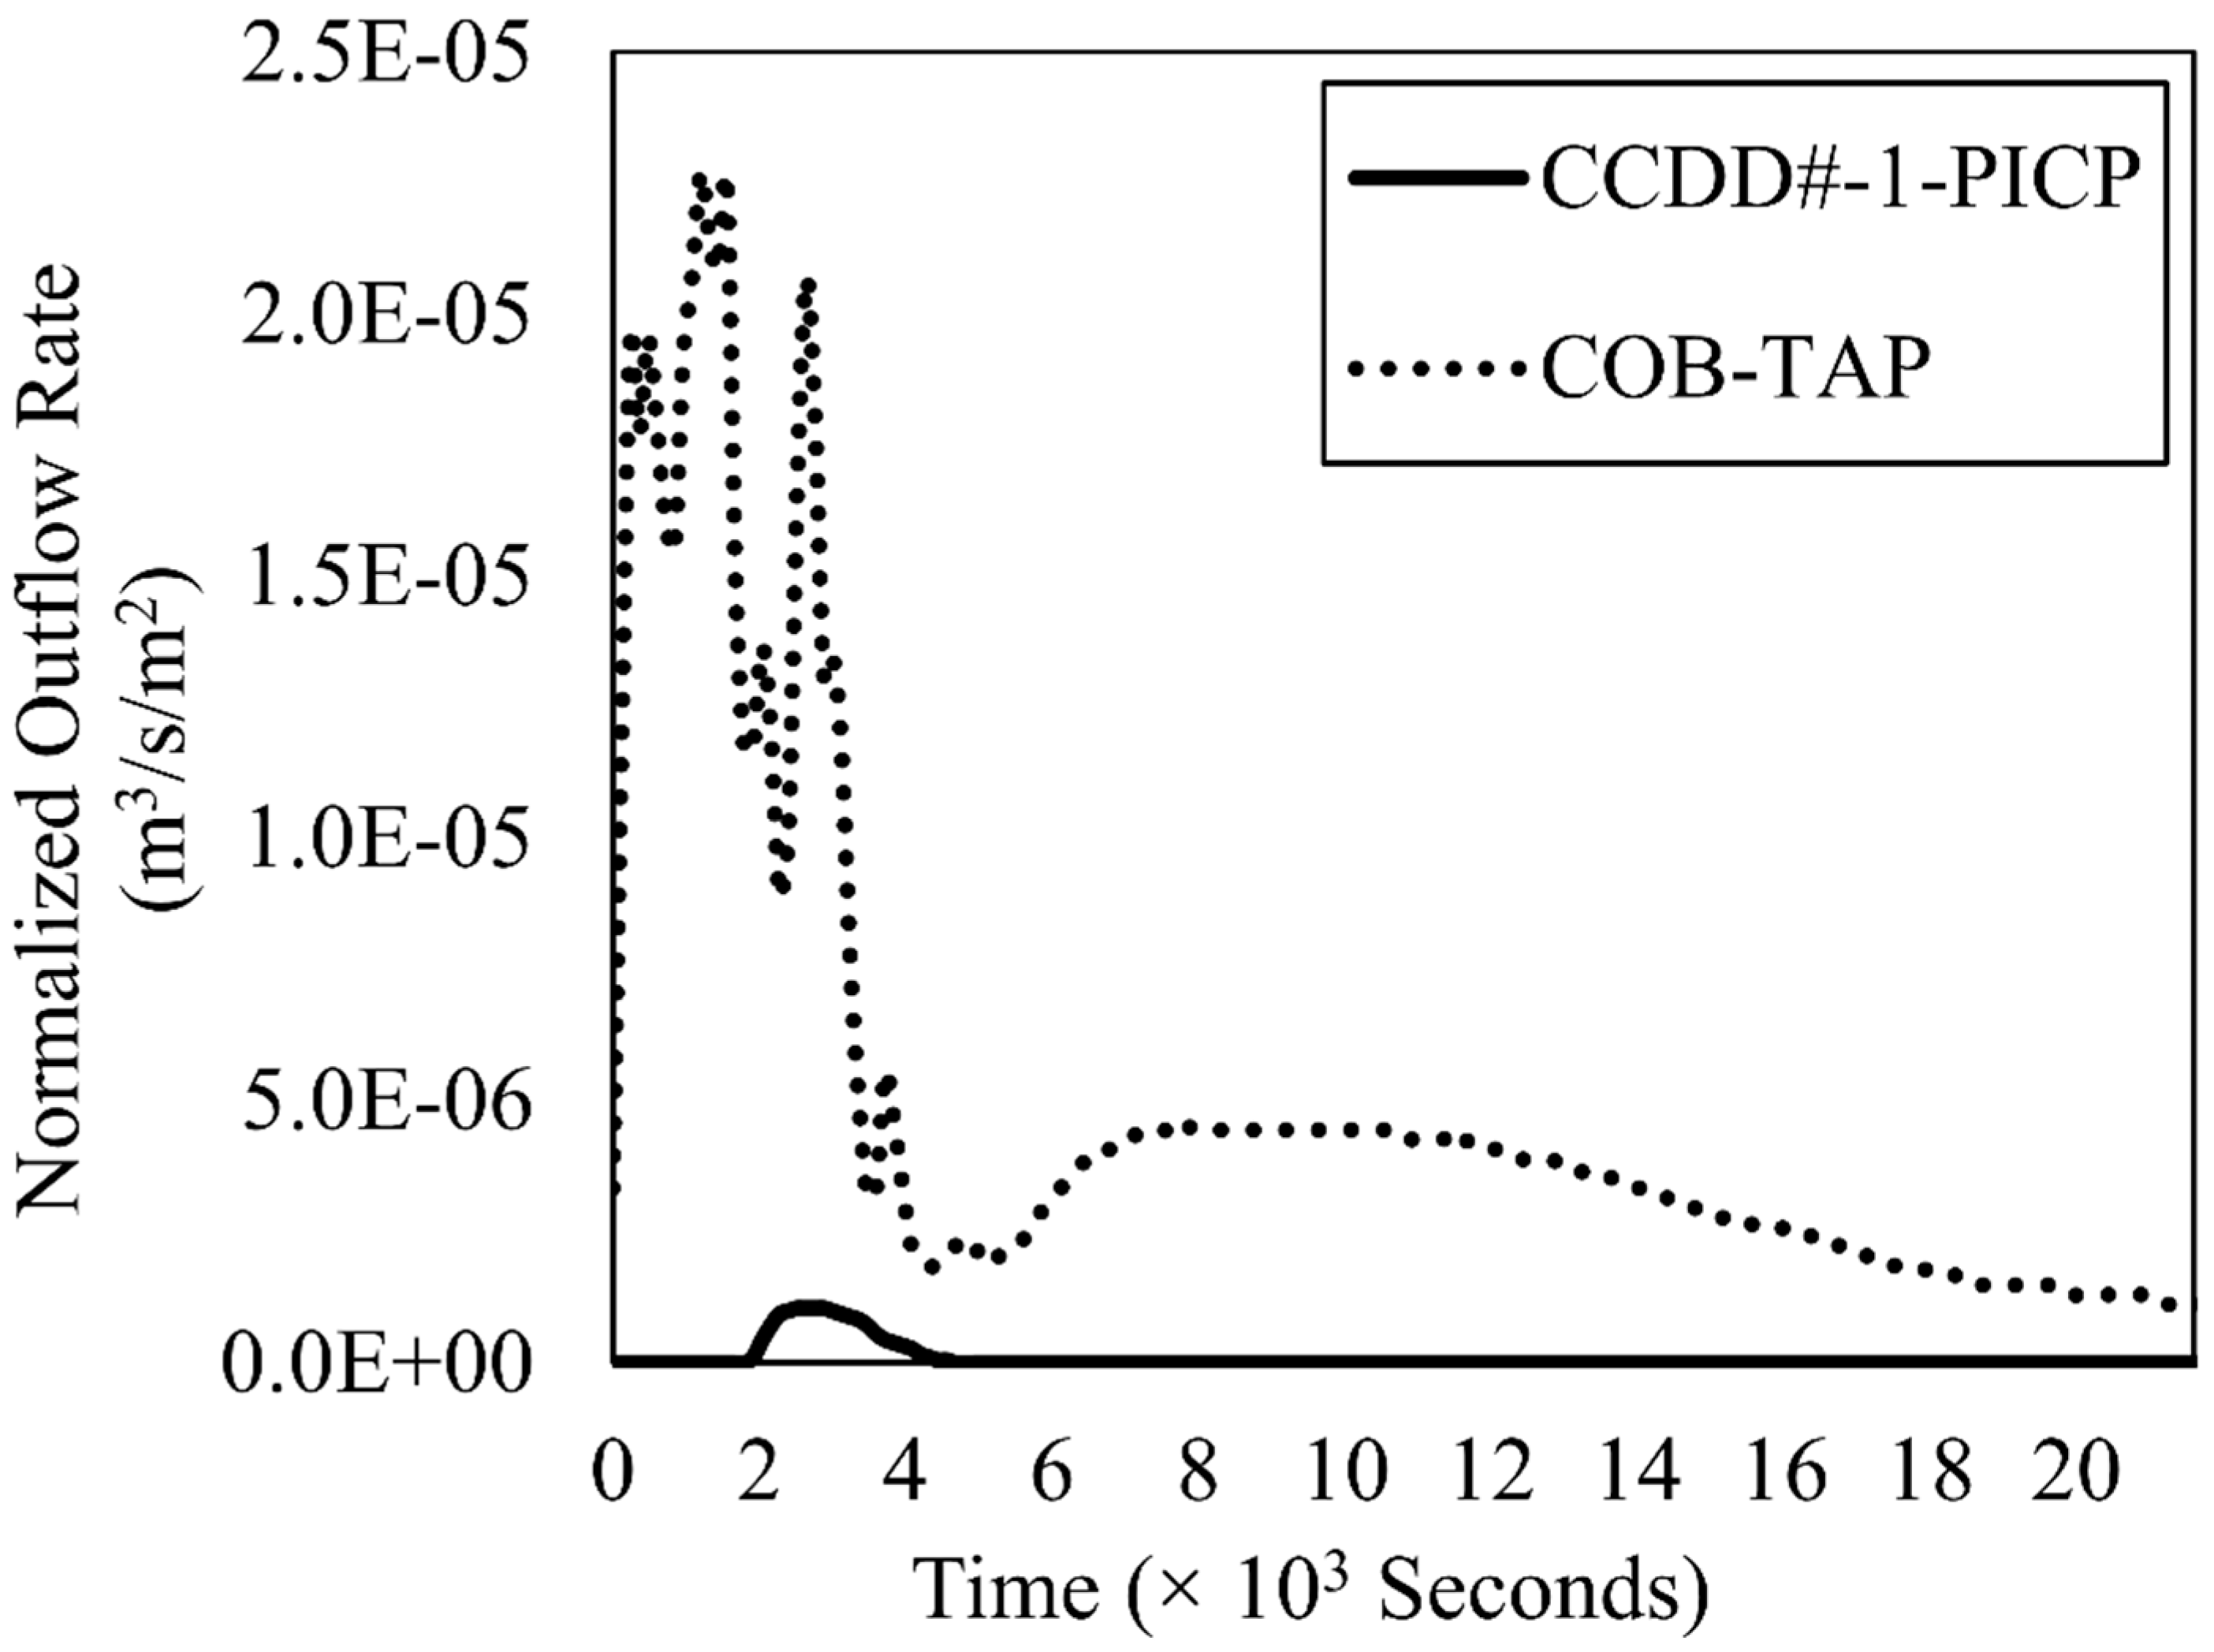
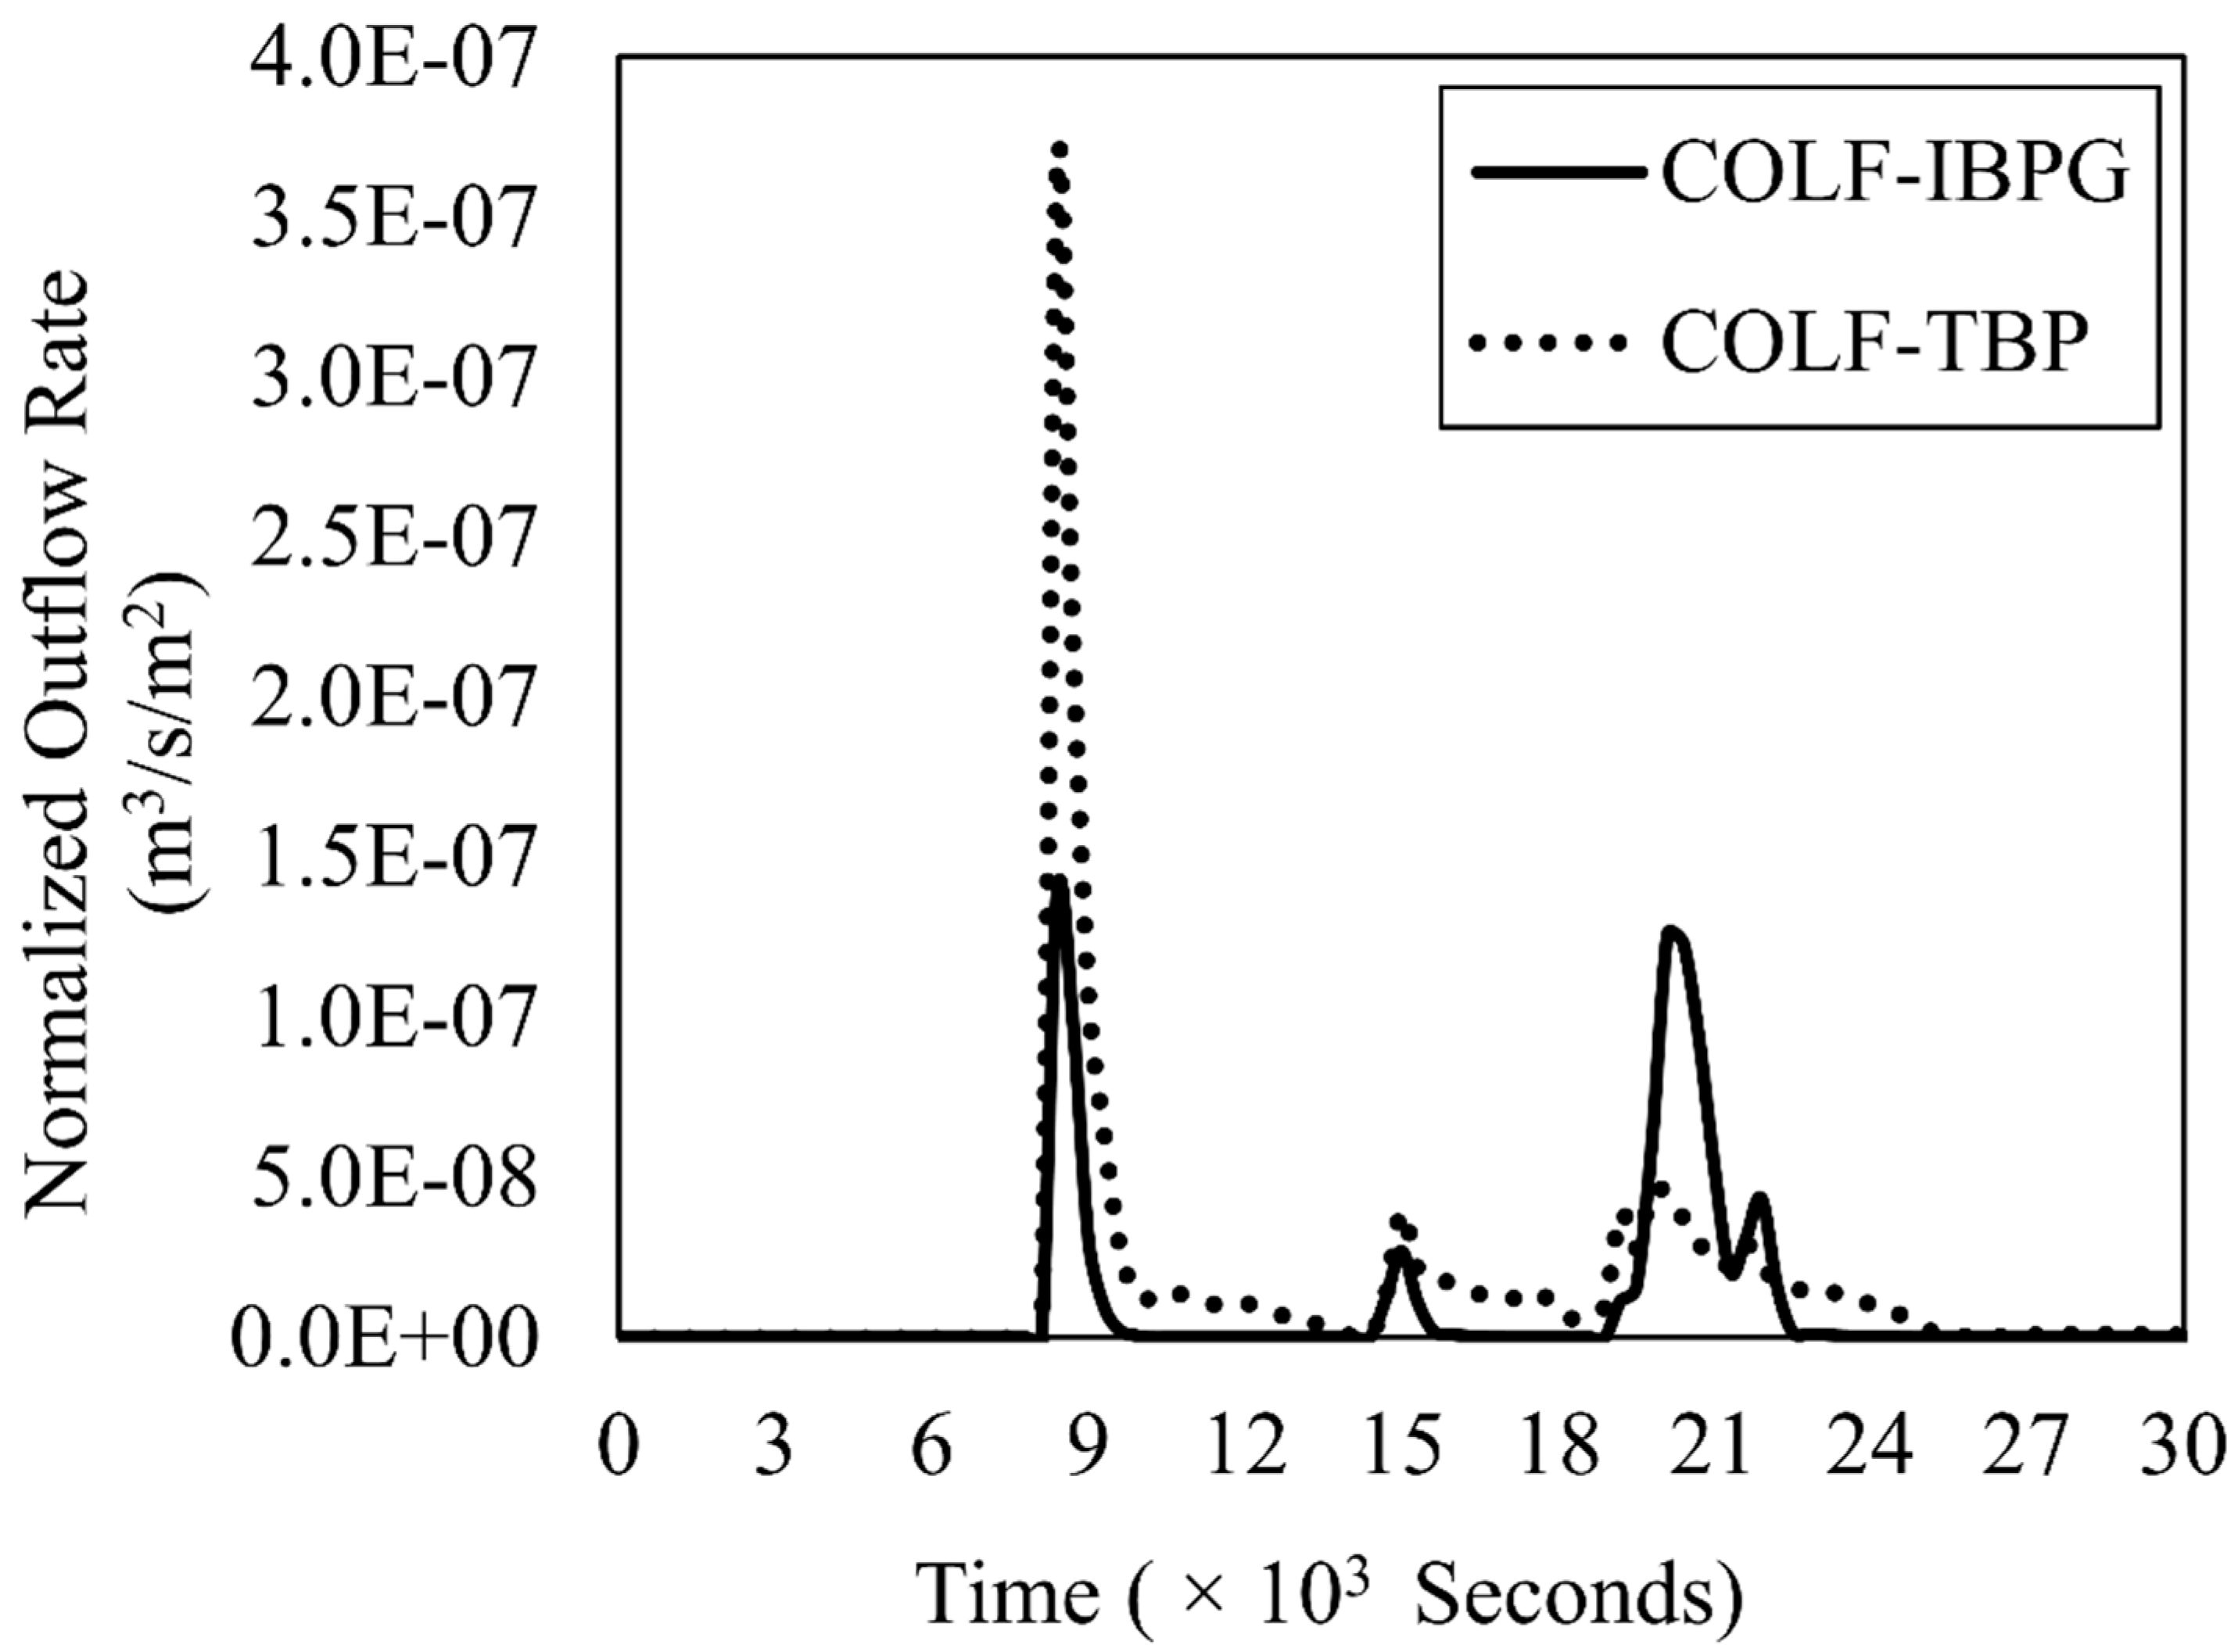
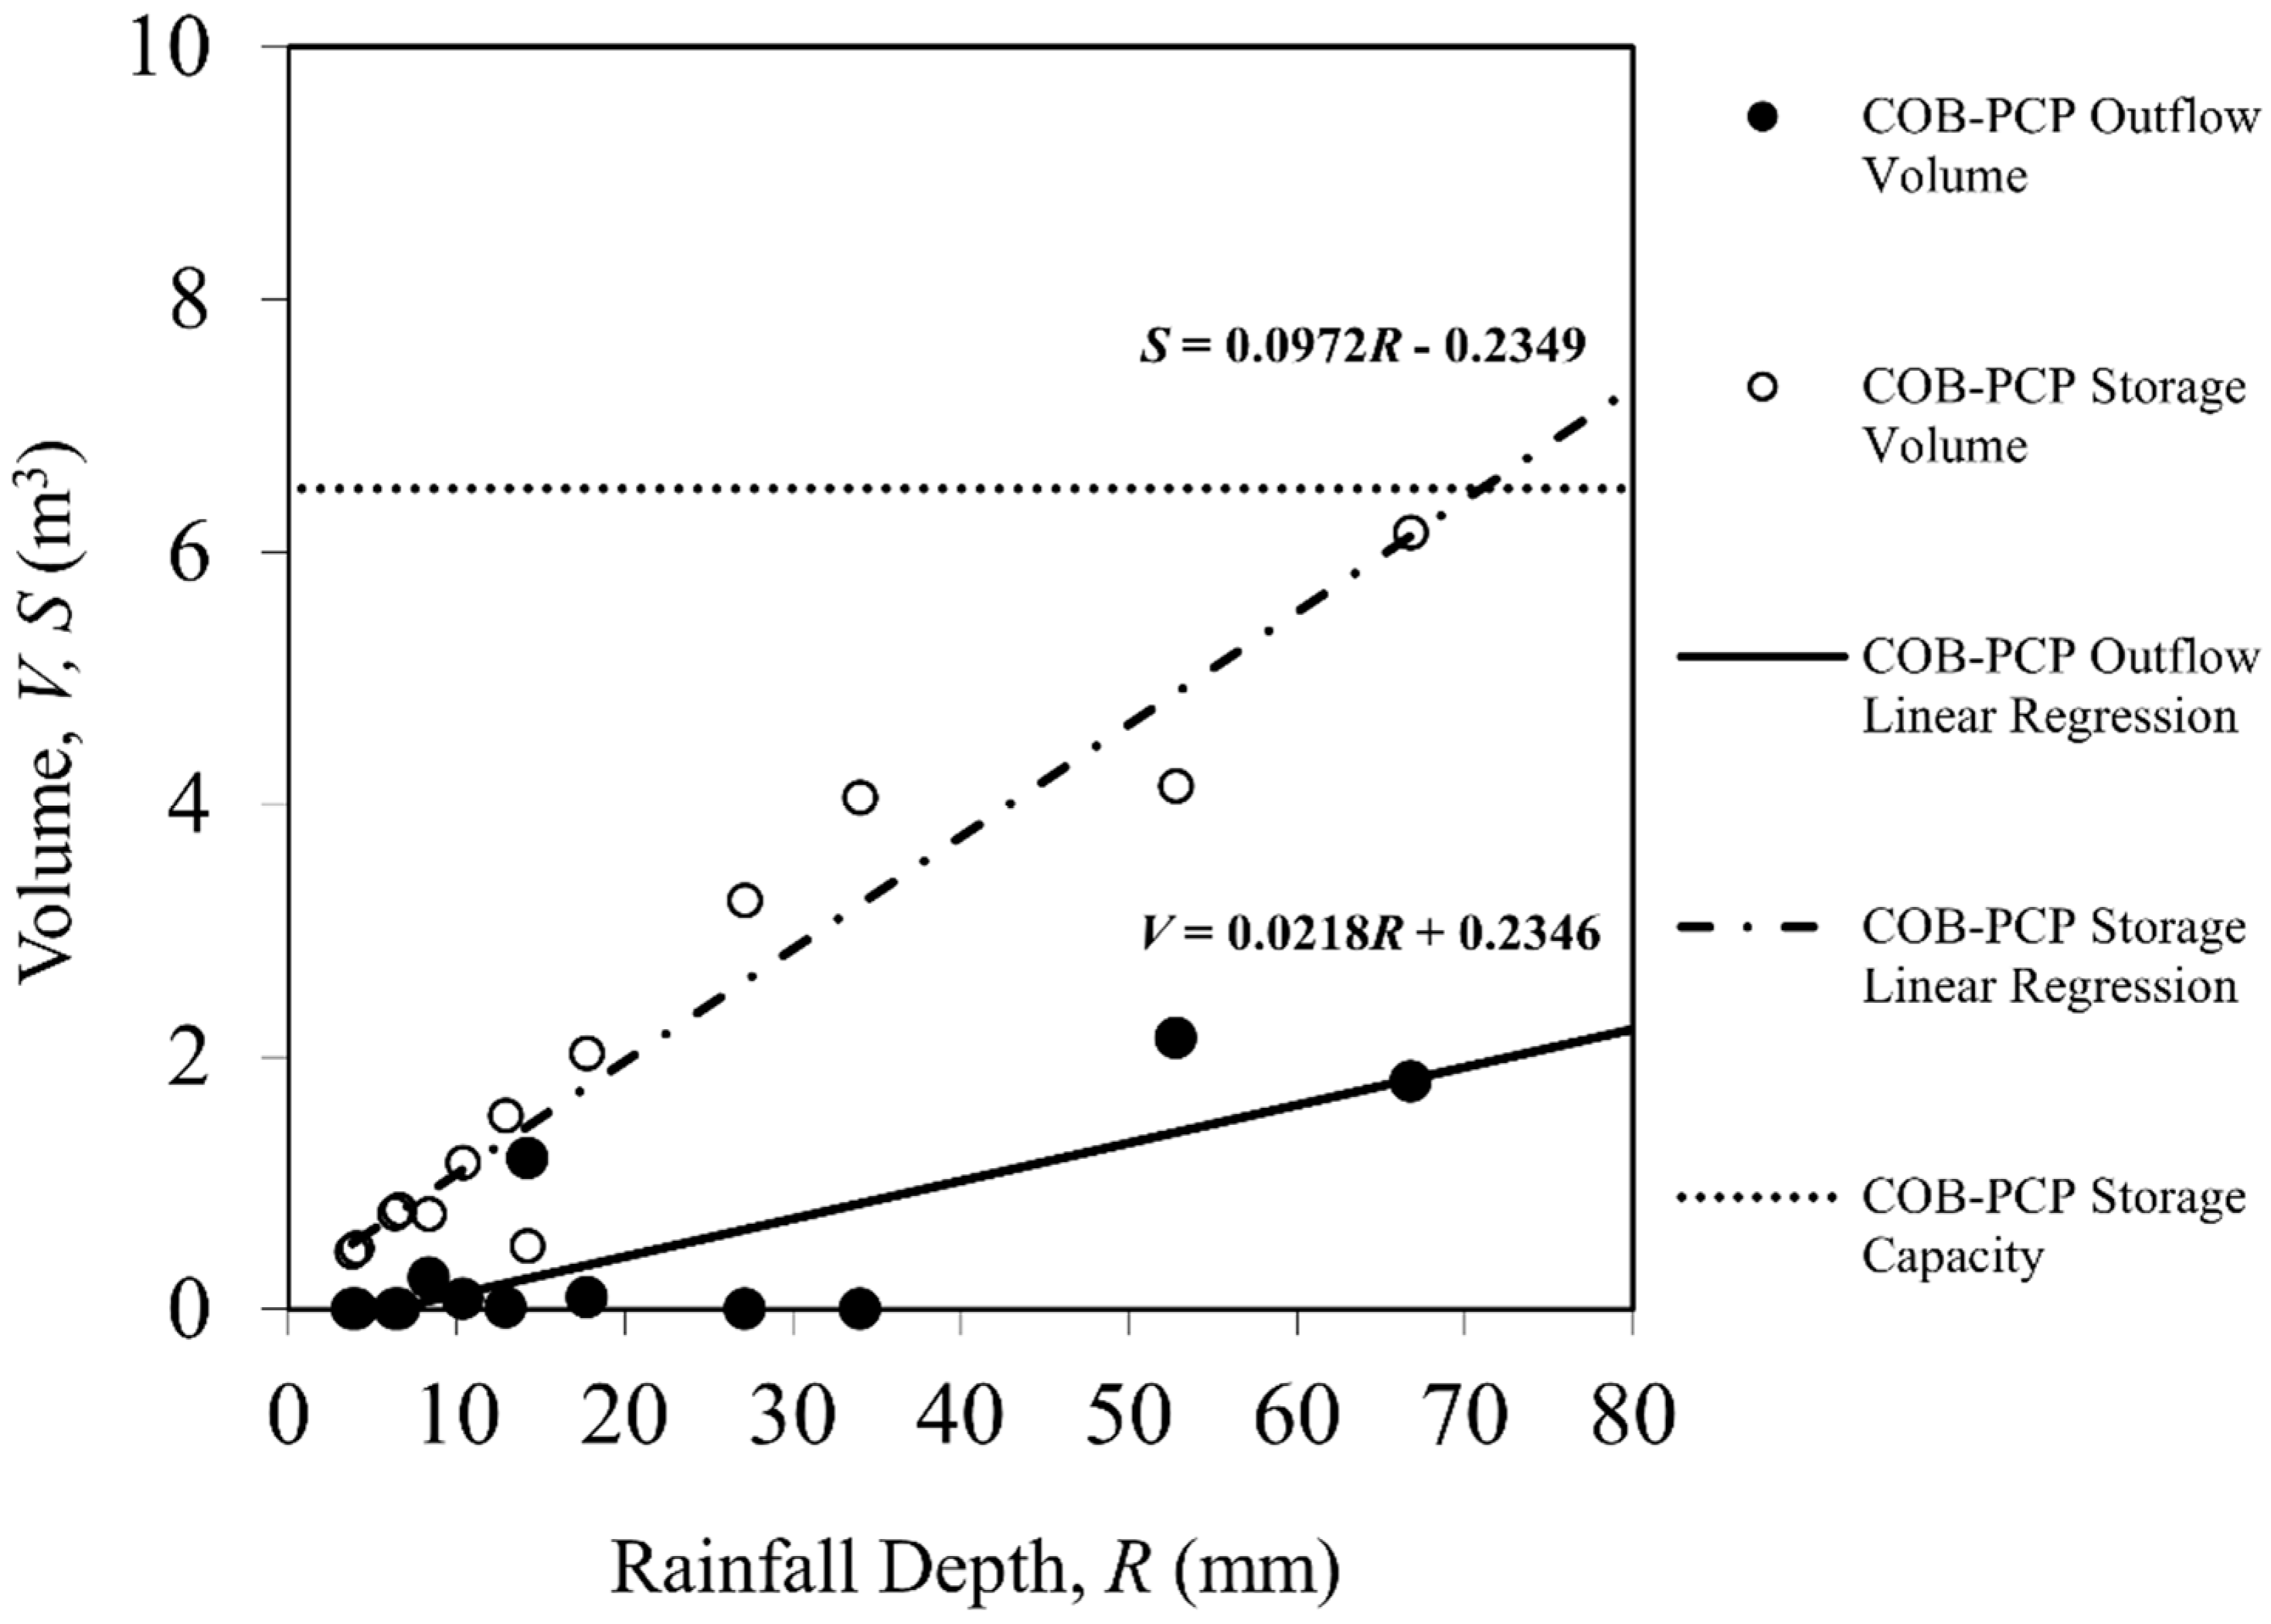
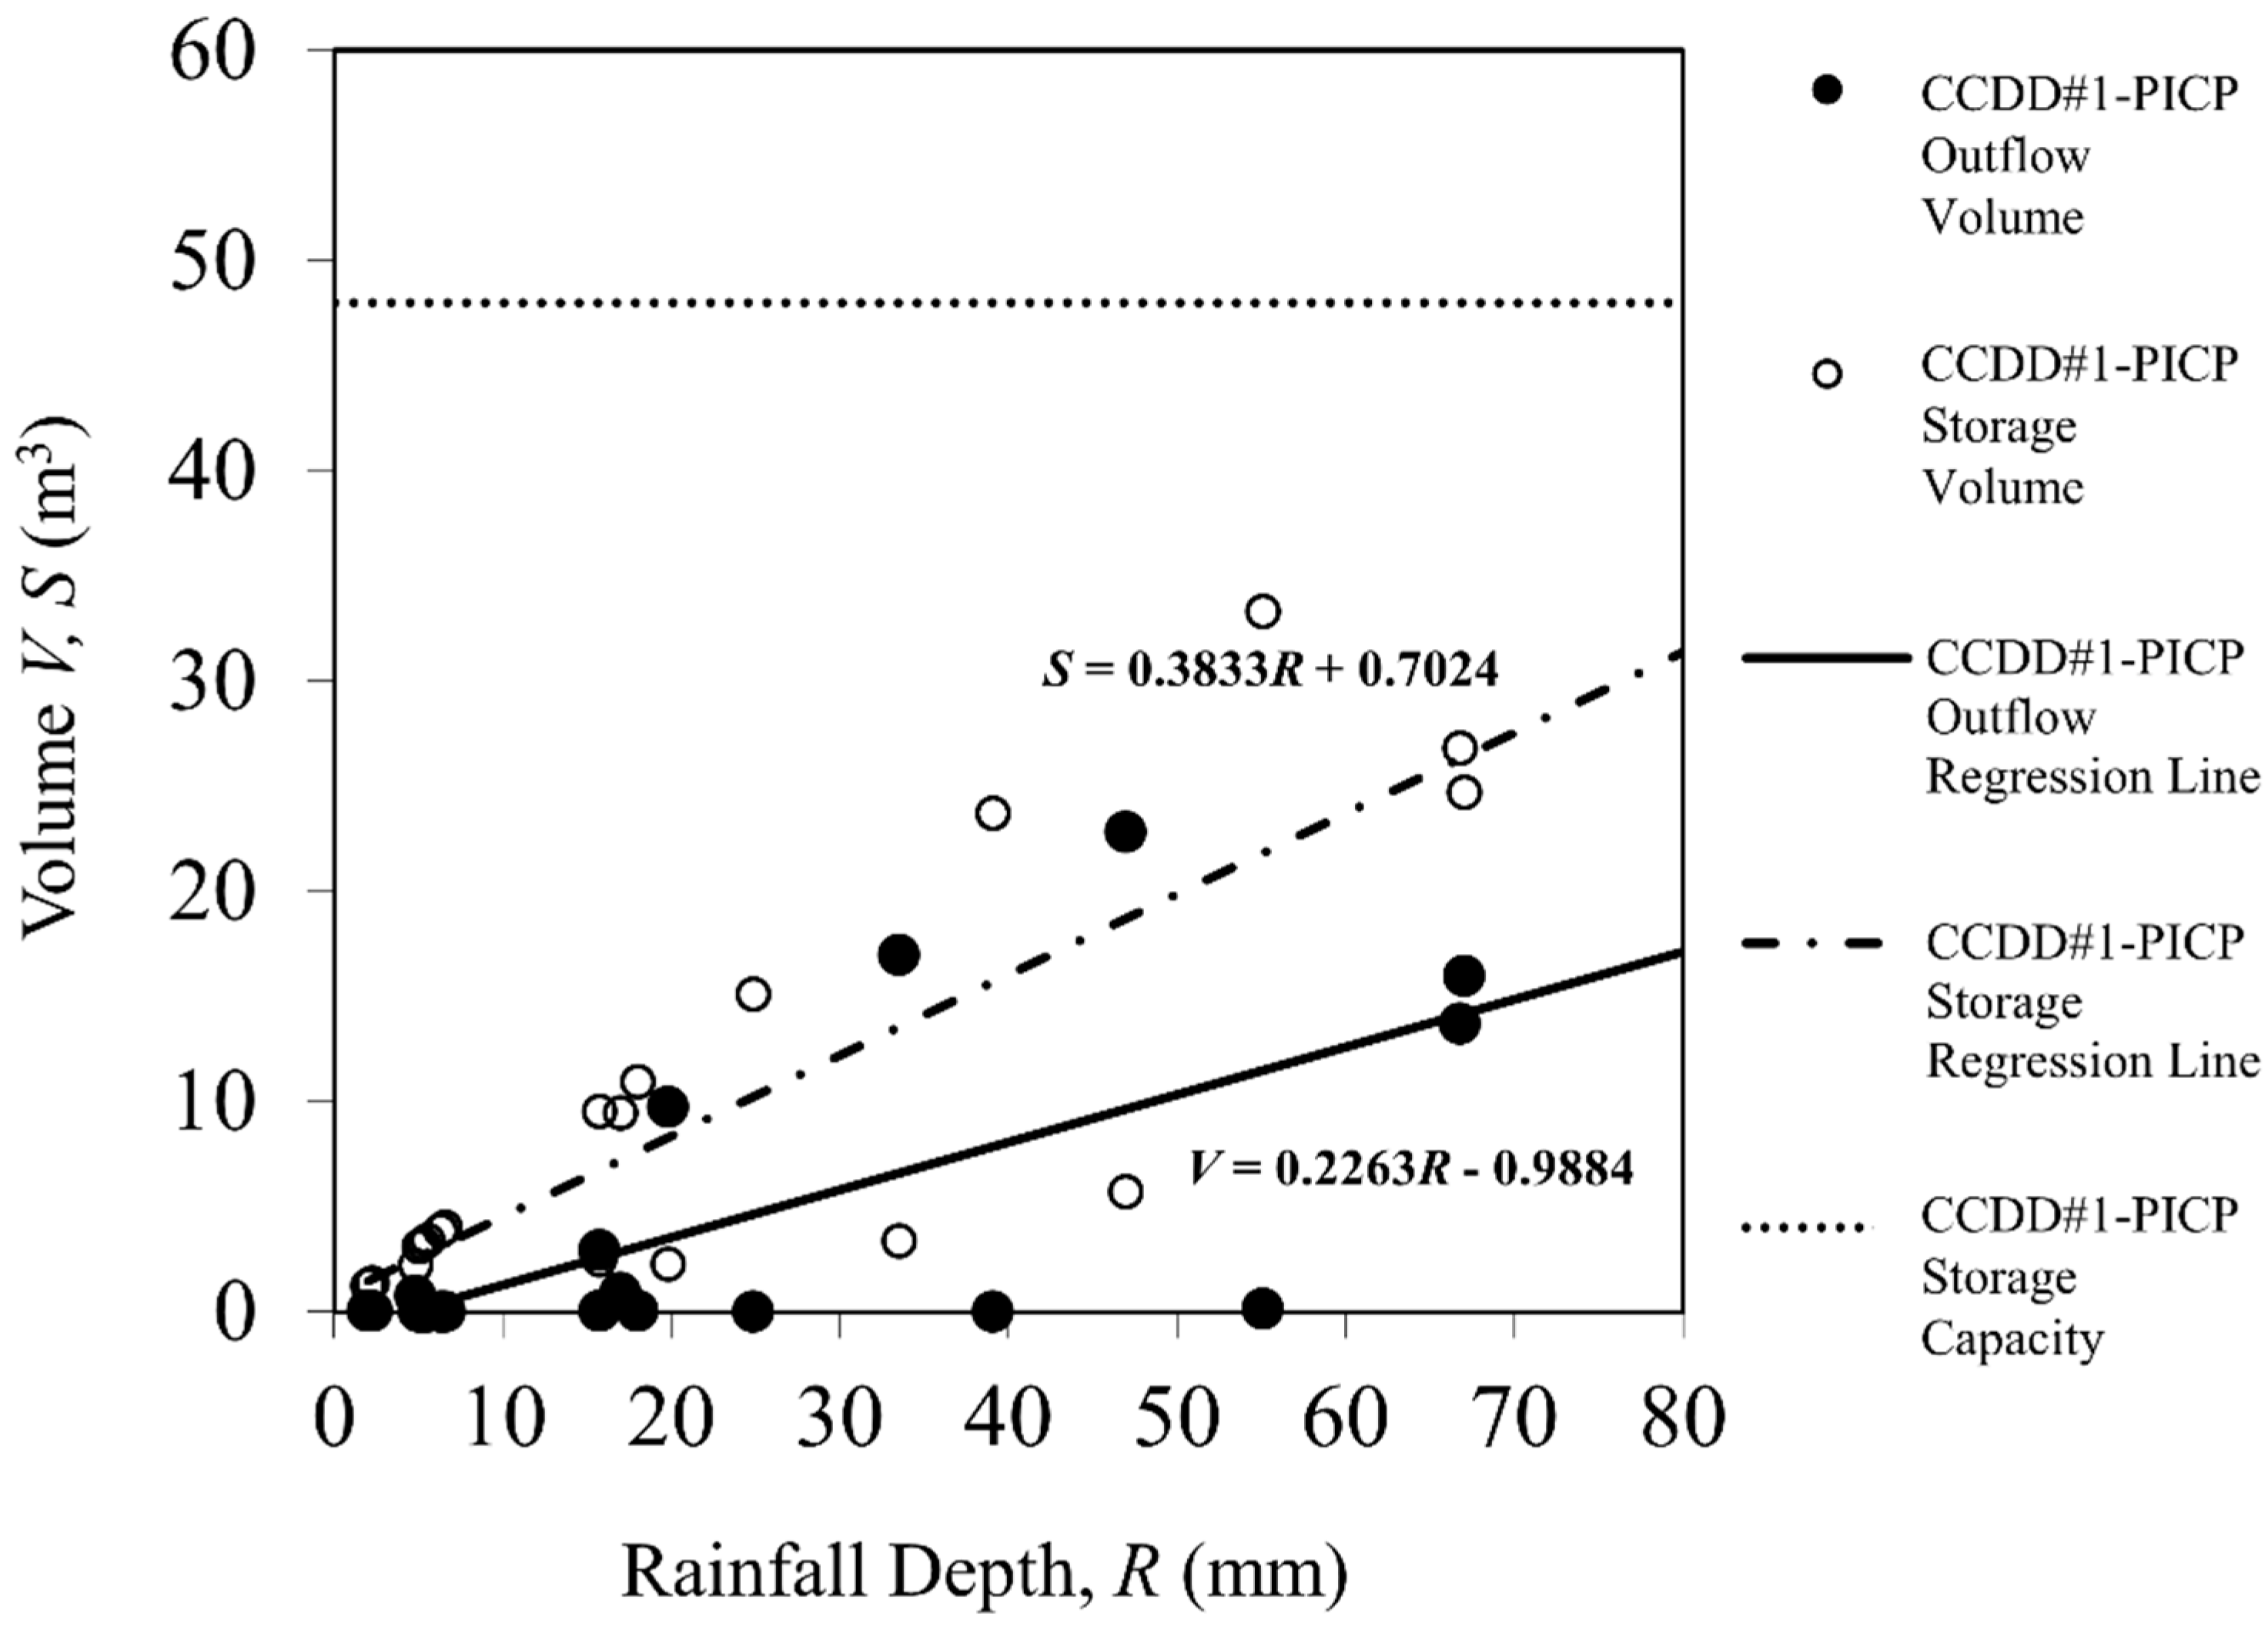
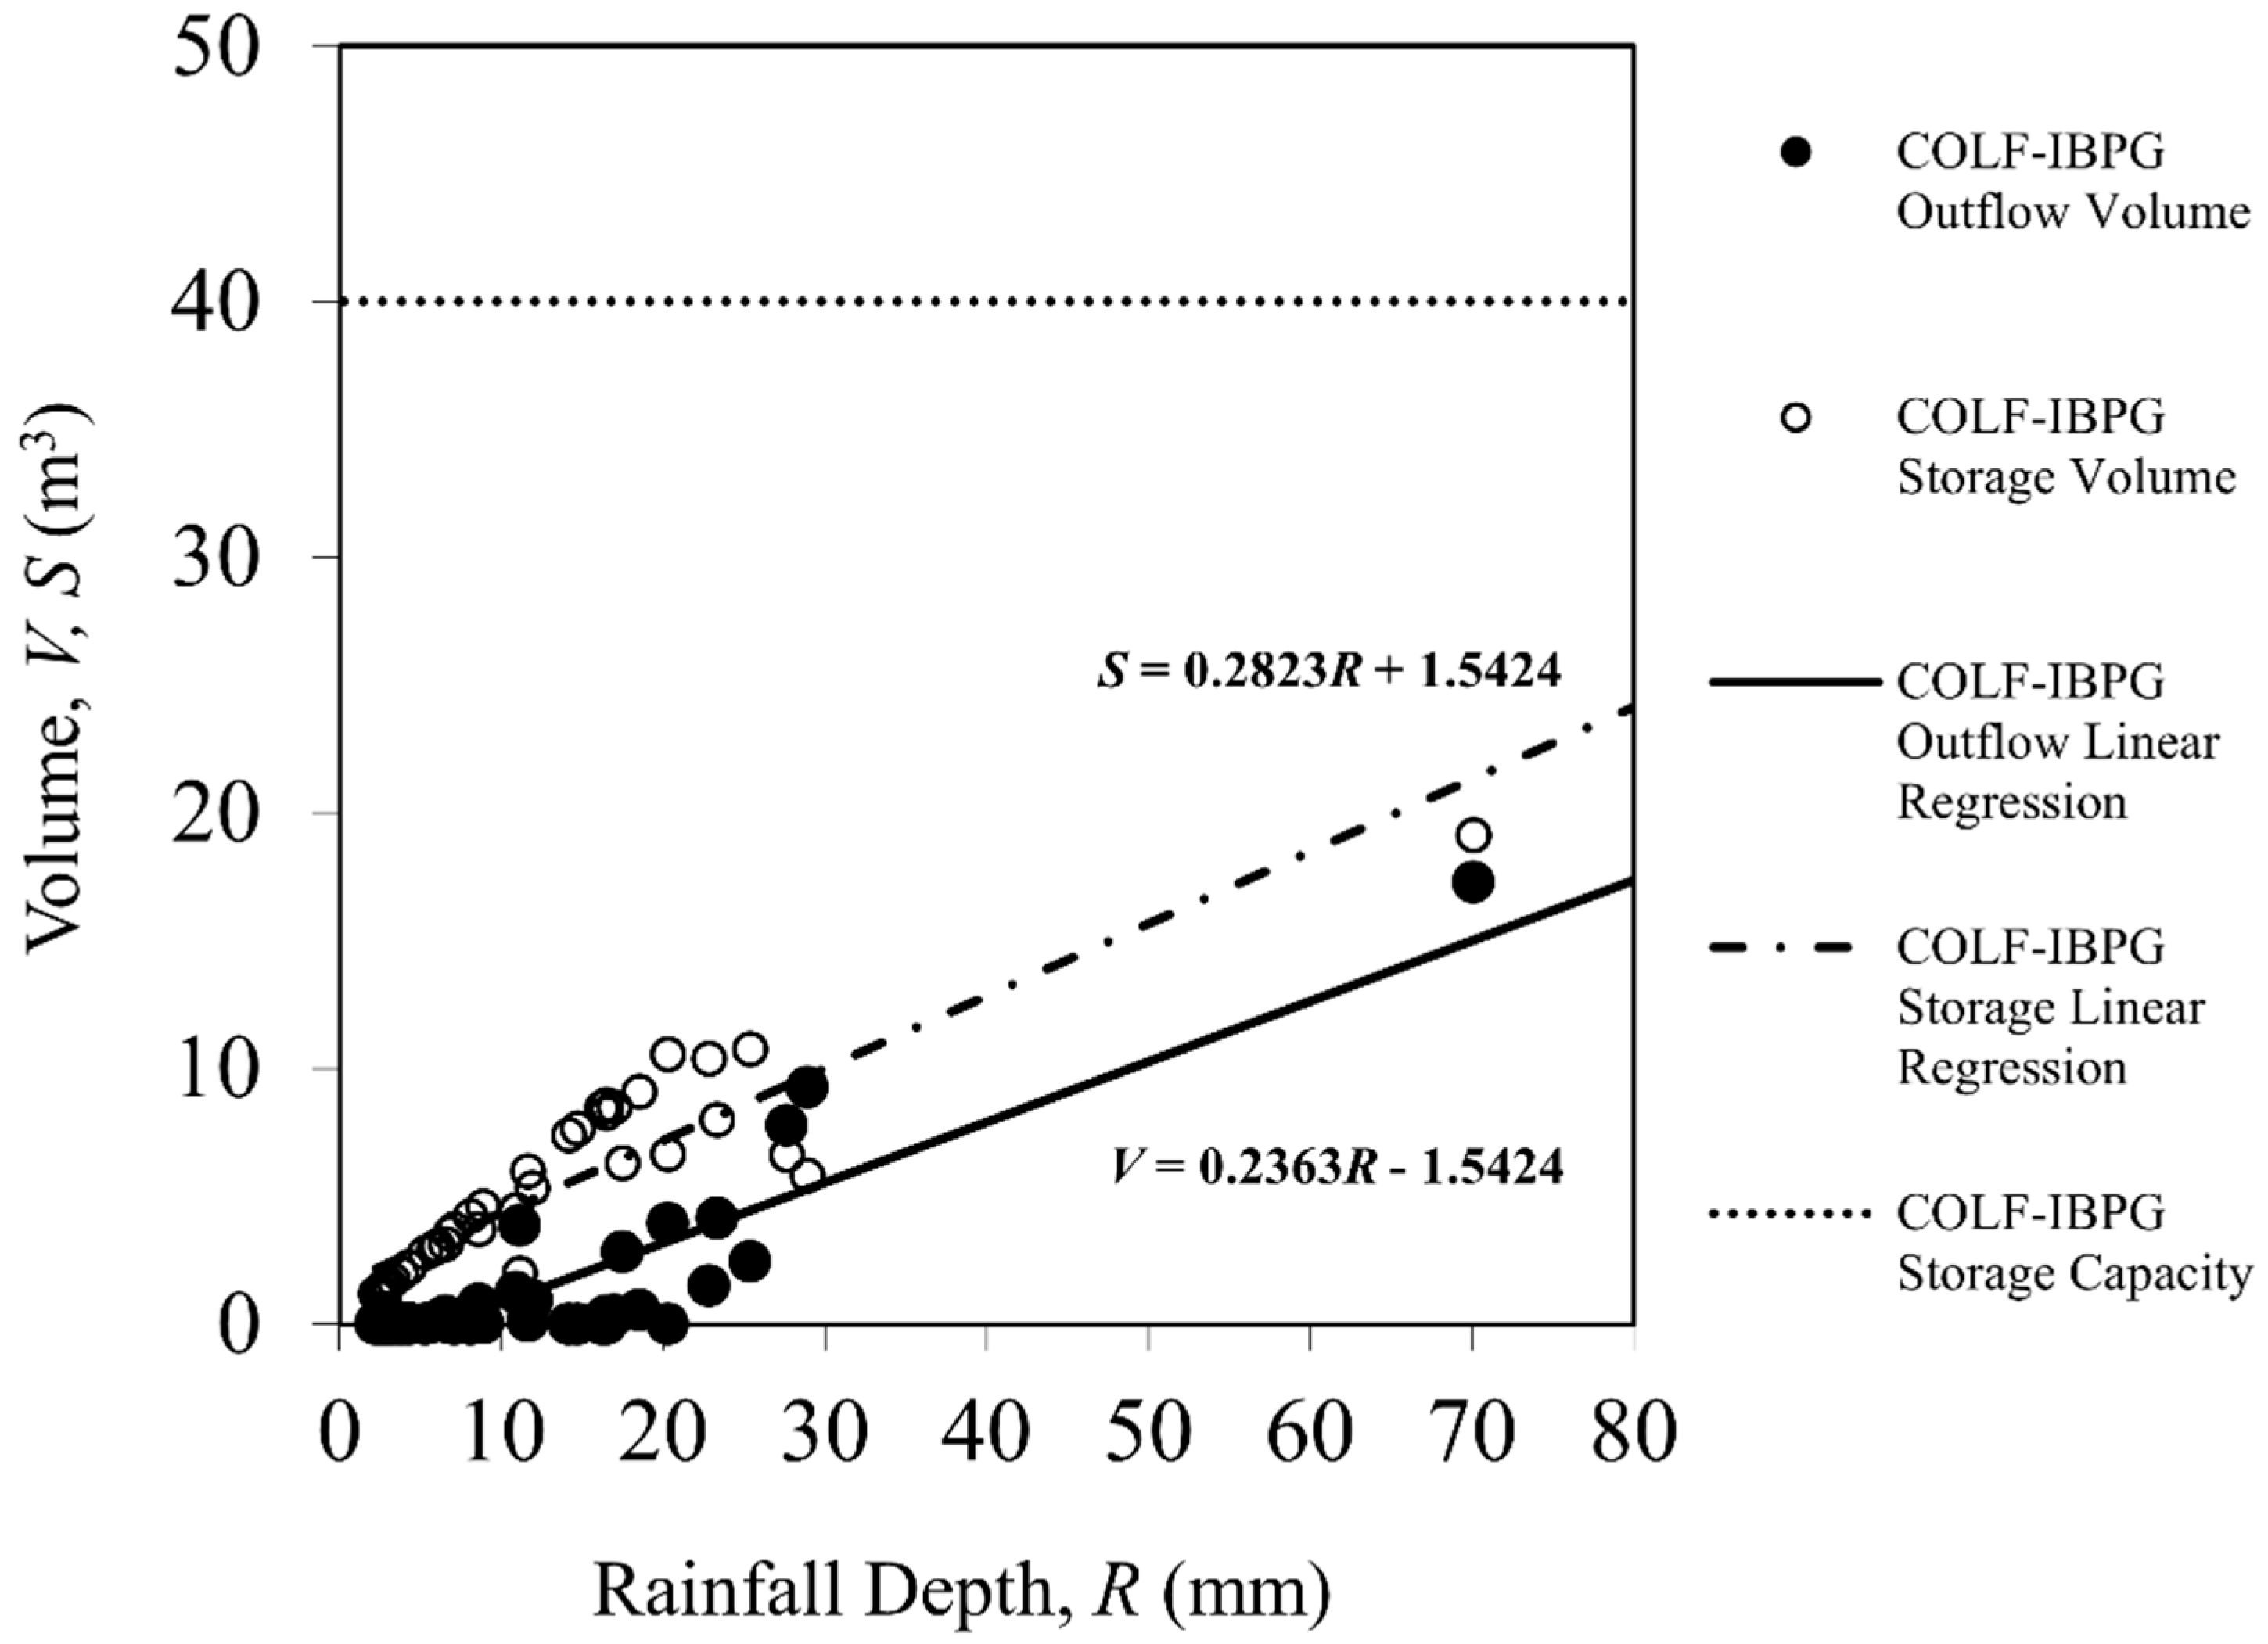
3.1. Peak Flow, Runoff Reduction, and Storage

A total of 13, 20, and 42 flow monitoring events were considered for the daily hydrograph analysis at the outfall of all the monitored pavements in COB, CCDD#1, and COLF sites, respectively. Flow data were collected for each rainfall event for the three permeable pavements and adjacent traditional pavements sections throughout the monitoring period. From each site, pavement behavior across the monitoring period was analyzed to determine runoff reduction and storage capacity at different rainfall depths. Storm events that had a total rainfall depth of less than 2 mm were not considered significant and excluded from the database. The total flow rate was used to calculate total runoff and storage volumes, which were then plotted against the corresponding rainfall depths. The flow results demonstrated that permeable pavements not only reduced the runoff volumes but also attenuated the peak flow at different rainfall depths. Among the three pavements, PCP showed improved reduction performance for both runoff volume and peak flow when compared to PICP and IPBG.
Figure 7, Figure 8 and Figure 9 show examples of hydrographs for the three pavements for a particular rainfall event for each monitored site. These hydrographs demonstrated that the permeable pavements significantly reduced the discharge volume as compared to traditional pavements. In all cases, the runoff of traditional pavements usually mirrored the rainfall spikes, whereas the discharge from the permeable pavements was relatively stable once the peak was reached. For the COB site, the highest rainfall depth was recorded on 13 September 2014, with a total depth of 67 mm. For that event, a hydrograph taken over 3 h is shown, which corresponds to PCP and TAP surface runoff flow rates (Figure 7). The TAP runoff flow rate was reported at the start of the rainfall interval. The traditional asphalt pavement runoff discharge displayed several peak flows for 3-h of rainfall with a total flow volume of 37.5 m3. However, the PCP flow was reported for the duration of only 10 min from 00:14 to 00:24 with a total volume of 0.66 m3. No runoff volume was recorded for the remainder of the storm event. PCP seemed to demonstrate a substantial attenuation of 86% for the peak flow and an increase of lag time from TAP for that flow event.
At the CCDD#1 site, a storm event occurred on 22 October 2014, with a total rainfall depth of 17 mm. Similarly, a hydrograph of PICP and TAP flow rates for more than 6-h is shown in Figure 8. Since there was no traditional pavement monitored at the CCDD#1 station, PICP runoff volume was compared to the COB-TAP runoff for that particular rainfall event. The PICP section has shown a dramatic reduction in the surface runoff volume and peak flow when compared to the TAP. From Figure 8, it appears that TAP demonstrated multiple peaks within the first 57 min of the flow event. The runoff continued with a steady rate after 1 h with a total volume of 16.9 m3. On the other hand, PICP demonstrated an increase in the lag time, showing only a single peak after 30 min of the event. For 6 h of runoff monitoring, the PICP runoff rate was reported for only 45 min, whereas no runoff was observed for the rest of the event. The PICP total runoff volume of 0.87 m3 was calculated, showing an 84% reduction for peak flow as compared to TAP.
Figure 9 depicts the runoff flow rates for IBPG and TBP at the COLF site; the total rainfall depth was 15 mm and occurred on 20 November 2015. For 7 h of the monitoring period, there was a greater runoff volume from the TBP section, as well a higher runoff peak flow rate despite the observed low rainfall intensity. The total flow volumes for TBP and IBPG were 0.2 and 0.088 m3, respectively.
Within the first 2-h of the flow event, IBPG showed a 67% reduction in the peak flow in comparison to TBP. However, IBPG did not show an increase in the lag as observed in the first two types. This result can be explained in terms of the larger drainage area of the COLF site in comparison to COB and CCDD#1 and the lower surface infiltration areas. The drainage to pavement area ratio for COLF was 3.8, whereas the ratio for COB and CCDD#1 was 2.5 and 1.4, respectively. The larger drainage area increased the COLF site runoff catchment and allowed it to receive run-on from the surroundings. At the same time, the IBPG surface area was approximately four times smaller than the drainage area. This outcome could possibly be the reason for the continuous runoff flow to the pavement, which caused no difference in hydrograph lag time between the IBPG and TBP sections.
Several studies concluded that permeable pavements can infiltrate the runoff and reduce its peak flow rate [4,13,19,21,44]. Based on the three series of hydrographs in this work, the peak flow was subjected to a significant attenuation when permeable pavements were brought into application in the semi-arid climatic region of the LRGV. After achieving the peak flow, the runoff volume was diminished as time elapsed for all permeable pavements. Meanwhile, a higher runoff volume was observed at the traditional pavement monitoring sections while permeable pavements demonstrated nearly a negligible discharge. When comparing the three representative hydrographs, PCP showed the highest performance in peak flow reduction despite the high rainfall intensity. Both PICP and PCP showed an increase in lag time, peak flow, and volume reduction. However, data from IBPG are indicative of peak flow and volume reduction with a subtle difference in the lag time.
In cold climatic regions (such as Calgary, Alberta), peak flow from PCP and PICP varied over a range from 21% to 50% [18]. In subtropical and humid climatic regions (such as the US State North Carolina), peak flow was reduced by 67% and 60%–74% for PCP and PICP, respectively [13]. In the semi-arid climatic region of the LRGV, the attenuation of peak flow was quite impressive as compared to other regions studied, ranging from 31% to 100% for PCP, 38% to 100% for PICP, and 42% to 100% for IBPG, perhaps because of increased infiltration due to having little to no sediments/sanding materials or frost penetration effects [19,45,46].
Table 4 shows a summary of the performance of the pavements in terms of Normalized Volume Reduction (NVR). Results from the Kolmogorov–Smirnov test suggest that the NVR data does not follow or slightly follow the characteristics of a normal distribution (skewness: −2.1 to −0.10; kurtosis: −1.22 to 4.6). All monitored permeable pavements showed substantially higher mean and median NVR values as compared to traditional types. In the COB monitoring station, a total of 13 significant rainfall events (Tables S1 and S2) were considered for the analysis of the PCP outflow volume from the monitoring section (Figure 10). PCP produced significantly reduced surface runoff versus TAP throughout the monitoring period. In a study of PCP in Wilmington, NC, no substantial runoff was produced for events up to 30 mm [11]. In this project, no runoff was observed from the PCP surface for six rainfall events; each was below 35 mm of depth with a total of 84 mm. In comparison to the adjacent traditional pavement, the PCP mean NVR has been observed at 2.8 × 10⁻³ m3/m2/mm, which is 98% higher than a TAP value of 0.07 × 10⁻³ m3/m2/mm. Furthermore, the Mann–Whitney U test results indicated that the mean NVR from PCP was significantly (p < 0.05) higher than TAP. Storage regression lines demonstrated that the existing PCP design can capture and store infiltrated runoff for to rainfall events up to 70 mm of depth (Figure 10). Although rapid drainage of infiltrated runoff might be anticipated due to the provision of a 10.1 cm polyvinyl chloride underdrain in the sub-base layer, a very gradual storage increment was noted as rainfall depths increased.
Figure 11 shows the outflow volume of 20 rainfall events (Table S3) considered for CCDD#1-PICP. For certain events, no runoff was observed, even for seven rain events that were less than 39 mm and a total of 93 mm. By comparing PICP to TAP at the COB site, the permeable pavement system NRV was 96% higher than the traditional pavement. From the regression equation of storage, the gradient was determined to be 0.38 m3 per millimeter of rainfall depth. As the drainage was facilitated with a 20.3 cm diameter of underdrain pipe, this might lead to a more rapid release of infiltrated runoff from the reservoir.
Figure 12 shows the results of IBPG at the COLF site for 42 (Table S4) significant rainfall–runoff events. Negligible to no runoff was observed for 17 events with rainfall depths less than 20 mm and a total of 131 mm. Normalized runoff volume was observed to be 46% lower in IBPG surface as compared to TBP (Table S5) with the average NVR of 2.2 × 10⁻³ and 0.05 × 10⁻³ m3/m2/mm, respectively. Results from the Mann–Whitney U test demonstrate that NVR is significantly (p < 0.05) higher in IBPG over TBP throughout the entire monitoring period. As there was no underdrain provision in IBPG design, the extensive 0.46 m of base storage might be adequate to store the infiltrated runoff for a certain time period prior to percolating through the subgrade. From the regression equation of storage, the outflow gradient was determined to be 0.28 m3 per millimeter of rainfall depth. The calculated rainfall depth was 136 mm, up to which the existing IBPG design appears to hold the infiltrated runoff within the base reservoir. These results indicate that the existing IPBG can capture runoff volume corresponding to rainfall depths far above the design depth of 70 mm.
Overall, the analyzed results clearly demonstrate a higher runoff reduction potential for all of the permeable pavement systems, as opposed to traditional pavement systems, which were limited to a certain rainfall range, design, and drainage condition. In cold climatic regions, the reduction in surface runoff volume has been observed at ~16–57% for maximum rainfall depths ranging between 52 and 90 mm and DA/PA of at least 4:1 [22,47]. In subtropical and humid climatic regions, exfiltrate volumes were 37%–66% of the surface runoff volumes for monitored permeable pavements with a maximum rainfall depth of 183 mm and DA/PA of 1:1 [13]. For the semi-arid climatic region, our data demonstrated improved runoff reduction potential for PCP; between 80% and 87% for maximum rainfall depths of up to 70 mm and DA/PA at least 2.5:1. Clearly, the regional hydrologic performance of permeable pavements depends on the geographic location and soil type and climate conditions, probably linked to the change in infiltration potential. Since the local performance of a permeable pavement system is influenced by its design and construction, the results can be discussed based on several factors, including storage depth, paver configuration, and characteristics of materials [5]. Comprehensively, the PCP type was observed to have an improved runoff reduction potential as compared to IBPG and PICP types in this project. This result might be explained in terms of the high surface infiltration rates of the PCP in this installation.
Unlike conventional concretes, the fine portion of the porous pavement was greatly reduced in the porous concrete mix, which allows for the forming of inter-connected void spaces within the concrete matrix while curing [11]. In the COB-PCP design, the 15.2 cm base reservoir of PCP consisted of highly permeable #57 open-graded washed stone with 35% porosity. This design probably helped detain a significant volume of runoff after infiltration through the porous surface. The stability of storage layers was ensured by installing 5 cm sand layer above the reservoir to prevent the migration of aggregates. In most block pavers, the runoff reduction mechanism is usually dominated by the infiltration through linearly permeable joints and concrete absorption. Additionally, the pea gravel-filled enlarged cell opening units in the existing IBPG design (Figure 2) helped to improve the infiltration capacity throughout the paver surface. Furthermore, an extensive base reservoir (45.7 cm) in IBPG consisted of crushed limestone with 40% porosity. This surface might prolong the IBPG storage over regular PICP. Unlike IBPG, infiltration was typical through permeable joints in existing PICP design at the CCDD#1 site. An enlarged (20.3 cm) perforated underdrain overlapped the base and subbase layer (Figure 3) and appeared to facilitate the rapid drainage of runoff outside of the site rather than detaining the water within the base reservoir.

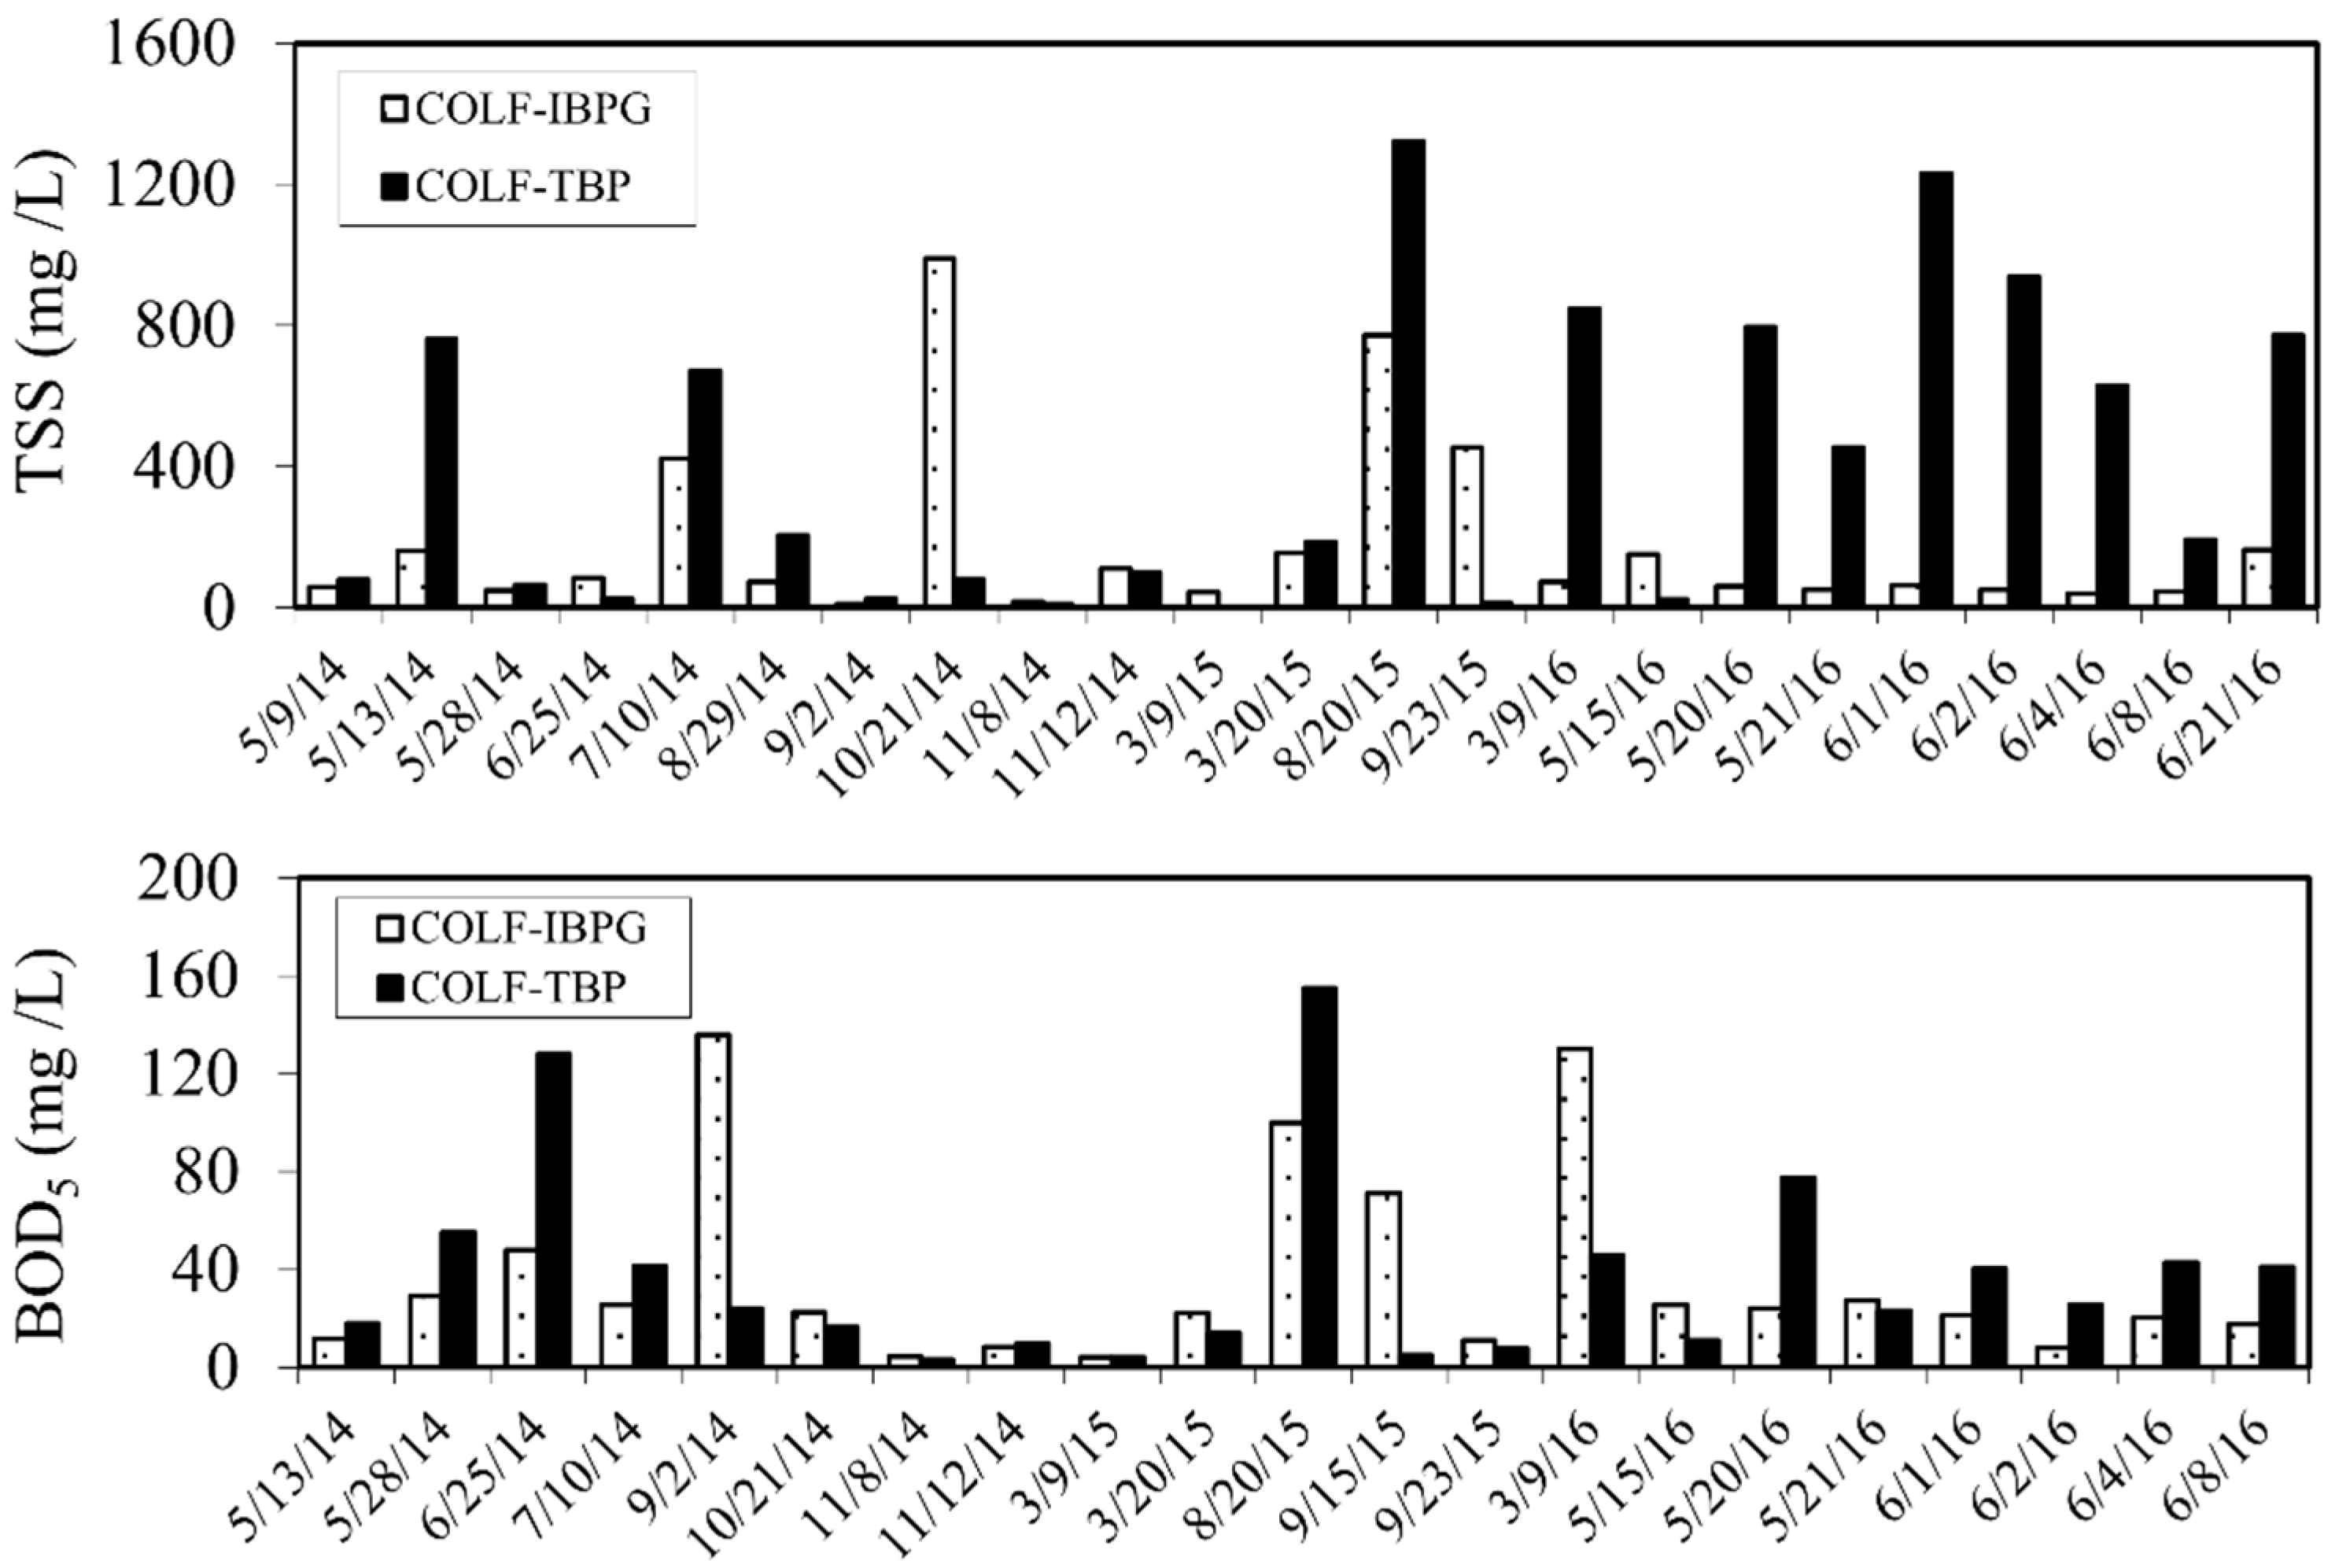
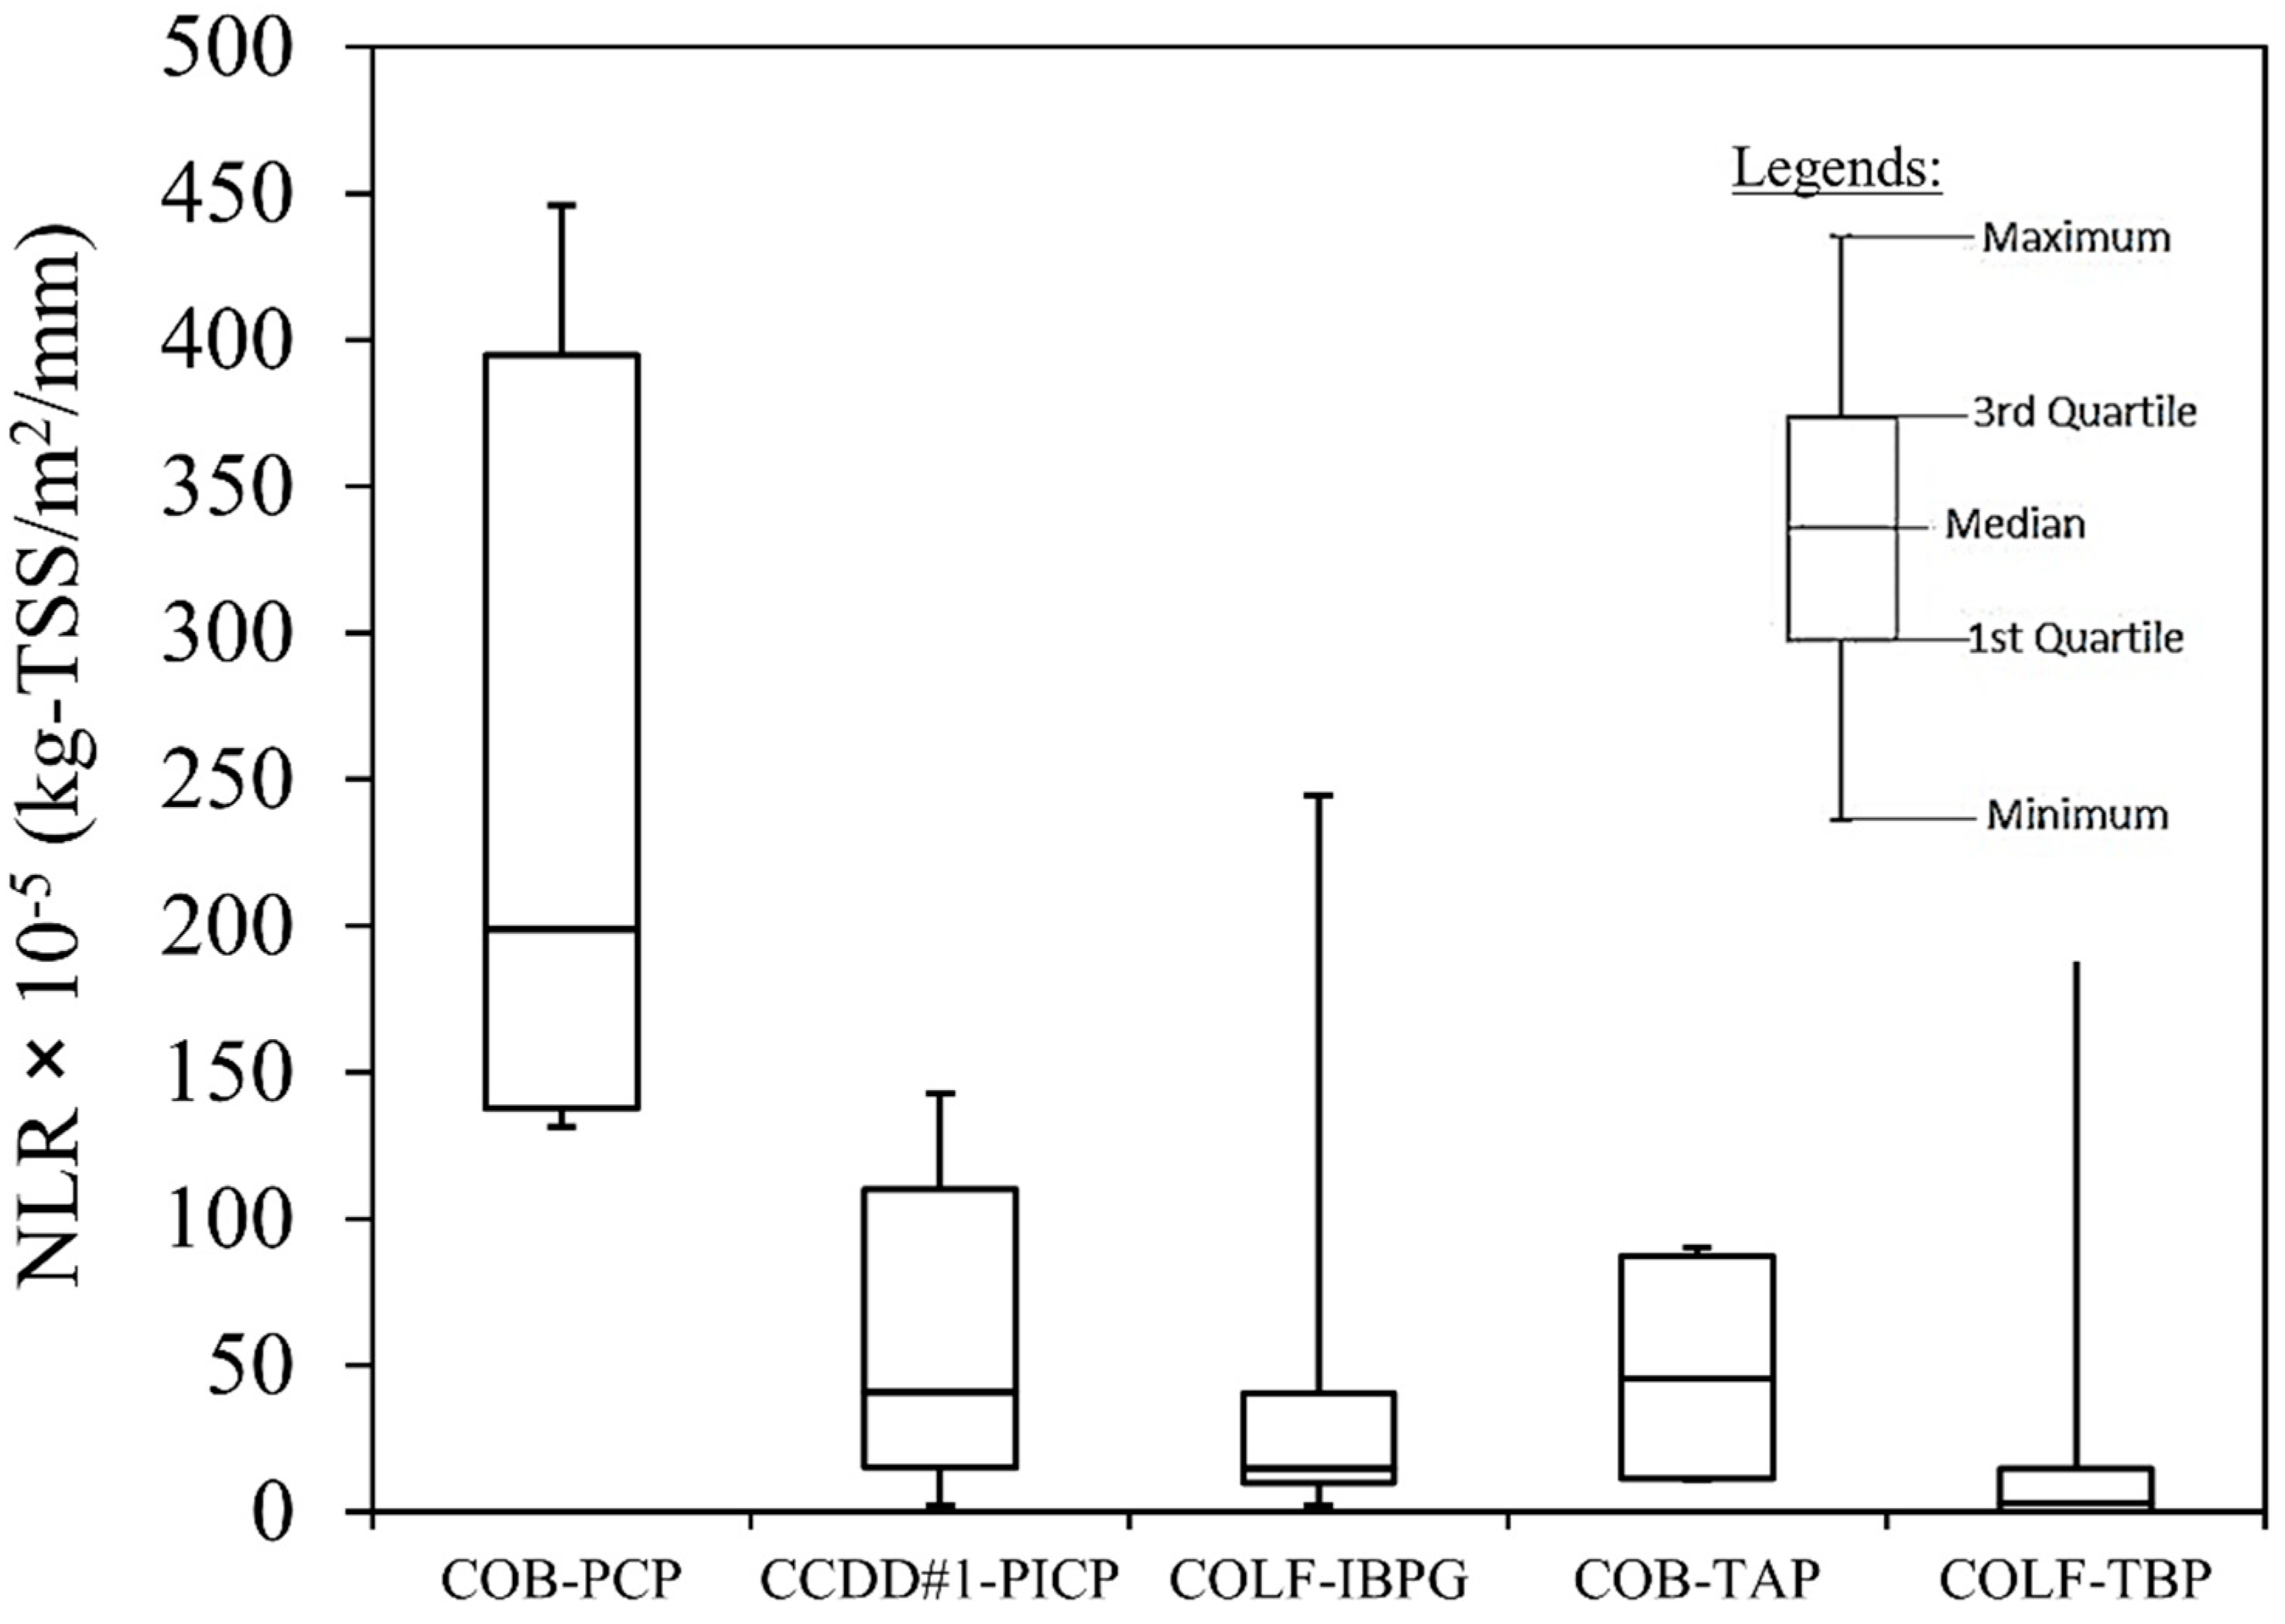
3.2. Water Quality Analysis

Figure 13 demonstrates observed TSS and BOD5 concentrations from the surface runoff, sampled at the outfall of monitored PCP, PICP, and TAP at different LRGV sites. The bar graph represents the observed concentration of TSS and BOD5 samples collected during four significant rainfall events. For comparison, a total of four TSS and BOD5 samples (Tables S6–S8) were analyzed for COB-PCP, COB-TAP, and CCDD#1-PICP during the monitoring period. Although our number of water quality samples for these two sites was sparse, the dataset was justifiable in the assessment BMPs performance, as advocated by previous studies [48,49,50,51]. TSS concentration was relatively high in those pavement surfaces in comparison to values from the International Stormwater Database (ISD). Within the monitoring timeframe, the TSS median for COB-PCP and COB-TAP was 621 and 900 mg/L respectively, whereas the ISD median was 58 mg/L. Overall, TSS concentration in PCP and PICP was observed to be lower than TAP in three events. The maximum TSS concentration was observed on 23 October 2014 in the COB site with a total rainfall depth of 52.8 mm. For that event, the TSS concentration was 2120 and 3980 mg/L for PCP and TAP, respectively. However, the maximum TSS concentration in CCDD#1-PICP was observed on 21 October 2014, which was about 960 mg/L. The higher TSS concentration for these sites can be explained through erosion of soil and dirt from the areas outside the parking lot, especially for the higher rainfall events. The drainage area surrounding the parking lot was mostly undeveloped unvegetated surfaces. On the other hand, BOD5 concentration showed a slight difference from ISD. The average BOD5 concentration for PCP and TAP was 13.3 and 17 mg/L, respectively, whereas ISD was 14.1 mg/L. The maximum BOD5 concentration was observed on 21 October 2014 from TAP, which was about 26 mg/L. Overall, BOD5 concentration was observed lower in PCP than TAP for two events. For those events, BOD5 concentration was 7.0 and 7.44 mg/L for PCP and PICP, respectively. At the CCDD#1 site, the BOD5 concentration for the PICP was observed lower than TAP for three events, which was about 960 mg/L.
A total of 23 samples (Tables S9 and S10) for TSS and 20 for BOD5 were analyzed from the COLF recreation center parking lot for both pavement types (Figure 14). For nearly all rainfall events, TSS and BOD5 concentrations were lower for the IBPG surface as compared to the TBP. The average TSS concentration for IBPG and TBP was 178 ± 74 and 356 ± 187 mg/L, respectively. However, BOD5 collected samples showed similarity in the values for both sections; the average concentration was 37.6 ± 24 and 36.6 ± 22.7 mg/L for TBP and IBPG, respectively. Like the COB site, BOD5 concentrations were substantially higher than ISD median values. The drainage area contribution for the COLF site was mainly composed of vegetated areas, and this may explain such a result. Organic materials probably coalesced in the parking lot whenever a storm event occurred. Overall, the results indicate that the design of all existing permeable pavements was adequate for the removal of suspended solids and organic materials to a certain extent.
For subtropical and humid regions, TSS concentrations were observed at 95–295 mg/L and 27–70 mg/L from PCP and PICP, respectively [13]. In cold climatic regions, TSS concentrations were observed to range between 30 and 550 mg/L for different types of monitored permeable pavements [18,46]. In the semi-arid climatic region of the LRGV, the TSS concentration at the PCP, PICP, and IBPG outfalls ranged from between 400 and 2200, 170 and 1000, and 10 and 1000 mg/L respectively, which were significantly higher than the values obtained from other climatic regions. The original solid concentrations were far more pronounced at the COB and CCDD#1 sites, whereas original BOD5 levels were observed to be much higher at the COLF site. This occurrence may be a possible reason that the monitored parking lot at the COLF Recreation Center was restricted to lower traffic volume. Furthermore, all monitored COLF pavements cover a significant percentage of the adjoining vegetative drainage sources, which may lead to a higher chance of contamination from organic fertilizers during heavy rainfall events. The monitored parking lots at COB and CCDD#1 recreational park were more open to the public and high traffic volumes, which might carry a significant amount of debris and dirt to the surface of those pavements.
Figure 15 and Figure 16 demonstrate a comparative results summary between all monitored pavement types in terms of TSS and BOD5 Normalized Load Reduction (NLR). Results from the Kolmogorov–Smirnov test determined that the NLR data for each pavement do not match or slightly match the characteristics of a normal distribution (skewness: 1.0 to 3.0; kurtosis: 0.75 to 8.25). Thus, any significant results were interpreted through nonparametric statistical tests, such as the Wilcoxon rank-sum test or the Mann–Whitney U test, depending on the characteristics of the data. The box–whisker plot represents NLR potentials of pavements at each quartile of the data analyzed. The pollutant load removal is dependent on the runoff volume reduction. From the hydrologic analysis, PCP runoff volume was significantly lower than TAP. The Wilcoxon rank-sum results confirmed that the PCP design was significant (p < 0.05) in TSS removal (NLR: 244 × 10−5 ± 143 × 10−5 kg/m2/mm) as compared to TAP, with an 80% additional reduction on average. This result can be explained due to the excessive TSS residuals received by the COB site, which were considered notably high as mentioned previously. Also, the BOD5 load reduction from PCP (NLR: 3.61 × 10⁻⁵ ± 1.78 × 10⁻⁵ kg/m2/mm) was found to be significant (p < 0.05), with an average of 86% additional reduction over TAP. By statistically analyzing the NLR data between the CCDC#1-PICP and TAP, the median values were found significantly (p > 0.05) close. In contrast to the PCP type, the PICP showed only 17% additional TSS removal over TAP. However, the assessment between the two pavements for TSS removal did not reflect the actual PICP’s individual water quality performance (NLR: 58 × 10−5 ± 54 × 10−5 kg/m2/mm). Load reduction for BOD5 from PICP (NLR: 3.0 × 10⁻⁵ ± 3.0 × 10⁻⁵ kg/m2/mm) was significant (p < 0.05), with an additional 81% on average load reduction over TAP. Relative to PCP and PICP, IBPG showed a maximum BOD5 removal (7.14 × 10⁻⁵ ± 7.19 × 10⁻⁵ kg/m2/mm), with an additional 46% removal over the adjacent TBP on average. Conversely, TSS removal performance was slightly degraded (40 × 10−5 ± 57 × 10−5 kg/m2/mm) as compared to PICP, with an additional 44% removal over TBP.
These results indicate that these pavements can improve runoff water quality, and their performance was consistent with additional runoff reduction. Along with runoff mitigation, PCP has been most promising in reducing TSS loadings versus IBPG and PICP. This result may be due to its rough and porous surface structure, which is capable of trapping sediments while storing water volume within the surface and media [52,53,54,55,56]. Furthermore, the existing innovative storage design (0.13 m), consisted of #2 open-graded aggregates followed by #52 washed stone, which might be effective in particulate trapping within its enlarged void spaces. An interim 0.08 m sand filter between the bedding and base reservoir might enhance its solids accumulation potential to some extent as well. In the case of IBPG, the existing permeable linear joints presumably enhance the TSS and BOD5 removal from the surface runoff. Furthermore, some portion of solids might be physically trapped within void spaces of the base reservoir aggregates [18].
In terms of paver characteristics, there were no significant dissimilarities observed between PICP and TBP. In terms of PICP for BOD5 removal, the only observable difference was the presence of linear permeable joints. In fact, the existing TBP design was slightly better in BOD5 removal (2.9 × 10⁻⁵ kg/m2/mm) over PICP. The possible explanation might lead to the entrapment of organic particulate solids into void spaces of pea gravel within the paver surface. An existing 1” sand filler beneath the paver surface might be effective as well in the treatment of a range of solid organic particles. A longer travel path within an enlarged and uniform base reservoir (0.46 m) might presumably enhance the entrapment of organic particulates from the stored runoff. Although TAP demonstrated some reduction, TBP demonstrated a surprisingly improved BOD5 reduction.

3.3. Influence of Design Parameters on Permeable Pavements Performance

The results from recent research suggest that the hydrologic performance of permeable pavements can be affected by many factors, such as surface type, pavers geometrical configurations (e.g., block dimensions, spacing, cross-sectional design, aggregate characteristics, and climatic conditions (e.g., rainfall depth and intensity), and soil conditions [44,46,51,57,58,59,60]. This work emphasized how permeable pavement performance can be affected by as-built design properties in terms of surface and base reservoir in the semi-arid climatic region based on design values and aggregate properties. The analyzed hydrologic and water quality data suggest that both surface and base reservoirs have an influence on the rainfall holding depth and the reduction of peak flow, runoff volume, TSS, and BOD5 loadings, as shown in Table 5.
Some influence of the surface characteristics on runoff mitigation was observed including several characteristics of the base aggregates. The infiltration from surfaces was a dominant factor for the differences in the normalized surface volume reduction from different permeable pavements. The laboratory test data suggest that the finer particle size of aggregates provides a greater value of porosity. In PCP, the highly porous structure (20% porosity) of the concrete matrix led to the potential development of favorable paths for the water to pass through, thereby minimizing the runoff from the site and reducing the lag time. For the IBPG, the combination of highly permeable pea gravel and interlocking blocks demonstrated a still significant infiltration behavior, which enhanced the runoff attenuation capacity in terms of peak flow.
It was observed that characteristics of the base reservoir aggregates had a large influence on surface infiltration and the maximum rainfall storage depths prior to flooding. PCP had a low potential to capture rainfall–runoff because of the undersized as-built base reservoir capacity, with lowest aggregate porosity (38%). On the other hand, the IBPG design seemed to be most promising in holding the infiltrated runoff depth, as higher as triggered from 136 mm rainfall depth. Possibly, the round graded crushed limestone attributed to better retention properties than #57 open aggregates, which might enhance the storage capacity of IBPG to some extent as compared to PICP.
Water quality results suggest that the pavement surface materials have a large impact on TSS and BOD5 removal. In terms of TSS removal, the highly porous and rough concrete structure might be dominant in the entrapment of larger sediment particles in the surface of the PCP. Due to the presence of pea gravel filled openings, IBPG performance was improved over PICP in capturing suspended solids from the runoff. The pea gravel was found to be more effective in entrapping organic solids that led to higher BOD5 removal potentials in the IBPG.

4. Conclusions

The performance of permeable pavements has not been totally consistent globally but the overall results have been very positive to improve water quality and runoff. Some researchers have recommended continued field data collection from permeable pavements and other LID control practices for different climatic regions (cold, subtropical, and semi-arid) and geographic locations with specific land use including low traffic areas, such as parking lots, walkways, parking lanes, highway shoulders [38,44,51,57]. Current research trends suggest an assessment of optimal permeable pavement system design for different climatic regions through field investigations of performance and analysis of parameters that affect the performance [60]. This study focused on adding some useful information in the context of previous and current research trends in the field investigation of permeable pavement performance in different climatic regions and the significant factors that might influence the performance.
This study investigated the hydrologic and environmental performance of three different types of permeable pavement designs in the semi-arid climatic region of the LRGV with a detailed discussion of several parameters that should affect the performance. The following are highlights of significant findings of this evaluation.
  • PCP, PICP, and IBPG showed a significant attenuation of peak flow and surface runoff volume for most of the monitoring events in the semi-arid climatic region of South Texas.
  • Because of the higher infiltration rates and underdrain provision, the existing PCP design demonstrated the most optimal higher runoff volume reductions over PICP and IBPG.
  • In terms of storage perspective, the existing IBPG design might have a better prospect of holding a significant volume of infiltrated runoff prior to subsurface drainage.
  • The attenuation of peak flow and runoff volume was quite notable for this region as compared to other regions studied, perhaps because of the increased infiltration due to enhanced aggregate porosity in the bedding layers and soil types.
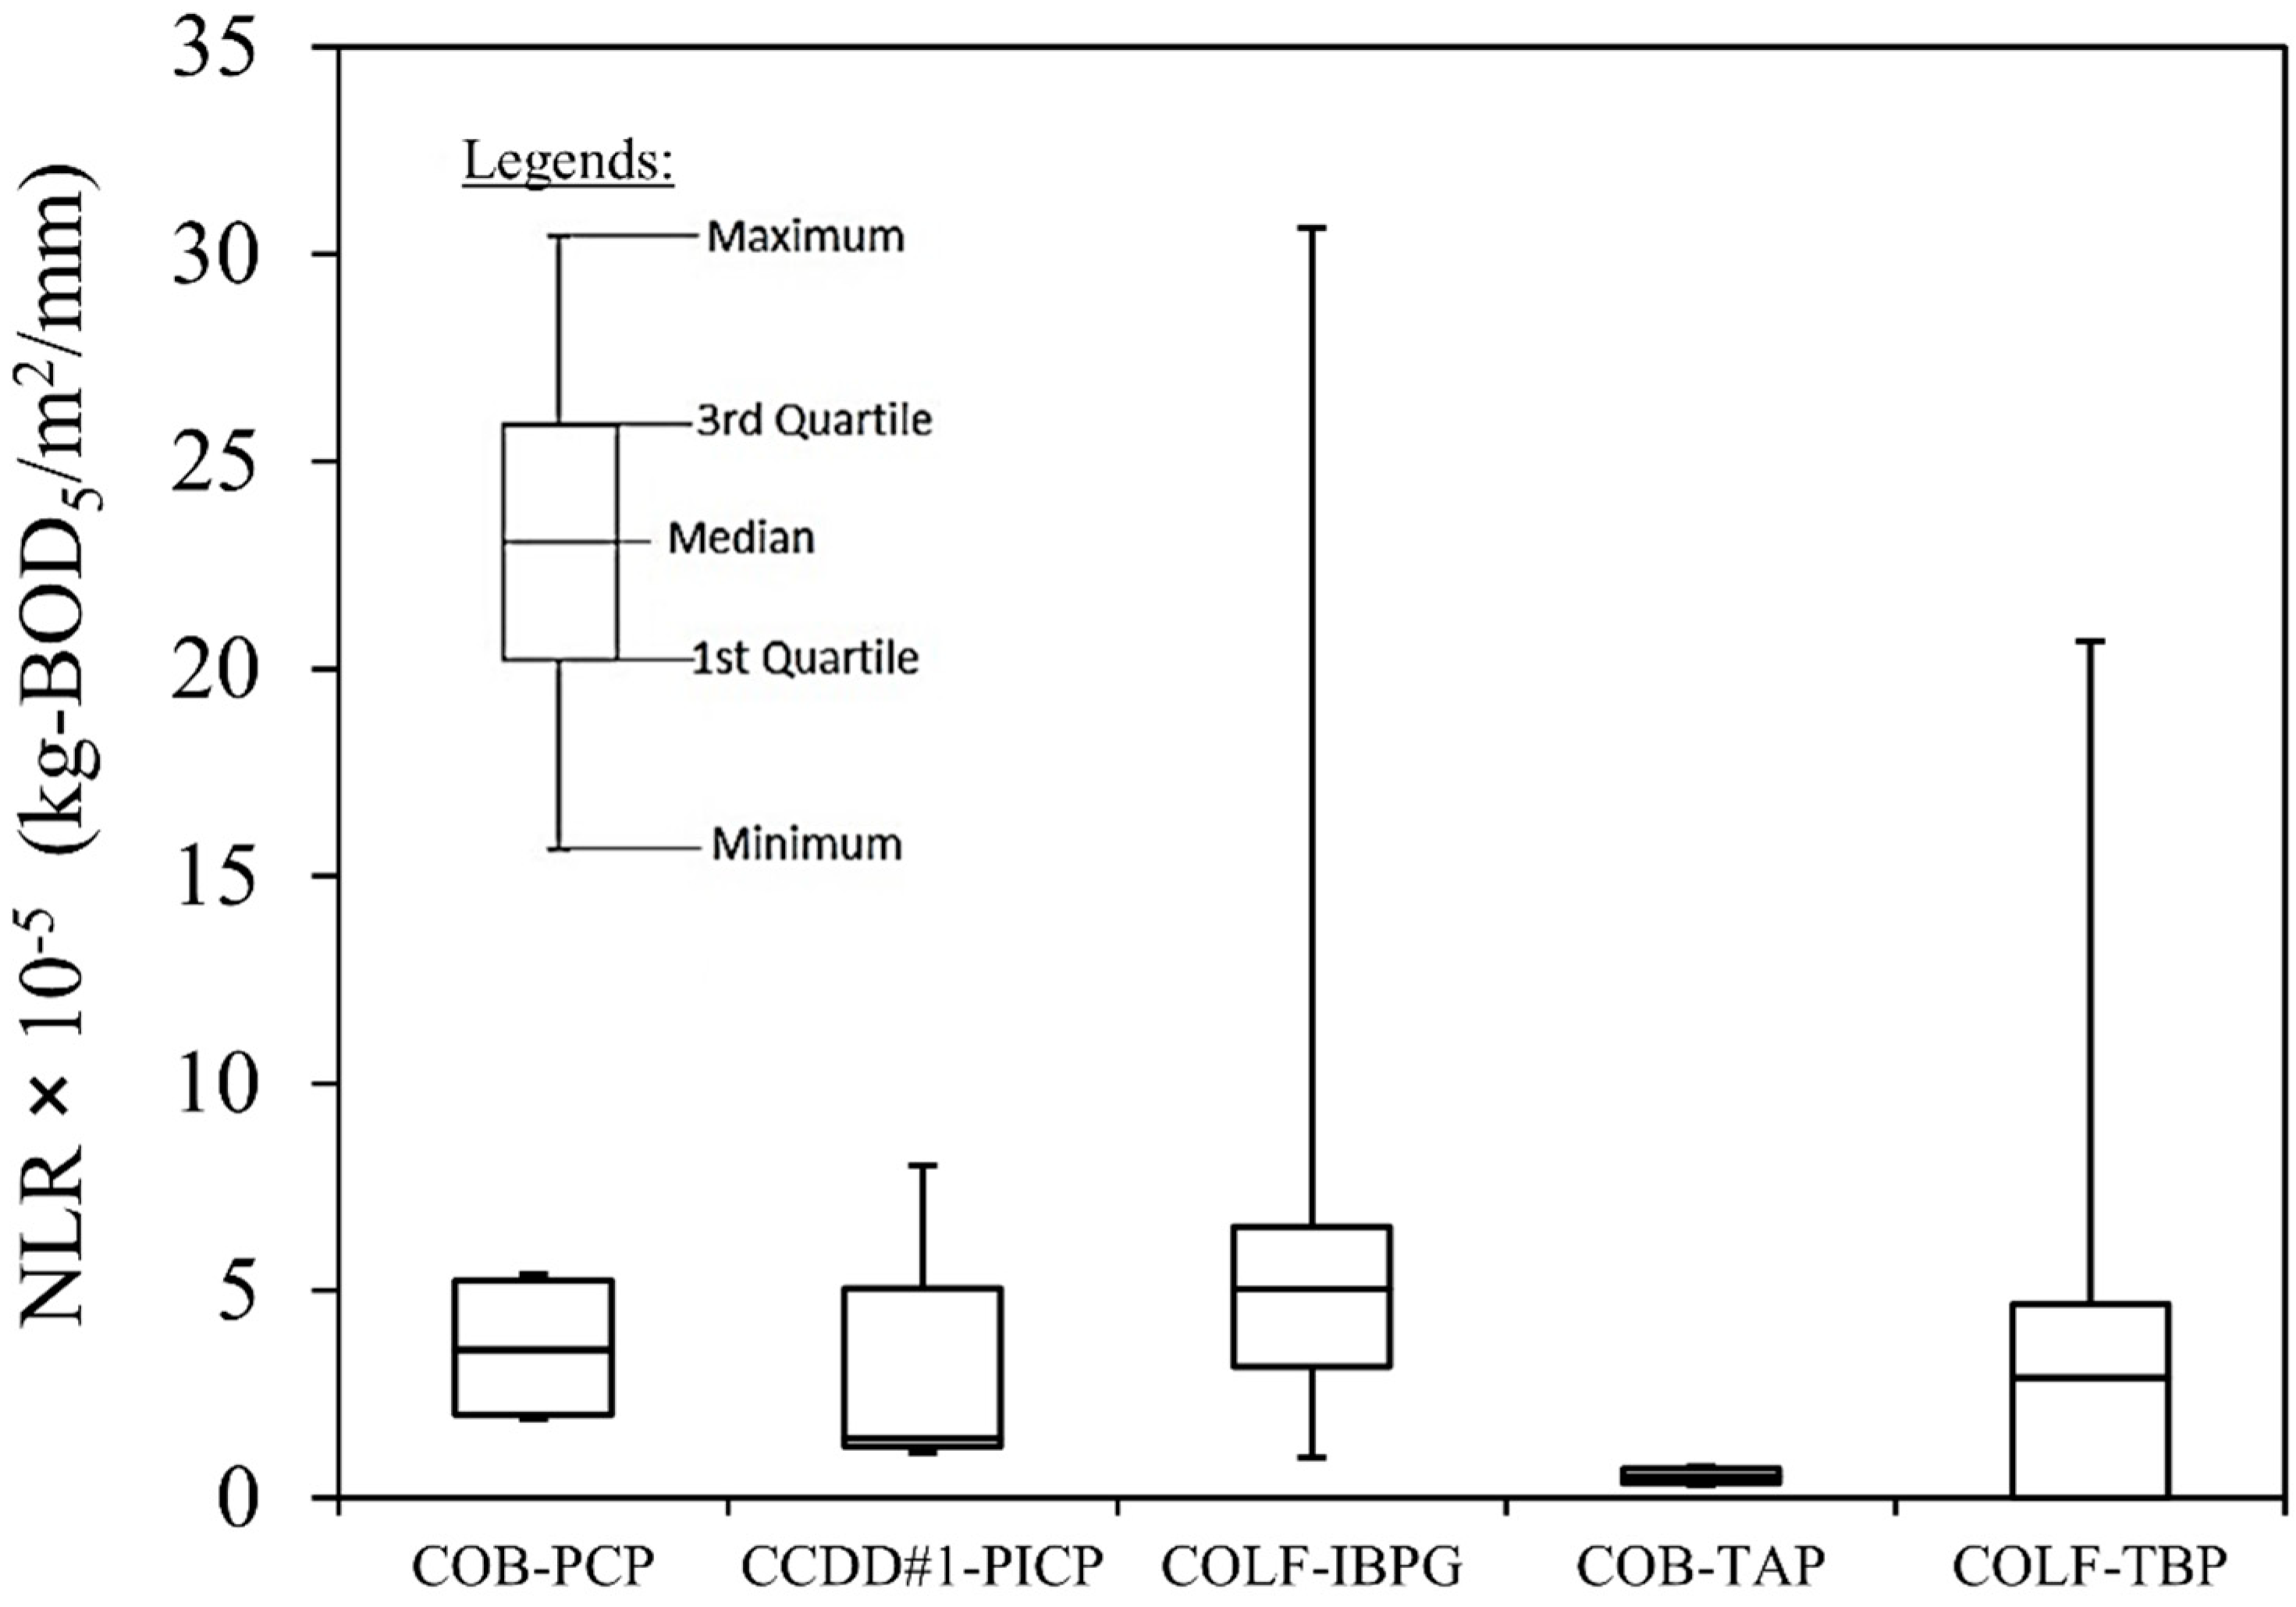
  • PCP and IBPG significantly demonstrated an improved TSS and BOD5 removal over monitored traditional pavements. PCP was the most optimal in accumulating particulate solids within its surface and void matrices. However, IBPG appeared to be a better solution for BOD5 removal, perhaps due to its potential to trap organic particles within the pea gravel filled cell openings. In this semi-arid climatic region of the LRGV, the TSS concentrations at the PCP, PICP, and IBPG outfall was somewhat higher than the values obtained from other climatic regions.
  • The surface characteristics of permeable pavements have a large effect on surface runoff volumes despite having similar characteristics of the base aggregates.
  • The characteristics of the base reservoirs (storage capacity and aggregate size) had a higher influence on surface infiltration and the maximum rainfall holding depth prior to flooding.
However, it is important to note that this study did not emphasize the measurement of surface clogging or the concentration of runoff water after infiltration. Additionally, the effects of temperature, maintenance, and antecedent moisture on the behavior of pavement need to be studied. Future studies should emphasize the laboratory or computer-based simulations of different permeable pavement designs to understand underlying mechanisms of pollutant removal in different layers. Field-scale modeling tool can be used to investigate the hydrologic and environmental performance of permeable pavements for different drainage area contributions and installation sizes.

Supplementary Materials

The following are available online at https://www.mdpi.com/2073-4441/11/10/1992/s1. Table S1. NVR, %volume reduction, and Normalized Peak Flow results of the Porous Concrete Pavement (PCP) for the City of Brownsville (COB) site. Table S2. NVR, %volume reduction, and Normalized Peak Flow results of the Traditional Asphalt Pavement (TAP) for the City of Brownsville (COB) site. Table S3. NVR, %volume reduction, and Normalized Peak Flow results of the Permeable Interlocking Concrete Pavement (PICP) for Cameron County Drainage District#1 (CCDD#1) site. Table S4. NVR, %volume reduction, and Normalized Peak Flow results of the Interlocking Block Pavement with Gravel (IBPG) for the City of La Feria (COLF) site. Table S5. NVR, %volume reduction, and Normalized Peak Flow results of the Traditional Block Pavement (TBP) for the City of La Feria (COLF) site. Table S6. TSS Concentration and NLR results of the Porous Concrete Pavement (PCP) and Traditional Asphalt Pavement (TAP) for City of Brownsville (COB) site. Table S7. BOD5 Concentration and NLR results of the Porous Concrete Pavement (PCP) and Traditional Asphalt Pavement (TAP) for City of Brownsville (COB) site. Table S8. TSS and BOD5 Concentration and NLR results of the Permeable Interlocking Concrete Pavement (PICP) for the Cameron County Drainage District#1 (CCDD#1) site. Table S9. TSS Concentration and NLR results of the Interlocking Block Pavement with Gravel (IBPG) and Traditional Block Pavement (TBP) for the City of Brownsville (COB) site. Table S10. BOD5 Concentration and NLR results of the Interlocking Block Pavement with Gravel (IBPG) and Traditional Block Pavement (TBP) for the City of Brownsville (COB) site.

Author Contributions

Conceptualization, T.A., K.D.J., and A.M.; Methodology, T.A. and K.D.J.; Formal Analysis, T.A. and A.M.; Investigation, T.A., A.M., and J.C.B.-C.; Supervision, K.D.J., and J.C.B.-C.; Writing—Original Draft Preparation, T.A. and A.M.; Writing—Review and Editing, T.A., A.M., K.D.J., and J.G.

Funding

Funding for this project was provided by the Texas Commission on Environmental Quality (Project Contract: 582-10-11100 & 582-11-10076) and financed through grants from the U.S. Environmental Protection Agency (Federal ID# 99614615, 99614616).

Acknowledgments

The authors would like to thank TCEQ NPS Project Manager Tim Cawthon for his project management support and contribution to data quality assurance. The authors also would like to thank Brandon Dalton from C.C. Lynch & Associates Inc. for his guidance in troubleshooting of LID research equipment and Mohammed Elansary for Linux AWK scripting support analyzing the flow data.

Conflicts of Interest

The authors declare no conflicts of interest.

References

  1. TCEQ. 2014 Texas Integrated Report—Texas 303(d) List (Category 5); TCEQ: Austin, TX, USA, 2014. [Google Scholar]
  2. ACWP. Update to the Arroyo Colorado Watershed Protection Plan; Texas Water Resources Institute: College Station, TX, USA, 2017; pp. 3–152. [Google Scholar]
  3. Hunt, W.F., III. Working with Regulators to Change Permeable Pavements Acceptance. In Proceedings of the 9th International Conference on Concrete Block Paving, Buenos Aires, Argentina, 18–21 October 2009; pp. 1270–1280. [Google Scholar]
  4. Drake, J.A.P.; Bradford, A.; Marsalek, J. Review of environmental performance of permeable pavement systems: State of the knowledge. Water Qual. Res. J. 2013, 48, 203–222. [Google Scholar] [CrossRef]
  5. Scholz, M.; Grabowiecki, P. Review of permeable pavement systems. Build. Environ. 2007, 42, 3830–3836. [Google Scholar] [CrossRef]
  6. Imran, H.M.; Akib, S.; Karim, M.R. Permeable pavement and stormwater management systems: A review. Environ. Technol. 2013, 34, 2649–2656. [Google Scholar] [CrossRef] [PubMed]
  7. Huang, J.; He, J.; Valeo, C.; Chu, A. Temporal evolution modeling of hydraulic and water quality performance of permeable pavements. J. Hydrol. 2016, 533, 15–27. [Google Scholar] [CrossRef]
  8. Kumar, K. Review on permeable pavement systems. In Proceedings of the 11th Transportation Planning and Implementation Methodologies for Developing Countries (11th TPMDC), Bombay, India, 10–12 December 2014; Transportation Systems Engineering (TSE) Group, Indian Institute of Technology: Bombay, India Poster No. 15. [Google Scholar]
  9. Dietz, M.E. Low impact development practices: A review of current research and recommendations for future directions. Water. Air. Soil Pollut. 2007, 186, 351–363. [Google Scholar] [CrossRef]
  10. Bean, E.Z.; Hunt, W.F.; Bidelspach, D.A. Field survey of permeable pavement surface infiltration rates. J. Irrig. Drain. Eng. 2007, 133, 249–255. [Google Scholar] [CrossRef]
  11. Bean, E.Z.; Hunt, W.F.; Bidelspach, D.A. Evaluation of four permeable pavement sites in Eastern North Carolina for runoff reduction and water quality impacts. J. Irrig. Drain. Eng. 2007, 133, 583–592. [Google Scholar] [CrossRef]
  12. Brattebo, B.O.; Booth, D.B. Long-term stormwater quantity and quality performance of permeable pavement systems. Water Res. 2003, 37, 4369–4376. [Google Scholar] [CrossRef]
  13. Collins, K.A.; Hunt, W.F.; Hathaway, J.M. Hydrologic comparison of four types of permeable pavement and standard asphalt in Eastern North Carolina. J. Hydrol. Eng. 2008, 13, 1146–1157. [Google Scholar] [CrossRef]
  14. Sansalone, J.; Kuang, X.; Ranieri, V. Permeable pavement as a hydraulic and filtration interface for urban drainage. J. Irrig. Drain. Eng. 2008, 134, 666–674. [Google Scholar] [CrossRef]
  15. Ball, J.E.; Rankin, K. The hydrological performance of a permeable pavement. Urban Water J. 2010, 7, 79–90. [Google Scholar] [CrossRef] [Green Version]
  16. Tota-Maharaj, K.; Scholz, M. Efficiency of permeable pavement systems for the removal of urban runoff pollutants under varying environmental conditions. Environ. Prog. Sustain. Energy 2010, 29, 358–369. [Google Scholar] [CrossRef]
  17. Beecham, S.; Pezzaniti, D.; Kandasamy, J. Stormwater treatment using permeable pavements. Proc. Inst. Civ. Eng. 2012, 165, 161–170. [Google Scholar] [CrossRef]
  18. Huang, J.; Valeo, C.; He, J.; Chu, A. Winter performance of inter-locking pavers—Stormwater quantity and quality. Water 2012, 4, 995–1008. [Google Scholar] [CrossRef]
  19. Roseen, R.M.; Ballestero, T.P.; Houle, J.J.; Briggs, J.F.; Houle, K.M. Water quality and hydrologic performance of a porous asphalt pavement as a storm-water treatment strategy in a cold climate. J. Environ. Eng. 2012, 138, 81–89. [Google Scholar] [CrossRef]
  20. Mahmoud, A.; Alam, T.; Yeasir, A.; Rahman, M.; Sanchez, A.; Guerrero, J.; Jones, K.D. Evaluation of field-scale stormwater bioretention structure flow and pollutant load reductions in a semi-arid coastal climate. Ecol. Eng. X 2019, 1, 100007. [Google Scholar] [CrossRef]
  21. Fassman, E.A.; Blackbourn, S. Urban runoff mitigation by a permeable pavement system over impermeable soils. J. Hydrol. Eng. 2010, 15, 475–485. [Google Scholar] [CrossRef]
  22. Winston, R.J.; Dorsey, J.D.; Smolek, A.P.; Hunt, W.F. Hydrologic performance of four permeable pavement systems constructed over low-permeability soils in Northeast Ohio. J. Hydrol. Eng. 2018, 23, 04018007. [Google Scholar] [CrossRef]
  23. Dreelin, E.A.; Fowler, L.; Ronald Carroll, C. A test of porous pavement effectiveness on clay soils during natural storm events. Water Res. 2006, 40, 799–805. [Google Scholar] [CrossRef]
  24. Kwiatkowski, M.; Welker, A.L.; Traver, R.G.; Vanacore, M.; Ladd, T. Evaluation of an infiltration best management practice utilizing pervious concrete. J. Am. Water Resour. Assoc. 2007, 43, 1208–1222. [Google Scholar] [CrossRef]
  25. Pratt, C.J.; Mantle, J.D.G.; Schofield, P.A. UK research into the performance of permeable pavement, reservoir structures in controlling stormwater discharge quantity and quality. Innov. Technol. Urban Storm Drain. 1995, 32, 63–69. [Google Scholar] [CrossRef]
  26. Saadeh, S.; Ralla, A.; Al-Zubi, Y.; Wu, R.; Harvey, J. Application of fully permeable pavements as a sustainable approach for mitigation of stormwater runoff. Int. J. Transp. Sci. Technol. 2019. [Google Scholar] [CrossRef]
  27. Kayhanian, M.; Li, H.; Harvey, J.T.; Liang, X. Application of permeable pavements in highways for stormwater runoff management and pollution prevention: California research experiences. Int. J. Transp. Sci. Technol. 2019. [Google Scholar] [CrossRef]
  28. LeFevre, N.-J.B.; Watkins, D.W.; Gierke, J.S.; Brophy-Price, J. Hydrologic performance monitoring of an underdrained low-impact development storm-water management system. J. Irrig. Drain. Eng. 2010, 136, 333–339. [Google Scholar] [CrossRef]
  29. Brown, C.; Chu, A.; van Duin, B.; Valeo, C. Characteristics of sediment removal in two types of permeable pavement. Water Qual. Res. J. 2009, 44, 59–70. [Google Scholar] [CrossRef]
  30. Lucke, T.; Beecham, S. Field investigation of clogging in a permeable pavement system. Build. Res. Inf. 2011, 39, 603–615. [Google Scholar] [CrossRef]
  31. Eck, B.J.; Winston, R.J.; Hunt, W.F.; Barrett, M.E. Water quality of drainage from permeable friction course. J. Environ. Eng. 2012, 138, 174–181. [Google Scholar] [CrossRef]
  32. Legret, M.; Colandini, V.; Le Marc, C. Effects of a porous pavement with reservoir structure on the quality of runoff water and soil. Sci. Total Environ. 1996, 189–190, 335–340. [Google Scholar] [CrossRef]
  33. Pagotto, C.; Legret, M.; Le Cloirec, P. Comparison of the hydraulic behaviour and the quality of highway runoff water according to the type of pavement. Water Res. 2000, 34, 4446–4454. [Google Scholar] [CrossRef]
  34. Chopra, M.; Kakuturu, S.; Ballock, C.; Spence, J.; Wanielista, M. Effect of rejuvenation methods on the infiltration rates of pervious concrete pavements. J. Hydrol. Eng. 2010, 15, 426–433. [Google Scholar] [CrossRef]
  35. Al-Rubaei, A.M.; Stenglein, A.-L.; Viklander, M.; Blecken, G.-T. Long-term hydraulic performance of porous asphalt pavements in Northern Sweden. J. Irrig. Drain. Eng. 2013, 139, 499–505. [Google Scholar] [CrossRef]
  36. Kuruppu, U.; Rahman, A.; Sathasivan, A. Enhanced denitrification by design modifications to the standard permeable pavement structure. J. Clean. Prod. 2019, 237, 117721. [Google Scholar] [CrossRef]
  37. Razzaghmanesh, M.; Borst, M. Long-term effects of three types of permeable pavements on nutrient infiltrate concentrations. Sci. Total Environ. 2019, 670, 893–901. [Google Scholar] [CrossRef] [PubMed]
  38. Ahiablame, L.M.; Engel, B.A.; Chaubey, I. Effectiveness of low impact development practices: Literature review and suggestions for future research. Water. Air Soil Pollut. 2012, 223, 4253–4273. [Google Scholar] [CrossRef]
  39. Kayhanian, M.; Weiss, P.T.; Gulliver, J.S.; Khazanovich, L. The Application of Permeable Pavement with Emphasis on Successful Design, Water Quality Benefits, and Identification of Knowledge and Data Gaps; National Center for Sustainable Transportation: Davis, CA, USA, 2015. [Google Scholar]
  40. Alam, T.; Mahmoud, A.; Jones, D.K.; Bezares-Cruz, C.J.; Guerrero, J. WinSLAMM simulation of hydrologic performance of permeable pavements—A case study in the semi-arid Lower Rio Grande Valley of South Texas, United States. Water 2019, 11, 1865. [Google Scholar] [CrossRef]
  41. HKO Climatological Information for Brownsville, United States. Available online: http://www.hko.gov.hk/wxinfo/climat/world/eng/n_america/us/brownsville_e.htm (accessed on 29 August 2018).
  42. NOAA National Weather Service Forcecast Office, Brownsville, TX. Available online: https://w2.weather.gov/climate/xmacis.php?wfo=bro (accessed on 29 August 2018).
  43. North Carolina Department of Environmental and Natural Resources. Updated Draft Manual of Stormwater Best Management Practices; NCDENR: Raleigh, NC, USA, 2006. [Google Scholar]
  44. Weiss, P.T.; Kayhanian, M.; Gulliver, J.S.; Khazanovich, L. Permeable pavement in northern North American urban areas: Research review and knowledge gaps. Int. J. Pavement Eng. 2019, 20, 143–162. [Google Scholar] [CrossRef]
  45. Van Duin, B.; Brown, C.; Chu, A.; Marsalek, J.; Valeo, C. Characterization of long-term solids removal and clogging processes in two types of permeable pavement under cold climate conditions. In Proceedings of the 11th International Conference on Urban Drainage, Edinburgh, UK, 31 August–5 September 2008. [Google Scholar]
  46. Huang, J.; Valeo, C.; He, J.; Chu, A. Three types of permeable pavements in cold climates: Hydraulic and environmental performance. J. Environ. Eng. 2016, 142, 04016025. [Google Scholar] [CrossRef]
  47. Drake, J.; Bradford, A.; Van Seters, T.; MacMillan, G. Evaluation of Permeable Pavements in Cold Climates-Kortright Centre, Vaughan; Toronto and Region Conservation Authority: Toronto, ON, Canada, 2012. [Google Scholar]
  48. Passeport, E.; Hunt, W.F.; Line, D.E.; Smith, R.A.; Brown, R.A. Field study of the ability of two grassed bioretention cells to reduce storm-water runoff pollution. J. Irrig. Drain. Eng. 2009, 135, 505–510. [Google Scholar] [CrossRef]
  49. Zhang, B.; Song, X.; Zhang, Y.; Han, D.; Tang, C.; Yu, Y.; Ma, Y. Hydrochemical characteristics and water quality assessment of surface water and groundwater in Songnen plain, Northeast China. Water Res. 2012, 46, 2737–2748. [Google Scholar] [CrossRef]
  50. Palmer, E.T.; Poor, C.J.; Hinman, C.; Stark, J.D. Nitrate and phosphate removal through enhanced bioretention media: Mesocosm study. Water Environ. Res. 2013, 85, 823–832. [Google Scholar] [CrossRef]
  51. Abdollahian, S.; Kazemi, H.; Rockaway, T.; Gullapalli, V. Stormwater quality benefits of permeable pavement systems with deep aggregate layers. Environments 2018, 5, 68. [Google Scholar] [CrossRef]
  52. Guo, Y.; Li, Y.; Wang, Y.; Gao, K.; Yang, L.; Qin, X.; Du, J.-G.; Wang, S. Study on pollutants removal performance of some biological carrier in wastewater land treatment system. Environ. Sci. Technol. 2009, 22, 33–35. (In Chinese) [Google Scholar]
  53. Li, W.; Ma, G.; Lu, L.; Li, S. The research of structure and performance of adsorption of modified fly ash and apply it to the waste water treatment. Mod. Sci. Instrum. 2006, 2. [Google Scholar] [CrossRef]
  54. Xiang, H.; Han, Y.; Liu, Y. Substrate screening for phosphorus removal in low concentration phosphorus-containing water body. Acta Sci. Circumstantiae 2013, 33, 3227–3233. (In Chinese) [Google Scholar]
  55. Koupai, J.A.; Nejad, S.S.; Mostafazadeh-Fard, S.; Behfarnia, K. Reduction of Urban Storm-Runoff Pollution Using Porous Concrete Containing Iron Slag Adsorbent. J. Environ. Eng. 2016, 142, 04015072. [Google Scholar] [CrossRef]
  56. Saghaian, N.S.; Abedi-Koupai, J.; Mostafazadeh-Fard, S.; Behfarnia, K. Treatment of urban storm water using adsorbent porous concrete. Proc. Inst. Civ. Eng. Water Manag. 2017, 171, 328–334. [Google Scholar] [CrossRef]
  57. Marchioni, M.; Becciu, G. Experimental results on permeable pavements in urban areas: A synthetic review. Int. J. Sustain. Dev. Plan. 2015, 10, 806–817. [Google Scholar] [CrossRef]
  58. Rodriguez-Hernandez, J.; Andrés-Valeri, V.C.; Ascorbe-Salcedo, A.; Castro-Fresno, D. Laboratory study on the stormwater retention and runoff attenuation capacity of four permeable pavements. J. Environ. Eng. 2016, 142, 04015068. [Google Scholar] [CrossRef]
  59. Kamali, M.; Delkash, M.; Tajrishy, M. Evaluation of permeable pavement responses to urban surface runoff. J. Environ. Manag. 2017, 187, 43–53. [Google Scholar] [CrossRef]
  60. Liu, Y.C.; Chui, F.T. Factors Influencing stormwater mitigation in permeable pavement. Water 2017, 9, 988. [Google Scholar]
Figure 1. Monitoring site locations of permeable pavements under the LRGV LID implementation Project in South Texas [2].
Water 11 01992 g001
Figure 2. Surface of monitored pavements in different LRGV parking lots: (A) Monte Bella Park, Porous Concrete Pavement (PCP); (B) Cameron County Drainage District #1, Permeable Interlocking Concrete (PICP); (C) La Feria Recreational Center, Interlocking Block Pavement with Gravel (IBPG); (D) Monte Bella Park, Traditional Asphalt Pavement (TAP); and (E) La Feria Recreational Center, Traditional Block Pavement (TBP).
Water 11 01992 g002
Figure 3. Computer-aided topographic map of the COB in Monte Bella Park parking lot. (Dotted rectangle represents the drainage area for the corresponding PCP and TAP sections). Note: Rc = Runoff Coefficient.
Water 11 01992 g003
Figure 4. Computer-aided topographic map of the CCDD#1-Cascade Park parking lot (Dotted rectangle represents the drainage area for the monitored PICP section.). Note: Rc = Runoff Coefficient.
Water 11 01992 g004
Figure 5. Computer-aided topographic map of the COLF-Recreation Center parking lot (Dotted rectangle represents the drainage area for the monitored TBP and IBPG sections.). Note: Rc = Runoff Coefficient
Water 11 01992 g005
Figure 6. Cross-section (as built) of three types of monitored permeable pavement installations in LRGV parking lots: (A) COB–PCP, (B) CCDD#1–PICP, and (C) COLF–IBPG.
Water 11 01992 g006
Figure 7. A segment of observed 3-h runoff hydrographs with flow measured at the outfall of monitored PCP and TAP at the Monte Bella Park Parking Lot, Brownsville, TX, from a total depth of 67 mm of rainfall, which occurred on 13 September 2014.
Water 11 01992 g007
Figure 8. A segment of observed 6-h runoff hydrographs with flow measured at the outfall of monitored PICP at the Monte Bella Park Parking Lot, Brownsville, TX, and TAP at the Cameron County Drainage District#1, Brownsville, TX, for a total depth of 17 mm rainfall occurred on 22 October 2014.
Water 11 01992 g008
Figure 9. A segment of observed 7-h runoff hydrographs with flow measured at the outfall of monitored IBPG and TBP at the La Feria Recreational Center Parking Lot, La Feria, TX, from a total depth of 15 mm rainfall, on 20 November 2015.
Water 11 01992 g009
Figure 10. Total outflow and storage volume versus corresponding to rainfall depths plot representing a pattern of runoff and storage from the monitored PCP at the Monte Bella Park parking lot, Brownsville, TX.
Water 11 01992 g010
Figure 11. Total outflow and storage volume versus corresponding to rainfall depths plot representing a pattern of runoff and storage from the monitored PICP at the Cameron County Drainage District #1-Cascade Park.
Water 11 01992 g011
Figure 12. Total outflow and storage volume versus corresponding to rainfall depths plot representing a pattern of runoff and storage from the monitored IBPG at the City of La Feria Recreation Center.
Water 11 01992 g012
Figure 13. TSS and BOD5 concentrations of runoff samples collected from the monitored PCP and TAP at the Monte Bella Park Parking Lot, Brownsville, TX, and PICP at the Cameron County Drainage District#1 Parking Lot, Brownsville, TX.
Water 11 01992 g013
Figure 14. TSS and BOD5 concentrations of runoff samples collected from the monitored IBPG and TBP at the La Feria Recreational Center Parking Lot, La Feria, TX.
Water 11 01992 g014
Figure 15. Box–whisker plot representing detailed comparisons of TSS Normalized Load Reductions (NLR) between different types of monitored pavements under the LRGV LID implementation project.
Water 11 01992 g015
Figure 16. Box–whisker plot representing detailed comparisons of BOD5 Normalized Load Reductions (NLR) between different types of monitored pavements under the LRGV LID implementation project.
Water 11 01992 g016
Table 1. Summary of attributes (field-measured) of monitored sites for permeable and traditional pavements under the Texas Commission for Environmental Quality (TCEQ) Low Impact Development (LID) Implementation Project in the Lower Rio Grande Valley (LRGV) of TX.
Site LocationCityPavement TypePavement Surface Area (m2)Drainage Area (m2)Drainage to Pavement Area Ratio (DA/PA)
Monte Bella Park Parking LotBrownsville, TXPorous Concrete Pavement (PCP)3792.92.5:1
Traditional Asphalt Pavement (TAP)153.29153.291:1
La Feria Recreation Center Parking LotLa Feria, TXInterlocking Block Pavement with Gravel (IBPG)2097853.76
Traditional Block Pavement (TBP)2429133.77
Cascade Park Parking LotBrownsville, TXPermeable Interlocking Concrete Pavement (PICP)3725181.39:1
Table 2. Summary of field and laboratory-measured values of different characterization parameters of pavement surfaces and materials.
ParametersPCPPICPIBPG
Surface Infiltration Rate (mm/h)50,80022,86024,892
Surface Porosity20% (Porous Concrete)35% (Polymeric Sand as Joint Filler)25% Pea Gravel
Base Aggregates Porosity35% (ASTM #57 Angular Washed Stone)38% (ASTM #57 Open Graded Aggregate)40% (Compacted Crushed Limestone)
Table 3. Summary of flow monitoring events and water quality (Total Suspended Solids (TSS) and Biochemical Oxygen Demand (BOD5)) samples collected from the catchment basin installed at the outfall of monitored permeable pavements.
Site LocationMonitoring PeriodType of PavementsNo. of Flow Monitoring EventsNo. of Water Quality Samples Collected
TSSBOD
COB09/2014–11/2014PCP1344
TAP1344
COLF05/2014–01/2016IBPG422320
TBP422320
CCDD#108/2014–03/2015PICP2055
Table 4. Summary of the performance of pavements in terms of normalized runoff volume reduction monitored under the LRGV LID Implementation Project.
Pavement TypeNormalized Volume Reduction × 10−3 (m3/m2/mm)Runoff Reduction (%)
MeanSTDMedian25% Percentile75% Percentile
PCP2.810.673.202.493.2298 *87 **
IBPG2.200.462.452.072.4846 *88 **
PICP1.280.521.621.061.6396 *80 **
TAP0.050.900.360.150.50--
TBP1.20.940.380.130.50--
* Average runoff reduction in comparison to the adjacent traditional pavement; ** Average runoff reduction in comparison to inflow calculated runoff volume.
Table 5. Design parameters affecting the hydrologic and environmental performance of three different types of permeable pavements monitored in the semi-arid LRGV region.
Design PropertiesType of Permeable PavementsMax. Rainfall Holding Depth (mm)%Normalized Peak Flow ReductionMean NVR (×10−3 m3/m2/mm)Mean TSS NLR (×10−3 kg/m2/mm)Mean BOD5 NLR (×10−3 kg/m2/mm)
Surface (materials, porosity, and infiltration rate)PCP: Porous concrete; 20%; 50,800 mm/h-38–1002.812.443.6
PICP: Interlocking blocks with sand as joint filler; 35%; 22,860 mm/h-31–1001.280.582.8
IBPG: Interlocking blocks with pea gravel; 25%; 24,892 mm/h-42–1002.200.43.9
Base Reservoir (max. storage capacity, aggregates porosity)PCP: 3 m3; #57 washed stone; 35%70----
PICP = 36 m3; #57 open graded aggregate; 38%123----
IBPG: 38 m3; crushed lime stone; 40%136----

