Article

Experimental Investigation of Flood Energy Dissipation by Single and Hybrid Defense System

by
Afzal Ahmed
1 and
Abdul Razzaq Ghumman
1,2,*
1
Faculty of Civil and Environmental Engineering, University of Engineering & Technology Taxila, Rawalpindi 47080, Pakistan
2
Civil Engineering Department, College of Engineering, Qassim University, Al-Mulida 51431, Saudi Arabia
*
Author to whom correspondence should be addressed.
Water 2019, 11(10), 1971; https://doi.org/10.3390/w11101971
Submission received: 15 July 2019 / Revised: 13 September 2019 / Accepted: 17 September 2019 / Published: 21 September 2019
(This article belongs to the Section Hydraulics and Hydrodynamics)

Abstract

:
In this study, a series of laboratory experiments were conducted to investigate the energy loss through the hybrid defense system (HDS) in the order of dike, moat, and emergent vegetation in steady subcritical flow conditions. The results of HDS were compared with a single defense system (SDS) comprising only vegetation (OV). The dimensions of dike were kept constant while two different shapes (trapezoidal and rectangular) of moat were considered. The impacts of vegetation of variable thickness and density were investigated. Two combinations of HDS were investigated including the combination of dike and vegetation (DV) and the combination of dike, moat, and vegetation (DMV). The effect of backwater rise due to the vegetation, hydraulic jump formation and the impact of the arrival time of floodwater on energy dissipation were investigated. It was observed that on the upstream side of obstructions, the backwater depth increased by increasing the Froude number in both the SDS and HDS. The hydraulic jump observed in HDS was classified and the energy dissipation due to it was calculated. Under various conditions investigated in this paper, the maximum average energy dissipation was 32% in SDS and 46% in HDS. The trapezoidal moat performed better than rectangular moat as energy dissipater. The delay time was also greater with trapezoidal moat as compared to that in rectangular one. The maximum delay time was 140 s in the case of HDS. Hence, the hybrid defense system offered maximum resistance to the flow of water, thus causing a significant energy loss. For each case of SDS and HDS, empirical equations were developed by regression analysis to estimate the energy dissipation amounts.

1. Introduction

Heavy floods carry serious socio-economic threats. Annually, floods claim almost 20,000 lives and adversely affect at least 20 million people throughout the world [1]. The recent studies indicate that losses from flood hazards are expected to increase in the near future [2]. In various European countries, whenever there is flood in main rivers, the surrounding small rivers are also flooded at the same time creating heavy damage to properties and human lives [3]. In 2011, the Great East Tsunami in Japan arrived with a return period of 1000 years [4] which destroyed embankments, coastal forests, tsunami gates, and thousands of human lives [5,6,7]. Similarly, the other south Asian countries were also affected by heavy floods in the recent past. Pakistan faces extreme flood events almost every year. The statistical analysis shows that a financial loss of US$38.165 billion occurred, more than 12,000 causalities were reported and 616,598 km2 land area was affected as a result of 23 major flood events from 1947 to 2015 in Pakistan [8]. The extreme flood events in India resulted in the death of several thousand people in Uttarakhand 2013, in Chennai 2015, and in Kerala 2018 [9,10]. Almost 38 districts were affected by a continuous spell of heavy rainfall in Bangladesh in 2017 [11]. Similarly, Indonesia is also vulnerable to flood damages [12,13].
In the last decade, many researchers investigated the energy mitigation and flow phenomena over embankments using physical models, numerical models and analytical approaches [14,15,16,17]. These methods may be costly for developing countries because of significant capital investment requirements [18]. Currently, ecological, natural methods are widely considered in many developed and underdeveloped countries [19,20,21,22,23]. Ecosystem degradation is a major cause of increasing water resources management challenges [24,25,26,27,28]. In the floodplain of rivers, vegetation may increase the hydraulic resistance by dragging and turbulence to safeguard the ecosystem [26]. Consequently, increasing tree cover is promoted as an effective means to enhance the storage capacity of catchment areas to increase the lag time, reduce discharge and flood risk [27].
In addition to the above-mentioned solutions, the hybrid or compound defense system were also studied by different researchers. Various studies consist of the energy dissipation through a compound defense system of vegetation [28], combined effects of sea embankment and coastal forest [4,29], a moat with/without a forest [30] and a double embankment system [31]. Furthermore, Zaha (2019) conducted a series of experiments to investigate a hybrid defense system consisting of a forest, a moat (depression) and an embankment under unsteady flow conditions, considering the dike as unbreakable [32]. It was noticed that in the recent catastrophic floods in various regions, soon after the breaching of embankments, the floodwater expanded into the entire floodplains within a short duration, but the barriers in the path of water caused delay in arrival of water to important places, providing a chance for adopting the preventing measures [32,33]. The field survey of different reaches of Indus basin revealed that the cross boundaries (embankments) are unprotected due to lack of proper maintenance and low density of coastal forests (Figure 1a–c). In order to improve their performance, there is a dire need to repair existing damaged embankments and construct a new sustainable system of flood protection [33].
However, the energy dissipation phenomena of a hybrid defense system and assessment of the effect of various shapes of its components still need further investigation [4,32]. Due to the hybrid defense system, the flow structure becomes more complex because of the formation of a hydraulic jump. The jump characteristics and its location should be identified to improve the efficiency of the hybrid defense system against the destructive forces [4]. In the present paper, the hydraulic jump developed in SDS and HDS was classified on the basis of its location and the Froude number. The energy dissipation due to the formation of a hydraulic jump in various cases was also calculated. In HDS, the effect of the density of vegetation and the shape of moat on total energy dissipation was analyzed and equations were developed by regression analysis to calculate energy dissipation, which has hardly been reported previously.
Therefore, the main objective of this study was to investigate the energy dissipation phenomena in the case of a single defense system and a hybrid defense system. To achieve the objective of the study, a series of experiments were conducted using laboratory models. The energy dissipation effects of each system were compared by paying special attention to the backwater rise on the upstream side of models, the formation of a hydraulic jump and the arrival time of floodwater. This study aimed to provide findings that will be useful in designing a hybrid defense system for the flood energy dissipation. The selected range of Froude numbers was based on previous data of different locations on the Indus basin, however, the results can be used worldwide for similar situations. The proposed defense system will be effective for the protection of various floodplains. The floodwater can also be stored in moat which may act as a floodwater harvesting structure. The imagery of proposed HDS at River Indus near Taunsa Barrage, Pakistan is shown in Figure 1d.

2. Materials and Methods

2.1. Experimental Apparatus and Procedures

2.1.1. Flume Characteristics

A glass-sided open channel flume of 10-m length, 0.31-m width and 0.5-m height with a constant bed slope of 1/500 was used for the laboratory experiments with different conditions, as shown in Table 1. The field data of past 59 years regarding Froude number for Jinnah barrage (on the upstream side) and Taunsa barrage (on the downstream side) located on the Indus river were collected from the Punjab Irrigation Department, Punjab, Pakistan. These data were used to select the experimental range of initial Froude number (Fro = V/(gh)0.5, where V = depth-averaged velocity (m/s), g = gravitational acceleration (m/s2), and h = water depth (m)). The initial Froude number (Fro) was estimated with the velocity and water depth without any obstruction placed in the channel. The calculated range of Froude number at Jinnah barrage was 0.17–0.59 and at Taunsa barrage was 0.10–0.59. The flow was subcritical (Fro < 1) in all the cases. Froude similarity was used to set the model scale of the laboratory experiments. For creating subcritical conditions, the water depths without any obstruction (ho) selected in the experiments were 4.5, 5.3, 6.8, 7.3, 7.7, 8.2, and 8.5 cm, setting the initial Fro approximately equal to 0.40, 0.44, 0.50, 0.57, 0.60, 0.63, and 0.65. The scale for all the cases of the current experimental models was 1/100.

2.1.2. Experimental Conditions

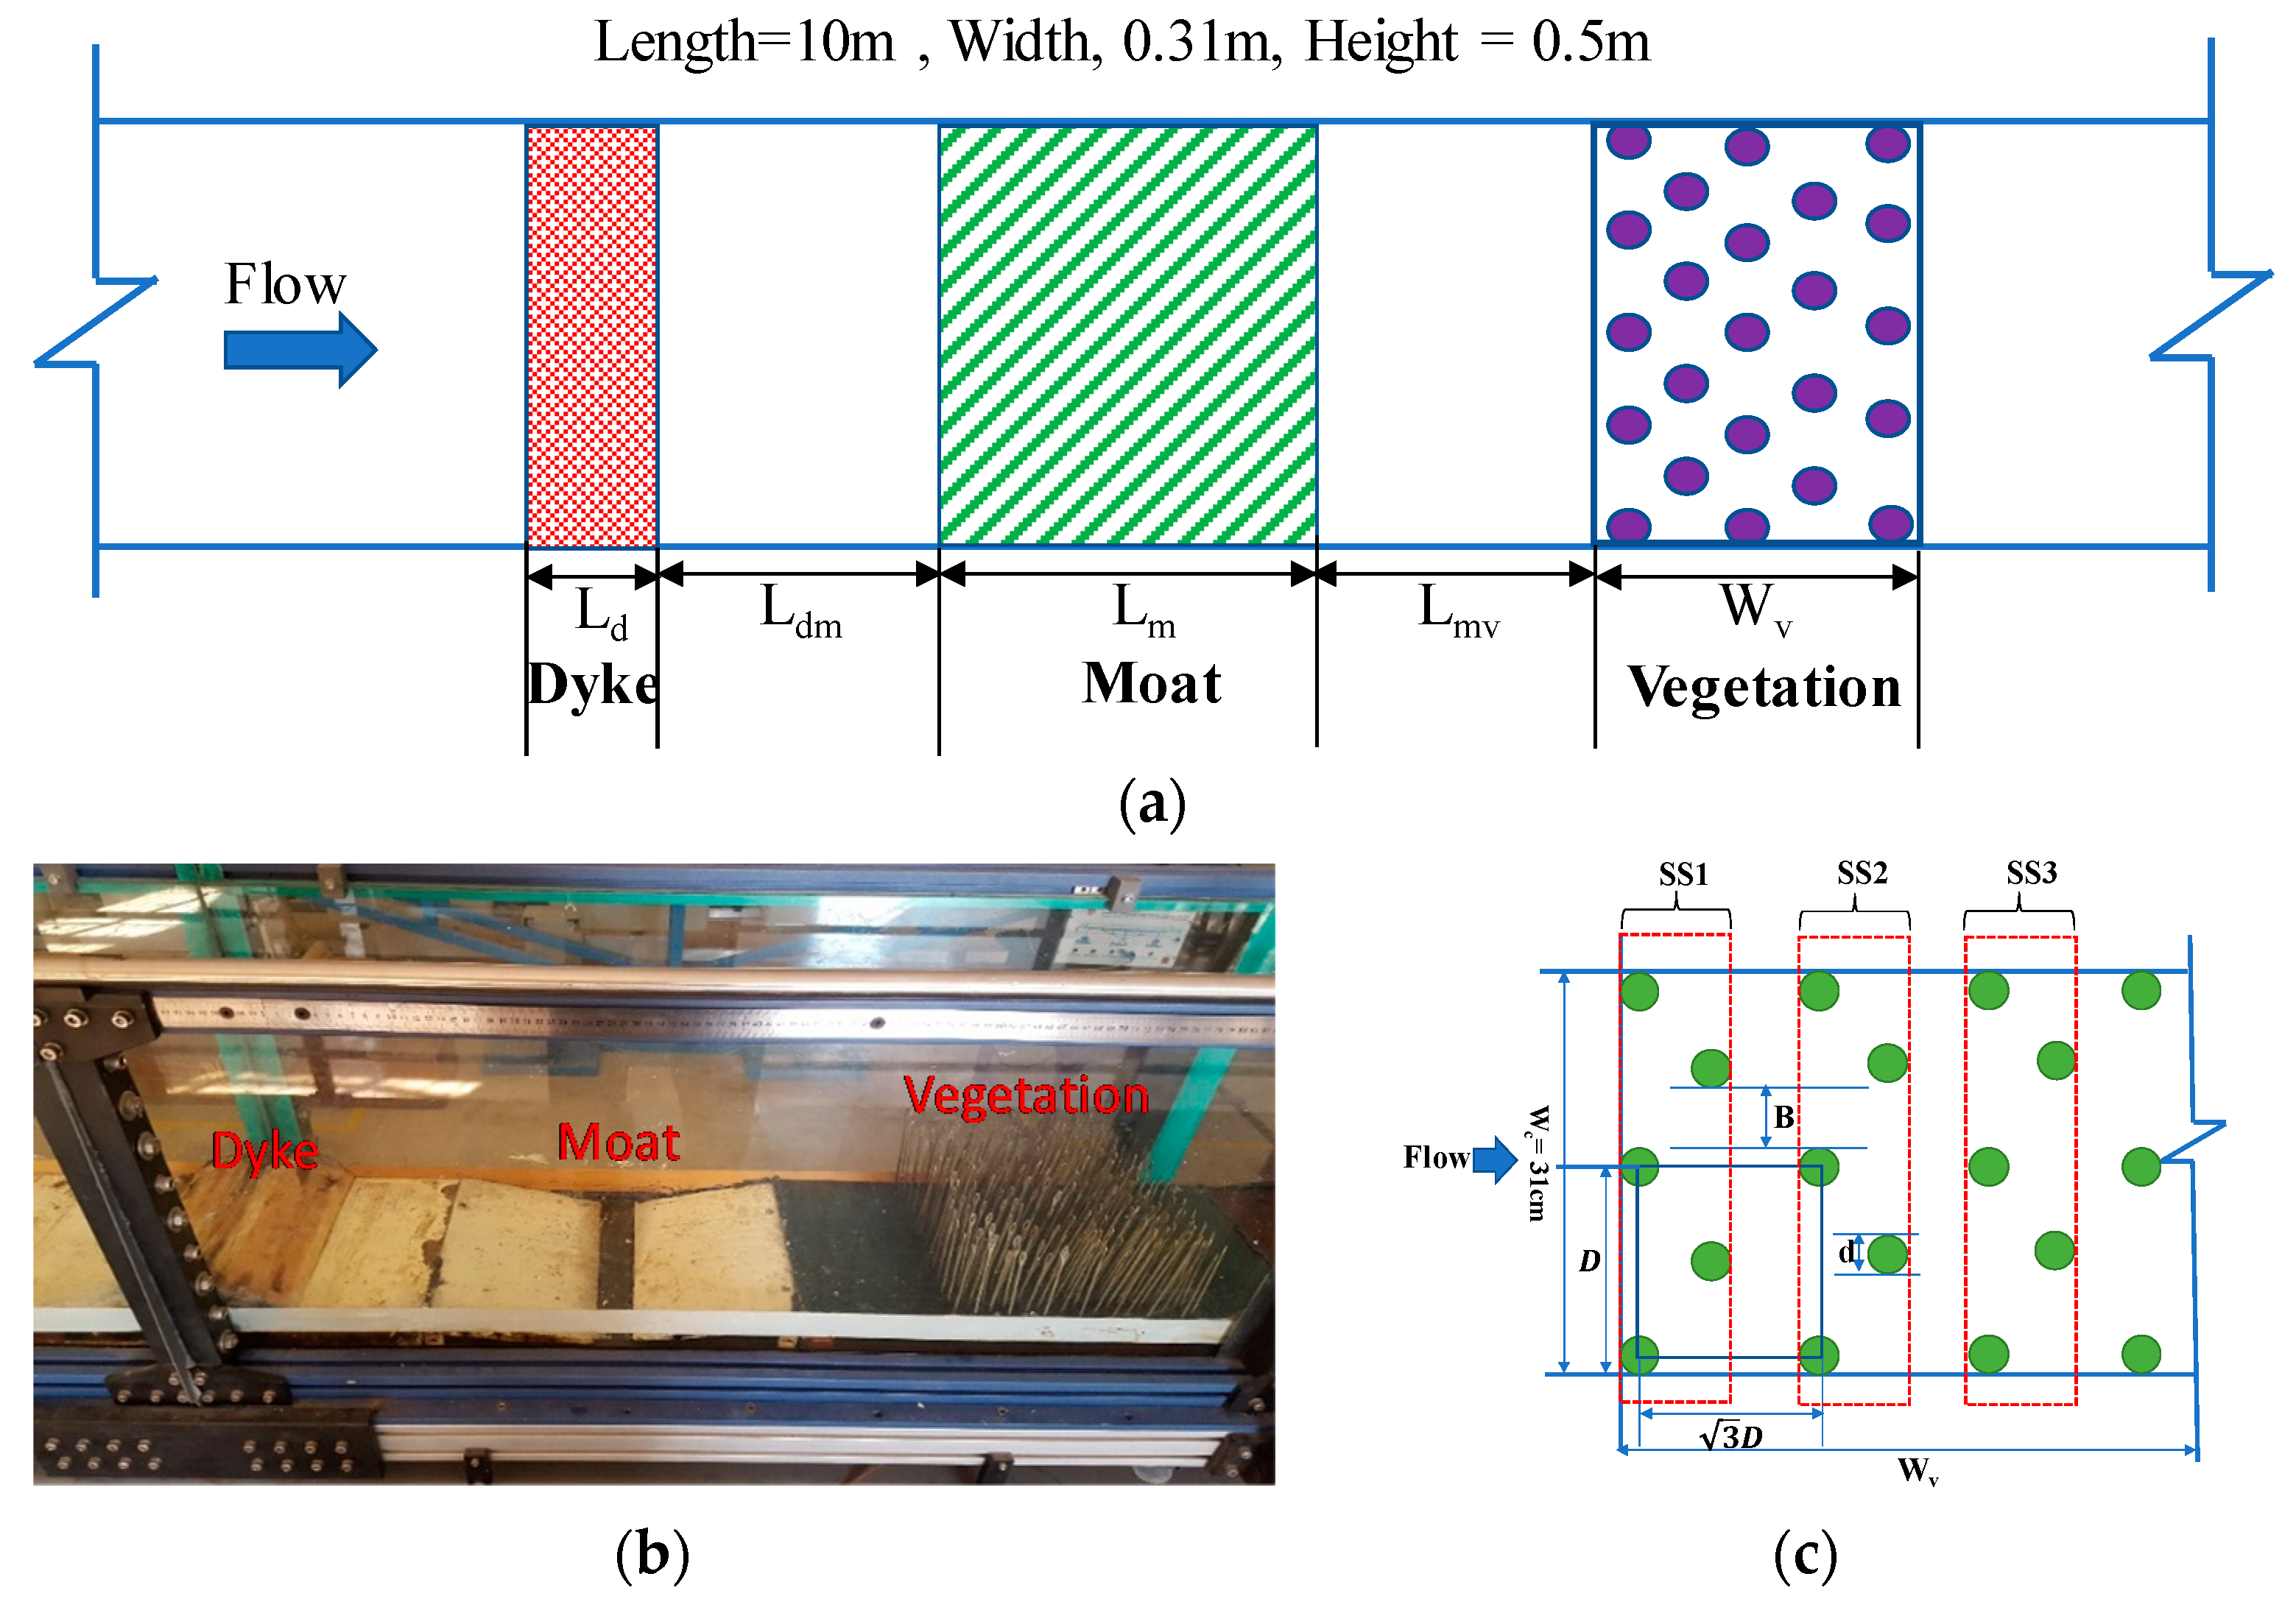
The tree species selected for the vegetation model was the Eucalyptus species. Its tree crown was higher relative to the maximum flood level in the past, and thus, the trees can be considered as circular cylinders [29]. The average tree height in the ecological zones of Punjab, Pakistan is in the range of 7.6–14.6 m and the average trunk diameter is 0.11–0.33 m [34]. To ensure the geometric similarity, metal rods, and steel cylinders of different diameters have often been used by various researchers [35,36,37]. In this experimental work, keeping in view the above-mentioned limits of average tree diameter, metal rods of 0.003 m diameter at a scale of 1:100 were used because the wooden cylinders of such a small diameter were expected to break or bend during the experimentation. In SDS, only vegetation (OV) models with variable densities were separately placed in the flume to check the individual capability of energy dissipation for these models. The density of vegetation was defined by B/d, where B is the spacing of each cylinder in cross-stream direction and d is the diameter of cylindrical vegetation. Two types of vegetation with respect to its density namely, sparse vegetation (OVS) having B/d = 2.13 and intermediate vegetation (OVI) having B/d = 1.09, were used. The distance (D) between vegetation and width of vegetation patch (Wv) (Figure 2c) were selected by considering the thickness of vegetation dn = 180 No.cm, where dn = 2 D 2 3   W v d   ×   10 2 . The dn represents the cumulative diameter of trees at breast height and is defined as the product of tree diameter and the number of trees in a rectangle with a frontage of unit length along the shoreline and depth equal to the width of the forest (Wv) [37].
In the current study, dn = 180 No.cm was selected for both the intermediate and sparse vegetation cases. The water level was measured by using a point gauge at the interval of 2–3 cm. Without placing any obstruction in the flume, the discharge was measured using a flow meter against each selected initial water depth (ho). The depth-averaged velocity was computed using the relationship between measured water depth and discharge. The dike and the moat were modeled at a scale of 1/100. The recommended height of embankment (dike) on Indus river in Pakistan is in the range of about 4–7 m high with addition to 1.2–1.8 m freeboard [38]. In the current study, the selected height of embankment (including the freeboard) was 5.5 m. Therefore, by using the scale of 1/100, the height of the embankment model was kept 5.5 cm. The dimensions of dike and moat are already mentioned in Table 1. In case of flooding, water flows from the embankment towards the floodplain in an oblique direction with respect to flow in the main channel. However, the direction of flow of water towards the weir-like obstacles/embankments in the floodplains of the river can be encountered in various orientations i.e., oblique or perpendicular depending upon the angle of placement of the obstruction [39,40,41,42]. In this study, it is assumed that the obstruction in the field will be constructed in such a way that the direction of flow of water towards the obstruction will be perpendicular. It was also considered that the slope of the floodplain was negligible provided that the banks of the river were already limited by defense work. However, it is worth mentioning here that if the obstruction is placed as per usual cases then the flow will approach the obstruction in an oblique manner and the results of this study will have to be reduced by a reduction factor depending upon the angle of obliqueness of flow. This angle will be different for different situations, and the reduction factor developed by [42,43,44] may be used to modify our results for real-life designs.
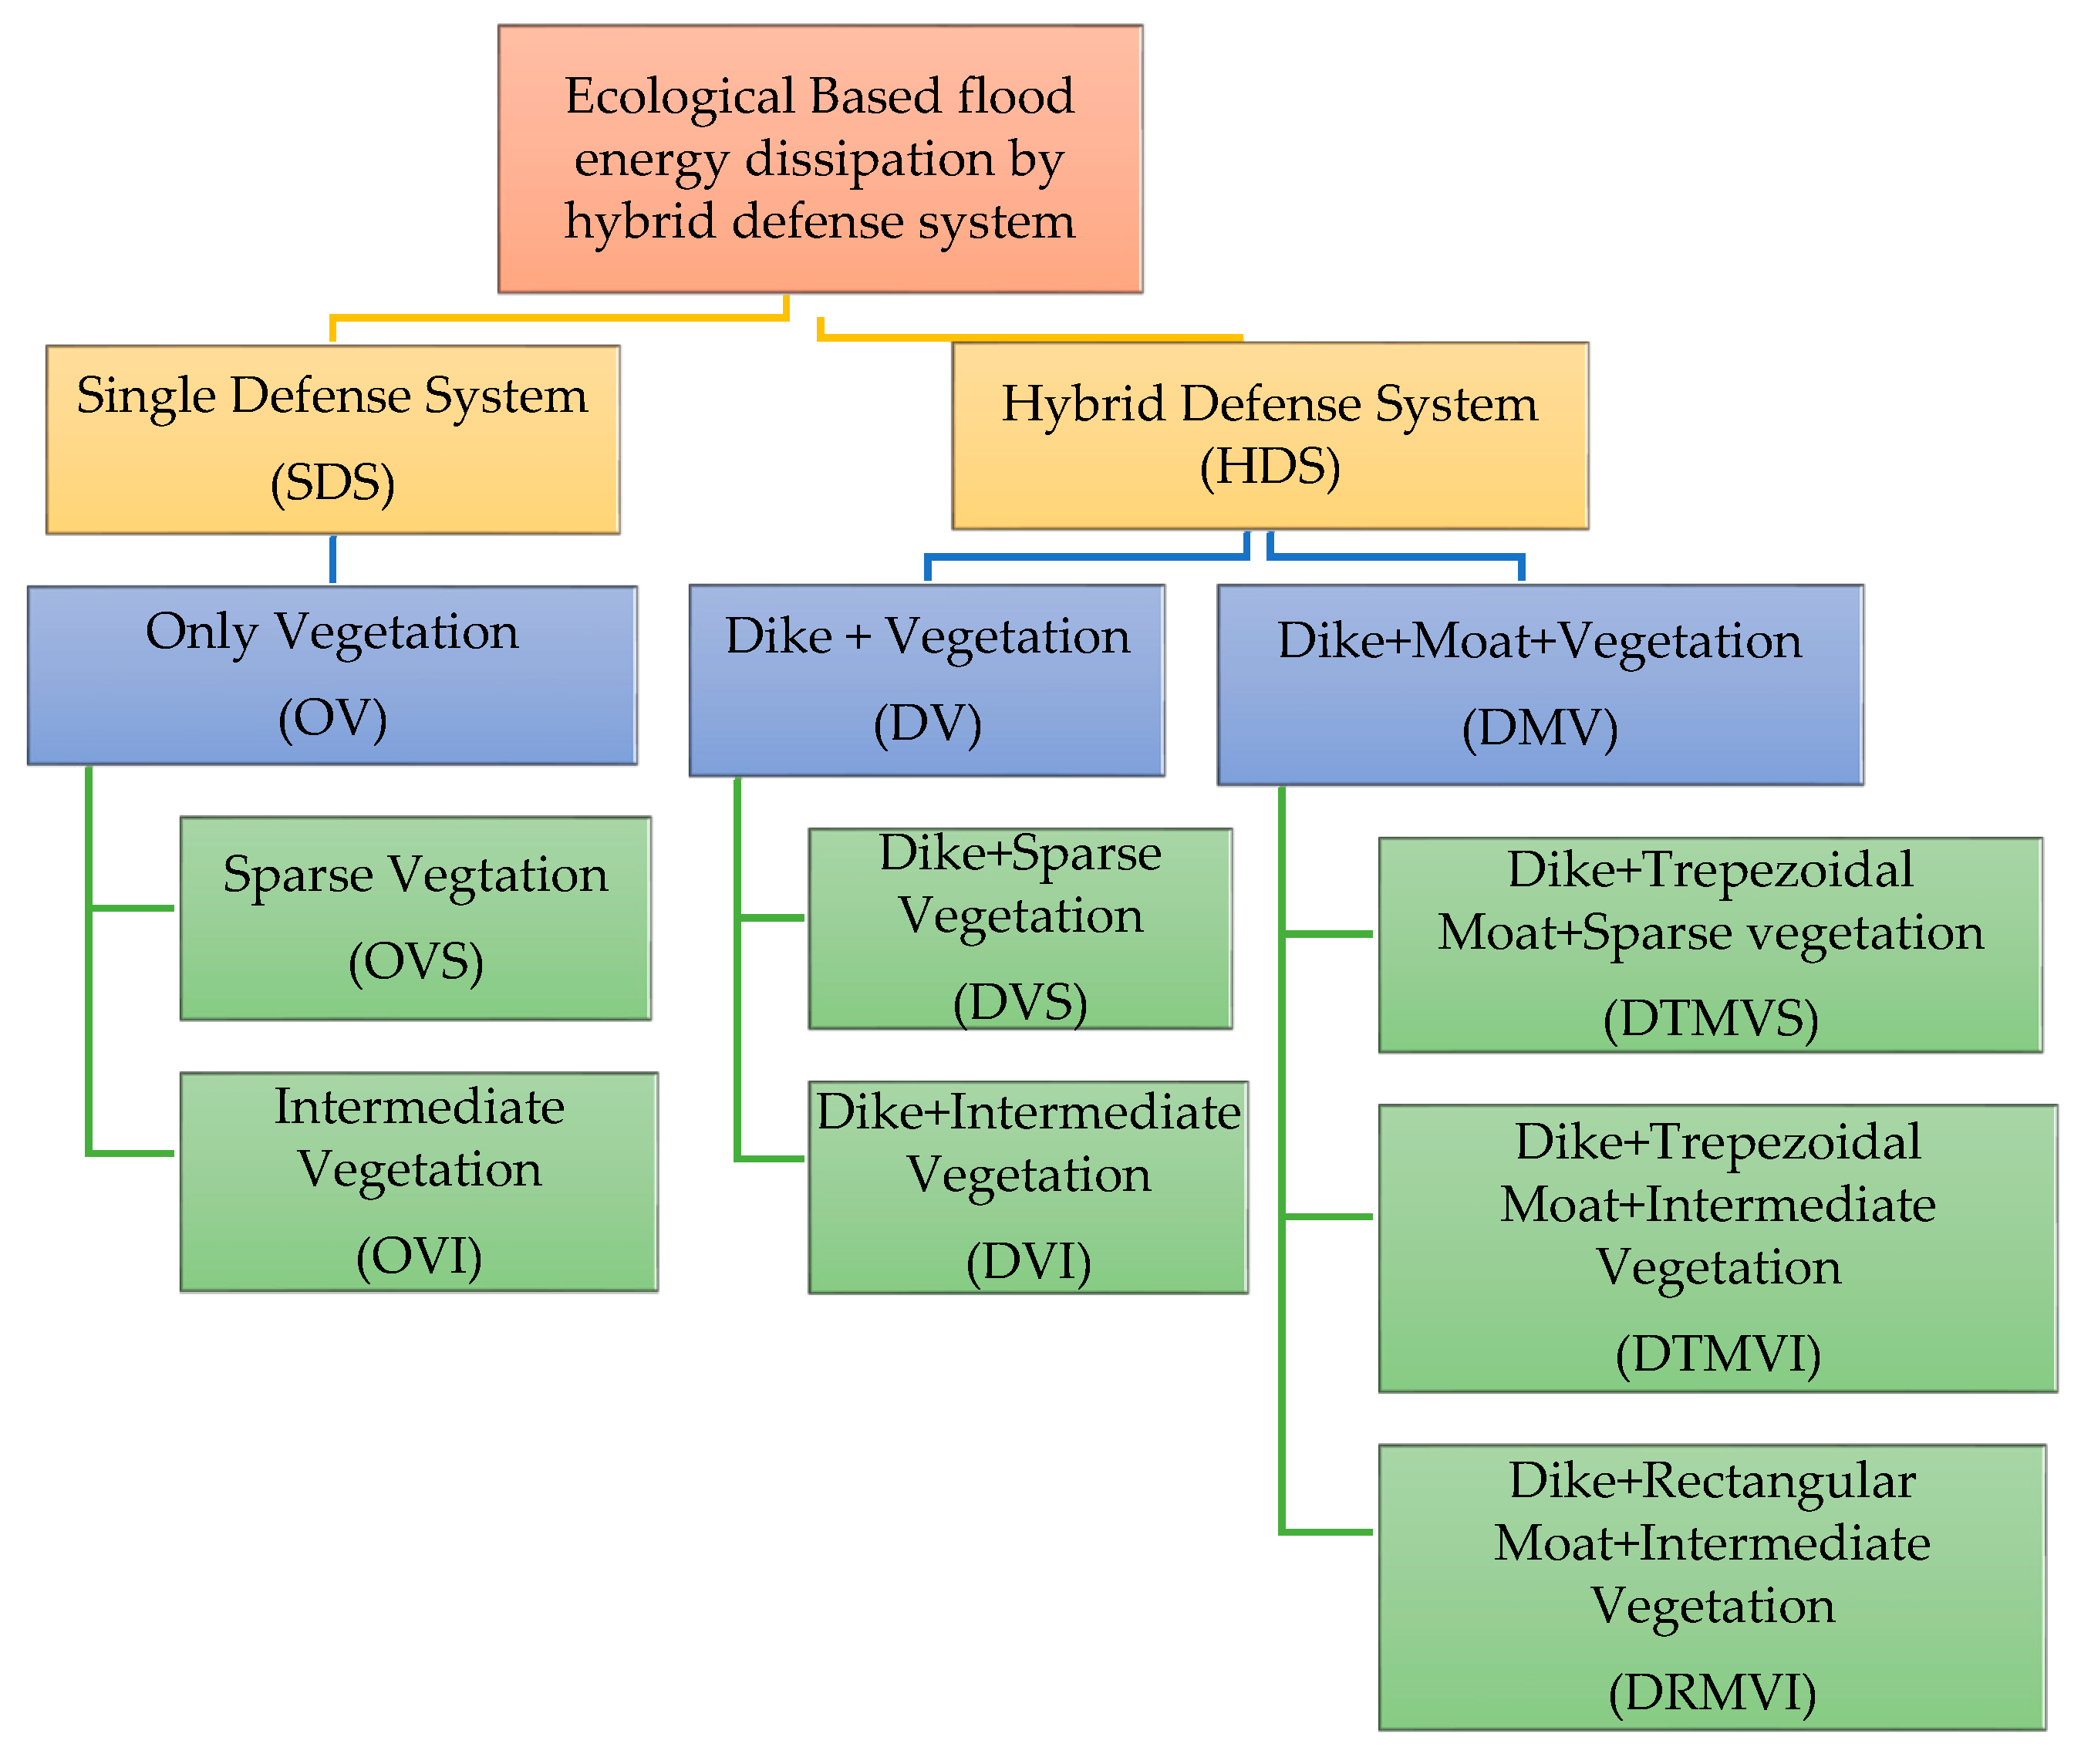
As described above, two cases of the flood energy dissipation defense system were tested. These two cases consist of a single defense system (SDS) and the hybrid defense system (HDS) as elaborated in the schematic Figure 3. In HDS, a combination of a dike and vegetation (DV) and a combination of a dike, moat, and vegetation (DVM) were tested separately. To assess the effects of the hybrid defense systems on flood energy mitigation, the order of the dike, moat and vegetation was kept constant in all the cases (Figure 2a). For expressing the respective cases in this study, the name of each obstruction, D, M, V was used to represent ‘Dike’, ‘Moat’ and ‘Vegetation’ as OV = only vegetation, OVS = only sparse vegetation, OVI = only intermediate vegetation, DV = dike and vegetation, DVS = dike and sparse vegetation, DVI = dike and intermediate vegetation, DMV = dike, moat and vegetation, DTMVS = dike, trapezoidal moat and sparse vegetation, DTMVI = dike, trapezoidal moat, and intermediate vegetation and DRMVI = dike, rectangular moat and intermediate vegetation respectively. The obstructions covering the full width of the channel were mounted in the bed of flume about 4 m from the upstream inlet of water.

2.1.3. Non-Dimensional Pi Groups

The scaling of experimental models to the prototype conditions is a challenging task [39]. Figure 4 shows a flow structure scheme and important parameters of the proposed HDS. Flow conditions, type of structure, vegetation arrangement and their combination are the main parameters that decide the amount of energy lost. The following dimensionless groups were developed by using well known Buckingham’s pi theorem.
F   [ Δ h 1 h o , Δ h 2 h o , Δ h 3 h o , Δ h 1 L o , Δ h 2 h m , v o g h o , v 1 g h 1 , v 2 g h 2 , v 3 g h 3 , p w h o v o µ ,   d n
B d , h 3 y 1 , L j y 1 , v 2 v 1 , v 3 v 2 , Δ E 1 E 1 , Δ E 2 E 2   ]   =   0
where Δh1 = backwater rise at the upstream of dike, ho = initial water depth without any model, vo = velocity at ho, Fro = Froude number at ho, Fr1 = Froude number on the upstream side of dike against water depth h1 and velocity v1, Fr2 = Froude number in front of vegetation patch against water depth h2 and velocity v2, Fr3 = Froude number on the downstream side of the vegetation patch against water depth h3 and velocity v3, g = gravitational acceleration, ρw = density of water, μ = viscosity of water, dn= dn/D is non-dimensional vegetation width, y1 = minimum water depth during the jump on the downstream of vegetation, Lj = length of hydraulic jump on the downstream of vegetation, HGL = hydraulic grade line, EGL = energy grade line, E1, E2, E3 = specific energies at respective points, ΔE1 = total energy loss (E1 − E3), ΔE2 = total energy loss (E2 − E3), dn, d and B are already defined in Section 2.1.2. To minimize the sidewall effects on the flow structure the ratio between the flume width and the cylinder diameter should be greater than five [4,45]. In this study, this ratio was kept greater than 5 to minimize the sidewall effect. The backwater rise, i.e., Δh1/ho, Δh2/ho and total energy loss (ΔE1/E1) and (ΔE2/E2) are the function of the initial Froude number Fro, vegetation density (B/d) and dn′. Froude number is commonly used in free-surface flows, so the Reynolds number was not considered here.
Δ h 1 h o , Δ h 3 h o , Δ E 1 E 1 , Δ E 2 E 2 =   F   [ v o g h o ,   B d ,   d n ]

2.1.4. Description of Energy Dissipation

The effectiveness of the hybrid defense structure was assessed by calculating the energy reduction (ΔE) in two ways. One was the reduction due to the formation of a hydraulic jump within the hybrid defense system, and the other was the total energy dissipation by HDS. Energy reduction due to the hydraulic jump in Section 2 and Section 3 are represented as (ΔEj2/y1) and (ΔEj3/y1), where, Δ E j 2 ,   Δ E j 3 =   ( y 2 y 1 ) 4 y 1 y 2 3 , y1 is the minimum depth at the toe of the hydraulic jump, y2 is the average water depth after the hydraulic jump [43]. The specific energy is defined as the energy per unit volume of water at any section of a channel with respect to the channel bed [46,47]. Therefore,
E   =   y   +   α v 2 2 g
where E = specific energy, y = water depth, v = velocity, and α = coefficient to account for variations in velocity, in this study a rectangular channel with a uniform cross-section and a constant discharge was taken, so the value of α is assumed to be unity as considered in the previous research [4]. The depth-averaged velocity against the known discharge (Q) was calculated using the known relationship for steady flow, i.e., V = Q/A. The relative percentage energy loss was calculated by using Equation (2) for DV and DMV models and Equation (3) for OV models.
Δ E 1   =   E 1 E 3 E 1   ×   100
Δ E 2   =   E 2 E 3 E 2   ×   100
where, ΔE1 is the relative energy loss, E1 = energy on the upstream side of dike in DV and DMV models, E2 = energy on the upstream side of vegetation and E3 = energy on the downstream side of vegetation.

2.1.5. Delay Time Analysis

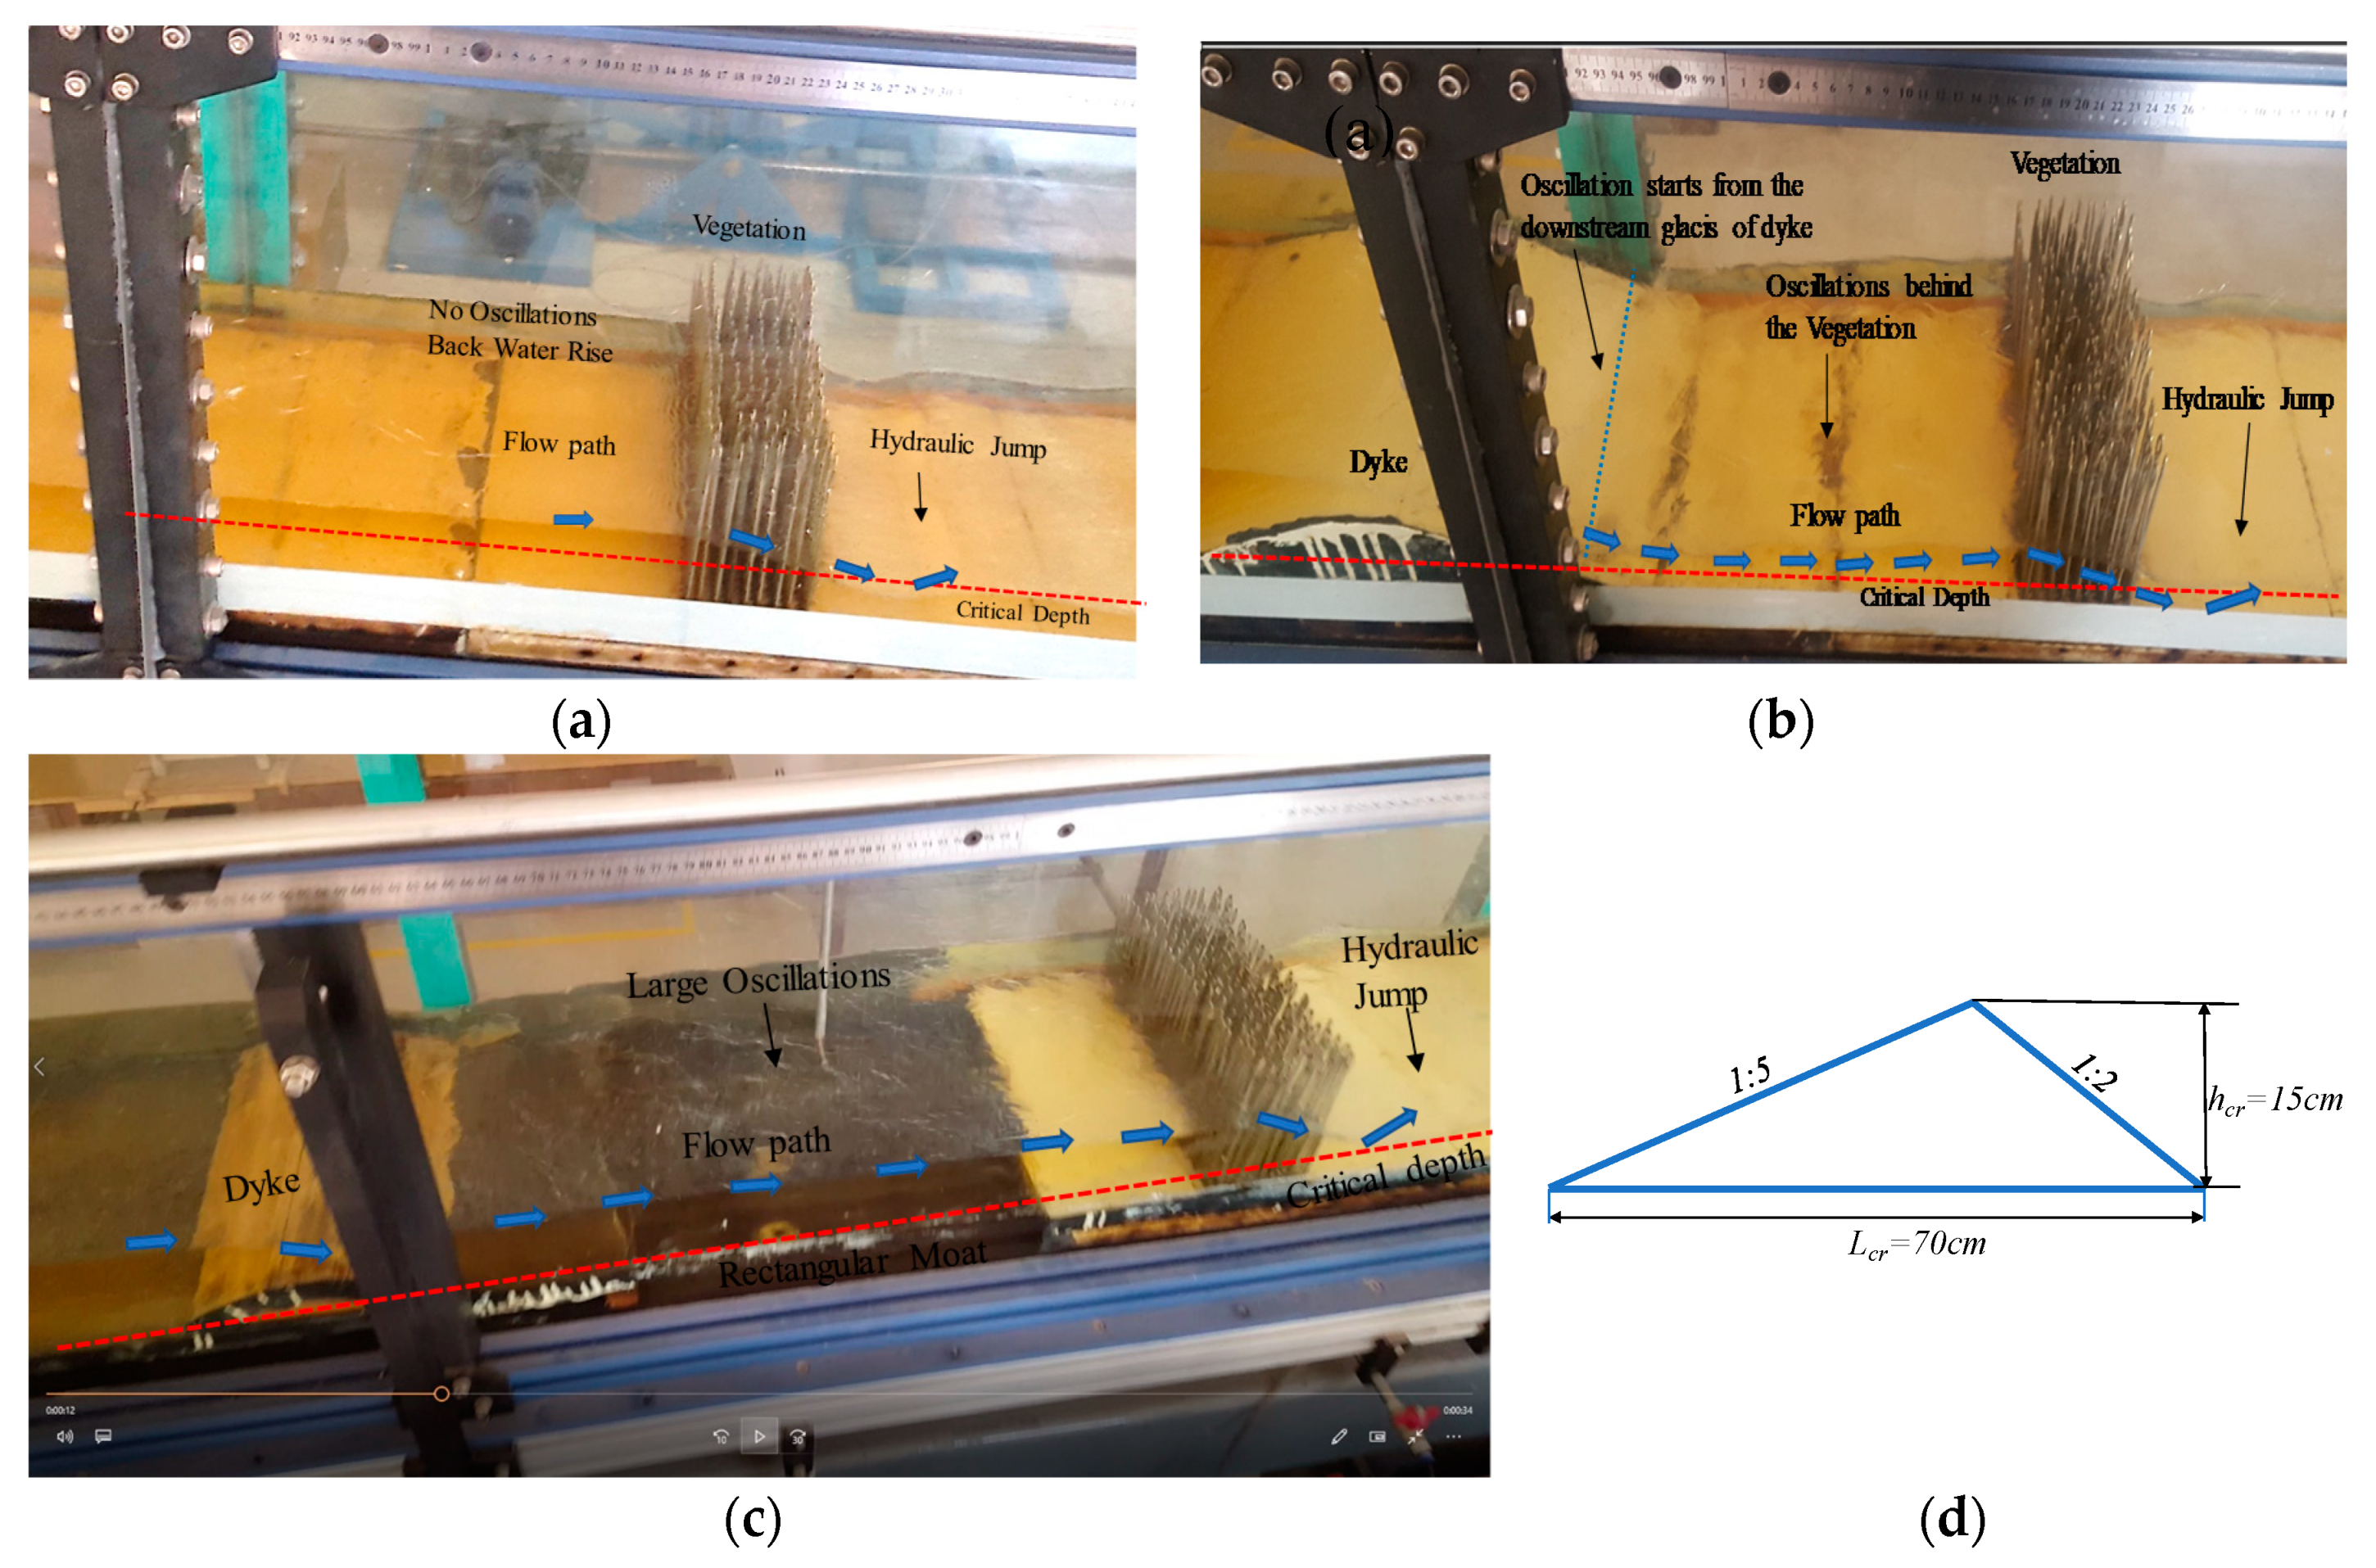
In this study, the delay time was considered as the time required for water to reach from the inlet of 10 m flume to the crest of the crump weir (Figure 7d) installed at 800 cm from the inlet having length = 70 cm, width = 31 cm (throughout the channel width), height = 15cm, 1:5 slope on the upstream and 1:2 on the downstream side of crump weir. The time (TWM) required to reach the water from inlet to the crest level of the crump weir was noted without placing any model in the channel and compared with the time required in SDS and HDS models.

3. Results

3.1. Backwater Rise

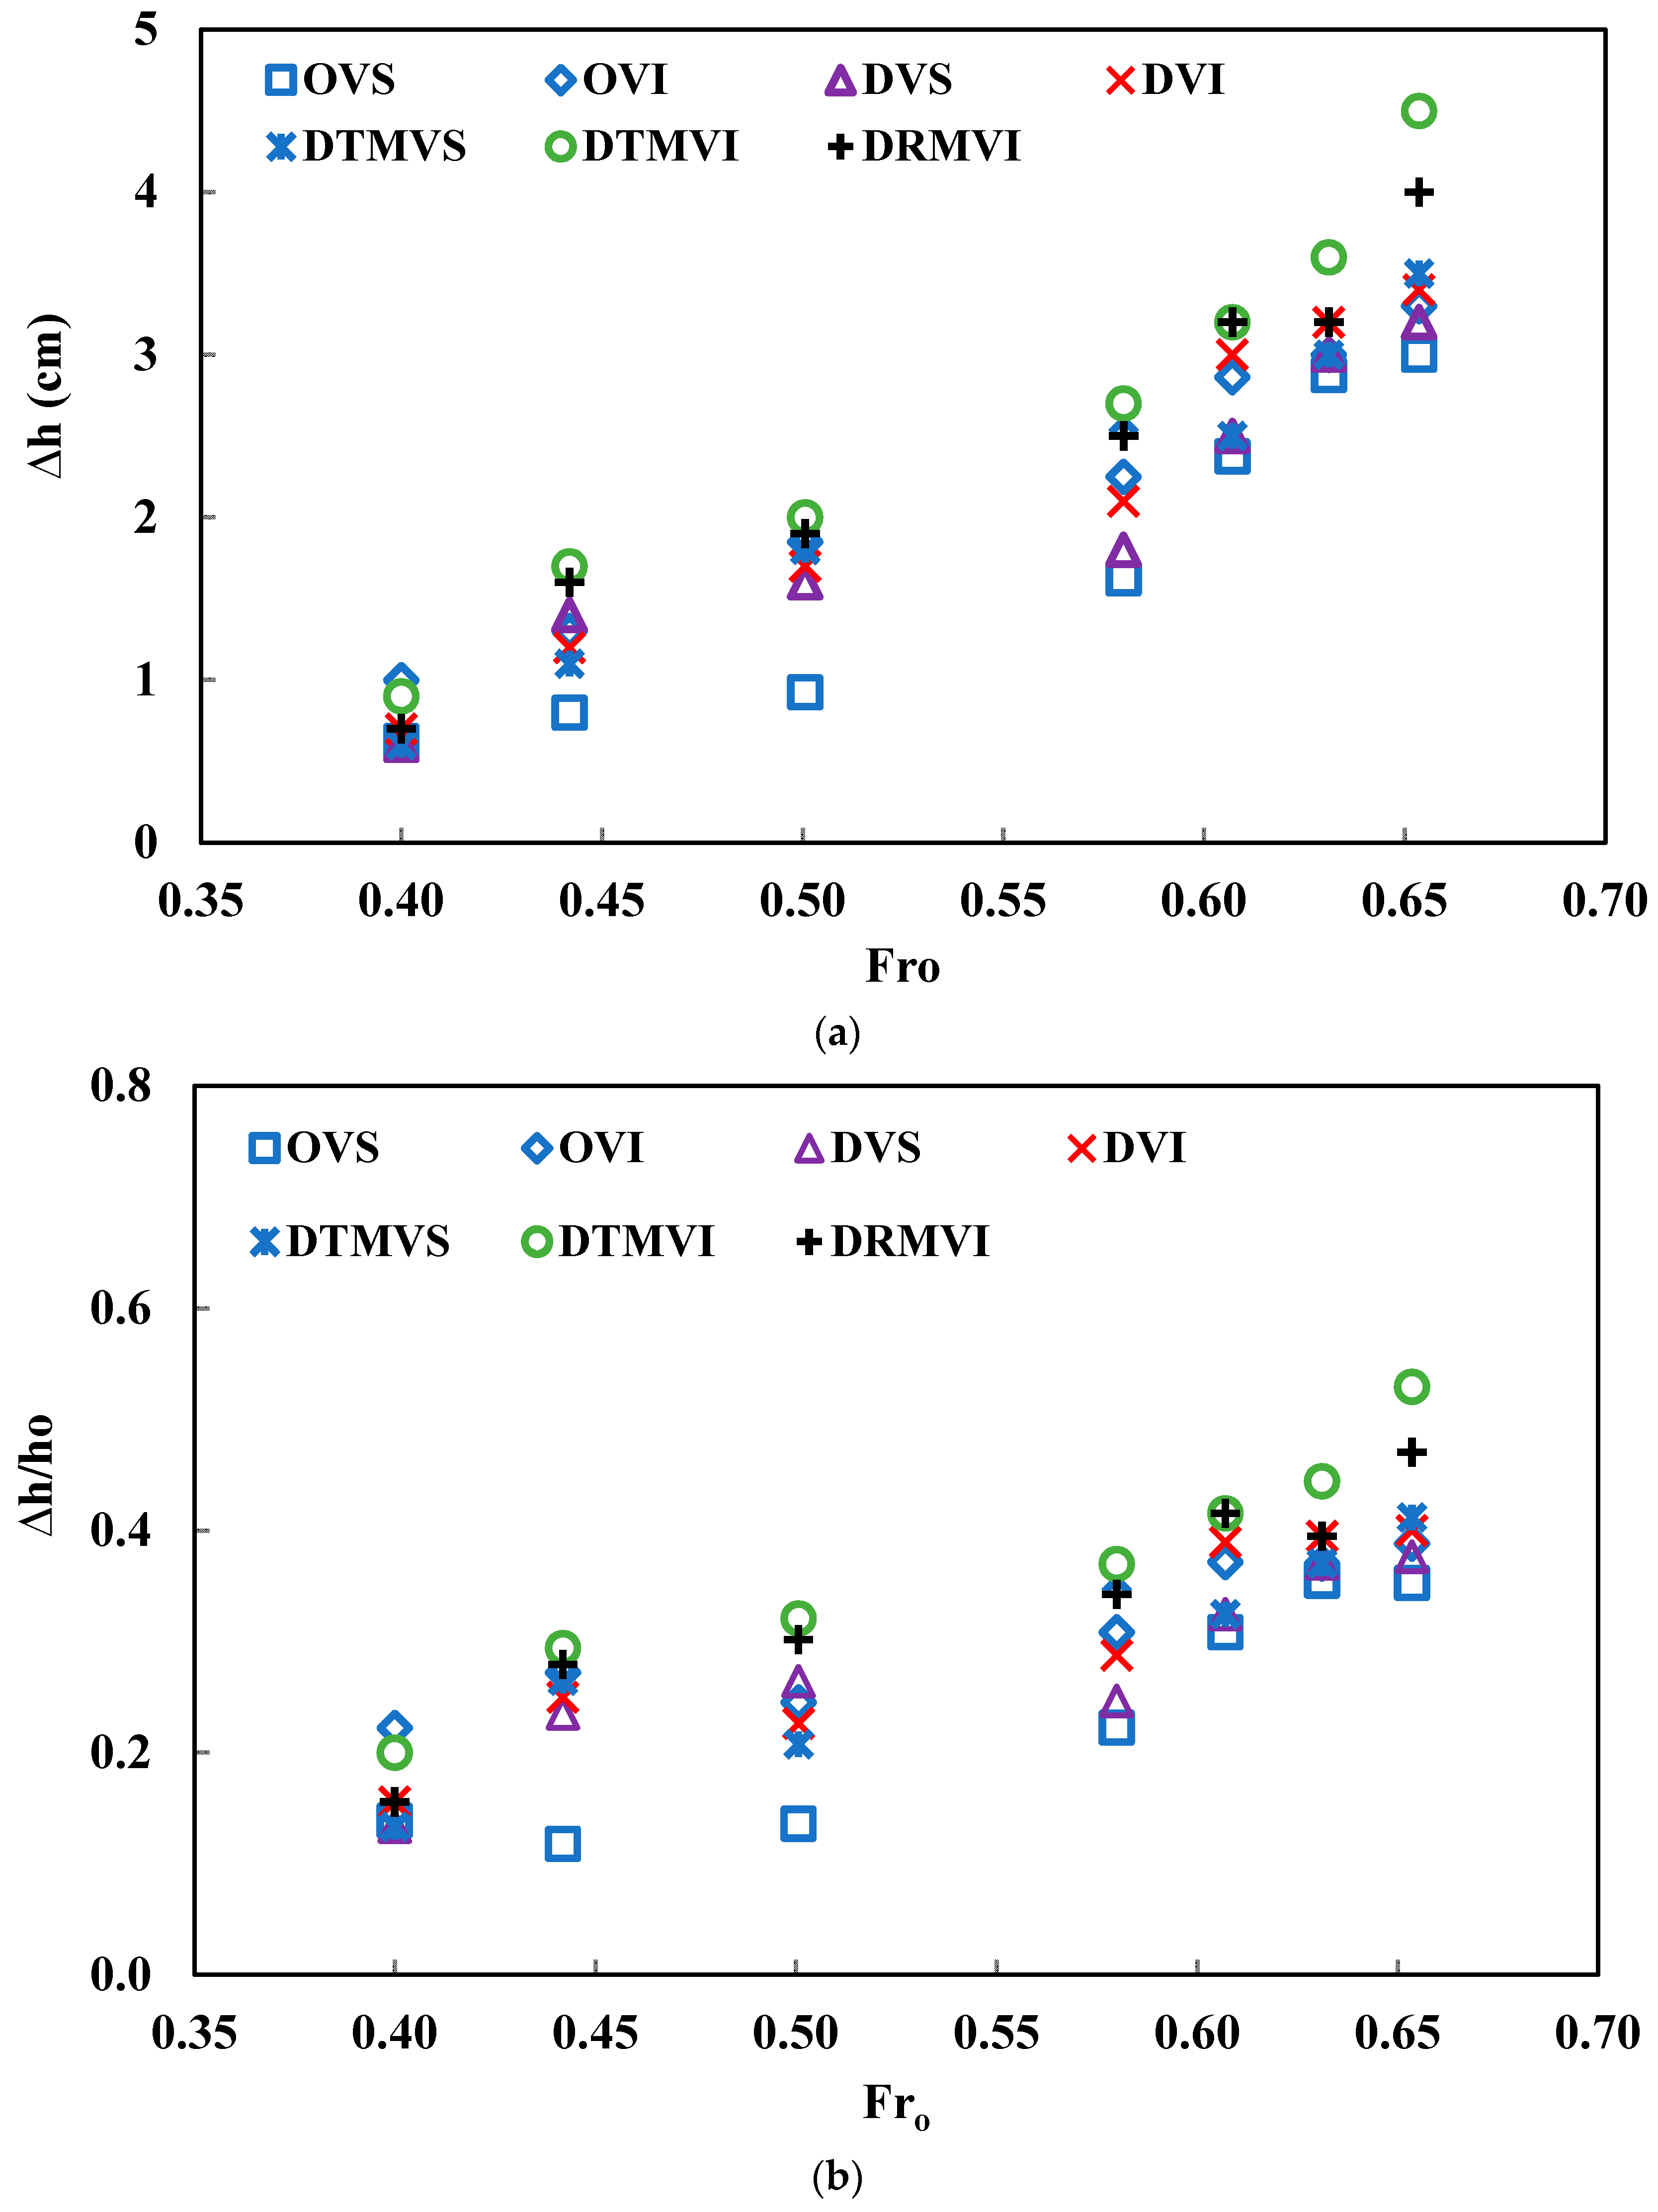
The vegetation always provides a barrier to the flowing water which creates backwater on the upstream side [30,32,39]. In the case of OVS and OVI, the initial water depth (ho) was raised upstream of the vegetation model, and the water surface slope was increased inside the vegetation due to the resistance offered by it. It was found that by increasing the density of vegetation from sparse to intermediate, the backwater rise increases to 26% and the surface slope inside the vegetation was also increased. The backwater rise and relative backwater rise varied linearly with increasing Froude number as shown in Figure 5a,b. However, the relative backwater rise was only slightly increased for different Froude number values as the range of the values on y-axis was lower as shown in Figure 5b. A similar trend was observed in the literature [48]. This shows that the initial flow depth had very little effect on the relative backwater rise for a given Froude number. In these figures, Δh and ho are the water depths on the upstream side of vegetation and initial water depth without any model placed in the channel respectively.
Similarly, the dike and vegetation (DV) together will offer more resistance to flow and a significant backwater rise. In this study, it was observed that after placing dike on the upstream side of vegetation, the maximum bac water rise increased by 15%. The backwater rise in DVI was 8.50% greater than that in DVS. The DMV model offers more resistance to the flow of water which resulted in higher backwater rise as compared to the previous models because of the moat. By placing the moat in between dike and vegetation, backwater rise was increased by 21%. By increasing the initial Froude number, the backwater rise and relative backwater rise increases linearly in DTMVI, DRMVI and DTMVS models (Figure 5a,b). In the case of a higher density of vegetation, the increase in backwater rise is 23% more than that in the case of DTMVI. In DTMVI, this value was 12% higher than that in DRMVI model. For the lower values of Froude number, i.e., Fro = 0.40 and 0.44, the backwater rise was slightly higher in SDS than that in HDS and for the remaining values of Froude number the backwater rise in the case of HDS was comparatively higher. It happened, because in HDS, for lower values of Fro the depth of water overtopping the dike was low so the depth achieved in front of vegetation was also low. However, for higher values of Fro the overtopping depth was high, due to which higher depth was achieved on the upstream side of vegetation.

3.2. Hydraulic Jump and Water Surface Profile Classification

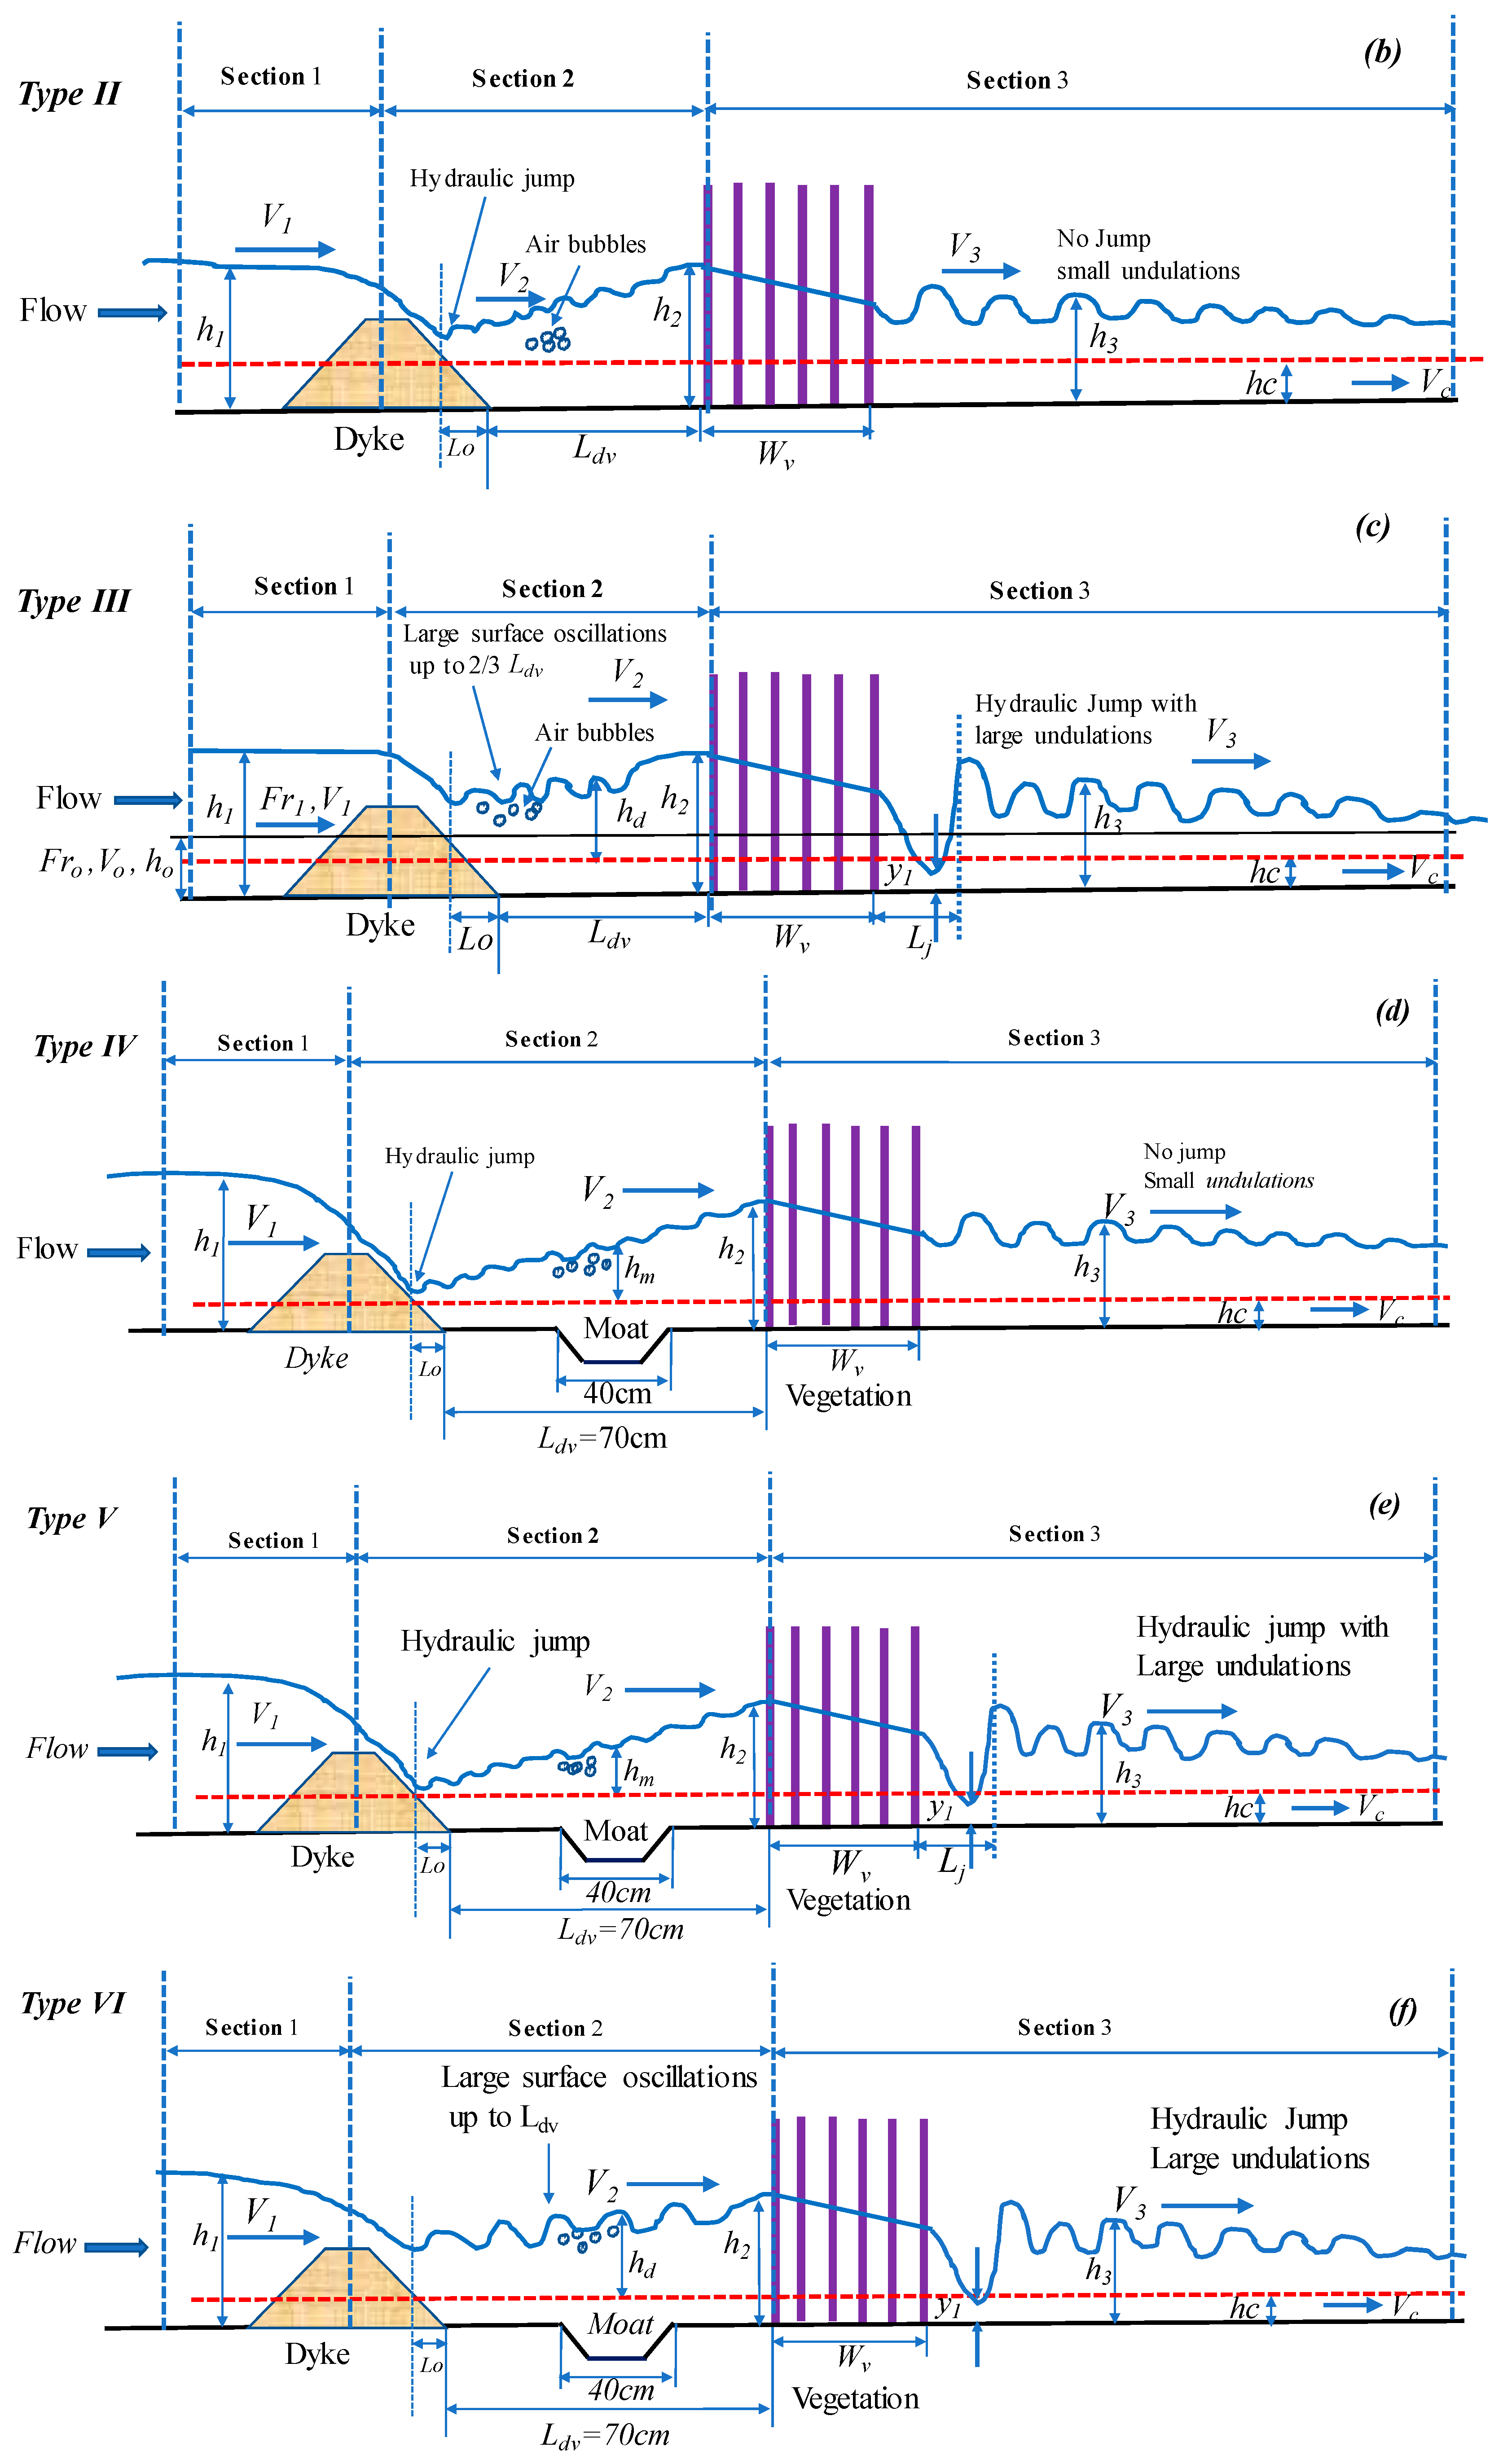
A hydraulic jump is formed when supercritical flow transforms to subcritical flow [37]. Previously, various researchers studied and classified the formation of a hydraulic jump due to only vegetation [48] and due to the combined effect of dike and vegetation [4]. In the hybrid defense system, the nature of the hydraulic jump varied with changing flow and vegetation conditions [4]. It is important to control the position of a hydraulic jump to reduce the flow energy and to stabilize the hydraulic structure [49,50]. Thus, the knowledge of jump type and associated water surface profiles and their classification for flow over the hydraulic structures are essential for assessment of the mitigation effect of a defense system. The types of jumps formed in this experimental investigation are classified in six different categories depending upon the location of the jump, as shown in Figure 6 and Figure 7. They represent experimental photographs captured during the experimentation. The hydraulic jump was observed between dike and vegetation model (Section 2, Figure 6) and/or on the downstream side of vegetation (Section 3, Figure 6).

3.2.1. Hydraulic Jump Classification in SDS

In SDS the hydraulic jump formed is classified as Type I (shown in Figure 6a). In the case of sparse vegetation (OVS) for initial values of Froude numbers i.e., Fro = 0.40, 0.44, 0.50, 0.57, and 0.60, only backwater rise and small undulations on the downstream side of vegetation with no hydraulic jump were observed while the flow was found to have higher slope inside the vegetation patch. However, for remaining Froude numbers i.e., Fro = 0.63 and 0.65 an undulated jump (UJ) (1 < Fr < 1.7 [51]) was developed on the downstream side of vegetation patch (Type I) as shown in Figure 6a. Similarly, in the case of intermediate vegetation (OVI) there was no jump formed against the lower values of Fro = 0.40, 0.44, 0.50 and 0.57, however, for Fro = 0.60, 0.63 and 0.65 undulated jump was formed on the downstream side of vegetation patch (Type I). The classification of the hydraulic jump of SDS is also elaborated in Table 2. A higher backwater rise, larger undulations, and a larger undulated jump were observed in OVI as compared to OVS. The relative length of the hydraulic jump Lj/y1 was maximum against Fro = 0.65 in OVI case. In Figure 6a h1 and h2 are the average depths of water on the upstream and downstream side of vegetation after the jump, y1 = minimum depth of water in hydraulic jump, Lj = length of hydraulic jump, hc = critical depth, V1, V2 are the average velocities on the upstream and downstream side of vegetation patch respectively and Vc = critical velocity against critical depth.

3.2.2. Hydraulic Jump Classification in HDS

In the case of hybrid defense system (HDS), in DVS and DVI cases, the hydraulic jump formed is classified as Type II and III, as shown in Figure 6b,c. In these figures, h1, h2 and h3 are the average water depths in front of dike, in front of vegetation, and downstream of vegetation patch, respectively, hd = the average depth of water in the middle of Ldv, Lo = the length of start of hydraulic jump on the downstream slope of dike from the toe of dike towards the crest, Ldv = distance between dike and vegetation, Fr1 = Froude number on the upstream of dike, Fro, ho, Vo, V1, V2, Vc, and Lj are already define previously. In Type II, a hydraulic jump developed in Section 2 with no jump in Section 3. However, in Type III no jump formed in Section 2 with the only jump developed in Section 3. The classification of the hydraulic jump of HDS is described below and summarized in Table 2.
In DVS model against the lower values of Froude number, i.e., Fro = 0.40 and 0.44 weak jump (WJ) (1.7 < Fr < 2.5 [51]) was formed in only Section 2 (Type II) with small undulations in Section 3 as shown in Figure 6b. For the initial values of Froude number (Fro = 0.40) the jump initiated on the bed in Section 2, however, for Fro = 0.44 jumpstarted from the downstream slope of the trapezoidal shape dike. Air bubbles were also formed in Section 2, and water surface slope also increases inside the vegetation model. For Fro = 0.50 undulated jump of Type II was formed in Section 2. However, for higher values of Froude numbers, i.e., Fro = 0.57, 0.60, 0.63 and 0.65 an undulated hydraulic jump of Type III was formed as shown in Figure 6c.
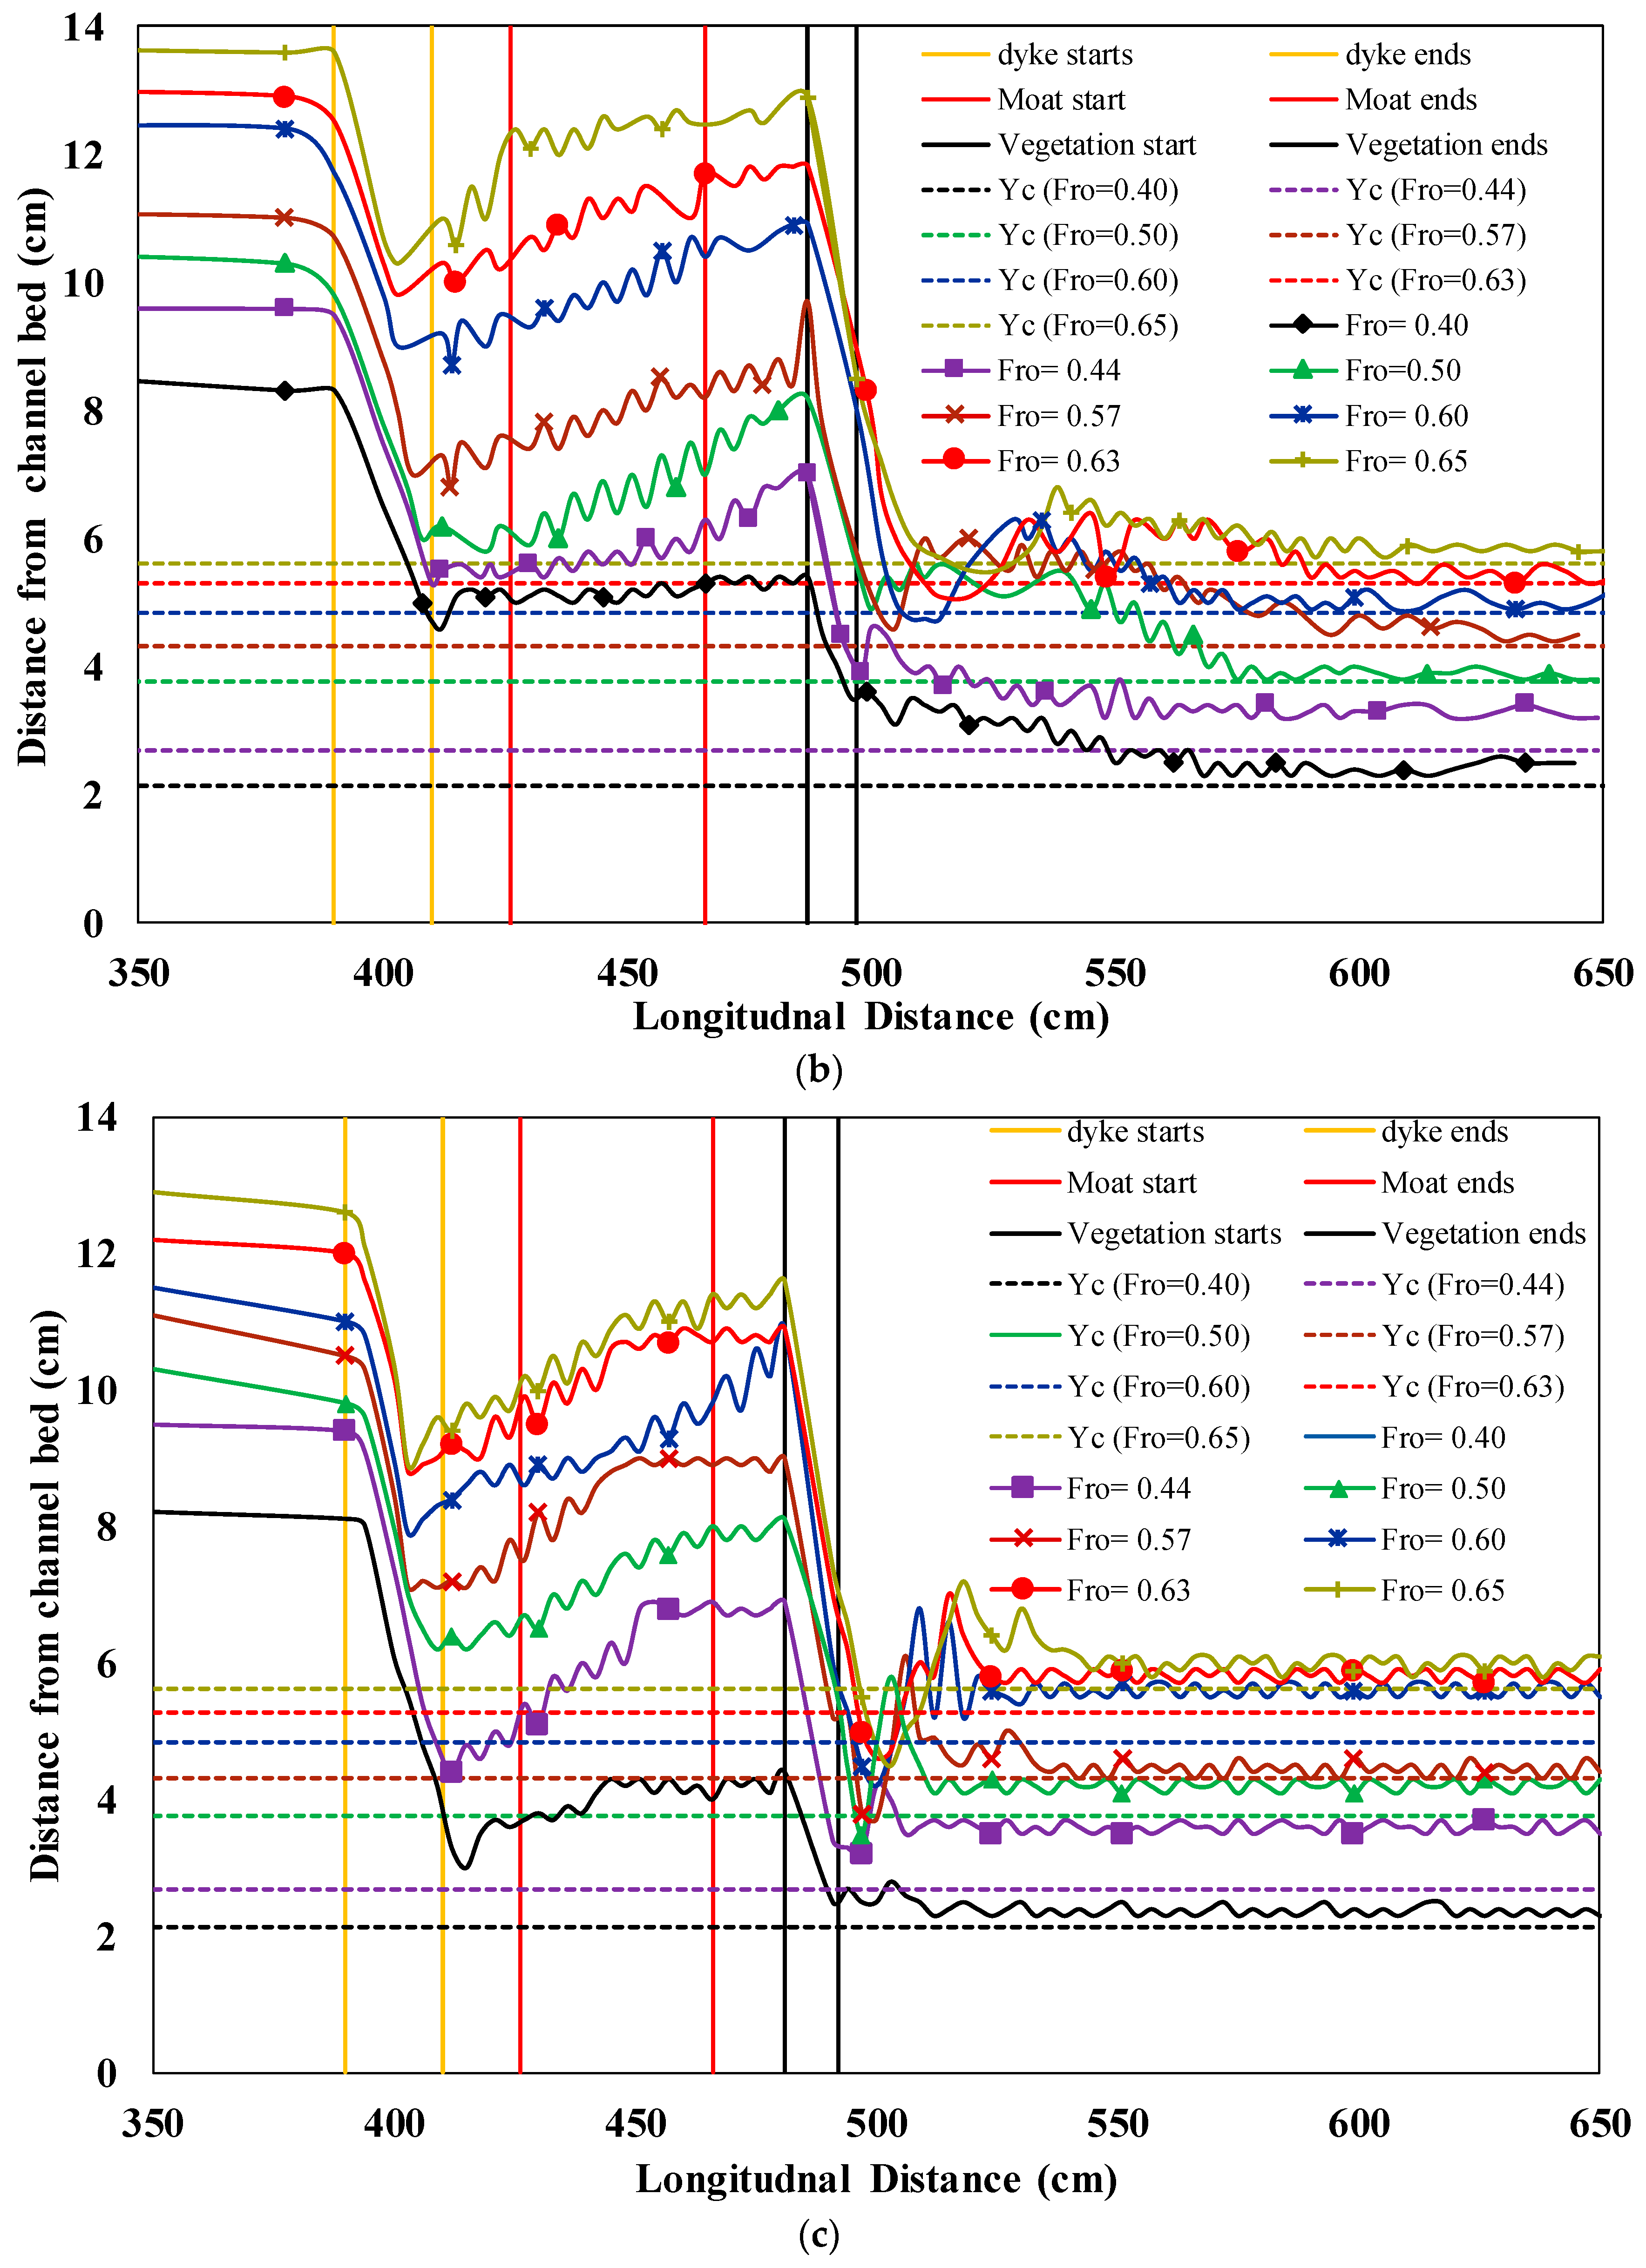
Similarly, in DVI for Fro = 0.40 and 0.44 weak jump of Type II and for Fro = 0.50 and 0.57 undulated jump of Type II was developed starting from the downstream slope of dike (Lo increases with Froude number), as shown in Figure 6c. For Fro = 0.60, 0.60 and 0.65 undular jump of Type III was developed in Section 3 with surface oscillations in Section 2 as shown in Figure 6c. In DTMVS, DTMVI and DRMVI cases, the formation of hydraulic jumps was classified as Type IV, V and VI. The classification is based on the location of the formation of a hydraulic jump either in Section 2 (Type IV), in both Section 2 and Section 3 (Type V) or in Section 3 (Type VI). In DTMVS model for the lower values of Froude number, i.e., Fro = 0.40, 0.44 undulated jump of Type IV was observed as shown in Figure 6d. Air bubbles were also formed in Section 2, and water surface slope also increased inside the vegetation model. There was no jump (NJ) for Fro = 0.50, 0.57, and 0.60 because the hydraulic jump shifted its position from Section 2 to Section 3 from lower to higher Froude numbers. In this range, the hydraulic jump was in the transition state. For the remaining values of Fro = 0.63 and 0.65 an undulated hydraulic jump of Type VI was developed, as shown in Figure 6e. The graphical representation of experimental results of DTMVS against all the values of the selected range of initial Froude number (Fro) are shown in Figure 8a.
In DTMVI model for Fro = 0.40, 0.44, and 0.50 jump of Type IV was observed (Figure 6d). The jump against Fro = 0.40 was weak and for Fro = 0.44 and 0.50 was undulated in nature. For Fro = 0.57 undulated jump was observed in both Section 2 and Section 3 classified as Type V as shown in Figure 6e and for Fro = 0.60, 0.63 and 0.65 undulated jump developed was classified as Type VI. The graphical representation of experimental results of DTMVI against all the values of the selected range of initial Froude number (Fro) is shown in Figure 8b.
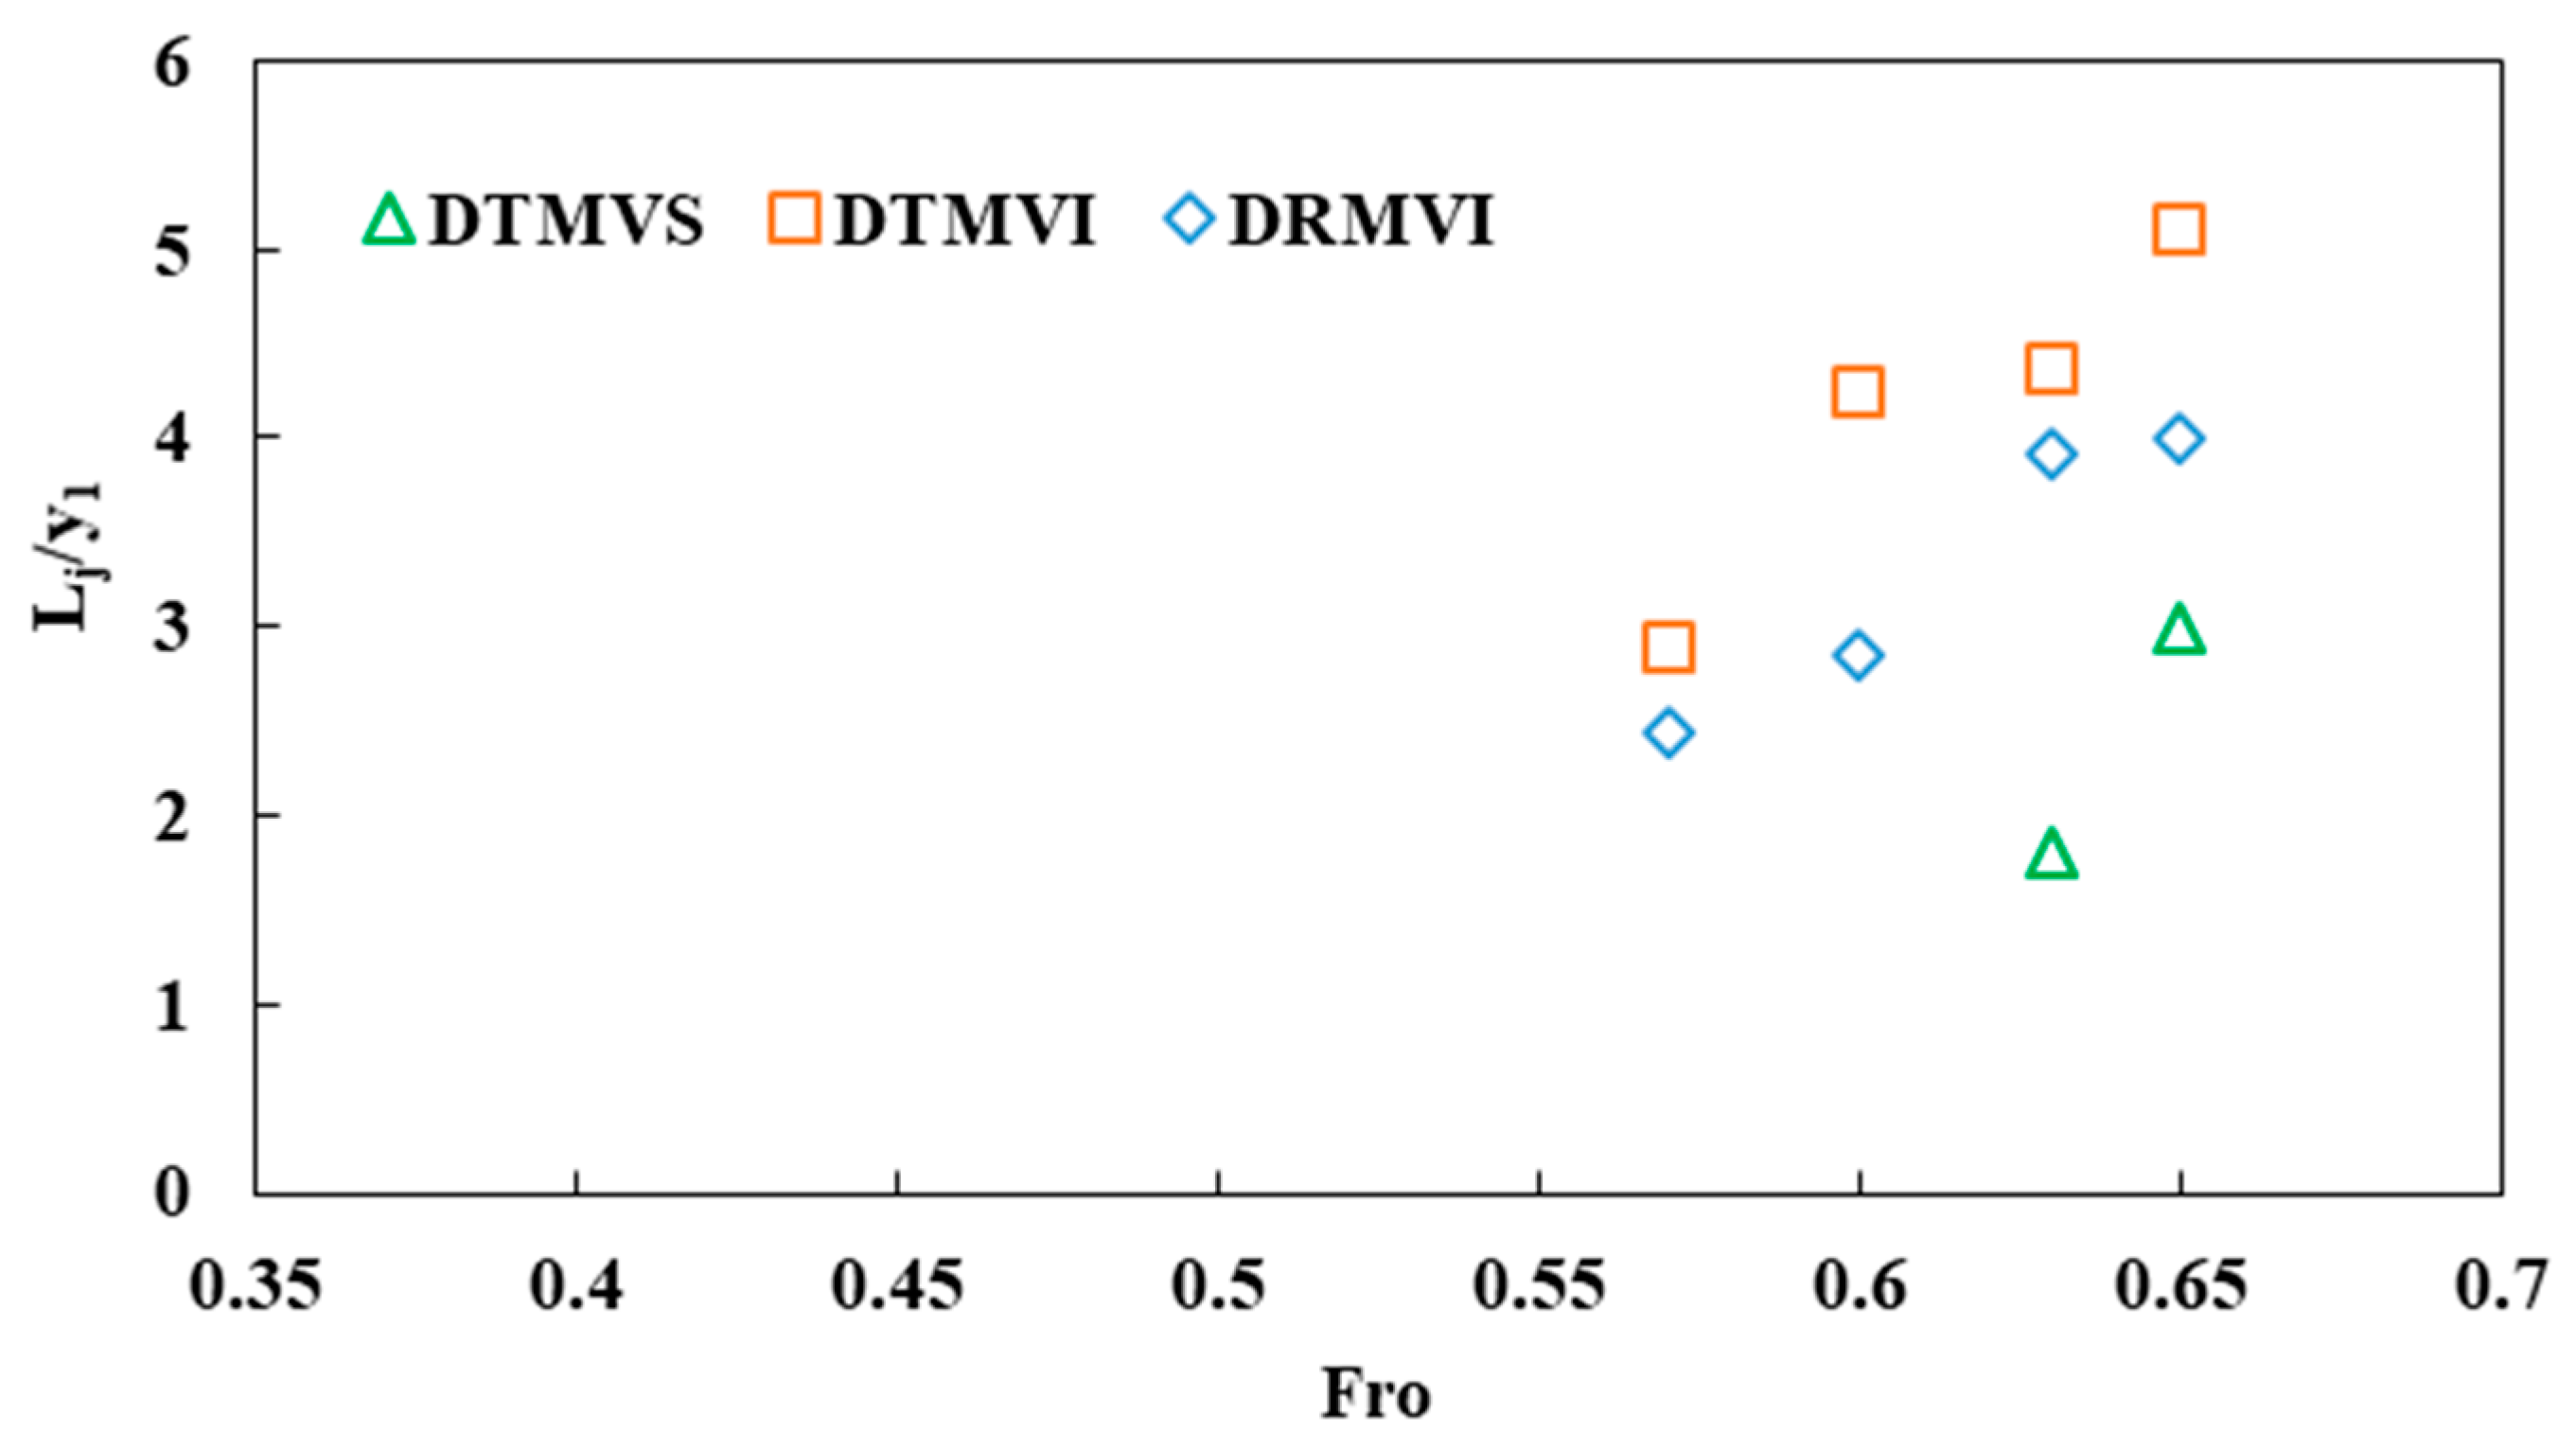
Similarly, in DRMVI model rectangular moat was used in combination with dike and intermediate vegetation to examine the effect of the shape of moat on total energy dissipation. The profiles were the same as those in the case of DTMVI. However, larger oscillations in between dike and vegetation than DTMVI was observed due to rectangular shape, because in rectangular shape a sudden drop of water was observed due to the straight walls of moat while in trapezoidal moat due to sloping surface fewer oscillations were formed. Against the value of Fro = 0.40 weak jump of Type IV, for Fro = 0.44 and 0.50 undulated jump of Type IV, for Fro = 0.57 undulated jump of Type V was observed. For the remaining values of Fro = 0.60, 0.63 and 0.65 undulated jump Type VI was developed as shown in Figure 6f. The graphical representation of experimental results of DRMVI against all the values of the selected range of initial Froude number (Fro) is shown in Figure 8c. The variation of length of the hydraulic jump can be represented by the relative length of the hydraulic jump (Lj/y1) [48]. In these cases, the relative length of the hydraulic jump (Lj/y1) increased by increasing Fro and the maximum relative jump was noted in the case of DTMVI as compared to DTMVS and DRMVS, as shown in Figure 9.

3.3. Evaluation of Energy Dissipation

3.3.1. Energy Dissipation in Single Defense System (SDS)

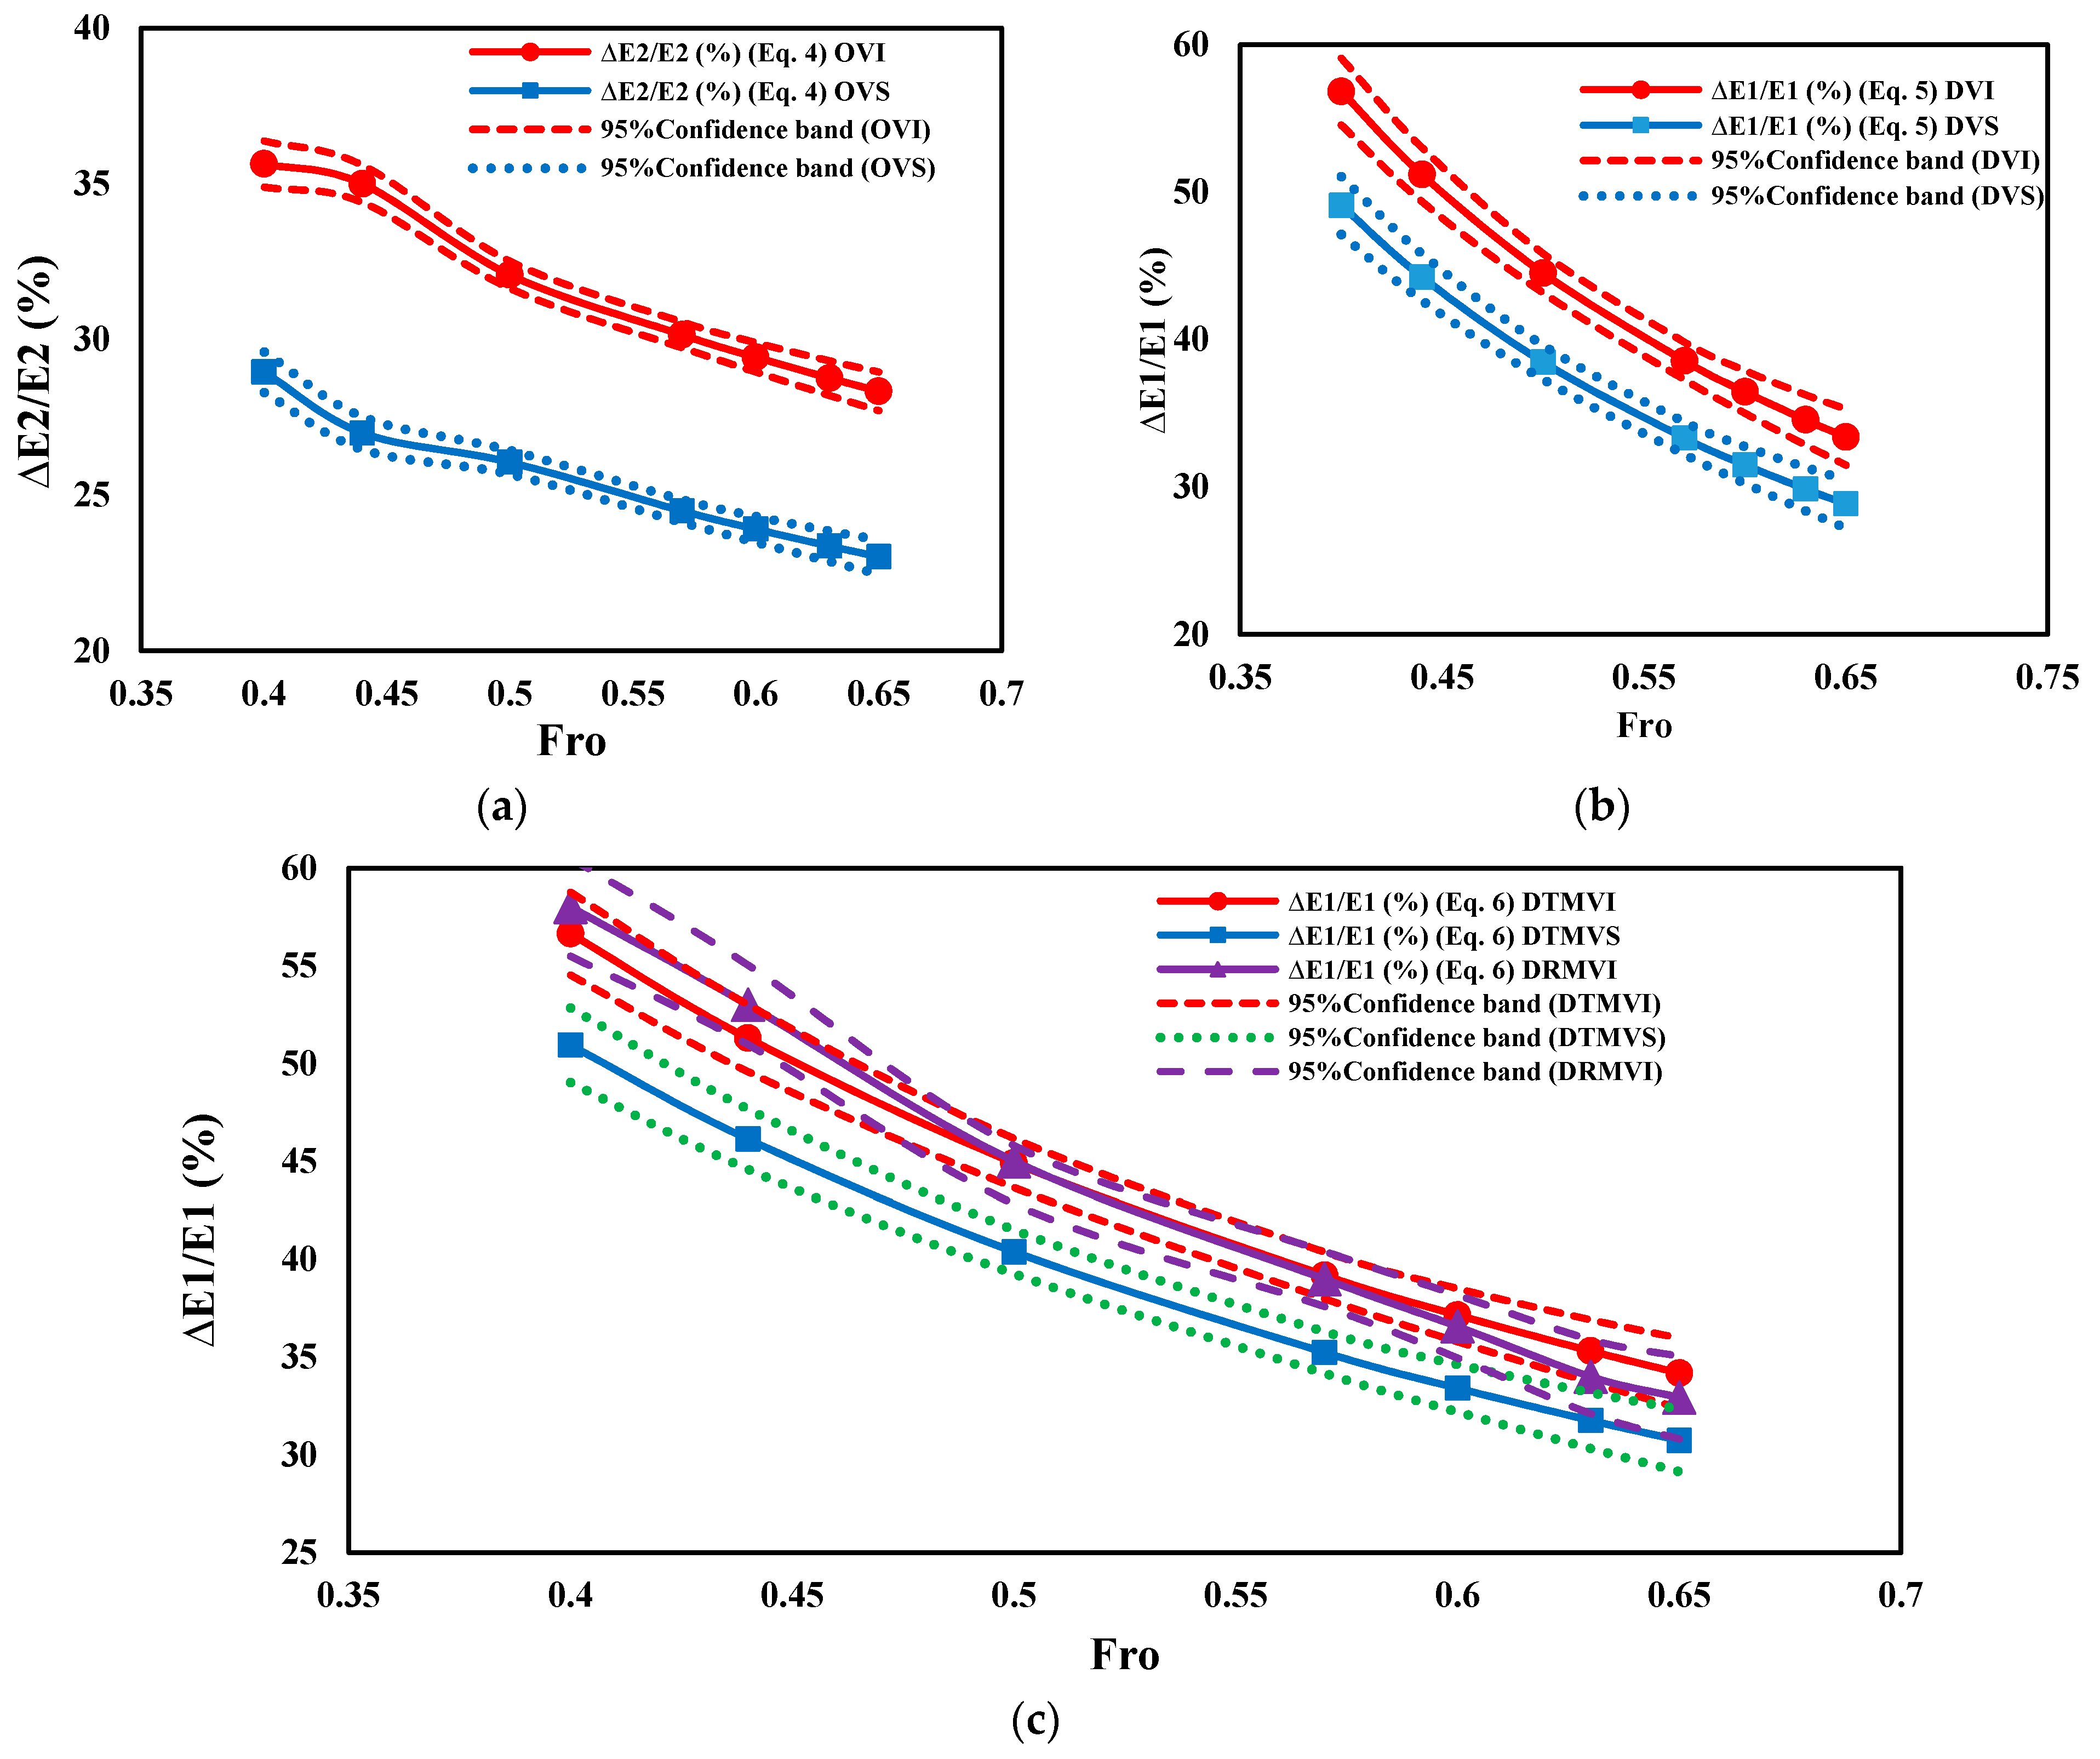
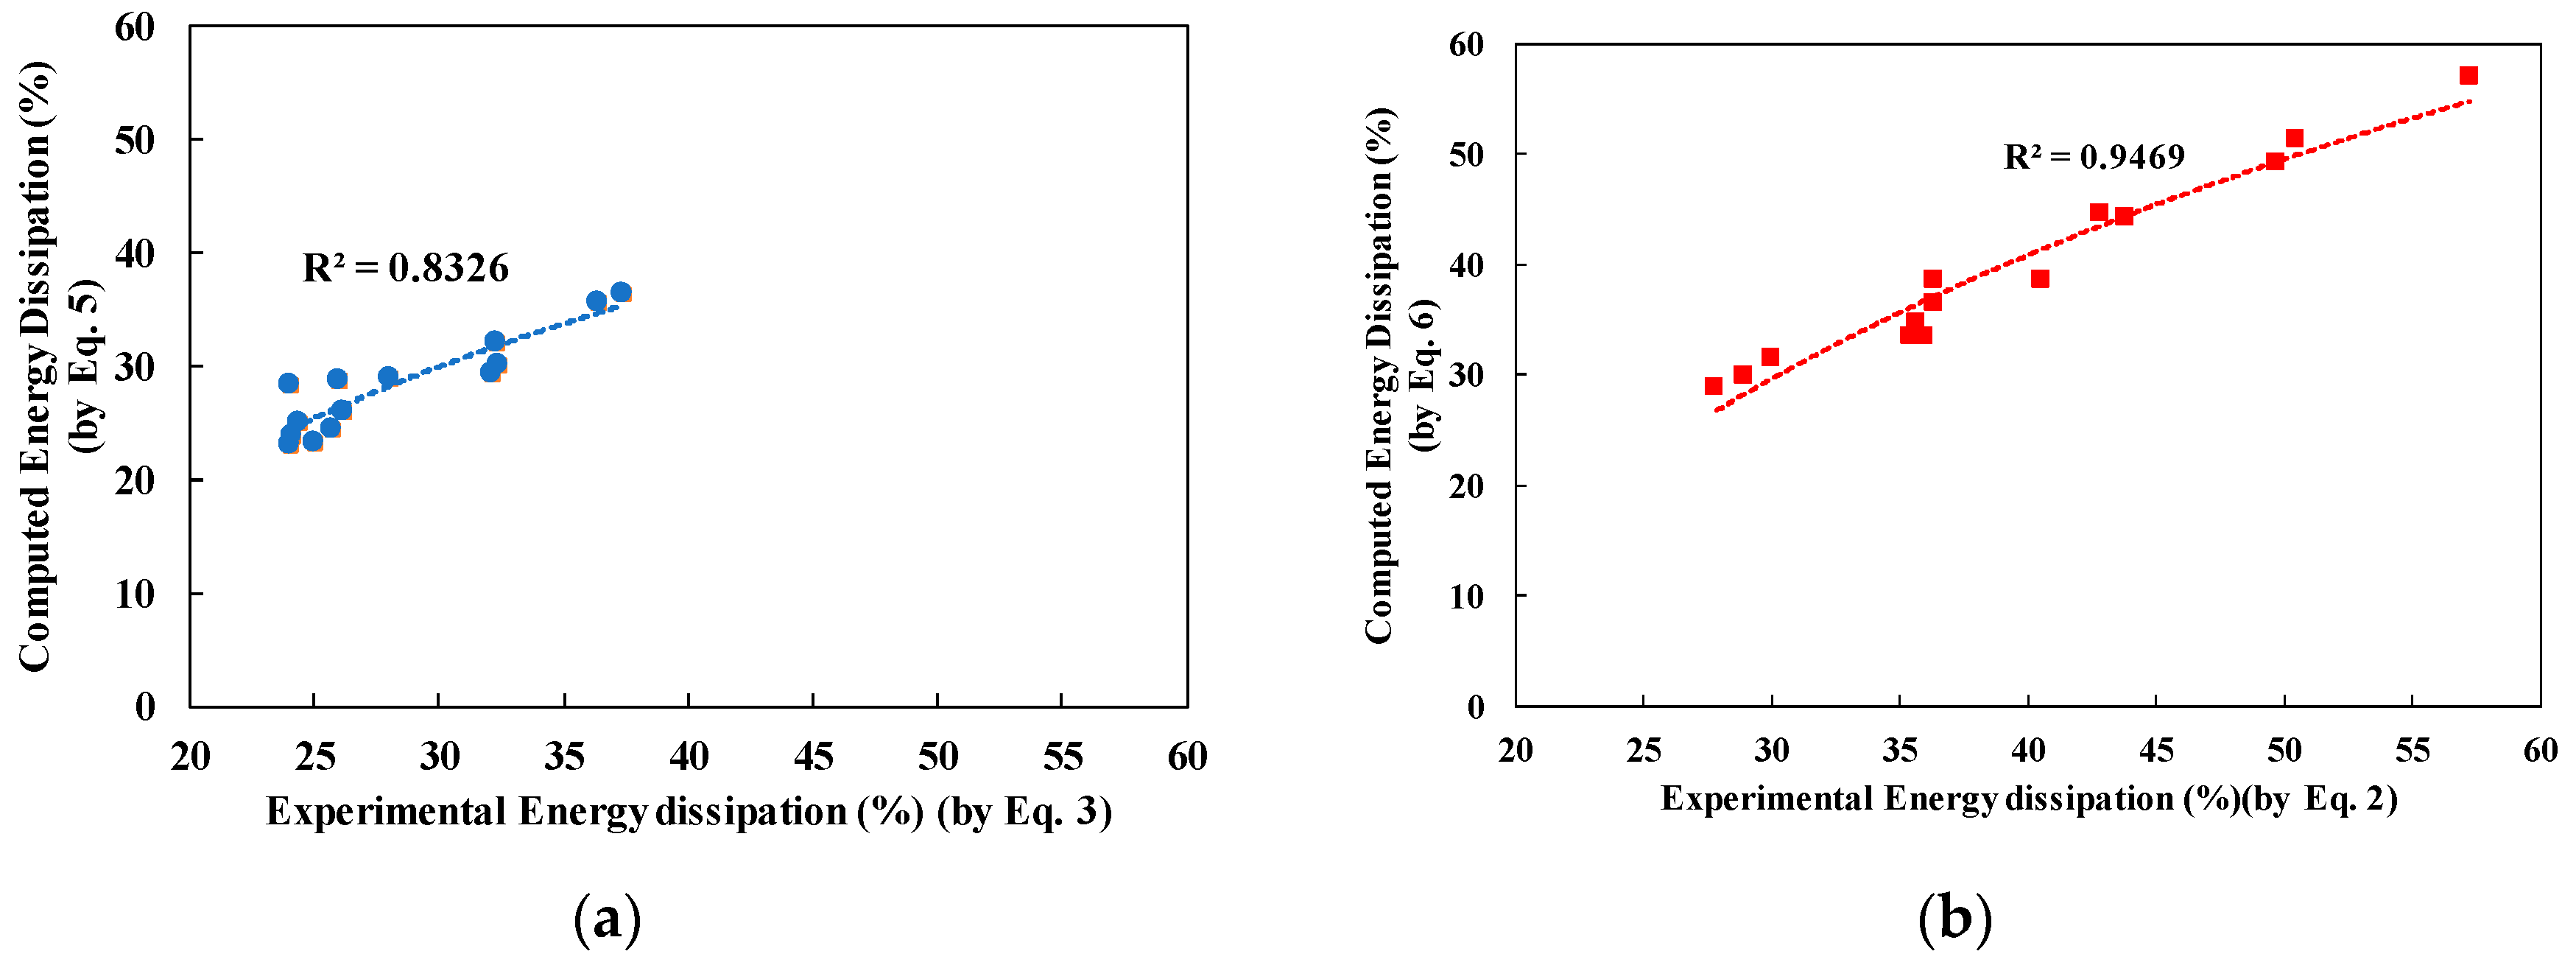
The energy loss due to a hydraulic jump only and the total energy loss were calculated against the Froude number range Fro = 0.40–0.65. In this study, the total energy loss for all the cases of SDS and HDS was determined, however, the energy loss due to a hydraulic jump is explained only for HDS. For SDS, the maximum energy reduction in OVS and OVI was 28% and 36.34%, respectively, against Fro = 0.40 and it decreased with higher values of Fro. While increasing the values of Fro from 0.40 to 0.65 the energy dissipation rate decreased by about 14.25% and 33.86% in OVS and OVI, respectively. The average energy loss was 25.32% and 31.49% for OVS and OVI, respectively. The results of energy dissipation show that initial Froude number and the density of vegetation (B/d) were the factors affecting the total energy loss. Based on these two important factors regression equations were developed for all the cases of SDS and HDS. In this paper, the Equations (4)–(6) were developed using EXCEL spreadsheet and graph to get the exponent type functions. The best fit curve and 95% confidence bands were computed and plotted (Figure 10a–c) for each of Equations (4)–(6) by software built in EXCEL. Equation (4), as given below, was developed to calculate the relative percentage energy loss in the case of OVS and OVI.
Δ E 2 E 2 ( % )   =   23.75 [ F r o ]   0.47 [ B D ]   0.31
By using Equation (4), the energy loss (%) in the case of OVI and OVS was calculated for a certain range of Froude number as a ready reference for future use, as shown in Figure 11a.

3.3.2. Energy Dissipation in Hybrid Defense System (HDS)

In HDS, the maximum energy loss (%) for DVS and DVI was 49.71% and 57.28% against Fro = 0.40. While increasing the values of Fro from 0.40 to 0.65 the energy reduction rate decreased by about 44% and 37.13% and the average energy loss was 36.63% and 41%, respectively. Equation (5) given below was developed by regression analysis as described above in Section 3.2.1, to compute the relative percentage energy reduction within the selected range of Fro. The computed values of energy loss using Equation (5) for a certain range of Fro are shown in Figure 11b.
Δ E 1 E 1 ( % )   =   21.23 [ F r o ]   1.09 [ B D ]   0.218
To check the effectiveness of all the cases of HDS, i.e., DTMVS, DTMVI, and DRMVI models, the maximum energy reduction due to a hydraulic jump in Section 2Ej2), in Section 3Ej3), maximum overall energy dissipation and average energy dissipation were calculated (summary is shown in Table 3) In all these cases, DTMVI performed better than DTMVS and DRMVI regarding energy dissipation. In the case of DTMVI, maximum ΔEj2 = 27% and ΔEj3 = 4%. The maximum total energy reduced in this case was 60% and the average energy reduced was 46%.
Figure 10c shows the combine trends of DTMVS, DTMVI, and DRMVI. Based on the data of DTMVS, DTMVI, and DRMVI cases, Equation (6) was developed to compute the relative percentage energy loss. The results from Equation (6) are shown in Figure 11c.
Δ E 1 E 1 ( % )   =   22.14 [ F r o ]   1.04 [ B D ]   0.1584

3.3.3. Delay in Floodwater Arrival Time and Water Level Rise

In the first step, the delay time TWM was computed without placing any obstruction model in the flume. Similarly, the delay times for a single defense system and a hybrid defense system were computed. The values of TWM were in the range of 28–80 s, against the different values of initial Froude number, whereas it was 29–115 s for OVS, 30–118 s for OVI, 32–129 s for DVS and 34–132 s for DVI. Similarly, the delay time for DTMVS, DTMVI, and DRMVI was 33–137 s, 37–140 s and 36–139 s respectively. The maximum delay time was 2 min 20 s for DTMVI against Fro = 0.40. In all the cases, the delay time decreases by increasing Fro. The relative time with respect to TWM was also maximum in the case of DTVMI, which will result in a maximum delay in flood arrival. To examine the relationship between the relative delay time for different cases of SDS and HDS, a pairwise comparison method namely least significant difference (LSD) method explained in the literature [52] was used. The calculated critical value of LSD was 0.21. So, the minimum difference between a pair of means (µ1–µ2) necessary for statistical significance was 0.21. There were 21 pairwise groups (G1 to G21). It was observed that for the difference of means of pairs G5–G6, G10–G11, and G14–G15 were greater than 0.21 means that there is a significant difference between the means of these pairs exist. OVI and DTMVI. It is concluded from G5, G6, G10, and G11 that the relative delay time of HDS (DTMVI and DRMVI) is higher than SDS (OVS and OVI). The results of G14 and G15 indicated that the relative time of delay increased by placing the moat in between the dike and vegetation of higher density. The complete pairwise comparison list is shown in Table A1 (Appendix A).
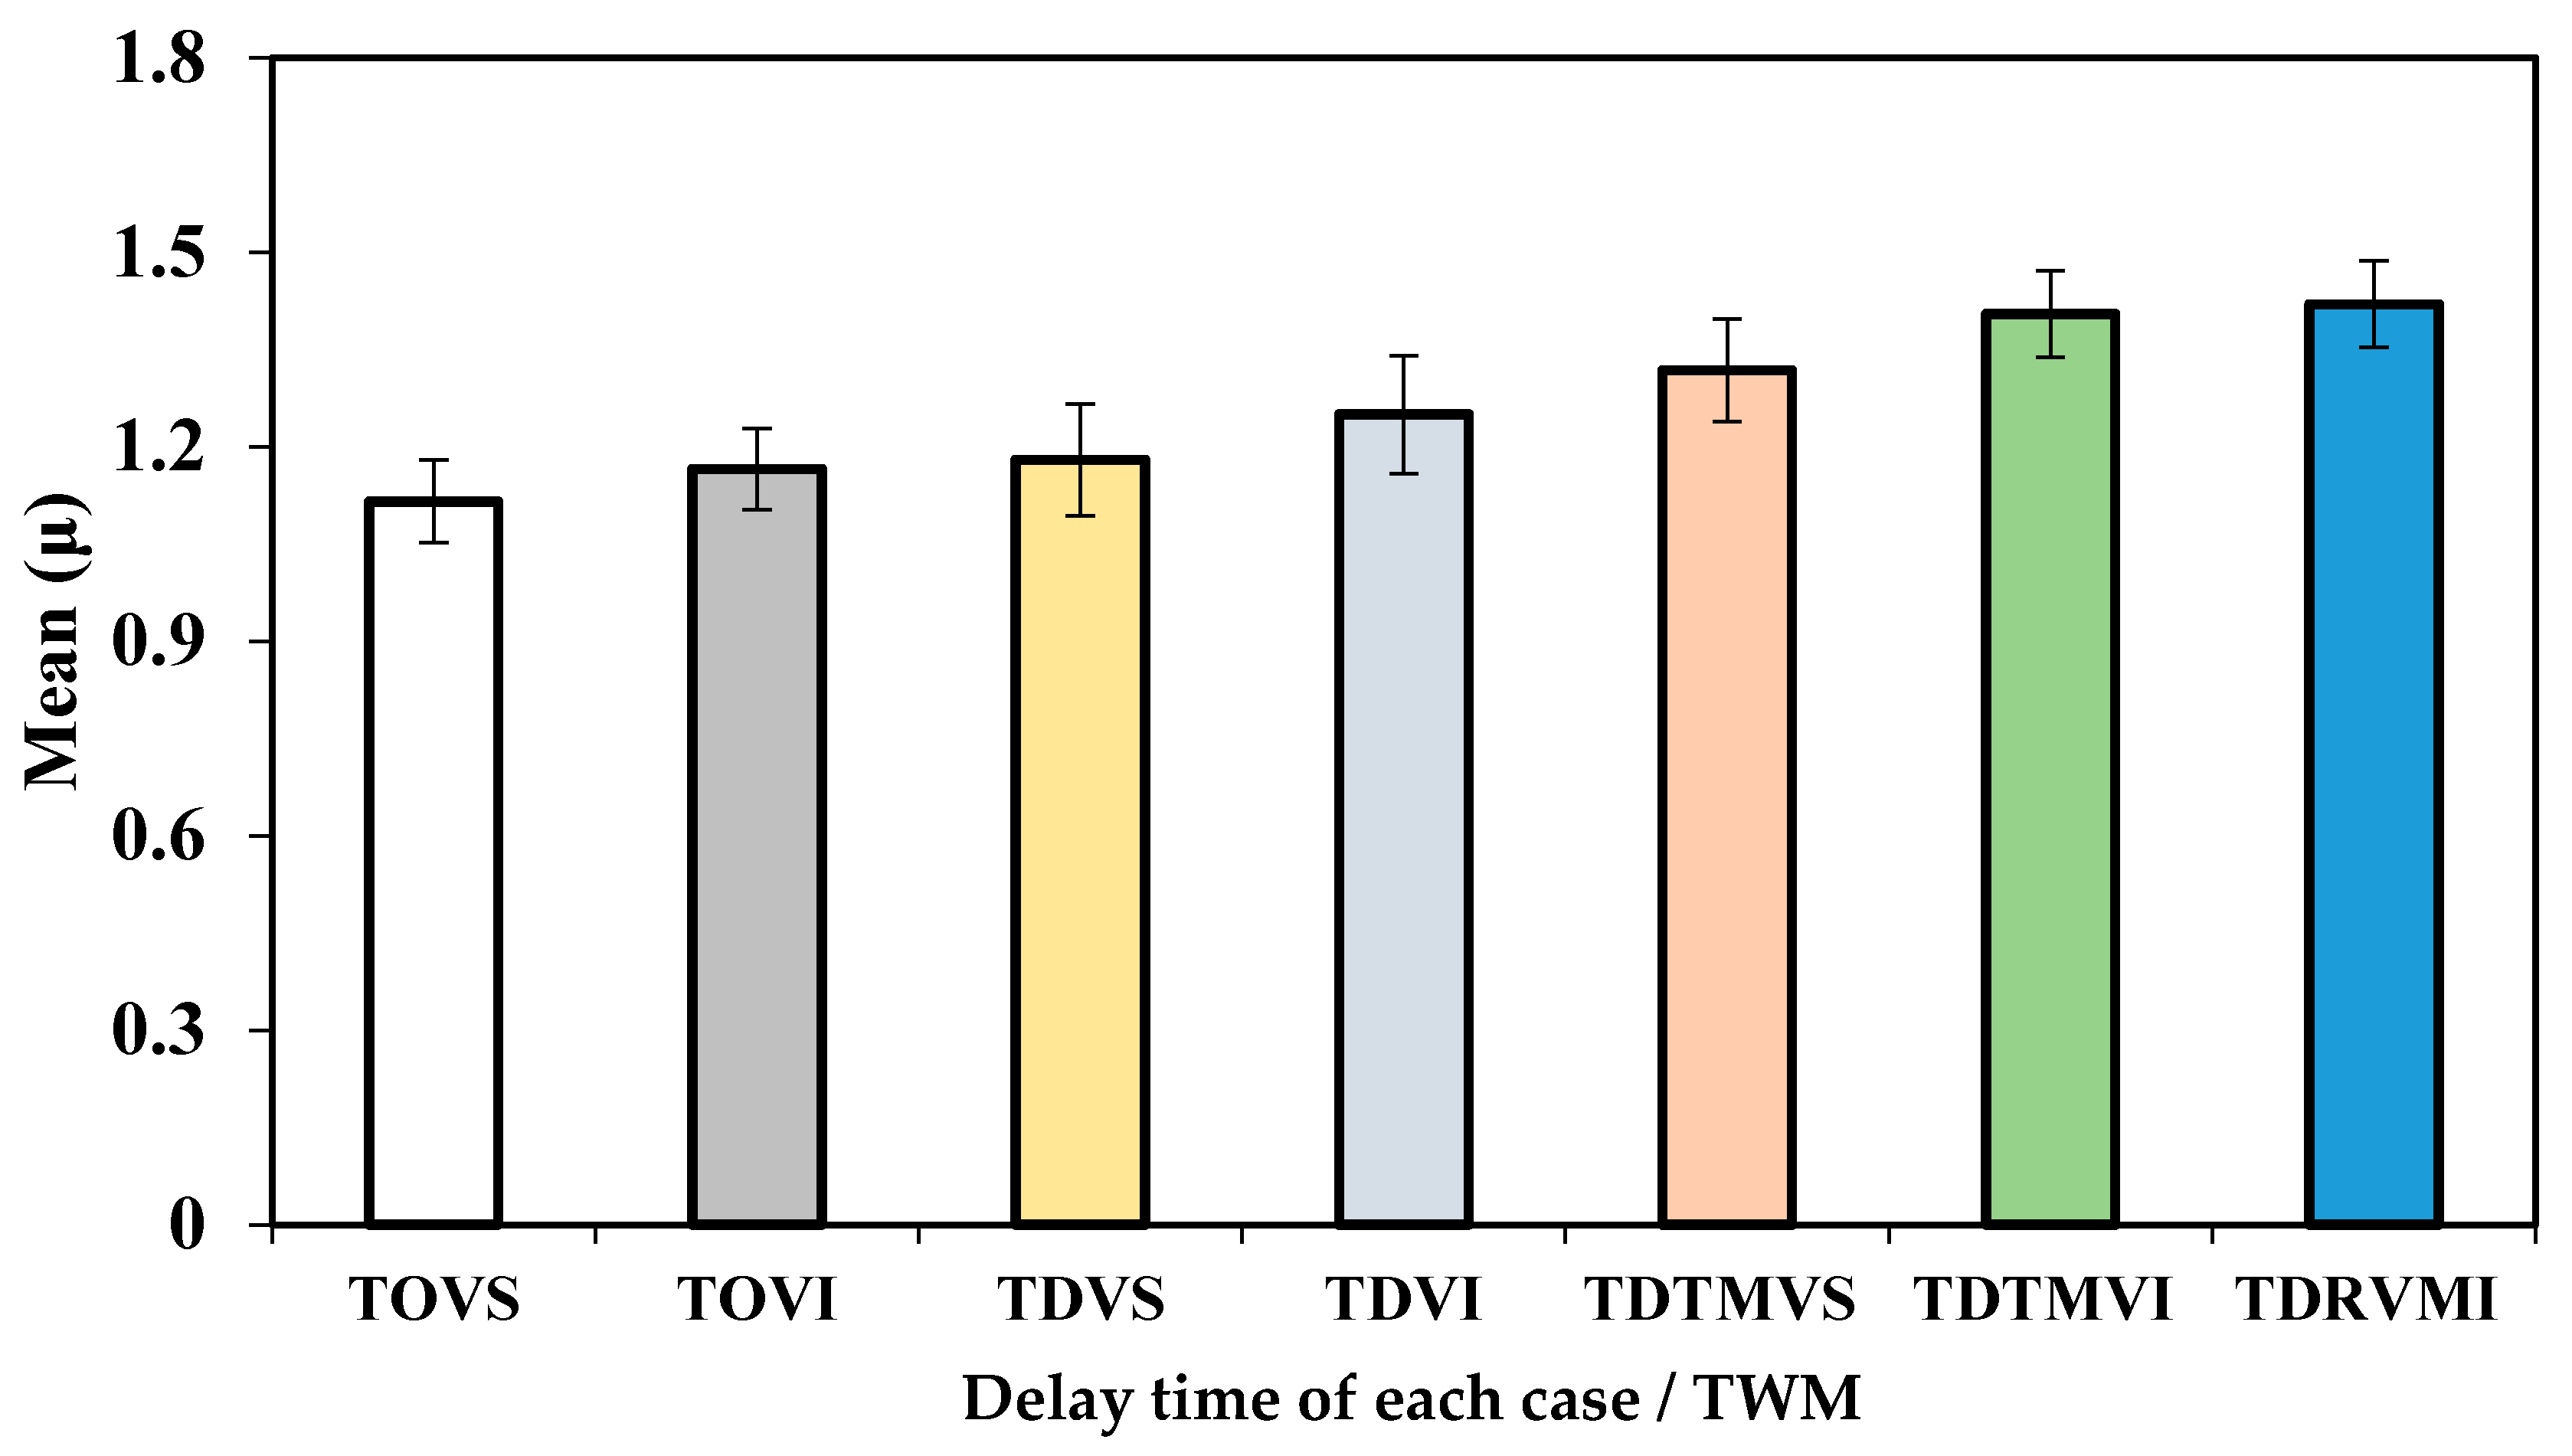
The average relative delay time and single standard error bars in either direction were represented against the relative time of delay for each case of SDS and HDS in Figure 12. The results indicated that the average relative delay time was observed to be maximum in the DTMVI model and minimum in the OVS model.

4. Discussion

4.1. Hydraulic Jump Formation and Energy Dissipation in SDS

In this paper, single and hybrid defense systems were tested in relation to the backwater rise, relative energy dissipation and relative delay time of flood. In SDS, vegetation of variable densities (B/d) were considered without any other model as many researchers did in the past [47,48]. Vegetation of different densities, i.e., dense (B/d = 0.25), intermediate (B/d = 1.09) and sparse vegetation (B/d = 2.13) was reported in the literature [48]. However, only intermediate and sparse vegetation was selected for the current research because the denser vegetation (B/d = 0.25) is rare and difficult to construct in the field. Various researchers performed experimental and numerical analysis of single defense system (dike or vegetation). The formation of undulated hydraulic jump behind the weir-like obstacles was studied experimentally and numerically to correlate the results obtained [39]. In the case of overtopping flow over weir embankment, different types of flow regimes were classified into four types [53]. Al-hashimi (2016) studied the energy dissipation and the flow characteristics over broad crested and single-step broad crested weirs and the maximum energy dissipation was 27.35% [41].
Previously, the reduction of energy was examined by single line vegetation model placed laterally across open channel flume under subcritical flow conditions and an experimental formula for the energy reduction efficiency of flood protection vegetation was proposed based on two variables i.e., Froude number and density of vegetation. In that study, it was found that a denser cylinder arrangement is more efficient in dissipating the flood energy [20]. Recently, Valyrakis (2015) carried out experimental studies to quantify the effect of increasing the density of bank vegetation on the flow velocity in the main channel and inside the vegetation [54]. Various researchers performed an experimental analysis of the formation of a hydraulic jump in an open channel flow [53,54,55]. The formation of an undulated hydraulic jump by using a sluice gate mounted in open channel flume was also reported in the literature [56,57,58]. The hydraulic jump was also classified as breaking and non-breaking undulated jump based on Froude number with aspect ratio [56] and ho/L [48], where b = width of the channel, y1 = depth of water at the toe of a hydraulic jump, ho = initial water depth and L = wavelength. In the current study, for OVS and OVI undulated hydraulic jump was observed only for the higher values of Fro (0.60, 0.63, and 0.65) and no jump was observed for lower values of Fro. The similar results were found in the literature [48]. The relative energy dissipation for a vegetation thickness of dn-180 No. cm calculated by Pasha and Tanaka (2017) was 26–28% and 29–32% in sparse and intermediate vegetation, respectively [48]. However, in the current research, the relative energy dissipated was in the range of 24–28% and 24–36% in sparse and intermediate vegetation respectively. The range of Fro used by Pasha and Tanaka (2017) was 0.57 to 0.73 [48] and in this study, it was 0.40 to 0.65. The back-water rise increases by increasing the density of vegetation [47]. The back-water rise was observed higher in OVI than OVS as shown in Figure 5a.
As discussed in Section 2.1.2, the overtopping flow due to high floods or embankment breaching is always in an oblique direction with respect to the flow in the main channel. However, the obstacles like roads, summer dikes, groins, or vegetation in the floodplains of a river can be encountered in various orientations. i.e., oblique or perpendicular and laid out by the floodplain management authorities. The difference between an oblique weir and plain weir is that in the case of the oblique weir, its crest makes an angle less than 90° with the direction of flow approaching the obstruction and in the perpendicular (plain) weirs the flow is at 90° to the weir or embankment crest [42]. Previously, some researchers used oblique weirs in their studies of open channel hydraulics [42,59,60] and other used plain or perpendicular weir/embankment [20,40,61,62]. Ali (2010) studied the vegetated weir-like structures oriented perpendicular to the flow direction to quantify the energy head loss [63]. However, it was reported in the previous studies that the flow always turns its direction when it reaches and passes the weir, towards an almost perpendicular orientation with respect to crest and the results are more deviating in the case of high obliqueness and when flow reaches an oblique weir (weir-like obstacles), it tends to change its direction normal to the weir crest [42]. For an oblique weir, the flow velocity is decomposed into two components, parallel and perpendicular to the flume axis as well as parallel and perpendicular to the weir axis. It is assumed by various authors that when the flow approaches the weir the crest parallel component does not change its magnitude, the accelerating force only acts on the velocity component perpendicular to the weir crest and the same holds for the deceleration process [43]. Therefore, to achieve the maximum possible energy dissipation similar to the results obtained in the current study, the arrangement in the real situation (in the field) the weir-like obstacles will have to be oblique at such an angle that its crest becomes perpendicular to the flow. When the flow is oblique, and weir will be oblique at the same angle the both will become perpendicular to each other, and energy dissipation will be similar to that obtained in the current research. However, for most commonly constructed obstructions, the overtopping flow is oblique to the obstruction. Therefore, the energy loss results reported in this paper will have to be reduced by a certain factor for real-life uses. These factors can be found by rigorous analysis taking into consideration the momentum and continuity equations or from previous publications [42,43,59,60]. However, the flow for a hybrid system investigated in this paper is highly complex. Therefore, some further experimental studies are needed to find a relationship between the energy loss by an obstruction across an oblique and perpendicular flow.

4.2. Hydraulic Jump Formation and Energy Dissipation in HDS

Recently, the hybrid defense system was introduced to minimize the damages of human lives and infrastructure due to extreme natural events [4], although this system was introduced in the response to the damages caused by tsunamis. However, Pasha and Tanaka (2017) investigated the energy loss through vegetation and a downstream undulated hydraulic jump for steady subcritical flow conditions with Froude number less than unity [48] and the Froude numbers of past tsunamis were estimated at 0.7–2.0 from field measurements and theory [64]. Moreover, at many locations, the tsunami’s flow was subcritical and had a Froude number between 0.7 and 1 [65]. The supercritical flow generated by tsunami converted to subcritical towards the inland side as Tanaka (2013) estimated the Froude number was 0.9–0.6 at 500 to 550 m distance from the shoreline [66] and a simulation study resulted that the Froude number decreased from 1.6 near the shoreline to 0.6 at 550 m from the shoreline [29]. Thus, it is equally important to determine the energy loss through single and hybrid defense system either the flow is subcritical or supercritical.
When flow passed through the hybrid defense system, its velocity decreased due to the contraction in the flow and a decelerating region is formed due to sudden expansion on the downstream side of the vegetation model resulted from the energy head loss in the expansion region [39]. Previously, the researchers reported the damage of houses and trees due to water overtopping the embankment [55]. Thus, a secondary structure on the downstream side of the embankment is required to reduce the flow velocity. The hydraulic jump is formed after placing any structure on the downstream of embankment [50]. In this regard, a secondary structure of different layers of single- and double-layer vegetation on the downstream of the embankment was tested with supercritical flow conditions [4]. The jump classified was jump A (formed on the bed of channel) and jump B (formed on the downstream slope of the embankment). According to that study for the initial values of Fro, Type A jump was formed on the bed of the channel in between embankment and vegetation while Type B jump was observed for the higher values of Fro. The maximum energy dissipated due to jump was 39%, and the maximum total energy reduction was in between 27% and 54% [4]. The hydraulic jump based on the values of Froude number was also classified by 2-D numerical analysis in the previous study [67].
In supercritical flow conditions, a higher Froude number increases the length of the hydraulic jump and the behavior of an undular hydraulic jump downstream of vegetation is investigated better against a low initial Froude number as reported by different researchers [66,68]. In the current study, the performance of single and hybrid defense systems was studied against the floodwater with subcritical flow conditions. For DVS and DVI, the hydraulic jump was classified against the initial values of Fro (0.40–0.57). However, for higher values (i.e., Fro = 0.60, 0.63 and 0.65) the jump formed was only on the downstream of vegetation and no jump was observed between dike and vegetation. The total relative energy reduction for DVS and DVI was between 28% and 57% and the average relative energy dissipation was 37% and 41% in DVS and DVI, respectively.
The hybrid defense systems are used to enhance coastal resilience in the protection from flooding [32]. Recently, hybrid defense system comprising dike, moat, and vegetation was tested by changing the layout of the components. The fluid force, tsunami arrival time, and overflow volume for different cases were measured. The hybrid defense system in the order of vegetation, a trapezoidal moat, and an embankment performed best in relation to the overflow volume, arrival time, and fluid force [32].
In the current paper, a hybrid system in the order of dike, moat (trapezoidal and rectangular) and vegetation of variable densities were tested with subcritical flow conditions. Backwater rise, energy dissipation due to hydraulic jump, and total relative energy dissipation were measured for each case to clarify the optimal hybrid defense system. To examine the effect of the shape of the moat, rectangular and trapezoidal shapes were used. For DTMVS, DTMVI, and DRMVI weak and undular jumps of Type IV, V, and VI were observed. The maximum backwater rise was observed for DTMVI case because the denser vegetation offered more resistance to flow resulting in higher backwater rise, as shown in Figure 5a. The energy loss due to a hydraulic jump was usually low [49] and the fraction of energy dissipated due to an undular jump is less than 5% [69]. In the current study, the amount of energy dissipation due to an undular jump on the downstream side of vegetation was well below 5% (ΔEj3 in Table 3). The maximum total relative energy dissipation and maximum average energy dissipation by hybrid defense system was 60% and 46% in DTMVI model. The arrival time was also highest in the DTMVI case. Contrarily, the hybrid defense system in the order of vegetation, moat and dike (where vegetation was in front) performed best in the previous study [32]. However, in this combination, in the case of a devastating flood event, the water may overtop the embankment and it will be difficult to connect this water to the river. Secondly, in that study, there was no space considered between the moat and embankment. In case of the breaching or erosion of embankment, the moat may be filled with erodible material and will not serve as a moat after its filling.
In the current research, a combination of dike, moat, and vegetation (where dike being on the riverside) was tested and in case of overtopping flow the water will come back to the moat which will further join the river by seepage action. Some water will be stored in the moat which will act as a flood harvesting structure. Moreover, the space between the downstream toe of dike and the start of moat (Ldv) was kept 15 cm to ensure the safety of the moat structure in case of breaching of dike. The rectangular moat was less effective than the trapezoidal moat based on the total energy loss and the arrival time. The sides of a rectangular hydraulic structure are also not stable. The tree breaking phenomena also occurred in some regions of Japan due to the large wave thrust of tsunami [29]. However, the floodwater has less capacity to break trees and other components of hybrid defense system [70]. Therefore, the defense system proposed in the current study will be more effective in the river environment. In the light of the results obtained in this study, a hybrid defense system in the order of dike, trapezoidal moat, and intermediate vegetation is highly recommended. The limitation of the proposed system is the space available to construct the defense system. In case of non-availability of the space, a single defense system will be preferred.

5. Conclusions

The flow structure with energy loss in a subcritical flow against the selected range of initial Froude numbers (Fro = 0.40–0.65) around single defense system (SDS) and the hybrid defense system (HDS) was investigated experimentally in a flume. The main conclusions of the study are as follows:
  • The backwater rise is maximum for OVI and DTMVI in SDS and HDS, respectively. The backwater rise is directly proportional to the density of vegetation and the value of initial Froude number. The water surface slope also increases by increasing vegetation density. The denser and wider the vegetation, the larger is the total energy dissipation in both SDS and HDS cases.
  • In SDS only undulated hydraulic jump was observed in both OVS and OVI, resulting in a significant energy loss. In HDS both weak and undulated hydraulic jumps were formed and in the case of DTMVI, the maximum energy loss due to hydraulic jump formed in between the dike and vegetation was 27% and 4% energy was dissipated due to the formation of jump on the downstream side of vegetation. The maximum total energy reduced in this case was 60% and the average energy reduced was 46%. Similarly, in the case of DRMVI, the maximum value of energy loss due to hydraulic jump between dike and vegetation was 22% and 3% energy was dissipated due to the formation of hydraulic jump on the downstream side of vegetation. The maximum total energy reduction and average energy reduction were 60% and 43.75%, respectively. In all these cases, the rate of energy reduction due to the hydraulic jump decreases by increasing Fro.
  • The performance of the DTMVI model to delay the arrival time of floodwater is the highest among all the models investigated in this paper
  • The “moat” can serve as floodwater harvesting and increasing the response time of flash floods generated from hill torrents. The shape of the moat affects the reduction of energy in general. However, its trapezoidal shape performs better than rectangular shape.
Under the above conclusions, a hybrid defense system is highly recommended where enough space is available across the river flow. The proposed system will be highly effective in various flood plains similar to that of Indus River.
Recommendations:
The response of the hybrid defense system with varying dimensions of dike and moat should be investigated in future and the true behavior of the hybrid defense system should be analyzed by considering the oblique flow towards the obstruction.

Author Contributions

Conceptualization, A.A. and A.R.G.; data curation, A.A.; investigation, A.A.; methodology, A.A.; supervision, A.R.G.; writing—original draft, A.A.; writing—review & editing, A.R.G.

Funding

This research received no external funding.

Acknowledgments

This study was funded by University of Engineering & Technology, Taxila, Pakistan. The authors acknowledge Ghufran Ahmed Pasha for his useful comments and great help during whole of this research.

Conflicts of Interest

The authors declare no conflict of interest.

Appendix A

Table A1. Pairwise comparison between different groups.
Group No.Pairsµ1–µ2Critical Value (LSD)Remarks
1TOVS/TWMTOVI/TWM0.0500.21No significant difference
2TOVS/TWMTDVS/TWM0.0600.21No significant difference
3TOVS/TWMTDVI/TWM0.1300.21No significant difference
4TOVS/TWMTDTMVS/TWM0.2020.21No significant difference
5TOVS/TWMTDTMVI/TWM0.2810.21significant difference
6TOVS/TWMTDRMVI/TWM0.2810.21significant difference
7TOVI/TWMTDVS/TWM0.0100.21No significant difference
8TOVI/TWMTDVI/TWM0.0800.21No significant difference
9TOVI/TWMTDTMVS/TWM0.1520.21No significant difference
10TOVI/TWMTDTMVI/TWM0.2390.21significant difference
11TOVI/TWMTDRMVI/TWM0.2310.21significant difference
12TDVS/TWMTDVI/TWM0.0690.21No significant difference
13TDVS/TWMTDTMVS/TWM0.1420.21No significant difference
14TDVS/TWMTDTMVI/TWM0.2280.21significant difference
15TDVS/TWMTDRMVI/TWM0.2200.21significant difference
16TDVI/TWMTDTMVS/TWM0.0720.21No significant difference
17TDVI/TWMTDTMVI/TWM0.1580.21No significant difference
18TDVI/TWMTDRMVI/TWM0.1500.21No significant difference
19TDTMVS/TWMTDTMVI/TWM0.0860.21No significant difference
20TDTMVS/TWMTDRMVI/TWM0.0780.21No significant difference
21TDTMVI/TWMTDRMVI/TWM0.00790.21No significant difference

References

  1. Smith, K. Environmental Hazards: Assessing Risk and Reducing Disaster; Routledge: New York, NY, USA, 2003. [Google Scholar]
  2. Kellens, W.; Terpstra, T.; De Maeyer, P. Perception and communication of flood risks: A systematic review of empirical research. Risk Anal. 2013, 33, 24–49. [Google Scholar] [CrossRef] [PubMed]
  3. Buijs, J.; Boelens, L.; Bormann, H.; Restemeyer, B.; Terpstra, T.; van der Voorn, T. Adaptive planning for flood resilient areas: Dealing with complexity in decision-making about multilayered flood risk management. In Proceedings of the 16th Meeting: Adaptive Planning for Spatial Transformation, Groningen, The Netherlands, 23–25 May 2018. [Google Scholar]
  4. Ali Hasan Muhammad, R.; Tanaka, N. Energy Reduction of a Tsunami Current through a Hybrid Defense System Comprising a Sea Embankment Followed by a Coastal Forest. Geosciences 2019, 9, 247. [Google Scholar] [CrossRef]
  5. Suppasri, A.; Shuto, N.; Imamura, F.; Koshimura, S.; Mas, E.; Yalciner, A.C. Lessons learned from the 2011 Great East Japan tsunami: Performance of tsunami countermeasures, coastal buildings, and tsunami evacuation in Japan. Pure Appl. Geophys. 2013, 170, 993–1018. [Google Scholar] [CrossRef]
  6. Nandasena, N.A.K.; Sasaki, Y.; Tanaka, N. Modeling field observations of the 2011 Great East Japan tsunami: Efficacy of artificial and natural structures on tsunami mitigation. Coast. Eng. 2012, 67, 1–13. [Google Scholar] [CrossRef]
  7. Pakoksung, K.; Suppasri, A.; Imamura, F. Systematic Evaluation of Different Infrastructure Systems for Tsunami Defense in Sendai City. Geosciences 2018, 8, 173. [Google Scholar] [CrossRef]
  8. Abbas, A.; Amjath-Babu, T.S.; Kächele, H.; Müller, K. Non-structural flood risk mitigation under developing country conditions: An analysis on the determinants of willingness to pay for flood insurance in rural Pakistan. Nat. Hazards 2015, 75, 2119–2135. [Google Scholar] [CrossRef]
  9. Houze, R.A., Jr.; McMurdie, L.A.; Rasmussen, K.L.; Kumar, A.; Chaplin, M.M. Multiscale aspects of the storm producing the June 2013 flooding in Uttarakhand, India. Mon. Weather Rev. 2017, 145, 4447–4466. [Google Scholar] [CrossRef]
  10. Van Oldenborgh, G.J.; Otto, F.E.L.; Haustein, K.; AchutaRao, K. The heavy precipitation event of December 2015 in Chennai, India. Bull. Am. Meteorol. Soc. 2016, 97, S87–S91. [Google Scholar] [CrossRef]
  11. Philip, S.; Sparrow, S.; Kew, S.; Van Der Weil, K.; Wanders, N.; Singh, R.; Hassan, A.; Mohammed, K.; Javid, H.; Haustein, K.; et al. Attributing the 2017 Bangladesh floods from meteorological and hydrological perspectives. Hydrol. Earth Syst. Sci. Discuss. 2019, 23, 1409–1429. [Google Scholar] [CrossRef] [Green Version]
  12. Marfai, M.A.; Hizbaron, D.R. Community’s adaptive capacity due to coastal flooding in Semarang coastal city, Indonesia. Int. J. Ser. Geogr. Ann. Univ. Oradea 2011, 21, 2011. [Google Scholar]
  13. Marfai, M.A.; King, L. Potential vulnerability implications of coastal inundation due to sea level rise for the coastal zone of Semarang city, Indonesia. Environ. Geol. 2008, 54, 1235–1245. [Google Scholar] [CrossRef]
  14. Zhao, G.; Ren, Y.; Visser, P.J.; Uijttewaal, W.S.J. Flow Process of the Embankment Breaching. In Proceedings of the 2013 IAHR World Congress, Chengdu, China, 8–13 September 2013. [Google Scholar]
  15. Evangelista, S. Experiments and numerical simulations of dike erosion due to a wave impact. Water 2015, 7, 5831–5848. [Google Scholar] [CrossRef]
  16. Greco, M.; Iervolino, M.; Leopardi, A.; Vacca, A. A two-phase model for fast geomorphic shallow flows. Int. J. Sediment Res. 2012, 27, 409–425. [Google Scholar] [CrossRef]
  17. Dewals, B.; Rulot, F.; Erpicum, S.; Archambeau, P.; Pirotto, M. Advanced Topics in Sediment Transport Modelling: Non-alluvial Beds and Hyperconcentrated Flows. In Sediment Transport; InTech: London, UK, 2012. [Google Scholar]
  18. Tanaka, N. Vegetation bioshields for tsunami mitigation: Review of effectiveness, limitations, construction, and sustainable management. Landsc. Ecol. Eng. 2009, 5, 71–79. [Google Scholar] [CrossRef]
  19. Peruzzo, P.; de Serio, F.; Defina, A.; Mossa, M. Wave height attenuation and flow resistance due to emergent or near-emergent vegetation. Water 2018, 10, 402. [Google Scholar] [CrossRef]
  20. Sanjou, M.; Okamoto, T.; Nezu, I. Experimental study on fluid energy reduction through a flood protection forest. J. Flood Risk Manag. 2018, 11, e12339. [Google Scholar] [CrossRef] [Green Version]
  21. Anjum, N.; Ghani, U.; Pasha, G.A.; Latif, A.; Sultan, T.; Ali, S. To investigate the flow structure of discontinuous vegetation patches of two vertically different layers in an open channel. Water 2018, 10, 75. [Google Scholar] [CrossRef]
  22. Mulahasan, S.; Stoesser, T. Flow resistance of in-line vegetation in open channel flow. Int. J. River Basin Manag. 2017, 15, 329–334. [Google Scholar] [CrossRef]
  23. Thuy, N.B.; Tanimoto, K.; Tanaka, N. Flow and potential force due to runup tsunami around a coastal forest with a gap–experiments and numerical simulations. Sci. Tsunami Hazards 2010, 29, 43–69. [Google Scholar]
  24. Liu, J.; Zang, C.; Tian, S.; Liu, J.; Yang, H.; Jia, S.; You, L.; Liu, B.; Zhang, M. Water conservancy projects in China: Achievements, challenges and way forward. Glob. Environ. Chang. 2013, 23, 633–643. [Google Scholar] [CrossRef] [Green Version]
  25. Dalimunthe, S.A. Who manages space? Eco-DRR and the local community. Sustainability 2018, 10, 1705. [Google Scholar] [CrossRef]
  26. Västilä, K.; Järvelä, J.; Aberle, J. Characteristic reference areas for estimating flow resistance of natural foliated vegetation. J. Hydrol. 2013, 492, 49–60. [Google Scholar] [CrossRef]
  27. McDonald, T.; Gann, G.; Jonson, J.; Dixon, K. International Standards for the Practice of Ecological Restoration—Including Principles and Key Concepts; Society for Ecological Restoration: Washington, DC, USA, 2016. [Google Scholar]
  28. Pasha, G.A.; Tanaka, N.; Yagisawa, J.; Achmad, F.N. Tsunami mitigation by combination of coastal vegetation and a backward-facing step. Coast. Eng. J. 2018, 60, 1–22. [Google Scholar] [CrossRef]
  29. Tanaka, N.; Yasuda, S.; Iimura, K.; Yagisawa, J. Combined effects of coastal forest and sea embankment on reducing the washout region of houses in the Great East Japan tsunami. J. Hydro-Environ. Res. 2014, 8, 270–280. [Google Scholar] [CrossRef]
  30. Fadly, U.; Murakami, K. Study on reducing tsunami inundation energy by the modification of topography based on local wisdom. J. Jpn. Soc. Civ. Eng. Ser. B3 2012, 68, I_66–I_71. [Google Scholar] [CrossRef]
  31. Tanaka, N.; Igarashi, Y. Multiple defense for tsunami inundation by two embankment system and prevention of oscillation by trees on embankment. In Proceedings of the 20th Congress of IAHR APD Congress, Colombo, Sri Lanka, 28–31 August 2016; pp. 1–8. [Google Scholar]
  32. Zaha, T.; Tanaka, N.; Kimiwada, Y. Flume experiments on optimal arrangement of hybrid defense system comprising an embankment, moat, and emergent vegetation to mitigate inundating tsunami current. Ocean Eng. 2019, 173, 45–57. [Google Scholar] [CrossRef]
  33. Aslam, M. Flood Management Current State, Challenges and Prospects in Pakistan: A Review. Mehran Univ. Res. J. Eng. Technol. 2018, 37, 297–314. [Google Scholar] [CrossRef] [Green Version]
  34. Tanvir, M.A.; Siddiqui, M.T.; Shah, A.H. Growth and price trend of Eucalyptus camaldulensis in Central Punjab. Int. J. Agric. Biol. 2002, 4, 344–346. [Google Scholar]
  35. Huai, W.X.; Zeng, Y.H.; Xu, Z.G.; Yang, Z.H. Three-layer model for vertical velocity distribution in open channel flow with submerged rigid vegetation. Adv. Water Resour. 2009, 32, 487–492. [Google Scholar] [CrossRef]
  36. Huai, W.; Wang, W.; Hu, Y.; Zeng, Y.; Yang, Z. Analytical model of the mean velocity distribution in an open channel with double-layered rigid vegetation. Adv. Water Resour. 2014, 69, 106–113. [Google Scholar] [CrossRef]
  37. Pasha, G.A.; Tanaka, N. Critical Resistance Affecting Sub- to Super-Critical Transition Flow by Vegetation. J. Earthq. Tsunami 2019, 13, 1950004. [Google Scholar] [CrossRef]
  38. Pavlin, Ž.; Kuspilić, N. Reference water levels for the design of dykes and earthfill dams. Građevinar 2018, 70, 225–233. [Google Scholar]
  39. Ali, S. Flow over Weir-Like Obstacles; TU Delft: Delft, The Netherlands, 2013. [Google Scholar]
  40. Mahtabi, G.; Arvanaghi, H. Experimental and numerical analysis of flow over a rectangular full-width sharp-crested weir. Water Sci. Eng. 2018, 11, 75–80. [Google Scholar] [CrossRef]
  41. Al-hashimi, S.A.M.; Madhloom, H.M.; Nahi, T.N.; Al-ansari, N. Channel Slope Effect on Energy Dissipation of Flow over Broad Crested Weirs. Engineering 2016, 8, 837–851. [Google Scholar] [CrossRef] [Green Version]
  42. Tuyen, N.B. Influences of the oblique Obstacles to the flow. In Proceedings of the Japan-Vietnam Estuary Workshop, Hochiminh, Vitenam, 20–24 August 2007. [Google Scholar]
  43. kabiri, S.A.R. Analytical Approach for Flow over an Oblique Weir. Sci. Iran. 2010, 17, 107–117. [Google Scholar]
  44. Kabiri-Samani, A.; Ansari, A.; Borghei, S.M. Hydraulic behaviour of flow over an oblique weir. J. Hydraul. Res. 2010, 48, 669–673. [Google Scholar] [CrossRef]
  45. Tanaka, N.; Yagisawa, J. Flow structures and sedimentation characteristics around clump-type vegetation. J. Hydro-Environ. Res. 2010, 4, 15–25. [Google Scholar] [CrossRef]
  46. Castro-Orgaz, O.; Chanson, H. Minimum specific energy and transcritical flow in unsteady open-channel flow. J. Irrig. Drain. Eng. 2015, 142, 04015030. [Google Scholar] [CrossRef]
  47. Iimura, K.; Tanaka, N. Numerical simulation estimating effects of tree density distribution in coastal forest on tsunami mitigation. Ocean Eng. 2012, 54, 223–232. [Google Scholar] [CrossRef]
  48. Pasha, G.A.; Tanaka, N. Undular hydraulic jump formation and energy loss in a flow through emergent vegetation of varying thickness and density. Ocean Eng. 2017, 141, 308–325. [Google Scholar] [CrossRef]
  49. Chow, V.T. Open-Channel Hydraulics; McGraw-Hill: New York, NY, USA, 1959. [Google Scholar]
  50. Hager, W.H. B-jump in sloping channel. J. Hydraul. Res. 1988, 26, 539–558. [Google Scholar] [CrossRef]
  51. Jesudhas, V.; Murzyn, F.; Balachandar, R. IDDES Evaluation of Oscillating Hydraulic Jumps. E3S Web Conf. 2018, 40, 05067. [Google Scholar] [CrossRef]
  52. Lee, S.; Lee, D.K. What is the proper way to apply the multiple comparison test? Korean J. Anesthesiol. 2018, 71, 353. [Google Scholar] [CrossRef] [PubMed]
  53. Fritz, H.M.; Hager, W.H. Hydraulics of Embankment Weirs. J. Hydraul. Eng. 1998, 124, 963–971. [Google Scholar] [CrossRef]
  54. Valyrakis, M.; Liu, D.; Mcgann, N.; Turker, U.; Yagci, O. Characterrising the effect of increasing river bank vegetation on the flow field across the channel. In Proceedings of the 36th IAHR World Congress, The Hague, The Netherland, 28 June–3 July 2015. [Google Scholar]
  55. Darcy, H.P.G.; Bazin, H. Recherches Hydrauliques; Imprimerie Impériales: Paris, France, 1865. [Google Scholar]
  56. Montes, J.S. A study of the undular jump profile. In Proceedings of the 9th Australasian Fluid Mechanics Conference AFMC, Auckland, New Zealand, 8–12 December 1986; pp. 148–151. [Google Scholar]
  57. Ryabenko, A.A. Conditions favorable to the existence of an undulating jump. Hydrotech. Constr. 1990, 24, 762–770. [Google Scholar] [CrossRef]
  58. Chanson, H. Current knowledge in hydraulic jumps and related phenomena. A survey of experimental results. Eur. J. Mech. 2009, 28, 191–210. [Google Scholar] [CrossRef] [Green Version]
  59. Aichel, O.G. Abflusszahlen fuer schiefe Wehre. Discharge ratios for oblique weirs. Z. VDI 1953, 95, 26–27. [Google Scholar]
  60. De Vries, M. Scheef Aangestrooomde Overlaten; WL-Delft Hydraul: Delft, The Netherlands, 1959. [Google Scholar]
  61. Keramaris, E.; Pechlivanidis, G.; Kasiteropoulou, D.; Michalolias, N.; Liakopoulos, A. Experimental and Numerical Study of Turbulent Flow in Open Channels with Impermeable and Porous Bed. Procedia Eng. 2016, 162, 381–387. [Google Scholar] [CrossRef] [Green Version]
  62. Wols, B.A. Undular hydraulic jumps. Master’s Thesis, Delft University of Technology, Delft, The Netherland, 2005. [Google Scholar]
  63. Ali, S.; Uijttewaal, W.S.J. The form drag due to vegetated weir-like obstacles interpreted as expansion losses. In Proceedings of the Water engineering for sustainable environment: 33rd IAHR congress, Vancouver, BC, Canada, 9–14 August 2009. [Google Scholar]
  64. Kawata, Y.; Benson, B.C.; Borrero, J.C.; Borrero, J.L.; Davies, H.L.; de Lange, W.P.; Imamura, F.; Letz, H.; Nott, J.; Synolakis, C.E. Tsunami in Papua New Guinea was as intense as first thought. Eos Trans. Am. Geophys. Union 1999, 80, 101–105. [Google Scholar] [CrossRef]
  65. Spiske, M.; Weiss, R.; Bahlburg, H.; Roskosch, J.; Amijaya, H. The TsuSedMod inversion model applied to the deposits of the 2004 Sumatra and 2006 Java tsunami and implications for estimating flow parameters of palaeo-tsunami. Sediment. Geol. 2010, 224, 29–37. [Google Scholar] [CrossRef]
  66. Tanaka, N.; Yagisawa, J.; Yasuda, S. Breaking pattern and critical breaking condition of Japanese pine trees on coastal sand dunes in huge tsunami caused by Great East Japan Earthquake. Nat. Hazards 2013, 65, 423–442. [Google Scholar] [CrossRef]
  67. Luoching, R. Hydraulic jump- The state of the art hydrodynamic characteristics of fixed and moveable beds. Int. J. Appl. Eng. Technol. 2015, 5, 1–11. [Google Scholar]
  68. Pasha, G.A.; Tanaka, N. Effectiveness of Finite Length Inland Forest in Trapping Tsunami-Borne Wood Debris. J. Earthq. Tsunami 2016, 10, 1650008. [Google Scholar] [CrossRef]
  69. Streeter, V.L.; Wylie, E.B. Fluid Mechanics; McGraw-Hill: New York, NY, USA, 1979. [Google Scholar]
  70. Smith, B. The Role of Vegetation in Catastrophic Floods: A Spatial Analysis. Bachelor’s Thesis, University of Wollongong, Wollongong, Australia, 2013. [Google Scholar]
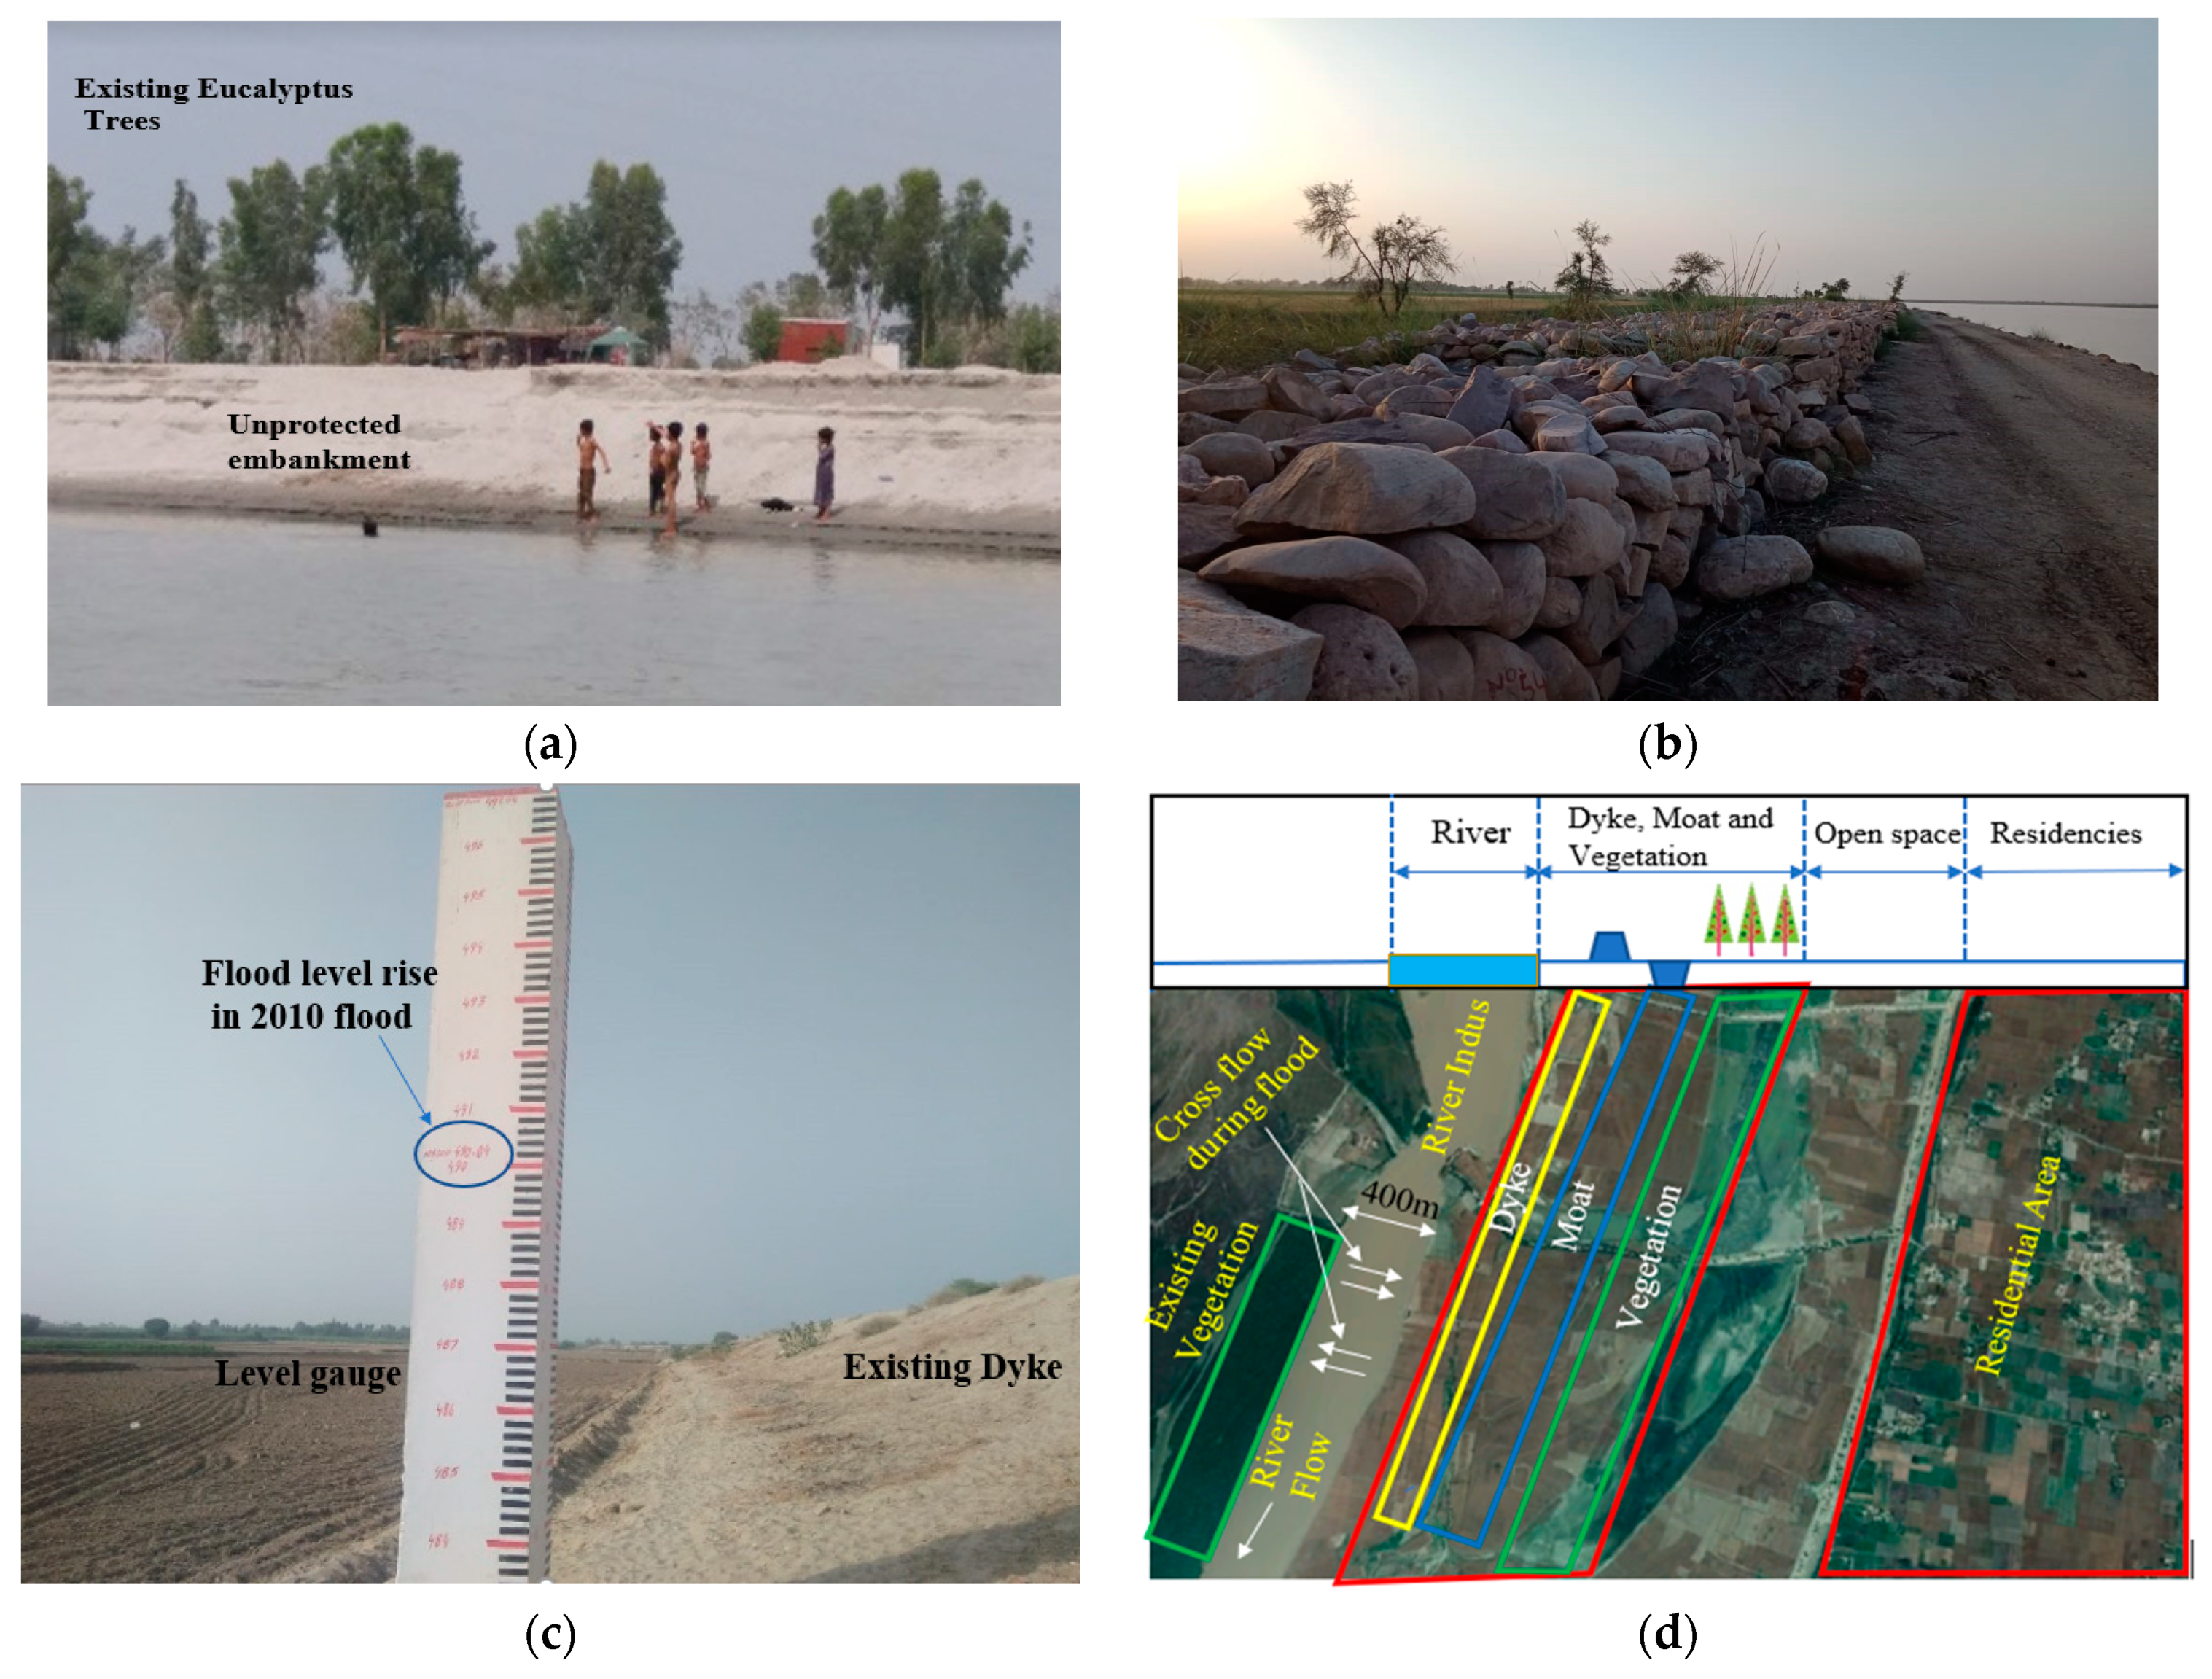
Figure 1. Pictorial views of the floodplain of Indus River near Taunsa Barrage. (a) Unprotected and scoured embankment. (b) Stone embankment protection. (c) Existing dike and level gauge. (d) Imagery of proposed hybrid defense system (HDS) at River Indus near Taunsa Barrage.
Water 11 01971 g001
Figure 2. Experimental setup: (a) Schematic of the channel with models, (b) experimental setup of the hybrid defense system in the laboratory, (c) vegetation arrangement details of staggered strips (SS).
Water 11 01971 g002
Figure 3. Schematic diagram of experimental model.
Water 11 01971 g003
Figure 4. Experimental model of the hybrid defense system (HDS).
Water 11 01971 g004
Figure 5. (a) Backwater rise (Δh) of single defense system (SDS) and HDS, (b) relative backwater rise (Δh/ho) of SDS and HDS.
Water 11 01971 g005
Figure 6. Hydraulic jump and water surface classifications: (OV model: (a) Jump on the downstream of vegetation (Type I)), (DV model: (b) Jump in Section 2 only (Type II) (c) Jump in Section 3 only (Type III)), (DVM model: (d) Jump in Section 2 only (Type IV) (e) Jump in both Section 2 and Section 3 (Type V)) (f) Jump in Section 3 only (Type VI).
Water 11 01971 g006aWater 11 01971 g006b
Figure 7. Experimental photographs: (a) only vegetation (OV) model (b) dike and vegetation (DV) model and (c) dike, moat and vegetation (DMV) model, (d) crump weir model for delay time analysis.
Water 11 01971 g007
Figure 8. Experimental observations of water surface profiles (a) dike, trapezoidal moat and sparse vegetation (DTMVS), (b) dike, trapezoidal moat, and intermediate vegetation (DTMVI) and (c) dike, rectangular moat and intermediate vegetation (DRMVI).
Water 11 01971 g008aWater 11 01971 g008b
Figure 9. Relative length of hydraulic jump in HDS.
Water 11 01971 g009
Figure 10. Percentage energy loss for different obstruction types and 95% confidence bands for: (a) sparse vegetation (OVS) and intermediate vegetation (OVI), (b) DVS and DVI and (c) DTMVS, DTMVI and DRMVI.
Water 11 01971 g010
Figure 11. Experimental and computed results comparison: (a) OVS and OVI, (b) DVS and DVI, and (c) DTMVS, DTMVI, and DRMVI.
Water 11 01971 g011aWater 11 01971 g011b
Figure 12. Comparison of relative delay time of SDS and HDS with standard error bars.
Water 11 01971 g012
Table 1. Experimental conditions of a hybrid defense system.
Case IDInitial Froude No. (Fro)DikeMoatVegetation Density (B/d)D (cm)Wv (cm)* Vegetation Thickness “dn” (No.cm)Vegetation Type
OVS0.40, 0.44, 0.50, 0.57, 0.60, 0.63, 0.65No dikeNo moat2.131.8818.36181.67Sparse
OVI0.40, 0.44, 0.50, 0.57, 0.60, 0.63, 0.65No dikeNo moat1.091.2548.17198.31Intermediate
DVS0.40, 0.44, 0.50, 0.57, 0.60, 0.63, 0.65 Water 11 01971 i001No moat2.131.8818.36181.67Sparse
DVI0.40, 0.44, 0.50, 0.57, 0.60, 0.63, 0.65 Water 11 01971 i002No moat1.091.2548.17198.31Intermediate
DTMVS0.40, 0.44, 0.50, 0.57, 0.60, 0.63, 0.65 Water 11 01971 i003 Water 11 01971 i0042.131.8818.36181.67Sparse
DTMVI0.40, 0.44, 0.50, 0.57, 0.60, 0.63, 0.65 Water 11 01971 i005 Water 11 01971 i0061.091.2548.17198.31Intermediate
DRMVI0.40, 0.44, 0.50, 0.57, 0.60, 0.63, 0.65 Water 11 01971 i007 Water 11 01971 i0081.091.2548.17198.31Intermediate
* The initial value of “dn” was taken as 180 No.cm. After inserting metal rods on wooden bed to make vegetation patch, the value of “dn” was again calculated to be 181.67 No.cm for sparse vegetation and 198.31 No.cm for intermediate vegetation.
Table 2. Hydraulic jump classification of SDS and HDS.
Classification of Hydraulic Jump
Froude Numbers
Case ID0.400.440.500.570.600.630.65
OVSNJNJNJNJNJUJ, Type IUJ, Type I
OVINJNJNJNJUJ, Type IUJ, Type IUJ, Type I
DVSWJ, Type IIWJ, Type IIUJ, Type IIUJ, Type IIIUJ, Type IIIUJ, Type IIIUJ, Type III
DVIWJ, Type IIWJ, Type IIUJ, Type IIUJ, Type IIUJ, Type IIIUJ, Type IIIUJ, Type III
DTMVSUJ, Type IVUJ, Type IVNJNJNJUJ, Type VIUJ, Type VI
DTMVIWJ, Type IVUJ, Type IVUJ, Type IVUJ, Type VUJ, Type VIUJ, Type VIUJ, Type VI
DRMVIWJ, Type IVUJ, Type IVUJ, Type IVUJ, Type VUJ, Type VIUJ, Type VIUJ, Type VI
Note: NJ = no jump, UJ = undular jump and WJ = week jump.
Table 3. Summary of energy dissipation of HDS.
Case IDEnergy Loss Due to Hydraulic JumpAverage Energy Loss (%)Maximum Energy Loss (%)
ΔEj2 (%)ΔEj3 (%)
DTMVS242.8438.5253.26
DTMVI2744660
DRMVI22343.7560