Abstract
The growth of Eucalyptus pellita in forestry plantations requires attention to water requirements, especially in the initial growth phase from seedling to field-ready plant. In this study, actual evapotranspiration (ETa), crop coefficient (Kc), and the irrigation requirement of E. pellita were assessed during the nursery growth phase (day 40–142). The experimental set-up included lysimeters with different treatments in terms of plants, drainage, and soil conditions. Plant growth and water balance were monitored during June September 2018 in an open nursery area in Riau, Indonesia. ETa was determined by the water balance lysimeter method and potential (reference) evapotranspiration (ETo) was extracted based on the Penman-Monteith method (FAO/56). The results showed that the average Kc value for E. pellita at age 40–142 days is 0.79, which exceeds that reported for E. grandis. The recommended irrigation requirement varies depending on precipitation, from 70 mL/plant/day with no rainfall to zero at precipitation of >30 mm/day. This is the first study to assess water use in E. pellita growing in pots during the nursery phase, which provides guidance on irrigation requirements during their initial growth phase.
1. Introduction
Eucalyptus is a main forest crop in tropical and subtropical regions. In Southeast Asia, Eucalyptus is cultivated in, e.g., Papua New Guinea and Indonesia [1]. In recent decades, forestry plantation in Indonesia has become a large-scale industry producing timber and wood pulp on more than 5 million hectares. On mineral soils, these plantations are based on Eucalyptus pellita, as a source of pulp and paper products [2,3]. Eucalyptus pellita grows rapidly, with a straight stem, and has high tolerance to various soil types and high resistance to pests and diseases [4].
Despite its commercial importance, the water requirement for irrigating E. pellita is poorly known [5]. In Indonesia, the species typically faces water stress due to too much water (during rainy season, October–December, with 250 mm rainfall per month on average) or too little (during rain-free periods of up to several months). Eucalyptus pellita is susceptible to soil moisture stress due to its rapid growth, driven by high photosynthetic and transpiration rates [6]. Low soil water availability restricts plant growth, especially in seasonally dry regions.
Crop coefficient (Kc), defined as the ratio of actual to potential evapotranspiration, plays an essential role in various agricultural practices and has been widely used to estimate actual crop evapotranspiration (ETa) in irrigation scheduling. The United Nations Food and Agriculture Organization (FAO) provides crop coefficient values for a large number of crops under different climate conditions, for use in places where local data are not available [7]. However, empirical crop coefficients have been criticized because their values may vary according to weather conditions and the crop stage in which they are derived. As an alternative, weighing lysimeters have been used to determine ETa by partitioning a simple water balance equation [8] that presents a procedure for evaluating the accuracy of ETa values obtained from measurements using large precision lysimeters. For measuring potential (reference) evapotranspiration (ETo), several methods are available, e.g., Penman-Monteith, Modified Penman, Makkink, Hargreaves, and evaporation pan.
In this study, the water needs of E. pellita were assessed in a controlled irrigation and growth experiment. The aim was to address possible errors in supplementary irrigation estimates for E. pellita grown in tropical environments, which could cause an increase in production costs and low crop yield. Our first objective was to determine ETa, Kc, and the irrigation requirement of E. pellita grown in a tropical climate (Indonesia). The second objective was to analyze the relationship between evapotranspiration and other climate factors (e.g., precipitation, wind speed, humidity, solar radiation, etc.). Evaporation and percolation/leaching in the field were also compared. The overall intention was to provide guidance on production of E. pellita in nursery gardens.
2. Material and Method
2.1. Experimental Site
An irrigation and E. pellita growth experiment was carried out from June 2018 to September 2018 in an open nursery belonging to the Sinarmas Forestry plantation company, located in Perawang district, Riau province, Indonesia (0°41′39′’ N; 101°36′21′’ E; 16 m asl) (Figure 1). Mean annual rainfall in the area is 2244 mm and there is a dry season that generally starts in June and ends in September. Mean monthly rainfall is around 130 mm in the dry season and 220 mm in the rainy season. The age of E. pellita plants during the experiment ranged from 42 days to 142 days. An automatic weather system (AWS) was installed about 20 m from the study site, to record precipitation, temperature, relative humidity, and net radiation.
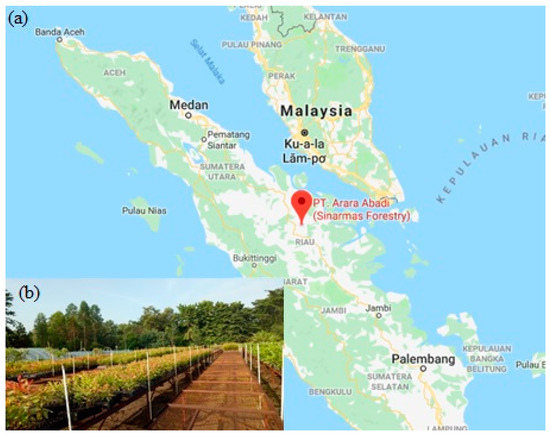
Figure 1.
Location of the study site in Riau Province, Indonesia (a), and Eucalyptus pellita plants growing in open nursery beds (b).
2.2. Experimental Design
The experimental set-up involved recording the water balance of individual plants growing in sets of 32 tubes of growing medium arranged in pottery pallets (Figure 2). Four different treatments were applied:
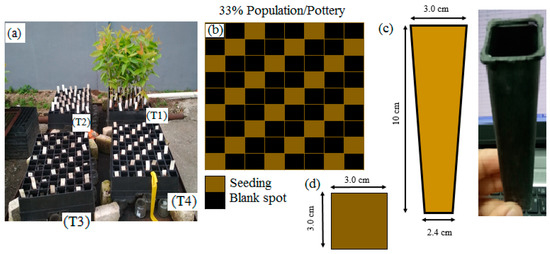
Figure 2.
(a) Pottery pallets containing tubes of Eucalyptus pellita plants in treatments T1-T4, (b) layout of seedlings and blanks in treatment T1, and (c,d) side and top view of a tube and its dimensions.
- Treatment 1 (T1): Plants + watering + free drainage
- Treatment 2 (T2): No plants + watering + free drainage
- Treatment 3 (T3): No plants and no watering + free drainage
- Treatment 4 (T4): No plants + watering and no drainage (tube bottom sealed).
Each tube was irrigated (50 mL) on two occasions per day: in the morning (08.30 h) and afternoon (14.00 h). Each treatment consists of 32 tubes that considered as repetition. The outflow from each tube was collected and measured, to monitor drainage (Figure 3a). The seedling density in the pallets and tube dimensions followed the forestry company standard (Figure 2b,d). Every plant was labeled in order to avoid confusion during the daily assessment (Figure 2a).
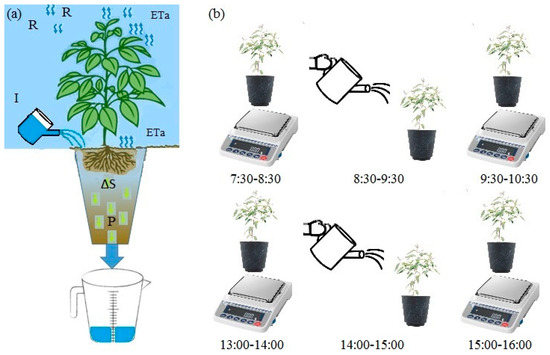
Figure 3.
(a) Water balance components in lysimeter measurements of actual evapotranspiration (ETa), where R is rainfall, P is percolation, and I is irrigation, and (b) daily measurement and irrigation schedule in the experiment.
The tubes, with dimensions of 3 cm by 3 cm × 10 cm height (Figure 2c), were filled with organic material (coco-peat 67%, carbonized rice husk 33%) by the machine. Data on daily air temperature, wind speed, solar radiation, and relative humidity used for estimating ETo and daily rainfall data were collected from the AWS at the study site.
During the study period, daily measurements were conducted on weekdays to determine different components of the water balance in each tube. These measurements consisted of three steps: (i) irrigation, (ii) weighing the tube (to determine soil moisture), and (iii) measuring the outflow (Figure 3). During weekends (Saturday and Sunday) and national holidays, the pallets were moved to a sprinkler irrigation area and no measurements were made. A soil moisture sensor (SM 150 T from Delta-T Devices) was used to measure the moisture content in the growing medium during the experiment. The sensor was calibrated before use according to the manufacturer’s instructions, based on actual moisture measurements on 30 samples of growing medium. This yielded a linear relationship (R2 = 0.968) between the soil moisture value measured by the sensor and the actual soil moisture of samples:
where CSM is the calibrated value and MSM is the value measured by the sensor.
2.3. Irrigation Demand and Crop Coefficient
Crop coefficient is defined as the ratio of actual to potential evapotranspiration:
where ETo can be calculated based on the meteorological approach, while an experimental approach is recommended to estimate ETa [9].
According to Penman-Monteith model, ETo can be calculated using meteorological elements and incorporating parameters for crop resistance, albedo, and air resistance. In the present study, the value of ETo was extracted from the AWS data as:
where ETo is reference (potential) evapotranspiration [mm day−1], Rn is net radiation at the crop surface [MJ m−2 day−1], G is soil heat flux density [MJ m−2 day−1], T is mean daily air temperature at 2 m height [°C], u2 is wind speed at 2 m height [m s−1], es is saturation vapor pressure [kPa], ea is actual vapor pressure [kPa], Δ is slope vapor pressure curve [kPa °C−1], and γ is a psychometric constant [kPa °C−1].
An experimental method (Figure 3) was used to calculate ETa in treatment T1. Lysimeters provided weight-based estimates of ETa and percolation were used to observe crop growth, as recommended by [10]. The water balance was then calculated using the data obtained as:
where R is rainfall, I is irrigation, ETa is actual evapotranspiration by the crop, DS is the change in soil water storage following addition of water, and P is drainage, all in mm.
R + I = ETa + DS + P
In treatments T2-T4, where there were no plants present, actual evaporation (Ea) was calculated instead of ETa:
R + I = Ea + DS + P
For treatment T4, where drainage from the system was not permitted, some of the irrigation water applied overflowed the tubes. There were no facilities for measuring this overflow, thus, estimating the exact amount of evaporation was impossible. Therefore, for treatment T4, the equation was modified to:
where Sp is overflow from the tube.
R + I = (Ea + Sp) + DS + (P = 0)
The experimental set-up allowed ETa to be measured in the morning and afternoon. Daily ETa was then taken as the combined morning and afternoon values. The change in soil water storage (∆S) brought about by addition of water was determined as:
where St and St−1 are soil water storage at time t (after watering) and t − 1 (before watering). These values were determined by measuring soil moisture content (by sensor) and considering the soil layers from the surface (z = 0) to the bottom of the tubes (z = 0.1 m).
DS = St − St−1
3. Result and Discussion
3.1. Comparison of Water Balance Components in Different Treatments
The total amount of water applied to the plants in treatment T1 was 2756 mm, which comprised 2651 mm as irrigation water and 105 mm as rainfall (Figure 4(b1)). The measured outflow was 1962 mm, which was considered as drainage (or percolation). The difference between water added and percolation, which was assumed to represent ETa, was 380 mm. The change in soil water storage (ΔS) following addition of water was on average 414 mm. Total cumulative soil Ea (actual evaporation) was estimated from treatment T2, in which there were no plants (Figure 4(d2)), and was found to be 305 mm, i.e., around half the value of ETa in treatment T1.
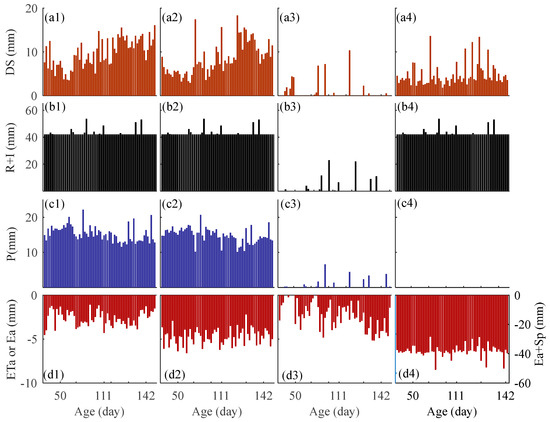
Figure 4.
Water balance components in the different treatments (where 1–4 represent T1–T4, respectively) from 07:30 h to 16:00 h on day 40–142 of Eucalyptus pellita growth: (a1–a4) change in soil water storage (DS), (b1–b4) rainfall (R) plus irrigation (I), (c1–c4) percolation (P) and (d1–d4) evapotranspiration (ETa) or evaporation (Ea).
Total cumulative soil Ea in non-irrigated conditions was estimated from treatment T3 (no plants, no irrigation, free drainage) and was found to be 151 mm, i.e., around half the value in irrigated conditions (T2) and one-fifth of ETa in T1. As mentioned, the amount of Ea in treatment T4 included overflow from the tubes (Figure 4(d4)). Among the three treatments involving irrigation (T1, T2 and T4), the lowest variation in soil moisture content was observed in T4, because there was no drainage system and the total amount of water applied (2756) mm greatly exceeded actual soil Ea (305 mm). Therefore, the soil in T4 was almost at saturation at all times (before and after irrigation).
3.2. Soil Moisture Variations
Soil moisture (SM) was measured during irrigation periods (DIP; 08:00 h-16:00 h) (Figure 5(a1–d1)) and outside irrigation periods (OIP; 16:00 h–08:00 h) (Figure 5a2–d2). The OIP soil moisture content decreased (showed negative values) in all treatments (T1–T4) except during rainfall events (Figure 5(a2–d2)). In the treatments where irrigation was applied (T1, T2 and T4), DIP increased accordingly (positive values), but some negative values were recorded (Figure 5(a1–d1)). These occurred when the decrease in soil moisture content in the afternoon between the two watering exceeded the increase in soil moisture after the second watering.
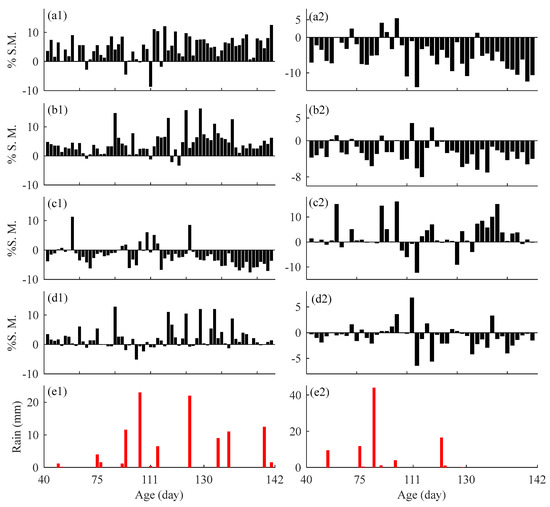
Figure 5.
Soil moisture (SM) fluctuations in different treatments during the irrigation period (DIP; 08.00 h–16.00 h, a1, b1, c1 and d1 in T1, T2, T3 and T4) and outside the irrigation period (OIP; 16.00 h–08.00 h, a2, b2, c2 and d2 in T1, T2, T3 and T4), on day 40–142 of Eucalyptus pellita growth, e1 and e2 timing and magnitude of rainfall events during the DIP and OIP periods.
It must be pointed that the sensor was used to measure the moisture in the growing medium four times per day over 64 days of measurement, giving a total of 256 measurements. Based on soil moisture characteristic tests in the laboratory, the wilting point (pF 4.2) of the growth medium was determined to be 18%-vol., field capacity (pF 2) was 27.5%-vol., and the saturation point (pF 1) was 47.3%-vol.
In the irrigated treatments (T1, T2, and T4), the change in soil moisture over time was more affected by irrigation than rainfall (irrigation volume was 42 mm/day). Soil moisture content was always above wilting point and below saturation point, either before or after irrigation. The greatest fluctuation in soil moisture content was observed in treatment T2, where there were no plants and therefore no water loss, and the smallest fluctuation was in T4, where the soil was always near saturation and there were no drainage losses of the irrigated water applied. Treatment T3 (no irrigation) represented natural conditions in the field, because the only water source for the plants was rainfall. The greatest increase in soil moisture in T3 was from 19%-vol. to 39%-vol., which was brought about by a rainfall event supplying 23 mm in one day. This indicates that irrigation of E. pellita plants is urgently needed during the dry season in order to ensure that there is no water deficient restricting growth.
3.3. Crop Coefficient, Actual Evapotranspiration, and Potential Evapotranspiration
Using the weather data collected during the experimental period (Figure 6), daily potential evapotranspiration (ETo) was calculated by the Penman-Monteith method (Figure 7a). Actual evapotranspiration (ETo) was calculated by solving the water balance equation (Equation (3)) for treatment T1 in the same period (Figure 7b). The crop coefficient (Kc) for E. pellita during initial growth in the open nursery was estimated by applying Equation (1) (Figure 7c).
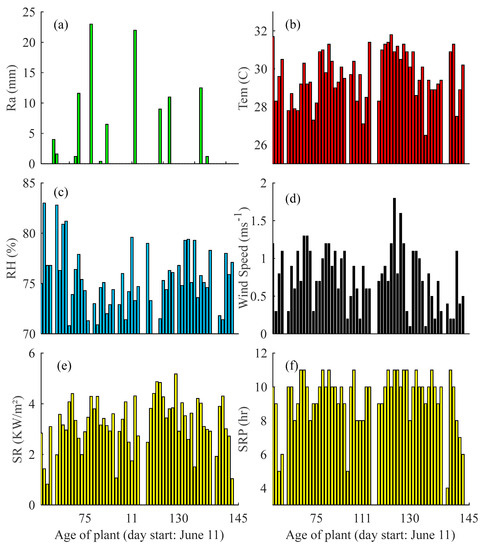
Figure 6.
Meteorological data collected by an Automatic Weather Station at the study side during the project period. (a) Rainfall (Ra), (b) temperature (Tem), (c) relative humidity (RH), (d) wind speed, (e) solar radiation (SR), and (f) solar radiation period (SRP).
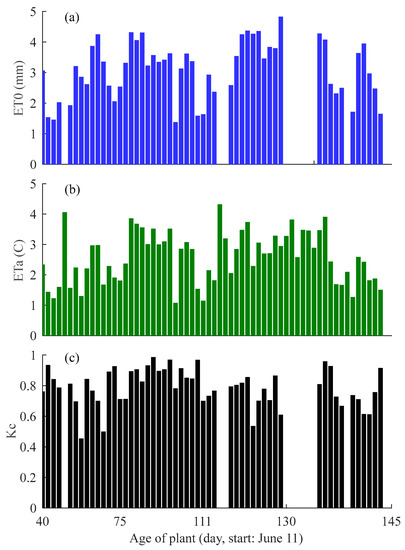
Figure 7.
(a) Potential evapotranspiration (ETo, calculated by the Penman-Monteith method), (b) actual evapotranspiration (ETa, calculated from experimental data and water balance) and (c) crop coefficient (Kc) during initial growth (days 40–145) of Eucalyptus pellita in an open nursery.
The average Kc value was estimated to be 0.79, with a deviation of ±0.12 (Figure 7c). For some periods, no Kc value was obtained, as no ETo value was available. Estimated Kc for Eucalyptus grandis in the initial growth stage to be 0.70 using the dual crop coefficient method [9], but to our knowledge, our work is the first study to report a Kc value for Eucalyptus pellita. The difference in Kc value may due to species differences. Another reason can be that calculation of Kc and of ETa follow the same method and criteria [11], indicating the necessity of determination and/or calibration for local cultivation conditions. As can be clearly seen in Figure 7, ETa and ETo both decreased on day 86 of E. pellita growth when there were 22 mm of rainfall. This means that ETo and ETa had a strong correlation, as can also be seen from the coefficient (R = 0.86) (Table 1).

Table 1.
Correlation coefficient (R) between metrological data and experimental results in treatments T1–T3 for Eucalyptus pellita during initial growth in an open nursery.
The weighing lysimeter generated an error throughout the experiment process. Based on [12], the root mean square error (RMSE), which quantifies how closely two independent datasets match, was used to compare the daily values of ETa derived from measurements and daily values of ETo derived from AWS data (Penman-Monteith method). The RMSE value was found to be 0.82 mm per day (R2 = 0.76).
The ETo values calculated based on the Penman-Monteith method showed a strong relationship with air temperature, relative humidity, solar radiation, and net radiation (R > 0.5), while ETa was positively correlated with solar radiation and net duration. [13] Observed an inverse correlation between ETo and ETa and concluded that, in conditions with no water restriction, Penman-Monteith ETo is proportional to the availability of solar energy and the radiation balance. They also concluded that ETa depends on local meteorological elements, increasing as temperature, wind speed, and incoming solar radiation increase, and as relative air humidity decreases. Similarly, [14] concluded that ETa is positively correlated with net radiation, wind velocity, air temperature, and specific humidity. Our results show that water restriction only applied in calculating ETo, and not ETa. [15] Concluded that lysimeter irrigation must exceed ETo in order to guarantee the water supply for crop evapotranspiration at the maximum rate, which is required to determine the Kc value.
3.4. Effect of Rainfall and Irrigation Recommendations
In order to compare the effect of rainfall on soil moisture content, the corresponding data were grouped (Figure 8). Soil moisture before a rainfall event (red line in Figure 8) value was not directly affected by rainfall, since the rainfall events occurred randomly. Since treatments T1, T2 and T4 were irrigated, the soil moisture content before rainfall was relatively constant (above the wilting point). In these cases, the soil moisture content after rain did not change much for any intensity of rainfall, since soil moisture conditions were controlled by irrigation. In treatment T3 (no irrigation), soil moisture content dropped in periods between rainfall events. At the highest rainfall intensity of 22 mm/day, when the soil moisture content was low (<20%-vol.) it increased strongly (by ~20%-vol.), whereas when it was already high (38–41%-vol.), i.e., close to saturation point, there was only a minor increase (Figure 8c).
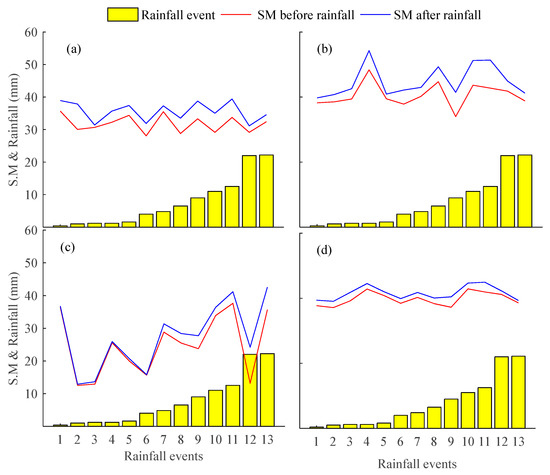
Figure 8.
Effect of rainfall events on soil moisture (SM) content in (a–d) treatments T1-T4.
Knowing the value of Kc, the amount of irrigation required for a specific crop can be defined. In the field, the input of water comes from rainfall, thus, if there is no rainfall, the crop water requirement has to be supplied by irrigation. As irrigation requirements, leaching and percolation also have to be considered [16]. The irrigation requirement of E. pellita during early growth in the nursery (Table 2) was calculated based on rainfall occurrence during the measurement period and assuming leaching of 5 mL and a soil moisture content of 22%-vol. (above wilting point). Water wastage (up to 20%) occurs if irrigation is based on overestimated Kc values [17], while yield reductions (up to 38%) occur if irrigation is based on underestimated Kc values [18]. It is worth noting that the recommended irrigation requirement of Eucalyptus pellita in this research is related to plants in the nursery stage. After the nursery stage, the plants will be transferred to the field (forestry plantation area) where the irrigation demand is supplied by precipitation.

Table 2.
Irrigation requirement of Eucalyptus pellita during early growth, based on rainfall occurrence.
4. Conclusions
The experimental lysimeter set-up used in this study enabled a good understanding of water balance components for Eucalyptus pellita. During the dry season, rainfall in the study region is limited and the soil moisture content decreases over time, thus, irrigation is essential in order to keep the level above wilting point.
Actual evapotranspiration (ETa) and potential (reference) evapotranspiration (ETo) showed a good correlation (R = 0.86). Calculating their ratio resulted in a crop coefficient (Kc) value for E. pellita of 0.79 (±0.12) during the initial growth stage (40–142 days), compared with a Kc value for Eucalyptus grandis of 0.70. ETo showed a strong positive correlation (R > 0.5) with temperature, relative humidity, solar radiation, and radiation period.
In the absence of irrigation, if the soil moisture content is below wilting point a rainfall event supplying 22 mm/day will increase the moisture content by about 20%-vol., but if the soil is already close to saturation, it will cause no major change in soil moisture. The irrigation recommendation in the field varies depending on precipitation, from 70 mL/plant/day in the case of no rainfall to zero with rainfall above 30 mm/day. Further studies may be required to confirm this recommendation.
Author Contributions
Conceptualization, D.A., B.K., and A.T.H.; methodology, D.A., B.K. and A.T.H.; software, D.A., M.I.H. and A.T.H.; validation, D.A., M.I.H. and A.T.H.; formal analysis, D.A., M.I.H., and A.T.H.; investigation, D.A., M.I.H. and A.T.H.; resources, D.A. and M.I.H.; data curation, D.A., M.I.H. and A.T.H.; writing—original draft preparation, D.A.; writing—review and editing, D.A., B.K. and A.T.H.; visualization, D.A., and A.T.H.; supervision, B.K. and A.T.H.; project administration, M.I.H.; funding acquisition, B.K.
Funding
This research was funded by Sinarmas Forestry Company and Doctoral Degree Program at University Oulu.
Acknowledgments
The author would like to thank Gurdeep D. Golani as Dy CEO of Sinarmas Forestry for providing support so the author can join in Doctoral Degree Program. The study was financially supported by PT. Arara Abadi (Sinarmas Forestry) and scientifically supported by the Doctoral Degree Program at the Water, Energy and Environmental Engineering Research Unit, University of Oulu, Finland.
Conflicts of Interest
The authors declare no conflict of interest.
References
- Bristow, M. Growth of Eucalyptus Pellita in Mixed Species and Monoculture Plantations. Ph.D. Thesis, Southern Cross University, Lismore, Australia, 2008. [Google Scholar]
- Lukmandaru, G.; Zumaini, U.F.; Soeprijadi, D.; Nugroho, W.D.; Susanto, M. Chemical Properties and Fiber Dimension of Eucalyptus pellita from the 2nd Generation of Progeny Tests in Pelaihari, South Borneo, Indonesia. Korean Wood Sci. Technol. 2016, 44, 571–588. [Google Scholar] [CrossRef]
- Setyaji, T.; Sunarti, S.; Nirsatmanto, A. Early growth and stand volume productivity of selected clones of Eucalyptus pellita. Indones. J. For. Res. 2016, 3, 27–32. [Google Scholar] [CrossRef][Green Version]
- Yuniarti, K.; Nirsatmanto, A. Several physical properties of Eucalyptus pellita F. Muell from different provenances and sampling position on tree. J. Peneli. Kehutan. Wallace 2018, 7, 151–163. [Google Scholar] [CrossRef]
- Hardie, M.; Mendham, D.; Corkrey, R.; Hardiyanto, E.; Maydra, A.; Siregar, S.; Marolop, R.; Wibowo, A. Effects of Eucalypt and Acacia plantations on soil water in Sumatra. New Forests 2018, 49, 87–104. [Google Scholar] [CrossRef]
- Kunert, N.; Cárdenas, A. Are mixed tropical tree plantations more resistant to drought than monocultures? Forests 2015, 6, 2029–2046. [Google Scholar] [CrossRef]
- Da Silva, V.D.P.; da Silva, B.B.; Albuquerque, W.G.; Borges, C.J.; de Sousa, I.F.; Neto, J.D. Crop coefficient, water requirements, yield and water use efficiency of sugarcane growth in Brazil. Agric Water Manag. 2013, 128, 102–109. [Google Scholar] [CrossRef]
- Schrader, F.; Durner, W.; Fank, J.; Gebler, S.; Pütz, T.; Hannes, M.; Wollschläger, U. Estimating precipitation and actual evapotranspiration from precision lysimeter measurements. Procedia Environ. Sci. 2013, 19, 543–552. [Google Scholar] [CrossRef]
- Alves, M.E.B.; Mantovani, E.C.; Sediyama, G.C.; Neves, J.C.L. Estimate of the crop coefficient for Eucalyptus cultivated under irrigation during initial growth. Cerne 2013, 19, 247–253. [Google Scholar] [CrossRef][Green Version]
- Kotrlik, J.W.; Williams, H.A.; Jabor, M.K. Reporting and Interpreting Effect Size in Quantitative. Agric. Educ. 2011, 52, 132–142. [Google Scholar] [CrossRef]
- De Carvalho, D.F.; de Lima, M.E.; de Oliveira, A.D.; da Rocha, H.S.; Guerra, J.G. Crop coefficient and water consumption of eggplant in no-tillage system and conventional soil preparation. Eng. Agric. 2012, 32, 784–793. [Google Scholar] [CrossRef]
- Kashyap, P.S.; Panda, R.K. Evaluation of evapotranspiration estimation methods and development of crop-coefficients for potato crop in a sub-humid region. Agric. Water Manag. 2001, 50, 9–25. [Google Scholar] [CrossRef]
- Monteiro, E.B.; da Silva, A.C.; Souza, A.P.; Tanaka, A.A.; Ferneda, B.G.; Martim, C.C. Water requirements and crop coefficients of tropical forest seedlings in different shading conditions. Revista Brasileira de Engenharia Agricola e Ambiental 2016, 20, 709–715. [Google Scholar] [CrossRef]
- Gu, L.; Hu, Z.; Yao, J.; Sun, G. Actual and reference evapotranspiration in a cornfield in the zhangye oasis, northwestern China. Water 2017, 9, 499. [Google Scholar] [CrossRef]
- Libardi, L.G.P.; de Faria, R.T.; Dalri, A.B.; de Souza Rolim, G.; Palaretti, L.F.; Coelho, A.P.; Martins, I.P. Evapotranspiration and crop coefficient (Kc) of pre-sprouted sugarcane plantlets for greenhouse irrigation management. Agric. Water Manag. 2019, 212, 306–316. [Google Scholar] [CrossRef]
- Savva, A.P.; Frenken, K. Irrigation Manual: Planning, Development Monitoring and Evaluation of Irrigated Agriculture with Farmer Participation; FAO: Rome, Italy, 2002; Volume IV. [Google Scholar]
- Djaman, K.; O’Neill, M.; Owen, C.; Smeal, D.; Koudahe, K.; West, M.; Allen, S.; Lombard, K.; Irmak, S. Crop evapotranspiration, irrigation water requirement and water productivity of maize from meteorological data under semiarid climate. Water 2018, 10, 405. [Google Scholar] [CrossRef]
- Kharrou, M.H.; Er-Raki, S.; Chehbouni, A.; Duchemin, B.; Simonneaux, V.; LePage, M.; Ouzine, L.; Jarlan, L. Water use efficiency and yield of winter wheat under different irrigation regimes in a semi-arid region. Agric. Sci. 2011, 2, 273–282. [Google Scholar] [CrossRef]
© 2019 by the authors. Licensee MDPI, Basel, Switzerland. This article is an open access article distributed under the terms and conditions of the Creative Commons Attribution (CC BY) license (http://creativecommons.org/licenses/by/4.0/).