Simulating Future Flows and Salinity Intrusion Using Combined One- and Two-Dimensional Hydrodynamic Modelling—The Case of Hau River, Vietnamese Mekong Delta


Abstract
1. Introduction
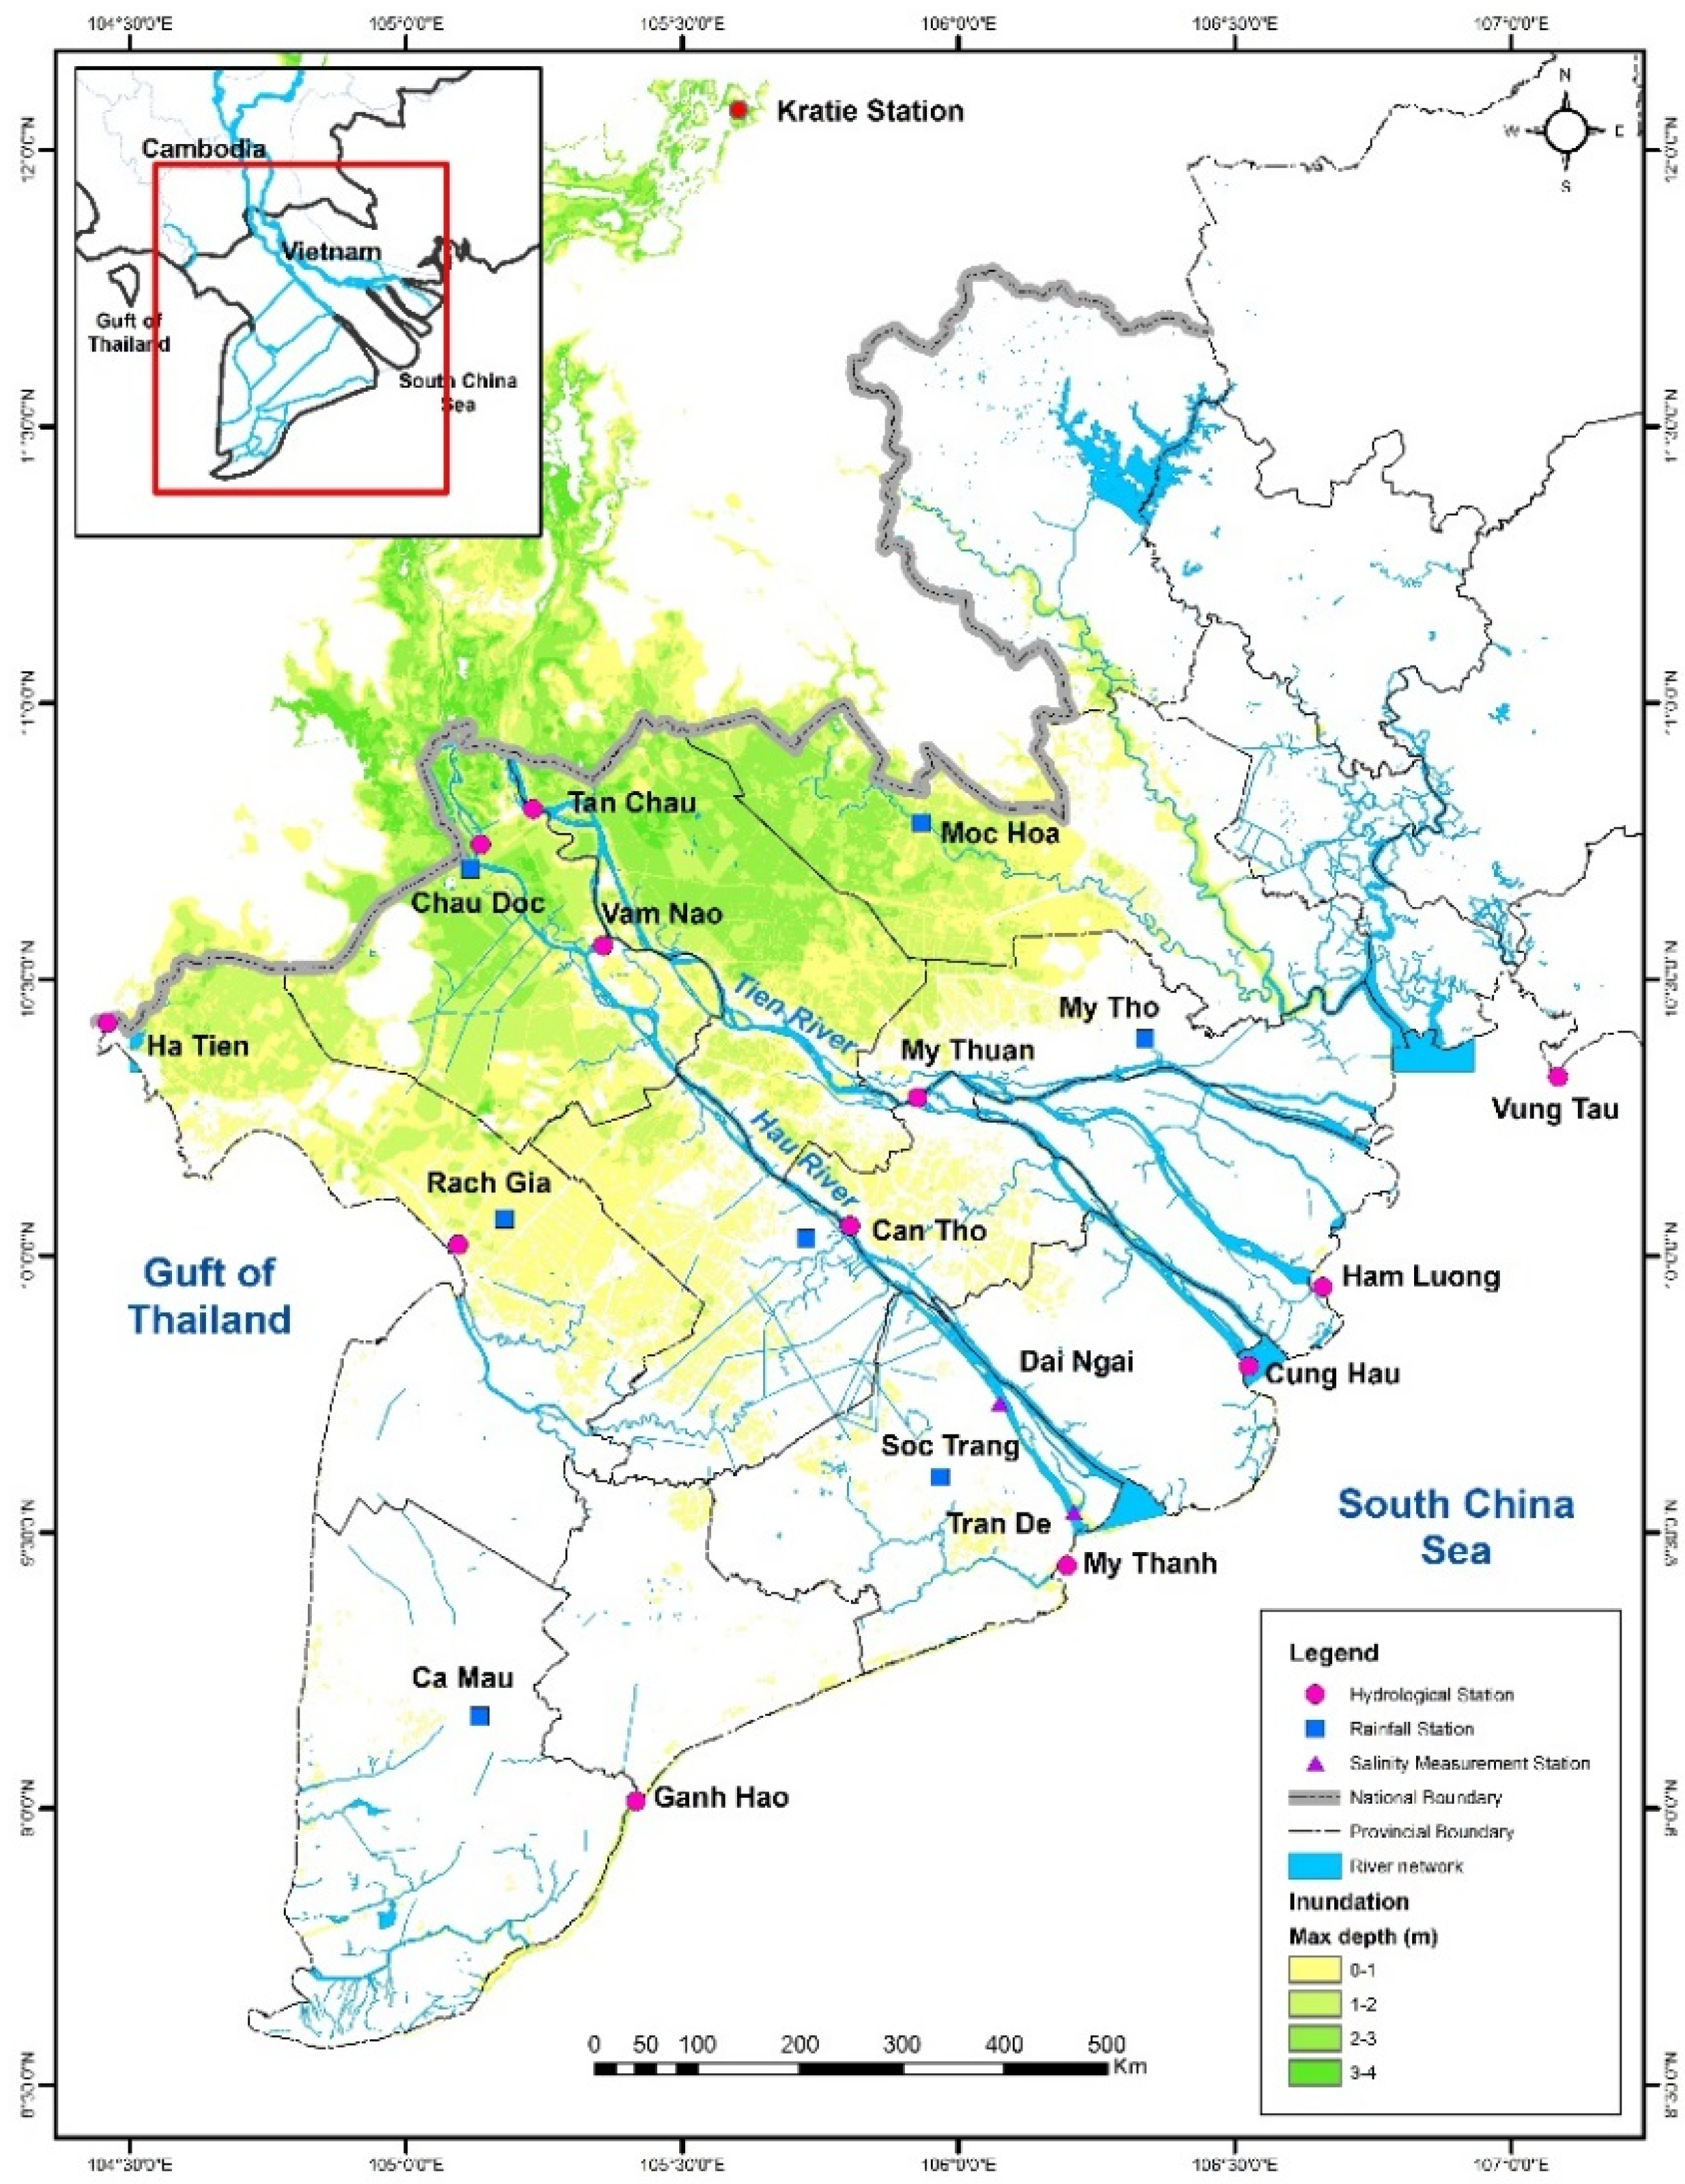
2. Study Area
3. Methodology and Model Setup
3.1. Hydrological and Hydraulic Data
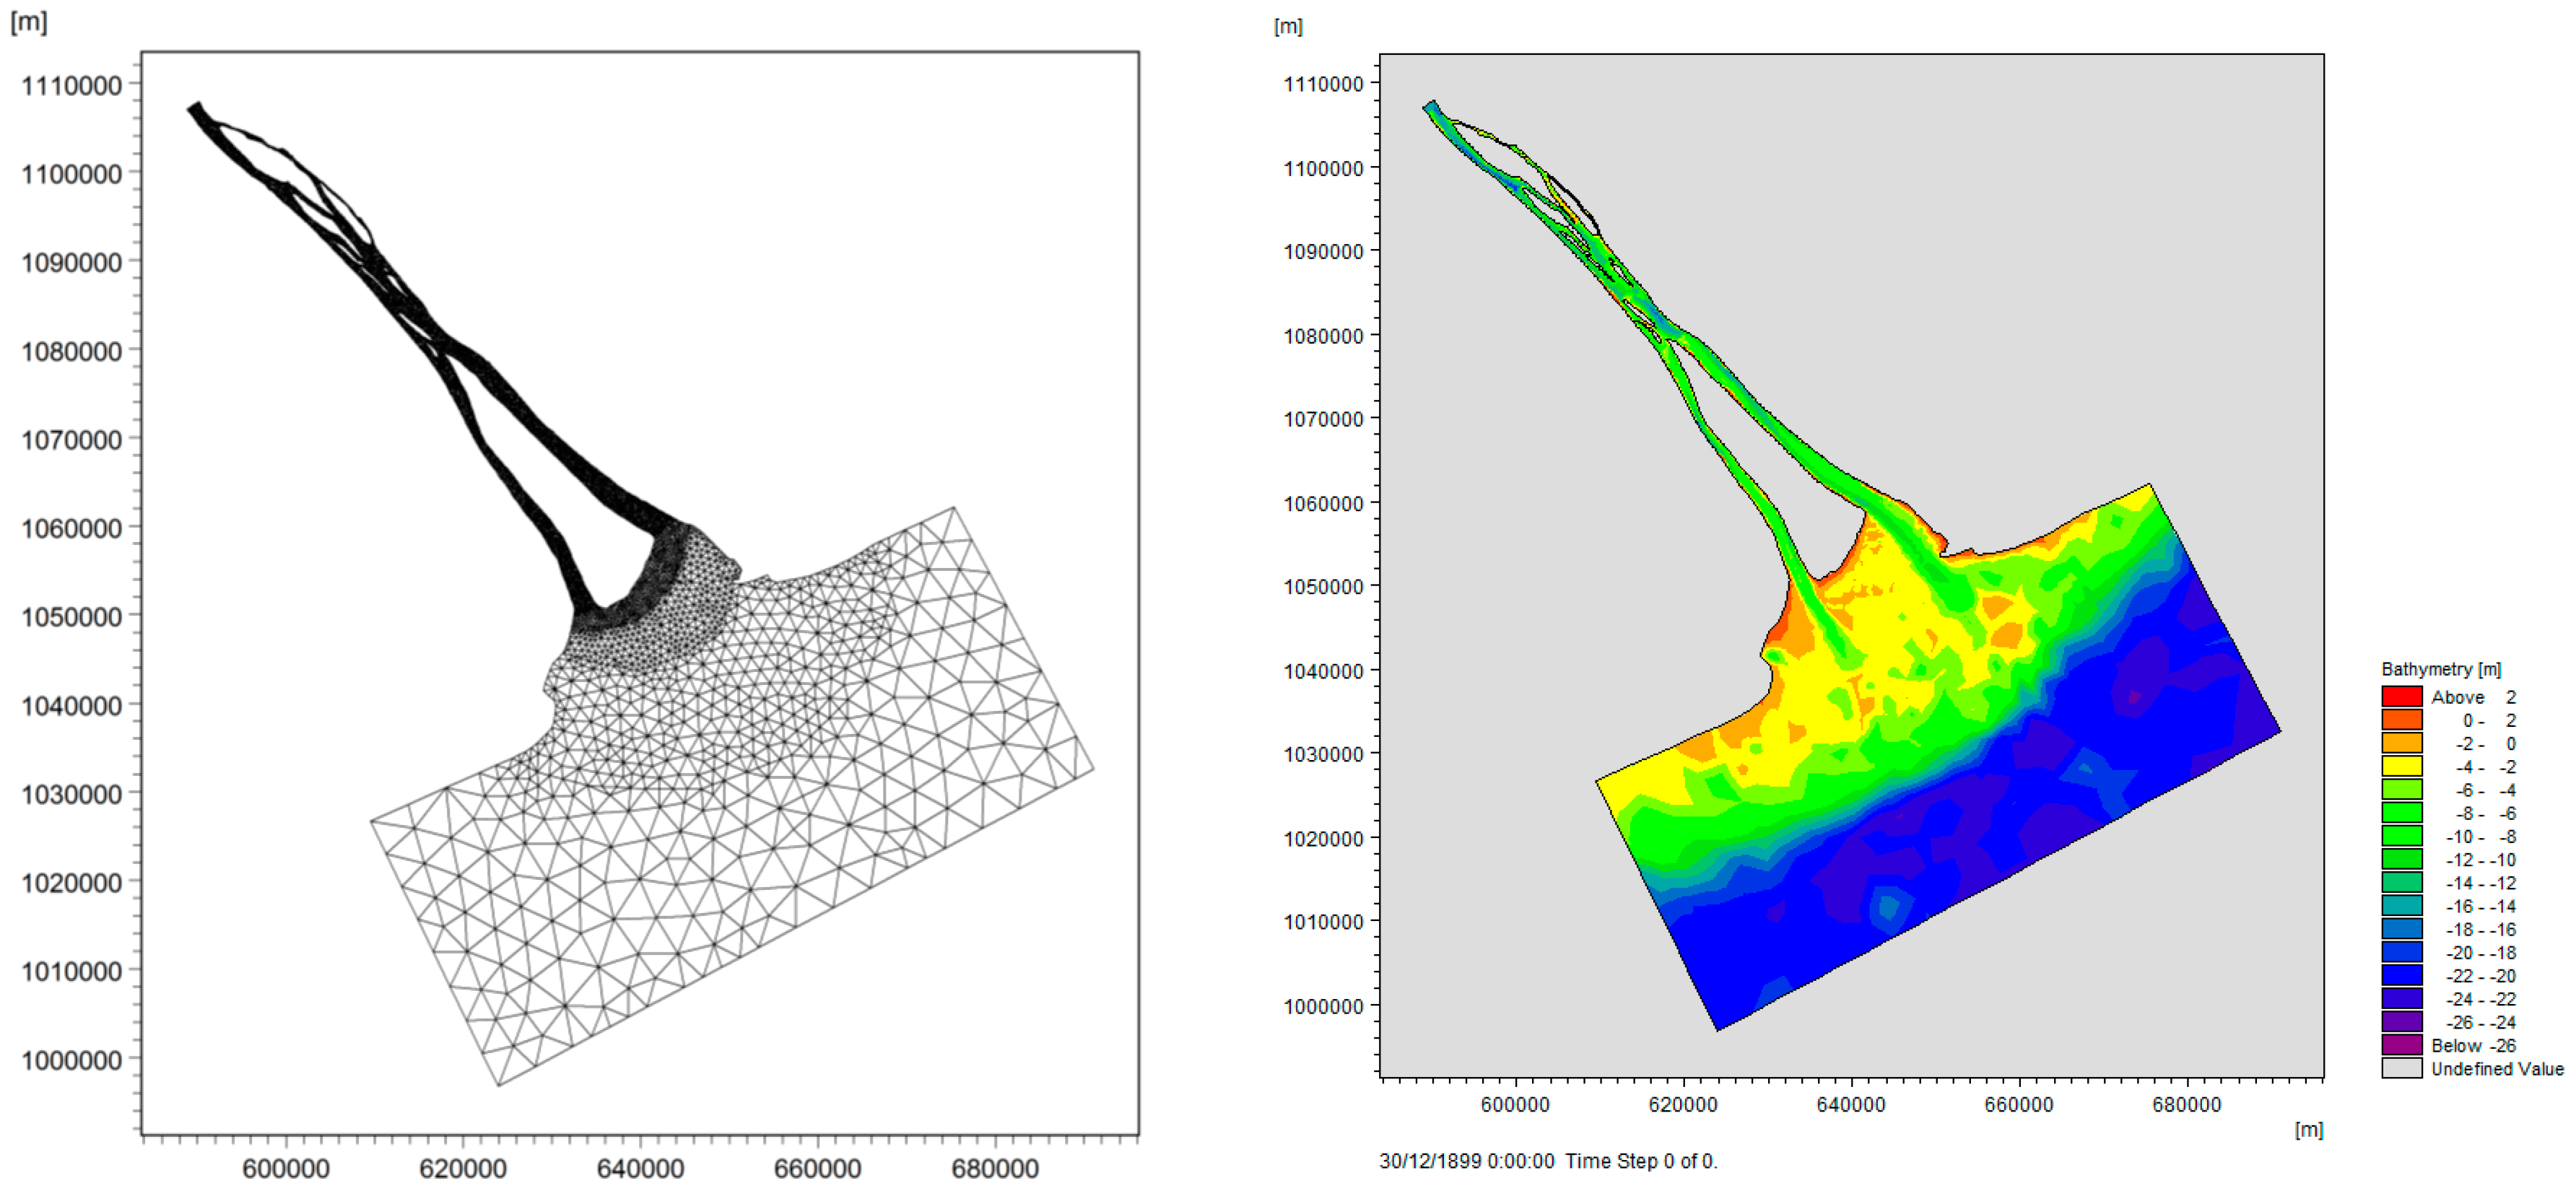
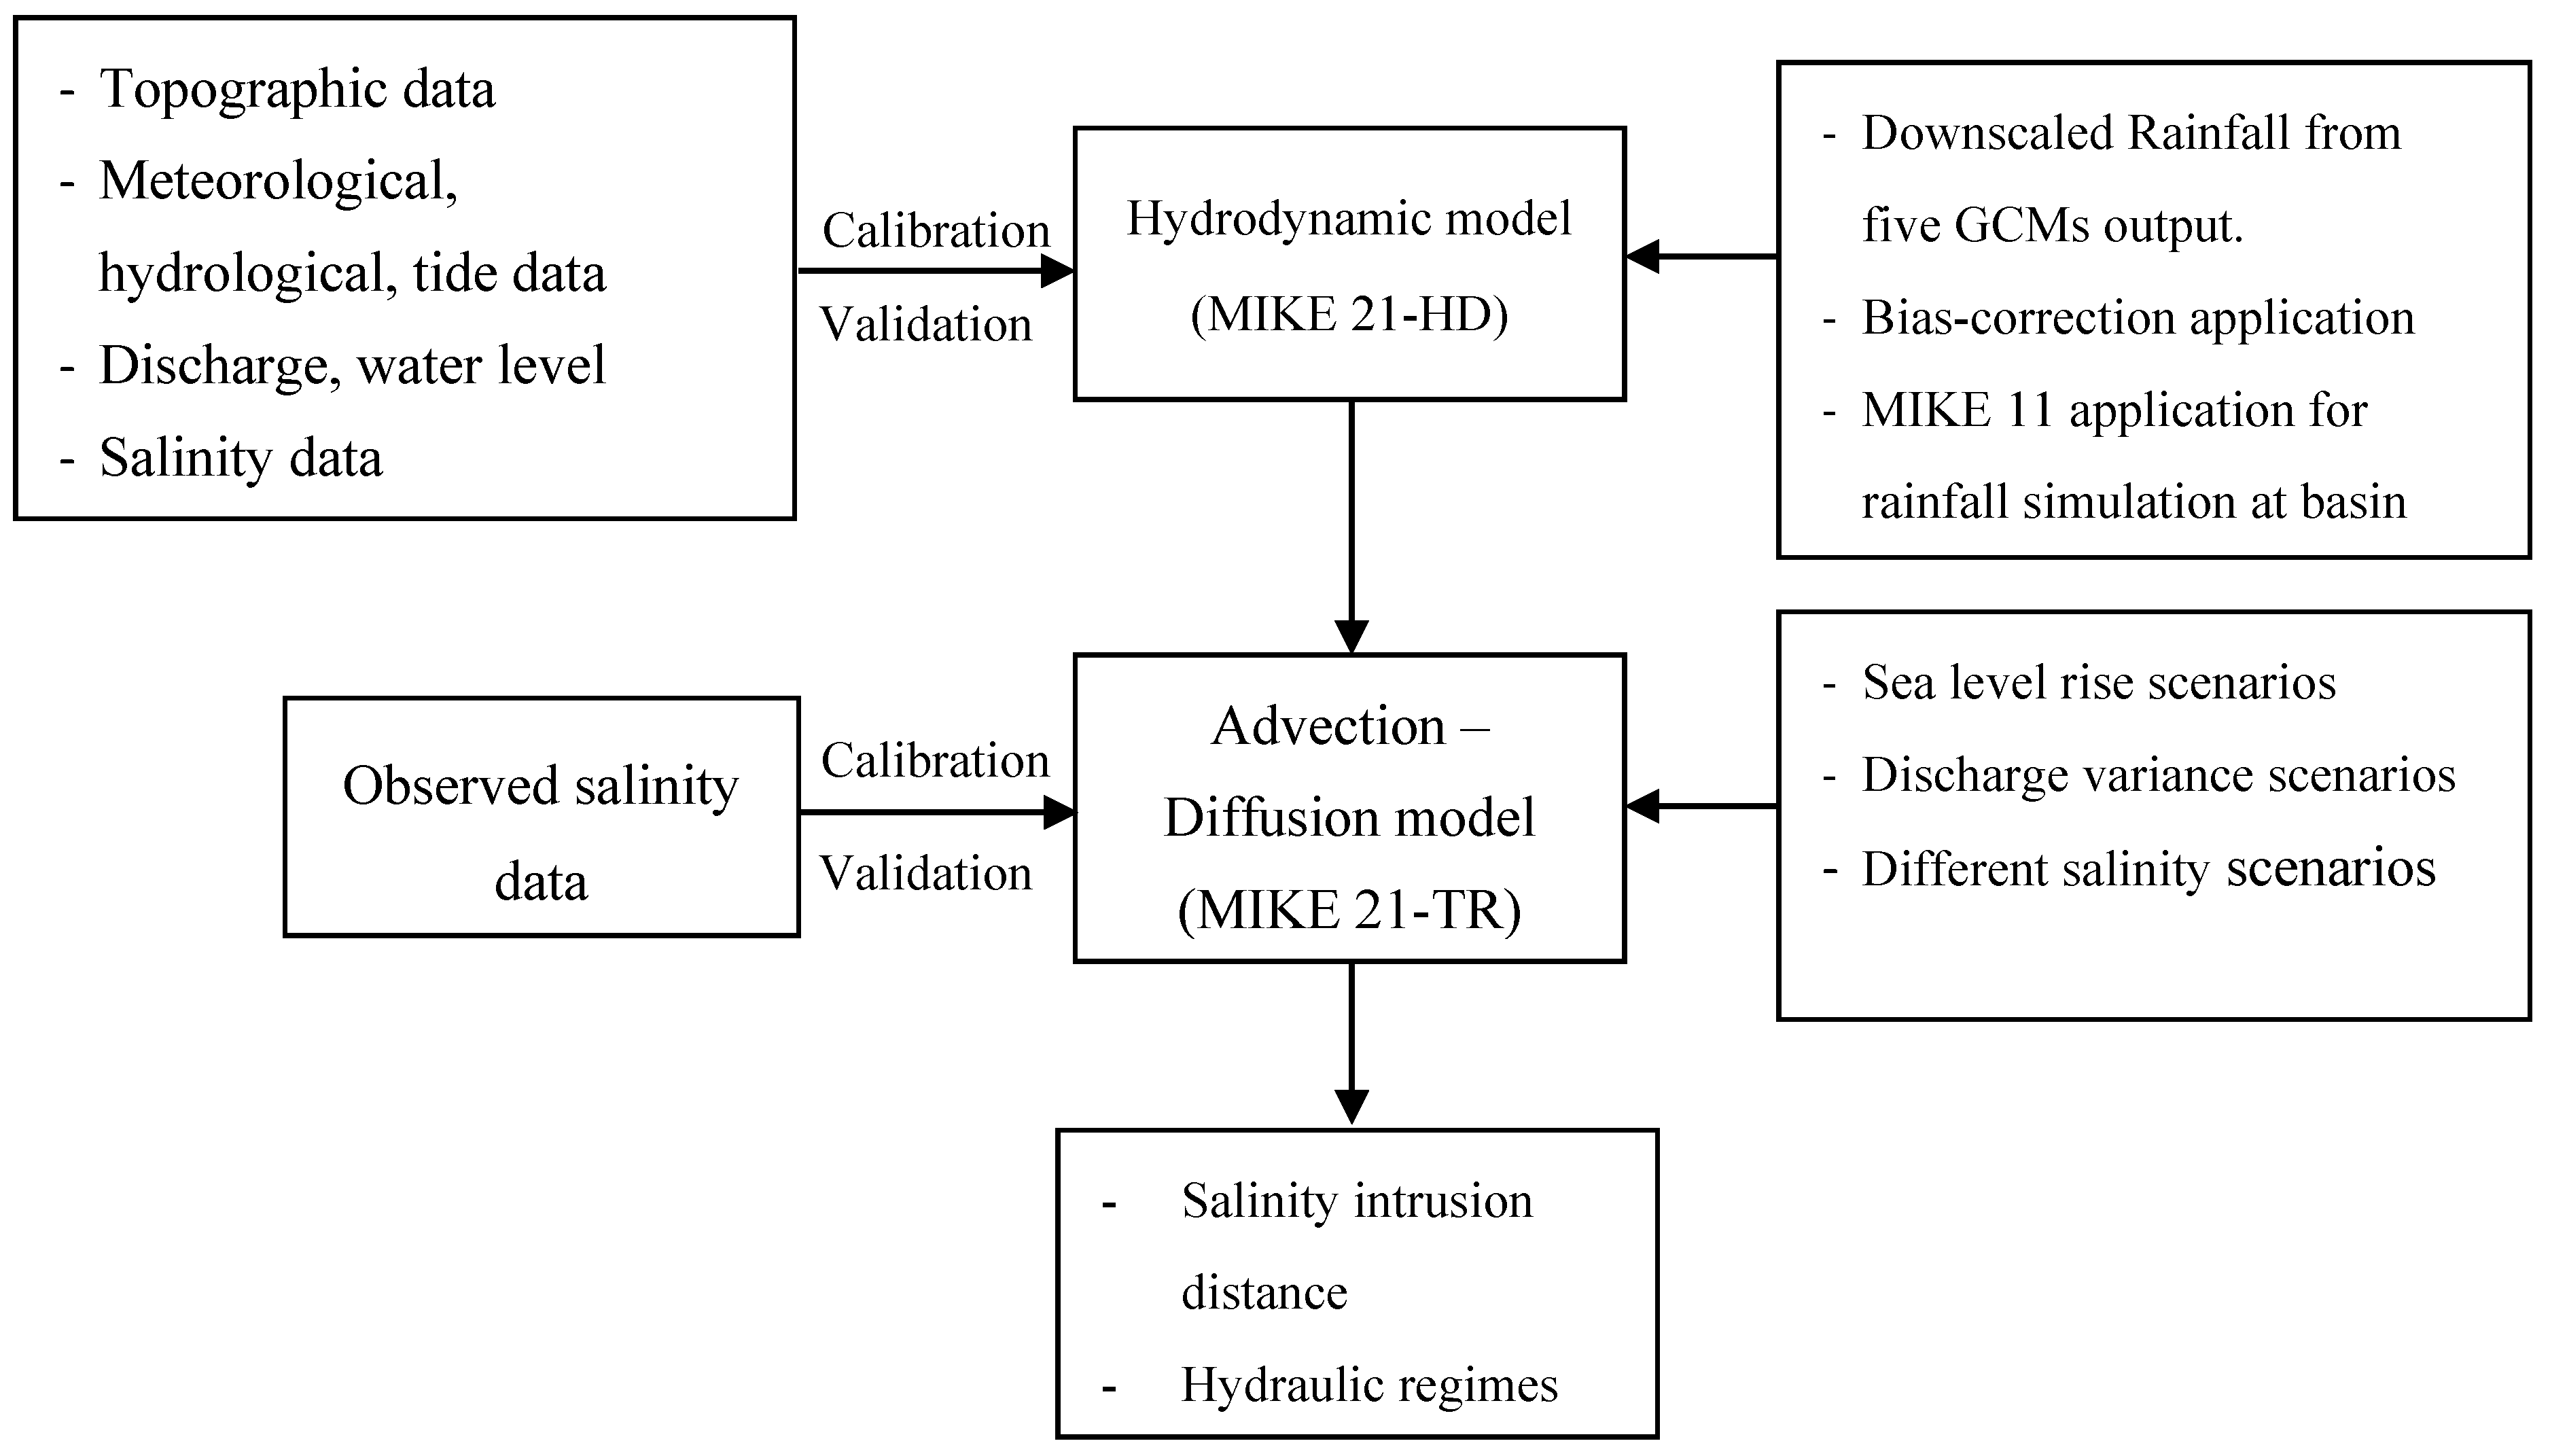
3.2. Model Schematization
3.3. MIKE 11 Hydrodynamic Model
3.4. MIKE 21 Hydrodynamic Model
3.5. Model Parameterization
3.6. Boundary Conditions
3.7. Computation of Flushing Time
4. Model Calibration and Validation
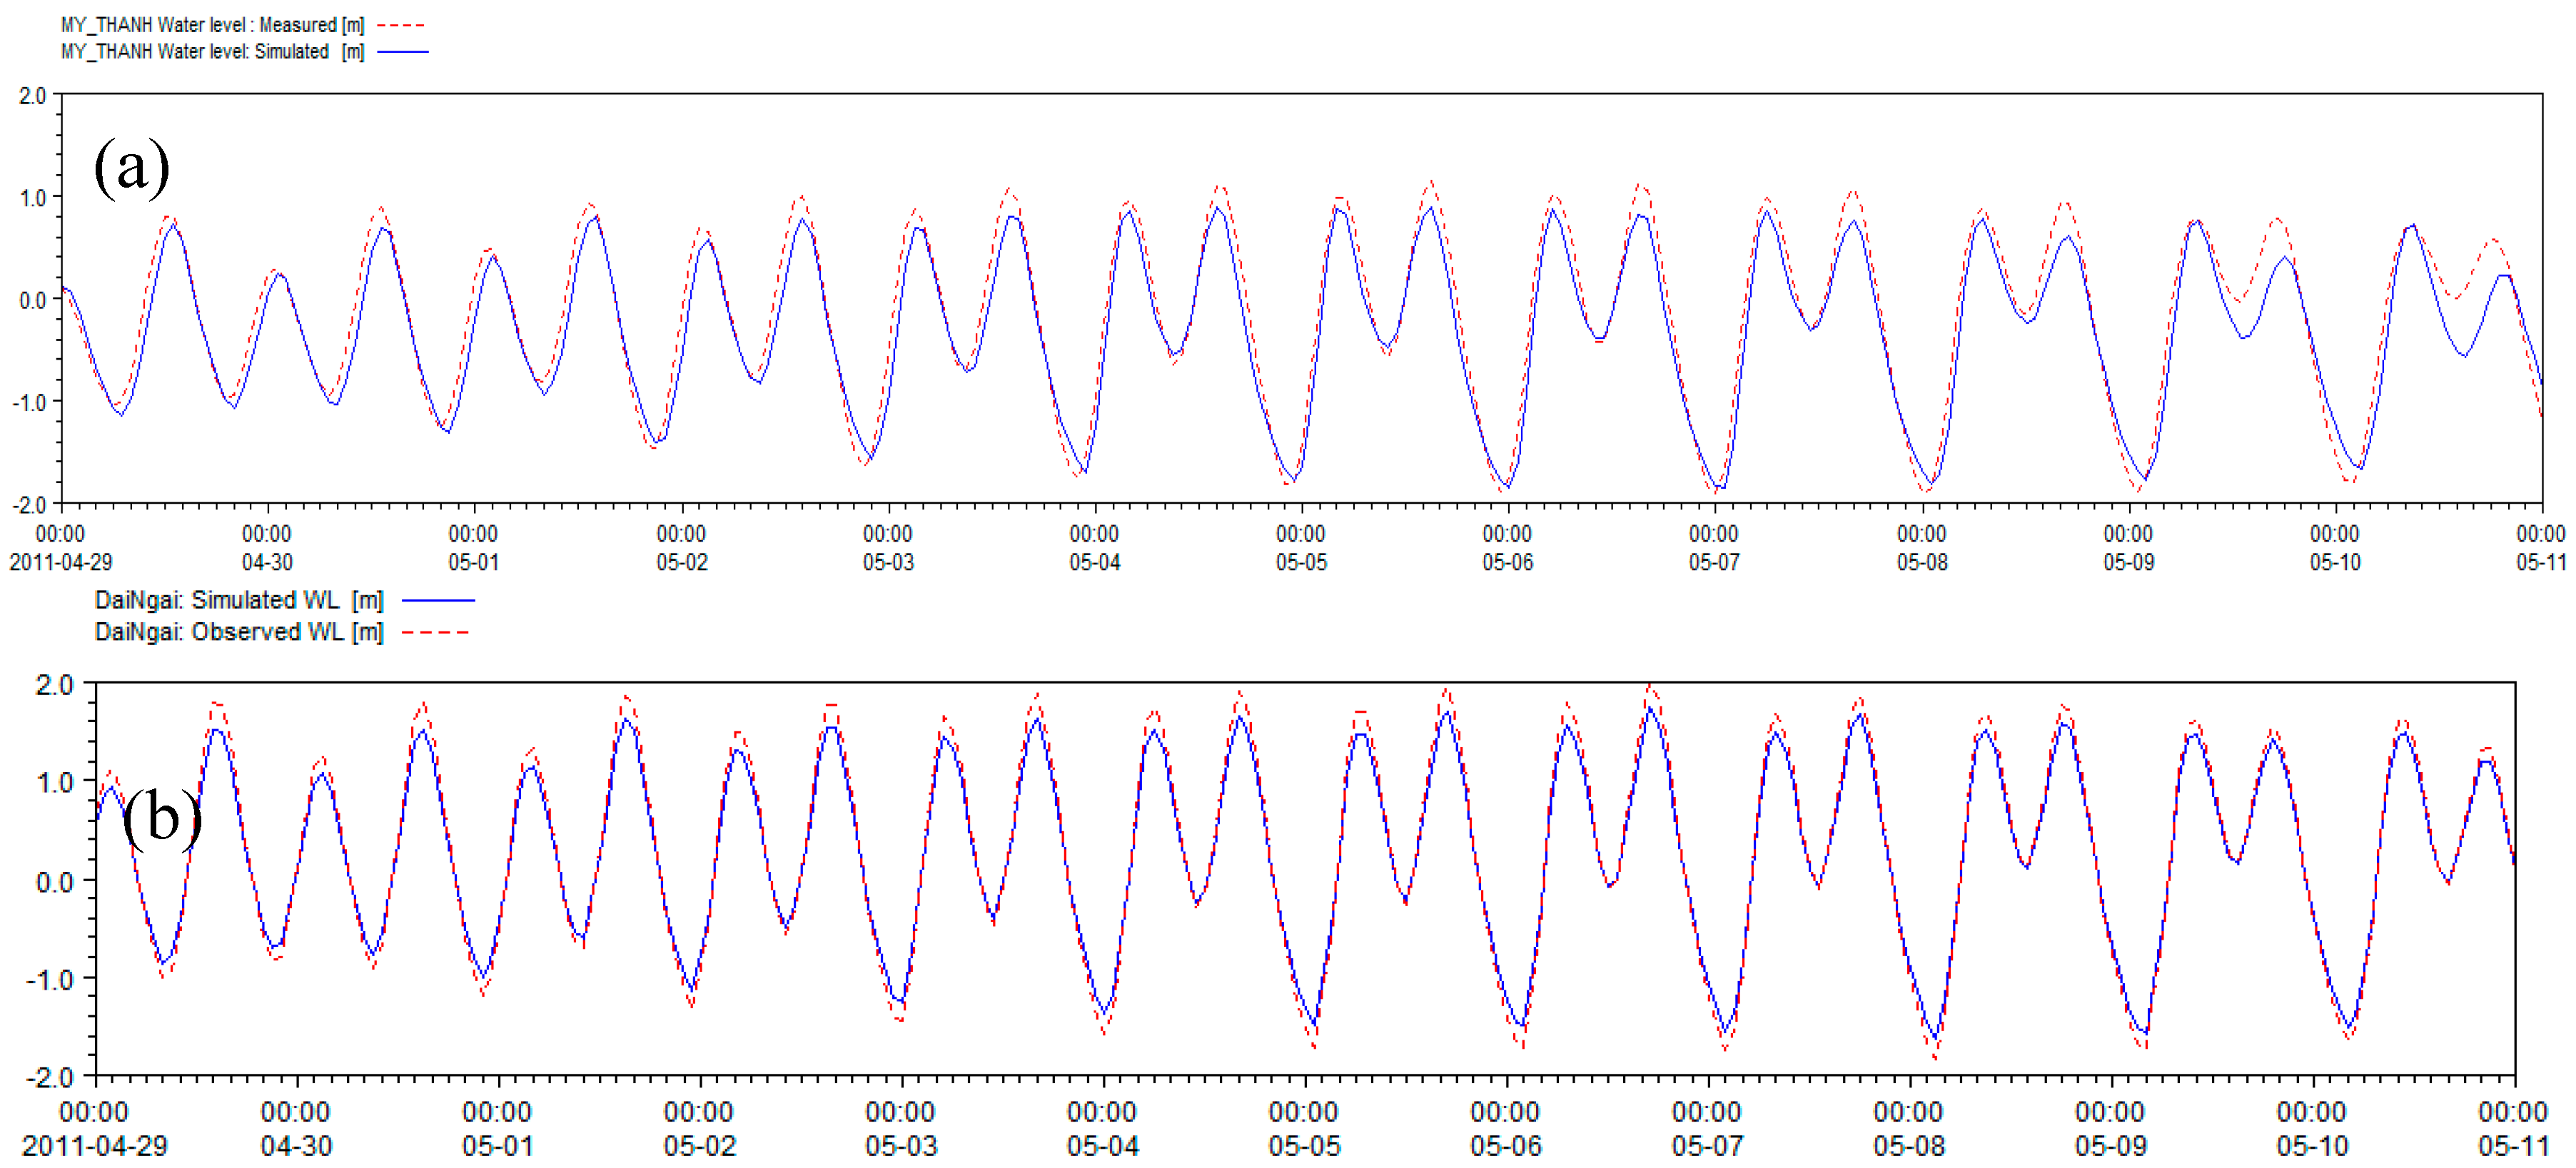
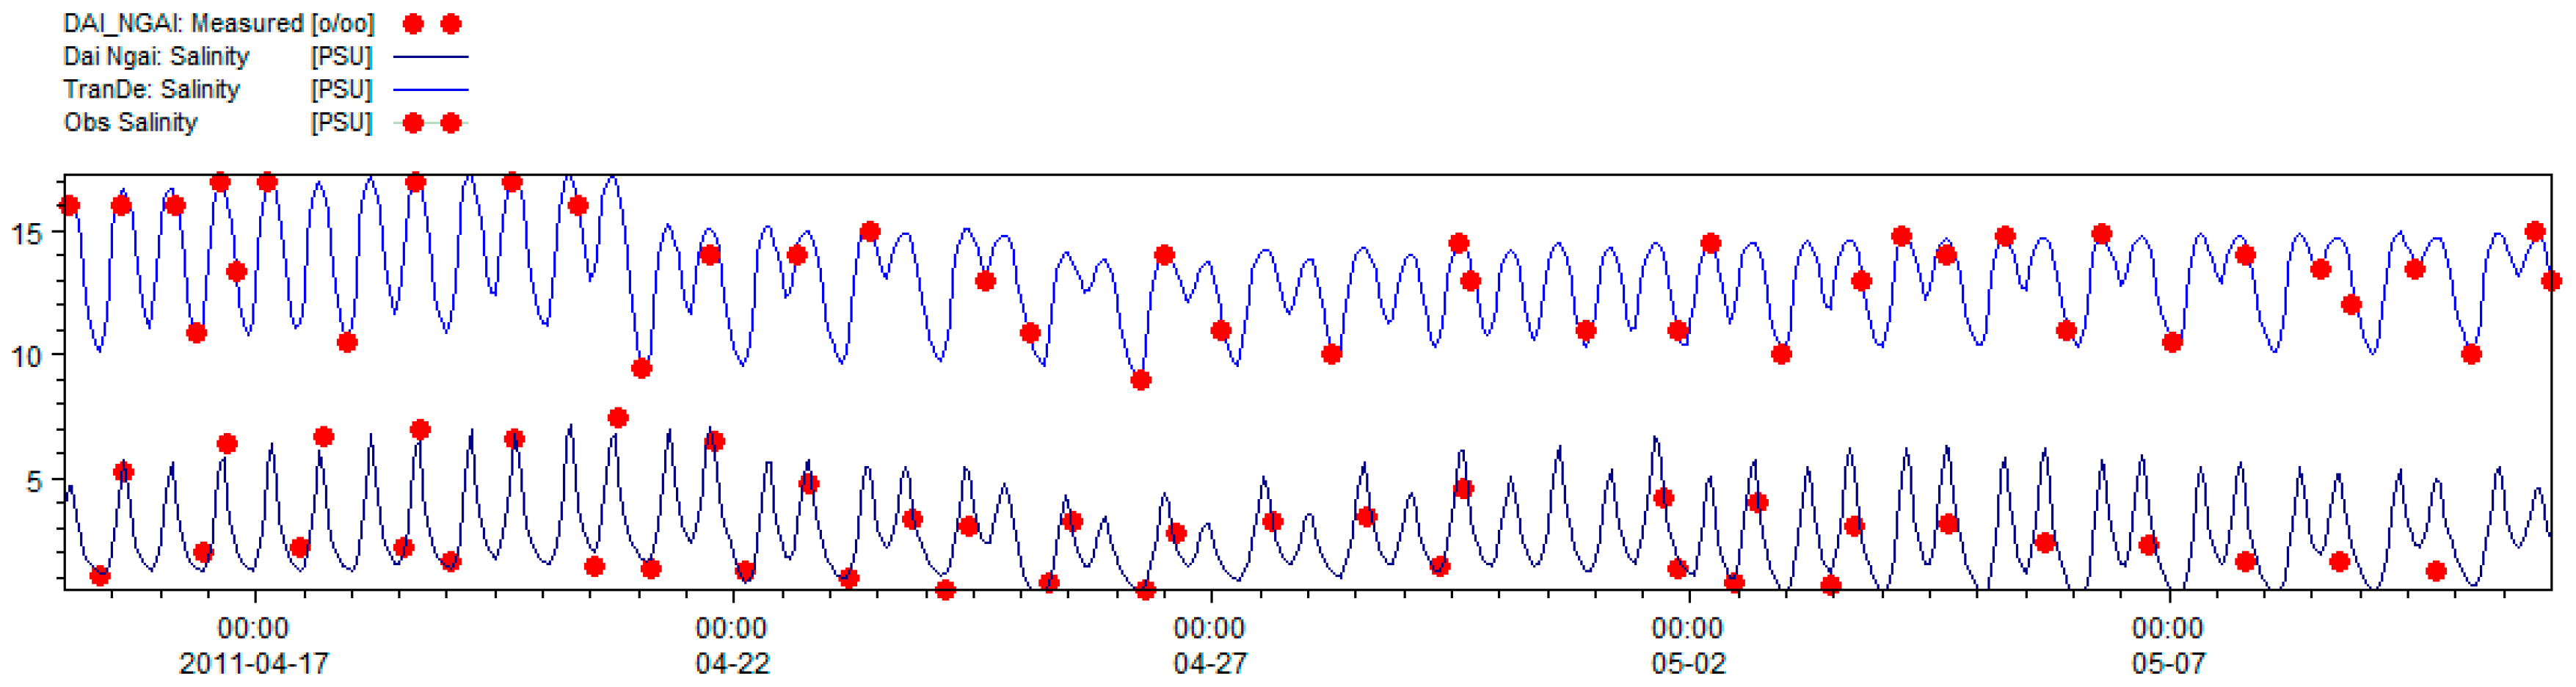
4.1. Model Calibration
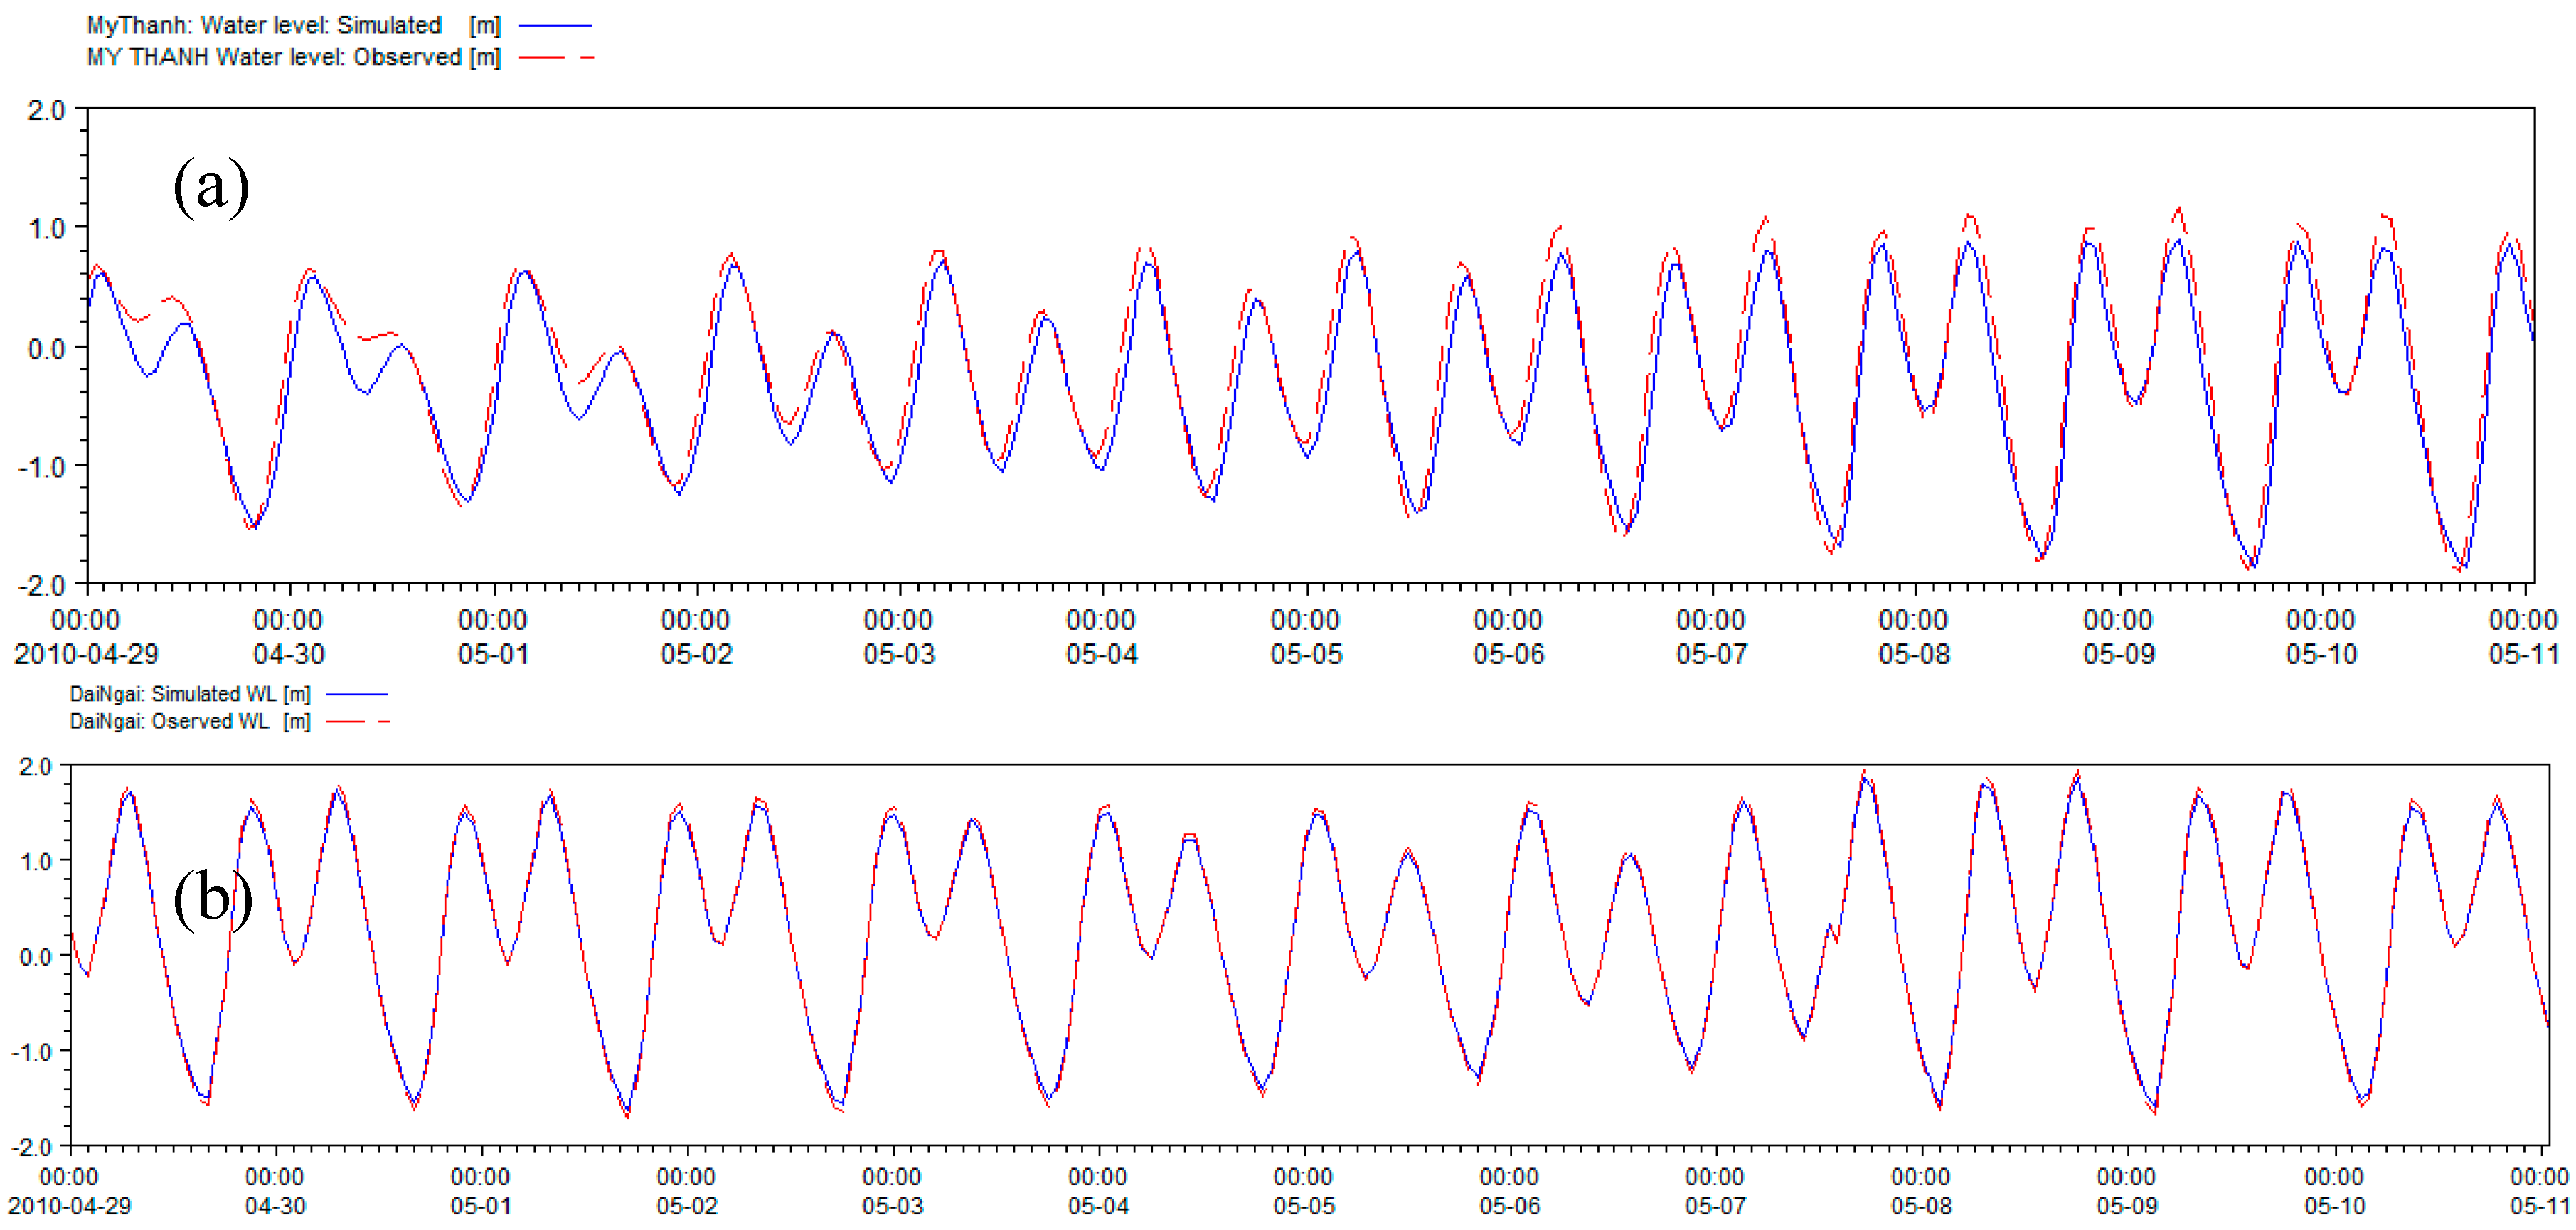
4.2. Model Validation
5. Results and Discussion
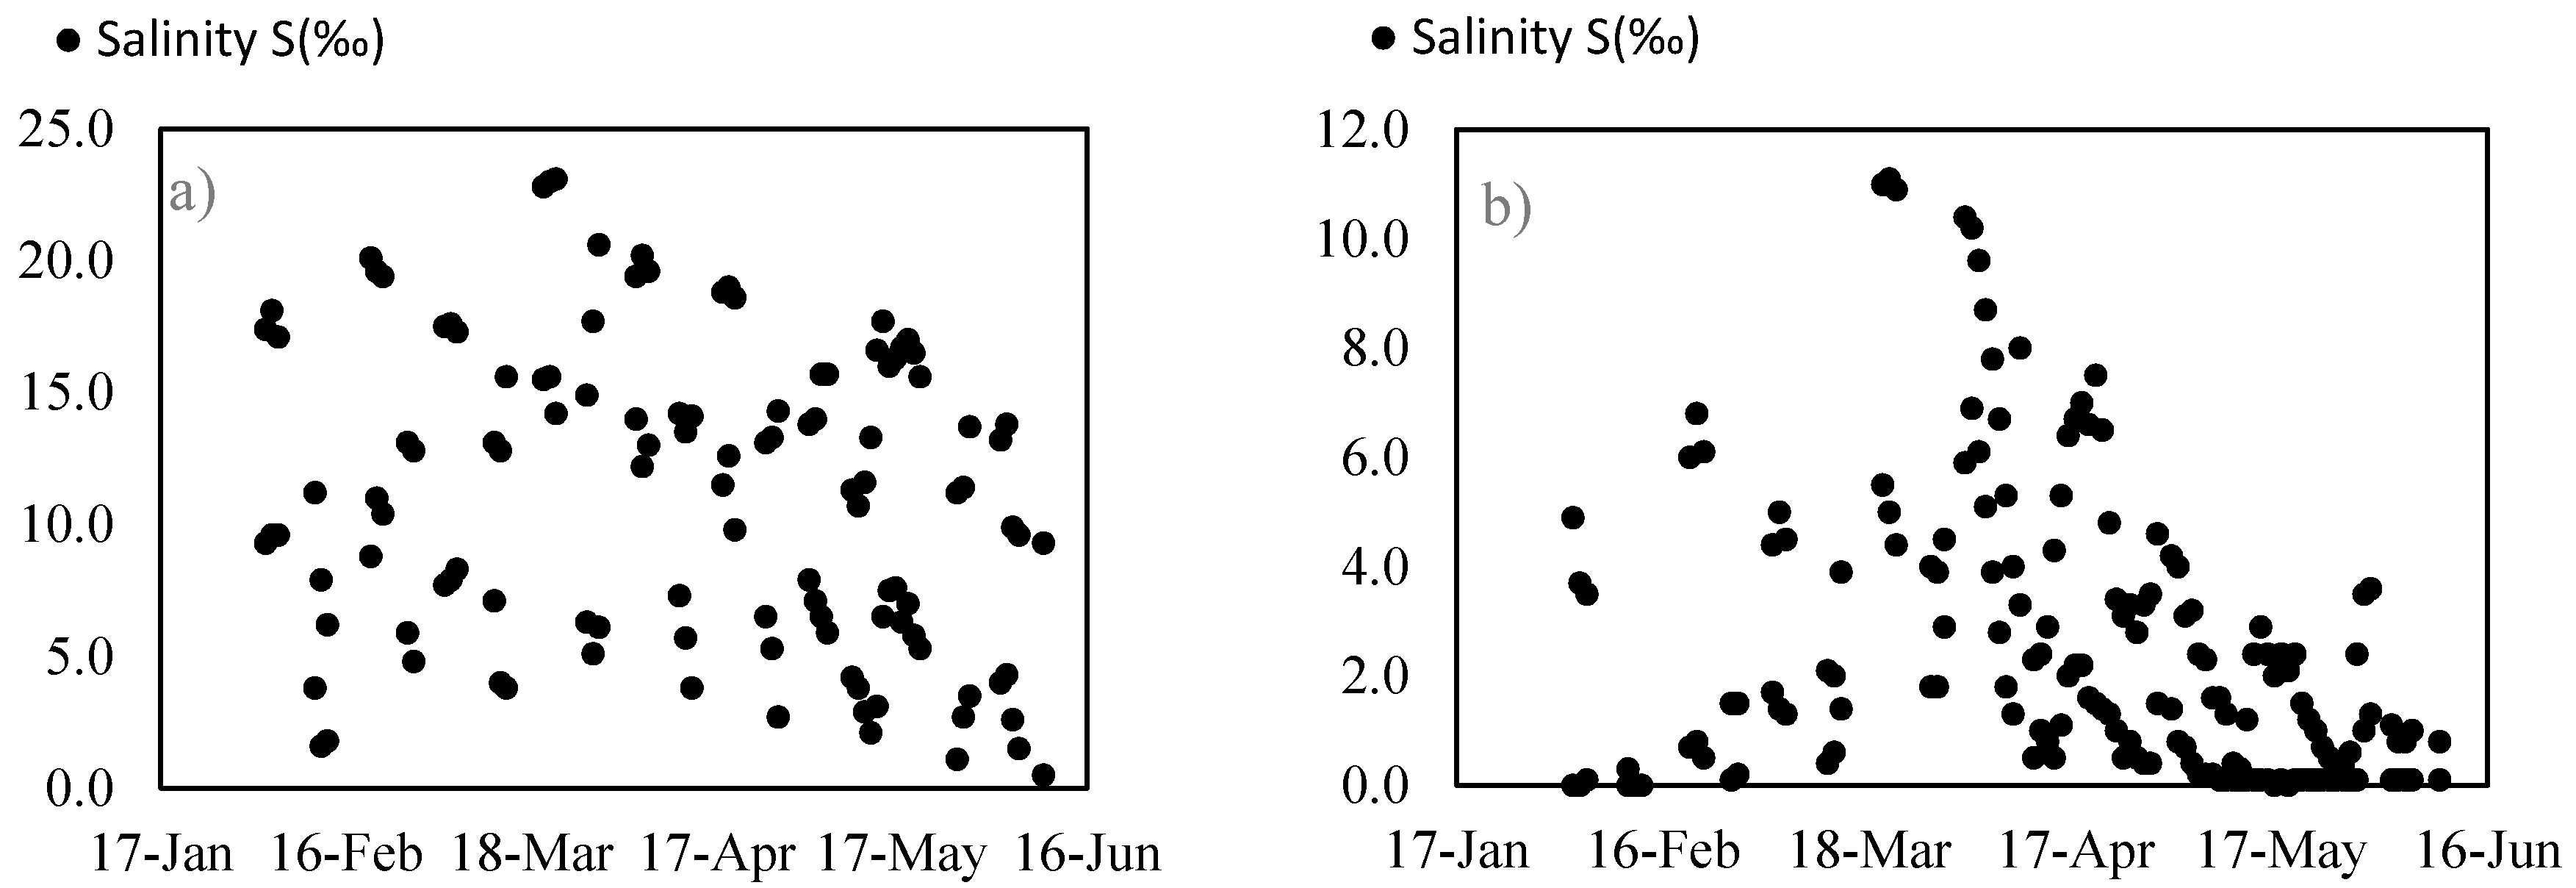
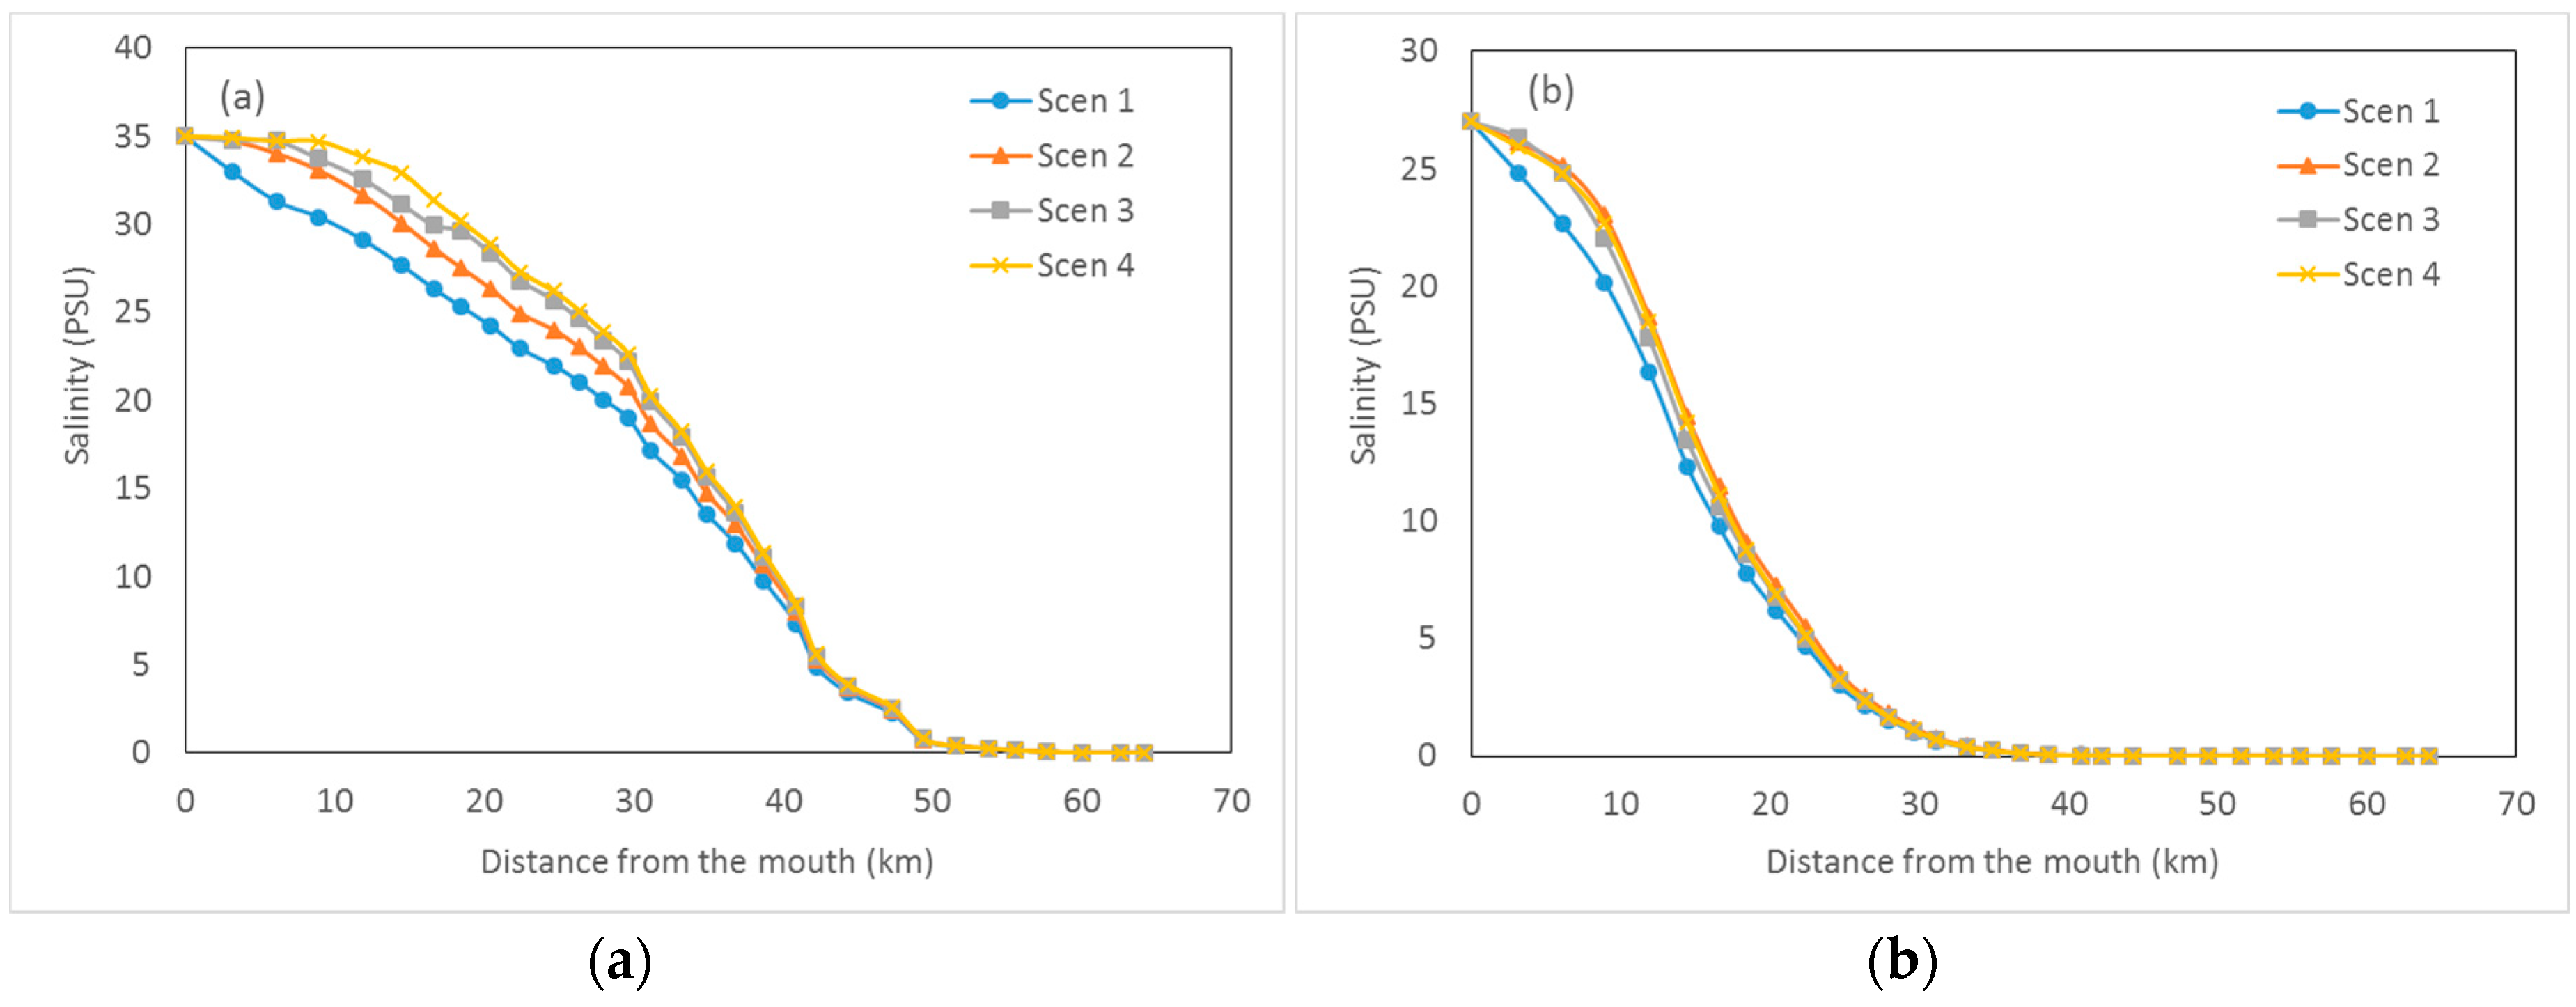
5.1. Changes in Salinity Intrusion
5.2. Changes in Salinity Intrusion Length
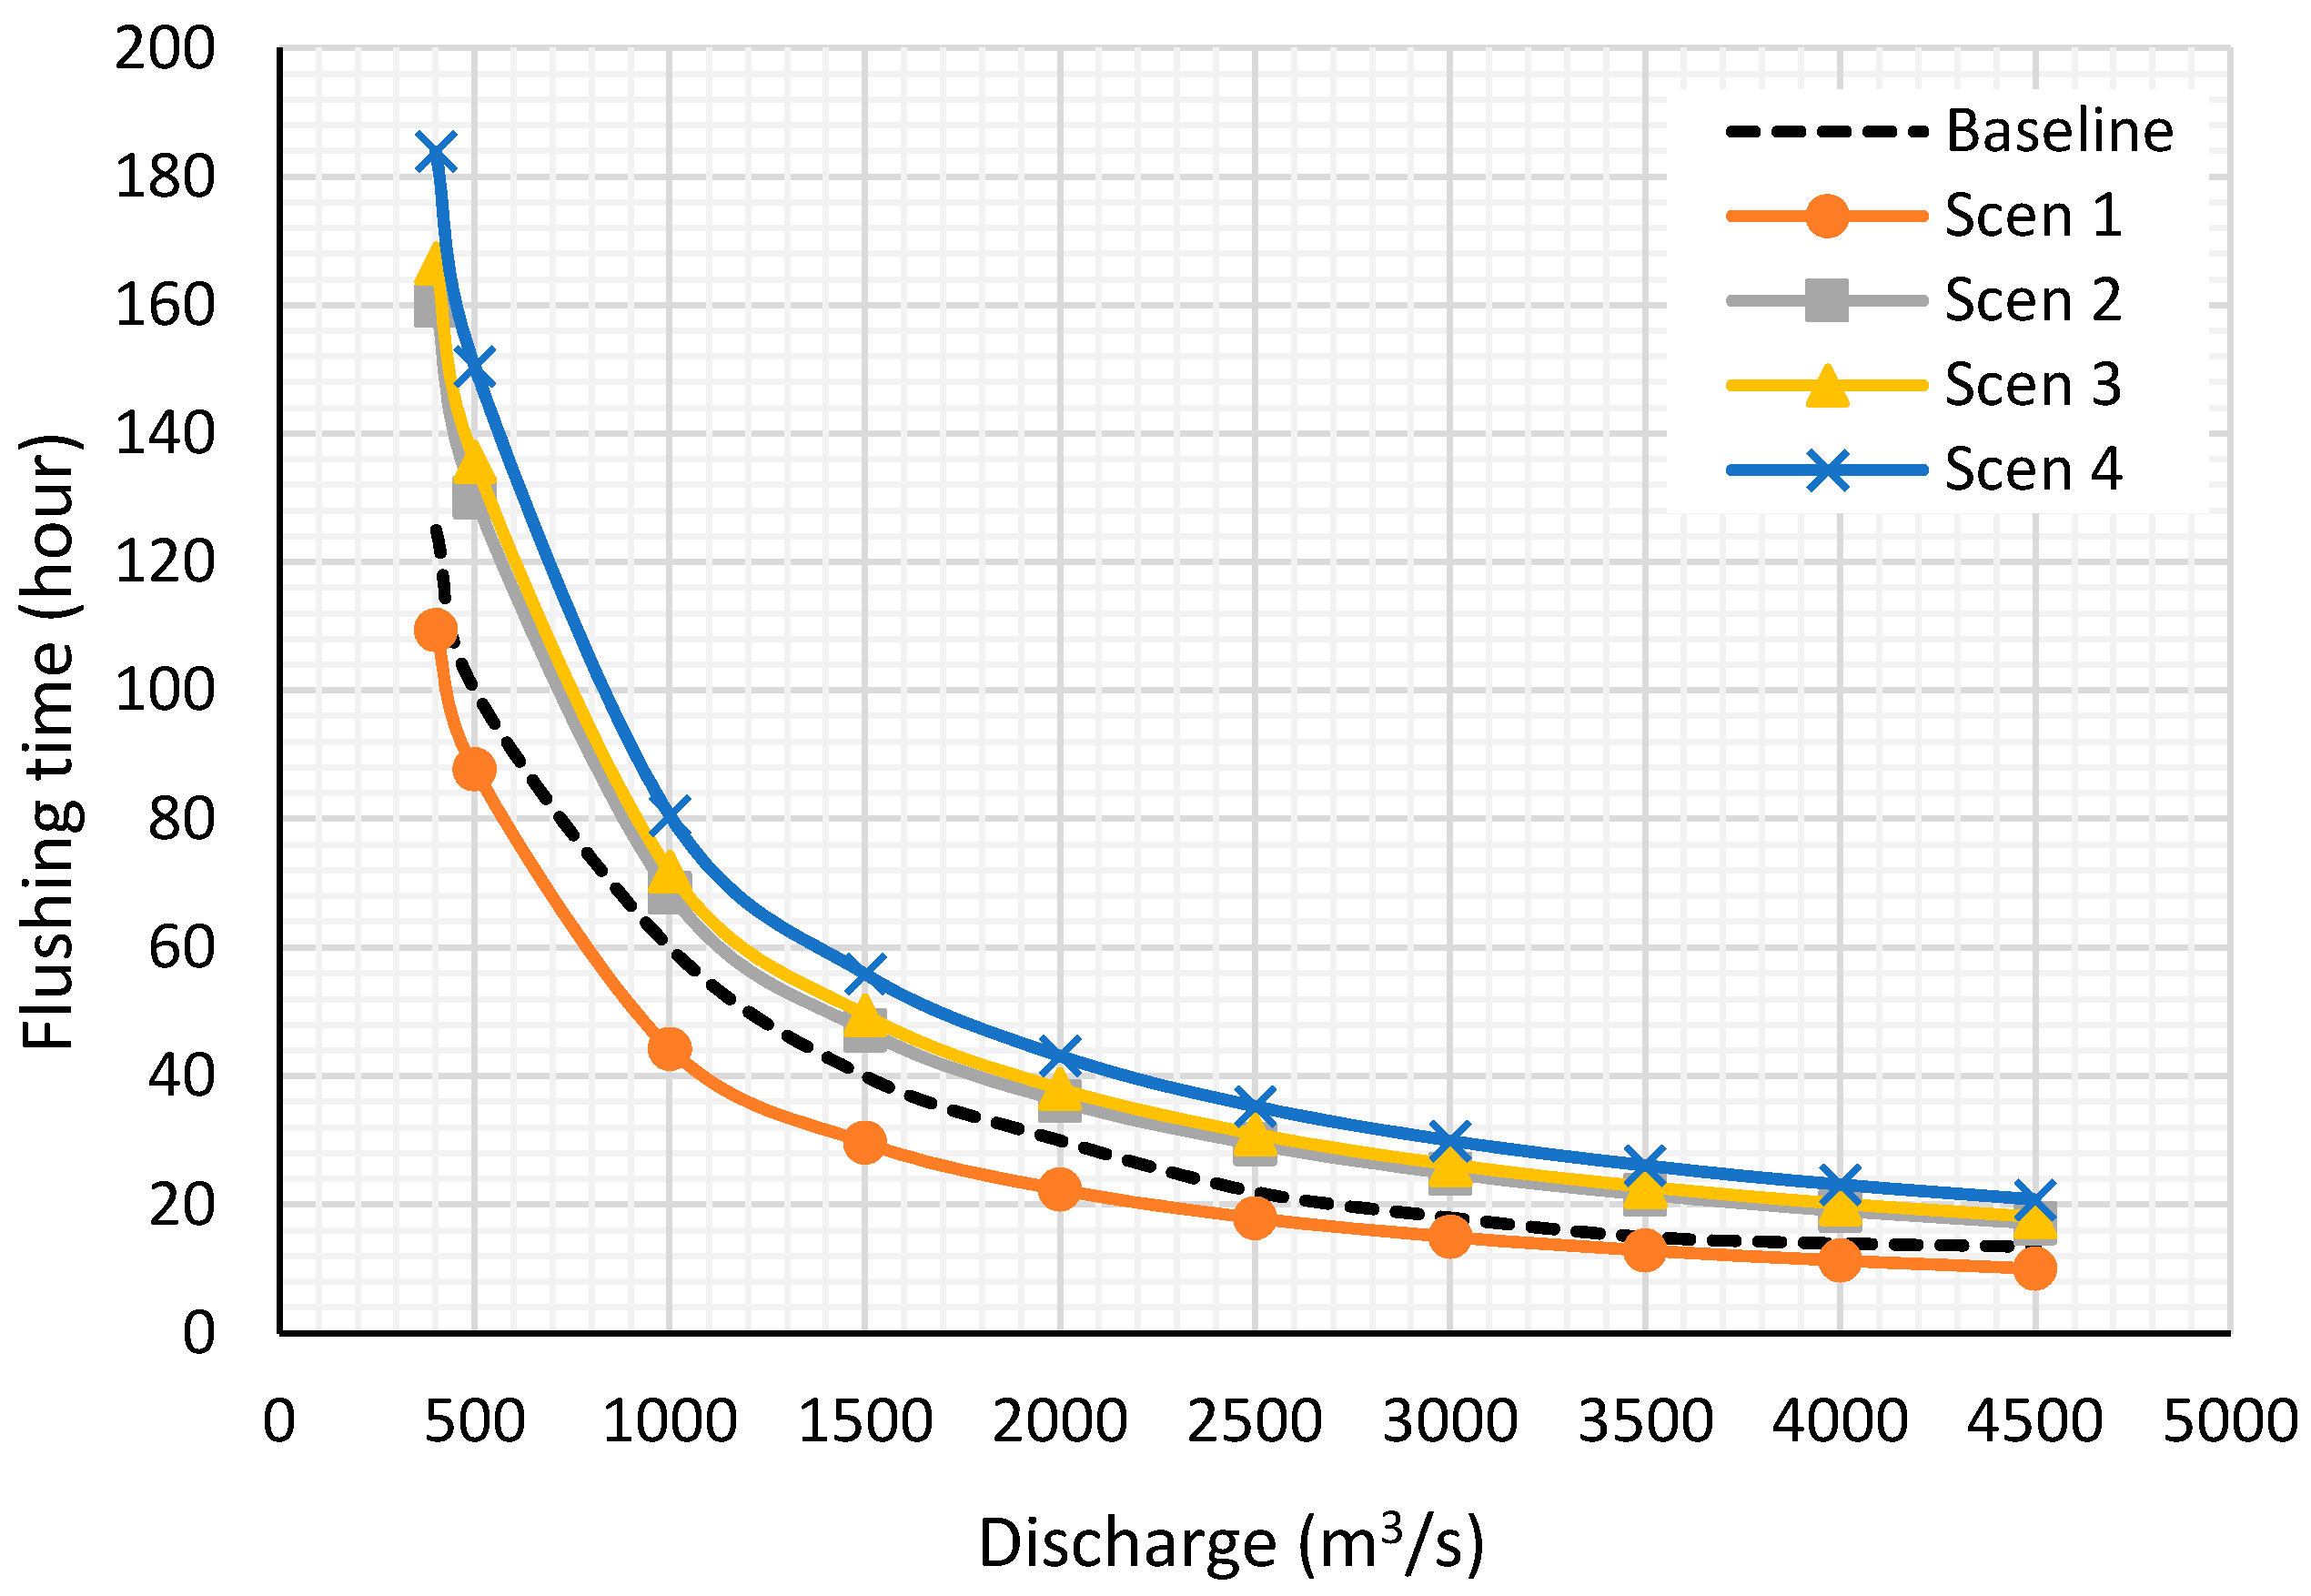
5.3. Changes in Flushing Time
5.4. Uncertainties, Limitations and Further Research
6. Conclusions
Author Contributions
Funding
Acknowledgments
Conflicts of Interest
References
- Gupta, A.D. Challenges and Opportunity for Integrated Water Resources Management in Mekong River Basin; Asian Institute of Technology: Bangkok, Thailand, 2005. [Google Scholar]
- World Bank. The Impact of Sea Level Rise on Developing Countries: A Comparative Analysis. World Bank Policy Research Working Paper 4136. 2007. Available online: http://go.worldbank.org/775APZH5K0 (accessed on 15 March 2017).
- Todd, M.C.; Taylor, R.G.; Osborn, T.J.; Kingston, D.G.; Arnell, N.W.; Gosling, S.N. Uncertainty in climate change impacts on basin-scale freshwater resources—Preface to the special issue: The QUEST-GSI methodology and synthesis of results. Hydrol. Earth Syst. Sci. 2011, 15, 1035–1046. [Google Scholar] [CrossRef]
- Hoanh, C.T.; Jirayoot, K.; Lacombe, G.; Srinetr, V. Impacts of Climate Change and Development on Mekong Flow Regime, First Assessment—2009; MRC Technical Paper No. 29; Mekong River Commission: Vientiane, Laos, 2010. [Google Scholar]
- Kingston, D.G.; Thompson, J.R.; Kite, G. Uncertainty in climate change projection of discharge for the Mekong River Basin. Hydrol. Earth Syst. Sci. 2011, 15, 1459–1471. [Google Scholar] [CrossRef]
- Dasgupta, S.; Laplante, B.; Meisner, C.; Wheeler, D.; Yan, J. The Impact of Sea Level Rise on Developing Countries: A Comparative Analysis; World Bank Policy Research Working; The World Bank: Washington, DC, USA, 2007; p. 4136. [Google Scholar]
- ICEM. Strategic Environmental Assessment of Hydropower on the Mekong Mainstream—Final Report; Mekong River Commission: Vientiane, Laos, 2010. [Google Scholar]
- IPCC. Climate Change 2007: Synthesis Report Contribution of Working Groups I, II and III to the Fourth Assessment Report of the Intergovernmental Panel on Climate Change; IPCC: Geneva, Switzerland, 2007. [Google Scholar]
- Varis, O.; Kummu, M.; Salmivaara, A. Ten major rivers in monsoon Asia-Pacific: An assessment of vulnerability. Appl. Geogr. 2012, 32, 441–454. [Google Scholar] [CrossRef]
- Keskinen, M.; Chinvanno, S.; Kummu, M.; Nuorteva, P.; Snidvongs, A.; Varis, O.; Västilä, K. Climate change and water resources in the Lower Mekong River Basin: Putting adaptation into the context. J. Water Clim. Chang. 2010, 1, 103–117. [Google Scholar] [CrossRef]
- Lebel, L.; Garden, P.; Imamura, M. The politics of scale, position, and place in the governance of water resources in the Mekong Region. Ecol. Soc. 2005, 10. Available online: http://www.ecologyandsociety.org/vol10/iss2/art18/ (accessed on 10 February 2016). [CrossRef]
- Piman, T.; Lennaerts, T.; Southalack, P. Assessment of hydrological changes in the lower Mekong Basin from Basin-Wide development scenarios. Hydrol. Process. 2013, 27, 2115–2125. [Google Scholar] [CrossRef]
- Västilä, K.; Kummu, M.; Sangmanee, C.; Chinvanno, S. Modelling climate change impacts on the flood pulse in the Lower Mekong floodplains. J. Water Clim. Chang. 2010, 1, 67–86. [Google Scholar] [CrossRef]
- Dyer, K.R. Estuaries: A Physical Introduction, 2nd ed.; John Wiley and Sons Ltd.: Chichester, UK, 1997; 195p. [Google Scholar]
- Fei, Y.; Xu, L.; Du, P.; Guan, Q.; Kang, X.; Xiao, W. Analysis of characteristics of time-frequency correlations between runoff, tidal range and salinity in the Changjiang Estuary. Acta Oceanol. Sin. 2011, 30, 84–93. [Google Scholar] [CrossRef]
- Pritchard, D.W. Estuarine circulation patterns. Proc. Am. Soc. Civ. Eng. 1955, 81, 717. [Google Scholar]
- Cameron, W.M.; Pritchard, D.W. Estuaries, in the Sea: Ideas and Observations on Progress in the Study of the Seas. In The Composition of Sea-Water, Comparative and Descriptive Oceanography; Hill, M.N., Ed.; Wiley-Interscience: New York, NY, USA, 1963; Volume 2, pp. 306–324. [Google Scholar]
- Nijssen, B.; O’Donnell, G.M.; Hamlet, A.F.; Lettenmaier, D.P. Hydrologic Sensitivity of Global Rivers to Climate Change. Clim. Chang. 2001, 50, 143–175. [Google Scholar] [CrossRef]
- Hoanh, C.T.; Tuong, T.P.; Gallop, K.M.; Gowing, J.W.; Kam, S.P.; Khiem, N.T.; Phong, N.D. Livelihood impacts of water policy changes: Evidence from a coastal area of the Mekong River Delta. J. Water Policy 2003, 5, 475–488. [Google Scholar] [CrossRef]
- Khang, D.K.; Kotera, A.; Sakamoto, T.; Yokozawa, M. Sensitivity of Salinity Intrusion to Sea Level Rise and River Flow Change in Vietnamese Mekong Delta-Impacts on Availability of Irrigation Water for Rice Cropping. J. Agric. Meteorol. 2008, 64, 167–176. [Google Scholar] [CrossRef]
- Wassmann, R.; Hien, N.X.; Hoanh, C.T.; Tuong, T.P. Sea level rise affecting the Vietnamese Mekong Delta: Water elevation in the flood season and implications for rice production. Clim. Chang. 2004, 66, 89–107. [Google Scholar] [CrossRef]
- Le, T.V.H.; Nguyen, H.N.; Wolanski, E.; Tran, T.C.; Haruyama, S. The combined impact on the flooding in Vietnam's Mekong River delta of local man-made structures, sea level rise, and dams upstream in the river catchment. Estuar. Coast. Shelf Sci. 2007, 71, 110–116. [Google Scholar] [CrossRef]
- Dinh, N.Q.; Balica, S.; Popescu, I.; Jonoski, A. Climate change impact on flood hazard, vulnerability and risk of the Long Xuyen Quadrangle in the Mekong Delta. Int. J. River Basin Manag. 2012, 10, 103–120. [Google Scholar] [CrossRef]
- Dat., T.Q.; Kanchit, L.; Thares, S.; Trung, N.H. Modeling the influence of river discharge and sea level rise on salinity intrusion in Mekong delta. Proceeding of the Environment Asia International Conference, Bangkok, Thailand, 22–25 March 2011. [Google Scholar]
- Duong, T.A.; Hoang, P.L.; Bui, M.D.; Rutschmann, P. Modeling seasonal flows alterations in the Vietnamese Mekong Delta under upstream discharge changes, rainfall changes and sea level rise. J. River Basin Manag. 2018, in press. [Google Scholar]
- Van, P.D.T.; Popescu, I.; van Griensven, A.; Solomatine, D.P.; Trung, N.H.; Green, A. A study of the climate change impacts on fluvial flood propagation in the Vietnamese Mekong Delta. Hydrol. Earth Syst. Sci. 2012, 16, 4637–4649. [Google Scholar] [CrossRef]
- Tuan, L.A.; Hoanh, C.T.; Miller, F.; Sinh, B.T. Floods and salinity management in the Mekong delta, Vietnam. In Challenges to Sustainable Development in the Mekong Delta: Regional and National Policy Issues and Research Needs; Be, T.T., Sinh, B.T., Miller, F., Eds.; The Sustainable Mekong Research Network: Bangkok, Thailand, 2007; pp. 15–68. [Google Scholar]
- MRC. Overview of the Hydrology of the Mekong Basin, Tech. Rep; Mekong River Commission: Vientiane, Laos, 2005. [Google Scholar]
- Trung, N.H.; Tuan, L.A.; Trieu, T.T.; Bastakoti, R.; Lebel, L. Multi-level governance and adaptation to floods in the Mekong delta. In Governing the Mekong. Engaging in the Politics of Knowledge Centre; Daniel, R., Lebel, L., Manorom, K., Eds.; Strategic Information and Research Development: Petaling Jaya, Malaysia, 2013; pp. 111–126. [Google Scholar]
- De, N.N. Farmers, Agriculture and Rural Development in the Mekong Delta of Vietnam; Education Publishing House: Hanoi, Vietnam, 2005; pp. 50, 51, 58. [Google Scholar]
- Thoi, N.H.; Gupta, A.D. Assessment of Water Resources and Salinity Intrusion in the Mekong Delta. Water Int. 2001, 26, 86–95. [Google Scholar] [CrossRef]
- Nguyen, A.D.; Savenije, H.H. Salt intrusion in multi-channel estuaries: A case study in the Mekong Delta, Vietnam. Hydrol. Earth Syst. Sci. 2006, 10, 743–754. [Google Scholar] [CrossRef]
- Lenderink, G.; Buishand, A.; Deursen, W.V. Estimates of future discharges of the river Rhine using two scenario methodologies: Direct versus delta approach. Hydrol. Earth Syst. Sci. 2007, 11, 1145–1159. [Google Scholar] [CrossRef]
- Schmidli, J.; Frei, C.; Vidale, P.L. Downscaling from GCM precipitation: A benchmark for dynamical and statistical downscaling methods. Int. J. Clim. 2006, 26, 679–689. [Google Scholar] [CrossRef]
- Sennikovs, J.; Bethers, U. Statistical downscaling method of regional climate model results for hydrological modelling. In Proceedings of the 18th World IMACS/MODSIM Congress, Cairns, Australia, 13–17 July 2009; Available online: http://mssanz.org.au/modsim09 (accessed on 20 July 2017).
- Block, P.J.; Souza Filho, F.A.; Sun, L.; Kwon, H.H. A Streamflow Forecasting Framework using Multiple Climate and Hydrological Models. J. Am. Water Resour. Assoc. 2009, 45, 828–843. [Google Scholar] [CrossRef]
- Hoang, L.P.; Lauri, H.; Kummu, M.; Koponen, J.; van Vliet, M.T.H.; Supit, I.; Leemans, R.; Kabat, P.; Ludwig, F. Mekong River flow and hydrological extremes under climate change. Hydrol. Earth Syst. Sci. 2016, 20, 3027–3041. [Google Scholar] [CrossRef]
- Nguyen, C.T. Processes and Factors Controlling and Affecting the Retreat of Mangrove Shorelines in South Vietnam. Ph.D. Thesis, Kiel University, Kiel, Germany, 2012. [Google Scholar]
- Vinh, V.D.; Ouillon, S.; Van Thao, N.; Ngoc Tien, N. Numerical Simulations of Suspended Sediment Dynamics Due to Seasonal Forcing in the Mekong Coastal Area. Water 2016, 8, 255. [Google Scholar] [CrossRef]
- MARD. The Drought and Salinity Intrusion in the Mekong River Delta of Vietnam. Assessment Report. 2016. Available online: https://ccafs.cgiar.org/publications/ (accessed on 15 March 2018).
- Abbott, M.B.; Ionescu, F. On the numerical computation of nearly-horizontal flows. J. Hydraul. Res. 1967, 5, 97–117. [Google Scholar] [CrossRef]
- Shooshtari, M.M. Principles of Flow in Open Channels; Shahid Chamran University Press: Ahvaz, Iran, 2008; Volume 15, pp. 643–745. [Google Scholar]
- Dung, N.V.; Merz, B.; B´ardossy, A.; Thang, T.D.; Apel, H. Multi-objective automatic calibration of hydrodynamic models utilizing inundation maps and gauge data. Hydrol. Earth Syst. Sci. 2011, 15, 1339–1354. [Google Scholar] [CrossRef]
- Manh, N.V.; Dung, N.V.; Hung, N.N.; Merz, B.; Apel, H. Large-scale suspended sediment transport and sediment deposition in the Mekong Delta. Hydrol. Earth Syst. Sci. 2014, 18, 3033–3053. [Google Scholar] [CrossRef]
- DHI. Mike 21 Flow Model FM Hydrodynamic Module Scientific Documentation; DHI Water and Environment: Hørsholm, Denmark, 2007. [Google Scholar]
- Lambkin, D. A Review of the Bed Roughness Variable in MIKE 21 FLOW MODEL FM, Hydrodynamic (HD) and Sediment Transport (ST) Modules; University of Southampton: Southampton, UK, 2007. [Google Scholar]
- Soulsby, R.L. Dynamics of Marine Sand: A Manual for Practical Application; Thomas Telford: London, UK, 1997; ISBN 0-7277-2584-X. [Google Scholar]
- Lauri, H.; de Moel, H.; Ward, P.J.; Räsänen, T.A.; Keskinen, M.; Kummu, M. Future changes in Mekong River hydrology: Impact of climate change and reservoir operation on discharge. Hydrol. Earth Syst. Sci. 2012, 16, 4603–4619. [Google Scholar] [CrossRef]
- Thomson, A.; Calvin, K.; Smith, S.; Kyle, G.P.; Volke, A.; Patel, P.; Delgado-Arias, S.; Bond-Lamberty, B.; Wise, M.; Clarke, L.; et al. RCP4.5: A pathway for stabilization of radiative forcing by 2100. Clim. Chang. 2011, 109, 77–94. [Google Scholar] [CrossRef]
- MONRE. Climate Changes and Sea Level Rise Scenarios for Vietnam; Ministry Natural Resources Environment (Viet Nam): Hanoi, Vietnam, 2009; p. 34.
- Andersen, O.B. The ANDERSEN-2006 Global Empirical Ocean Tide Model. 2006. Available online: http://ebookbrowse.com/andersen-ag06-tide-pdf-d351826746 (accessed on 20 May 2018).
- Lauff, G.H. Lyered Sediments of Tidal Flats, Beaches; Shelf Bottoms of the North Sea Estuaries; Publication 83; American Association for the Advancement of Science: Washington, DC, USA, 1967. [Google Scholar]
- Smajgl, A.; Toan, T.Q.; Nhan, D.K.; Ward, J.; Trung, N.H.; Tri, L.Q.; Tri, V.P.D.; Vu, P.T. Responding to rising sea levels in the Mekong Delta. Nat. Clim. Chang. 2015, 5, 167–174. [Google Scholar] [CrossRef]
- Trieu, T.T.N.; Phong, N.T. The impact of climate change on salinity intrusion and Pangasius (Pangasianodon Hypophthalmus) farming in the Mekong Delta, Vietnam. Aquac. Int. 2014, 23, 523. [Google Scholar] [CrossRef]
- Bhuiyan, M.J.A.N.; Dutta, D. Assessing impacts of sea level rise on river salinity in the Gorai river network, Bangladesh. Estuar. Coast. Shelf Sci. 2012, 96, 219–227. [Google Scholar] [CrossRef]
- Nobi, N.; Gupta, A.D. Simulation of regional flow and salinity intrusion in an integrated stream-aquifer system in coastal region: Southwest region of Bangladesh. Groundwater 1997, 35, 786–796. [Google Scholar] [CrossRef]
- Oude Essink, G.H.P.; Van Baaren, E.S.; De Louw, P.G. Effects of climate change on coastal groundwater systems: A modeling study in The Netherlands. Water Resour. Res. 2010, 46, 76. [Google Scholar] [CrossRef]
- Van den Burgh, P. Ontwikkeling van een Methode voor het Voorspellen van Zoutverdelingen in Estuaria, Kanalen en Zeeen; Rijkwaterstaat: Assen, The Netherlands, 1972; pp. 10–72. (In Dutch) [Google Scholar]
- Savenije, H.H.G. Predictive model for salt intrusion in estuaries. J. Hydrol. 1993, 148, 203–218. [Google Scholar] [CrossRef]
- Prandle, D. Saline intrusion in partially mixed estuaries. Estuar. Coast. Shelf Sci. 2004, 59, 385–397. [Google Scholar] [CrossRef]
- Takagi, H.; Tsurudome, C.; Thao, N.D.; Anh, L.T.; Ty, T.V.; Tri, P.V.D. Ocean tide modelling for urban flood risk assessment in the Mekong Delta. Hydrol. Res. Lett. 2016, 10, 21–26. [Google Scholar] [CrossRef]
- Williams, B.L. Flushing time calculations for the Upper Waitemata Harbour, New Zealand. N. Z. J. Mar. Freshw. Res. 1986, 20, 455–465. [Google Scholar] [CrossRef]


| Model | Input Data | Observed | Projection |
|---|---|---|---|
| MIKE 11 | Precipitation | Daily precipitation from 7 stations (locations in Figure 1) Period: 1978–2011 Source: SRHMC | Projected precipitation based on downscaled and bias-corrected GCM simulations. Period: 2036–2065 Source: CMIP5 |
| River discharge at Kratie | Daily discharge data Period: 2010–2011 Source: MRC + SIWRR | NA | |
| River discharge in the Mekong Delta | Daily discharges and water levels at 10 stations (locations in Figure 1) Period: 2005–2011 Source: SIWRR | NA | |
| Sea water level and tides | Period: 2005–2011 Source: SIWRR | ||
| Hydraulic network | Period: 2005–2011 Source: SIWRR | ||
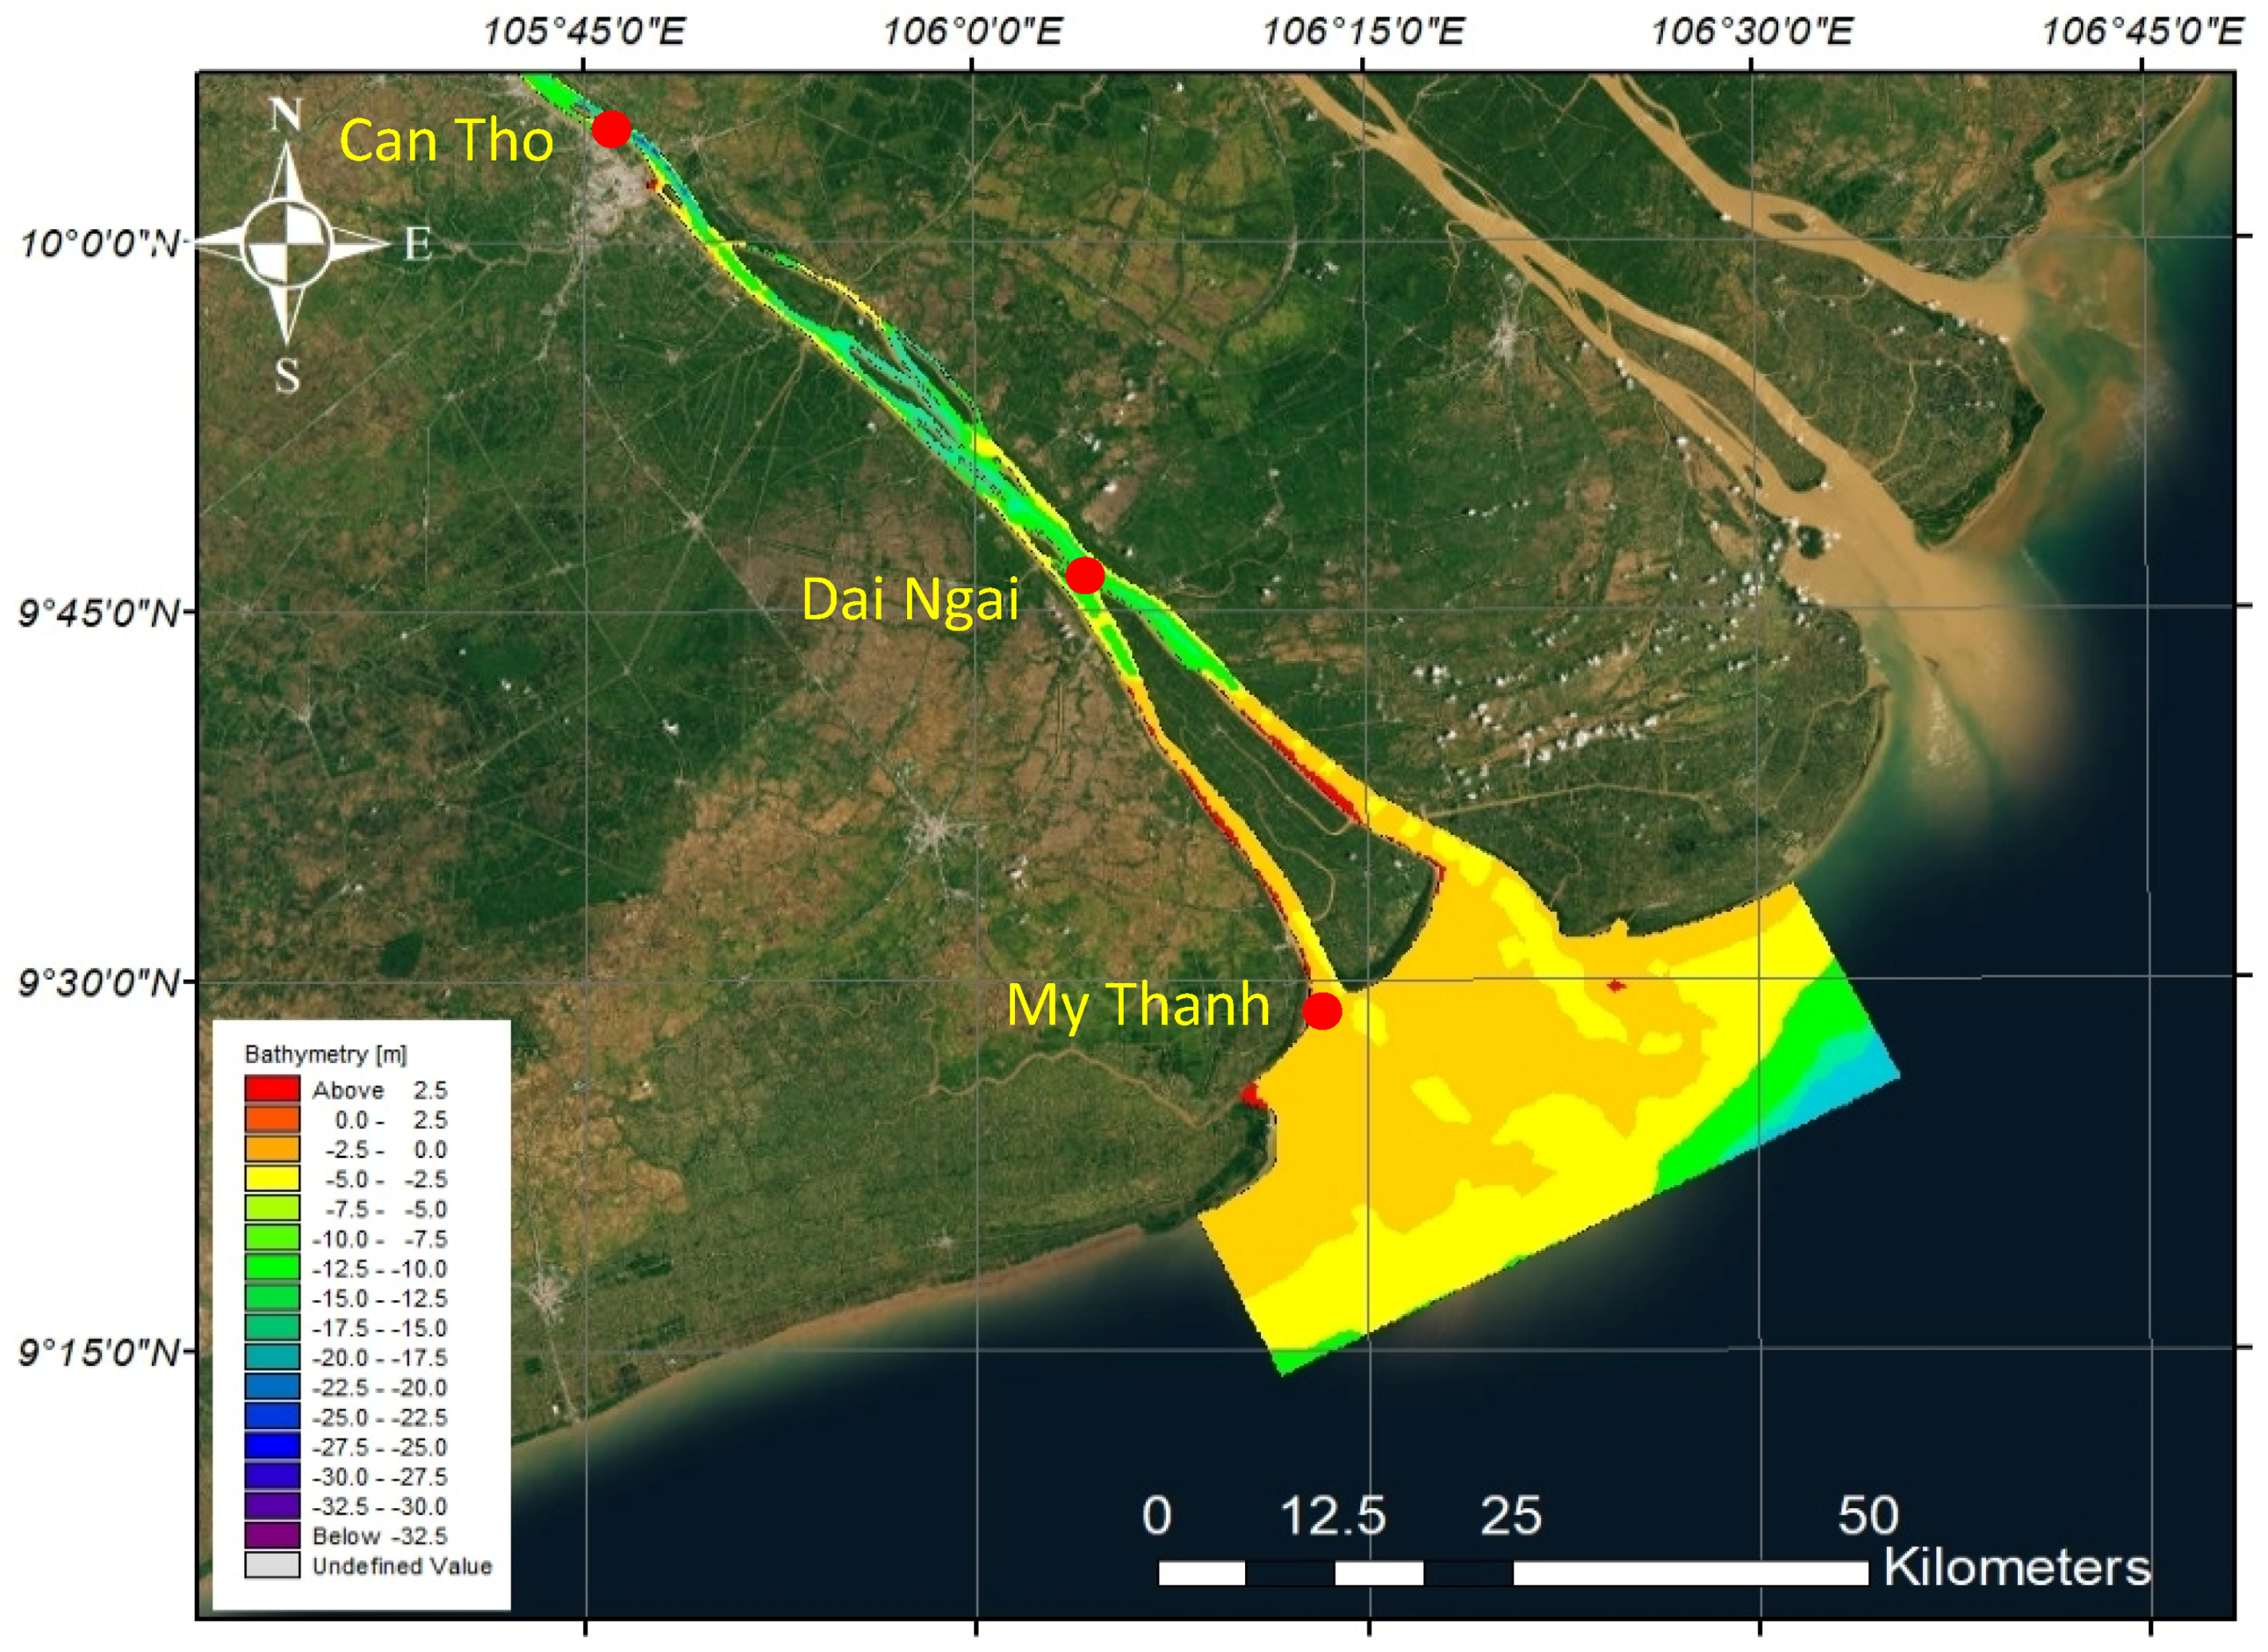
| MIKE 21 | Discharges at Can Tho | Hourly discharge Cali. Period 2011 Vali. Period 2010 Source: SRHMC + DHI | Future Period 2036–2065 |
| Tidal magnitudes | Period 2010–2011 Source: SRHMC + DHI | Future Period 2036–2065 | |
| Branches discharges | Five main channels/rivers connecting Hau river | ||
| Period 2010–2011 |
| General Circulation Model (GCM) | Abbreviation | Country | Spatial Resolution |
|---|---|---|---|
| ACCESS 1.0 | ACCESS | Australia | 1.25° × 1.875° |
| CCSM4 | CCSM4 | NCAR/USA | 0.94° ×1.25° |
| CSIRO-Mk 3.6 | CSIRO | Australia | 1.875° × 1.875° |
| HadGEM2-ES | HadGEM2 | Hadley/UK | 1.875° × 1.25° |
| MPI-ESM-LR | MPI | Germany | 1.875° × 1.875° |
| Month | Jan. | Feb. | Mar. | Apr. | May | June | July | Aug. | Sept. | Oct. | Nov. | Dec. |
|---|---|---|---|---|---|---|---|---|---|---|---|---|
| Dominant direction | NE | NE | E | SE | SE | SW | SW | SW | SW | NW | ENE | NE |
| Scenarios | Sea Level Rise (cm) | Changes Upstream Discharge | Precipitation Scenarios |
|---|---|---|---|
| Scen. 1 | 23 | +10% | RCP 4.5, 8.5 |
| Scen. 2 | 23 | −10% | RCP 4.5, 8.5 |
| Scen. 3 | 35 | −15% | RCP 4.5, 8.5 |
| Scen. 4 | 35 | −20% | RCP 4.5, 8.5 |
| Calibration (2011) | Validation (2010) | |||||
|---|---|---|---|---|---|---|
| Stations | Root Mean Square Error (RMSE) (m) | Mean Absolute Error (MAE) (m) | R | RMSE | MAE | R |
| My Thanh | 0.29 | 0.23 | 0.923 | 0.31 | 0.26 | 0.913 |
| Dai Ngai | 0.13 | 0.11 | 0.997 | 0.16 | 0.14 | 0.967 |
| Stations | Maximum and Minimum Salinity (Practical Salinity Units (PSU)) | |||||||
|---|---|---|---|---|---|---|---|---|
| Scenario 1 | Scenario 2 | Scenario 3 | Scenario 4 | |||||
| Maximum | Minimum | Maximum | Minimum | Maximum | Minimum | Maximum | Minimum | |
| Dai Ngai | 5.44 | 0.076 | 5.74 | 0.071 | 5.83 | 0.066 | 5.91 | 0.054 |
| (1st June) | ||||||||
| Tran De | 29.41 | 25.02 | 30.39 | 25.31 | 30.27 | 25.20 | 30.31 | 25.44 |
| (1st June) | ||||||||
| Scenarios | Distance from the Mouth (km) | |||
|---|---|---|---|---|
| Spring Tide | Neap Tide | |||
| 1.0 PSU | 4.0 PSU | 1.0 PSU | 4.0 PSU | |
| Baseline | 45.26 | 41.46 | 25.49 | 20.13 |
| Scenario 1 | 48.55 | 43.58 | 29.85 | 22.03 |
| Scenario 2 | 49.13 | 44.05 | 30.44 | 23.01 |
| Scenario 3 | 49.16 | 44.17 | 30.07 | 22.48 |
| Scenario 4 | 49.18 | 44.27 | 30.14 | 22.59 |
| Scenarios | Relative Changes of Saline Intrusion (km) | |||
|---|---|---|---|---|
| Spring Tide | Neap Tide | |||
| 1.0 PSU | 4.0 PSU | 1.0 PSU | 4.0 PSU | |
| Scenario 1 | 3.29 | 2.12 | 4.36 | 1.90 |
| Scenario 2 | 3.87 | 2.59 | 4.95 | 2.88 |
| Scenario 3 | 3.90 | 2.71 | 4.58 | 2.35 |
| Scenario 4 | 3.92 | 2.81 | 4.65 | 2.46 |
© 2018 by the authors. Licensee MDPI, Basel, Switzerland. This article is an open access article distributed under the terms and conditions of the Creative Commons Attribution (CC BY) license (http://creativecommons.org/licenses/by/4.0/).
Share and Cite
Tran Anh, D.; Hoang, L.P.; Bui, M.D.; Rutschmann, P. Simulating Future Flows and Salinity Intrusion Using Combined One- and Two-Dimensional Hydrodynamic Modelling—The Case of Hau River, Vietnamese Mekong Delta. Water 2018, 10, 897. https://doi.org/10.3390/w10070897
Tran Anh D, Hoang LP, Bui MD, Rutschmann P. Simulating Future Flows and Salinity Intrusion Using Combined One- and Two-Dimensional Hydrodynamic Modelling—The Case of Hau River, Vietnamese Mekong Delta. Water. 2018; 10(7):897. https://doi.org/10.3390/w10070897
Chicago/Turabian StyleTran Anh, Duong, Long Phi Hoang, Minh Duc Bui, and Peter Rutschmann. 2018. "Simulating Future Flows and Salinity Intrusion Using Combined One- and Two-Dimensional Hydrodynamic Modelling—The Case of Hau River, Vietnamese Mekong Delta" Water 10, no. 7: 897. https://doi.org/10.3390/w10070897
APA StyleTran Anh, D., Hoang, L. P., Bui, M. D., & Rutschmann, P. (2018). Simulating Future Flows and Salinity Intrusion Using Combined One- and Two-Dimensional Hydrodynamic Modelling—The Case of Hau River, Vietnamese Mekong Delta. Water, 10(7), 897. https://doi.org/10.3390/w10070897