Article

Evaluating Structural, Chlorophyll-Based and Photochemical Indices to Detect Summer Maize Responses to Continuous Water Stress

1
Key Laboratory of Meteorological Disaster, Ministry of Education (KLME), Joint International Research Laboratory of Climate and Environment Change (ILCEC), Collaborative Innovation Center on Forecast and Evaluation of Meteorological Disasters (CIC-FEMD), Jiangsu Key Laboratory of Agricultural Meteorology, College of Applied Meteorology, Nanjing University of Information Science & Technology, Nanjing 210044, China
2
Department of Geosciences, University of Massachusetts-Amherst, Amherst, MA 01002, USA
3
Department of Disaster Management, Begum Rokeya University, Rangpur 5400, Bangladesh
4
Jiangsu Provincial Key Laboratory of Geographic Information Science and Technology, International Institute for Earth System Science, Nanjing University, Nanjing 210023, China
*
Authors to whom correspondence should be addressed.
These authors contributed equally to this work.
Water 2018, 10(4), 500; https://doi.org/10.3390/w10040500
Submission received: 14 March 2018 / Revised: 4 April 2018 / Accepted: 16 April 2018 / Published: 18 April 2018
(This article belongs to the Section Water Resources Management, Policy and Governance)

Abstract

:
This study evaluates the performance of structural, chlorophyll-based, and photochemical indices to detect maize water status and to assess production based on five years of field experiments (2013–2017) during the primary growth stages. We employed three categories of indicators, including water condition and productive and thermal indicators, to quantify the responses of summer maize under continuous water stress from drought to waterlogging conditions. Furthermore, we adopted several spectral indices to assess their sensitivity to three categories of metrics. The results showed the association is the best between the treatment level and Leaf Water Content (LWC). The waterlogging treatment influenced Leaf Water Potential (LWP) in moderate drought stress. Severe drought stress caused the strongest reduction in productivity from both Leaf Area Index (LAI) and chlorophyll content. In terms of sensitivity of various indices, red-edge-position (REP) was sensitive to maize water conditions LWP, LAI and chlorophyll content. Photochemical Reflectance Index (PRI) and Normalized Difference Vegetation Index (NDVI) were the most and second most sensitive indices to productive indicators, respectively. The results also showed that no indices were capable of capturing the information of Crop Water Stress Index (CWSI).

1. Introduction

Maize (Zea mays L.) is cultivated world-wide, and its yield ranks second after rice on the world crop production list. Maize is one of the most versatile crops and plays an important role in the food, economy, industry, and energy sectors. China is one of the highest maize-producing countries in the world, yielding 215.8 million tons in 2014, which contributed to 20% of the global maize production [1]. Despite these high yields, higher yields of maize will be needed in the next 50 years to overcome population expansion, as well as environmental and economic constraints [2]. Considering the genetic characteristics, maize is more sensitive to various environmental stresses under the background of climate change [3]. Under these stresses, a reduction in yield often occurs after the whole growth period [4]. Crop water status is heavily controlled by soil moisture, which is one of the most important environmental stresses in each growth period of maize. The excess (waterlogging stress) and shortage (drought stress) conditions of soil moisture inhibit healthy crop growth and eventually cause a reduction of yield. However, climate change is likely to accelerate the spatial patterns of droughts and floods and may increase the occurrence and magnitude of droughts and floods in the near future [5].
Vegetation indices based on crop spectral information offer an effective and rapid method to detect crop water status and assess productivity by a high-resolution remote sensing technique [6]. Various categories of vegetation indices have been proposed to capture different crop information in the last decade. The traditional index primarily focuses on one characteristic, the Normalized Difference Vegetation Index (NDVI), that can detect canopy characteristics. A NDVI value of 1 would mean densely vegetated area and −1 would mean little or no vegetation, theoretically. However, the NDVI will be saturated when the canopy is in a dense state and the NDVI value would not change even if the canopy got denser, since the red reflectance is almost unchanged, while the near-IR is increasing. In contrast, a sparse canopy cannot cover the background information, which leads to NDVI inaccuracy [7]. Another traditional index, the Renormalized Difference Vegetation Index (RDVI), optimized by Rondeaux et al. [8], uses a modification in the denominator of NDVI, which has been demonstrated to improve the index sensitivity and expand the density range of application [9].
The traditional vegetation indices were not capable of detecting photosynthetic pigment levels in most cases. In such cases, the chlorophyll-based indices were built. Kim et al. [10] proposed a Transformed Chlorophyll Absorption in Reflectance Index (TCARI) that reduced non-photosynthetic background noise when the chlorophyll concentration and absorbed photosynthetically active radiation were critically evaluated. The advantage of TCARI is that it alleviates the low Leaf Area Index (LAI) [8]. Furthermore, Haboudane et al. [11] integrated an index to form the TCARI/OSAVI, which normalized TCARI by the Optimized Soil-Adjusted Vegetation Index (OSAVI) for increasing sensitivity to chlorophyll content and minimizing background and LAI effects. Another widely used chlorophyll-based index is red-edge-position (REP), which is defined as the wavelength when the first derivative of the spectral reflectance between red and near-infrared (NIR) reaches its maximum, usually at approximately 720 nm. It has been extensively used to estimate chlorophyll content [12], crop yield [13], above ground nitrogen uptake [14], and stress conditions [15], as well as to reduce the influence of the sensor view angle, and varying soil and atmospheric conditions [16]. The REP can shift the outcome from the chlorophyll content. The REP shifts towards a shorter wavelength (blue-shift) when green vegetation density decreases, while it shifts towards a longer wavelength (red-shift) when green vegetation density increases [7]. The Triangular Vegetation Index (TVI) [17] is also widely used to assess the chlorophyll content in terms of the triangle area shaped by the peaks of red and near-infrared and the green valley from the reflectance curve. The valley of reflectance in red is caused by chlorophyll absorption, and the peak in the near-infrared band is caused by multi-reflection of the leaf tissue. Thus, the chlorophyll absorption and the leaf tissue abundance can increase the triangle area. Nevertheless, the TVI is a non-monotonic function of chlorophyll content. This index increases with chlorophyll content before it reaches the threshold, and the TVI decreases when the chlorophyll content increases [7].
Gamon et al. [18] presented a narrow-band index, the Photochemical Reflectance Index (PRI), based on the xanthophyll cycle pigment states. In addition, the PRI can effectively capture the information of emitted leaf fluorescence, photosynthesis, and many other physiological processes [19]. Although the applicability of PRI has been already demonstrated, there are still a number of existing barriers to prevent the further application of PRI, including background diversification (different soil types, moisture, and the other non-vegetation area) and the influence of atmospheric factors (illumination condition) [20].
Currently, most of the studies have concentrated on a single plant’s physiological and productive impacts from drought [21] to waterlogging [22] separately. However, it would be difficult to quantify the impact of both drought and waterlogging stresses on maize from previous research since the variety, soil type, and climate conditions may vary in different studies. Thus, the quantitative response of summer maize under continuous water stress levels from drought to waterlogging is still uncertain, showing a potential knowledge gap in the existing literature [23]. Furthermore, the applicability of various vegetation indices on detecting impacts of continuous water stress on summer maize has received more and more attention in recent decades [6,8,9,13]. In the present study, three categories of metrics including water condition indicators (Leaf Water Content (LWC) and Leaf Water Potential (LWP)), the productive indicators (LAI and chlorophyll content), and the thermal indicator (Crop Water Stress Index (CWSI)) were employed to quantify the responses of maize under continuous water levels, ranging from drought to waterlogging. Moreover, we assessed the performance of several spectral indices in this study, focusing on structural, chlorophyll-based and photochemical indices to detect maize water status and production condition. We also evaluated the performance of NDVI, RDVI, REP, TCARI/OSAVI (TO), TVI and PRI to detect each metric and decide the best indices for the different metrics by sensitivity analysis. The objectives of this study were to explore the responses of maize under continuous water stress levels from drought to waterlogging, to evaluate the relationship between maize responses, to investigate the operational use of different categories of vegetation indices to monitor water status and thermal condition and to assess productivity.

2. Materials and Methods

2.1. Site Description

Field experiments were conducted at an agro-meteorological experimental station of Nanjing University of Information Science and Technology (NUIST), Jiangsu province, China (32.0° N, 118.8° E) during the 2013–2015 maize growing seasons (Figure 1). The study area is located in the typical subtropical monsoon climate zone which is susceptible to extreme climate events [24].
A complete randomized plot design with four treatments repeated within three blocks was employed in this experiment. The size of each plot was 2.5 m × 2.5 m × 1.5 m that was isolated by reinforced cement concrete to prevent soil moisture lateral seepage. Forty seeds were planted in each plot into 5 rows and 8 columns, the row length was 2.5 m, the row space was approximately 0.42 m, and the place space was approximately 0.28 m. The maximum field capacity (FC) of all plots was up to 27.57% and the wilting humidity was 11.0%. The soil texture was mainly loamy clay with 26.1% clay content. The pH value of the soil was 6.1 ± 0.2. The content of organic carbon and total nitrogen were 19.4 g·kg−1 and 11.5 g·kg−1, respectively. All plots were covered under an auto-rain-shelter.
The seed type of maize was Jiangyu 403 and the soil moisture was controlled at approximately 80–90% FC for a healthy growth condition at the beginning stage. The four treatments were carried out from jointing completion to the end of the experiment by controlling soil moisture at four continuous levels: severe drought (W1, 56–60% FC), moderate drought (W2, 65–75% FC), well-watered (W3, 80–90% FC), and mild waterlogging (W4, 95–105% FC).
The meteorological conditions in three primary growth stages of maize (vegetative growth (ST1), reproductive stage (ST2) and maturity (ST3)) are demonstrated in Figure 2. The conventional meteorological data recorded by the automatic meteorological station and the radiation data were recorded at an agro-meteorological observation station. As shown in Figure 2a, it was observed that the temperature and net radiation reached the peak at the late vegetation growth stage in 2013, and later declined with fluctuation in other stages. Precipitation was evenly distributed in each stage, while most of the days were sunny. In 2014, the temperature and net radiation reached their peaks at the middle of the vegetation growth stage, and then showed a fluctuated decline in the maturity stage (Figure 2b). The precipitation was frequent during the late vegetative growth and the reproductive stages, while sunny days were less frequent in 2014 than in 2013 and 2015. In 2015, as Figure 2c, it is observed that the temperature and net radiation reached their peaks at the middle of the vegetation growth stage and showed a fluctuated decline in other stages. The precipitation was frequent during vegetative growth and the early maturity stages, while most of the days were sunny in 2015. In 2016 and 2017, as Figure 2d,e, the temperature and net radiation also reached their peaks at the middle of the vegetation growth stage and showed a fluctuated decline in other stages. The precipitation was mostly in the early vegetative growth stage and late maturity stage in 2016, but more frequently in 2017 the most precipitation came during the middle vegetative growth stage to the maturity stage.

2.2. Moisture Control and Field Measurements

The soil moisture monitoring and the irrigation were implemented automatically in this experiment. The soil moisture was monitored by moisture sensor (SMART, Sentek Sensor Technologies, Stepney, Australia) at depths of 10, 20, and 50 cm every 60 min at the center of each plot, which was collected by a data logger (CR1000 Measurement and Control System, Campbell Scientific, Logan, UT, USA) in order to manipulate the irrigation schedule and amount. The drip irrigation was implemented by PVC pipes with small holes connected with the data logger. At the same time, an oven-drying method was adopted manually at the same depths to calibrate the data sensor every 10 days during the experimental period (2013–2015).
The field measurements were carried out from 8:00 am to 17:00 pm on the observation days, which were chosen on sunny days during each growth stage. Considering the accuracy, the chlorophyll content was extracted by an ethyl alcohol method [26]. The LAI was measured by Plant Canopy Analyzer (LAI 2000, LI-COR Inc., Lincoln, NE, USA), once per observation. The LAI was measured at five locations inside the plot, four near the sides and one at the center, and then an average of the five measures represented the plot. The leaf water potential was measured by Dew Point Potential Meter (WP4, Decagon Devices Inc., ‎Pullman, WA‎, USA) every two hours on the observation day. Three representative flag leaves of each treatment were collected randomly for immediate water potential measurements to avoid the excised water loss. The LWC was calculated from fresh weight (W1) and dry weight (W2) from leaves, defined by the following formula [27]:
LWC = W 1 W 2 W 1 × 100 %
Hourly canopy temperature was measured symmetrically by a hand-held infrared thermometer with a 5° field of view (ST80, RAYTEK, Everett, WA, USA). Representative sun leaves in four corners and the center were selected and averaged to reduce errors. On the observation day, canopy reflectance was measured around 11 am with field spectroradiometers (Field Spec 3, ASD Inc., Longmont, CO, USA) when the wind speed was low. The sensor was set approximately 1 m above the canopy, with a 5° field of view. We were only able to measure the canopy reflectance in 2015–2017 due to limited availability of equipment.

2.3. Calculation of the CWSI

Idso et al. [28] presented a widely used temperature-based index, i.e., CWSI, which is given below:
CWSI = ( T c T a ) ( T c T a ) l l ( T c T a ) u l ( T c T a ) l l
where T c is the canopy temperature and T a is the air temperature. ( T c T a ) u l is the upper limit of canopy-air temperature difference, which represents a drought stress status with zero transpiration. ( T c T a ) l l is the lower limit of canopy-air temperature difference, which refers to the crop in non-stressed status with potential evaporation.
Two methods are used to calculate CWSI: The empirical and the theoretical models, which differ from each other in terms of calculating lower and upper limits. The empirical model is based on the non-stressed baseline, the linear relationship between air vapor pressure deficit (VPD) and canopy-air temperature difference. The lower and upper lines are shown as below:
( T c T a ) l l = A + B × V P D
( T c T a ) u l = A + B × V P G
where VPD is the vapor pressure deficit above the canopy, A and B represent empirical coefficients, and VPG is the difference between two saturation vapor pressures when air temperatures are T a and T a + A . The empirical model is based on assuming the canopy resistance, net radiation, wind speed, air temperature, and soil heat flux are constant in the significant observation time [29].
Jackson et al. [30] proposed a theoretical model based on one-layer canopy energy balance. The lower and upper lines are given as below:
( T c T a ) l l = r a ( R n G ) ρ C p γ ( 1 + r c p r a ) Δ + γ ( 1 + r c p r a ) V P D Δ + γ ( 1 + r c p r a )
( T c T a ) u l = r a ( R n G ) ρ C p
where r a is the aerodynamic resistance, R n is the net radiation, G is the soil heat flux, ρ is the air density, C p is the air specific heat, γ is the psychometric constant, Δ is the slope of the saturated vapor pressure to temperature curve, and r c p is the minimum canopy resistance.
In particular, r a and r c p can be computed by the following equations [29]:
r a = { ln ( z d z 0 ) 2 k 2 u w h e n   u > 2   m · s 1 4.72 ln ( z d z 0 ) 2 1 + 0.54 u w h e n   u 2   m · s 1
where z is the reference height, d is the zero-plane displacement, z 0 is the roughness, k is the Kalman constant by 0.41, u is the wind speed at the height of the reference, and
r c p ¯ = ρ C p A ( R n G ) ¯ ( 1 B γ + 1 1 + B Δ ¯ )
where A and B are the coefficients from the empirical model.
Ideally, the CWSI value is between zero and one. Zero stands for a well-watered status when the crop is under a non-stressed condition, and one stands for a total drought-stressed status when there is no water available for the crop transpiration. It is generally acknowledged that the theoretical model is more accurate than the empirical model [31]. For this reason, we adopted the theoretical model. We were only able to measure the CWSI in 2015, due to limited availability of equipment.

2.4. Structural, Chlorophyll-Based, and Physiological Indices

The spectral indices were calculated from reflectance of the corresponding wavelength. Several indices were employed to detect maize water status and assess production in this study.
Normalized Difference Vegetation Index:
NDVI = ( R 800 R 670 ) / ( R 800 + R 670 )
with a modification of NDVI to increase its sensitivity the Renormalized Difference Vegetation Index was developed as below:
RDVI = ( R 800 R 670 ) / ( R 800 + R 670 )
where R 670   and   R 800 are the reflectance at 670 nm and 800 nm, respectively.
Red edge refers to the region of rapid change in reflectance of vegetation in the near infrared range. According to the definition of REP (red edge position), the accuracy mainly depends on the spectral reflectance data resolution [32], and so we adopted the 4-point interpolation approach [33], which has a suitability for discontinuous spectral data. The 4-point approach in the study was developed as outlined below:
ρ i = ρ 1 + ρ 4 2
λ i = λ 2 + ( λ 3 λ 2 ) ρ i ρ 2 ρ 3 ρ 2
where ρ i is the reflectance at red edge position, λ i (red edge, inflected point), namely, λ 1 , λ 2 , λ 3 and λ 4 are wavelengths at 670, 700, 740 and 780 nm, respectively, and ρ 1 , ρ 2 , ρ 3 and ρ 4 are reflectance at wavelengths λ 1 , λ 2 , λ 3 and λ 4 , respectively. In this case, we also adopted another index, TCARI/OSAVI, based on the chlorophyll absorption that supposedly reduces the soil background effect, which refers to the TCARI normalized by OSAVI:
TCARI = 3 × [ ( R 700 R 670 ) 0.2 × ( R 700 R 550 ) × ( R 700 / R 670 ) ]
OSAVI = ( 1 + 0.16 ) × ( R 800 R 670 ) / ( R 800 + R 670 + 0.16 )
The red edge ratio index R700/R670 is sensitive to the chlorophyll absorption that forms a part of the TCARI index. The chlorophyll and leaf tissues related to the TVI were also employed. The TVI generally uses the reflectance at green, red, and Near-IR bands to represent the area of the triangle defined by the green peak and the chlorophyll absorption.
TVI = 120 ( R 750 R 550 ) 100 × ( R 670 R 550 ) 2
The PRI was calculated using the reflectance at 531 and 570 nm, in the following form, which was mainly driven by xanthophyll cycle activity:
PRI = ( R 570 R 531 ) / ( R 570 + R 531 )

2.5. Statistical Analysis

The sensitivity study was performed by correlation matrix analysis through OriginPro software (version 2016, OriginLab Co., Northampton, MA, USA). The significant differences between treatments were determined by one-way Analysis of Variance (ANOVA) followed by the Least-Significant Difference (LSD) test. All data were examined for assumptions of normality and we completed homogeneity tests before these analyses were carried out.

3. Results and Discussion

3.1. Water Condition Indicators

LWC and LWP are two direct plant water status indicators. The LWC is a direct indicator of leaves’ water content [34], as it reflects the absolute amount of water content. Furthermore, the LWC also has a direct influence on photosynthesis. Water potential is the potential energy of water per unit volume relative to pure water in the reference condition. The LWP is useful in describing water transport [35] and crop water states [36].
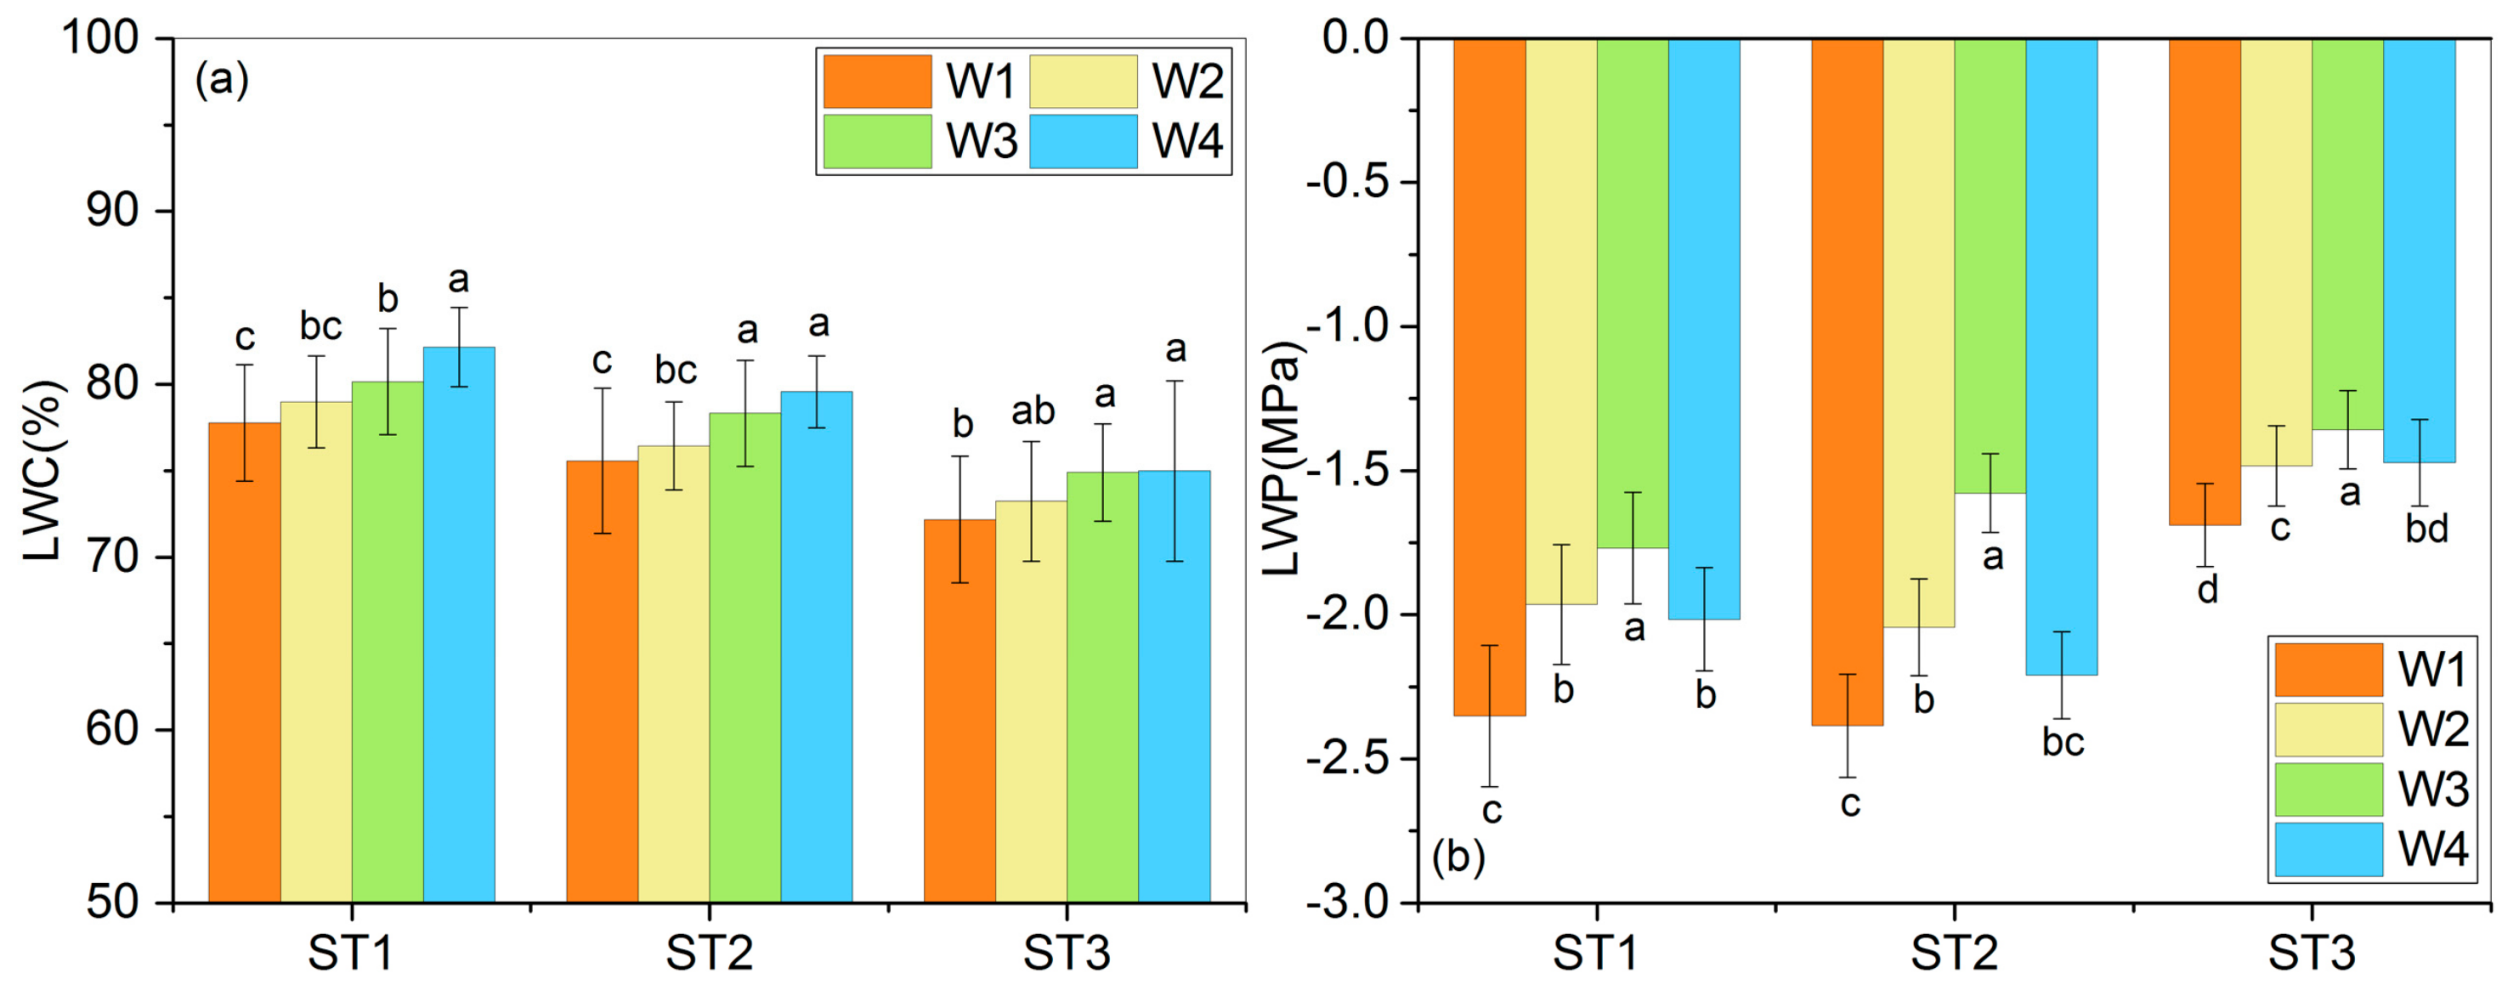
The distinct differences of LWC under different treatment levels are clearly identified in Figure 3a. The LWC under all treatments decreased from ST1 to ST3, even when the treatment remained at the same level. A recent study carried out by Wang et al. [37] reported the same observation and concluded that it is the outcome of the leaf senescence from ST1, ST2 to ST3 (the maturity stage). Moreover, the association is best between the treatment level and LWC in all growth stages. This finding revealed that the LWC could reflect the treatment level directly. Figure 3b provides the responses of LWP to different water stresses. The LWP decreases from ST1 to ST2 with a slight increase from ST2 to ST3 for W1, W2 and W4. The LWP showed a significantly increasing trend with the treatment level from W1 to W2 and subsequently to W3. This manifested LWP was able to indicate water state [31], and similar results are observed in other plants [31,38] under the drought stress. LWP in W4 (treatment 4) decreased significantly compared to W3 (treatment 3). This finding was in keeping with earlier research, with many scholars reporting that the LWP reduced under waterlogging treatment compared to under non-waterlogging treatment, owing to rapid stomatal closure when waterlogging occurred [39]. Moreover, this research revealed that the waterlogging treatment (W4) significantly influenced the LWP more than the moderate drought (W2), especially in ST3.

3.2. Productive Indicators

LAI and chlorophyll content are two productive indicators [40,41]. LAI is a dimensionless quantity that characterizes plant canopy morphology. The chlorophyll content is a key indicator of measures such as physiological status, photosynthetic capacity and stress conditions [42].
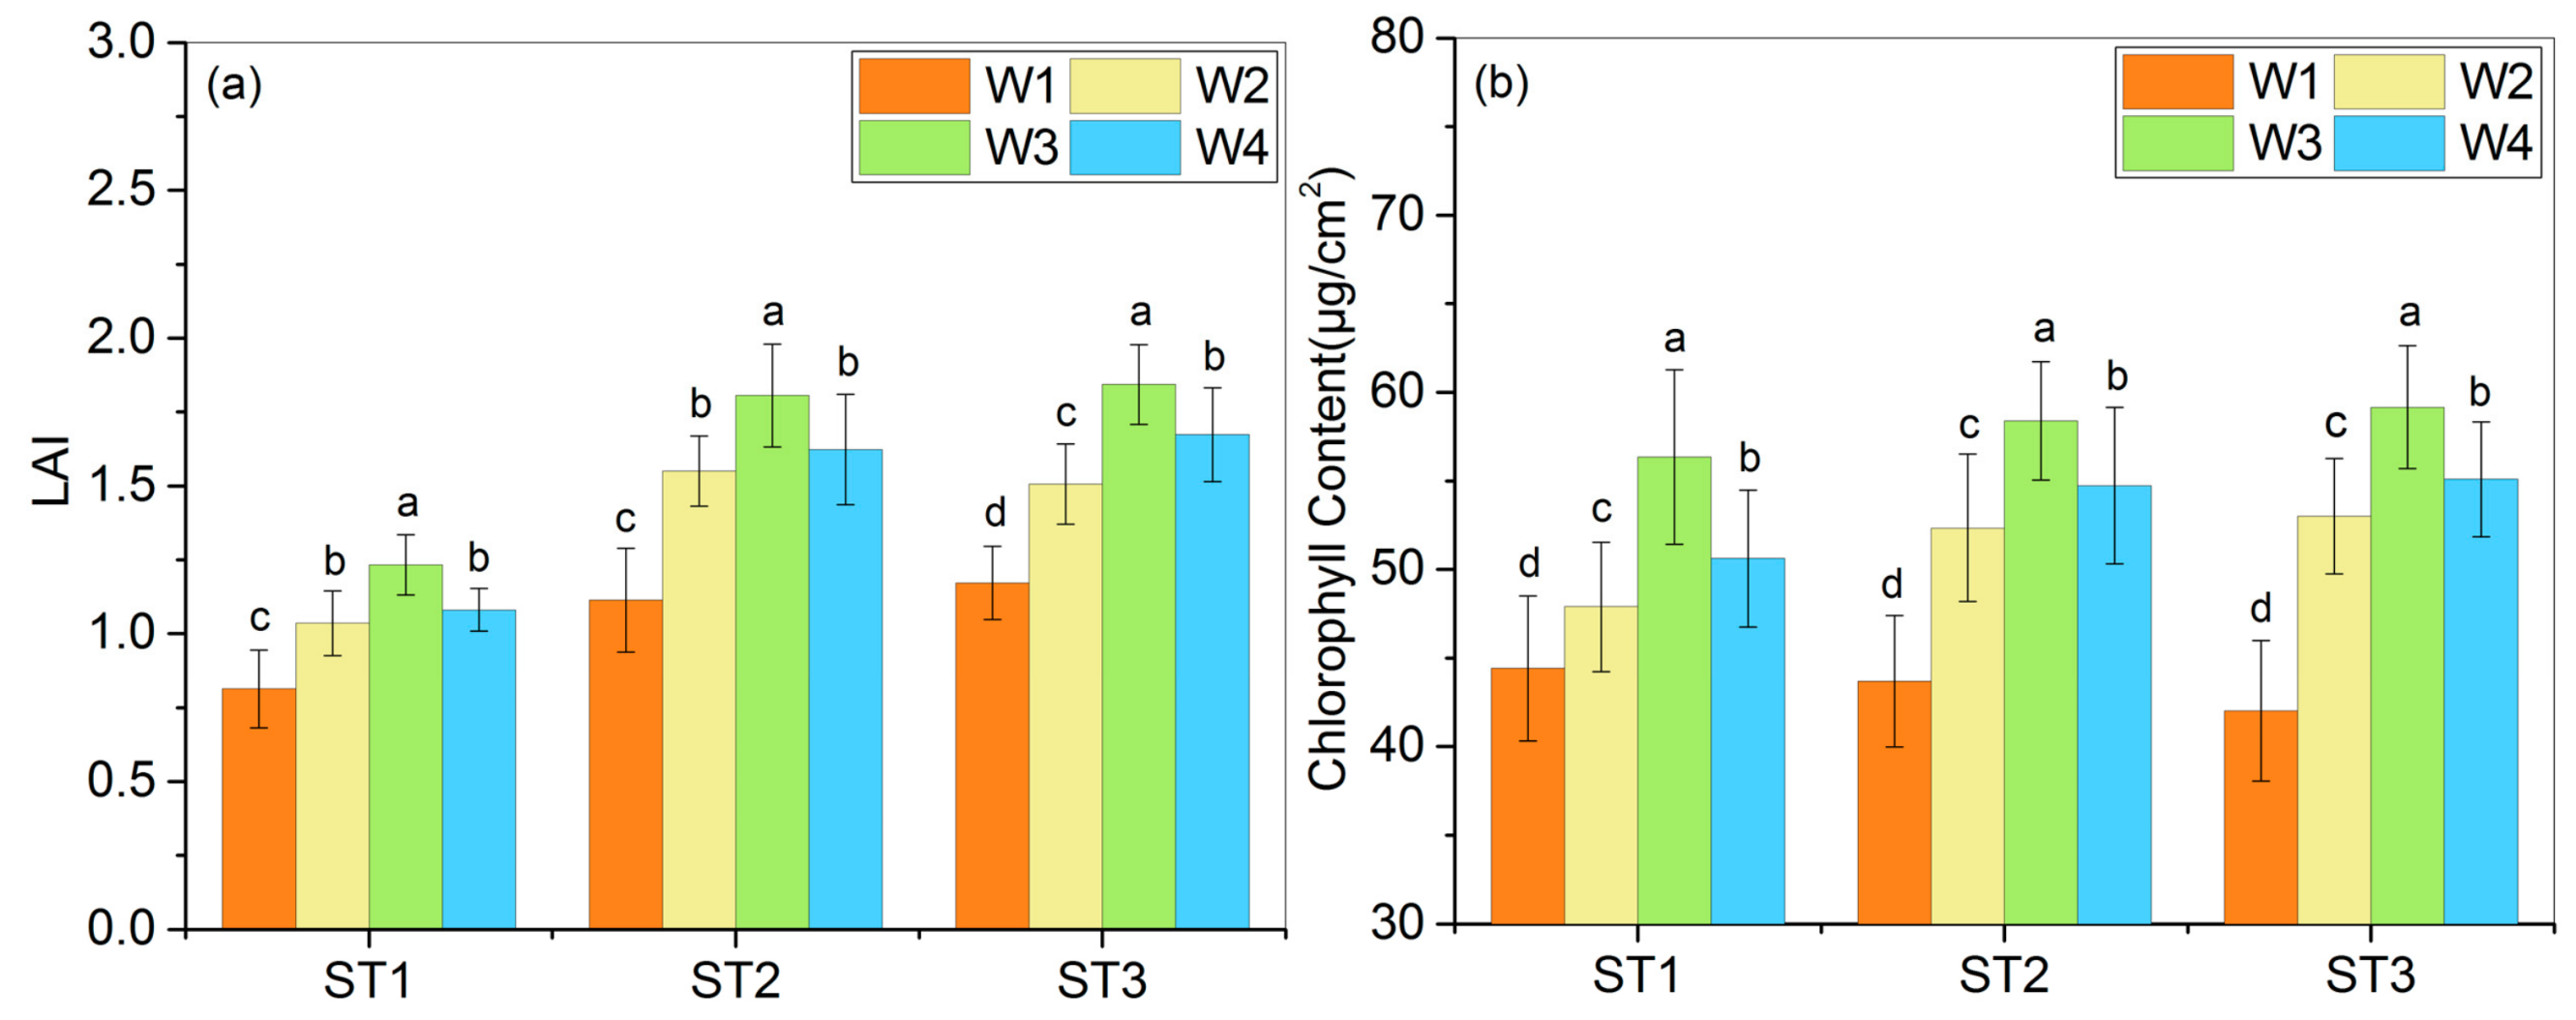
As observed in Figure 4a, the LAI showed an increasing trend from ST1 to ST2, which resulted in a high canopy expansion rate in the vegetation stage (ST1). The LAI changed slightly from ST2 to ST3, since the canopy reached the maximum expansion gradually and entered the senescence process among all treatments. This finding is in keeping with an earlier study [43]. The LAI presented a decreasing sequence from W3 to W4 and from W2 to W1 during ST2 and ST3. LAI in W1 was much lower than other water stresses, primarily because of heavy wilting, which was a result of the severe water stress. LAI in W4 was also significantly low compared to that of W3 due to the lodging caused by waterlogging. Jiang et al. [44] and Ren et al. [22] also obtained similar results. The differences of LAI between W2 and W3 were small but significant. This finding might be attributable to the summer maize in W2, which did not reach the wilting point. The results indicated that the moderate drought could cause more damage on summer maize productivity than waterlogging status compared with the LAI in W2 and W4 (Figure 4a). At the beginning of the stress treatment, i.e., ST1, the LAI showed an anomalous distribution, which may be caused by the delayed response of canopy on water content.
The chlorophyll content extracted by the ethyl alcohol method in this study is shown in Figure 4b. The chlorophyll content showed the following order: W3 > W4 > W2 > W1, during the whole growth period. The chlorophyll content of non-stressed treatment (W3) showed a gradually increasing tendency during the late vegetation stage (ST1) to maturity (ST3). The chlorophyll content of W3 was the highest and W1 was the lowest. The chlorophyll content of W2 and W4 treatments increased from ST1 to ST2 and increased slightly from ST2 to ST3. Meanwhile, the chlorophyll content decrease in W1 from ST2 to ST3 revealed that the severe drought mostly inhibited the maize growth. In addition, the moderate drought stress inhibited the chlorophyll content growth more than the waterlogging stress. It can be said that severe drought is a major constraint to crop production.
From the results of LAI and chlorophyll content, we could forecast that maize productivity in W1 would be the lowest and would be the highest in W3. Furthermore, maize productivity in W4 might be higher than that of W2, but the significance was controversial as the differences were not statistically significant in all three stages. Nevertheless, the water condition indicators LWC showed an association with the treatment level, while W4 showed a discrepancy of productivity (LAI and chlorophyll content). Combined with previous studies, this finding could be explained reasonably by the fact that the water content exceeded the demand for the plant. In turn, the waterlogging soil inhibited root respiration and photosynthetic rates, as well as stomata conductance [45], which eventually led to the reduction of productivity and crop yield [22].

3.3. Thermal Indicator

The CWSI is a complicated standard thermal indicator compared to LWP, LWC, LAI and chlorophyll content and it is widely used to monitor the crop water status and to schedule irrigation schemes [46].
The baseline is crucial for calculating CWSI, since it is susceptible to climatic conditions, soil type, crop growth state and other factors. Jensen et al. [47] observed that solar radiation would affect the canopy-air temperature difference when the crop was either in a well-watered or drought stressed condition. The temperature difference in a drought stress status could have a negative impact when solar radiation is weak, it could even be 8 °C in the well-watered status when solar radiation was strong. Zhao et al. [48] also mentioned that variations in soil fertilization could cause a reasonable difference in the low baseline and suggested that CWSI low baseline should be defined according to soil fertilization level. Testi et al. [49] indicated that the wind speed had an effect on the slope of the baseline. Therefore, it is necessary to build a specific baseline for this study. This baseline is not only an indicator of crop status but also an indispensable variable to calculate canopy resistance, which is used in the theoretical model. The baseline and other specific variables for the CWSI calculation are listed in the supplementary materials (see Supplementary Table S1 and Figure S1).
In accordance with spectral information, which was measured in 2015, the primary parameters for the CWSI calculation are listed in Table 1.
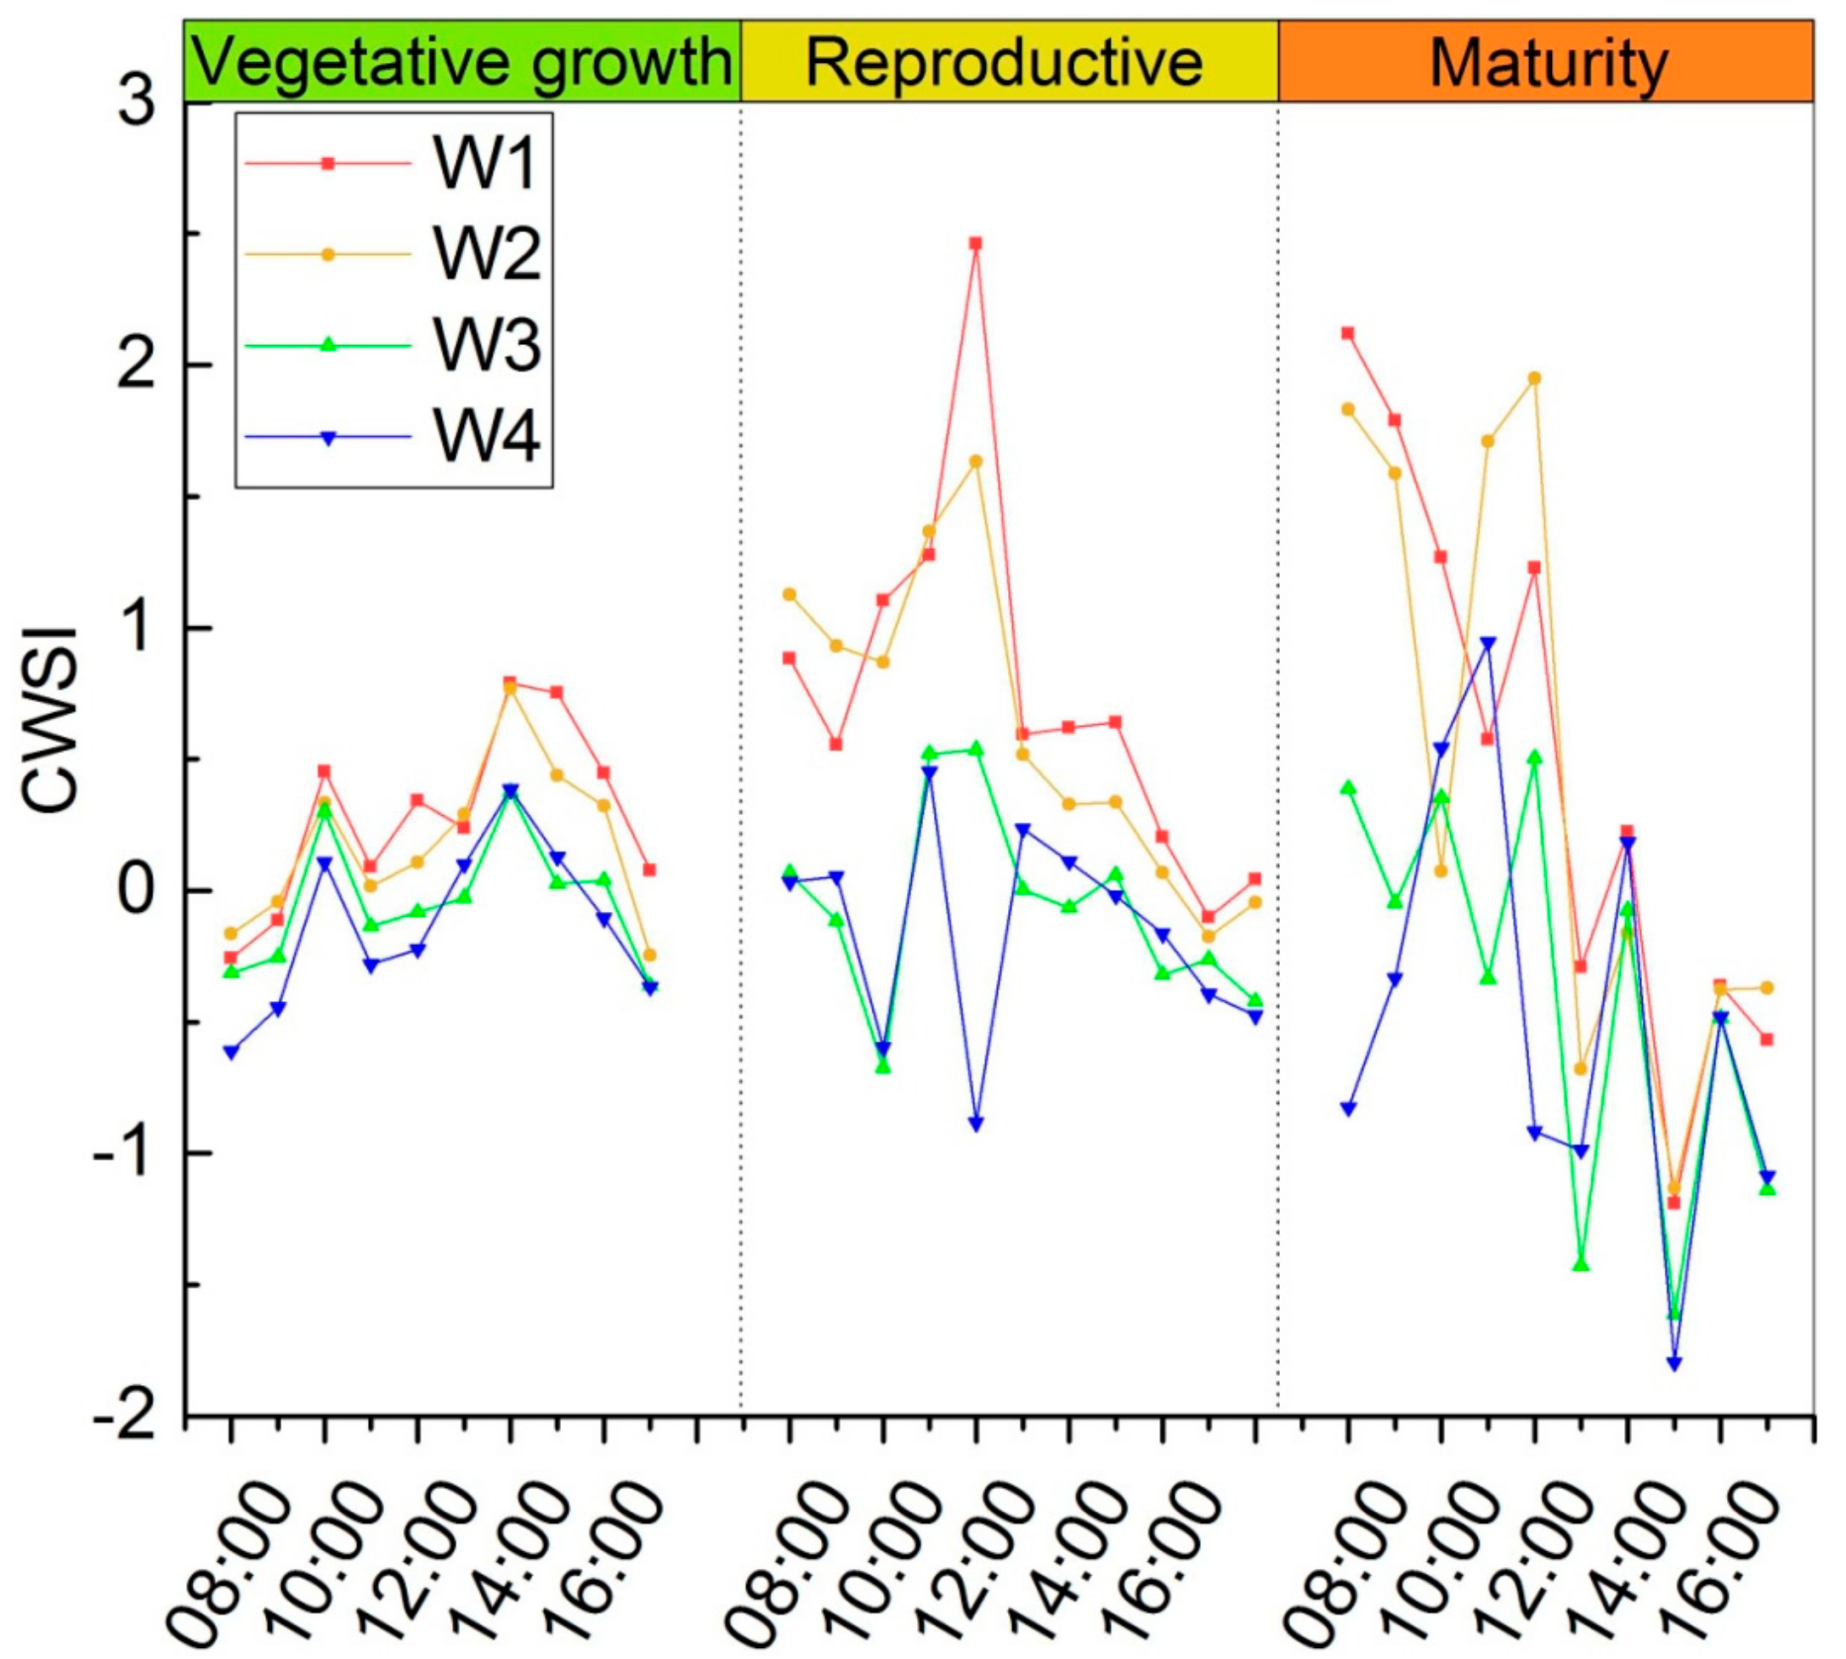
Finally, the hourly CWSI values from 08:00–17:00 were calculated through the theoretical model, as depicted in Figure 5. As shown in Figure 5, it was observed that the CWSI exhibited a general decrease tendency from W1 to W2 and W3 and subsequently to W4, which indicated that CWSI could accurately detect crop water status. The CWSI of W3, with an average of −0.17 varying up to approximately 0, testified that the W3 was in a non-stressed status. Meanwhile, the averaged CWSI of W4 was −0.26, lower than that of W3. This finding indicated that the negative CWSI could represent the waterlogging status. However, many variables were included in the calculation of the theoretical model. The uncertainty was inevitable, which could be responsible for the CWSI overflowing within a range of 0–1. Additionally, the daily CWSI values fluctuated with two peaks at approximately 10:00 and 14:00, especially in ST1 and ST2. This was the result of the plant mid-day depression effect, when the air temperature reached its peak at noon on hot and sunny days, leading to photosynthesis rate decrease and leaf stomata closure to reduce damage [50,51]. Since the mid-day effect is occurring as a plant’s self-protecting behavior, the plant is less stressed, resulting in the CWSI decrease. Furthermore, the CWSI were notably scattered among all treatments in ST3. This might be the result of distinctly different physiological characteristics [52] and the meteorological features in maturity stage. Thus, the difference in physiological characteristics could also be verified by r c p from Table 1.

3.4. Sensitivity Analysis of Spectral Indices to Three Categories of Metrics

The sensitivity analysis between spectral indices (NDVI, RDVI, REP, TO, TVI and PRI) and three categories of metrics, including the water indicators (LWC and LWP), the productive indicators (LAI and chlorophyll content), and the thermal indicator (CWSI) for each treatment at different growth stages is plotted in Figure 6.
Due to the different structural effects caused by continuous stress from drought to waterlogging, the relationship between NDVI and chlorophyll content was the most significant (Figure 6(a4), R = 0.65, p < 0.05). NDVI was also able to detect the LAI information effectively (Figure 6(a3), R = 0.64, p < 0.05). This finding revealed that the NDVI could give a reliable reference for productivity assessment, while the performance of RDVI was not as suitable as the NDVI. Although the RDVI performed better than the NDVI in some studies [53], these studies were based on the radiation transfer metrics or the field data without considering the waterlogging treatment. Therefore, the lower sensitivity of RDVI in our case could be explained reasonably by the waterlogging treatment introduced in this field experiment.
From the view of three chlorophyll based indices, TVI performed the best on LAI and chlorophyll content detection (Figure 6(e3,e4), both R = 0.57, p < 0.05). Moreover, REP showed good performance on LAI and chlorophyll content detection (Figure 6(c3), R = 0.43, p < 0.05 for LAI, Figure 6(c4), R = 0.53, p < 0.05 for chlorophyll content). REP also showed a significant correlation with LWP (Figure 6(c1), R = 0.46, p < 0.05). This result might imply REP was a more comprehensive index. TO was not sensitive to all indicators in our case. The sensitivity of TO and TVI to LWP remains a matter of debate. Ballester et al. [54] studied the capability of several spectral indices to detect water stress in five tree crop species and reported that the TO was significantly sensitive to the LWP in almond, lemon, and apricot but not in orange or peach. Moreover, Zarco-Tejada et al. [55] used high-resolution airborne imagery to investigate the water status in a citrus orchard and concluded that the correlation coefficient of TO against LWP was not significant, while TVI against LWP was highly significant. The non-significance of TO in this study suggested that different stress conditions might also influence the sensitivity of TO. While the TVI exhibited an optimal performance, the performance of TVI was less susceptible to different water stress conditions.
The results obtained by the relationship between PRI and water status and productivity indicators suggested that the PRI was sensitive to LAI and chlorophyll content (Figure 6(f3), R = −0.64, p < 0.05 for LAI and Figure 6(f4), R = −0.66, p < 0.05 for chlorophyll content), which indicated the PRI could be used for evaluating the productivity in this case. As an effective photochemical index, the PRI was closely related to diurnal xanthophyll cycle activity. This has drawn much attention recently [56,57]. It has been demonstrated in many studies [57,58] that the PRI is sensitive to canopy structural changes, especially in water stress conditions [59]. Furthermore, the PRI has also been used to predict yield [60].
It was observed that no indices could detect the thermal feature (CWSI) in this case. This might be because the spectral indices were not able to capture the thermal information when the waterlogging stress was taken into consideration. In addition, we employed the theoretical CWSI model in order to improve the result accuracy, more variables were involved in this calculation. However, this might bring the baseline shift according to the environmental condition and the plant physiological response, and then lead to uncertainties in the results [61,62]. Moreover, as mentioned above in Figure 5, the scattering in ST3 could be another reason that the information was not simply identified.

4. Conclusions

This study explored the responses of summer maize to continuous water stress by analyzing the water condition indicators, productive indicators, and the thermal indicators based on five years of field experiments. Further, the performance of structural, chlorophyll-based and photochemical indices was evaluated to detect maize water status and to assess maize production.
From the above analysis, the association is at best between the treatment level and LWC. The LWP showed an increasing trend with the treatment level from W1 to W2 and later to W3. The waterlogging treatment influenced LWP more than did the moderate drought. The severe drought caused the most reduction in productivity for both LAI and chlorophyll content. Furthermore, the maize productivity in W4 was higher than that of W2. Additionally, the CWSI detected maize water content effectively, especially in ST1 and ST2, but exhibited dispersion in ST3. Comparing the sensitivities of three different series of spectral indices based on various levels of drought and waterlogging stresses, the results revealed that REP was sensitive to maize water conditions LWP. Moreover, REP also showed good performance on LAI and chlorophyll content detection. It could be used as a comprehensive index for the detection of the stress condition. The PRI and NDVI were the most and second most sensitive indices to production indicators, respectively. The results also showed that no indices were capable in capturing the information of CWSI in this case. Furthermore, only the chlorophyll based index (REP) showed applicability to monitor the water status. All three categories of spectral indices could be used to evaluate productivity.

Supplementary Materials

The following are available online at https://www.mdpi.com/2073-4441/10/4/500/s1, Figure S1: The relationships exhibit between Tc Ta and VPD in the main growth stages during 2013–2015. Table S1: Roughness and zero-plane displacement.

Acknowledgments

Meng Li thanks the China Scholarship Council (NO. 201608320180) who provided the funding during a visit of Meng Li to University of Massachusetts, Amherst. This study is supported by the Postgraduate Research & Practice Innovation Program of Jiangsu Province (KYCX17_0885) and the China Special Fund for Meteorological Research in the Public Interest (GYHY201106043; GYHY201506001).

Author Contributions

Meng Li conceived the experiment(s), Meng Li, Ronghao Chu, and Shuren Chou conducted the experiment(s), and Meng Li and Qian Yu analyzed the results. All authors reviewed and revised the manuscript.

Conflicts of Interest

The authors declare no conflict of interest.

References

  1. Food and Agriculture Organization (FAO). FAOSTAT-Agriculture Database. 2014. Available online: http://faostat.fao.org/site/339/default.aspx (accessed on 8 July 2017).
  2. Zhang, F.; Cui, Z.; Fan, M.; Zhang, W.; Chen, X.; Jiang, R. Integrated soil-crop system management: Reducing environmental risk while increasing crop productivity and improving nutrient use efficiency in China. J. Environ. Qual. 2011, 40, 1051–1057. [Google Scholar] [CrossRef] [PubMed]
  3. Li, M.; Shen, S.; Lv, H.; Han, Y.; Chu, R.; Sha, X. Thermal resources and summer maize temperature suitability in the Huang-Huai-Hai region under future climate change. Trans. Atmos. Sci. 2016, 39, 391–399. [Google Scholar]
  4. Liu, Y.; Tang, B.; Zheng, Y.; Ma, K.; Xu, S.; Qiu, F. Screening methods for waterlogging tolerance at maize (Zea mays L.) seedling stage. Agric. Sci. China 2010, 9, 362–369. [Google Scholar] [CrossRef]
  5. Islam, A.R.M.; Shen, S.; Hu, Z.; Rahman, MA. Drought Hazard Evaluation in Boro Paddy Cultivated Areas of Western Bangladesh at Current and Future Climate Change Conditions. Adv. Meteorol. 2017, 2017. [Google Scholar] [CrossRef]
  6. Kross, A.; Mcnairn, H.; Lapen, D.; Sunohara, M.; Champagne, C. Assessment of RapidEye vegetation indices for estimation of leaf area index and biomass in corn and soybean crops. Int. J. Appl. Earth Obs. 2015, 34, 235–248. [Google Scholar] [CrossRef]
  7. Liang, S. Quantitative Remote Sensing of Land Surfaces; John Wiley & Sons, Inc.: Hoboken, NJ, USA, 2004. [Google Scholar]
  8. Rondeaux, G.; Steven, M.; Baret, F. Optimization of soil-adjusted vegetation indices. Remote Sens. Environ. 1996, 55, 95–107. [Google Scholar] [CrossRef]
  9. Dong, T.; Meng, J.; Shang, J.; Liu, J.; Wu, B. Evaluation of Chlorophyll-Related Vegetation Indices Using Simulated Sentinel-2 Data for Estimation of Crop Fraction of Absorbed Photosynthetically Active Radiation. IEEE J. Sel. Top. Appl. Earth Obs. Remote Sens. 2015, 8, 4049–4059. [Google Scholar] [CrossRef]
  10. Kim, M.S.; Daughtry, C.S.T.; Chappelle, E.W.; McMurtrey, J.E.; Walthall, C.L. The use of high spectral resolution bands for estimating absorbed photosynthetically active radiation (A par). In Proceedings of the 6th Symposium on Physical Measurements and Signatures in Remote Sensing, Val D’Isere, France, 17–21 January 1994; pp. 299–306. [Google Scholar]
  11. Haboudane, D.; Miller, J.R.; Tremblay, N.; Zarco-Tejada, P.J.; Dextraze, L. Integrated narrow-band vegetation indices for prediction of crop chlorophyll content for application to precision agriculture. Remote Sens. Environ. 2002, 81, 416–426. [Google Scholar] [CrossRef]
  12. Clevers, J.G.P.W.; Gitelson, A.A. Remote estimation of crop and grass chlorophyll and nitrogen content using red-edge bands on Sentinel-2 and-3. Int. J. Appl. Earth Obs. 2013, 23, 344–351. [Google Scholar] [CrossRef]
  13. Kanke, Y.; Tubaña, B.; Dalen, M.; Harrell, D. Evaluation of red and red-edge reflectance-based vegetation indices for rice biomass and grain yield prediction models in paddy fields. Precis. Agric. 2016, 17, 507–530. [Google Scholar] [CrossRef]
  14. Feng, W.; Guo, B.-B.; Zhang, H.-Y.; He, L.; Zhang, Y.-S.; Wang, Y.-H.; Zhu, Y.-J.; Guo, T.-C. Remote estimation of above ground nitrogen uptake during vegetative growth in winter wheat using hyperspectral red-edge ratio data. Field Crop. Res. 2015, 180, 197–206. [Google Scholar] [CrossRef]
  15. Das, P.K.; Choudhary, K.K.; Laxman, B.; Rao, S.V.C.K.; Seshasai, M.V.R. A modified linear extrapolation approach towards red edge position detection and stress monitoring of wheat crop using hyperspectral data. Int. J. Remote. Sens. 2014, 35, 1432–1449. [Google Scholar] [CrossRef]
  16. Cho, M.A.; Skidmore, A.; Corsi, F.; Wieren, S.E.V.; Sobhan, I. Estimation of green grass/herb biomass from airborne hyperspectral imagery using spectral indices and partial least squares regression. Int. J. Appl. Earth Obs. 2007, 9, 414–424. [Google Scholar] [CrossRef]
  17. Broge, N.H.; Leblanc, E. Comparing prediction power and stability of broadband and hyperspectral vegetation indices for estimation of green leaf area index and canopy chlorophyll density. Remote Sens. Environ. 2000, 76, 156–172. [Google Scholar] [CrossRef]
  18. Gamon, J.A.; Peñuelas, J.; Field, C.B. A narrow-wave band spectral index that tracks diurnal changes in photosynthetic efficiency. Remote Sens. Environ. 1992, 41, 35–44. [Google Scholar] [CrossRef]
  19. Chou, S.; Chen, J.M.; Yu, H.; Chen, B.; Zhang, X.; Croft, H.; Khalid, S.; Li, M.; Shi, Q. Canopy-Level Photochemical Reflectance Index from Hyperspectral Remote Sensing and Leaf-Level Non-Photochemical Quenching as Early Indicators of Water Stress in Maize. Remote Sens. 2017, 9, 794. [Google Scholar] [CrossRef]
  20. Hmimina, G.; Dufrêne, E.; Soudani, K. Relationship between photochemical reflectance index and leaf ecophysiological and biochemical parameters under two different water statuses: Towards a rapid and efficient correction method using real-time measurements. Plant Cell Environ. 2014, 37, 73–87. [Google Scholar] [CrossRef] [PubMed]
  21. Liu, F.; Shen, S.H.; Yang, B.Y.; Tao, S.L. Spectral Monitoring Model of Leaf /Canopy Stomatal Conductance in Maize under Different Soil Moisture Treatments. Chin. J. Agrometeorol. 2013, 34, 727–731. [Google Scholar]
  22. Ren, B.; Zhang, J.; Li, X.; Fan, X.; Dong, S.; Liu, P.; Zhao, B. Effects of waterlogging on the yield and growth of summer maize under field conditions. Can. J. Plant Sci. 2014, 94, 23–31. [Google Scholar] [CrossRef]
  23. Valliyodan, B.; Ye, H.; Song, L.; Murphy, M.; Grover Shannon, J.; Nguyen, H.T. Genetic diversity and genomic strategies for improving drought and waterlogging tolerance in soybeans. J. Exp. Bot. 2016, 68, 1835–1849. [Google Scholar] [CrossRef] [PubMed]
  24. Chu, R.; Li, M.; Shen, S.; Islam, A.R.M.T.; Cao, W.; Tao, S.; Gao, P. Changes in reference evapotranspiration and its contributing factors in Jiangsu, a major economic and agricultural province of eastern China. Water 2017, 9, 486. [Google Scholar] [CrossRef]
  25. Jarvis, A.; Reuter, H.I.; Nelson, A.; Guevara, E. Hole-Filled Seamless SRTM Data V4. 2008. Available online: http://srtm.csi.cgiar.org (accessed on 8 July 2017).
  26. Ritchie, R.J. Consistent sets of spectrophotometric chlorophyll equations for acetone, methanol and ethanol solvents. Photosynth. Res. 2006, 89, 27–41. [Google Scholar] [CrossRef] [PubMed]
  27. Huang, J.; Cheng, X. Agricultural Meteorological Observation Specification; China Meteorological Press: Beijing, China, 1993.
  28. Idso, S.B.; Jackson, R.D.; Pinter, P.J., Jr.; Reginato, R.J.; Hatfield, J.L. Normalizing the stress-degree-day parameter for environmental variability. Agric. Meteorol. 1981, 24, 45–55. [Google Scholar] [CrossRef]
  29. Yuan, G.; Luo, Y.; Tang, D.; Yu, Q.; Yu, L. Estimating Minimum Canopy Resistances of Winter Wheat at Different Development Stages. Acta Ecol. Sin. 2002, 22, 930–934. [Google Scholar]
  30. Jackson, R.D.; Idso, S.B.; Reginato, R.J.; Pinter, P. Canopy temperature as a crop water stress indicator. Water Resour. Res. 1981, 17, 1133–1138. [Google Scholar] [CrossRef]
  31. Wanjura, D.F.; Upchurch, D.R. Water status response of corn and cotton to altered irrigation. Irrig. Sci. 2002, 21, 45–55. [Google Scholar] [CrossRef]
  32. Clevers, J.G.P.W.; Jong, S.M.D.; Epema, G.F.; Meer, F.D.V.D.; Bakker, W.H.; Skidmore, A.K.; Scholte, K.H. Derivation of the red edge index using the MERIS standard band setting. Int. J. Remote. Sens. 2002, 23, 3169–3184. [Google Scholar] [CrossRef]
  33. Gilabert, M.A.; Gandía, S.; Meliá, J. Analyses of spectral-biophysical relationships for a corn canopy. Remote Sens. Environ. 1996, 55, 11–20. [Google Scholar] [CrossRef]
  34. Ceccato, P.; Flasse, S.; Tarantola, S.; Jacquemoud, S.; Grégoire, J.M. Detecting vegetation leaf water content using reflectance in the optical domain. Remote Sens. Environ. 2001, 77, 22–33. [Google Scholar] [CrossRef]
  35. Barcelo, J.; Poschenrieder, C.H. Cadmium-Induced Decrease of Water Stress Resistance in Bush Bean Plants (Phaseolus vulgaris L. cv. Contender) I. Effects of Cd on Water Potential, Relative Water Content, and Cell Wall Elasticity. J. Plant Physiol. 1986, 125, 17–25. [Google Scholar] [CrossRef]
  36. Williams, L.E.; Grimes, D.W.; Phene, C.J. The effects of applied water at various fractions of measured evapotranspiration on water relations and vegetative growth of Thompson Seedless grapevines. Irrig. Sci. 2010, 28, 221–232. [Google Scholar] [CrossRef]
  37. Wang, Q.; Zhou, G.; Ma, X. Responses of summer maize leaf water content and photosynthetic characteristics to consecutive drought with different intensities. Chin. J. Appl. Ecol. 2015, 34, 3111–3117. [Google Scholar]
  38. Ramírez, D.A.; Yactayo, W.; Rens, L.R.; Rolando, J.L.; Palacios, S.; Mendiburu, F.D.; Mares, V.; Barreda, C.; Loayza, H.; Monneveux, P.; et al. Defining biological thresholds associated to plant water status for monitoring water restriction effects: Stomatal conductance and photosynthesis recovery as key indicators in potato. Agric. Water Manag. 2016, 177, 369–378. [Google Scholar] [CrossRef]
  39. Ashraf, M. Habib-ur-Rehman Interactive effects of nitrate and long-term waterlogging on growth, water relations, and gaseous exchange properties of maize (Zea mays L.). Plant Sci. 1999, 144, 35–43. [Google Scholar] [CrossRef]
  40. Gitelson, A.A.; Vinã, A.S.; Verma, S.B.; Rundquist, D.C.; Arkebauer, T.J.; Keydan, G.; Leavitt, B.; Ciganda, V.; Burba, G.G.; Suyker, A.E. Relationship between gross primary production and chlorophyll content in crops: Implications for the synoptic monitoring of vegetation productivity. J. Geophys. Res.-Atmos. 2006, 111, 854–871. [Google Scholar] [CrossRef]
  41. Yin, X.; Lantinga, E.A.; Schapendonk, A.H.C.M.; Zhong, X. Some Quantitative Relationships between Leaf Area Index and Canopy Nitrogen Content and Distribution. Ann. Bot. 2003, 91, 893–903. [Google Scholar] [CrossRef] [PubMed]
  42. Curran, P.J.; Dungan, J.L.; Macler, B.A.; Plummer, S.E. The effect of a red leaf pigment on the relationship between red edge and chlorophyll concentratio. Remote Sens. Environ. 1991, 35, 69–76. [Google Scholar] [CrossRef]
  43. Gitelson, A.A.; Stark, R.; Grits, U.; Rundquist, D.; Kaufman, Y.; Derry, D. Vegetation and soil lines in visible spectral space: A concept and technique for remote estimation of vegetation fraction. Int. J. Remote Sens. 2002, 23, 2537–2562. [Google Scholar] [CrossRef]
  44. Jiang, D.; Tao, Q.; Zhang, G. Effect of waterlogging on senescence of flag leaf and root of wheat yangmai. Chin. J. Appl. Ecol. 2002, 13, 1519–1521. [Google Scholar]
  45. Huang, B.; Johnson, J.W.; Nesmith, S.; Bridges, D.C. Growth, physiological and anatomical responses of two wheat genotypes to waterlogging and nutrient supply. J. Exp. Bot. 1994, 45, 193–202. [Google Scholar] [CrossRef]
  46. Sezen, S.M.; Yazar, A.; Dasgan, Y.; Yucel, S.; Akyıldız, A.; Tekin, S.; Akhoundnejad, Y. Evaluation of crop water stress index (CWSI) for red pepper with drip and furrow irrigation under varying irrigation regimes. Agric. Water Manag. 2014, 143, 59–70. [Google Scholar] [CrossRef]
  47. Jensen, H.E.; Svendsen, H.; Jensen, S.E.; Mogensen, V.O. Canopy-air temperature of crops grown under different irrigation regimes in a temperate humid climate. Irrig. Sci. 1991, 11, 181–188. [Google Scholar] [CrossRef]
  48. Zhao, F.; Chen, J.; Zhang, H. Effect of nitrogen fertilization level on the low baseline of crop water stress index for summer maize in red soil. Chin. J. Agrometeorol. 2012, 33, 215–219. [Google Scholar]
  49. Testi, L.; Goldhamer, D.A.; Iniesta, F.; Salinas, M. Crop water stress index is a sensitive water stress indicator in pistachio trees. Irrig. Sci. 2008, 26, 395–405. [Google Scholar] [CrossRef]
  50. Ding, L.; Wang, K.J.; Jiang, G.M.; Li, Y.G.; Jiang, C.D.; Liu, M.Z.; Niu, S.L.; Peng, Y. Diurnal variation of gas exchange, chlorophyll fluorescence, and xanthophyll cycle components of maize hybrids released in different years. Photosynthetica 2006, 44, 26–31. [Google Scholar] [CrossRef]
  51. Leakey, A.D.B.; Bernacchi, C.J.; Dohleman, F.G.; Ort, D.R.; Long, S.P. Will photosynthesis of maize (Zea mays) in the US Corn Belt increase in future [CO2] rich atmospheres? An analysis of diurnal courses of CO2 uptake under free-air concentration enrichment (FACE). Glob. Chang. Biol. 2004, 10, 951–962. [Google Scholar] [CrossRef]
  52. Cui, X.; Xu, L.; Yuan, G.; Wang, W.; Luo, Y. Crop water stress index model for monitoring summer maize water stress based on canopy surface temperature. Trans. Chin. Soc. Agric. Eng. 2005, 21, 22–24. [Google Scholar]
  53. Roujean, J.L.; Breon, F.-M. Estimating PAR absorbed by vegetation from bidirectional reflectance measurements. Remote Sens. Environ. 1995, 51, 375–384. [Google Scholar] [CrossRef]
  54. Ballester, C.; Zarco-Tejada, P.J.; Nicola´s, E.; Alarco´n, J.J.; Fereres, E.; Intrigliolo, D.S.; Gonzalez-Dugo, V. Evaluating the performance of xanthophyll, chlorophyll and structure-sensitive spectral indices to detect water stress in five fruit tree species. Precis. Agric. 2018, 19, 178–193. [Google Scholar] [CrossRef]
  55. Zarco-Tejada, P.J.; González-Dugo, V.; Berni, J.A.J. Fluorescence, temperature and narrow-band indices acquired from a UAV platform for water stress detection using a micro-hyperspectral imager and a thermal camera. Remote Sens. Environ. 2012, 117, 322–337. [Google Scholar] [CrossRef]
  56. Wong, C.Y.S.; Gamon, J.A. Three causes of variation in the photochemical reflectance index (PRI) in evergreen conifers. New Phytol. 2015, 206, 187–195. [Google Scholar] [CrossRef] [PubMed]
  57. Hilker, T.; Hall, F.G.; Coops, N.C.; Collatz, J.G.; Black, T.A.; Tucker, C.J.; Sellers, P.J.; Grant, N. Remote sensing of transpiration and heat fluxes using multi-angle observations. Remote Sens. Environ. 2013, 137, 31–42. [Google Scholar] [CrossRef]
  58. Garbulsky, M.F.; Peñuelas, J.; Gamon, J.; Inoue, Y.; Filella, I. The photochemical reflectance index (PRI) and the remote sensing of leaf, canopy and ecosystem radiation use efficiencies: A review and meta-analysis. Remote Sens. Environ. 2011, 115, 281–297. [Google Scholar] [CrossRef]
  59. Peguero-Pina, J.J.; Morales, F.; Flexas, J.; Gil-Pelegrín, E.; Moya, I. Photochemistry, remotely sensed physiological reflectance index and de-epoxidation state of the xanthophyll cycle in Quercus coccifera under intense drought. Oecologia 2008, 156, 1–11. [Google Scholar] [CrossRef] [PubMed]
  60. Royo, C.; Aparicio, N.; Villegas, D.; Casadesus, J.; Monneveux, P.; Araus, J.L. Usefulness of spectral reflectance indices as durum wheat yield predictors under contrasting Mediterranean conditions. Int. J. Remote Sens. 2003, 24, 4403–4419. [Google Scholar] [CrossRef]
  61. Wanjura, D.F.; Upchurch, D.R. Canopy temperature characterizations of corn and cotton water status. Trans. ASAE 2000, 43, 867–875. [Google Scholar] [CrossRef]
  62. Alfaraj, A.; Meyer, G.E.; Horst, G.L. A crop water stress index for tall fescue (Festuca arundinacea Schreb.) irrigation decision-making-a fuzzy logic method. Comput. Electron. Agric. 2001, 31, 107–124. [Google Scholar] [CrossRef]
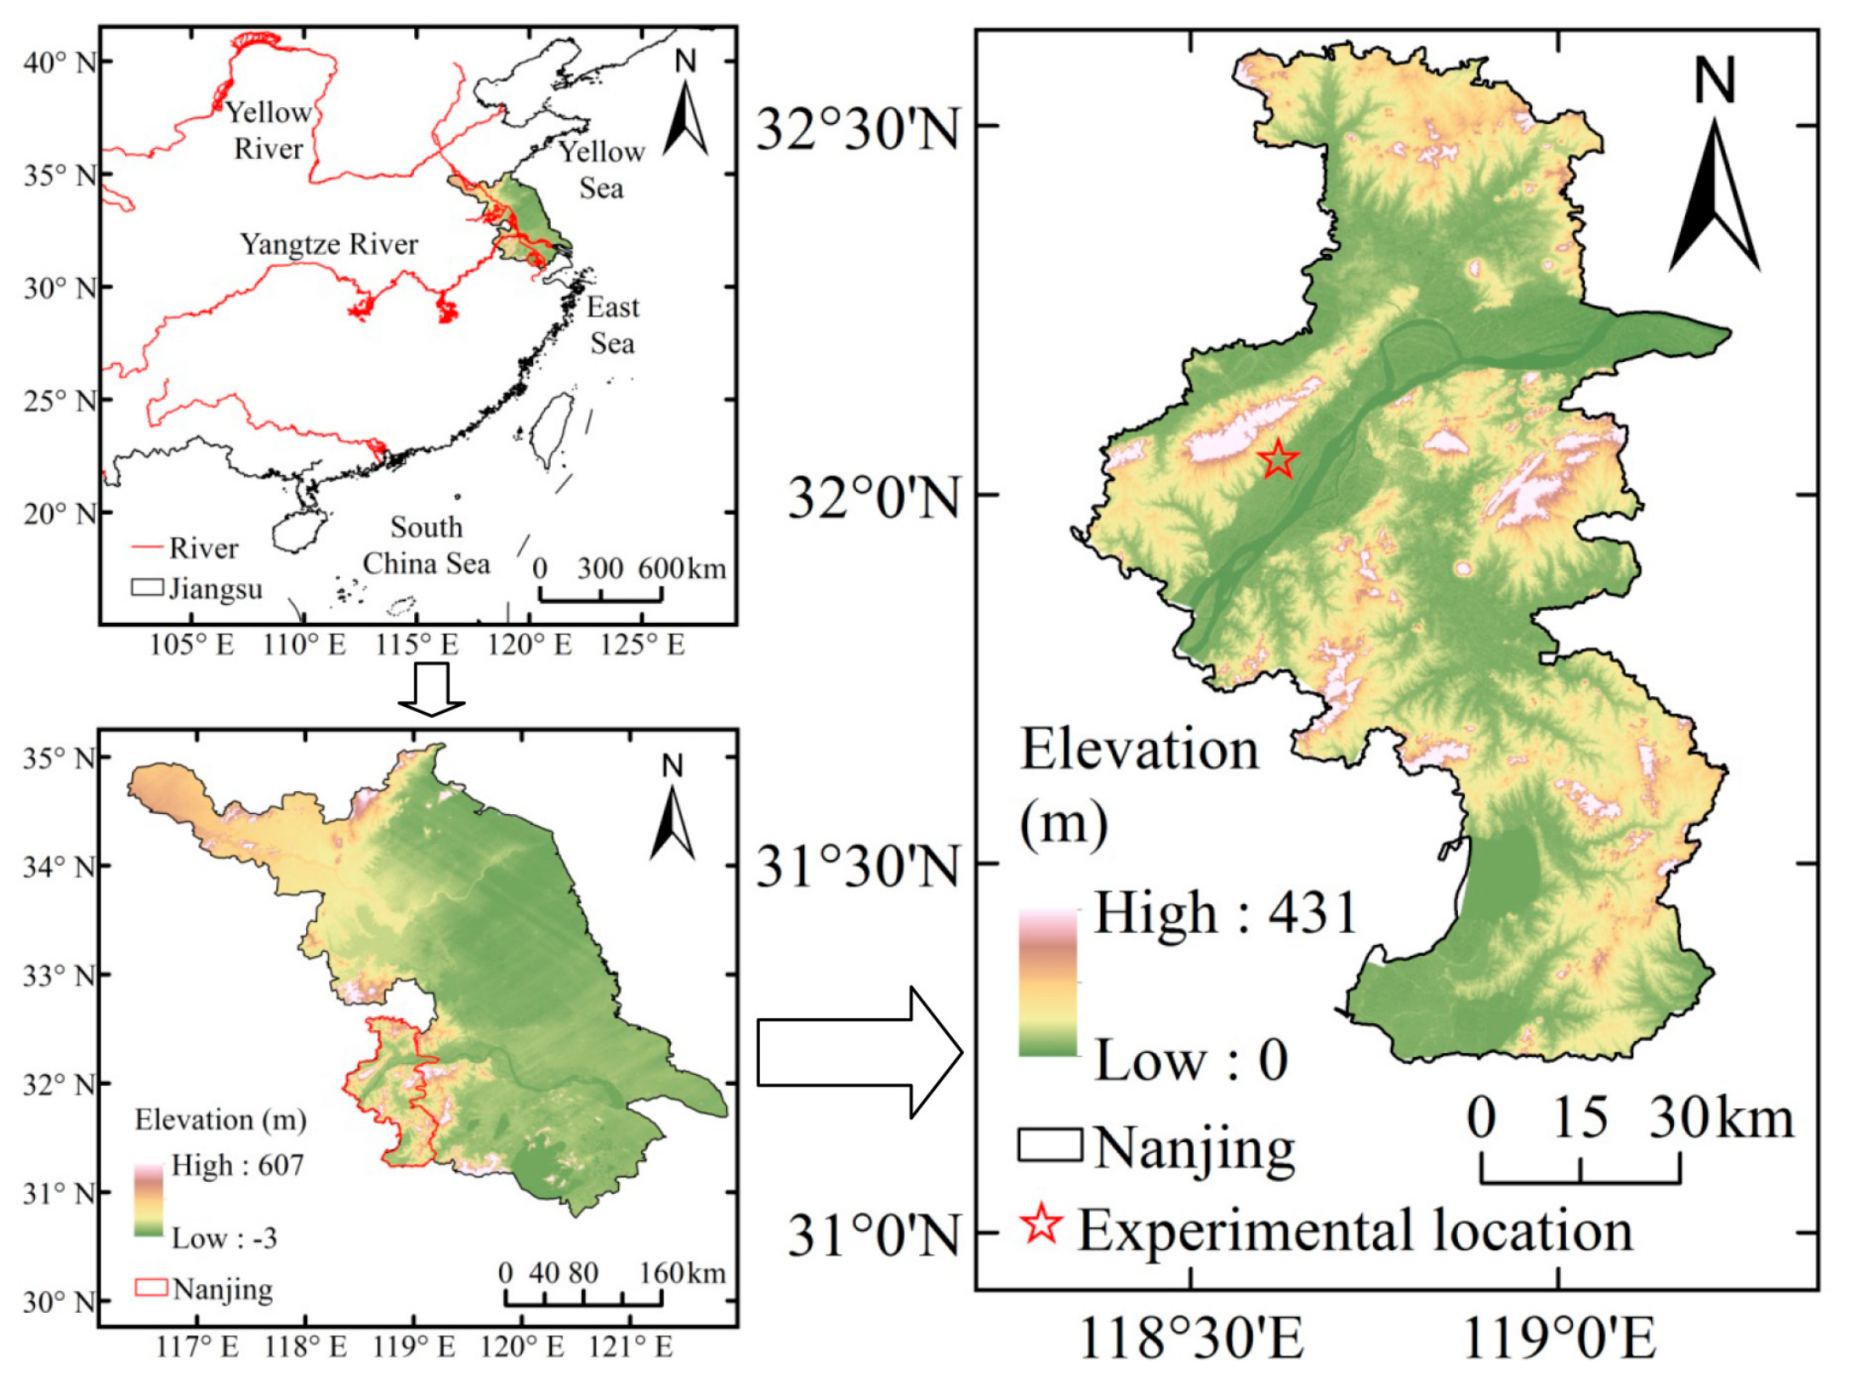
Figure 1. Location of the study area shows the experimental site. The maps were generated using ArcGIS 9.3 (http://www.esri.com/software/arcgis/arcgis-for-desktop) and vector layer information was from the National Geomatics Center of China (http://zhfw.tianditu.com/). The elevation dataset was provided by Shuttle Radar Topographic Mission (SRTM) website [25].
Water 10 00500 g001
Figure 2. Meteorological conditions during the main growth stages of maize during 2013–2017. (ae) for 2013, 2014, 2015, 2016, 2017 respectively.
Water 10 00500 g002
Figure 3. Responses of (a) Leaf Water Content (LWC) and (b) Leaf Water Potential (LWP) to different water stress in the main growth stages. Note: The sample sizes were 80 and 168 leaves for LWC and LWP in each growth stage, respectively. The error bars indicate the standard deviation. Bars sharing the same character represent a lack of significant difference (p > 0.05) in each growth stage.
Water 10 00500 g003
Figure 4. Responses of (a) Leaf Area Index (LAI) and (b) chlorophyll content to different water stress in the main growth stages. Note: The sample sizes were 88, 85, and 79 plots for LAI in ST1, ST2, and ST3, respectively. The sample sizes were 161, 171, and 164 leaves in ST1, ST2, and ST3 for chlorophyll content in each growth stage, respectively. The error bars indicate the standard deviation. Bars sharing the same character represent a lack of significant difference (p > 0.05) in each growth stage.
Water 10 00500 g004
Figure 5. Hourly CWSI calculated by the theoretical model from 08:00 to 17:00 in different levels of water stress during the main crop growth stage. Note: The sample size was 32 plots in each growth stage.
Water 10 00500 g005
Figure 6. The correlation coefficients show sensitivity of spectral indices to three categories of metrics. Note: * and ns denote the significant (with p < 0.05) and non-significant trend. The small letters ae represent indices Normalized Difference Vegetation Index (NDVI), Renormalized Difference Vegetation Index (RDVI), Red-Edge-Position (REP), TCARI/OSAVI (TO), Triangular Vegetation Index (TVI), and Photochemical Reflectance Index (PRI) respectively. The numbers 1, 2, 3, 4 and 5 represent the metrics LWC, LWP, LAI, chlorophyll content, and CWSI, respectively. The sample size was 36 groups for LWC, LWP, LAI, chlorophyll content. The sample size was 12 groups for CWSI. TCARI = Transformed Chlorophyll Absorption in Reflectance Index; OSAVI = Optimized Soil-Adjusted Vegetation Index.
Water 10 00500 g006
Table 1. Parameters used for the Crop Water Stress Index (CWSI) calculation.
VariablesVegetative Growth (ST1)Reproductive (ST2)Maturity (ST3)
A ( ° C )3.555.088.53
B ( ° C / hpa )−0.10−0.23−0.53
r c p ( s · m 1 )50.8750.85122.00
Note: The sample sizes were 27, 17, and 49 plots for ST1, ST2, and ST3, respectively. The detailed statistical analyses can be found in the supplementary materials.