Article

A Study on the Comparison of Corrosion in Water Supply Pipes Due to Tap Water (TW) and Reclaimed Water (RW)

1
Environmental and Plant Engineering Research Division, Korea Institute of Civil Engineering and Building Technology (KICT), Daehwa-dong 315, Goyangdae-Ro, Ilsanseo-gu, Goyang-si, Gyeonggi-do 10223, Korea
2
Smart City & Construction Engineering, University of Science & Technology (UST), 217, Gajeong-ro, Yuseong-gu, Daejeon 34113, Korea
*
Author to whom correspondence should be addressed.
Water 2018, 10(4), 496; https://doi.org/10.3390/w10040496
Submission received: 21 March 2018 / Revised: 11 April 2018 / Accepted: 12 April 2018 / Published: 17 April 2018
(This article belongs to the Special Issue Innovative Water Management and Reuse)

Abstract

:
Among a wide variety of alternative water resources, reclaimed water from waste-water has drawn much attention, as it is considered a stable water resource to be substituted for agricultural, industrial, recreational, and public water. This study aimed to compare and evaluate the effects of tap water and reclaimed water on the corrosion of the inner surface of pipes. The investigated pipes included GSP (Galvanized Steel Pipe), CIP (Cast Iron Pipe), STSP (Stainless Steel Pipe), and PVCP (Polyvinyl Chloride Pipe). Assessment of corrosion impact on the different materials of pipes was conducted by analyzing the corrosion accelerators and inhibitors related to the characteristics of reclaimed water. Reclaimed water with higher ionic content showed a faster corrosion rate than tap water because corrosion accelerators have more of an effect on pipe corrosion than do corrosion inhibitors. In terms of pipe materials, the corrosion rate was fastest in CIP, followed by GSP, and STSP; PVCP exhibited no electrochemical corrosion.

1. Introduction

Due to the rapid changes in climate and the recognition of the importance of water, the acquisition of alternative water resources has become an important part of research. Among a wide variety of alternative water resources, treated wastewater draws much attention, as it is considered a stable resource for substituting the agricultural, industrial, recreational, and public water, thanks to its good water quality and the amount of discharge that can be reliably predicted.
Water demand has been steadily increasing for the last several decades due to the increase in population, irrigation area, and industries, as well as the rapid expansion of urban areas. The water demand amounts to about 30.1 billion m3 which comprises 6.2 billion m3 of municipal use, 2.6 billion m3 of industrial use, 14.9 billion m3 of agricultural use, and 6.4 billion m3 of instream flow augmentation. Half of the total water demand comes from agricultural use [1]. After the advanced wastewater treatment process, the treated wastewater offers great potential for use. This is a stable alternative water resource, and as such, much attention has been paid to the research on its applicability as an alternative water resource.
The reclaimed system of treated wastewater is established less by open channels than by pipelines for the prevention of recontamination. In 2009, the Ministry of Environment/Korea Environment Corporation offered advice to use polyvinyl-chloride pipes, polyethylene pipes, steel pipes, or cast iron pipes (with the inner surface treatment showing fewer problems in corrosion or scale forming) as the material for the pipes.
Since 2006, the treated wastewater reclaimed model project has been in progress. However, most studies have focused on the presentation of the appropriate water quality standards or treatment methods. Meanwhile, the degree of pipe corrosion based on the characteristics of reclaimed water has not been clearly presented.
Accordingly, it became necessary to analyze the reclaimed wastewater quality and study the effect of reclaimed water on corrosion based on the materials of the pipes. Specifically, the effluent from the wastewater treatment and reclaimed facility in I city, which was used as the test sample, has never been examined for the threat of microbes by the materials of pipes or pipe corrosion, despite that it is being used as water for living.
While dissolved oxygen (DO), water temperature, or pH are some of the key factors in the corrosion among water elements within the reclaimed water pipes, the actual corrosion behavior is affected not by a single factor but by complex factors. Therefore, it is necessary to analyze or control the complex interactions of these factors.
While Lee et al. (2001) focused on tap water pipes, the research on complex water factors in corrosion has considerably lagged behind in Korea and abroad [2]. Even the basic data on the survey of corrosion characteristics of each pipe material by complex factors of water quality in actual pipelines are lacking. While there is a degree of difference, metal pipes are gradually corroded as time goes by, eluding heavy metals or giving off distinct tastes or smells. Slime formation may accelerate corrosion. The corrosion of supply pipes and the formation of sediment rust inside the pipes, not only causes doubt about the quality of the tap water, but also produces water overuse [3,4]. The problem of deterioration of water quality caused by this corrosion is widely used as a limiting factor in sewage reuse [5].
This study aims to evaluate both quantitatively and qualitatively the effect on tap water quality of treated wastewater based on the corrosion of the inner surface of pipes. This will be achieved by conducting a survey on the tap water and reclaimed water quality and utilizing the corrosion rate and corrosive index.
Developing and presenting the corrosion impact assessment by the materials of pipes will be implemented by measuring the corrosion accelerators and inhibitors related to the characteristics of reclaimed water

2. Materials and Methods

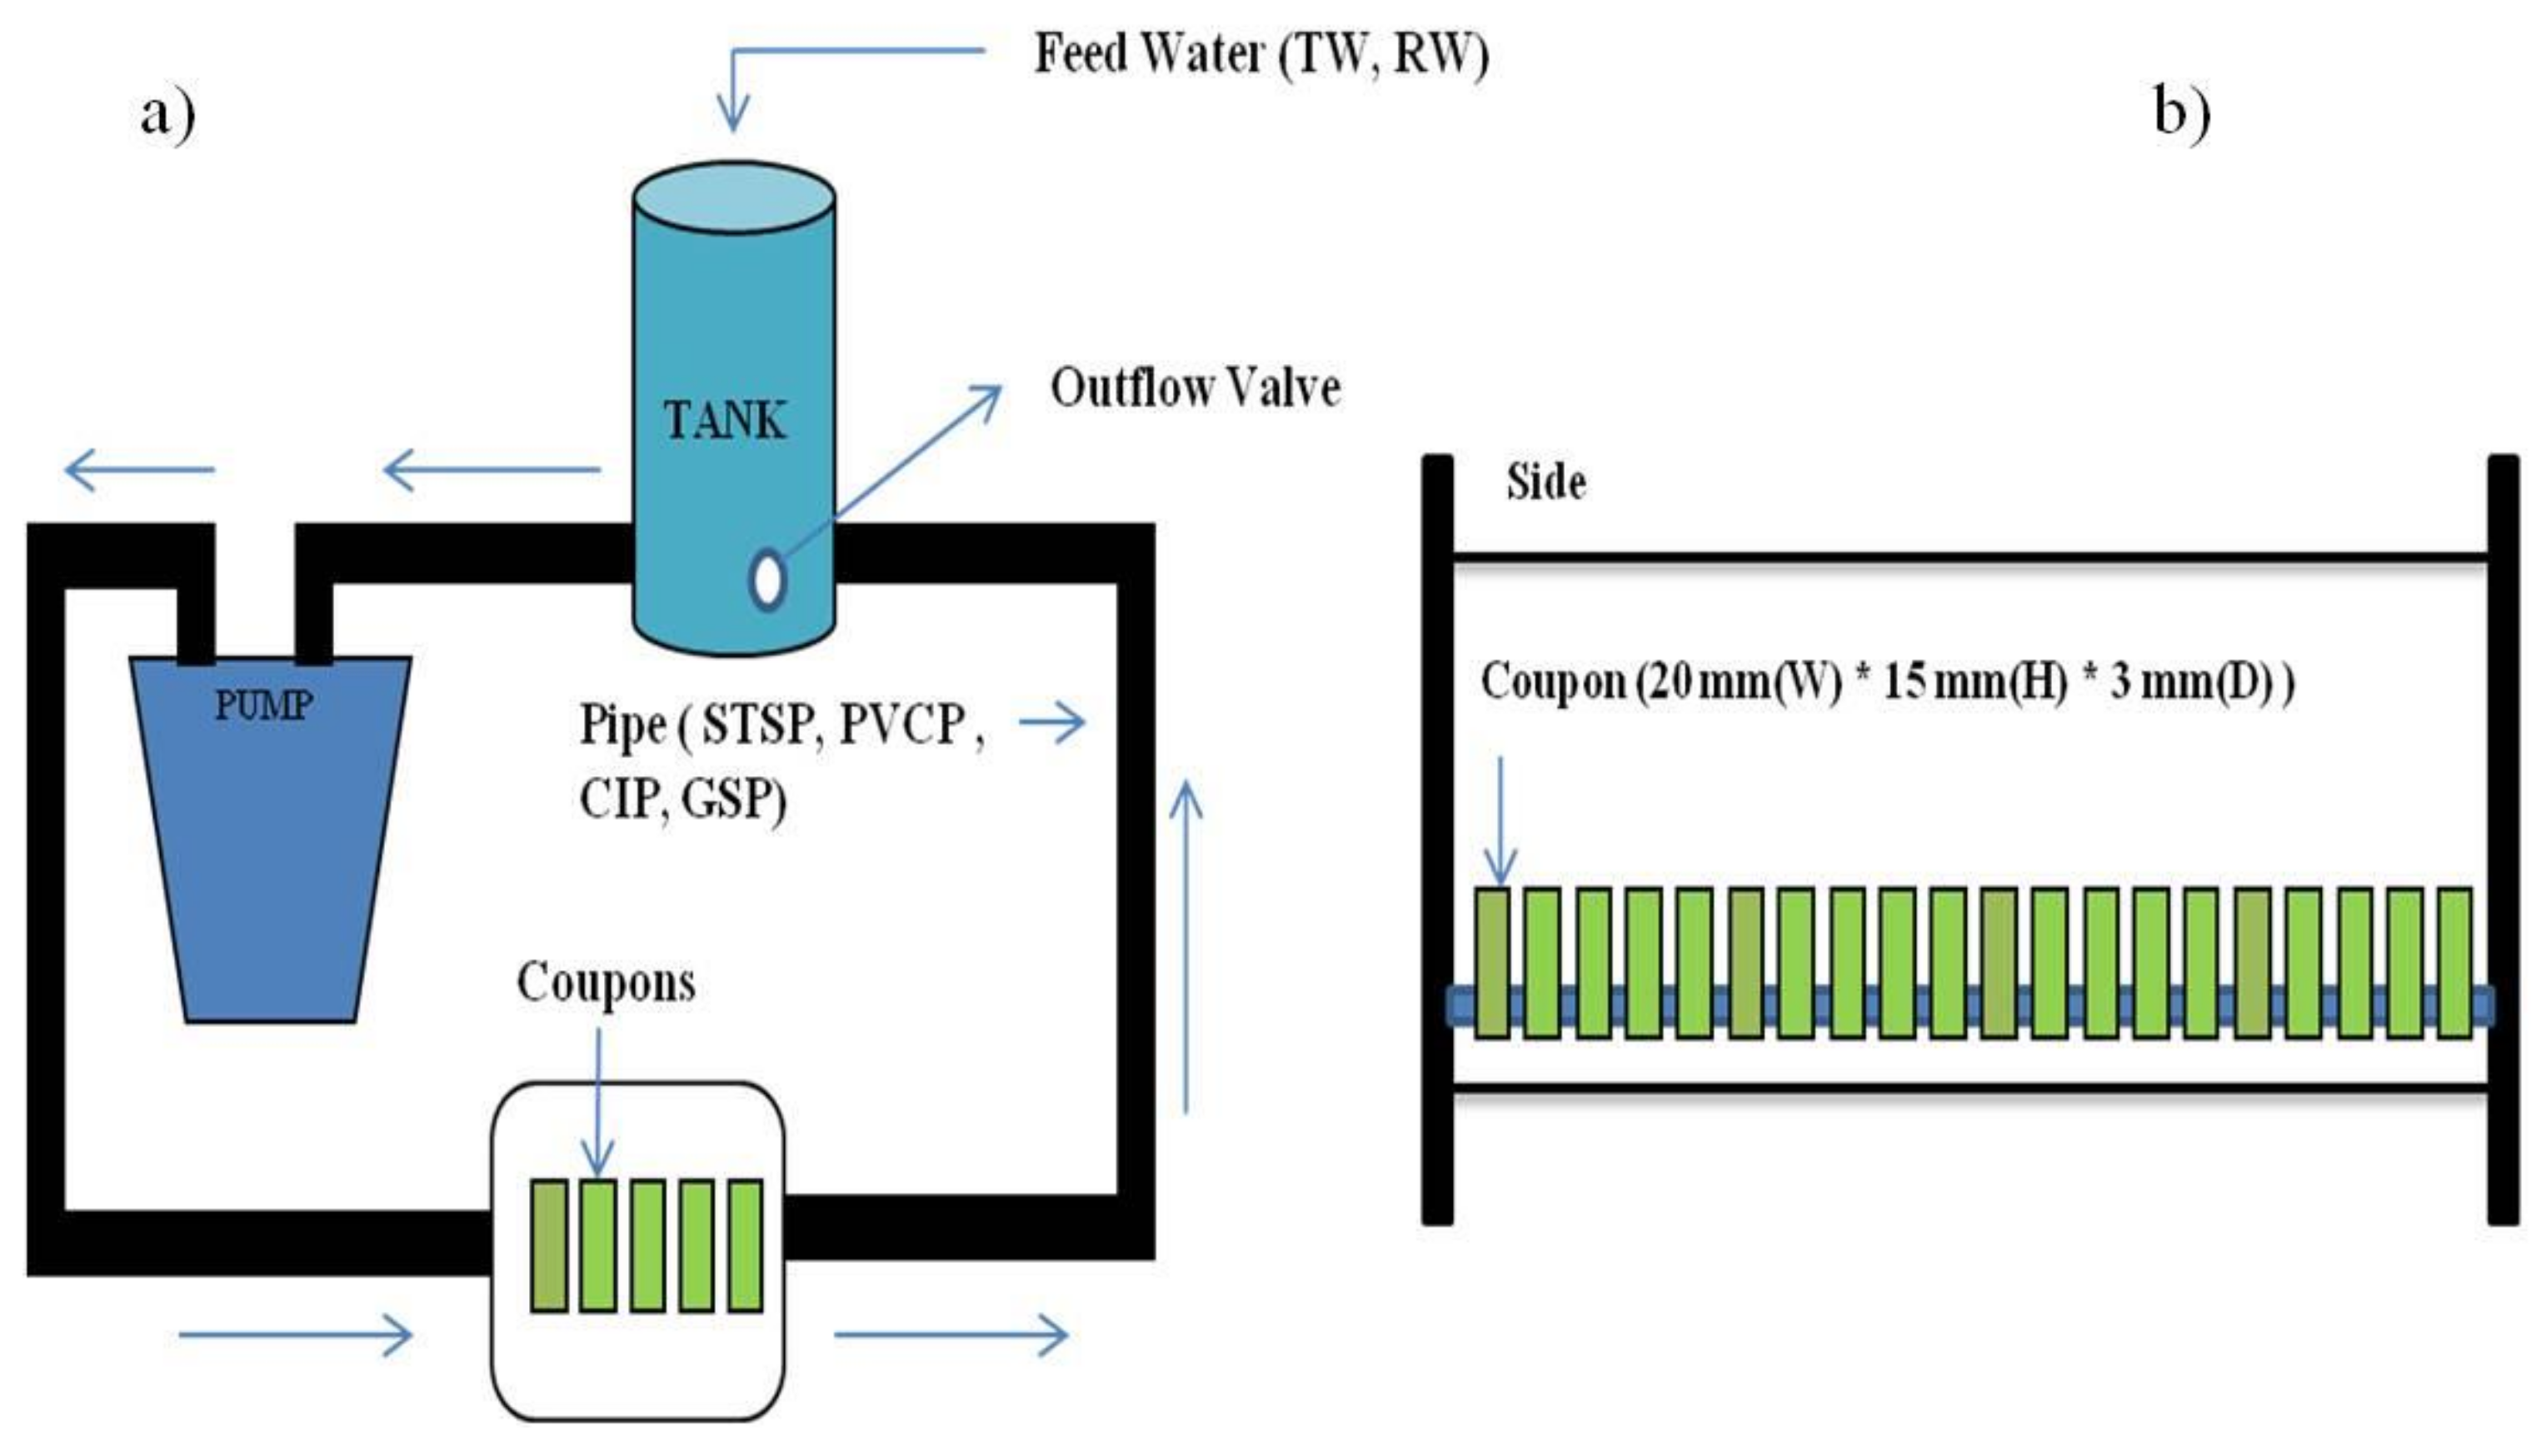
2.1. Experimental Setup

This test produced looped devices so that the test water could be circulated continuously. As for the test devices, the study selected cast iron pipes (CIPs), stainless steel pipes (STSPs), polyvinyl chloride pipes (PVCP), as well as galvanized steel pipes (GSPs) as these are usually used in the reclaimed water supply network in Korea. Eight loops were installed, each of which had one underwater pump to supply tap water and reclaimed water. The water was exchanged every 24 h. The simulation pipe network used pipes of 15 mm diameter, and the total length of each loop was 2.5 m. The test made sure to supply the test water by 1.5 m/s. Table 1 shows the detailed information of the device.
To observe the corrosive characteristics, the coupons were attached on the device and ran the test. The coupons are small test devices and the corrosion rate for each type of material was measured by the weight loss of the coupons. The size of each coupon was 20 mm (Width) × 15 mm (Height) × 3 mm (Depth). An acryl chamber was installed in the middle of the loop, and each chamber contained 20 coupons. The support was placed inside the acryl chamber and the coupons were installed perpendicular to the flow of the water. Before being installed, the coupons were sterilized in the sterilizer for 15 min at 121 °C, and dried for 24 h in a dryer at 105 °C. Then, the coupons were installed underwater.
The coupons were collected again after a certain interval of time and the corrosion rate and the reduced weight of the coupons were analyzed. Figure 1 shows the overall map of the simulated test device for water distribution and the chamber installed in it.

2.2. Preparation of Tested Water

The test was conducted by using the reclaimed water (RW) treated at the wastewater reclamation facility in I city and the tap water (TW) supplied by the Korea Institute of Construction Technology, Ilsan, Korea. Sand filtration followed by active carbon filtration and finally sodium hypochlorite sterilization was used to treat the reclaimed water at the sewerage facility where it became a viable water source for the general use of the city. Table 2 shows the current condition of the effluent quality.
The RW and TW at each loop were exchanged every 24 h. Based on time lapse, the test analyzed the water quality factors such as temperature, pH, DO, conductivity, alkalinity, and total organic carbon (TOC), among others.

2.3. Analytical Method

2.3.1. Water Quality Analysis

By using the analysis method in Table 3, this study conduct a comparative analysis of the corrosiveness of RW and TW based on these indices,

2.3.2. Assessment of Corrosion Rate

The corrosion rates were calculated in miles per year using the recommended relation by American Society for Testing and Materials (ASTM) 1985 [6] that has been used successfully applied by Sanusi [7] and Orubite [8]. Generally, the miles penetration per year (MPY), the unit used as the corrosion rate, is calculated by Equation
M P Y = 534 W D A T
Here, W is weight loss (mg), D is density (g/cm3), A is area (in 2), and T is hour (h). Equation (6) can be easily solved by the dimensional analysis, and the constant 534 is the value that can be changed in the conversion of W, D, A, and T.
While MPY is most advisable in terms of realistic consideration, milligrams per square decimeter per day (mg/dm2/day, mdd), the weight loss by unit area and by unit hour has often been used recently.
1 M P Y = 1.44 mdd D
To calculate the corrosion rate, the study collected the coupons by pipe material of the test device from the effectors, treated them based on KS D ISO 8407:2009 (Table 4), and measured the amount of weight loss by mdd.

3. Result and Discussion

3.1. Characteristics of Tested Water

3.1.1. Quality of the Initial Influent

Table 5 shows the initial water quality data of RW and TW supplied to the simulated test device for water distribution. The pH of both water coupons were around neutral at about 7. The initial water temperature was between 25.9 °C and 26.1 °C. During the test duration, the average temperature was 21 °C and the both water coupons did not show much difference.
The concentration of residual chloride of TW conform to the “Drinking Water Quality Standard (4 mg/L or below)” and the “Regulation on the Cleaning and Health Control of the Water Supply Facilities (0.1 mg/L or higher)”. The concentration of disengaged residual chlorine of TW used as the water coupon was 0.1 mg/L. This was within the recommended scope of the water quality at 0.1 mg/L or higher.
On the other hand, the concentration of combined residual chlorine of RW used as the water coupon was 0.01 mg/L, which was considerably below the standard of 0.2 mg/L or higher (recommended standard for the waste water or reclaimed water, Ministry of Environment, 2009) [9]. It is determined that the concentration of the disinfectant was almost used up and, therefore, had almost disappeared.
In the case of the RW used as the water coupon, the concentration of chlorite ion exceeded the recommended standard of 250 mg/L by between 650 and 850 mg/L due to the influent of seawater, the characteristic of the coastal reclaimed land, which resulted in a conductivity 20 times higher than that of TW at 3700 µS/cm. As for TOC, the concentration of chlorite ion of RW was 2.86 mg/L, twice that of TW. The concentration of suspended heterotrophic bacteria in RW was 1672 CFU/mL and 10 CFU/mL in TW, showing that there were more microbes in RW than in TW.

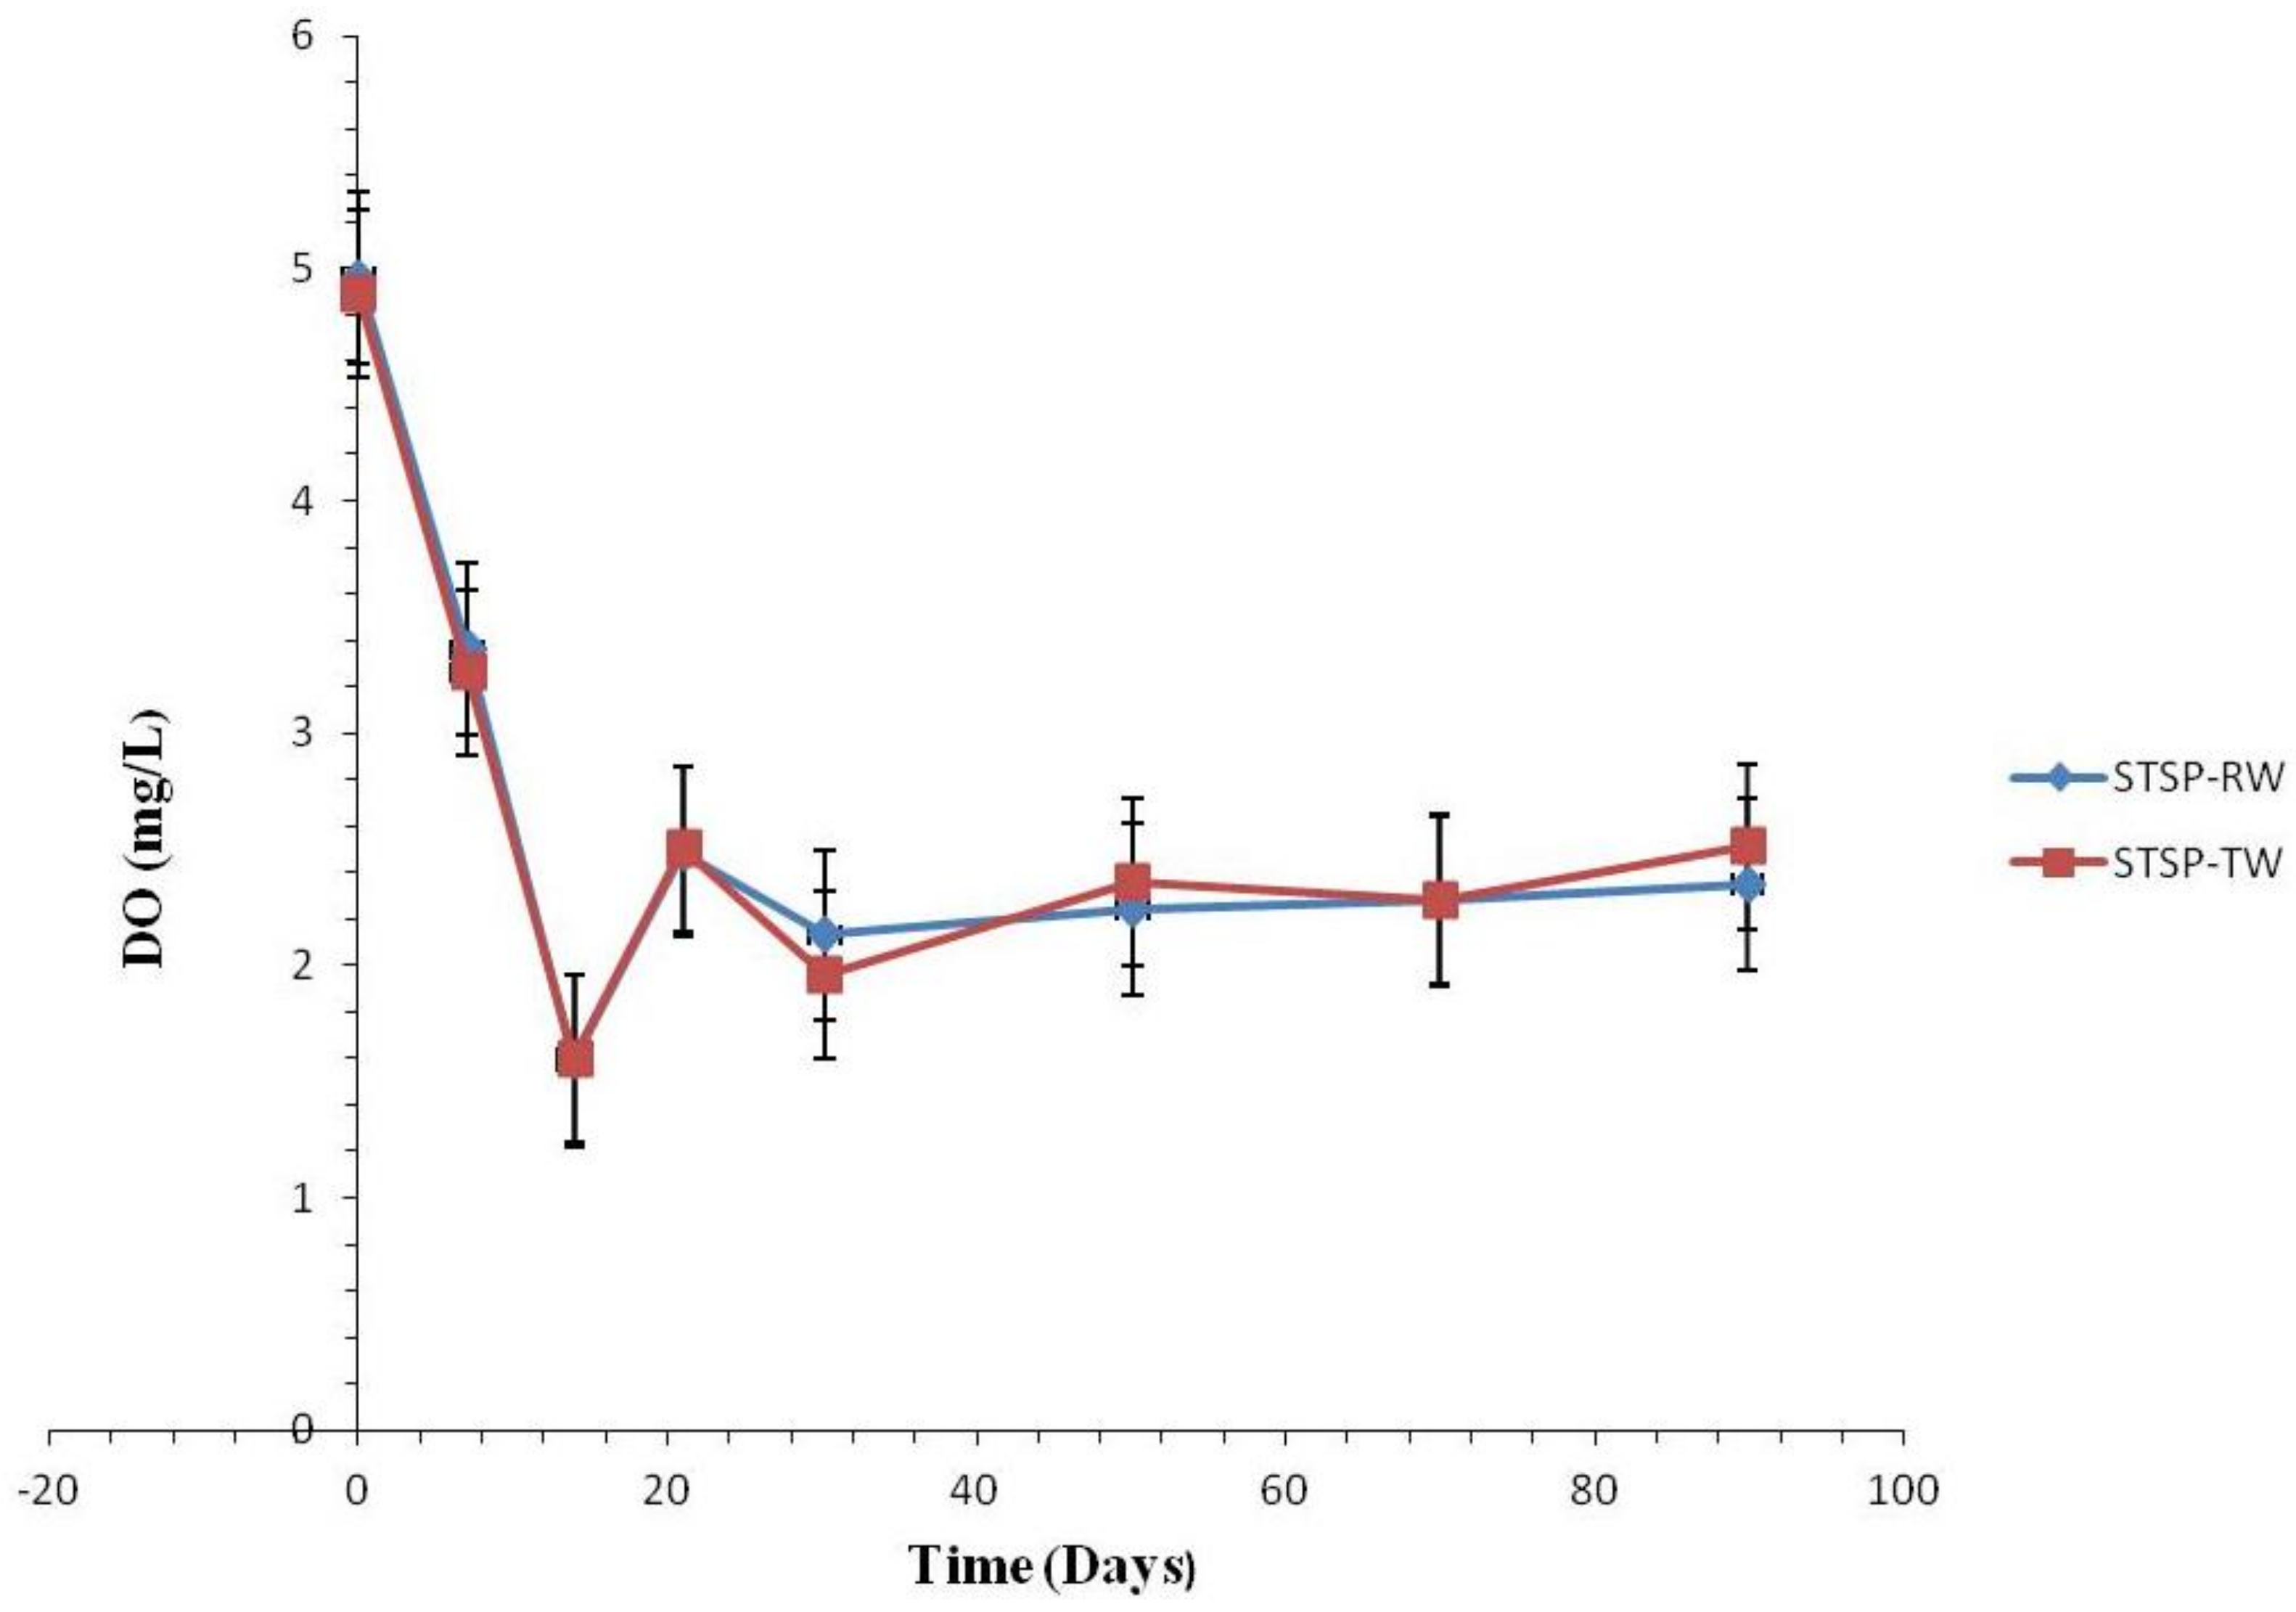
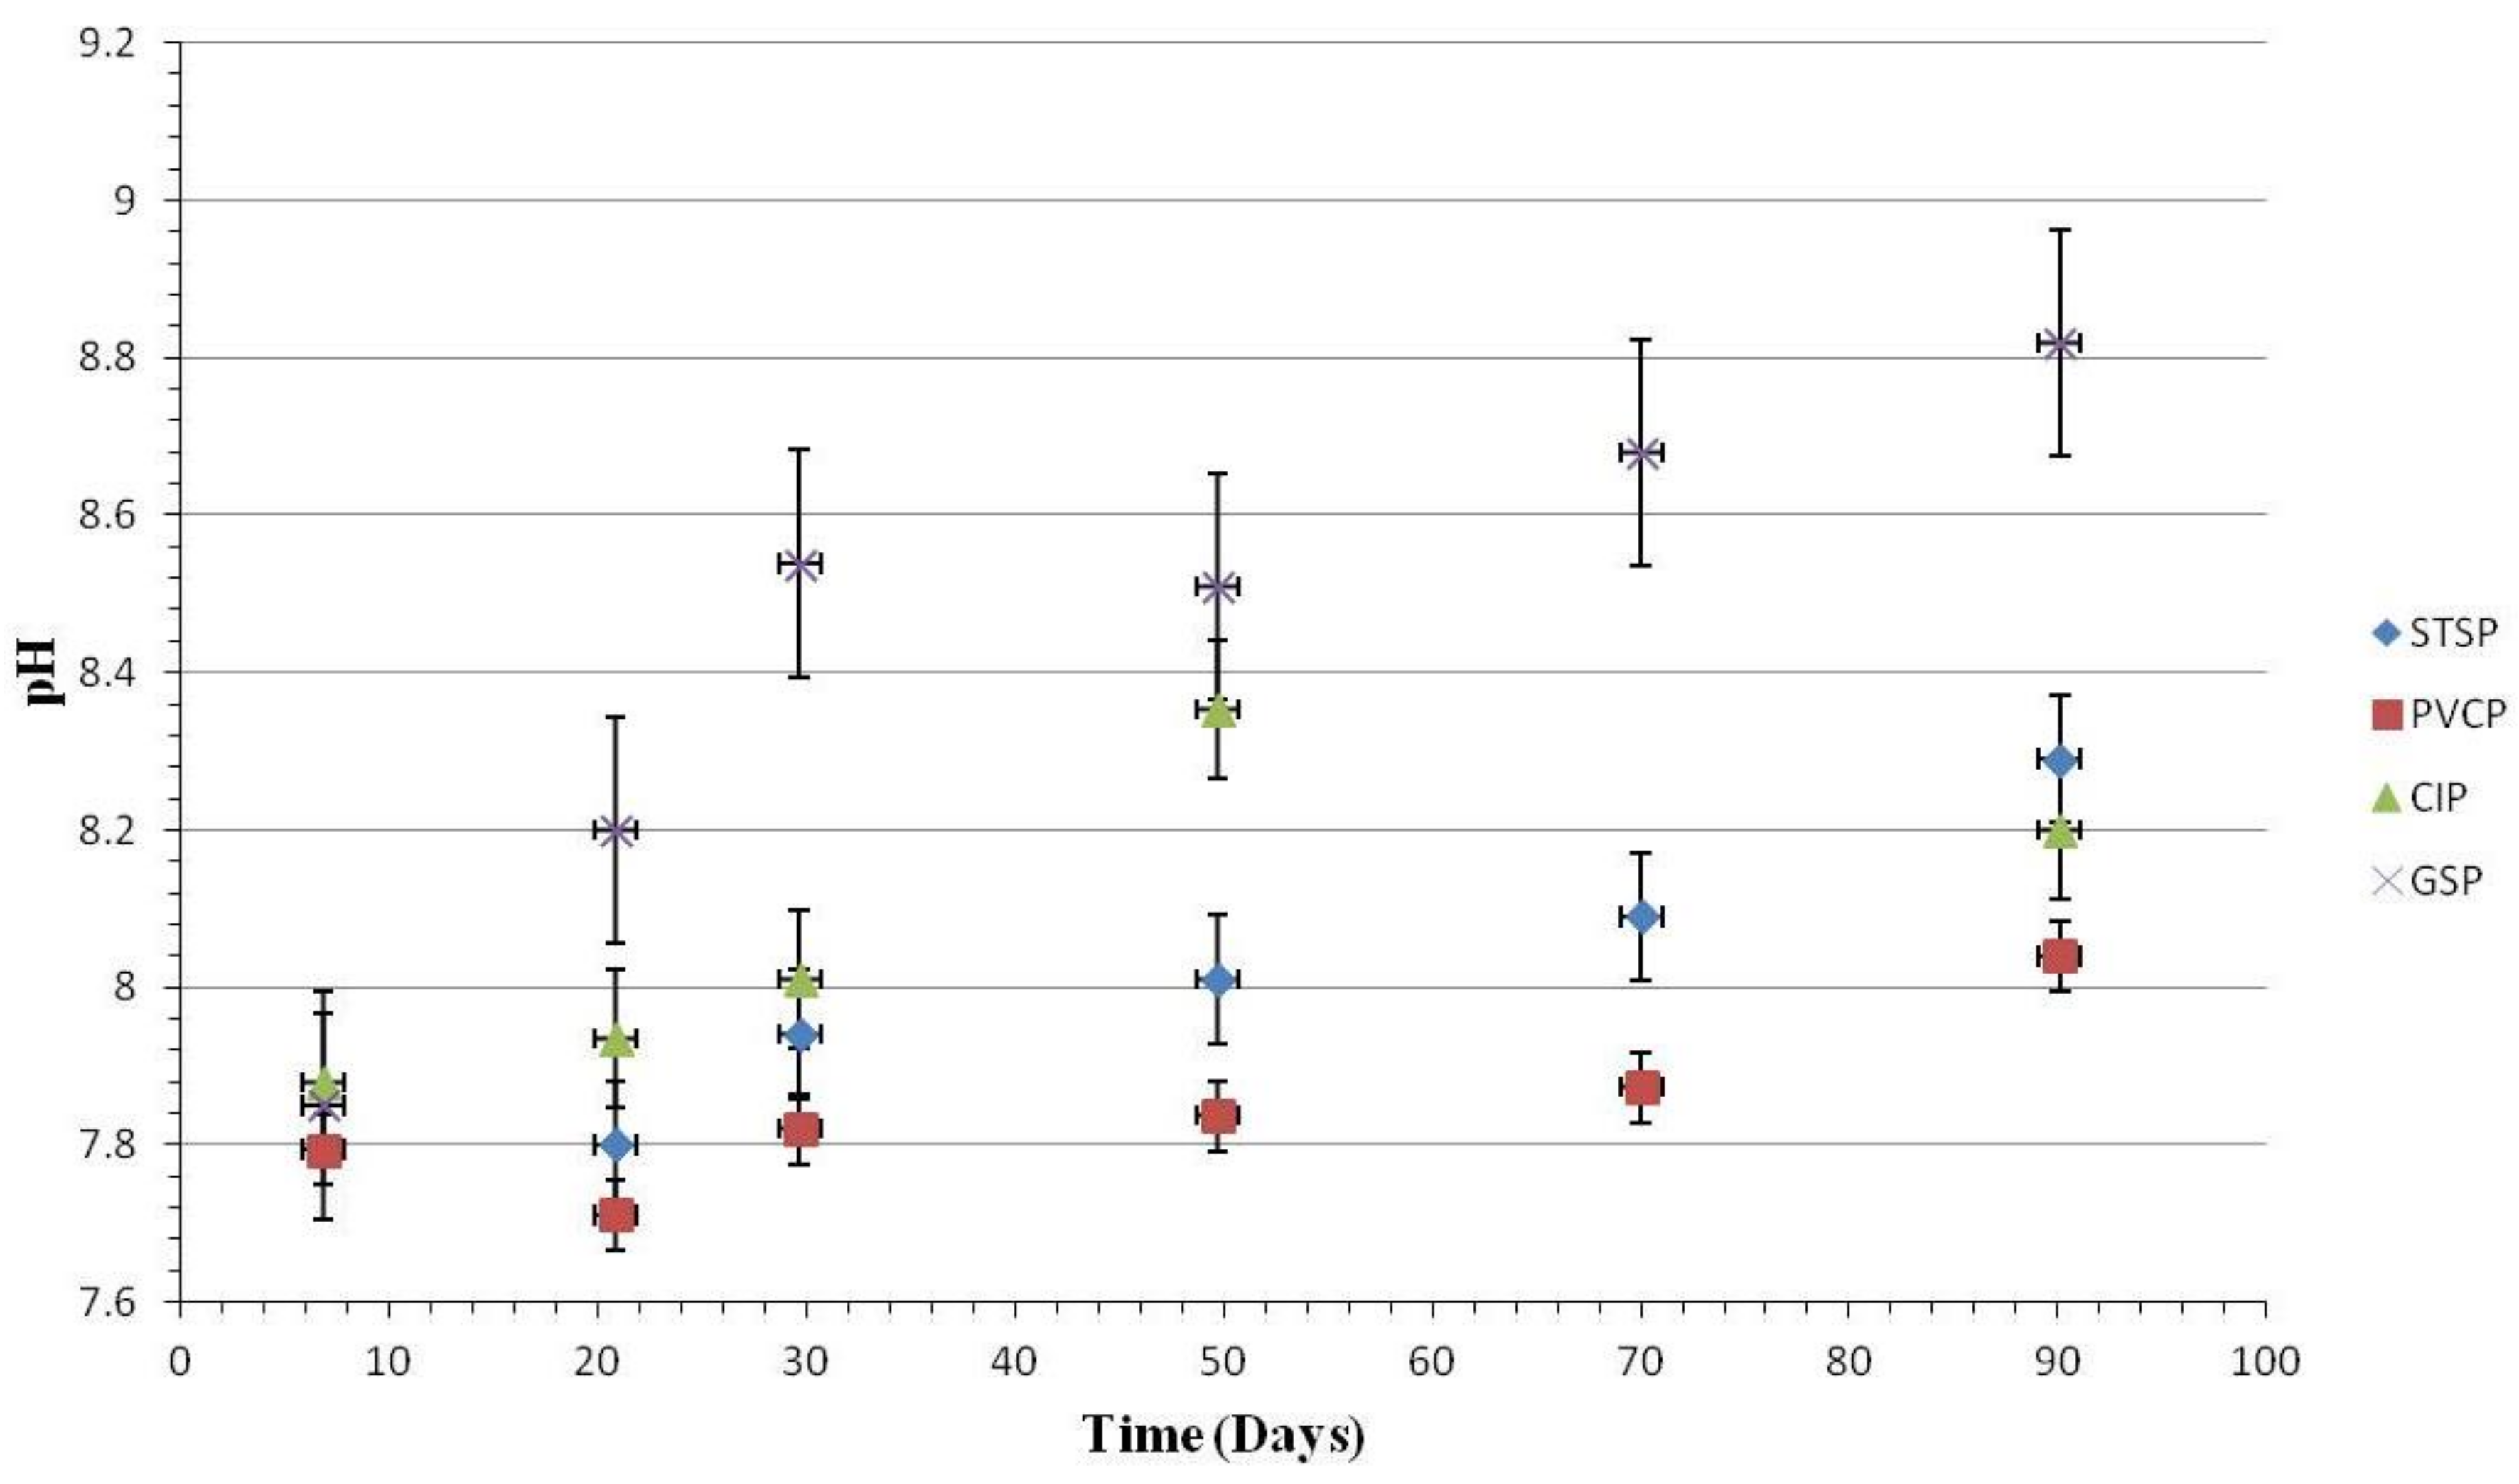
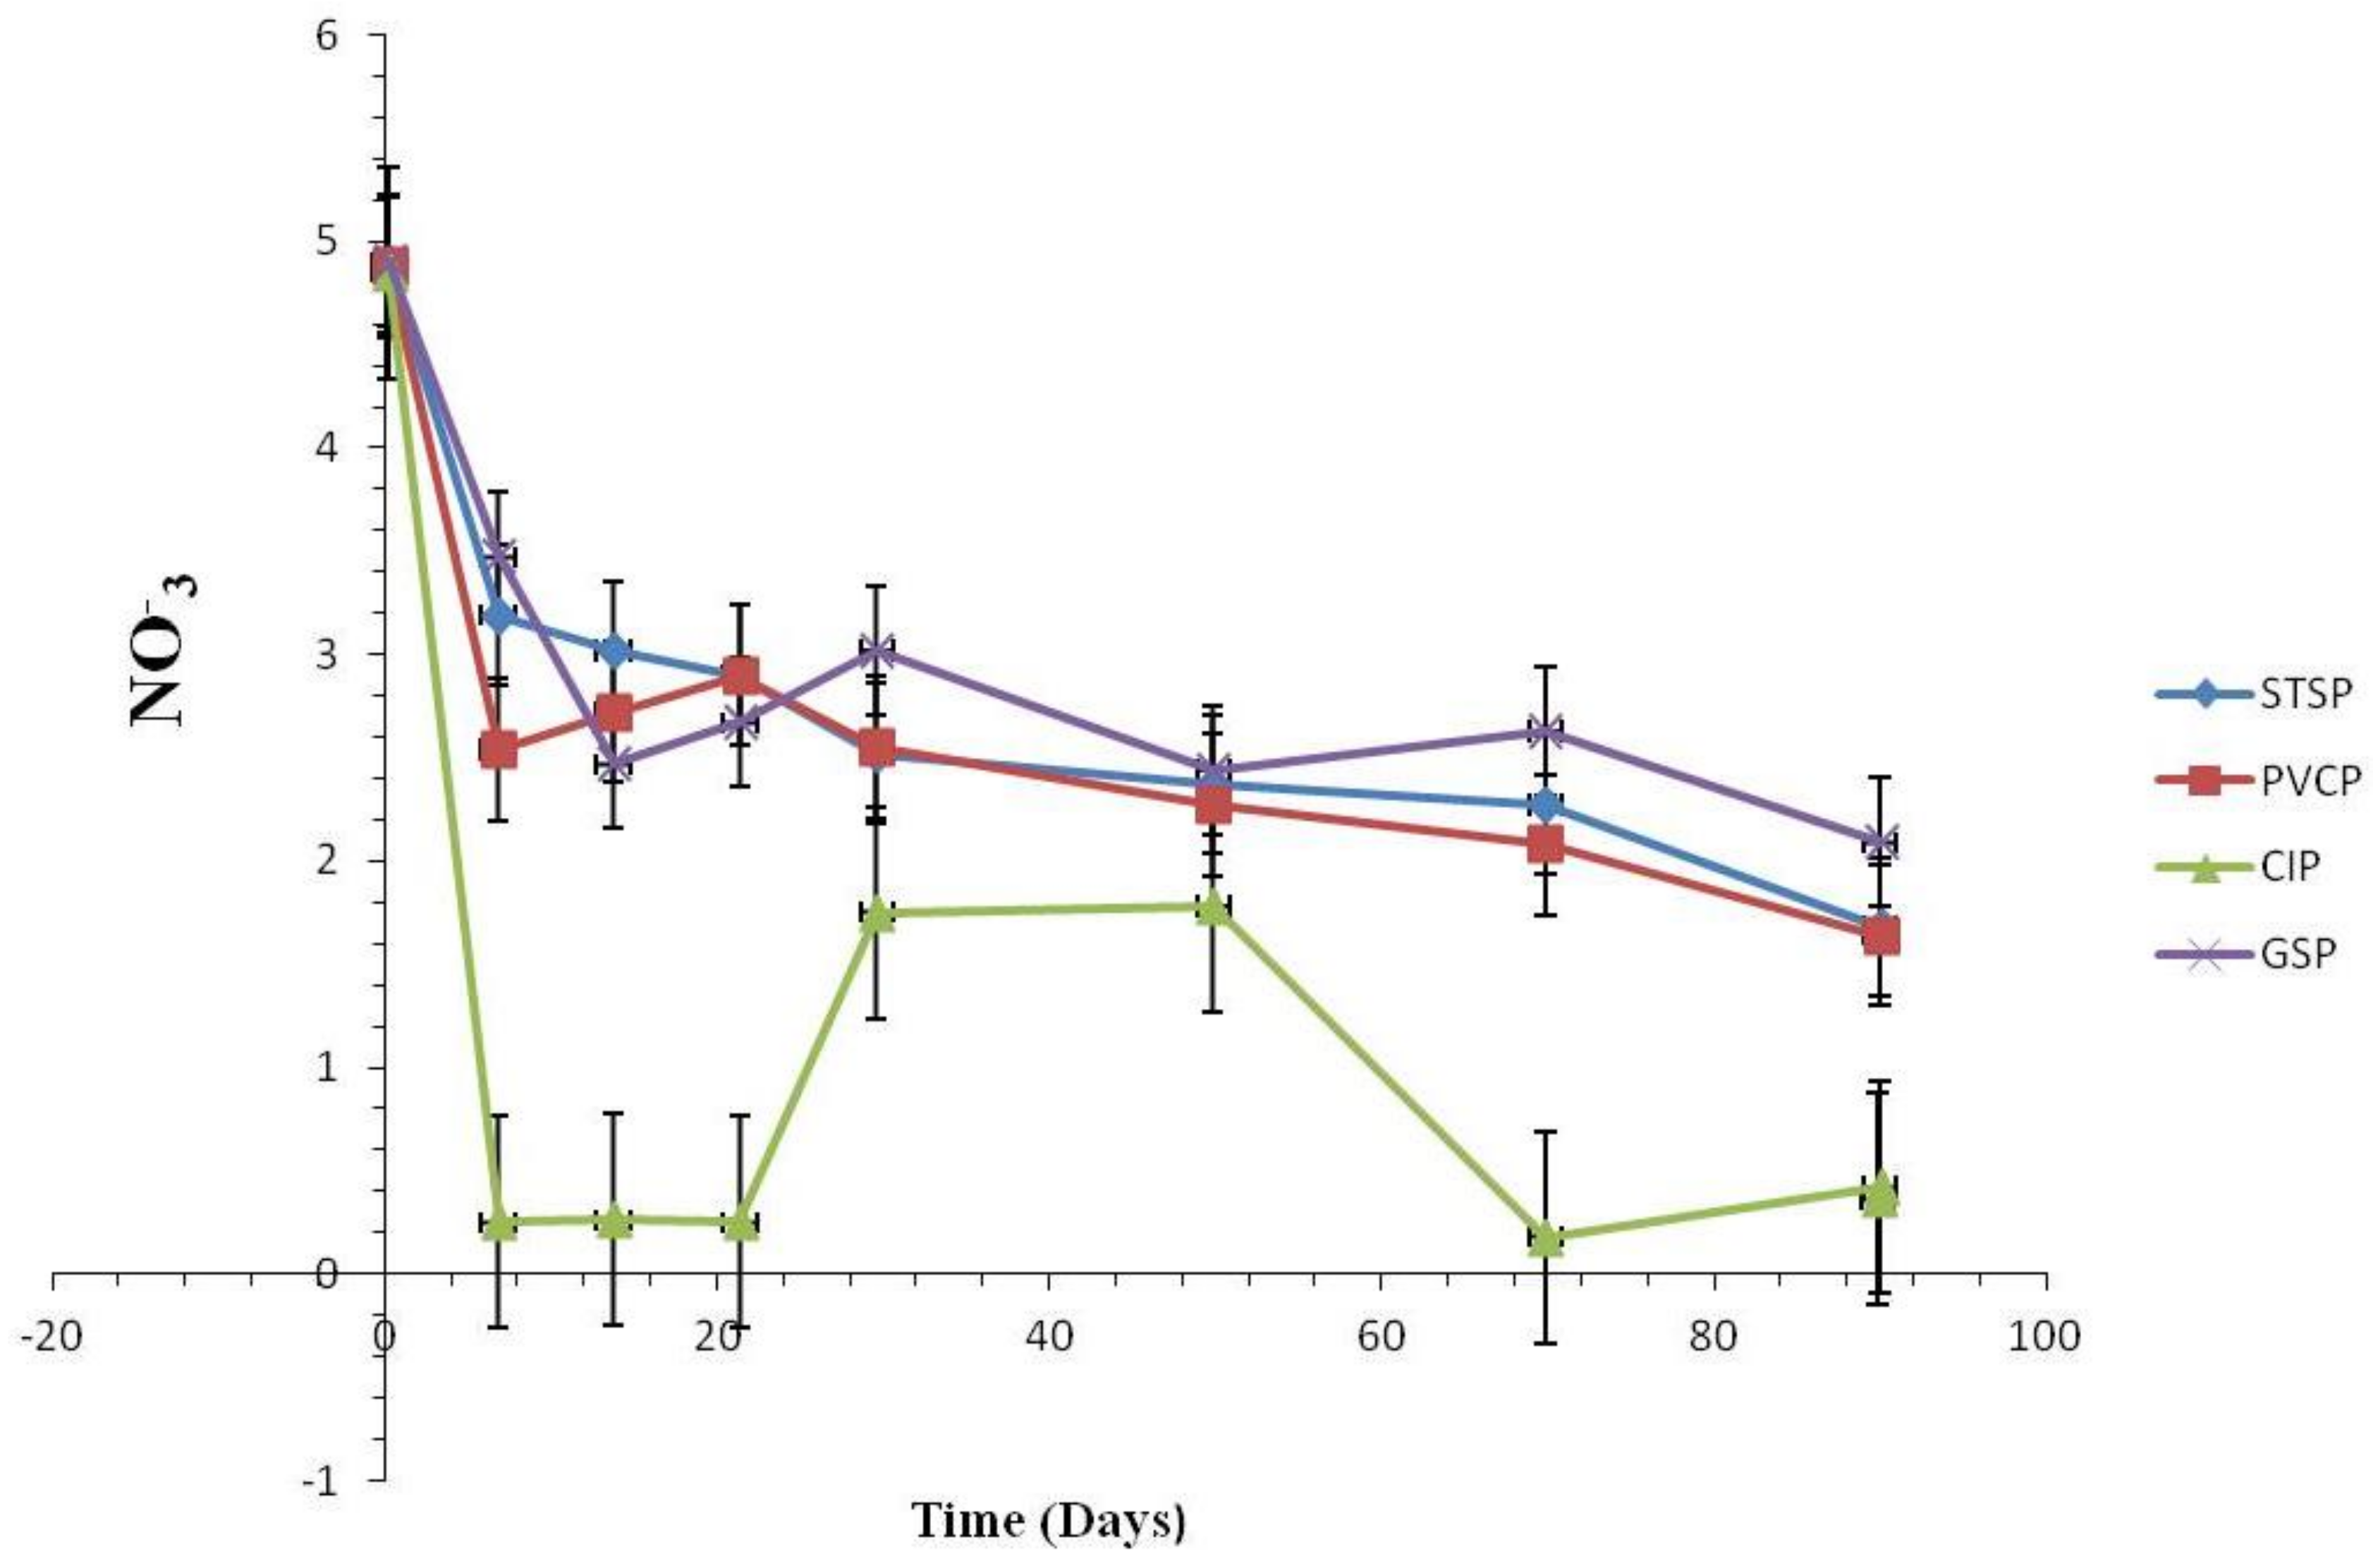
3.1.2. Water Quality Change

Water Quality Change

The dissolved oxygen in water increases as the temperature, pressure, and the surface area of water increase. Since oxygen reacts as a polarized cathode in water, it promotes pitting corrosion and tubercles. As shown in Equation (3), oxygen works as an electron acceptor that accepts the electrons produced by the corrosion of metallic ions, accelerating corrosion as the electron acceptors are converted to hydroxyl ions. Without oxygen dissolved in water, corrosion does not progress. In addition, the dissolved oxygen works as a principal factor in the growth of nitrifying bacteria and the response of nitrification [10].
O + 2H2O + 4e → 4OH
The Figure 2 indicates the concentration values of DO by time lapse in the STPSs to which RW and TW were supplied. Figure 2 shows the difference in the DO concentration between the two water coupons as negligible, but both concentrations rapidly decrease in the beginning. This may be related to the fact that the initial corrosion rate rapidly accelerates, which is largely affected by the dissolved oxygen.
Since pH is affected by the materials receiving electrons emitted by the corrosion of metal, it is the most important factor in corrosion.
Generally, the variations of pH in water in its natural state, between 4.3 and 10, do not affect corrosion. Figure 3 demonstrates the change of pH over time in the pipe supplied with RW.
While the initial pH of RW was 7.42, it increased over time in all four types of pipes. After 90 days, the pH measured in CIP and GSP increased to 9.01 and 8.68, respectively. On the hand, that in STSP and PVCP increased slightly to 8.29 and 8.04, respectively. It is believed that the reason for such a low pH in these two types of pipes is that the acid produced by the nitrification must have lowered the pH.

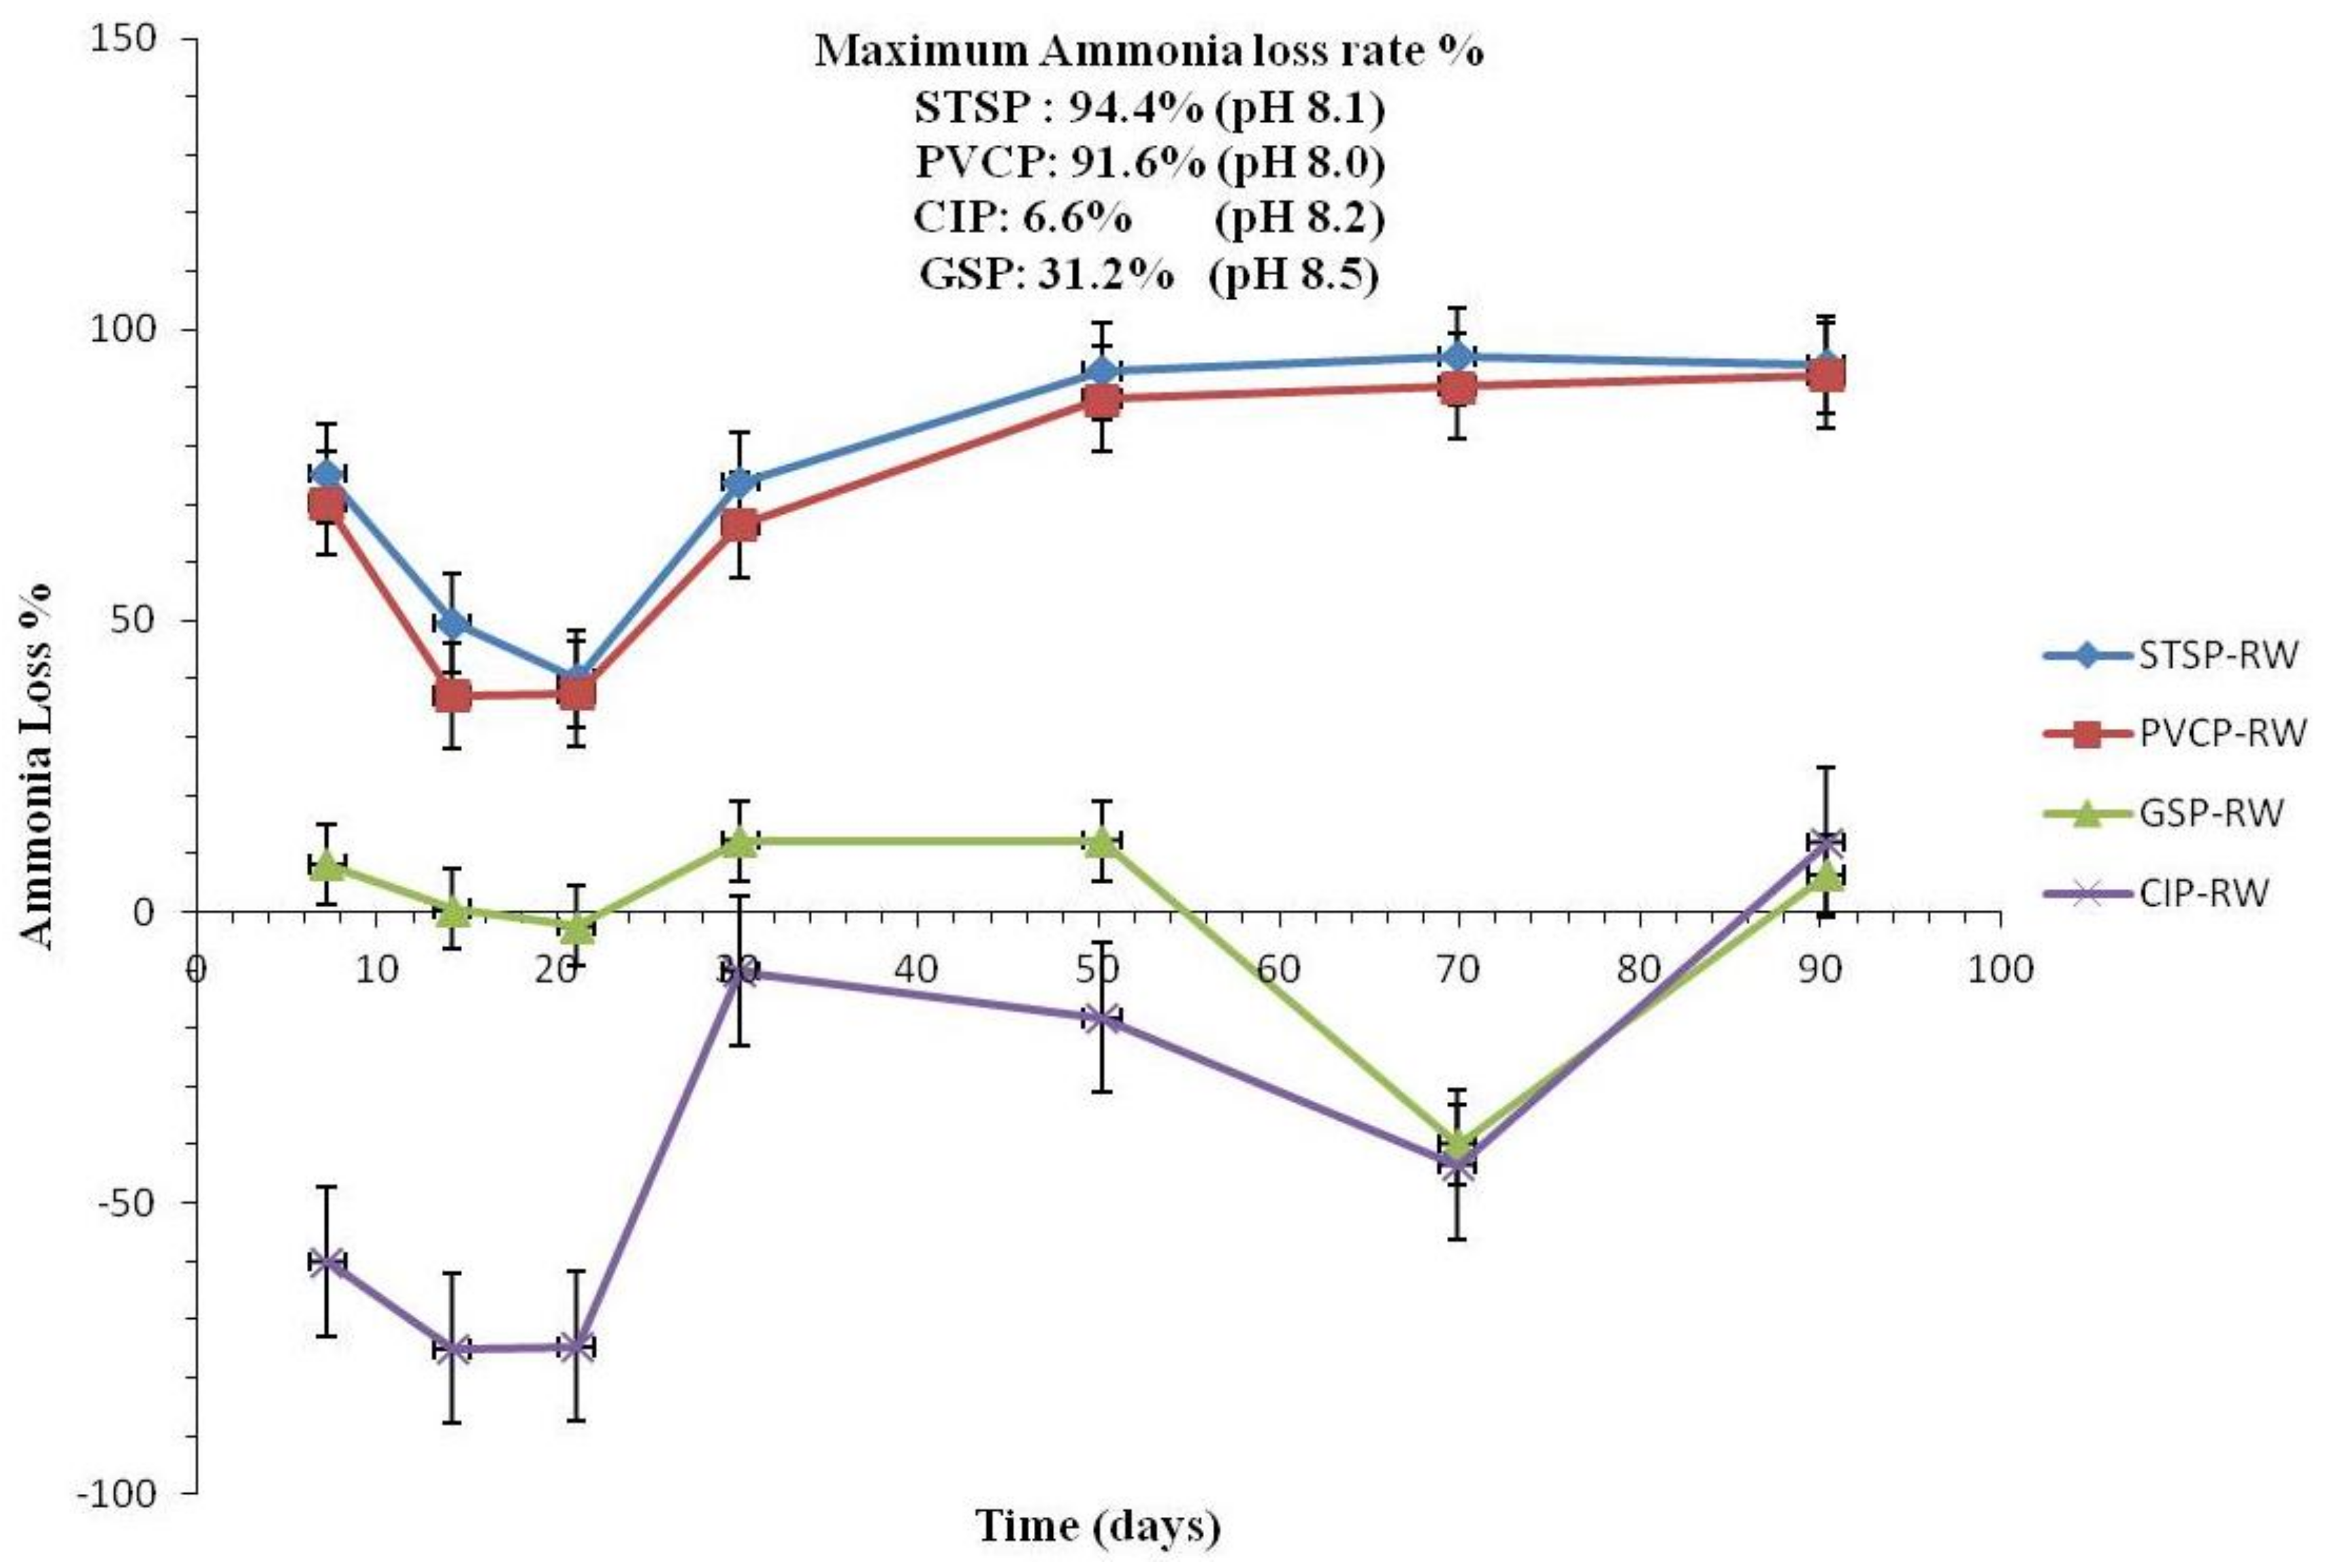
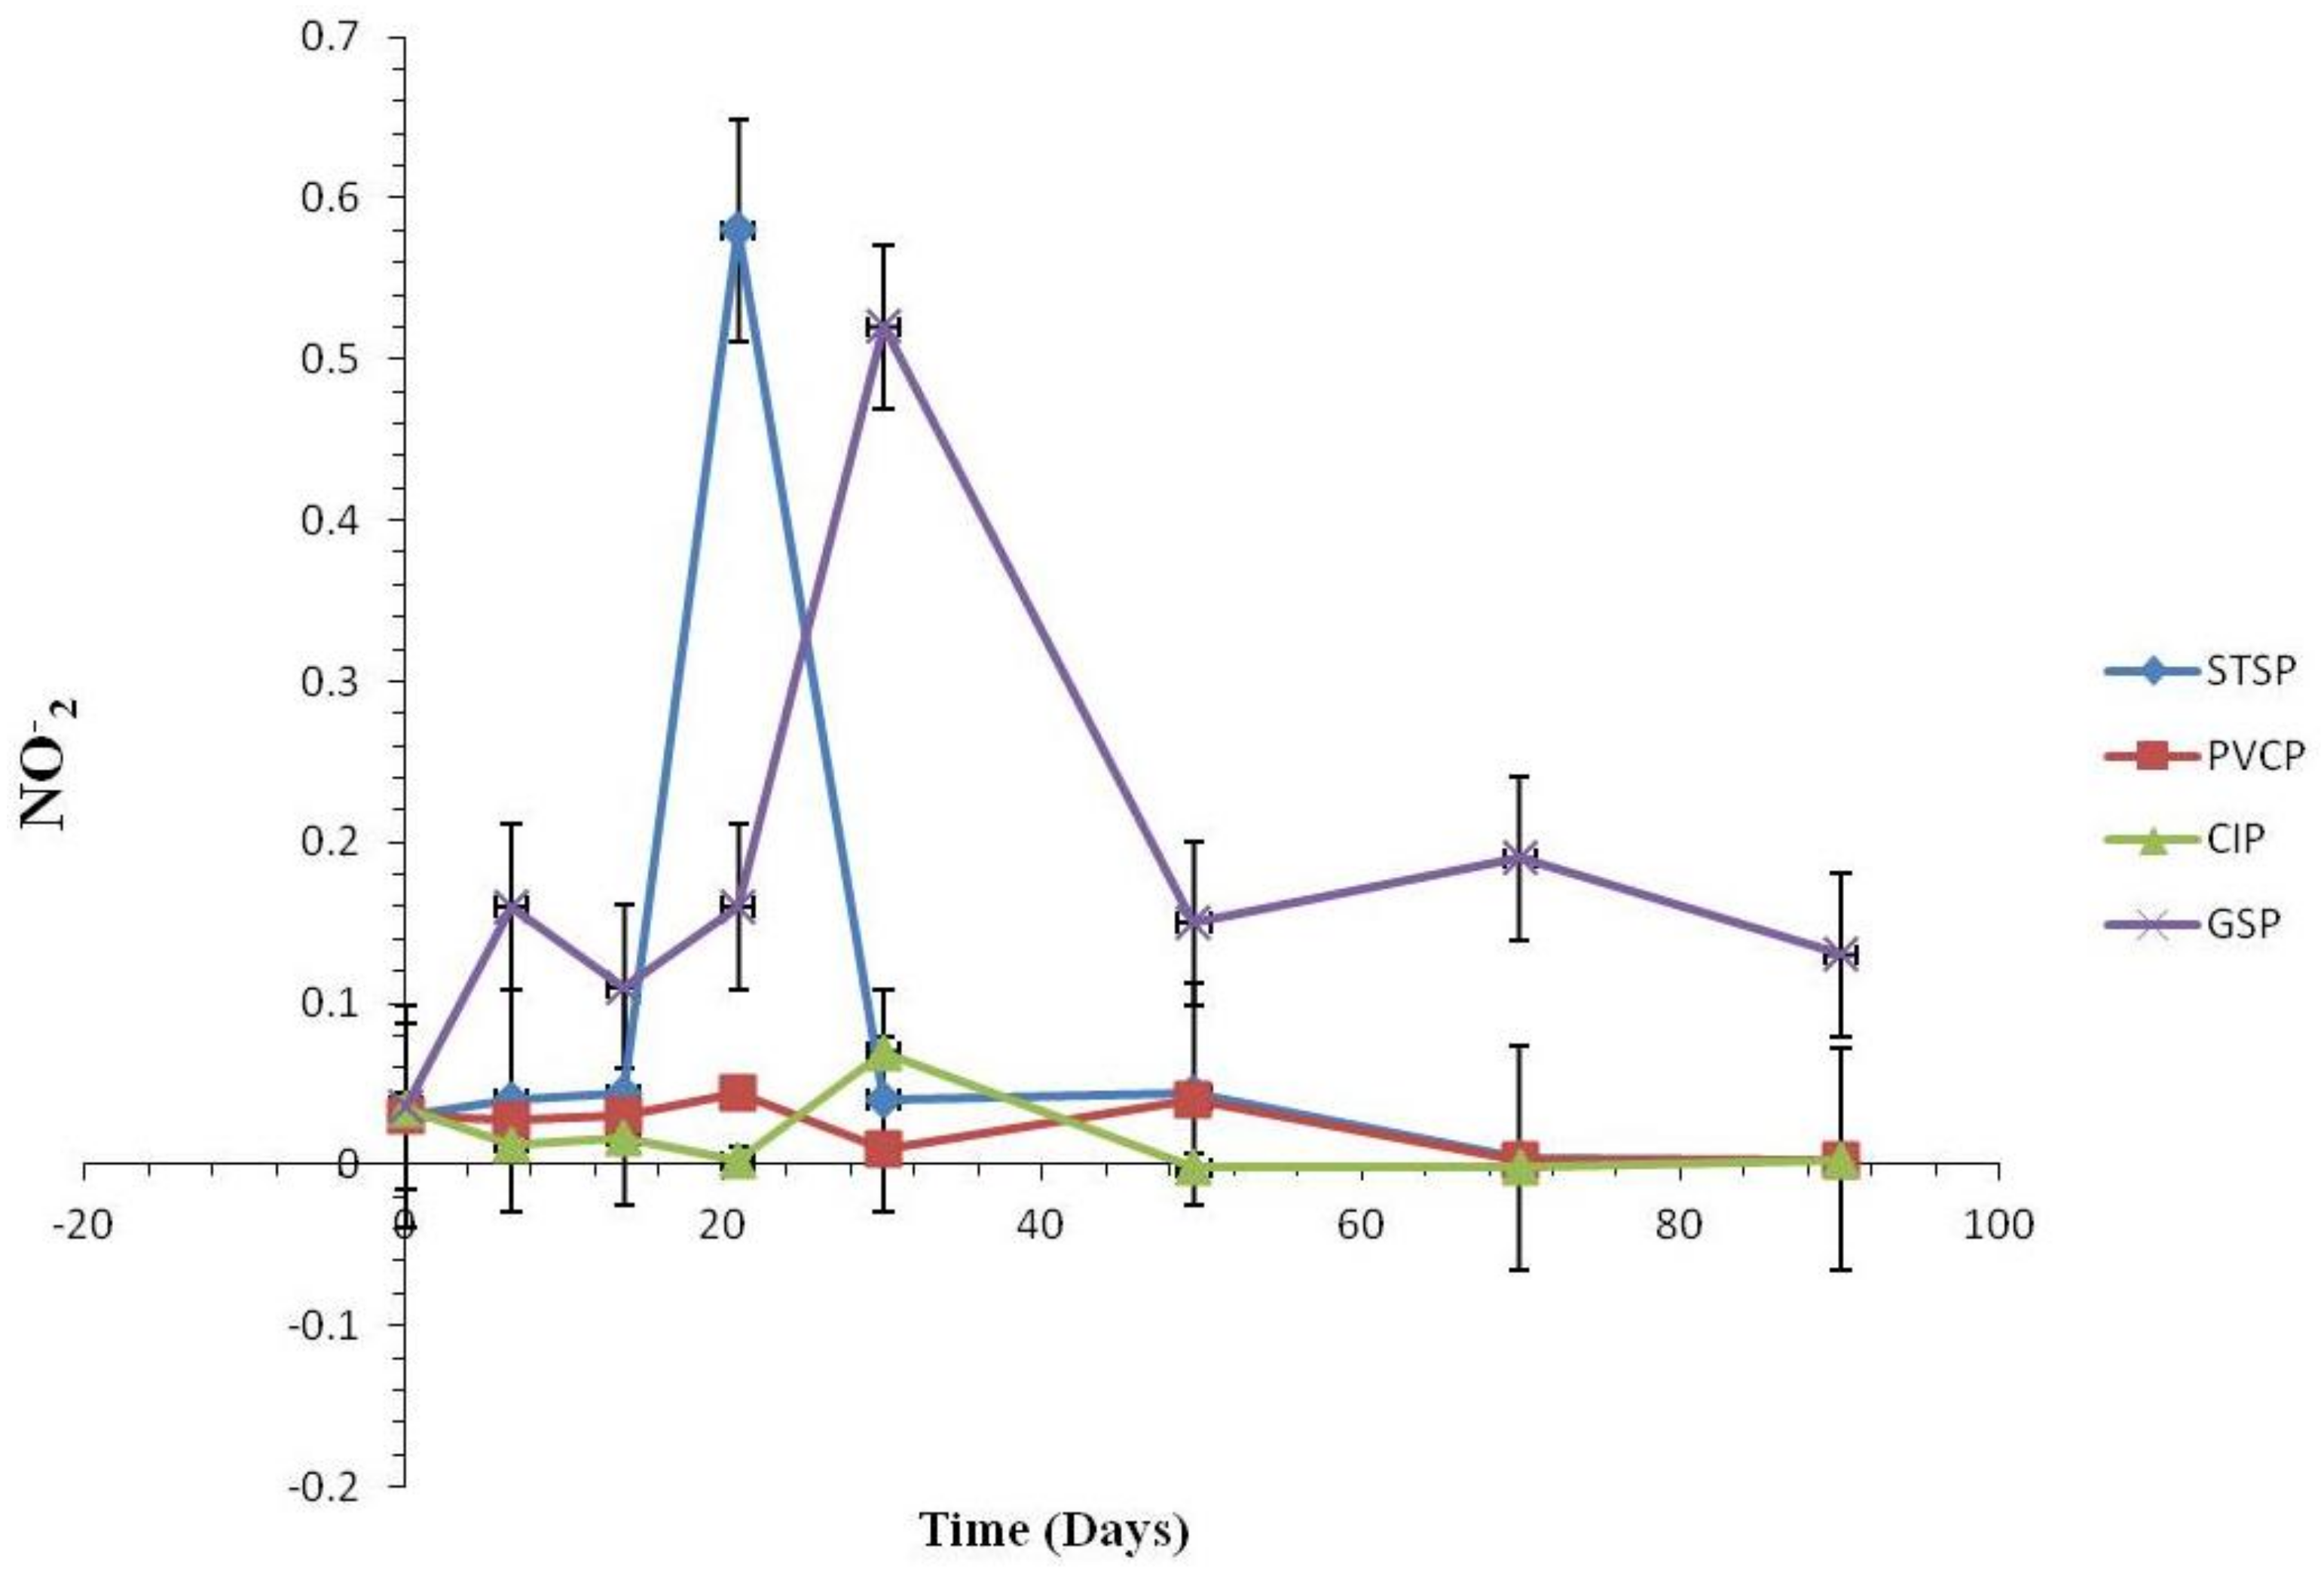
Effect of Nitrification and Denitrification

As in Equations (4) and (5), nitrification in the water progresses, where C5H7O2N means nitrification bacteria. Nitrification results in decreasing pH as the additional acid produced by nitrification is added to the acid in the initial influent.
NH4+ + 1.9O2 + 0.0172HCO3 + 0.069CO2 → 0.0172C5H7O2N + 0.983NO2 + 0.966H2O +1.97H+
NO2 + 0.00875NH4+ + 0.035CO2 + 0.00875HCO3 + 0.456O2 + 0.00875H2O → 0.00875C5H7O2 + 1.0NO3
Nitrification reduces alkalinity and residual chloramines as it increases the concentration of NO3 nitrate and NO2 nitrite as well as the microbial count, degrading water quality. In the end, maintaining biologically stable and safe residual chloramines requires the prevention of nitrification. [11].
Figure 4 shows the ammonium reduction ratio used to verify the nitrification by the types of pipes in the test pipes supplied with RW. Initially in all four-pipe types, no decrease in ammonium could be detected, but after 20 days, it was reduced by 94.4% in STSP and by 91.6% in PVCP. Through this result, it could be determined that nitrification occurred in STSP and PVCP. On the contrary, the reduction ratio of ammonia in CIP and GSP did not exceed 30% during the test. This may be because heavy metals are toxic against the nitrifying bacteria that play a role in nitrification. This hampered nitrification in these two pipes.
Figure 5 and Figure 6 show the changes in the nitrate and nitrite in the pipe supplied with RW. The denitrification process occurs when nitrates are used as the electron acceptor due to the oxidization of various organic and inorganic electron donators in water. As Figure 7 indicates, denitrification occurred as the concentration of nitrite dropped considerably in the beginning; it is expected that this must have caused the increase in pH.

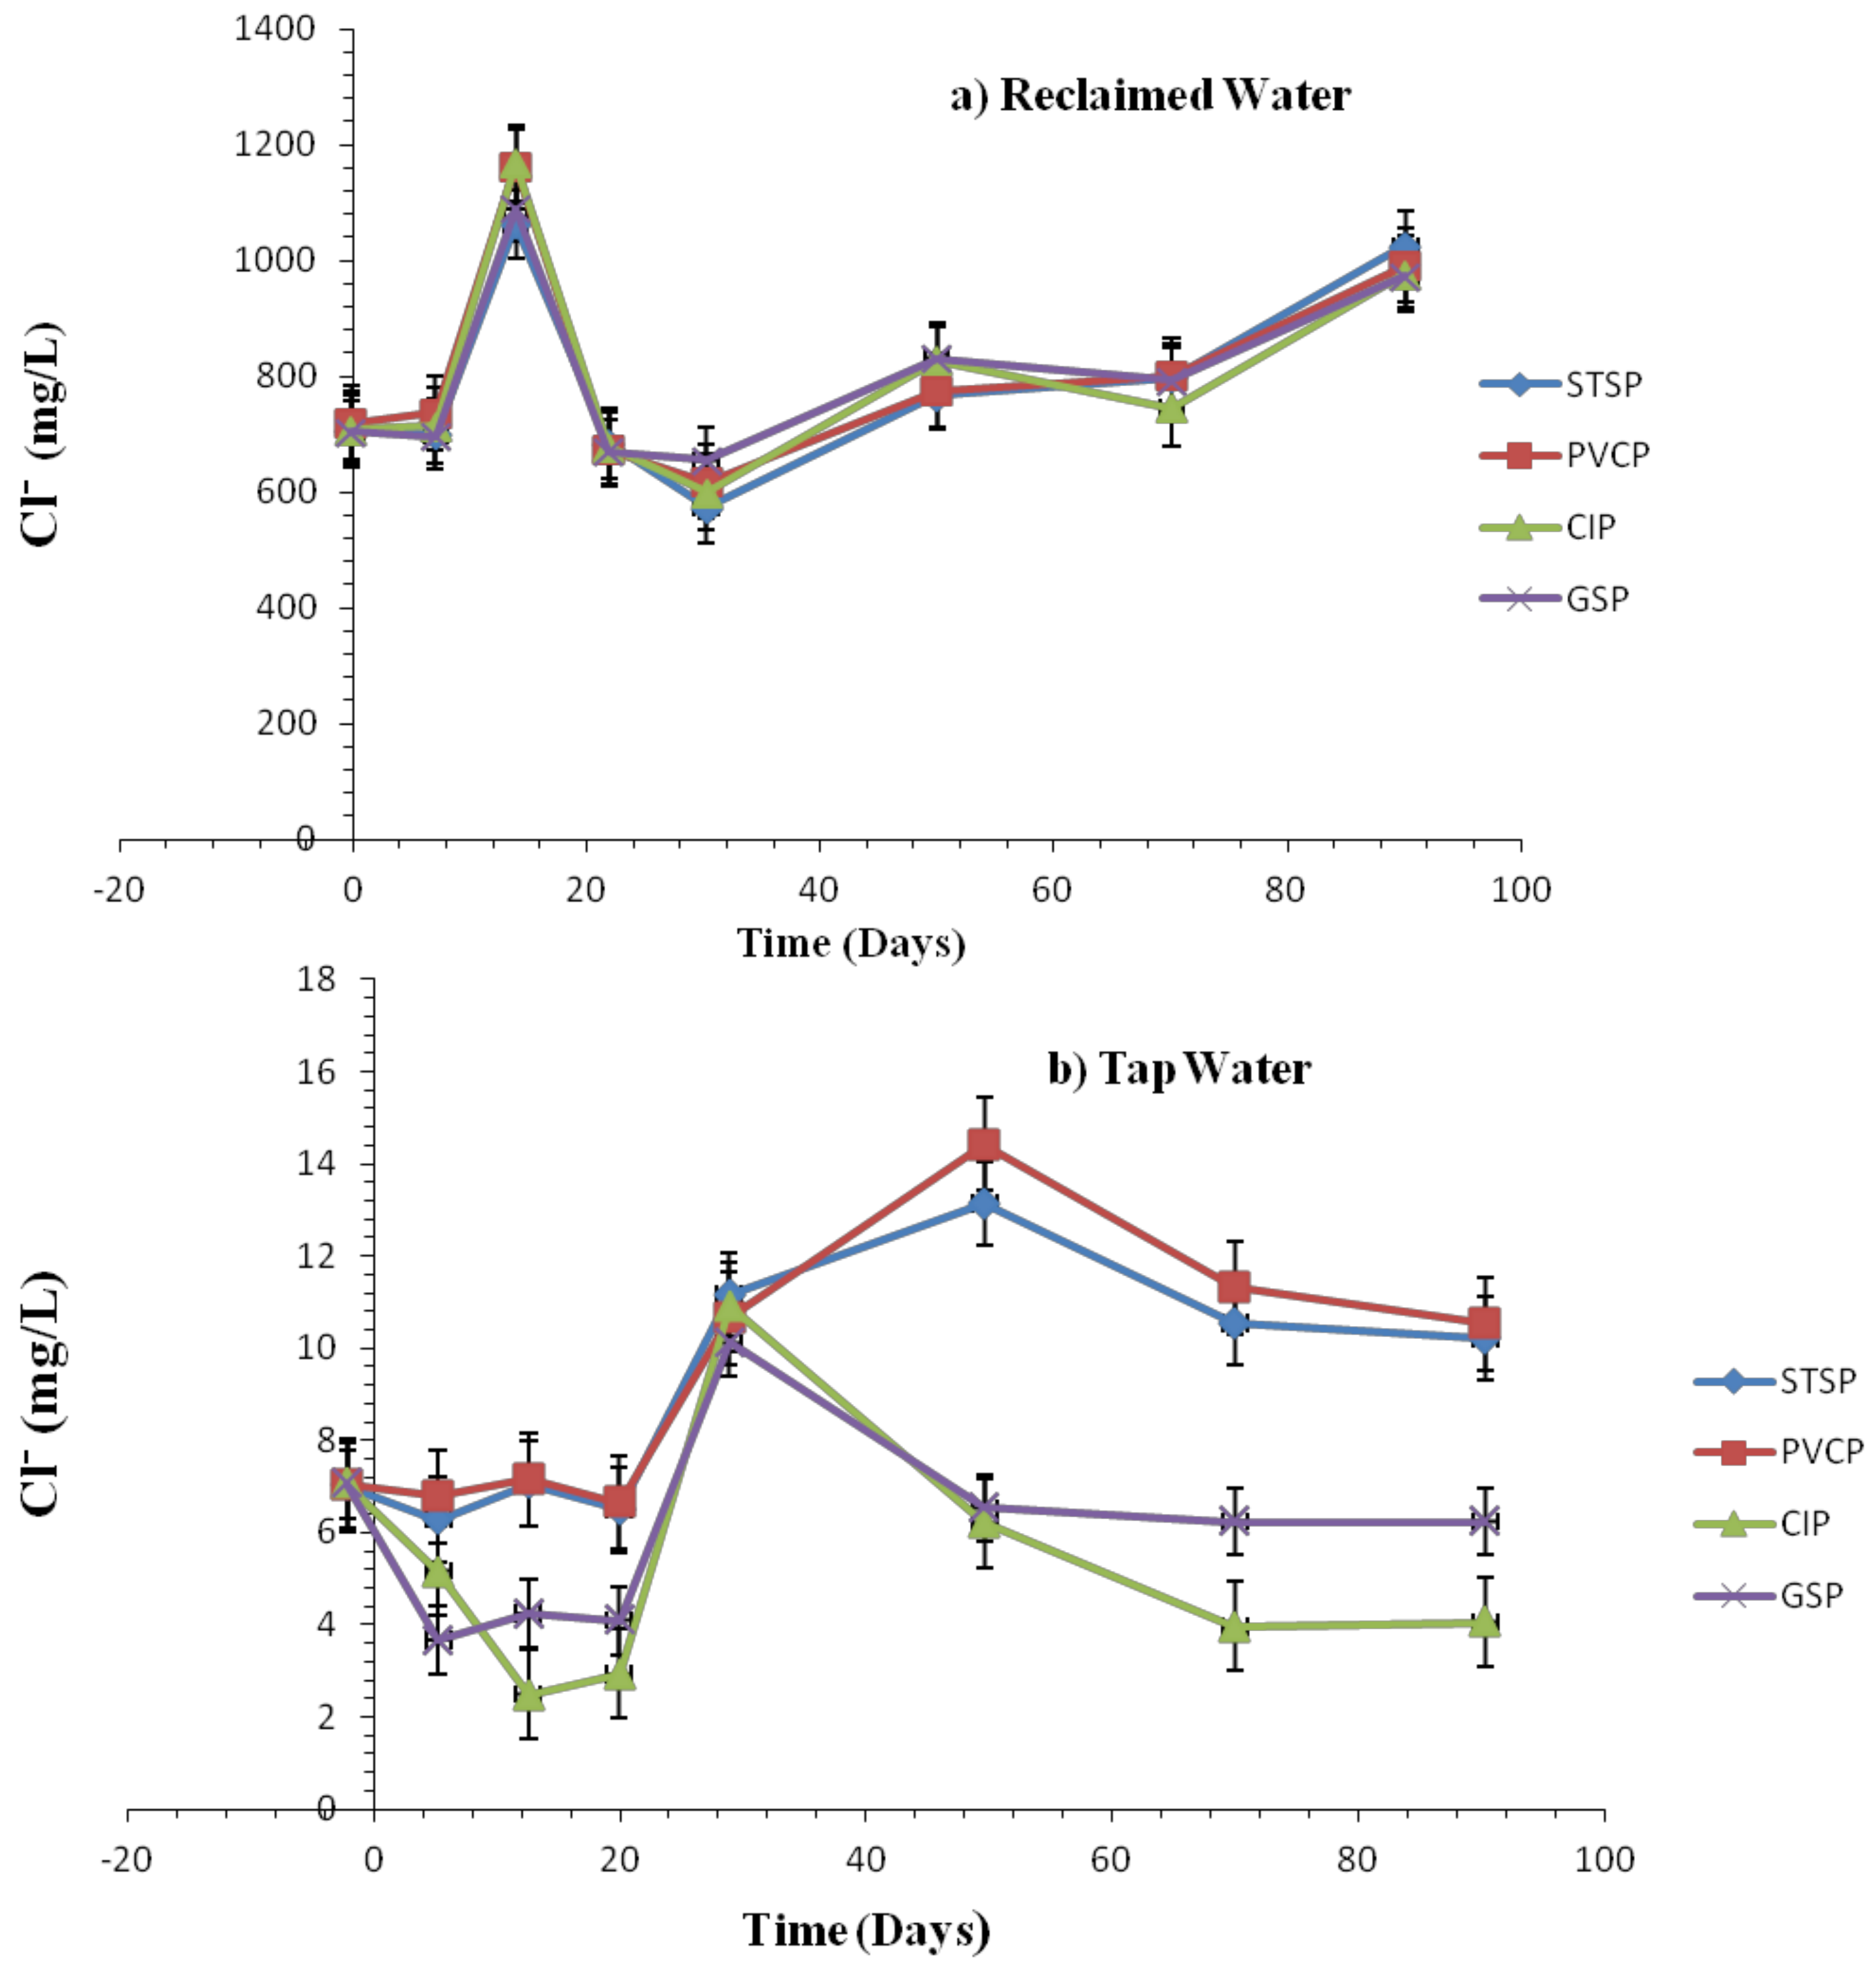
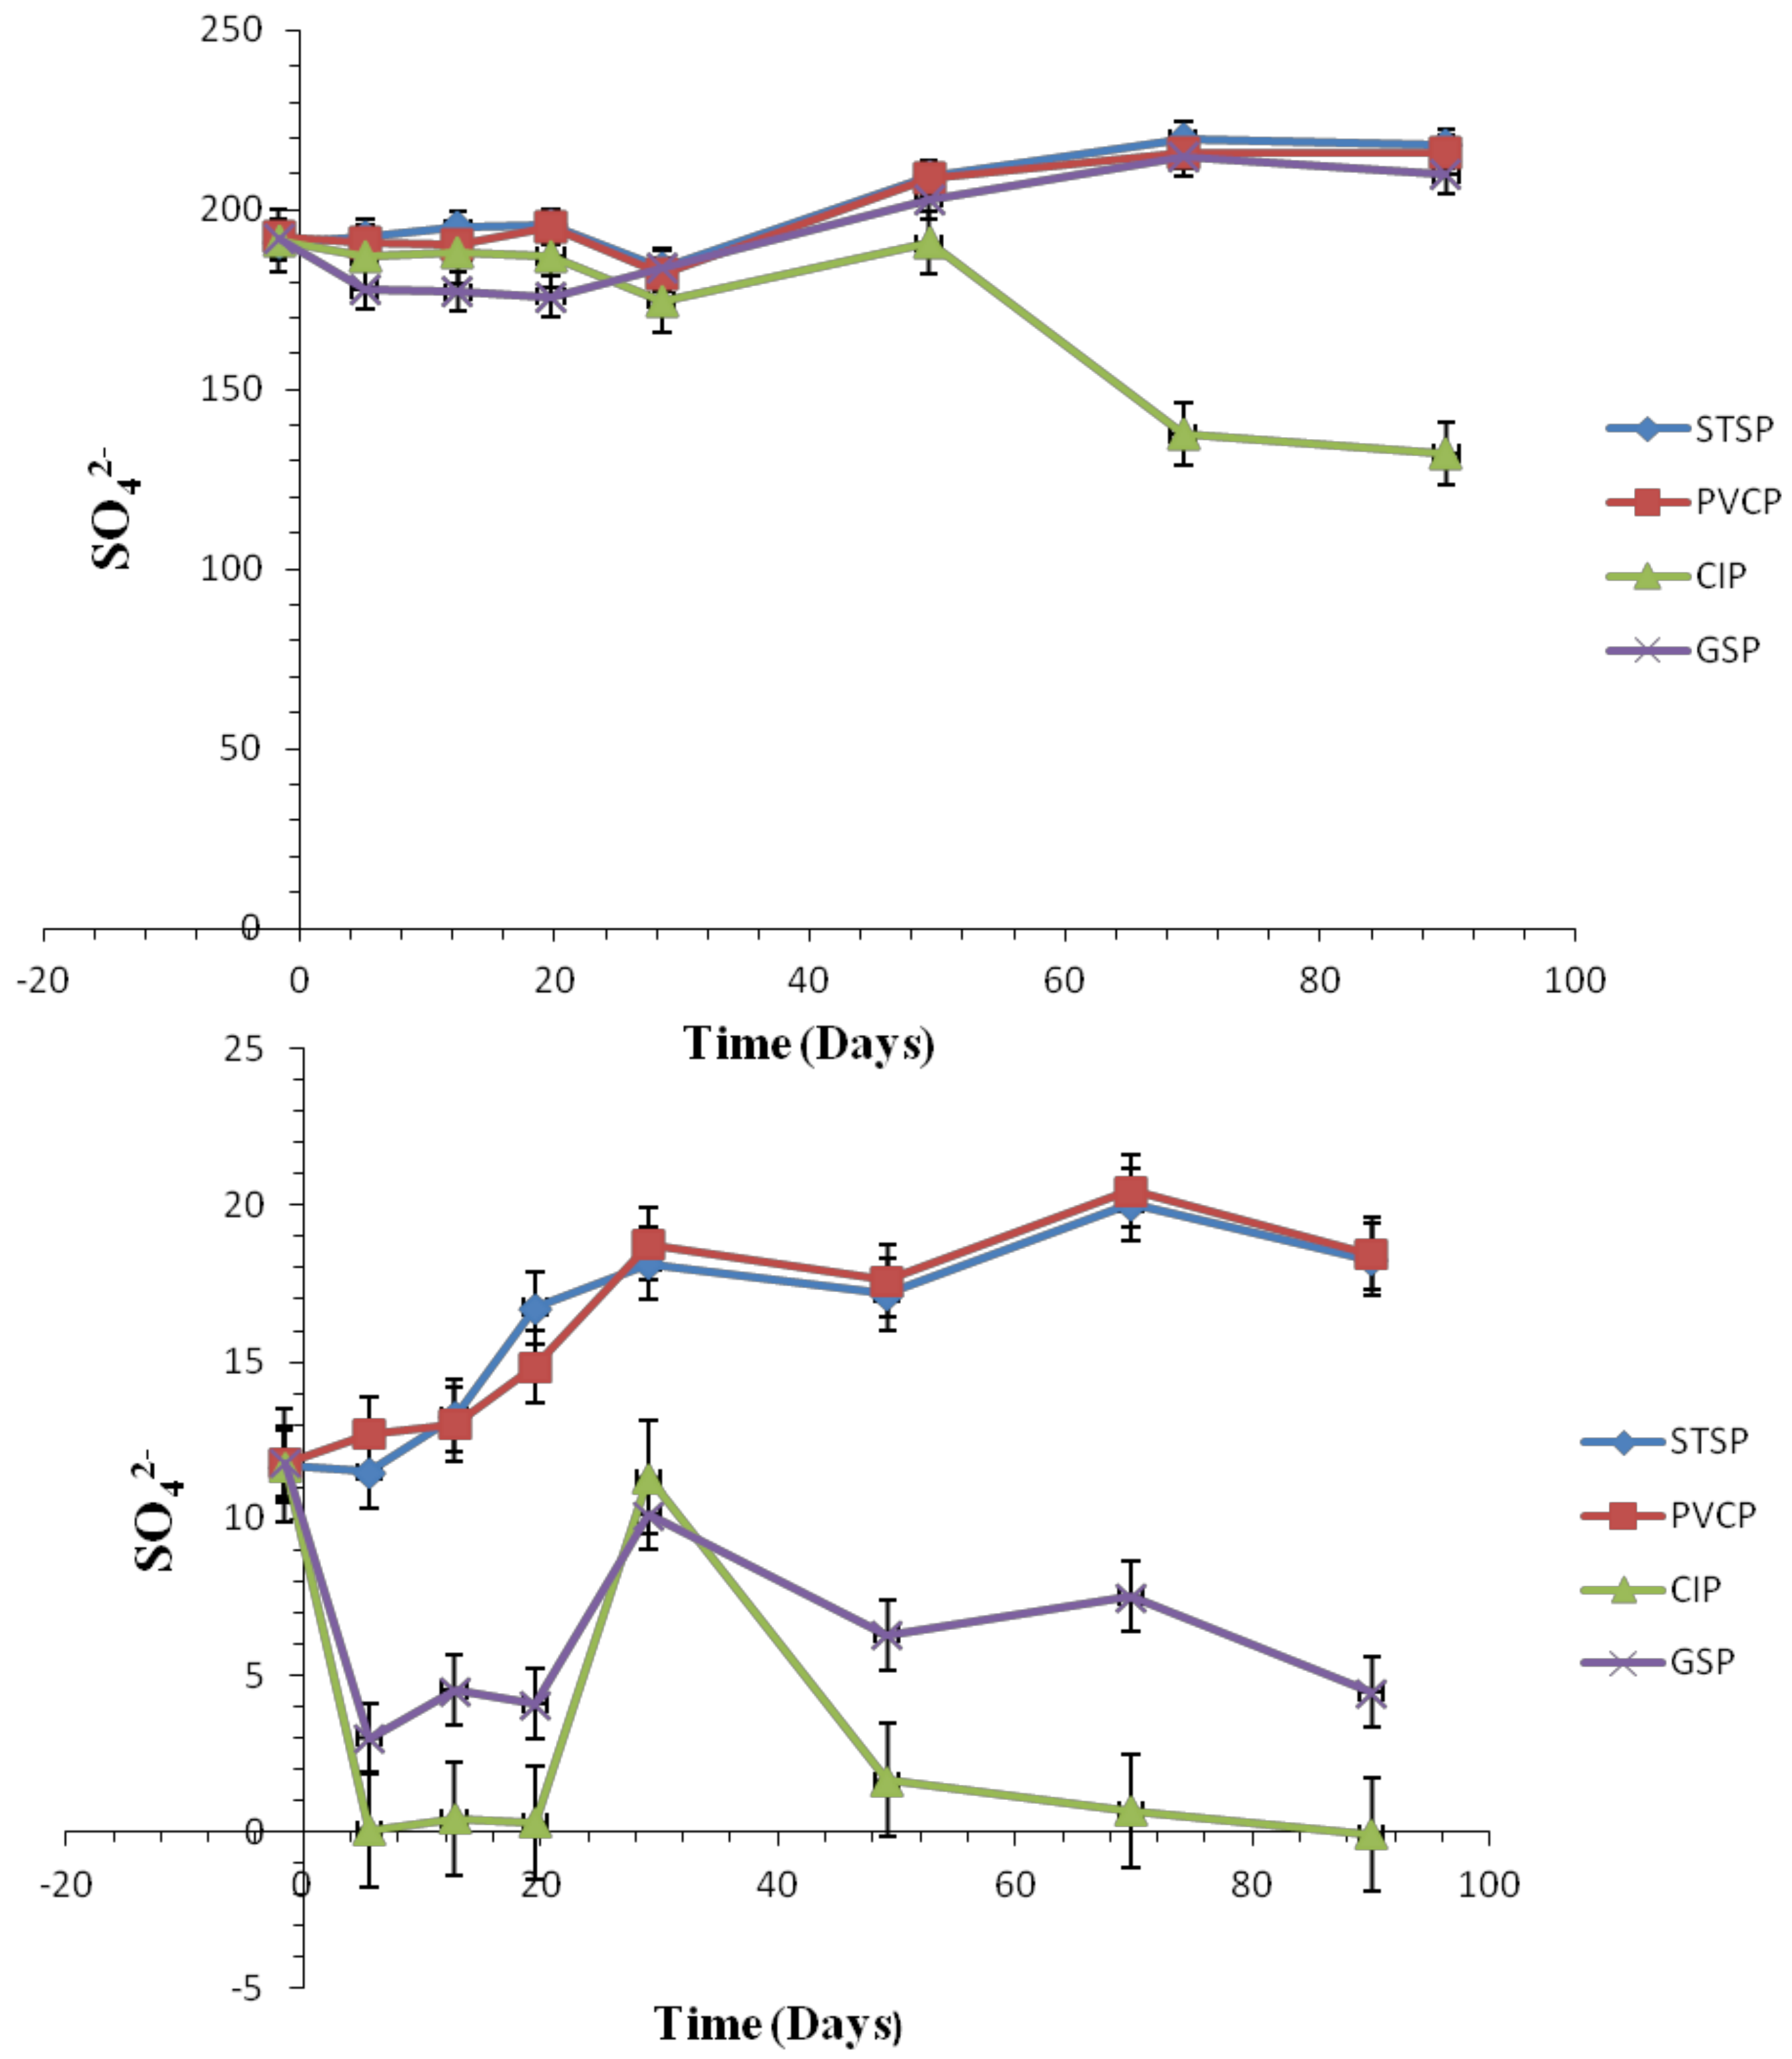
Effect of Chlorite Ions and Sulfate Ions
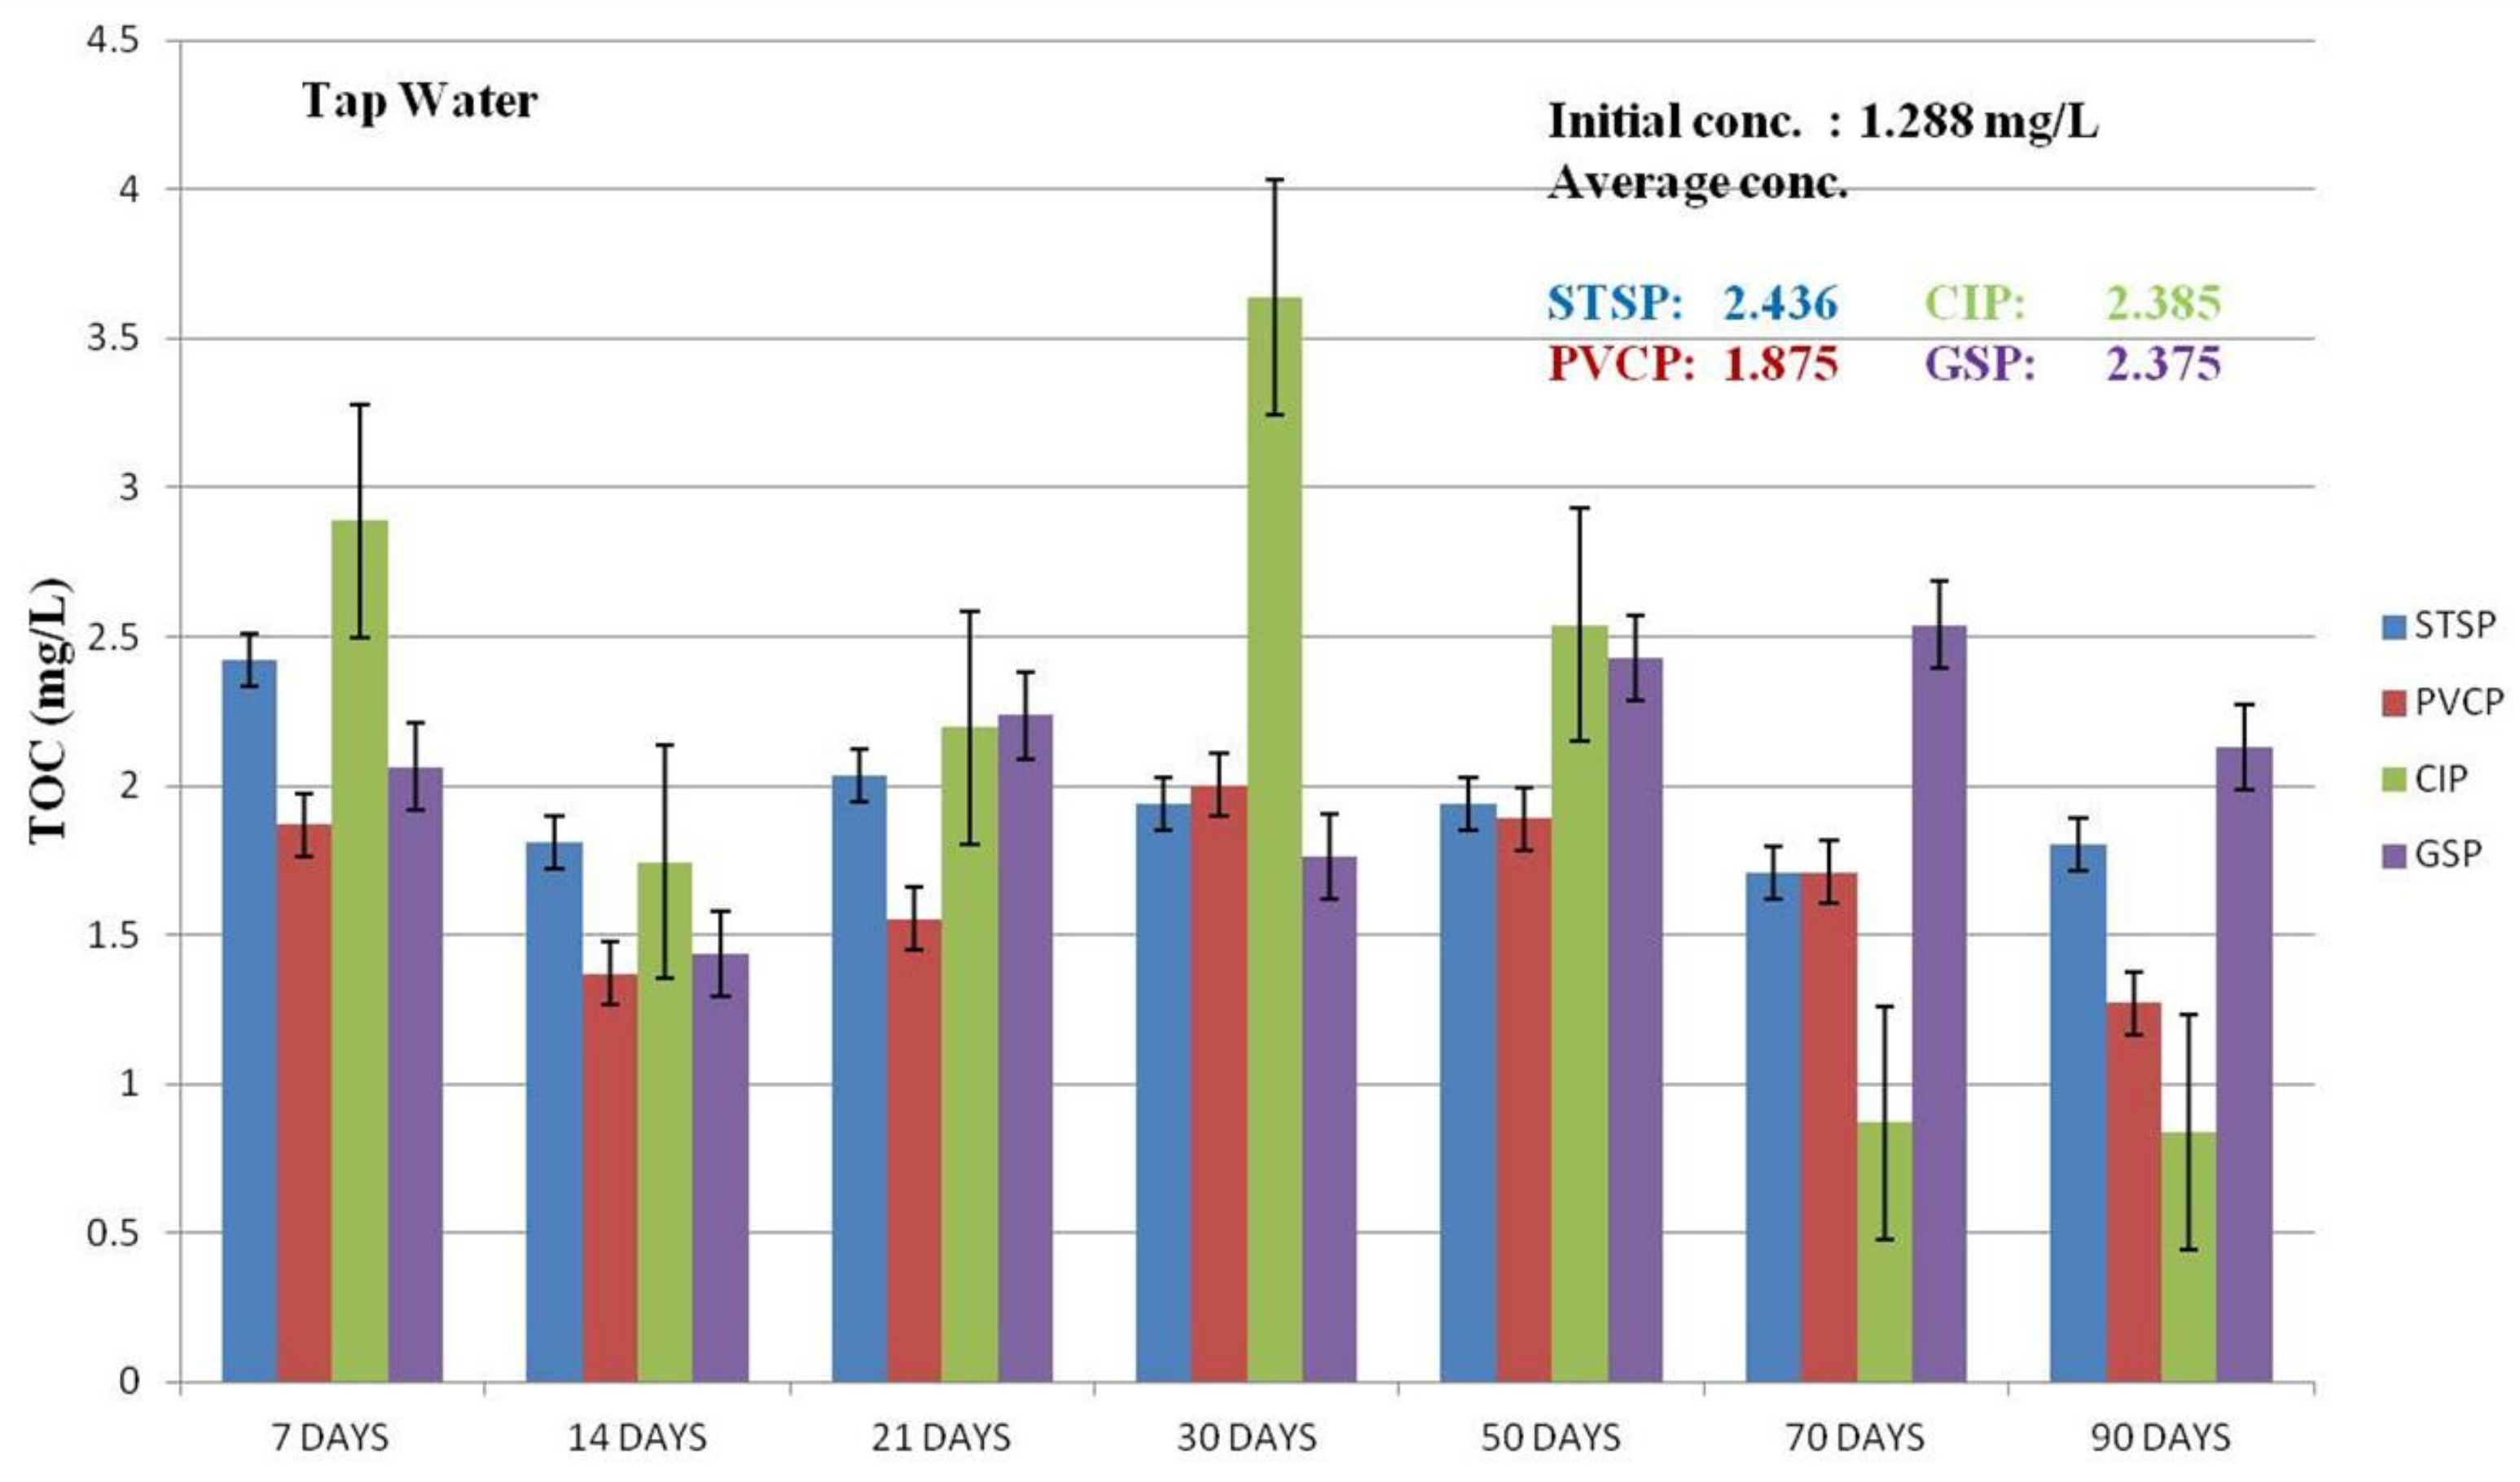
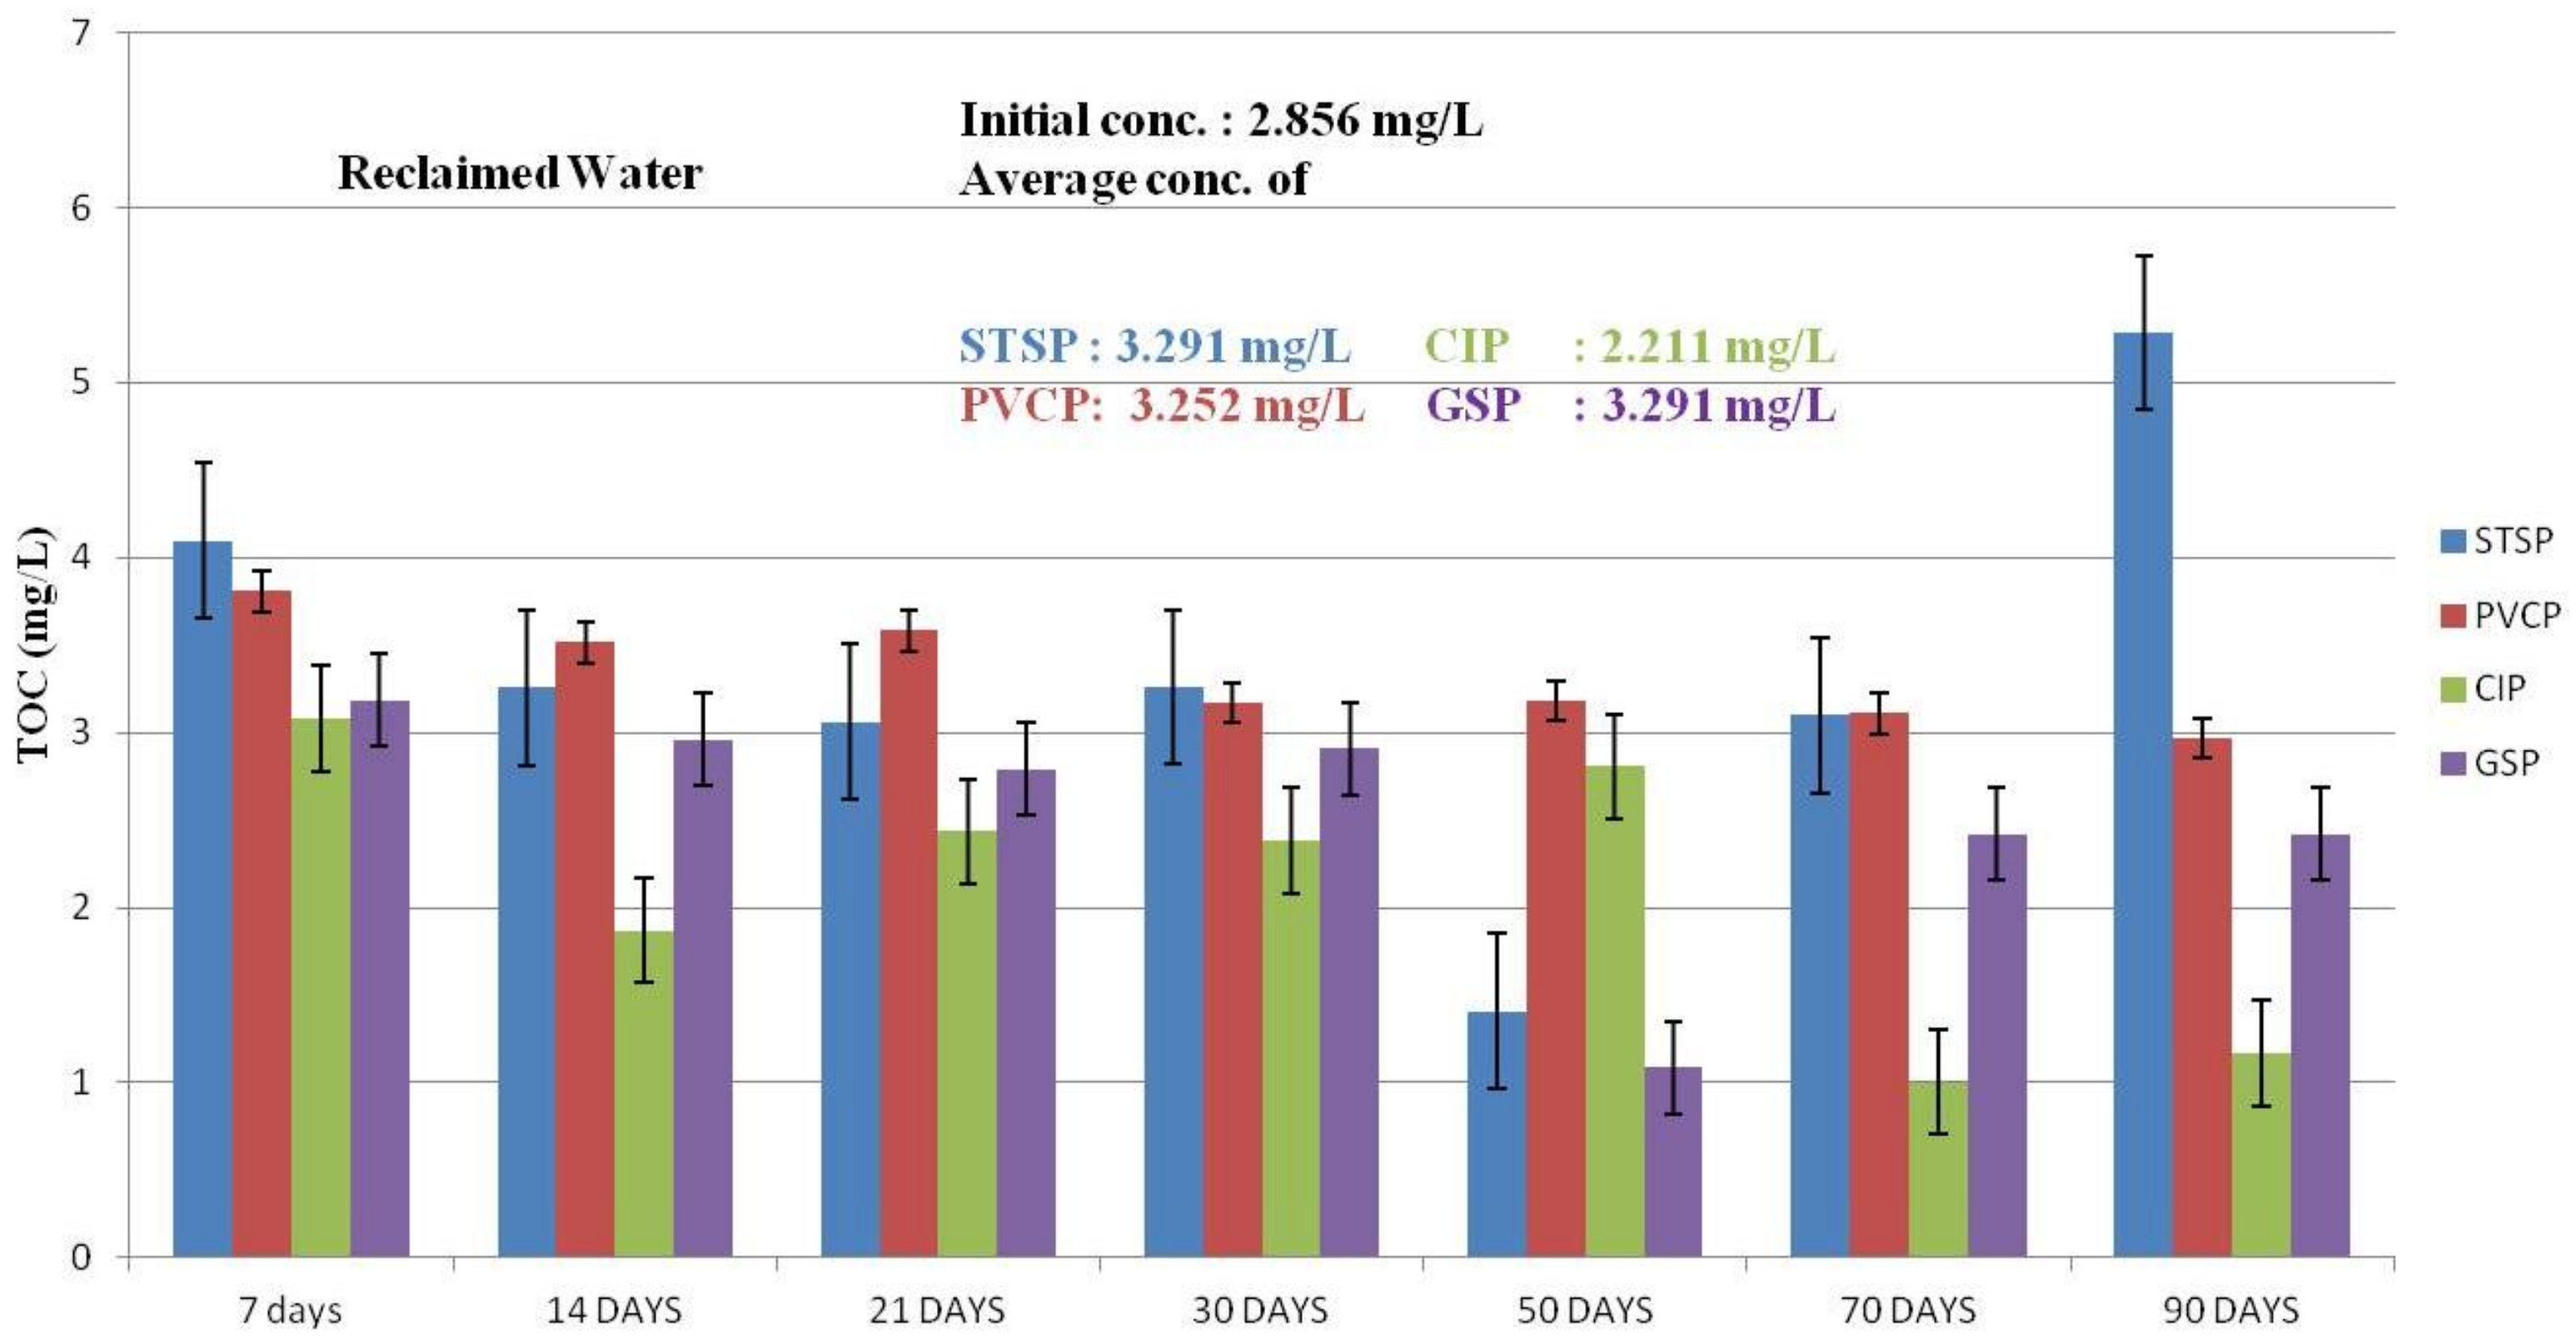
Chlorite ions play a key factor in corrosion and have the most decisive effect on corrosion of metal due to their high responsiveness; they can result in severe pitting corrosion. In the case of stainless steel pipes, the concentration of chlorite ions can be in proportional to the crevice corrosion. Chemicals like lime, sodium hydroxide, or calcium hydroxide, used to increase alkalinity in coagulating sedimentation, may reduce the corrosiveness to cast iron pipes. However, since chlorite ions can also promote pitting corrosion, the use of corrosion inhibitors is restricted in order to protect the positive electrode as in the phosphate system or the silicate system.
The chlorite ion concentration in RW was 1176 mg/L at maximum, which was between 80 and 250 times higher than that in TW. The chlorite ion concentration in RW in I city, which was used in the test, measured higher. This was due to the effect of seawater as the city is located on the coastal reclamation land, and such a high chlorite ion concentration is expected to have a decisive effect on the corrosion of the pipe supplied with RW.
Sulfate ions cause pitting corrosion on metal pipes as they dissolve metal by reacting with metal in the solution and preventing the formation of a metal protecting oxidized layer. Compared to chlorite ions, this tendency is somewhat weaker in sulfate ions; chlorite ions react with the metal three times more strongly than do the sulfate ions [12]. The high concentration of sulfate ions directly affects the activity of microbes and corrosion, while the sulfate-reducing bacteria are key factors in corrosion. The result of this study indicates that the concentration of sulfate ions in RW is ten times higher than that in TW, as shown in Figure 8.

Effect of TOC

The total organic carbon (TOC) in various factors is used by the heterotrophicbacteria to create new cell materials, and it functions as an energy source. Specifically, the TOC is a key material promoting the re-growth of microbes in water at the malnutrition state. While organic carbonates may cause corrosion by microbes by promoting their growth, the effect of organic carbonates on the inner pipe corrosion is still unclear. While organic carbonates form a film on the pipe surface to restrict corrosion, some organic carbonates are combined with metallic ions, thereby accelerating corrosion [13]. Ridgway (1982) argues that restricting corrosion is crucial in controlling microbes in water supply pipes where organic carbonates exist. The microbes count increased as the TOC and dissolved oxygen concentration decreased, due to microbes that grew while consuming the dissolved oxygen and TOC [14].
This study analyzed the effect of organic carbonates on the corrosion of supply pipes in RW and TW by using the simulated test device for water distribution. The analysis of organic carbonates, the test variable, was determined by TOC concentration, while the initial TOC concentration of RW and TW was 2.86 mg/L and 1.29 mg/L, respectively.
During the test period, the average TOC concentration in STSP, PVCP, CIP, and GSP of RW was 3.29, 3.25, 2.21, and 2.59 mg/L, showing the relatively higher concentration in STSP and PVCP for 50 days. The TOC concentration in STSP gradually decreased as time passed. After 50 days, it plummeted to 1.1–1.4 mg/L; then at 90 days, it surged to 3.1 and 5.7 mg/L. Although the TOC concentration of PVCP somewhat decreased, it was relatively steady between 2.9 and 3.8 mg/L. As for CIP, the TOC concentration, measured on the 14th day, decreased to 1.88 mg/L. As for GSP, the TOC concentration did not show much change for 30 days. On the 50th day, it dropped to 1.08 mg/L, and after the 70th day, it maintained its TOC concentration.
The TOC concentration analysis during the test period on the water coupons supplied with TW showed that the average TOC concentration of the effluent in STSP, PVCP, CIP, and GSP was 2.38, 1.88, 2.39, and 2.44 mg/L, respectively. An overall increase from the 1.29 mg/L of TOC concentration in the TW before it was supplied to the test device.
Kim et al. (2007) also observed the change in the TOC concentration over time of two coupons whose initial TOC concentration in TW was 0.15 mg/L (control group) and 2.10 mg/L (test group), respectively [13] The results showed that the TOC concentration in the two groups increased to 0.48 and 0.68 mg/L, and 0.37 and 0.51 mg/L, respectively. The researchers determined that such a result was due to the residual rust inhibitor used in iron slides during the test. It seems that a more quantitative and qualitative analysis is required for organic carbonates that can be eluded from the pipe coupons. It is also believed that organic carbonates can be used by the biofilm on the pipes and so microbes in the water should be considered. Figure 9 and Figure 10 show the change in the TOC concentration in RW and TW as time passes.

3.2. Corrosion Rate by Tested Water

The test result on the weight loss was analyzed by testing the water and pipe materials to detect the corrosion rate of each pipe material in relation to RW and TW. Before measuring the weight to determine the difference between the corrosion rates, a few procedures were followed. The coupons were collected from the test device, treated with corrosive byproducts based on KS D ISO 8407:2009 (Table 4), wiped lightly with a brush, cleaned with distilled water, dried for 12 h in an oven at 105 °C, and weighed. By calculating the weight difference between the weight of the coupons after removing all the corrosive byproducts from pipe coupons that were soaked for a specified time and the initial weight of the coupons, the test compared the weight over time. The corrosion rate was converted to the rate in mdd.
While this study focused on four-pipe materials—STSP, PVCP, CIP, and GSP—it removed PVCP, non-metal material, from the calculation of the corrosion rate as it poses no risk of corrosion. The actual weight loss was negligible.

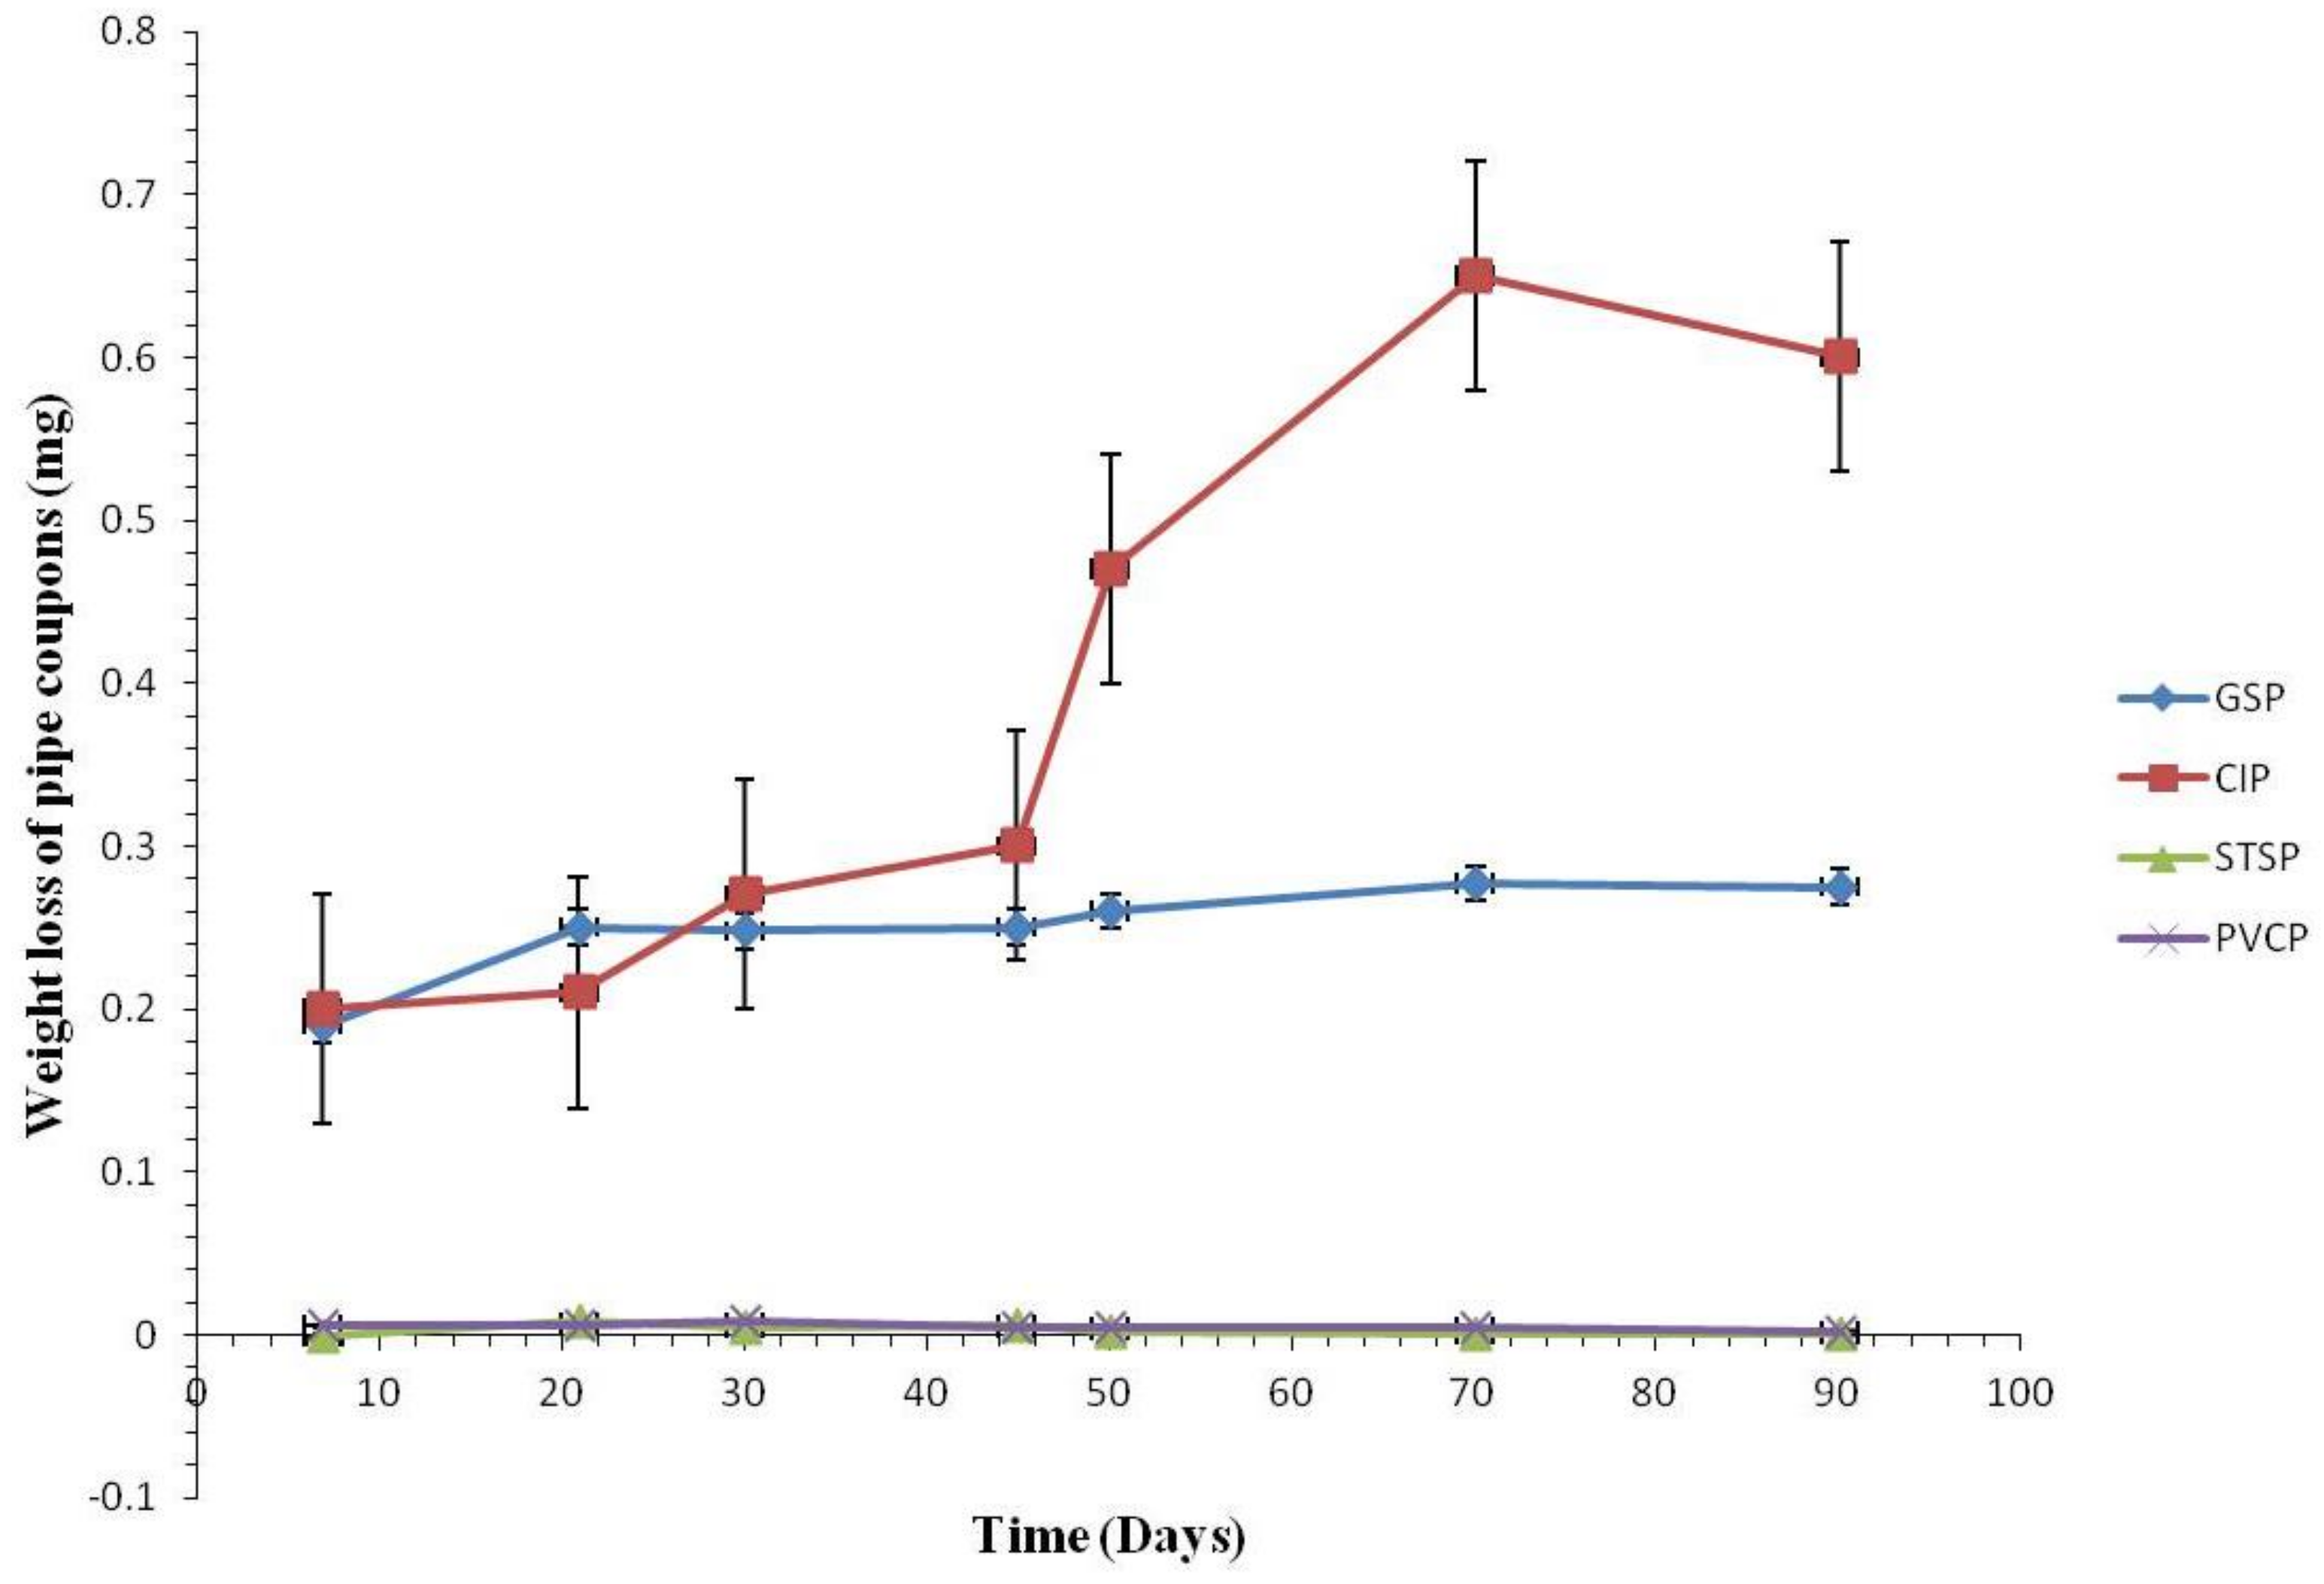
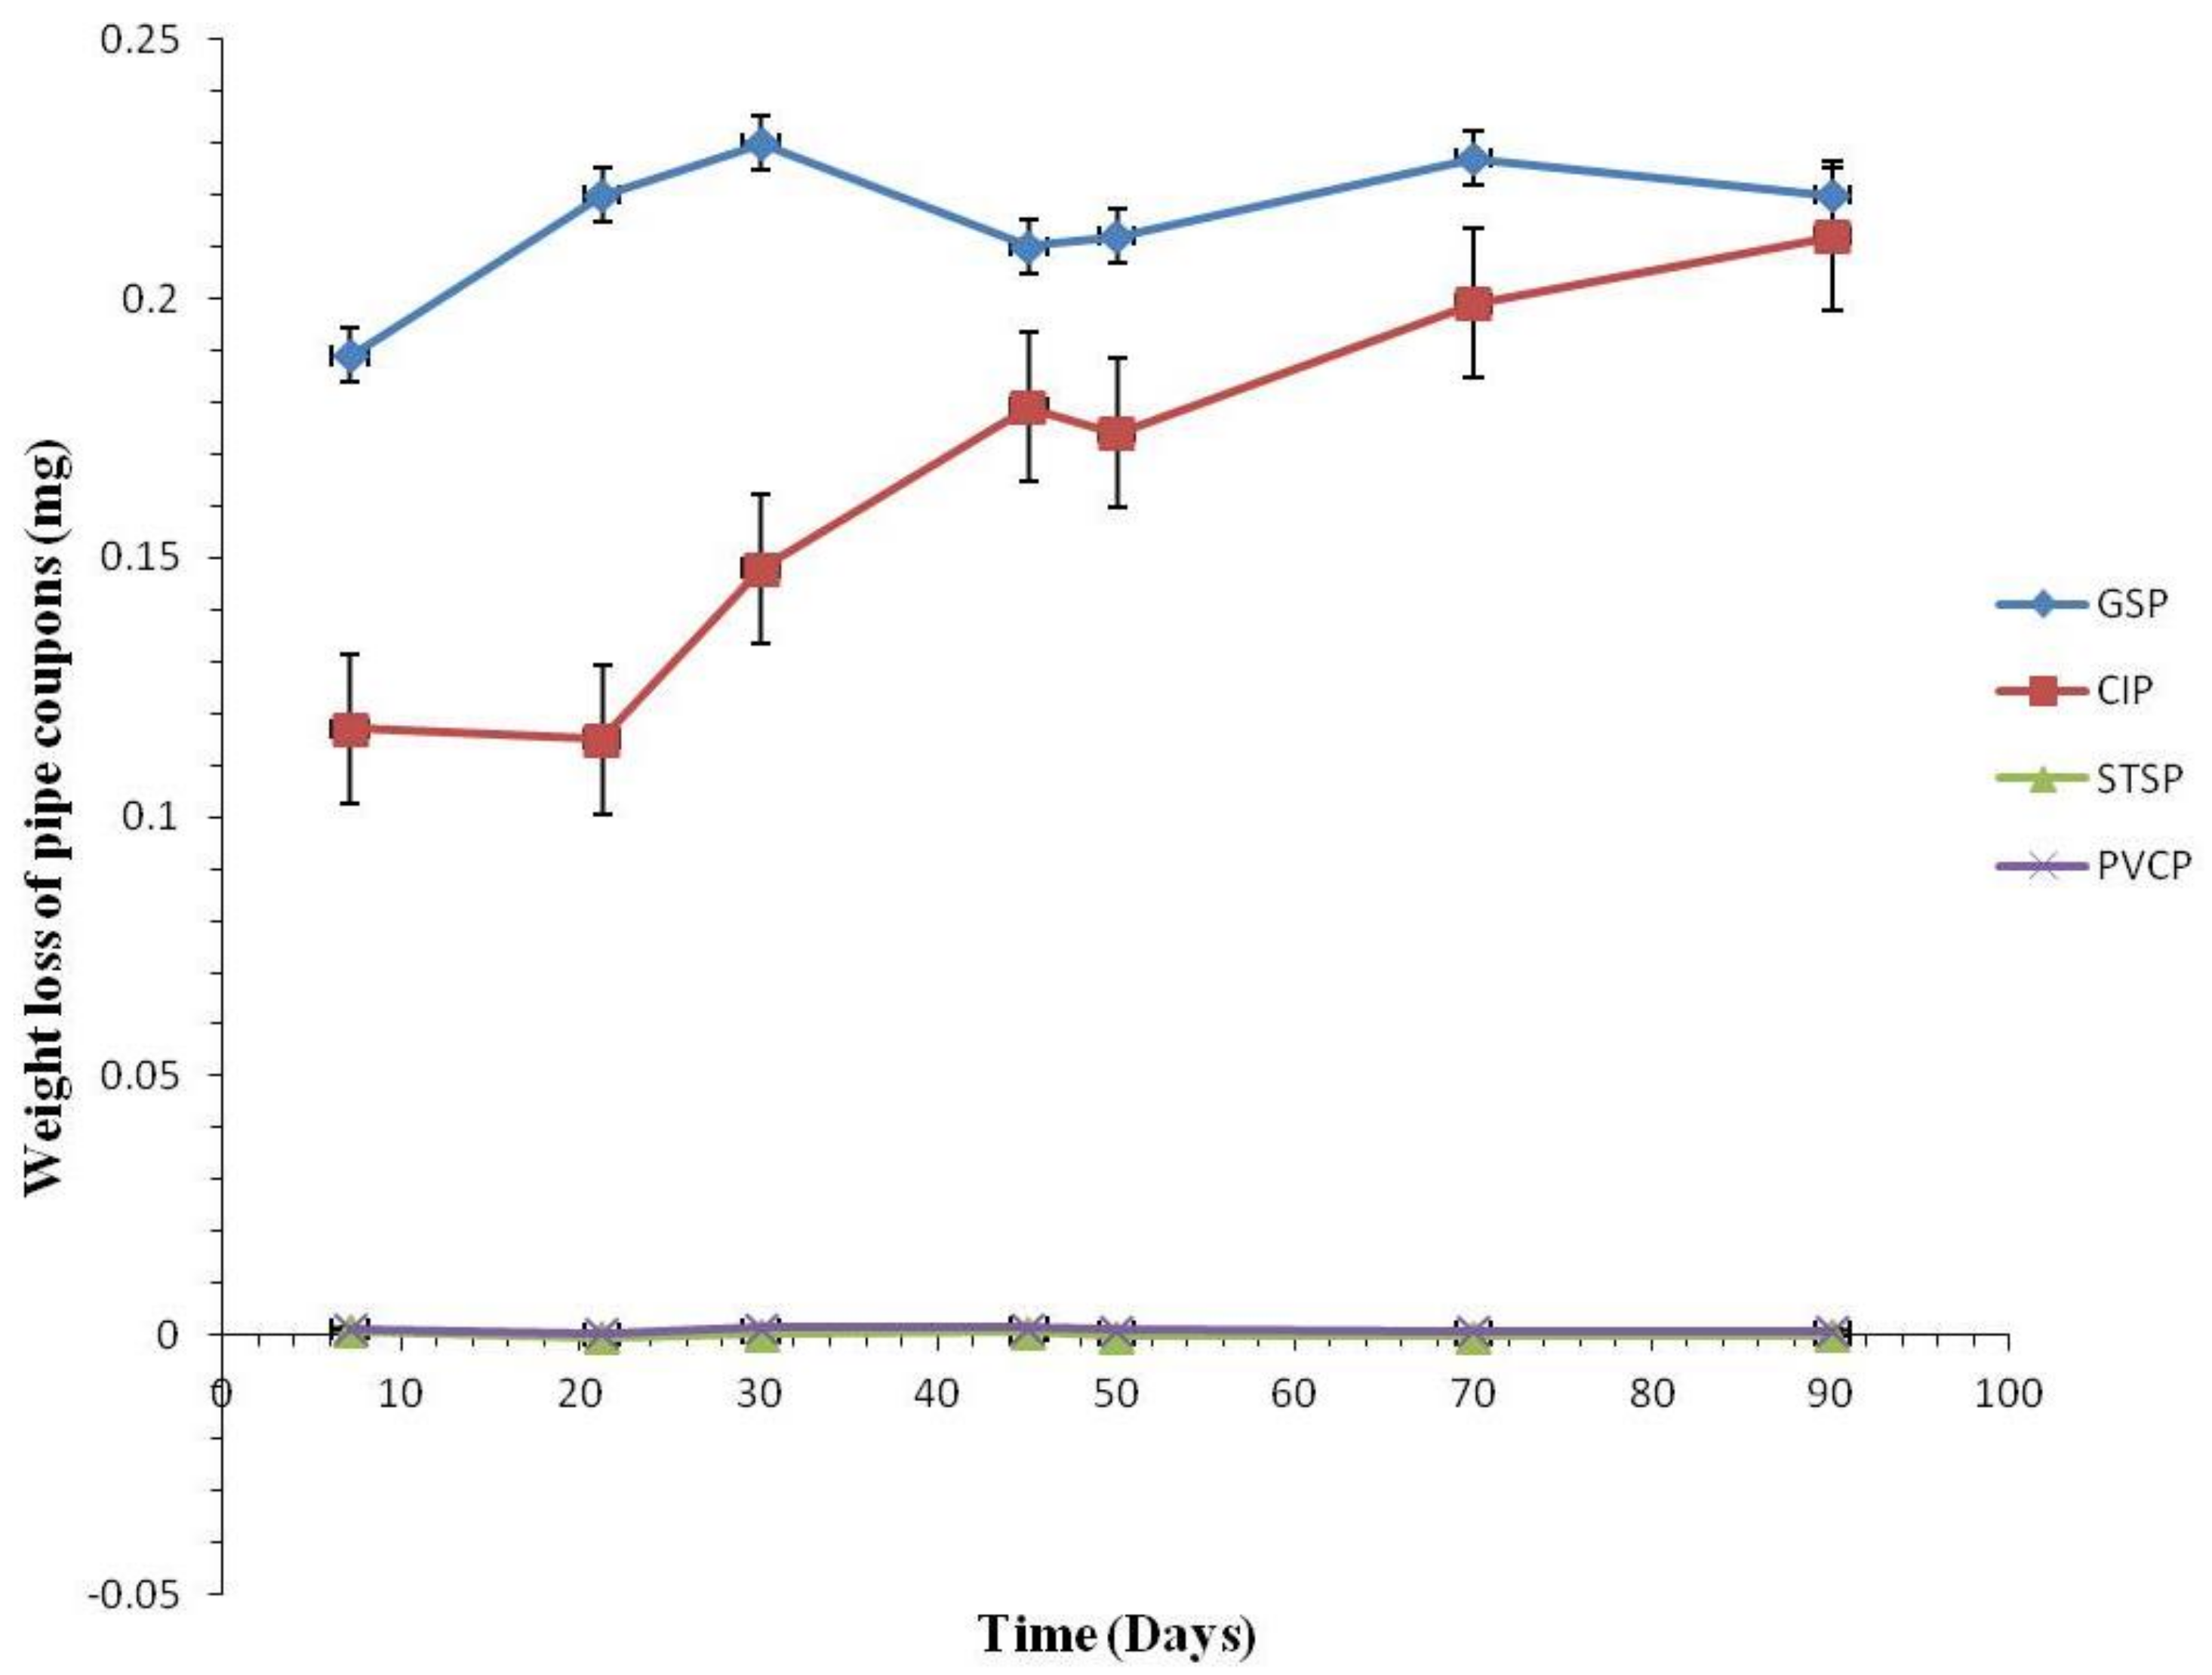
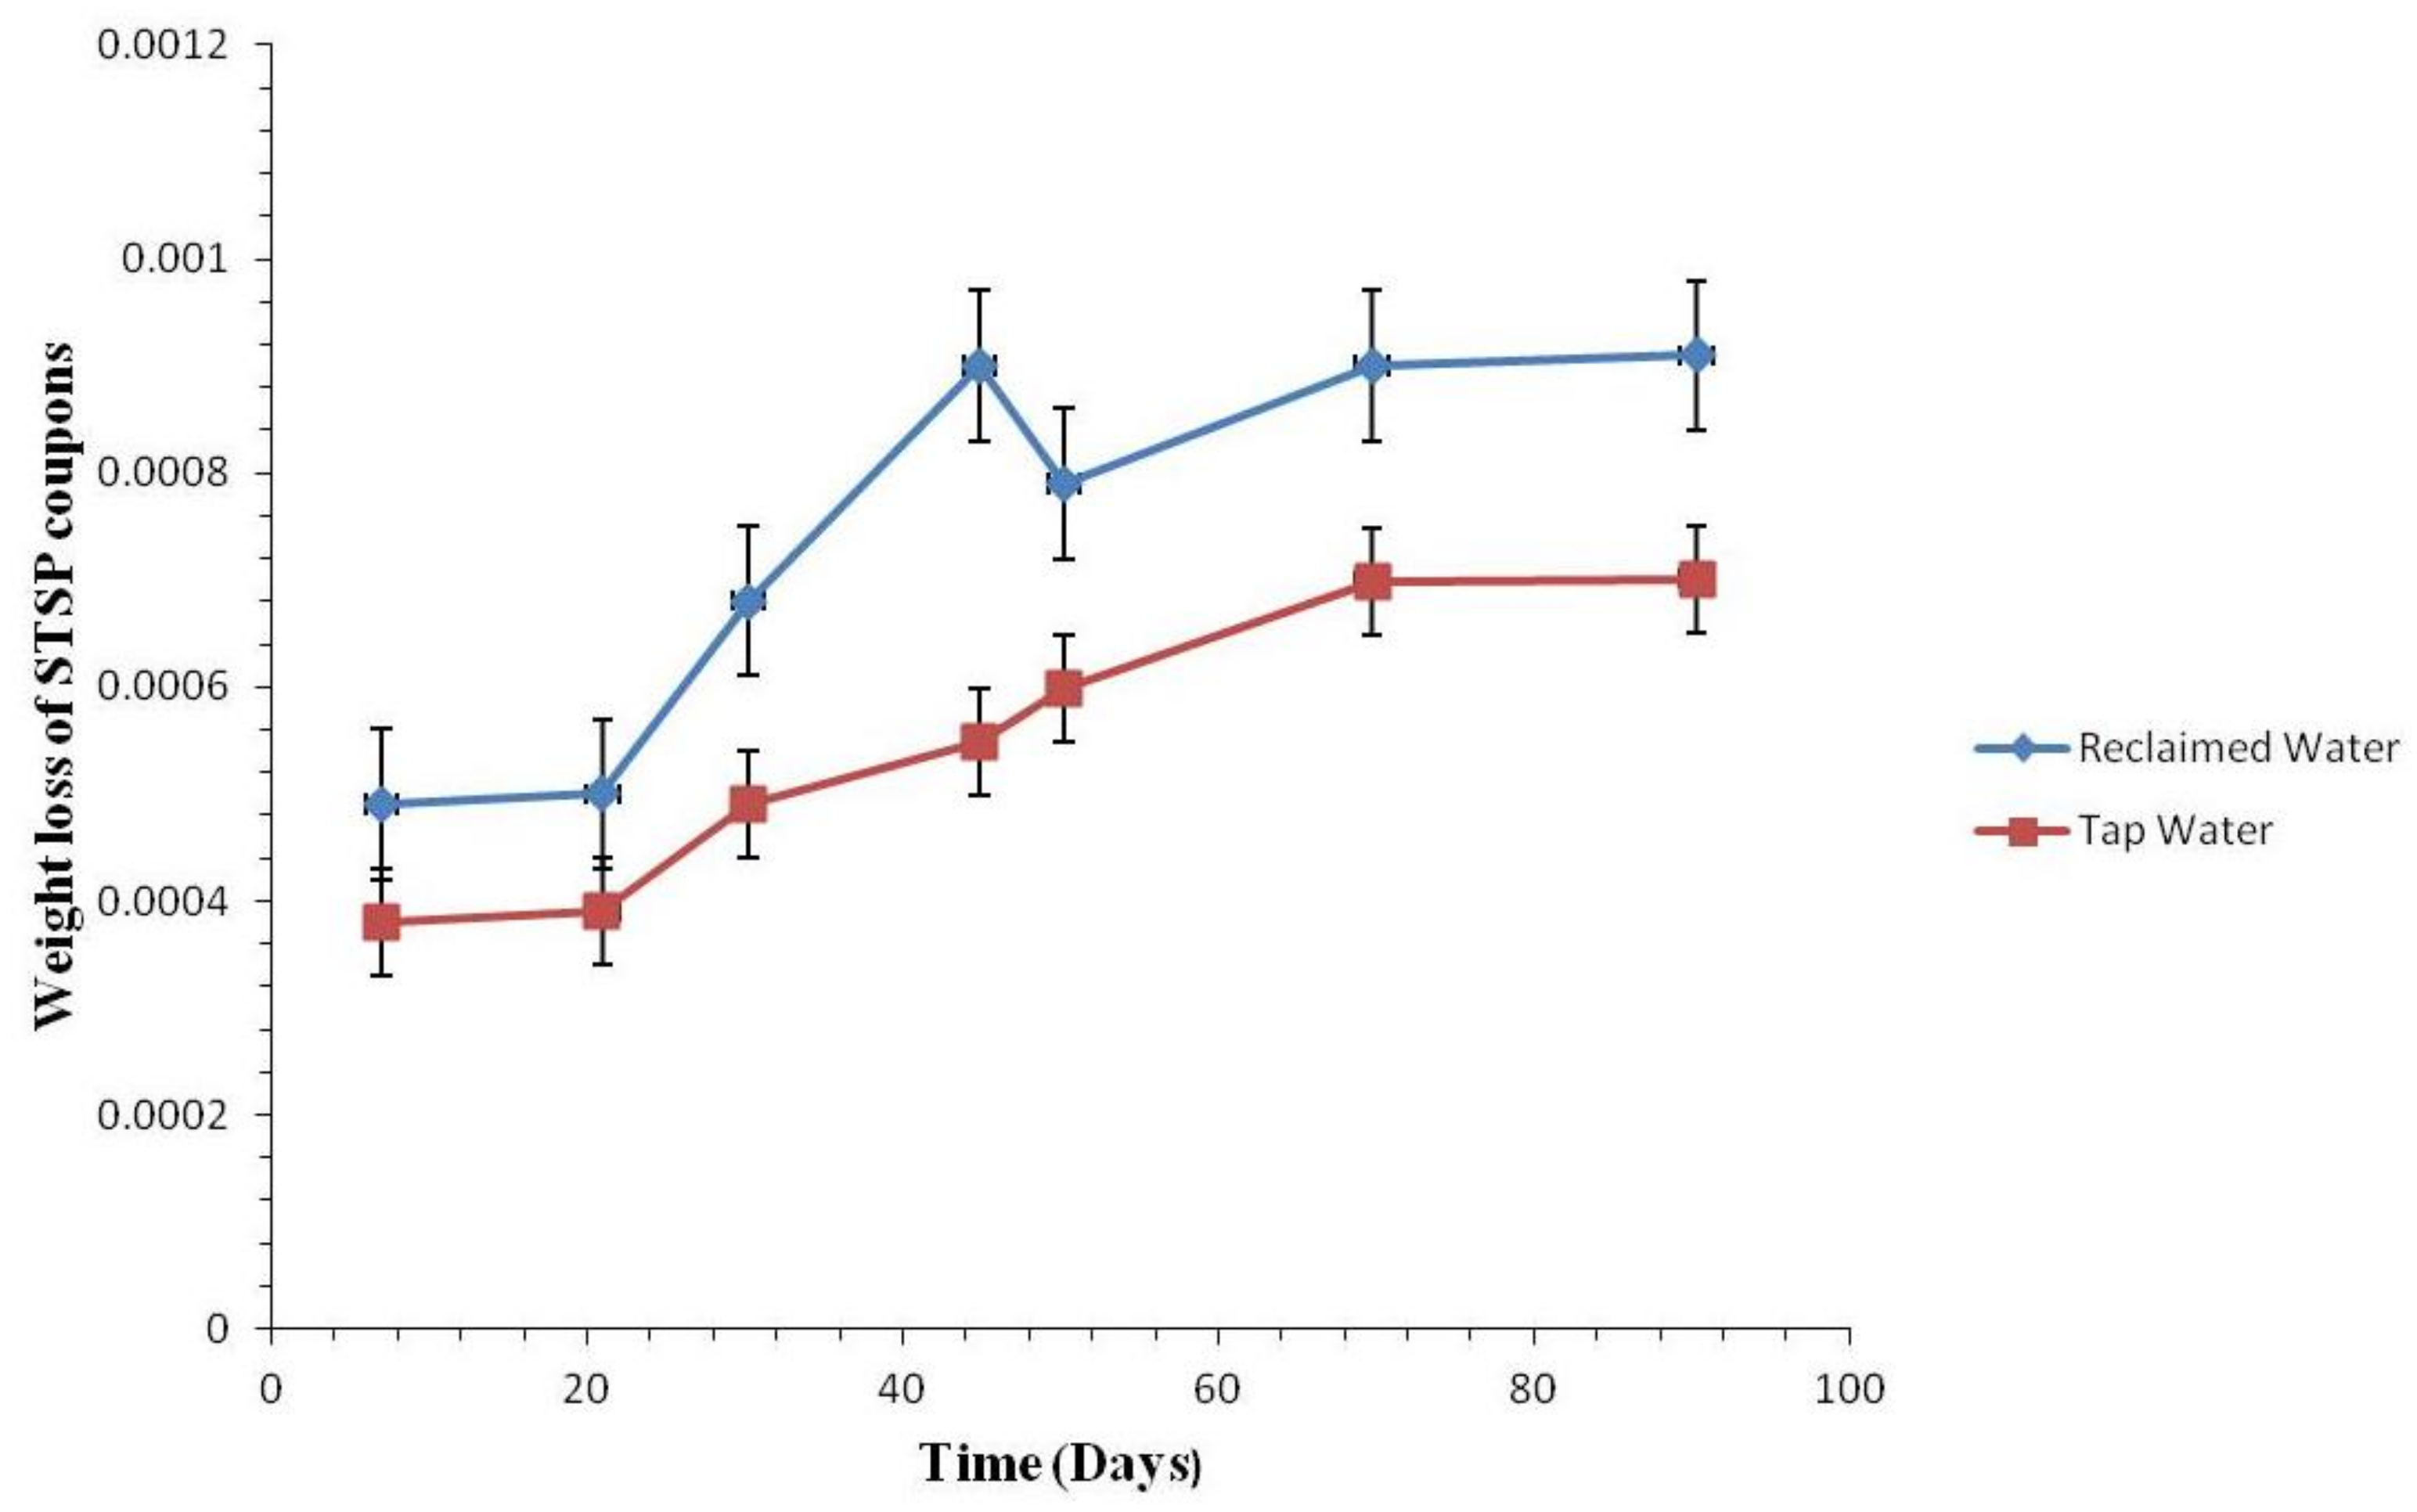
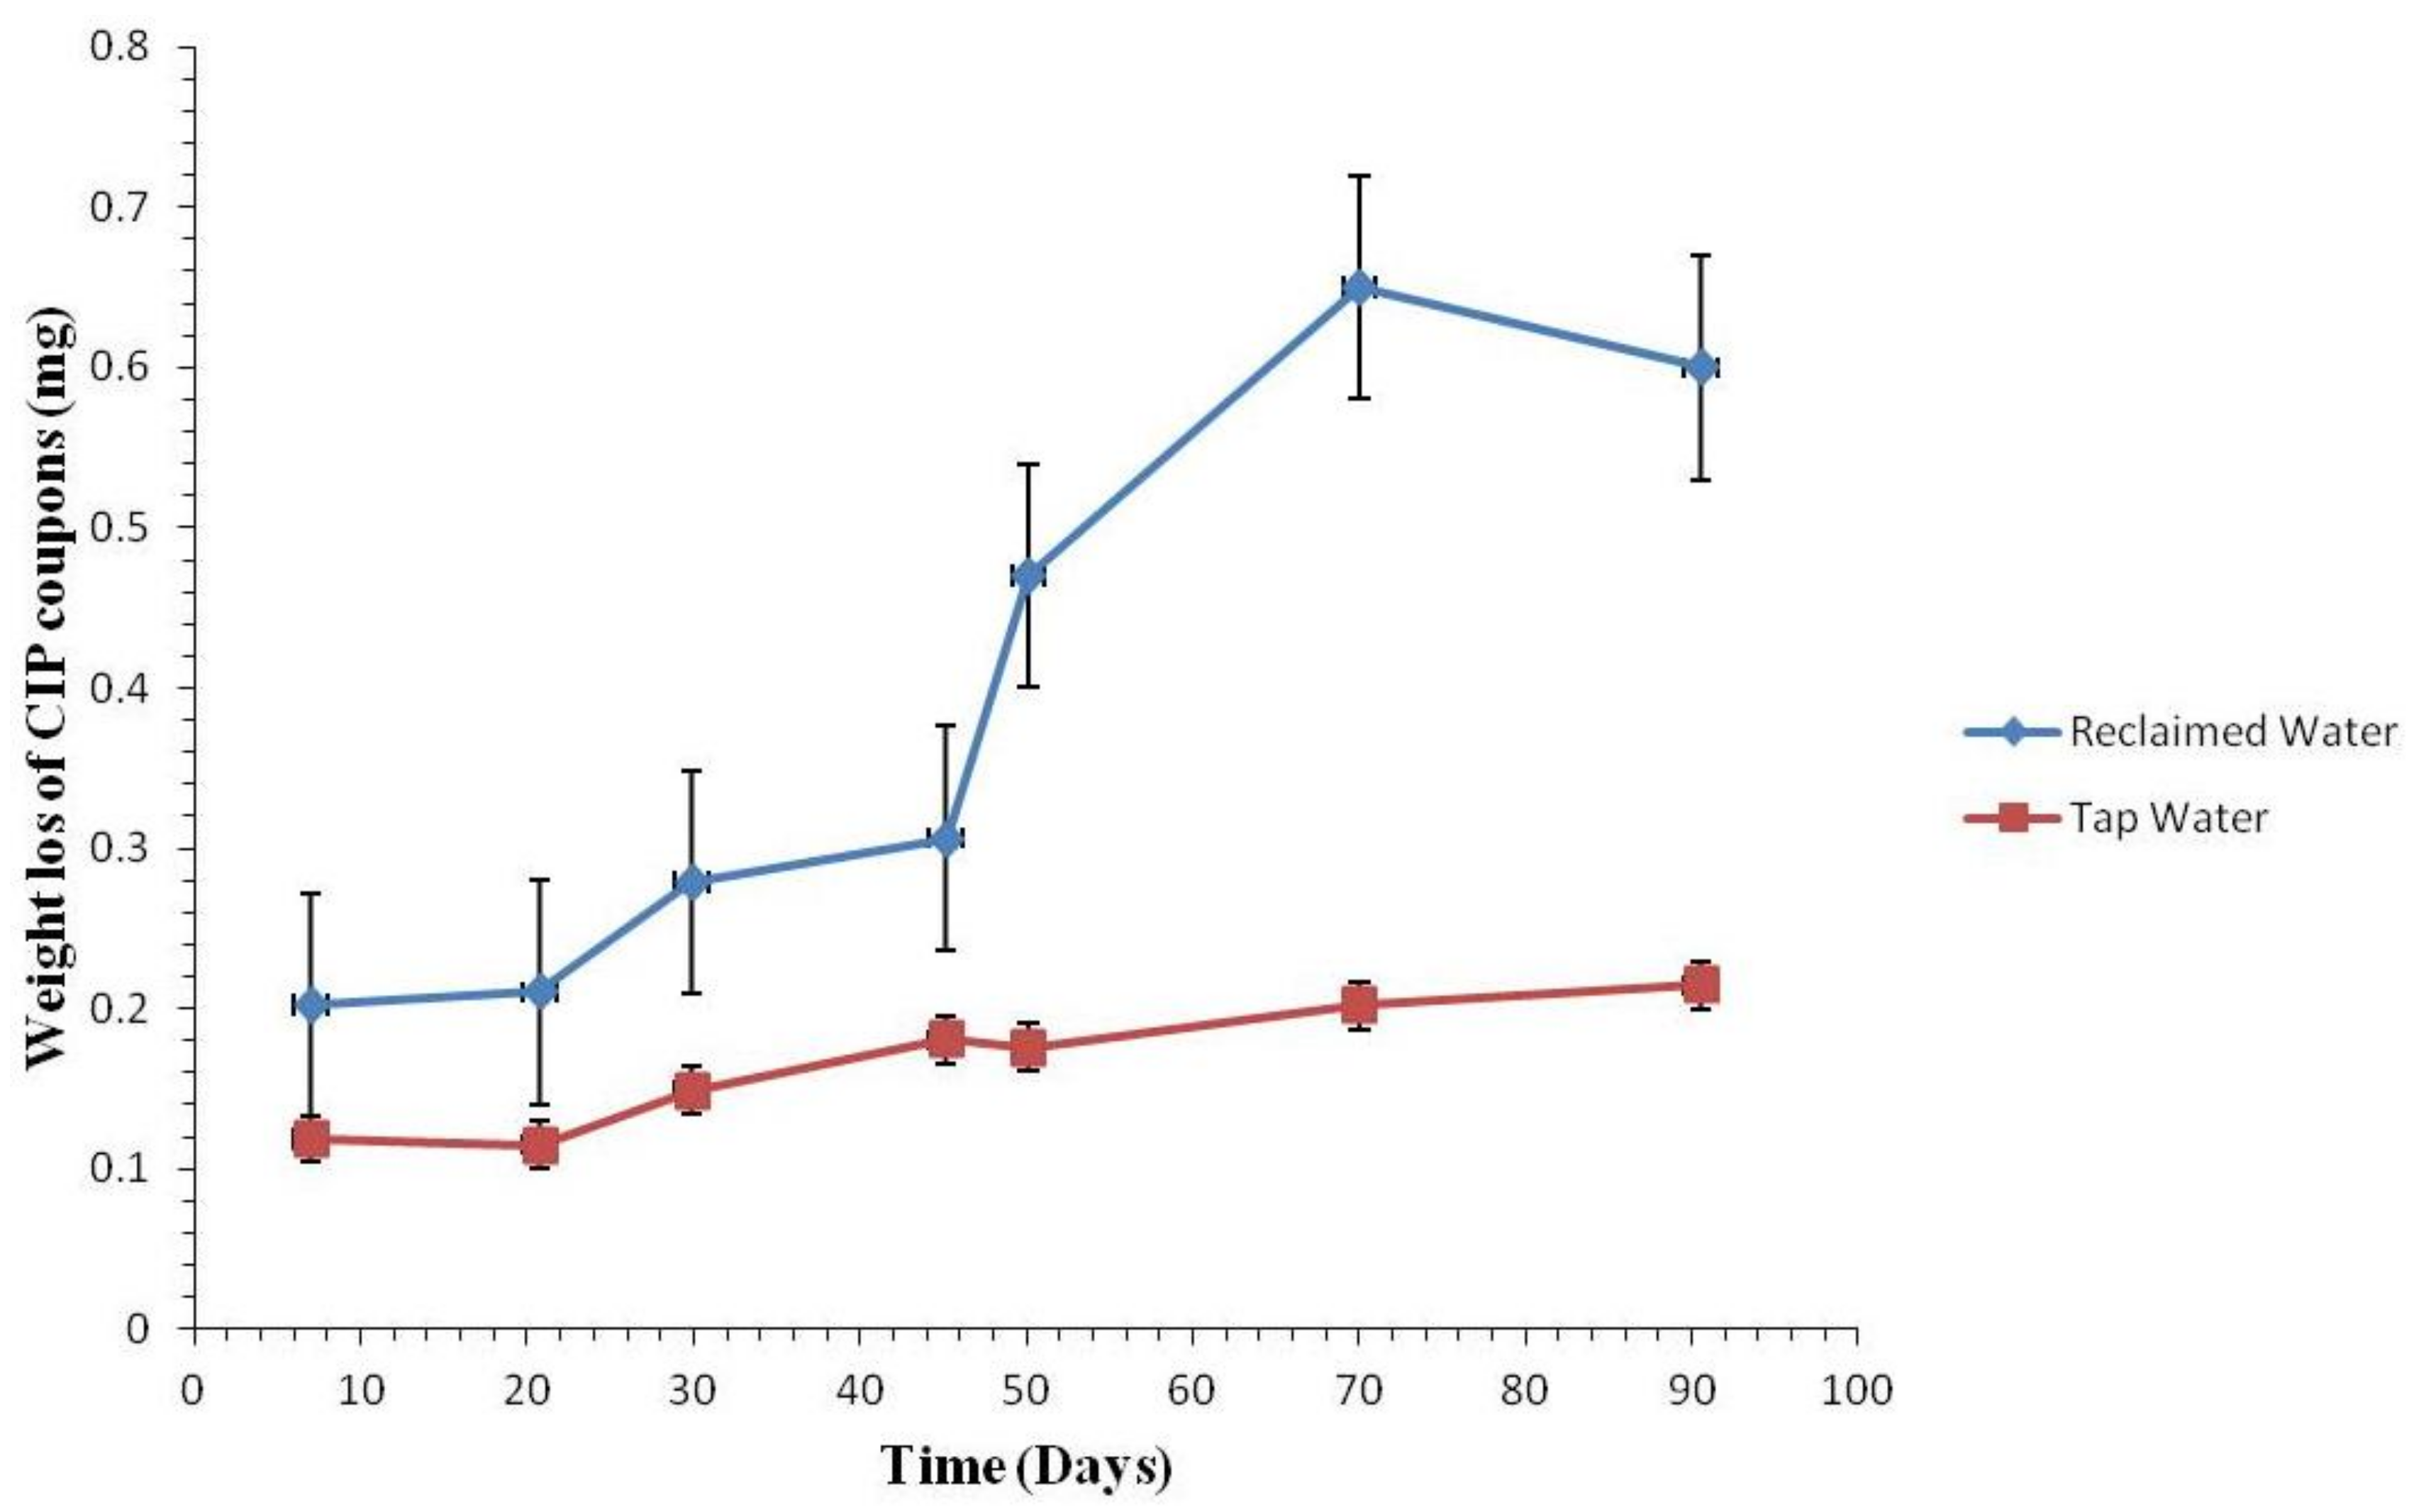
3.2.1. Coupon Weight Loss by Pipe Materials

Figure 11 and Figure 12 show the weight loss of coupons by pipe material over time.
Initially, the weight loss of GSP was the largest in both RW and TW, followed by the weight loss of GSP, STSP, and PVCP. For 90 days, the weight loss of CIP in RW was the largest at 0.6507 mg, while that of GSP, STSP, and PVCP was 0.2766 mg, 0.0092 mg, and 0.0090 mg. As opposed to RW, the weight loss of GSP in TW for 90 days was largest at 0.2308 mg, followed by CIP at 0.2117 mg. The average weight loss of PVCP and STSP was 0.005 mg, showing little change from the initial weight.
In both RW and TW, the weight loss of CIP and GSP were the largest. In CIP, the weight loss in RW was larger than that in TW. In PVCP, considering that corrosion is an electrochemical phenomenon, the weight loss due to corrosion barely occurred. STSP also showed little corrosion as it is a composite metal with extremely restricted corrosiveness. The weight loss of both STSP and PVCP is almost none considering the margin of error of the scale.

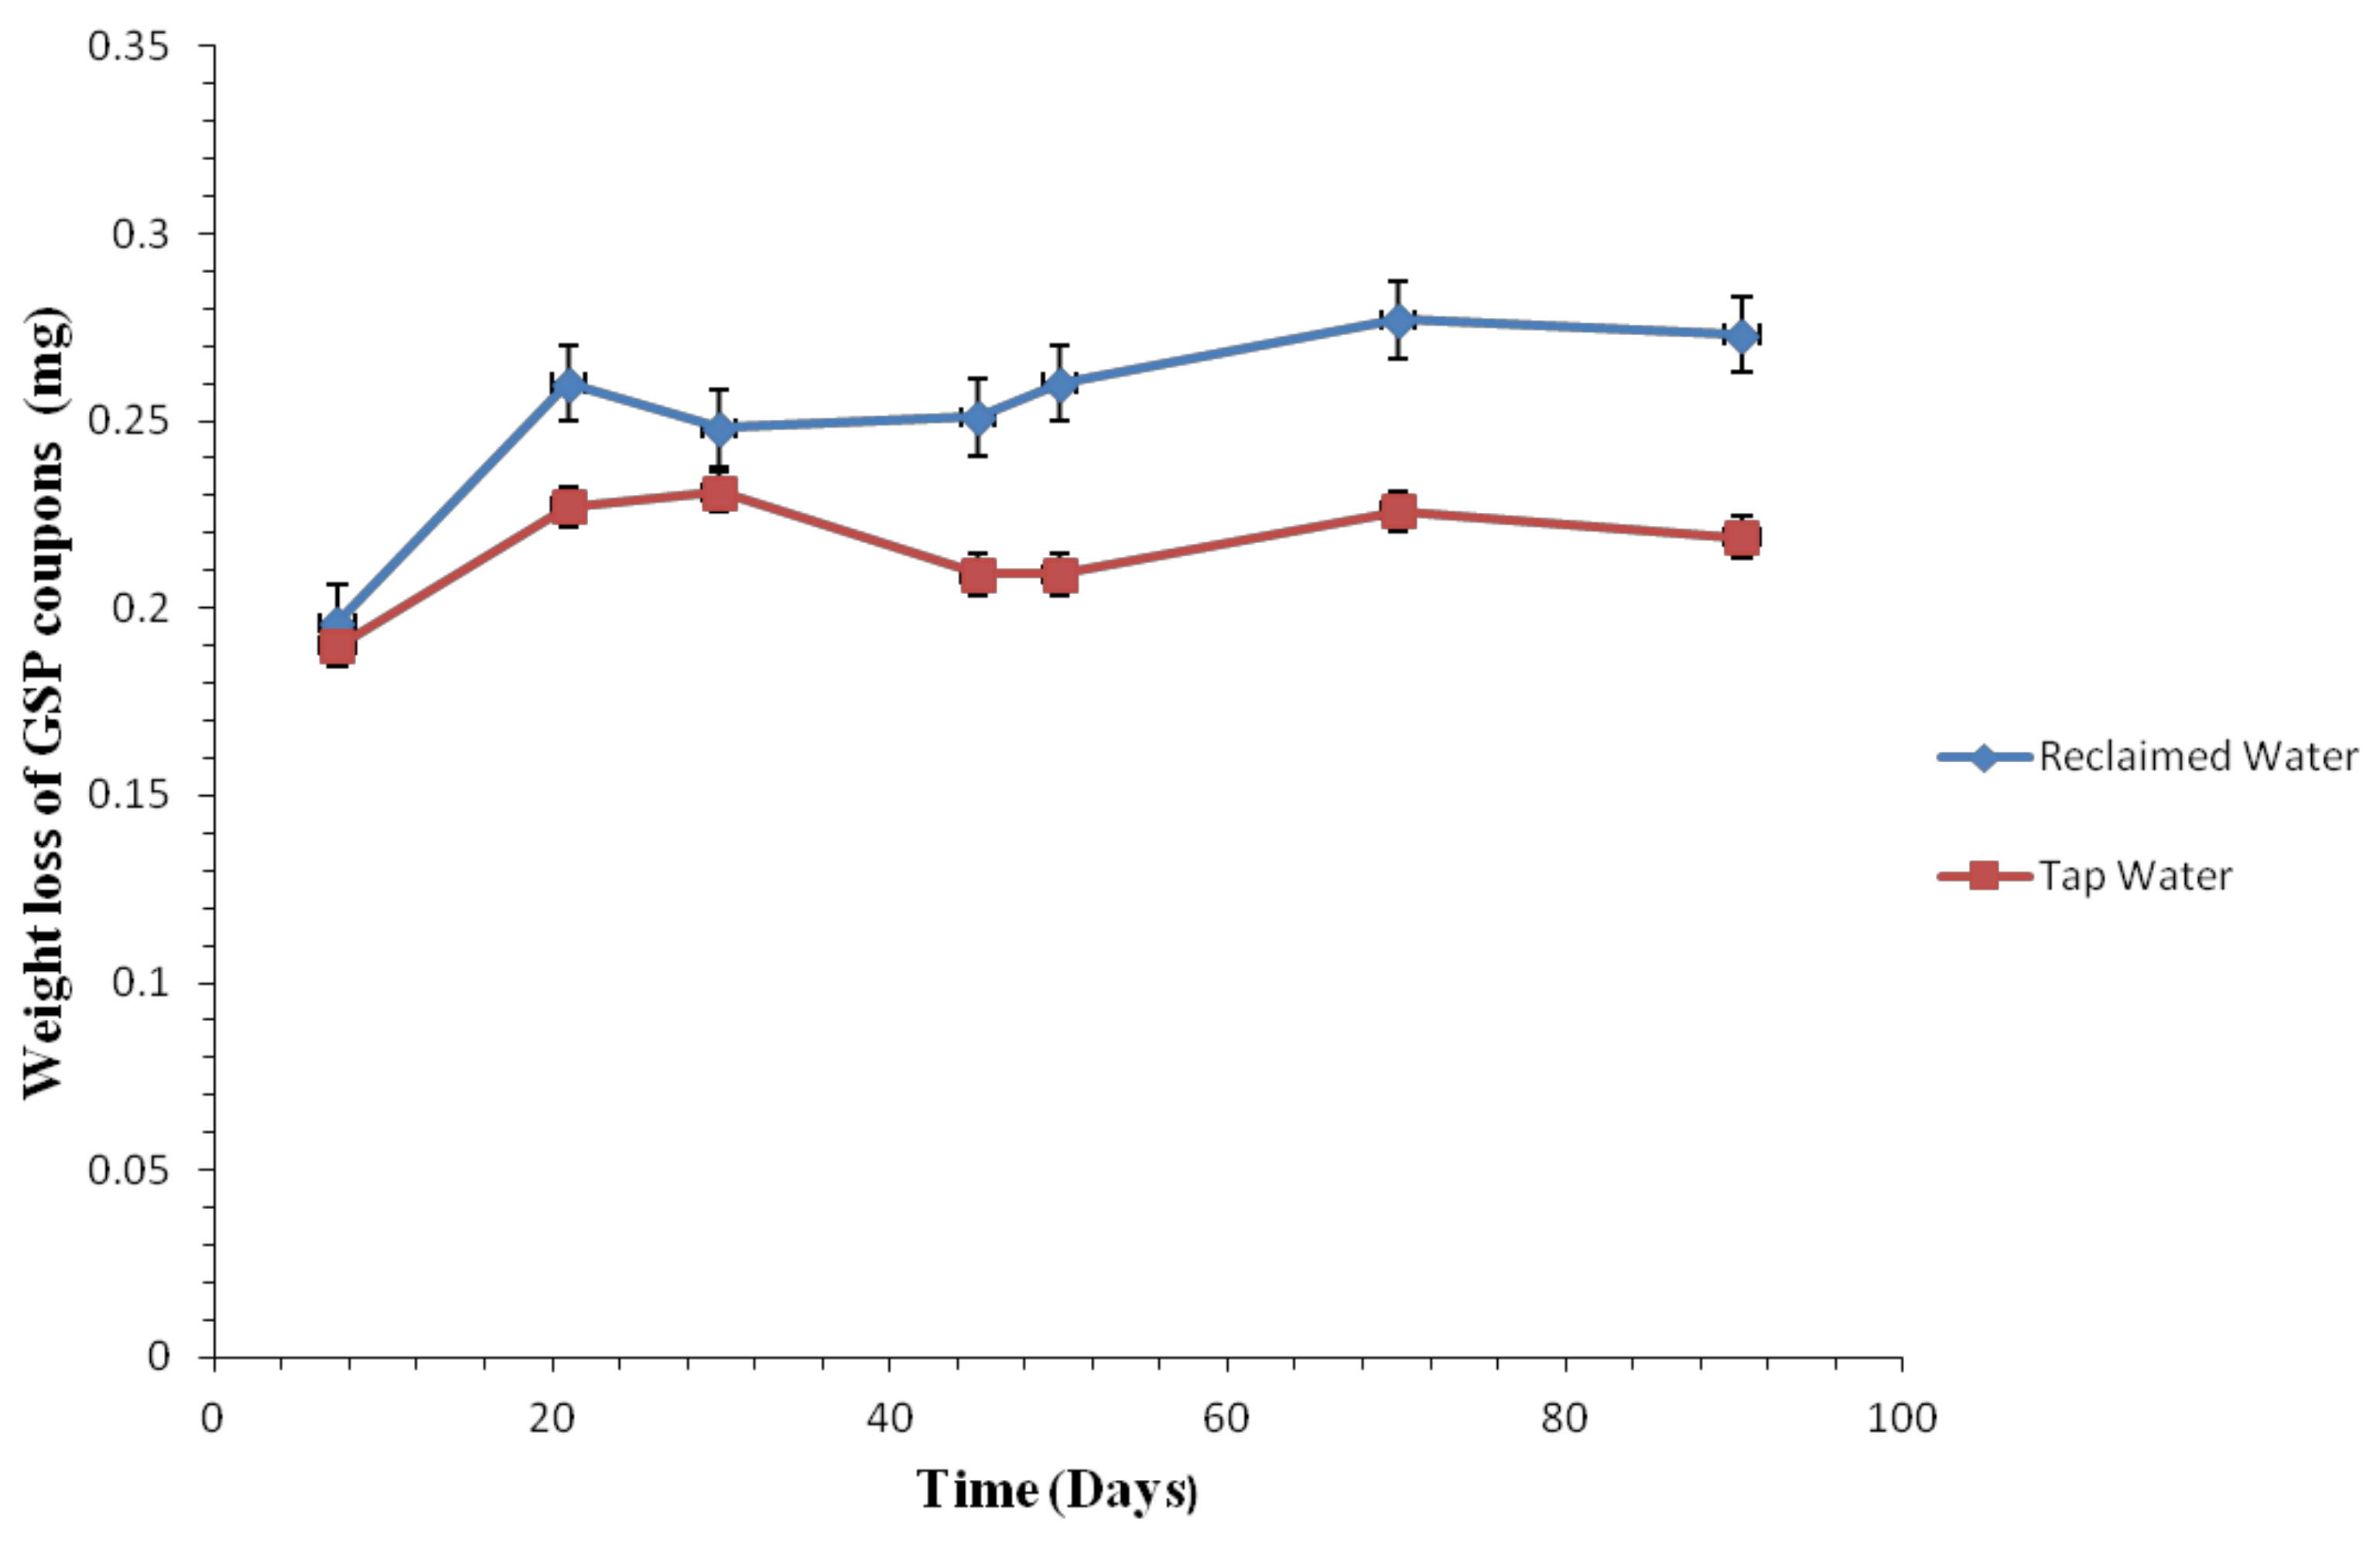
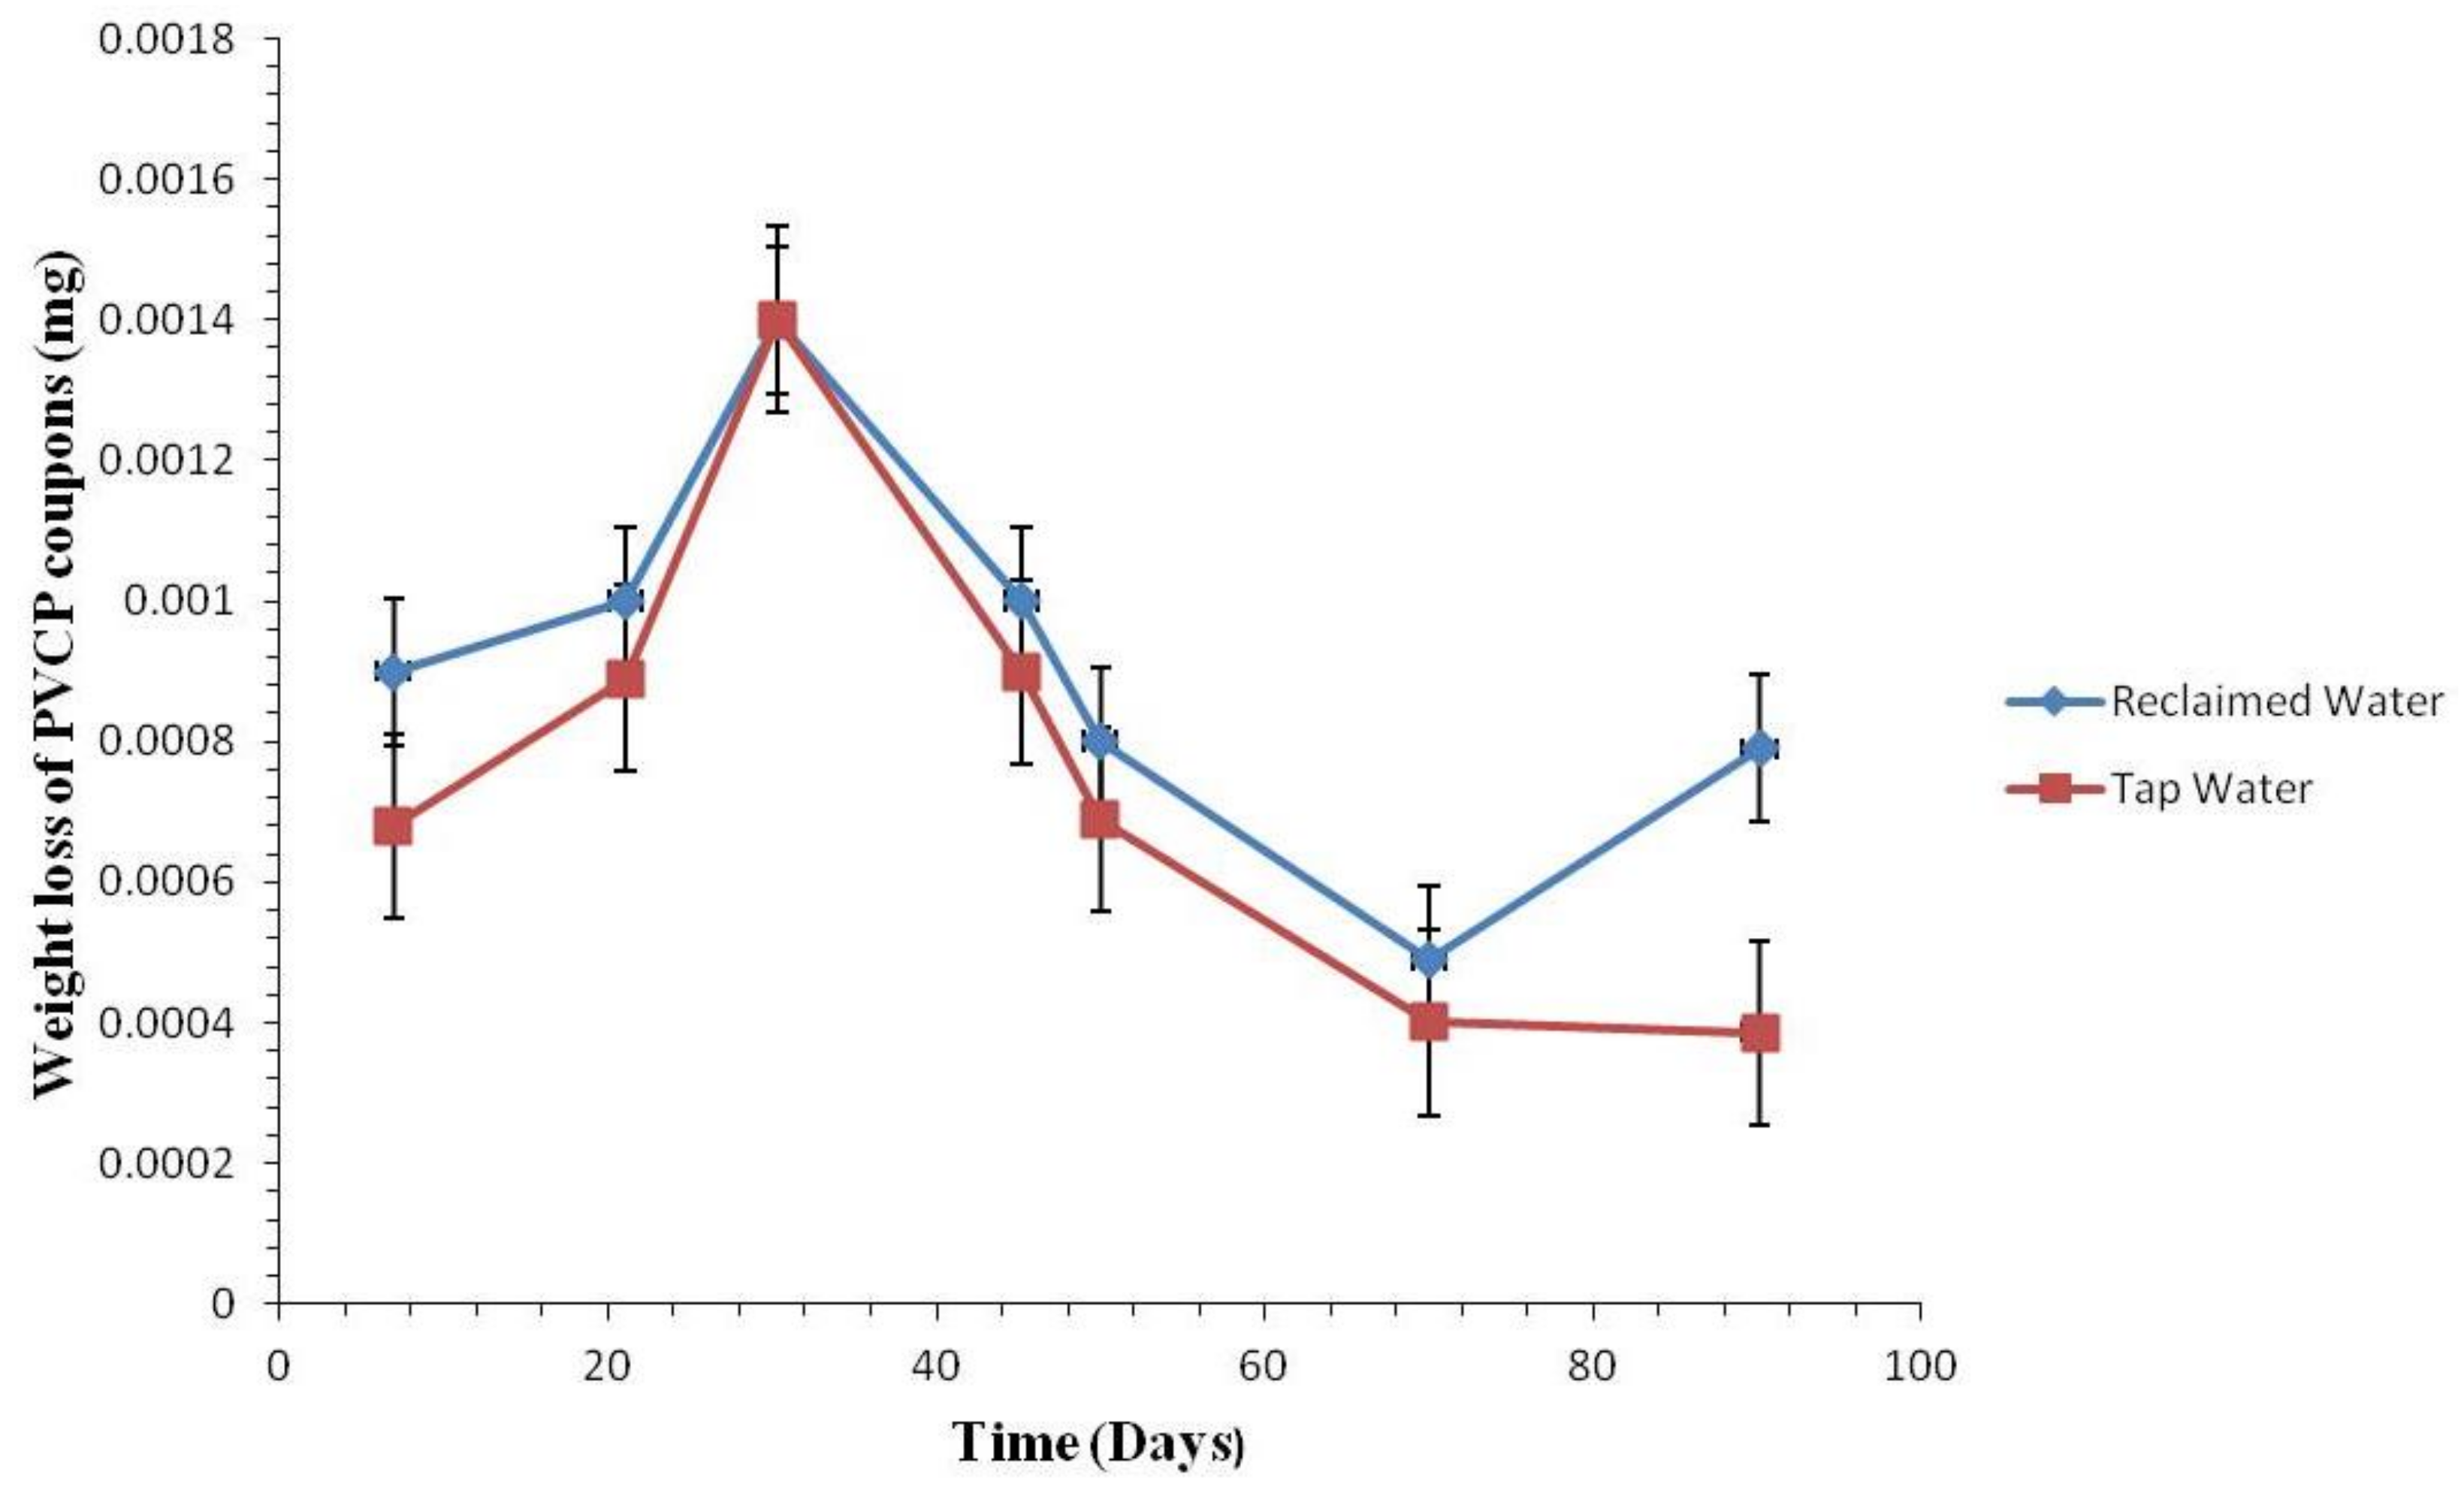
3.2.2. Weight Loss of the Coupons

Figure 13, Figure 14, Figure 15 and Figure 16 show the weight loss data of coupons by water quality. The results show that in all four pipe materials—CIP, GSP, STSP, and PVCP—the weight loss was larger in RW.
In RW, the weight of GSP rapidly decreased after 45 days, the weight loss gradually increased from 0.6507 mg on the 70th day to 0.6043 mg on the 90th day. The weight of GSP in TW, however, showed a bit of a decrease for the initial 14 days to 0.2610 mg, but as time passed, the weight loss became stable. While the weight loss of STSP was negligible both in RW and TW, the difference in the weight loss became more drastic as time passed. In PVCP, there was a significant difference in the weight loss between RW and TW. However, the weight loss for the first 30 days increased to 0.015 mg, and after 30 days, it drastically decreased. The weight loss of STSP and PVCP was very low, and considering the margin of error of the scale, it is considered as none. In CIP, the weight loss in RW and TW for 14 days was stable at 0.1161 mg and 0.2077 mg, respectively. After 14 days, the weight loss of CIP in TW showed little change between 0.1496 mg and 0.2117 mg, whereas that in RW after 45 days drastically changed between 0.4693 mg and 0.6043 mg.

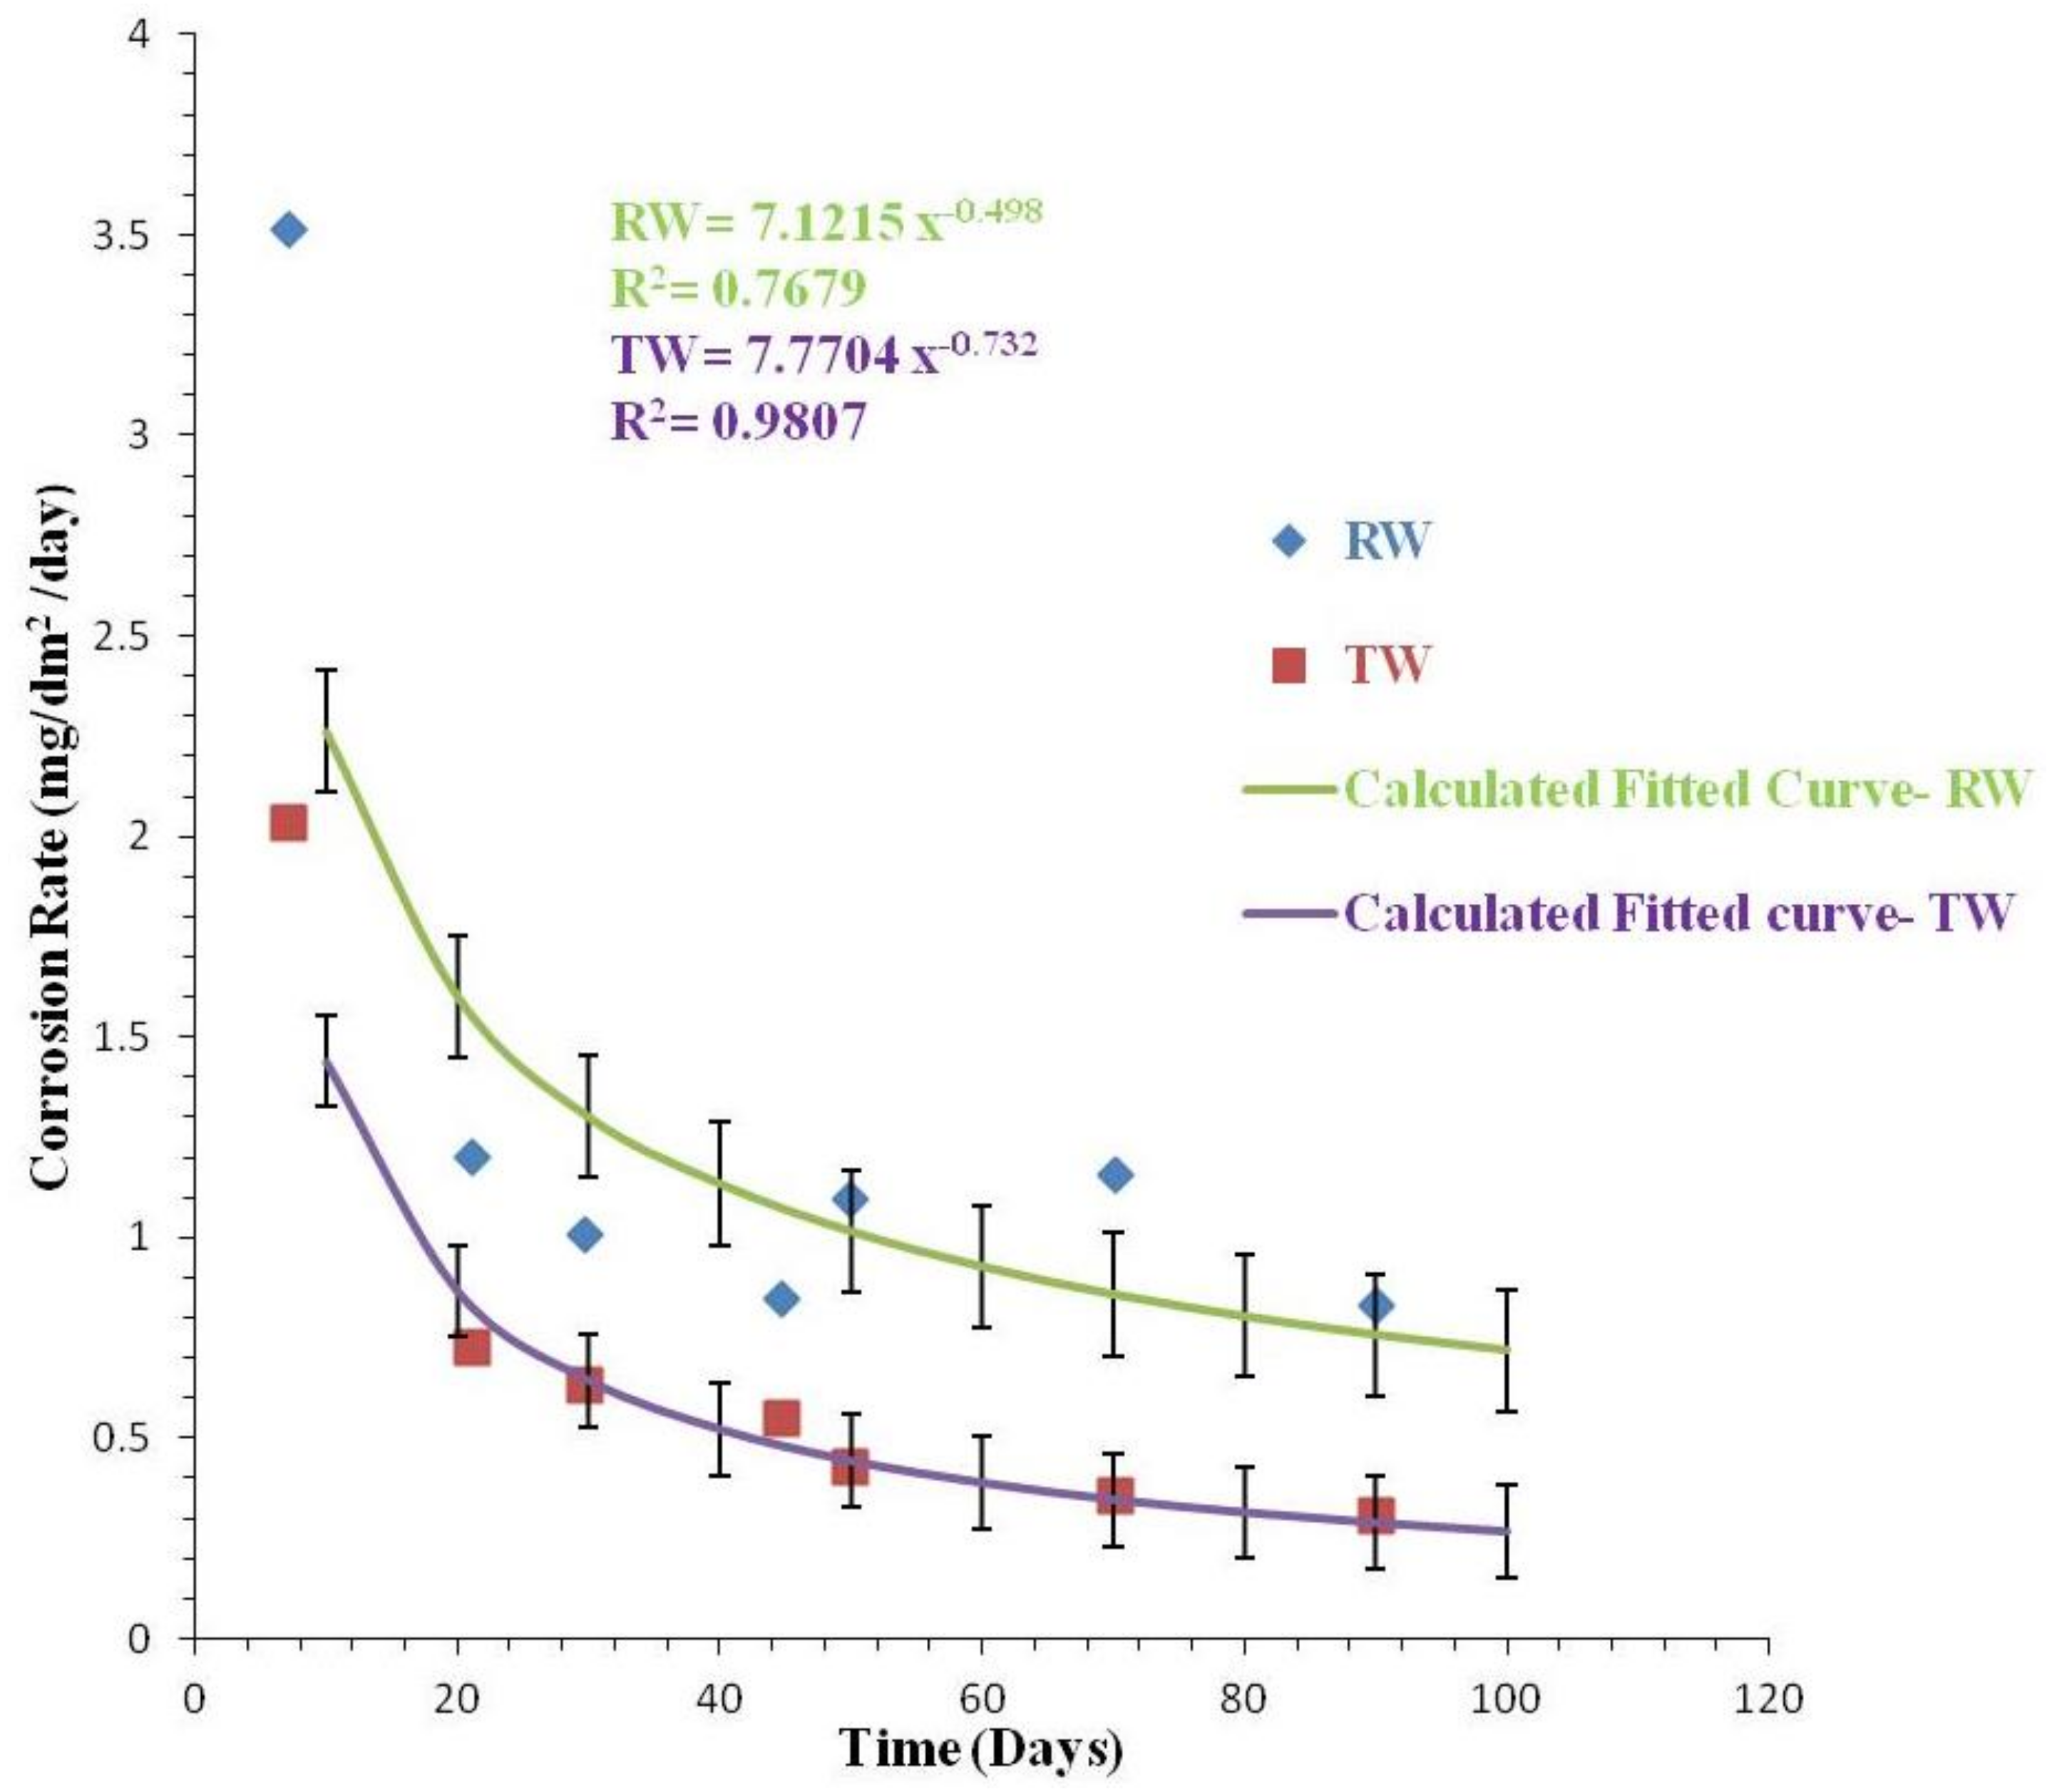
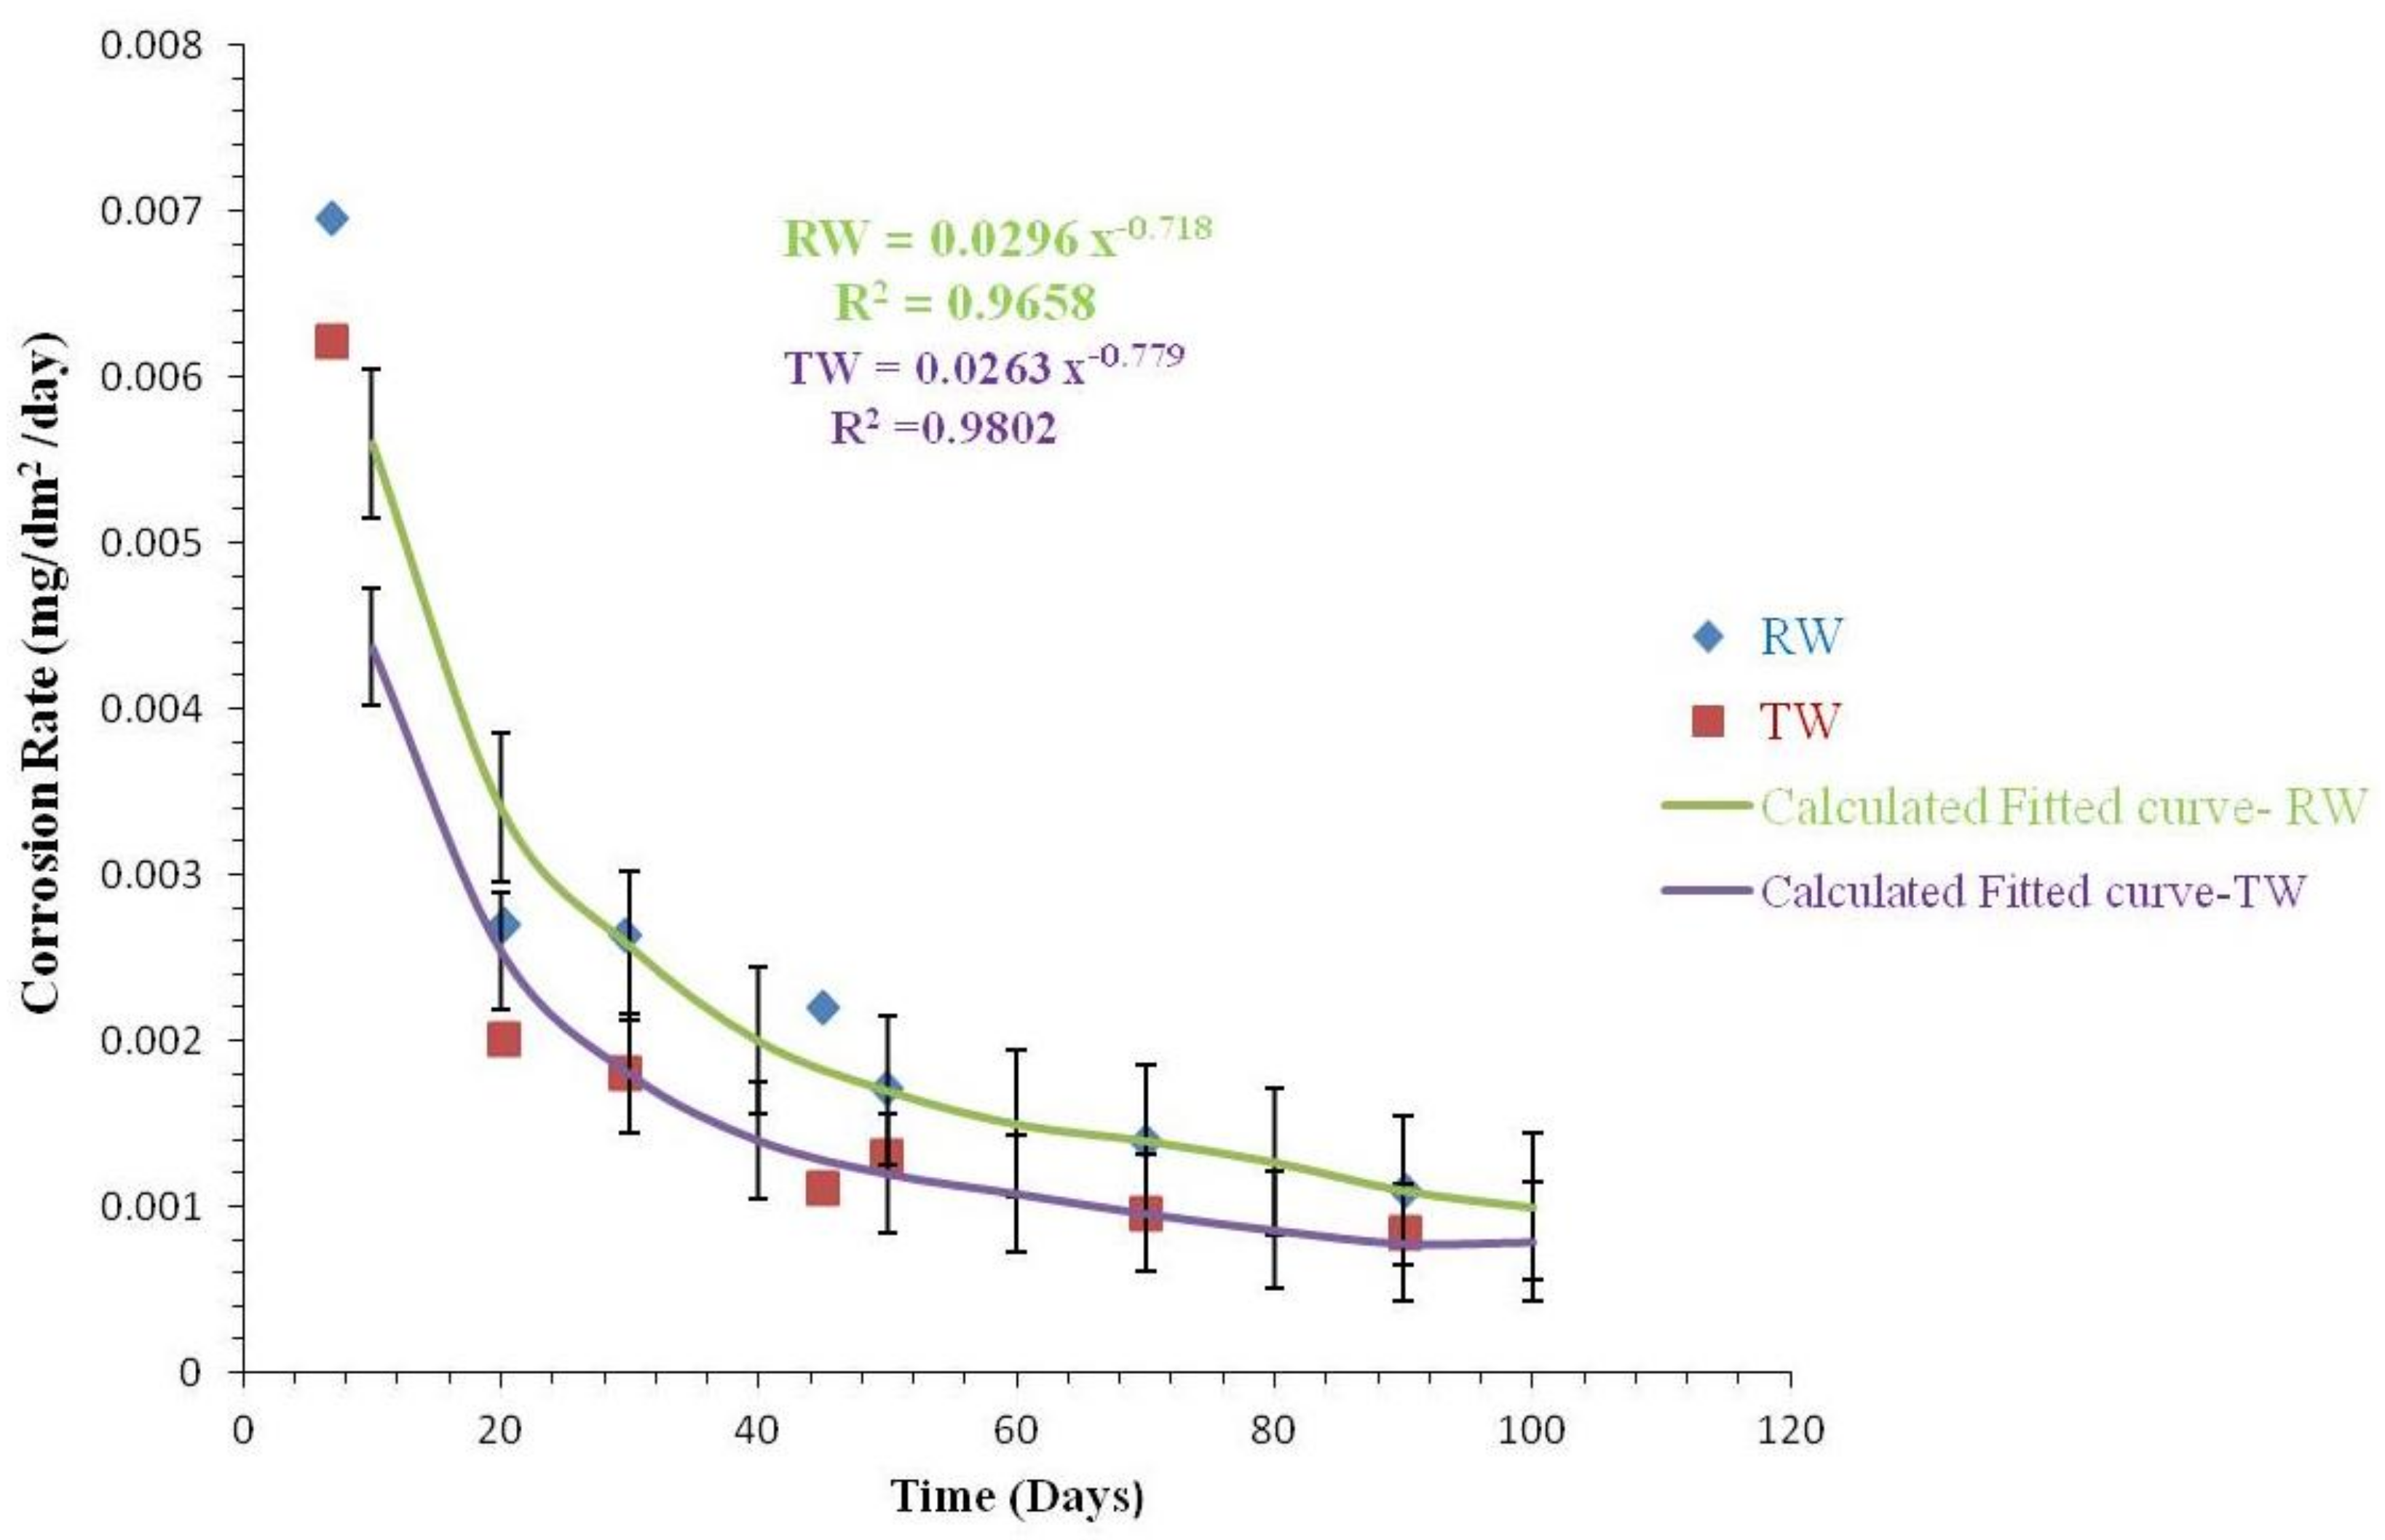
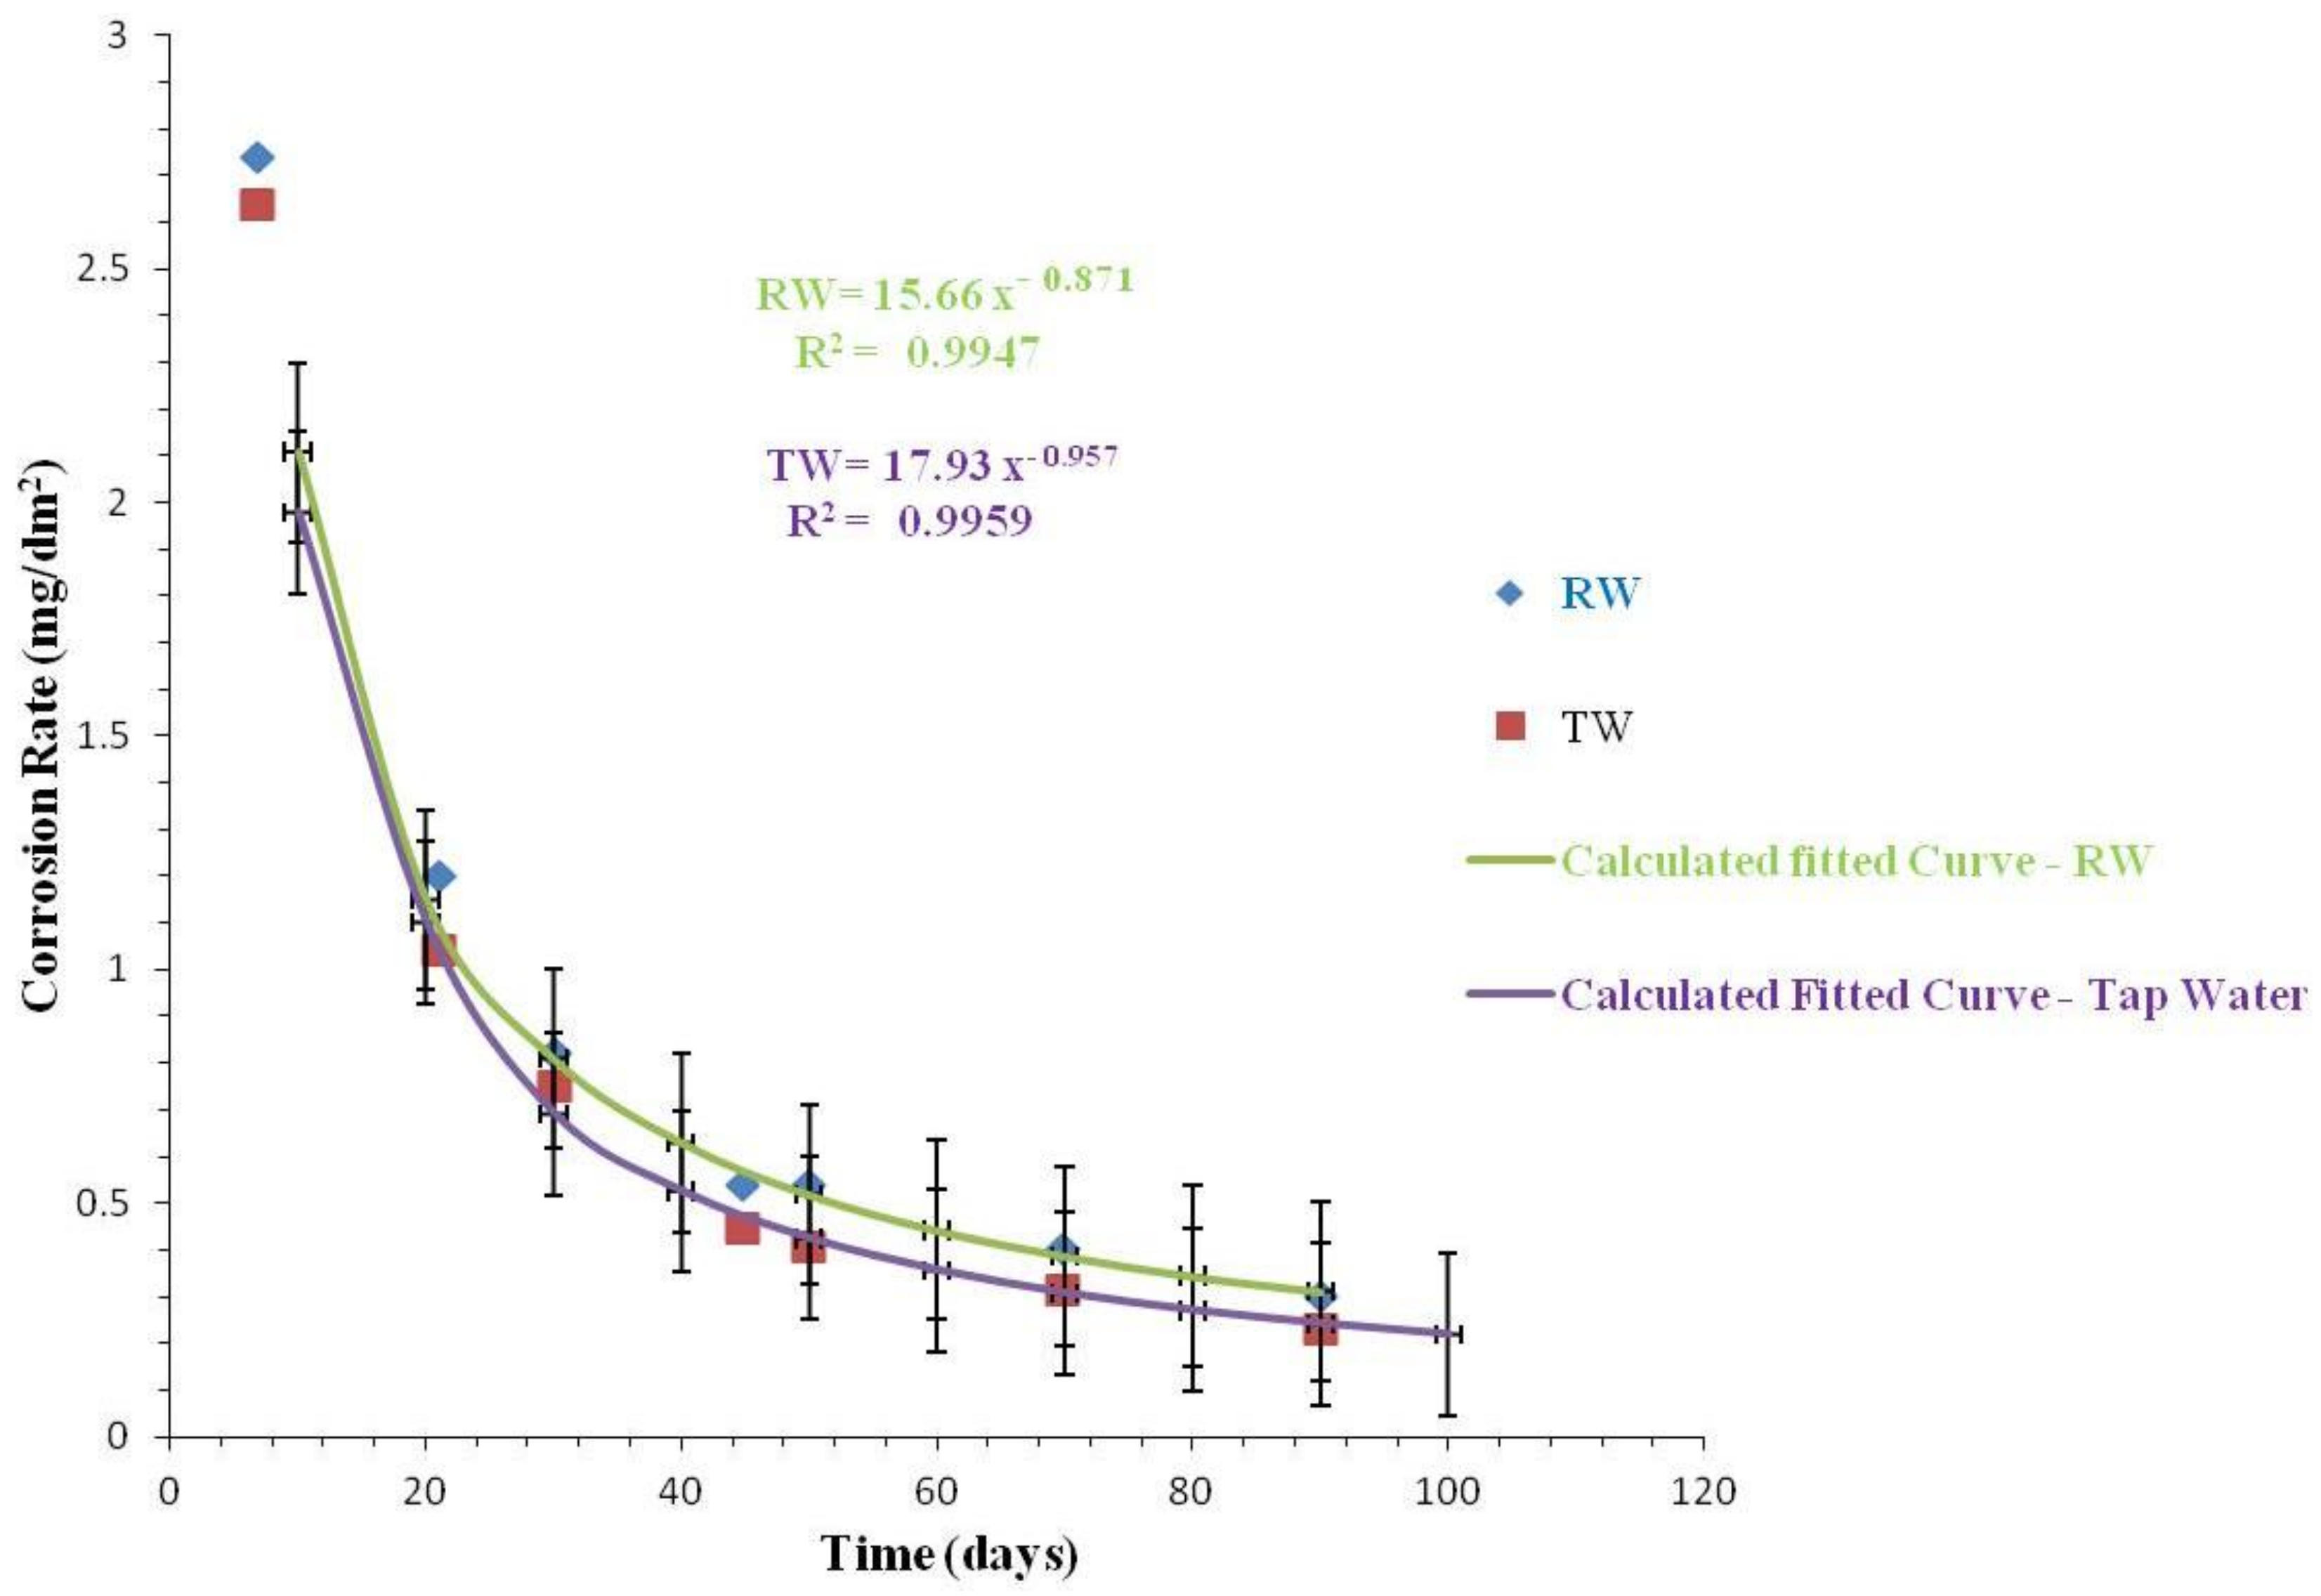
3.2.3. Comparison of Corrosion Rates

Figure 17, Figure 18 and Figure 19 indicate the corrosion rates of GSP, STSP, and CIP in RW and TW. We removed PVCP, non-metal material, from the calculation of the corrosion rate as it poses no risk of corrosion. The actual weight loss was negligible. The corrosion rates were shown by calculating the weight loss as the unit of mdd.
The initial corrosion rate of GSP in TW was 2.654 mdd, which was lower than 2.736 mdd in RW, and it continued to decrease, and by the 90th day, was down to 0.236 mdd in TW and 0.295 mdd in RW. During the test, the corrosion rate of GSP in RW was faster by an average of 0.0971 mdd.
The initial corrosion rate of CIP in RW was the largest at 3517 mdd, while that in TW was 2.027 mdd. For 90 days, it decreased to 0.833 mdd in RW and 0.0003 mdd in TW, and after 21 days, it either decreased by a negligible margin or became stable. The corrosion rate of CIP also was higher in RW at 0.673 mdd than that in TW, which was a bigger difference than that in the other pipe materials. It had been possible to confirm that the difference between tap water and reclaimed water in CIP was clearer than the difference in GSP or STSP.
The corrosion rate of STSP, which has relatively good corrosion resistance compared to the above two materials, was the fastest in RW in the beginning at 0.0079 mdd, and in TW, it was 0.0064 mdd. For 90 days, it decreased to 0.0011 mdd in RW and 0.0009 mdd in TW. After seven days, the corrosion rate in RW drastically decreased to 0.265 mdd, and after 21 days, it maintained a stable speed. Also in TW, it showed a fast corrosion rate in the beginning, and after 21 days, the rate either decreased by a negligible margin or became stable. The average corrosion rate of STSP in RW was 0.0007 mdd, faster than that in TW.
Considering that corrosion started as soon as water was supplied to the pipes, it is believed that such corrosion initially progressed quickly and it gradually decreased as time passed. After 21 days, it became stable. When linearized, the initial corrosion rate affected the final weight loss and can be used to predict the further lifetime of the pipes.
Figure 17, Figure 18 and Figure 19 show a result of the corrosion rate and the regression analysis for each of pipes. The initial corrosion rate was also considered the largest in CIP showing the largest weight loss, followed by GSP and STSP. In STSP, the corrosion rate in both TW and RW was the lowest; the effect of the factors other than the corrosiveness of water quality—such as MIC (microbiologically induced corrosion)—can be considered.
As such, the corrosion rate showed the difference by water quality. In all pipe materials, the initial corrosion rate in RW where almost no residual chloride concentration exists was higher by 0.002 to 1.5 mdd than that in TW where the total residual chloride concentration or disengaged residual chloride concentration is high. This way, it was confirmed that the selection of pipe material is important in a water system with high corrosiveness.
Table 6 shows the effects of water quality on pipe corrosion.
Table 7 shows the effect of pipe material on internal pipe corrosion.
Table 8 shows possible ways to prevent corrosion by changing the respective parameters of the TW.
Table 9 shows possible ways to prevent corrosion by changing the respective parameters of the RW.

4. Conclusions

This study examined the corrosion phenomena inside the RW and TW supply pipes. By selecting STSP, PVCP, CIP, and GSP as the target pipe materials, the study observed the various characteristics of corrosion rates. This study concluded as follows. In the case of the reclaimed water, the concentration of dissolved ions is high due to the influent of seawater, and we believe chloride and sulfate ions were the most influential factors on the acceleration of corrosion. By water quality, the corrosion rate was considerably faster in RW than in TW. By materials, excluding PVCP, which had no electrochemical corrosion, the corrosion rate was fastest in CIP, followed by GSP and STSP.

Acknowledgments

This work is supported by the Korea Agency for Infrastructure Technology Advancement (KAIA) grant funded by the Ministry of Land, Infrastructure and Transport (Guideline of non-destructive precision inspection and system improvement plan).

Author Contributions

Hyundong Lee was the supervisor of the project. His guidance proved helpful and valuable for the project. Without his guidance, this project would not have been completed. Hyundong Lee and Usman Rasheed designed and conceived the experiment. Usman Rasheed performed the experiments and analyzed the data. Myeongsik Kong provided his technical support during the experiments .The paper was thoroughly written and then revised according to the reviews of Reviewers by Usman Rasheed. He took necessary help from Hyundong Lee from time to time. Myeongsik Kong was also involved with the management side. He dealt with all the financial matters related to this project.

Conflicts of Interest

The authors declare no conflict of interest.

References

  1. KCID-ICID. Overview of National Policies and Development Plans; Korean National Committee on Irrigation and Drainage-The International Commission on Irrigation and Drainage (KCID-ICID): Seoul, South Korea, 2004. [Google Scholar]
  2. Lee, H.; Bae, C.; Park, J.; Chung, W.; Kwak, P. Evaluation of water quality characteristics effects on the internal corrosion of galvanized steel service pipe in the building. J. Korean Soc. Water Qual. 2001, 17, 627–635. [Google Scholar]
  3. Chung, G.H.; Kim, T.W.; Lee, J.H.; Kim, J.H. Optimization of water reuse system under uncertainty. J. Korea Water Resour. Assoc. 2010, 43, 131–138. [Google Scholar] [CrossRef]
  4. Davil, M.F.; Mahvi, A.H.; Norouzi, M.; Mazloomi, S.; Amarluie, A.; Tardast, A.; Karamitabar, Y. Survey of corrosion and scaling potential produced water from Ilam water treatment plant. Appl. Sci. 2009, 7, 1–6. [Google Scholar]
  5. Tyrrell, S.A.; Rippey, S.R.; Watkins, W.D. Inactivation of bacterial and viral indicators in secondary sewage effluents, using chlorine and ozone. Water Res. 1995, 29, 2483–2490. [Google Scholar] [CrossRef]
  6. American Society for Testing and Materials (ASTM). Standard practice for preparing, cleaning and evaluating corrosion test specimens. In Annual Book of ASTM Standards; American Society for Testing and Materials (ASTM): West Conshohoken, PA, USA, 1985; Volume 3. [Google Scholar]
  7. Sanusi, K.O.; Okoro, H.K. Investigation of corrosion effect of mild steel on orange juice. Afr. J. Biotechnol. 2011, 10, 152–156. [Google Scholar] [CrossRef]
  8. Orubite, O.K.; Oforka, N.C. Corrosion inhibition of Zinc on HCl using Nypa fruticans Wurmb Extract and 1, 5 Diphenel Carbazone. J. Appl. Sci. 2004, 8, 57–61. [Google Scholar]
  9. Ministry of Environment. Environmental Statistics Yearbook 2009; Ministry of Environment: Seoul, South Korea, 2009.
  10. AWWARF (American Water Works Association Research Foundation). Internal Corrosion of Water Distribution Systems; AWWARF-DVGW-TZW Cooperative Research Report; AWWARF (American Water Works Association Research Foundation): Denver, CO, USA, 1996. [Google Scholar]
  11. Caroline, K.N.; Kendall, R.S.; Marc, A.E. Nitrate accelerated corrosion of lead solder in potable water systems. Corros. Sci. 2011, 53, 1044–1049. [Google Scholar]
  12. Lee, Y. Study on Corrosion Characteristics in the Water Distribution Pipeline Depending on Water Quality. Master’s Thesis, University of Seoul, Seoul, Korea, 2009. [Google Scholar]
  13. Kim, T.; Lee, Y.; Lee, H.; Lee, C.; Ahn, K.; Lee, W. Influence of pipe materials on corrosion and bacteria regrowth in a model home plumbing system. J. Environ. Sci. 2007, 16, 121–128. [Google Scholar] [CrossRef]
  14. Ridgway, H.F.; Olson, B.H. Scanning electron microscope evidence for bacterial colonization of a drinking-water distribution system. Appl. Environ. Microbiol. 1982, 41, 274–287. [Google Scholar]
Figure 1. (a) Schematic of the simulated distribution loop system and coupon tester used in the experiment; (b) Coupons installed in the chamber.
Water 10 00496 g001
Figure 2. Variations of dissolved oxygen concentration in RW and TW in stainless steel pipes against time with standard error bars.
Water 10 00496 g002
Figure 3. Variations of pH in RW in stainless steel, polyvinyl chloride, cast iron, and galvanized steel pipes over time with standard error bars.
Water 10 00496 g003
Figure 4. Ammonia loss (%) of RW in stainless steel, polyvinyl chloride, galvanized steel, and cast iron pipes over time with standard error bars.
Water 10 00496 g004
Figure 5. Variations of nitrate concentration in RW in stainless steel, polyvinyl chloride, cast iron, and galvanized steel pipes over time with standard error bars.
Water 10 00496 g005
Figure 6. Variations of nitrite concentration in RW in stainless steel, polyvinyl chloride, cast iron, and galvanized steel pipes over time with standard error bars.
Water 10 00496 g006
Figure 7. Variations of chloride concentration in RW and TW in stainless steel, polyvinyl chloride, cast iron, and galvanized steel pipes over time with standard error bars.
Water 10 00496 g007
Figure 8. Variations of sulfate concentration in RW and TW in stainless steel, polyvinyl chloride, cast iron, and galvanized steel pipes over time with standard bars.
Water 10 00496 g008
Figure 9. Total organic carbon for RW over time with standard error bars.
Water 10 00496 g009
Figure 10. Total organic carbon for TW over time with standard error bars.
Water 10 00496 g010
Figure 11. Weight loss of coupons with RW in galvanized steel, cast iron, stainless steel, and polyvinyl chloride pipes over time with standard error bars.
Water 10 00496 g011
Figure 12. Weight loss of coupons with TW in galvanized steel, cast iron, stainless steel, and polyvinyl chloride pipes over time with standard error bars.
Water 10 00496 g012
Figure 13. Weight loss of galvanized steel pipe coupons with RW and TW over time with standard error bars.
Water 10 00496 g013
Figure 14. Weight loss of stainless steel pipe coupons with RW and TW over time with standard error bars.
Water 10 00496 g014
Figure 15. Weight loss of polyvinyl chloride pipe coupons with RW and TW over time with standard error bars.
Water 10 00496 g015
Figure 16. Weight loss of cast iron pipe coupons with RW and TW over time with standard error bars.
Water 10 00496 g016
Figure 17. Corrosion rate of galvanized steel pipe coupons with RW and TW over time with standard error bars.
Water 10 00496 g017
Figure 18. Corrosion rate of cast iron pipe coupons with RW and TW over time with standard error bars.
Water 10 00496 g018
Figure 19. Corrosion rate of stainless steel pipe coupons with RW and TW over time with standard error bars.
Water 10 00496 g019
Table 1. Conditions of the simulated distribution loop system.
ParametersValue
Type of ExperimentsLoop Test
Coupon Size20 mm (W) × 3 mm (D) × 15 mm (H)
Source of WaterTW (Tap Water)
RW (Reclaimed Water)
Running Time24 h
Flow Rate1.5 m/s
Type of CouponPVCP (Polyvinyl chloride pipe)
GSP (Galvanized steel pipe)
CIP (Cast iron pipe)
STSP (Stainless steel pipe 304)
Volume of Water4 L
Measurement ParametersTemperature, Dissolved Oxygen (DO), pH, Alkalinity, Turbidity,
NO3-N, Hardness, Total Organic Carbon (TOC), Cl, Fe2+, Hydroxypropyl cellulose (HPC),
NO2-N, PO43−-P, SO42−, NH4+-N, Zn2+,
Conductivity
Table 2. Properties of Reclaimed Water (RW).
ClassificationpHBOD (mg/L)COD (mg/L)SS (mg/L)T-N (mg/L)T-P (mg/L)Chromaticity (Degree)Chloride (mg/L)Coliform (ea/mL)
Supplied water quantityToilet-1.55.33.43.3610.3802620ND
Landscape---------
Recreation---------
Treatment plantTreated Water-16.98.47.77.70.57--259
Inflow-66.866.3131.731.04.57---
Recommendation standards of reclaimed water quantityToilet5.8~8.5Less 10Less 20---Less 20-ND
Landscape5.8~8.5 Less 10Less 20---Less 20Less 250ND
Note: BOD—Biological oxygen demand; COD—Chemical oxygen demand; SS—Suspended solids; T-N—Total Nitrogen; T-P—Total Phosphorus.
Table 3. Analytical methods for water quality.
ParameterUnitMethod
Conductivityμs/cmConductivity meter, Model 115A Plus, Expotech, Houstan, TX, USA
Total organic carbon (TOC)mg/LStandard method
Temperature°C-
Hardnessmg/L CaCO3DR 4000, HACH, Loveland, CO, USA
Dissolved Oxygen (DO)mg/LDO meter, YSI 550A, Istek, Seoul, South Korea
Clmg/LDR 4000, HACH, Loveland, CO, USA
pH pH meter, Istek pH-250L, Seoul, South Korea
Fe2+mg/LDR 4000, HACH, Loveland, CO, USA
NO3-N, NO2-N NH4+-N, PO43−-Pmg/LDR 4000, HACH, Loveland, CO, USA
Zn2+mg/LDR 4000, HACH, Loveland, CO, USA
Table 4. Removal methods of corrosion products from coupons.
MaterialTimeTemperatureChemicalRemarks
Copper and copper alloys20 min20∼25 °C50% HClfollowed by light scrub
Stainless steel20 min60 °C10% HNO3followed by light scrub
Iron and steel20 min20∼25 °CConcentrated HCl + 50 g/L SnCl2 + 20 g/L SbCl3followed by light scrub
Table 5. Characteristic properties of adjusted RW and TW.
Analysis ItemUnitSewage Reuse Water Tap Water
TurbidityNTU0.7910.088
Electrical conductivity μs/cm 3700177.45
DOmg/L 4.944.86
Alkalinitymg/L as CaCO3 9634
Free residual chlorine mg/L0.030.1
SO42−mg/L191.512.0
Hardnessmg/L as CaCO374382
Bonded residual chlorine mg/L0.0100.20
pH-7.427.86
Zn2+mg/L0.0100.068
Fe2+mg/L0.0060.010
NO2-Nmg/L0.03650.0093
NO3-Nmg/L4.91.1
NH4+-Nmg/L0.5780.072
TOCmg/L2.861.29
PO43-Pmg/L0.4060.0492
Suspended HPC CFU/mL167210
Chlorinemg/L704.757.04
Water temperature °C26.125.9
Table 6. Effects of water quality on pipe corrosion.
Water QualityEffect
TemperatureHigh water temperature promotes the rate of oxidation.
Experience shows that corrosion is more pronounced in hot water lines.
pHLow pH may increase corrosion.
High pH may protect pipes and decrease corrosion rates or could cause dezincification of brasses or soft blue hydroxide deposits on copper pipe.
AlkalinityMay help form protective coating; helps control pH changes.
Low to moderate alkalinity reduces corrosion of most materials. High alkalinity increases corrosion of copper, lead, and zinc.
Calcium HardnessCalcium may precipitate as CaCO3 and may provide protection and reduce corrosion rates, but may cause turbidity or excessive scaling.
MagnesiumMay inhibit the precipitation of calcite in the form of CaCO3 on pipe surface and favor the deposition of the more soluble aragonite form of CaCO3.
DOHigh DO increases many corrosion rates.
ConductivityHigh conductivity tends to increase corrosion rate.
Chlorine residualIncreases corrosion, particularly for copper, iron, and steel.
AcidityHigh acidity increases corrosion rate and release rate of metal.
Chloride, sulfateHigh levels increase corrosion of iron, copper, and galvanized steel.
TOCLow TOC may decrease microbial activity.
Table 7. Effects of pipe material on internal pipe corrosion.
MaterialCorrosion TypeTap Water Quality Deterioration
Cast--
IronUniformRust tubercles (blockage of pipe)
Ductile Graphitization
Pitting under unprotective scale
Iron and suspended particles release
SteelPittingRust tubercles (blockage of pipe), iron, and suspended particles release
Galvanized steelGeneral pittingExcessive zinc, lead, cadmium, and iron release and blockage of pipe
CopperUniformCopper release
Localized attack
Cold water
Hot water
Pipe perforation and subsequent leakage from pipes
Corrosion fatigueRupture of pipes and fittings and consequent leakage
ErosionLeakage from pipes.
Table 8. Optimizing factors of corrosion control for TW.
Inhibition FactorValueAcceleration FactorValue
pH7.5Total Dissolved Solids (TDS) (mg/L)85
Alkalinity (mg/L as CaCO3)60Cl (mg/L)10
Hardness (mg/L as CaCO3)80SO42−10
Table 9. Optimizing factors of corrosion control for RW.
Inhibition FactorValueAcceleration FactorValue
pH7.5 (5.8~8.5)TDS500
Hardness650NH4+1.0
Alkalinity350PO43−0.5
Chlorine0.2Cl, SO42−200~500

