Article

Combining Chemical Flocculation and Disc Filtration with Managed Aquifer Recharge

by
Kristofer Hägg
1,2,*,
Michael Cimbritz
3 and
Kenneth M. Persson
1
1
Division of Water Resources Engineering, Faculty of Engineering LTH, Lund University, John Ericssons Väg 1, V-Hus, 221 00 Lund, Sweden
2
Sweden Water Research AB, Ideon Science Park, Scheelevägen 15, 223 70 Lund, Sweden
3
Department of Chemical Engineering, Faculty of Engineering LTH, Lund University, Naturvetarvägen 14, Box 124, 221 00 Lund, Sweden
*
Author to whom correspondence should be addressed.
Water 2018, 10(12), 1854; https://doi.org/10.3390/w10121854
Submission received: 9 November 2018 / Revised: 7 December 2018 / Accepted: 12 December 2018 / Published: 14 December 2018
(This article belongs to the Special Issue Innovative Water Management and Reuse)

Abstract

:
Natural organic matter (NOM) is a growing concern for artificial recharge plants. In the future, it is predicted that warmer climates and more precipitation will cause higher NOM production in lakes and more NOM transport to lakes. This, coupled with increasing drinking water demand due to the population increase, is pushing operators of water treatment plants (WTPs) to find new ways to treat water. In this study, the possibility of reducing the organic load in infiltration basins through a compact pre-treatment technique utilizing microsieves, or disc filters, instead of bulky sedimentation basins and rapid sand filters after chemical flocculation to separate flocs, was investigated. The experiments were conducted using a laboratory-scale flocculator, bench-scale disc filters (10 µm and 40 µm), FeCl3, an anionic synthetic polymer, and water from Lake Vomb, a lake in southern Sweden. Raw water was flocculated using FeCl3 and the polymer, and the filtrated samples were analyzed by measuring UV–VIS absorbance, total organic carbon (TOC), and permeate volume. The results when using 10-µm and 40-µm disc filters demonstrate that it is possible to reduce NOM (by approximately 50%) and separate flocs from raw water. The experiments also highlight the importance of sufficient flocculation times and the use of appropriate polymer dosage to achieve higher permeate volumes and avoid residual polymers in the effluent. In this paper, the possibility of using this technique as a standalone treatment step or as a pre-treatment step in order to manage the aquifer recharge is demonstrated.

1. Introduction

One-quarter of all drinking water in Sweden is produced by artificial groundwater recharge plants [1]. The techniques most commonly used to recharge the groundwater are induced infiltration and infiltration through infiltration basins [2]. The latter is more common in Sweden among water treatment plants (WTPs) with high production. The technique utilizes services provided by nature to reduce natural organic matter (NOM), bacteria, and viruses [3]. Artificial recharge plants can, depending on the study, remove 50–85% of NOM from surface waters [3,4,5,6]. However, problems arise when WTPs are pushed to the limit due to increasing drinking water demands. This problem is exacerbated with the growing concerns regarding global warming. It is expected that the increasing temperature and precipitation [7] will cause lakes and rivers, which are used for drinking water, to deteriorate due to organic carbon transport [8,9] to surface waters. This, combined with the increased demand for drinking water due to the increasing population, has put pressure on water utilities to plan ahead to secure water production for future generations. At Vomb Water Works, an artificial recharge plant in southern Sweden, an additional raw water source, i.e., Lake Bolmen, will be used in an effort to increase drinking water production. However, the limitation of the infiltration fields’ capacity to treat large volumes of lake water from the NOM-rich waters of Lake Bolmen has prompted the water utility to investigate different pre-treatment methods.
One solution common among utilities, which is effective to reduce NOM, is to pre-treat the raw water by chemical flocculation before infiltration [5]. This technique is used in different ways in Sweden, with coagulation and flocculation steps using Fe(III)- or Al(III)-coagulants [10]. Depending on the production volume needed, different separation methods are commonly used. In Sweden, smaller WTPs with low production (<20,000 m3/year) tend to remove flocs by contact filtration, while larger WTPs with higher production (>20,000 m3/year) tend to use sedimentation [4].
Microscreens were originally used for pre-treatment for slow and rapid sand filters at potable water treatment works in order to reduce coagulant doses and solids loading [11], but nowadays, there are several alternative applications available for both water and wastewater treatment. Disc filtration, one type of microscreen based on gravity flow, is widely used for tertiary filtration in wastewater treatment, mainly because of the resulting low footprint. Difficulties when adding coagulants to improve tertiary treatment were, however, noticed quite early [12,13]. This was due to flocs not being strong enough to withstand shear forces in the filter. A polymer addition was suggested as a solution, and recent development has shown the possibility of combining coagulation/flocculation with disc filtration in order to achieve very low levels of effluent phosphorus [14].
The objective of this study was to investigate the possibility of combining chemical flocculation and disc filtration in drinking water production, either as a standalone treatment step or as a pre-treatment step before aquifer recharge.

2. Materials and Methods

During this study, jar tests [15] were performed in combination with laboratory-scale disc filtration. The jar tests and subsequent filtration were conducted as described in [14] with some alterations. The procedure is described in the following sections.

2.1. Preparation for Jar Tests

To ensure successful coagulation, FeCl3-assisted flocculation needs to occur around pH 5.1 [16]. This was achieved by adding FeCl3 and HCl solutions to 1 liter of raw water and measuring the pH before the jar tests were conducted. The pH was measured using a WTW pH-197 (Sigma-Aldrich, Saint Louis, MO, USA) pH meter after FeCl3 was added. An HCl solution was then added until the targeted pH was reached. The volume of HCl needed was later added before the coagulants during each jar test.

2.2. Jar Tests and Disc Filters

Jar tests, as described in [15], were conducted in the water treatment plant in Vomb, Sweden, using a program-controlled flocculator (Flocculator 2000, Kemira, Helsingborg, Sweden). In the setup, a 1-L glass beaker was used in combination with a laboratory-scale disc filter (Nordic Water Products AB, Gothenburg, Sweden), as shown in Figure 1 below. The horizontally set disc filter (ϕ = 9 cm) was attached to a 1.2-L cylinder through which water flowed by gravity, and the flocs were retained on the filter material. The test procedure was as follows:
  • The flocculator was programmed to 30 s rapid mixing (400 rpm) and 20 min slow mixing (75 rpm). The beaker was filled with 1 L of raw water.
  • Before the program was started, the pre-calculated amount of HCl was added to the beaker while mixing.
  • The program was started, and when 10 s of the rapid mixing remained, FeCl3 was added.
  • When the polymer was used, it was added during slow mixing.
  • Once the flocculation program had finished, the raw water was transferred to the disc filter. The permeate was collected and measured after 60 s of filtration.
To ensure replicability, the water sample was transferred from the beaker over to the disc filter in the same manner, by carefully pouring the water into the disc filter while angling the filter to minimize floc breakage. Once the sample was transferred, the disc filter was set upon a 1-L beaker to collect the permeate.
In preparation for the trials using disc filters, the experiments were conducted to find the appropriate FeCl3 dosages. The experiments followed the procedure mentioned above with a couple of exceptions; no polymer was added, and instead of transferring the raw water to the disc filter (step 5) a 30-min sedimentation step was added.

2.3. Coagulants and Additives

All the coagulants used in the study were of food-grade quality and were used directly without further preparation apart from the synthetic polymer (a co-polymer of acrylamide and sodium acrylate), MLT 30 (BASF, Ludwigshafen, Germany). A H2SO4 (97%) and HCl solution was used to control the resulting pH due to the high alkalinity of the lake water. The primary coagulant used was PIX-311, a 40% by weight FeCl3 solution produced by Kemira (Helsinpgborg, Sweden) and provided by Sydvatten AB, Sweden (municipal drinking water producer, Malmö, Sweden). The 0.5% synthetic, anionic, polymer was diluted the day of the experiment in distilled water resulting in a 0.05% polymer solution.

2.4. Water Sample Analysis

Raw water and the treated water samples were tested for total organic carbon (TOC) and UV–VIS absorbance using a TOC analyzer (TOC-L, Shimadzu, Kyoto, Japan) and spectrophotometer (DR 5000, Hach Lange, Loveland, CO, USA), respectively. The absorption was measured at λ = 254 nm and λ = 436 nm using a 5-cm cuvette. These wavelengths were used by the water treatment plant for daily process control.

2.5. Vomb Lake and Drinking Water Quality

The raw water samples used in this study were taken from Lake Vomb in southern Sweden. Lake Vomb is a hypertrophic lake with seasonal algae blooms, mostly caused by effluents from the surrounding agriculture [17], and has been used by Vomb Water Works as a raw water source since 1948. The water quality varies daily and seasonally. The experiments in this study were conducted during the summers of 2016 and 2017, and during this time, the water quality was as shown in Table 1.

3. Results and Discussion

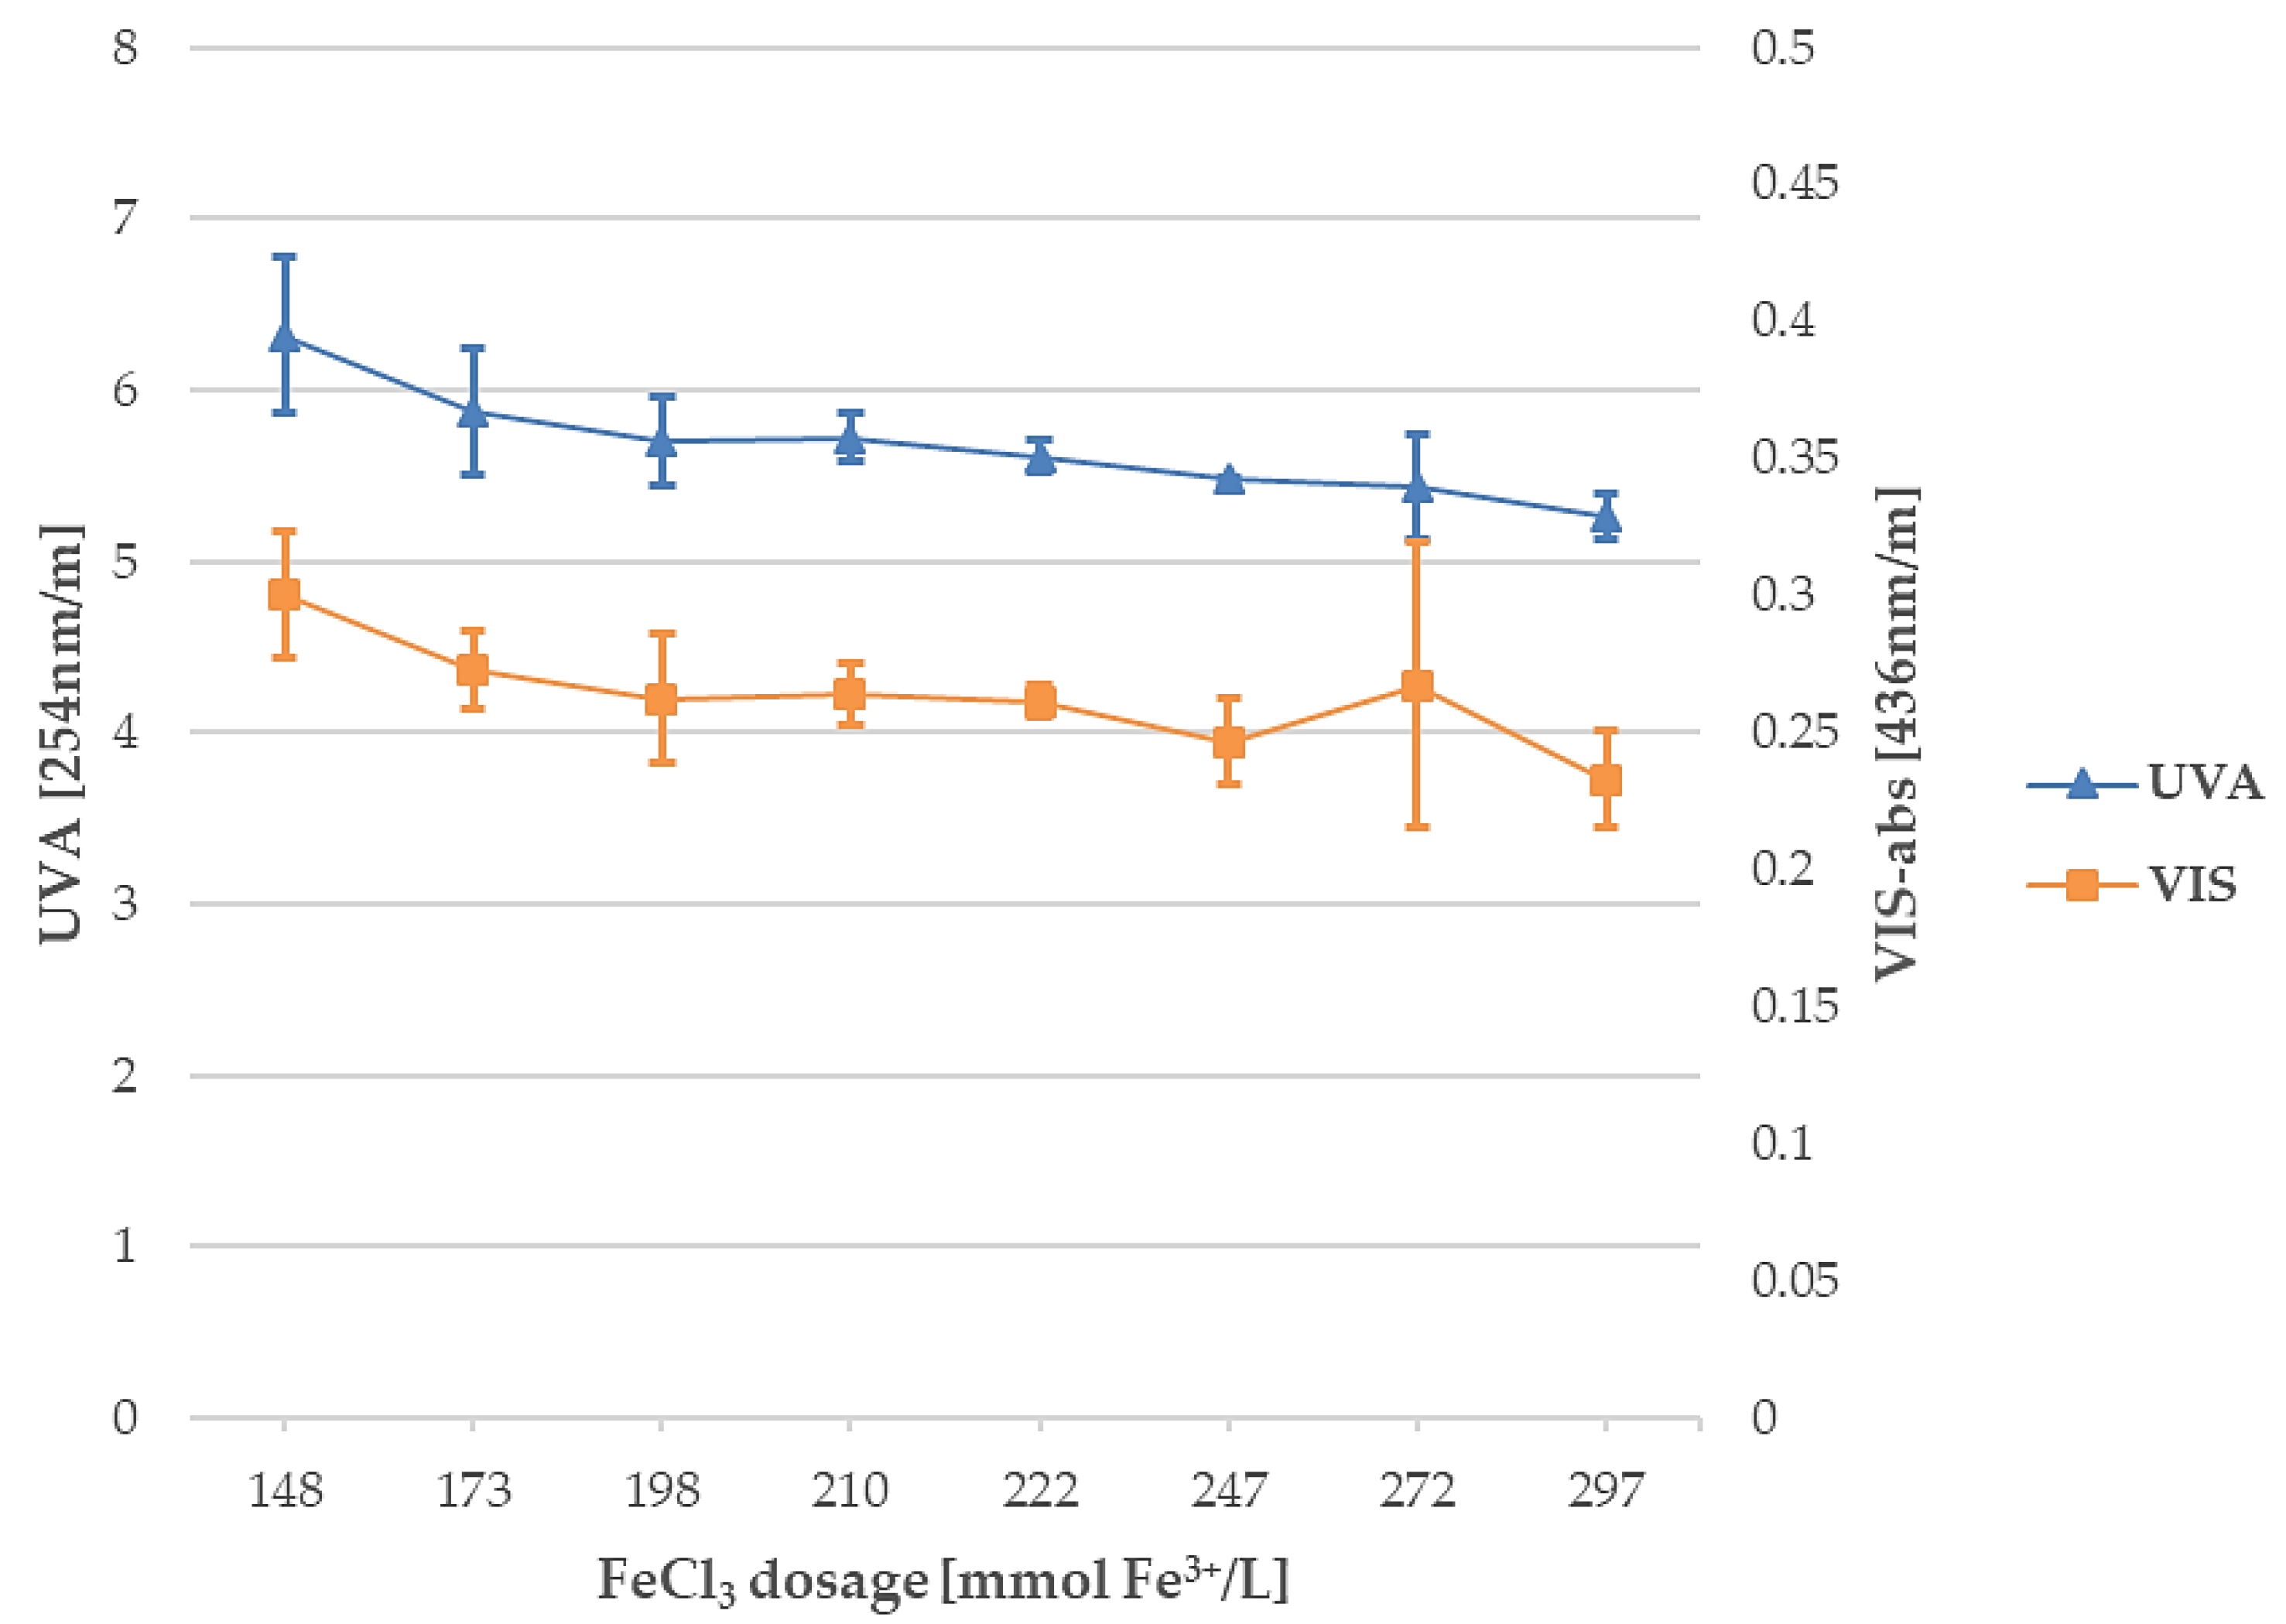
3.1. Fe3+: Coagulant Dosage

To ensure successful coagulation and flocculation, varying FeCl3 dosages were tested within a pH range of 4.9–5.3. In Figure 2, the residual UV–VIS absorbance after flocculation and sedimentation are presented.
The greatest reduction in the UV–VIS absorption seemed to occur between 148 and 173 mmol/L Fe3+, followed by a marginal improvement up to 297 mmol Fe3+. For the remaining experiments with disc filters, 173 mmol Fe3+ (70 mg FeCl3 solution/L) was chosen.

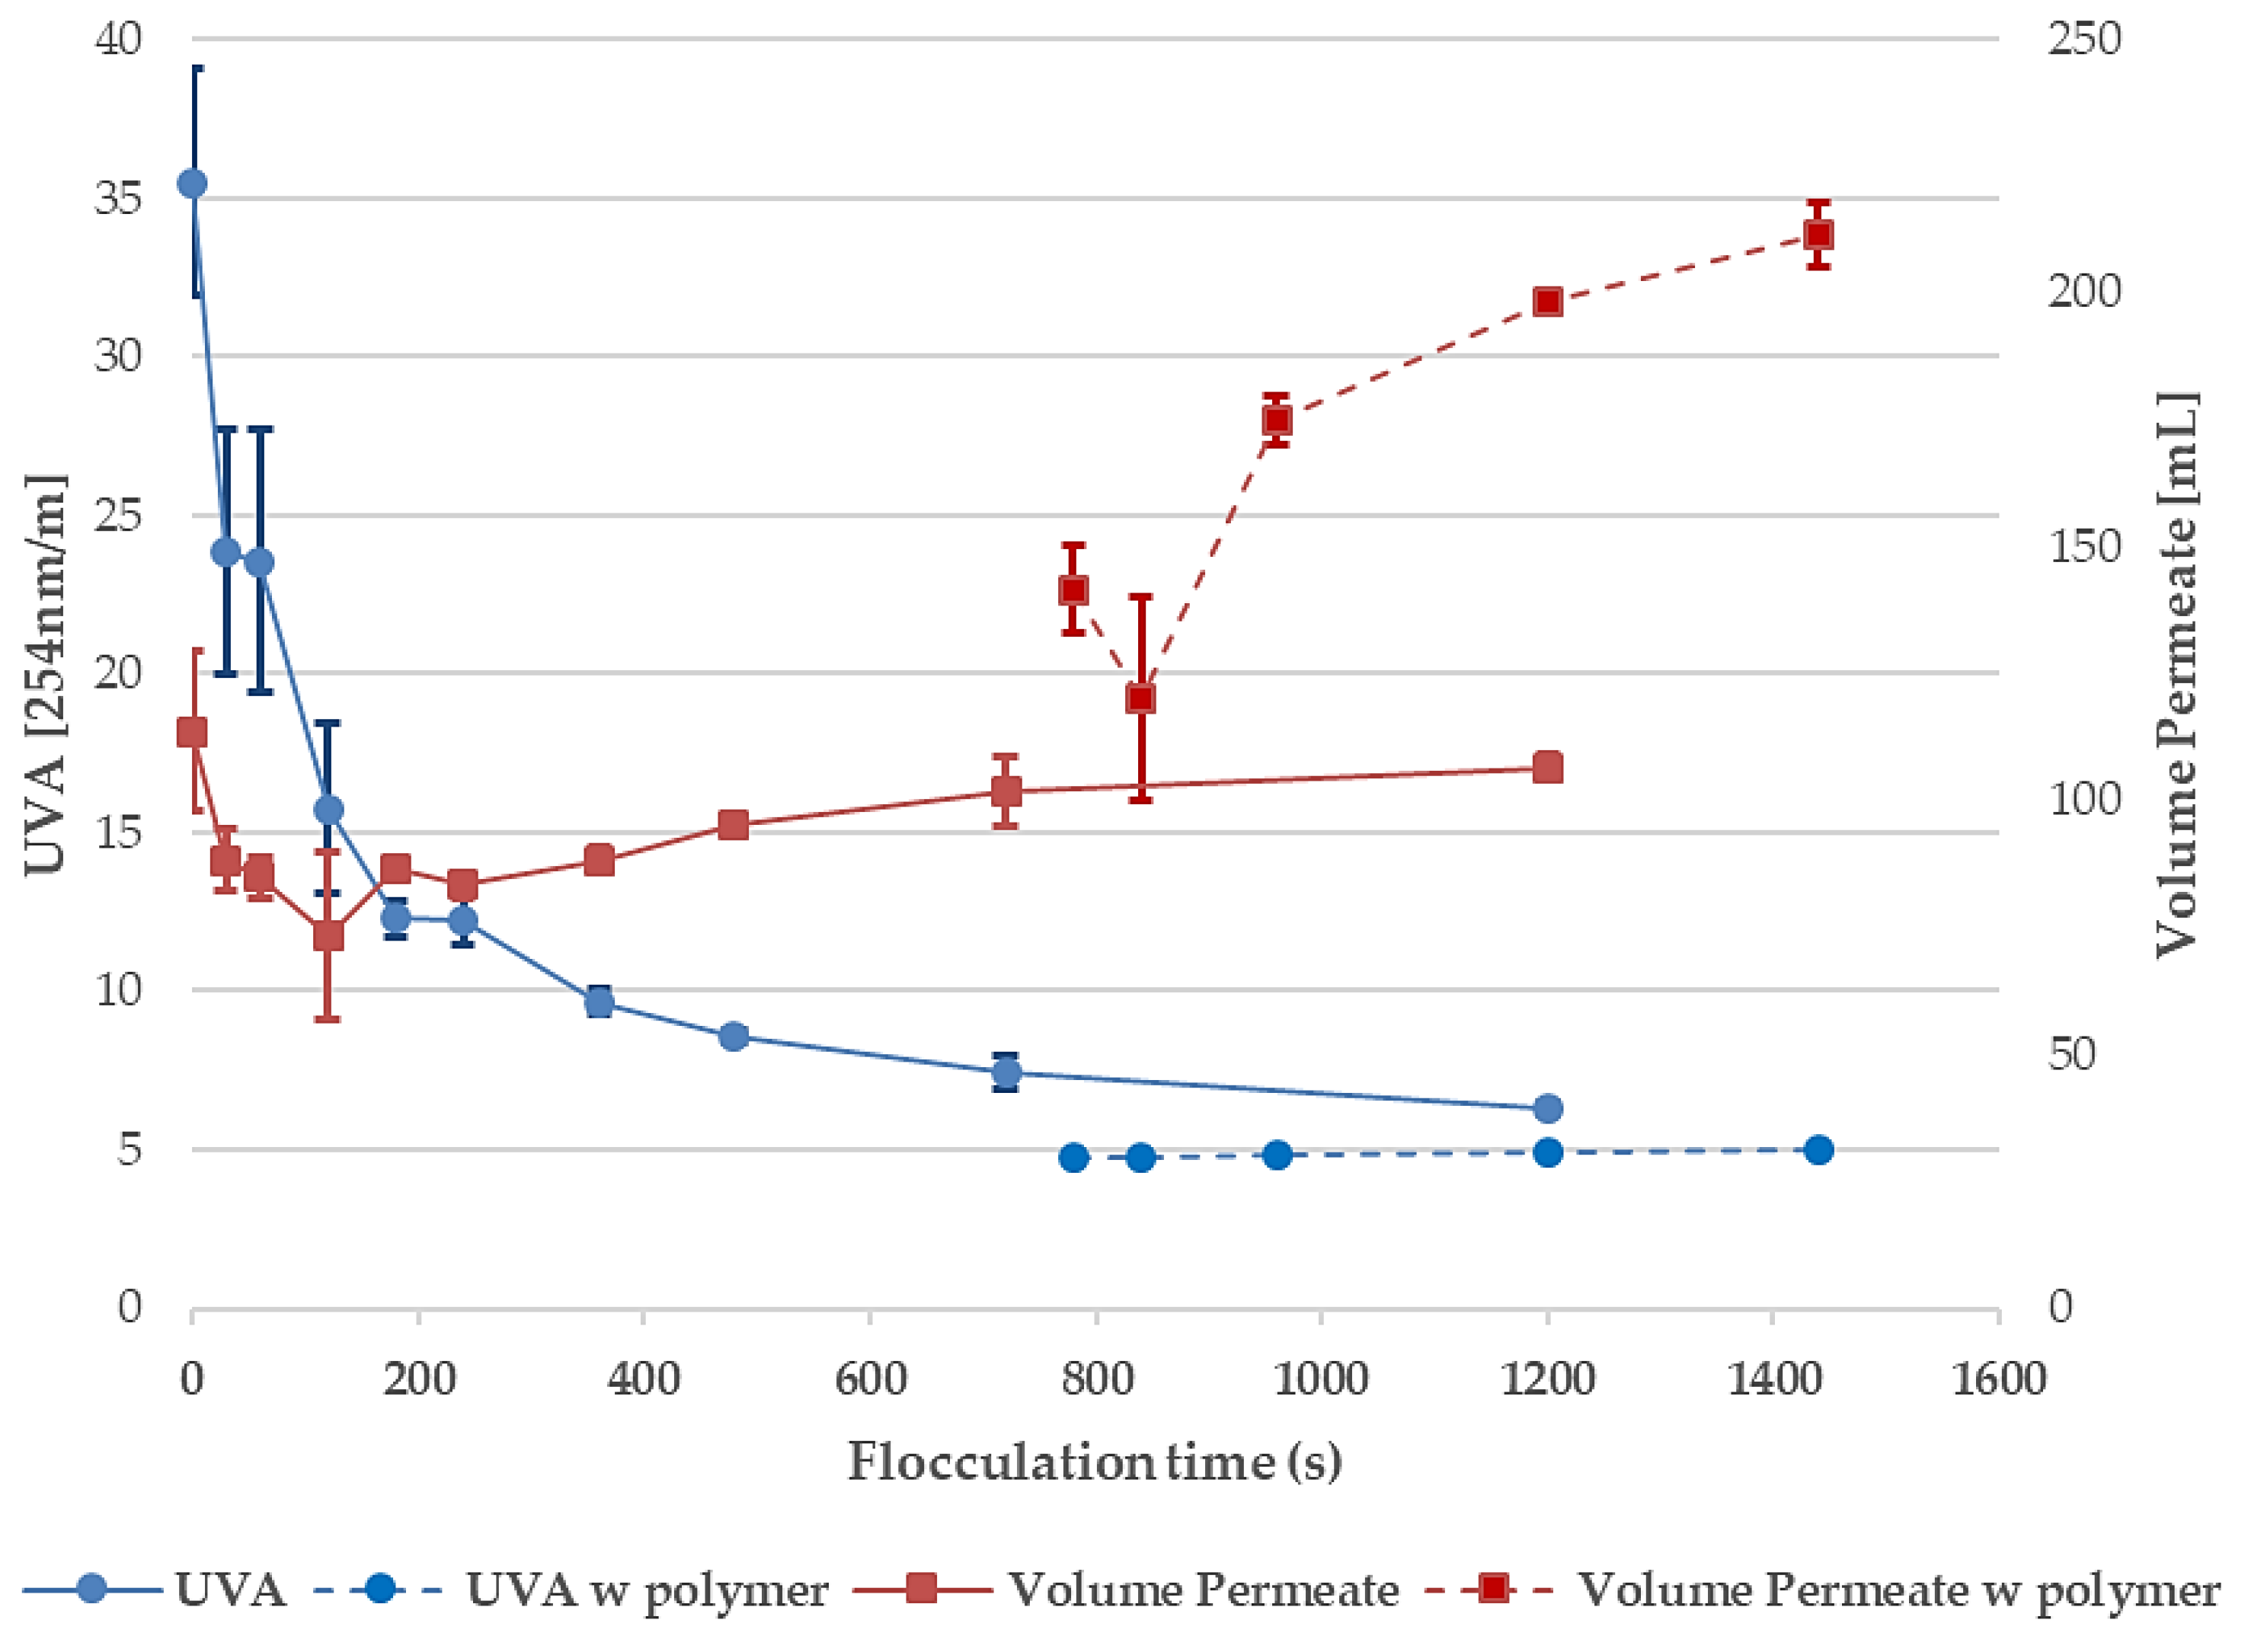
3.2. Effects of Flocculation Time, Polymer Addition, and Disc Filter Filtration

In order to produce strong flocs using FeCl3 and the synthetic polymer, different flocculation times were tested. Figure 3 shows the resulting permeate volume and residual UV absorbance (UVA) after floc separation using disc filters.
As the flocculation time increased, both the residual UVA and the permeate volume were reduced. After 120 s, the residual UVA was still decreasing, while the permeate volume started to gradually increase. During the first 120 s of flocculation, the variation of the results was most likely due to insufficient flocculation time, and once the flocculation time reached about 240 s, the UV absorption was reduced to a lower value than that of the raw water. After 240 s, the permeate volume slowly increased, and at the same time, the residual UVA decreased. Once the polymer was added, the permeate volume increased considerably, and the residual UVA decreased more than in the samples without the polymer addition. The permeate volume increased with the flocculation time. This could be a result of larger and stronger flocs over time, allowing more water to pass through the disc filter. The UVA stayed constant, however, which meant that increasing the polymer flocculation times by more than 60 s had little or no effect on the reduction of the UVA. The difference in the flocs when using the polymer can be seen in Figure 4.
Based on the results seen in Figure 3, the flocculation times for the FeCl3 and the polymer addition were set to 720 and 240 s, respectively, in the remaining experiments. This way, the experiments could be conducted during shorter periods of time, reducing the uncertainties associated with the raw water quality variations.

3.3. Polymer Dosage, 10-µm and 40-µm Disc Filters

In the following experiments, the polymer dosage was varied, and the responses in the UVA, TOC, and permeate volume were studied using 10- and 40-µm disc filters. The flocculation time before the polymer additions was 720 s, and it was 240 s after the polymer additions. Each datapoint in Figure 5 is the average result (n = 3) after flocculation and filtration using 10 µm disc filter.
As seen in the results, the polymer additions had a large impact on the permeate volume, and a moderate effect on the residual UVA. The permeate volume gradually increase, similar to the flocculation times (Figure 3), until the polymer dose reached 0.6 mg/L. After that, the permeate volume decreased with the increasing amount of the polymer. This could be the result of an overdose of the polymer occurring above 0.6 mg/L, causing the clogging of the disc filters. Moreover, the overdosing of the polymer might cause re-stabilization from the charge reversal [22]. The UVA was reduced to about the same point where the permeate volume reached its maximum, after which the UVA became constant. The residual TOC stayed essentially at the same level, until the polymer dose reached 0.8 mg/L, when it started to increase at the same rate as the polymer dose. The only organic matter added to the samples was the polymer, and because the polymer did not significantly absorb the UV light, it is reasonable to assume that the TOC increase was caused by the increase of the polymer. To illustrate this, experiments were done where the polymer was gradually added to Milli-Q water (see Figure 6 below). In Figure 6, it is possible to see an increase in the UVA when the polymer dose approaches 2 mg/L. Note that this increase is only 0.02 m−1. Following the Swedish regulatory limit for polyacrylamide in drinking water [21], using 0.5 mg polymer/L raw water resulted in a UVA and TOC reduction of 74% and 49%, respectively.
Figure 7 shows that similar trends were observed when a 40-µm disc filter was used. The UVA decreased until the polymer dose reached about 0.5 mg/L, while the residual TOC remained constant with a small increase when the polymer dosage was 0.2 mg/L. The variation of the results at lower polymer dosages was most likely due to insufficient polymer dosages. This could be an explanation for why a temporary increase in the TOC and permeate volume could be observed. As mentioned before, if 0.5 mg/L of polymer was used, a UVA and TOC reduction of 70% and 50%, respectively, could be obtained. This result is similar to what was observed when using the 10-µm disc filters but this time with a higher permeate volume. However, reaching a sufficient polymer dosage appeared to be more important.
Water with a TOC content above 4 mg/L is unsatisfactory for drinking water but is suitable as pre-treated water used for artificial groundwater recharge. Lowering the content of organic matter to 4 mg/L would reduce the organic matter load in the infiltration basins and likely ensure high-quality groundwater [3,5,6].
There are some alternatives remaining that could be investigated in future studies. Other coagulants and different polymers could be used, in particular, aluminum-based coagulants and so-called green polymers, which might be more suitable for drinking water due to the trace amounts of acrylamide (monomer) found in synthetic polymers. The concern might be that these options might not be as effective in reducing NOM. One important uncertainty that needs to be investigated is the residual polymer, which can cause clogging in the infiltration basins and other subsequent treatment steps. Lastly, how these results, in particular, permeate volume, will carry over to pilot-scale implementation remains to be seen and would make for an interesting study. It is notable that disc filters have high fluxes and, therefore, can be used for very compact waterworks designs.

4. Conclusions

In this study, the possibility of combining chemical flocculation and disc filtration for drinking water treatment was demonstrated. The most important results can be summarized as follows:
  • When combining jar tests with 10- and 40-µm disc filters, it was possible to reduce the UVA and TOC by 74% and 49% and 70% and 50%, respectively.
  • The optimum polymer dosage for the TOC and UVA reduction and permeate volume was 0.6 mg/L when using 10-µm disc filters. Good results were also achieved following the Swedish regulatory limits for drinking water, 0.5 mg/L. The polymer dosage exceeding 0.6 mg/L showed signs of clogging and residual polymer in the effluent.
  • For 40-µm disc filters, the results varied more at the lower polymer dosage and reached stable results at 0.5 mg/L. Increasing the polymer dosages above 0.5 mg/L did not improve the TOC and UVA reduction, although permeate volume increased.
  • Switching the 10-µm disc filters for the 40-µm disc filters using 0.5 mg polymer/L, the permeate volume was increased by approximately 30%.
The jar tests showed the importance of sufficient polymer dosage and flocculation times for UVA reduction and the maximization of permeate volume. At least 180 s was needed to achieve successful flocculation and UVA reduction when using Fe3+, with an observed improvement up to 1200 s. Moreover, a 60-s flocculation time for the polymer, seemed to be sufficient for UVA reduction. However, the permeate volume increased with extended flocculation times.

Author Contributions

Data curation, K.H.; Investigation, K.H.; Supervision, K.M.P.; Original draft preparation, K.H. and M.C.; and Review and editing, M.C. and K.M.P.

Funding

This research received no external funding.

Acknowledgments

The authors acknowledge Nordic Water for supplying laboratory scale disc filters and BASF for providing anionic polymers. We would also like to acknowledge Tobias Persson and Britt-Marie Pott for their advice, and Marianne Franke, Dan Bogren, and Agneta Jönsson for their technical support.

Conflicts of Interest

The authors declare no conflicts of interest.

References

  1. Svenskt Vatten. 2016. Available online: http://www.svensktvatten.se/Vattentjanster/Dricksvatten/Ravatten/ (accessed on 12 July 2017).
  2. Hansson, G. Artificial Groundwater Recharge—A Method Used in Swedish Drinking Water Supply; No. 2005-05; Swedish Water Wastewater Assoc. (SWWA): Bromma, Sweden, 2000. [Google Scholar]
  3. Kolehmainen, R.E.; Langwaldt, J.H.; Puhakka, J.A. Natural organic matter (NOM) removal and structural changes in the bacterial community during artificial groundwater recharge with humic lake water. Water Res. 2007, 41, 2715–2725. [Google Scholar] [CrossRef] [PubMed]
  4. Hägg, K.; Persson, K.M.; Persson, T.; Zhao, Q. Artificial Recharge Plants for Drinking Water Supply–Groundwork for a Manual for Operation; Swedish Water Wastewater Assoc. (SWWA): Bromma, Sweden, 2018. [Google Scholar]
  5. Jokela, P.; Eskola, T.; Heinonen, T.; Tanttu, U.; Tyrväinen, J.; Artimo, A. Raw Water Quality and Pretreatment in Managed Aquifer Recharge for Drinking Water Production in Finland. Water 2017, 9, 138. [Google Scholar] [CrossRef]
  6. Tanttu, U.; Jokela, P. Sustainable drinking water quality improvement by managed aquifer recharge in Tuusula region, Finland. Sustain. Water Resour. Manag. 2018, 4, 225–235. [Google Scholar] [CrossRef]
  7. Eklund, A.; Axén Mårtensson, J.; Bergström, S.; Björck, E.; Dahné, J.; Lindström, L.; Nordborg, D.; Olsson, J.; Sjökvist, L.S.o.E. Sveriges framtida klimat—Underlag till Dricksvattenutredningen; Swedish Meteorological and Hydrological Institute: Norrköping, Sweden, 2015. [Google Scholar]
  8. Tranvik, L.; Jansson, M. Terrestrial export of organic carbon. Nature 2002, 415, 861–862. [Google Scholar] [CrossRef]
  9. Lepistö, A.; Kortelainen, P.; Mattsson, T. Increased organic C and N leaching in a northern boreal river basin in Finland. Glob. Biogeochem. Cycles 2008, 22. [Google Scholar] [CrossRef] [Green Version]
  10. Hernebring, C. Operational Experiences at Water Treatment Plants Applying Chemical Coagulation during the Autumn/Spring 1998–99; Swedish Water Wastewater Assoc. (SWWA): Bromma, Sweden, 2003. [Google Scholar]
  11. Ljunggren, M. Micro screening in wastewater treatment—An overview. Vatten 2006, 62, 171. [Google Scholar]
  12. Truesdale, G.; Birkbeck, A. Tertiary Treatment of Activaded Sludge Effluents. Water Pollut. Control 1968, 67, 483–492. [Google Scholar]
  13. Lynam, B.; Ettelt, G.; McAloon, T. Tertiary treatment at Metro Chicago by means of rapid sand filtration and microstrainers. J. (Water Pollut. Control Fed.) 1969, 41, 247–279. [Google Scholar]
  14. Väänänen, J. Microsieving in Municipal Wastewater Treatment: Chemically Enhanced Primary and Tertiary Treatment; Department of Chemical Engineering, Lund University: Lund, Sweden, 2017. [Google Scholar]
  15. Crittenden, J.C.; Trussell, R.R.; Hand, D.W.; Howe, K.J.; Tchobanoglous, G. MWH’s Water Treatment: Principles and Design, 3rd ed.; John Wiley & Sons Incorporated: Hoboken, NJ, USA, 2012. [Google Scholar]
  16. Lindquist, A.; Gillberg, L.; Hansen, B.; Karlsson, I.; Enkel, A.N.; Pålsson, A. About Water Treatment; Kemira Kemwater: Helsingborg, Sweden, 2003. [Google Scholar]
  17. Länsstyrelsen i Skåne Län, “Vombsjön,” Redovisning från Sjödatabasen. 2012. Available online: https://www.lansstyrelsen.se/download/18.6ae610001636c9c68e55840/1527064814580/Vombsjön.pdf (accessed on 25 September 2018).
  18. Löfgren, S.; Andersen, T. The color of Water—Climate induced water color increase in Nordic lakes and streams due to humus. Swed. Univ. Agric. Sci. 2017. Available online: http://info1.ma.slu.se/ima/publikationer/brochure/the_color_of_water.pdf (accessed on 15 May 2017).
  19. Meili, M. Sources, concentrations and characteristics of organic matter in softwater lakes and streams of the Swedish forest region. Hydrobiologia 1992, 229, 23–41. [Google Scholar] [CrossRef]
  20. Sydvatten, A.B. Produktionsrapport 2016. 2016. Available online: http://sydvatten.se/wp-content/uploads/2018/04/Produktionsrapport-2016.pdf (accessed on 22 October 2018).
  21. Livsmedelsverket, Statens livsmedelsverks författningssamling—Statens livsmedelsverks föreskrifter om dricksvatten. 2001. Available online: https://www.livsmedelsverket.se/globalassets/om-oss/lagstiftning/dricksvatten---naturl-mineralv---kallv/slvfs-2001-30-hela_foreskriften.pdf (accessed on 21 September 2018).
  22. Bolto, B.; Gregory, J. Organic polyelectrolytes in water treatment. Water Res. 2007, 41, 2301–2324. [Google Scholar] [CrossRef] [PubMed]
Figure 1. Photo of the Kemira Flocculator 2000 (Helsingborg, Sweden) and the laboratory-scale disc filters from Nordic Water.
Water 10 01854 g001
Figure 2. The residual UV–VIS absorption after chemical flocculation and sedimentation using FeCl3. The average raw water UV–VIS absorption was (n = 12) 19.1 ± 0.6 (254 nm) and 2.1 ± 0.5 (436 nm).
Water 10 01854 g002
Figure 3. The effects of the flocculation times on the UV reduction and permeate volume when using the 10-µm disc filter, with the maximum theoretical permeate volume being 1000 mL. The polymer dosage was 0.5 mg/L and was added after 720 s of flocculation time after the FeCl3 addition. Each sampling point is the result of three iterations and, in total, 45 tests. The average raw water UV absorbance (UVA) was (n = 4) 17.3 ± 0.13 (254 nm).
Water 10 01854 g003
Figure 4. Photo of Kemira Flocculator 2000. (a) Flocs formed without the polymer; and (b) flocs formed with the polymer. The difference in the floc size can clearly be seen, where the flocs formed after the polymer addition (b) were larger than those formed with only the FeCl3 (a).
Water 10 01854 g004
Figure 5. The effects of the polymer dosage on the UVA, TOC, and permeate volume using a 10-µm disc filter. The average raw water UVA (n = 4) and TOC (n = 2) were 17.3 ± 0.4 and 8.8 mg/L, respectively. The average permeate volume when filtering only the raw water was 1167 ± 58 mL after 1 min.
Water 10 01854 g005
Figure 6. The effects of the polymer dosage on the UVA and TOC added to the Milli-Q water. Each data point is the result of three iterations. The first data point is for the pure Milli-Q water. The labels for each data point show the added polymer dosage measured in mg.
Water 10 01854 g006
Figure 7. The effects of the polymer dosage on the UVA, TOC, and permeate volume using a 40-µm disc filter. The average raw water UVA (n = 4) and TOC (n = 2) was 18.2 ± 0.15 and 9.3 mg/L, respectively. Each data point in the figure is the average of three iterations (n = 3).
Water 10 01854 g007
Table 1. Average raw water quality of Lake Vomb from 2016 and 2017. Compared with other lakes in southern Sweden, the total organic carbon (TOC) concentration and color in Lake Vomb are within the lower to middle range [18,19,20].
Sampling PointpHTOC [mg/L]Color [mg Pt/L]Alkalinity [mg HCO3/L]Turbidity [FNU]U [254 nm/m]VISVI [436 nm/m]
Lake Vomb8.3 ± 0.07 1
(n = 7)
9.1 ± 0.39 1
(n = 4)
23.8 2152.9 22.9 217.7 ± 0.52 1
(n = 8)
1.54 ± 0.23 1
(n = 8)
Limit 3>9.0, <7.5415n/a0.5n/an/a
Note: 1 Measurements conducted during the experiments from summer 2017 from June to August; 2 Data reflects average annual values taken from Sydvatten AB’s annual rapport [20]; 3 Swedish regulatory limit for drinking water [21].

