1. Introduction
Spur dike is a widely used hydraulic structure in river control engineering. After the spur dike was built, the pattern of the flow is locally changed, for example, the generation, separation and attenuation of surrounding vortices make the flow present strong three-dimensional turbulent characteristics, and the flow structure is very complex. The study of local scour near the spur dike not only has important value for hydraulics, but also has practical guiding significance for the practical engineering application of the spur dike.
Under clean-water scour conditions, the scholars pay more attention to the vertical dimension erosion characteristics of the scour hole, namely the evolution characteristics of scour depth [
1,
2]. Affected by large and small-time scales, the exponential function relation can be used to describe scour depth evolution characteristics [
3,
4]. In addition, the power function relation [
5] and logarithmic function relation are often discussed [
6]. In comparison, the discussion results of scour hole’s morphological parameter are slightly smaller. We only reported the influence of flow depth and the alignment angle on the evolution rule of scour hole morphology, and thought that the ratio of scour hole-volume to scour depth was approximately constant over time [
7,
8]. Oscar et al. [
9] pointed out that one of the reasons for the lack of relevant research results is that the observation of scour hole area and volume is more dependent on the improvement of measurement techniques. With the application of new measuring tools, for example, the literature [
6] not only reported the evolution process of bridge pier scour hole 3-D structure and visualization, but also proposed the relationship between scour depth and scour hole-volume to present a cubic polynomial function. The scour hole-volume presents the growth trend of the power function over time, which is similar to that of scour depth. Bouratsis et al. [
10] also reported the 3-D structure evolution process of bridge piers scour hole and discussed in detail the evolution trend of scour hole-volume with time. Some other studies also present the role of the bridge scour countermeasures on 3D structure of the scour hole pattern [
11]. Although it showed the increase of the power function, there were clearly two different growth rates. However, there is no literature on the 3-D structure evolution of the scour hole in the spur dike.
The profile morphological characteristics of the scour hole, including the profile morphological evolution process of the scour hole over time, and spatial dimension characteristics under the scour equilibrium state, are also an area of interest for many scholars [
6,
12]. With the passing of time, the profile morphology of the scour hole remains constant. Zhang et al. [
13] further reported the slope distribution characteristics of the scour hole profile in the spur dike, and thought that its distribution characteristics were closely related to local flow. Although the above literature [
6,
12,
13] has paid attention to the morphological characteristics of scour hole profiles from the time dimension or the spatial dimension, the relevant discussion on profile area of the scour hole with time evolution has not been mentioned. It is important that this parameter is one of the important parameters which cannot be ignored in the local bed shear stress evolution model, namely, the evolution characteristics of the scour hole profile area determines the evolution trend of local bed shear stress [
14,
15,
16,
17]. At present, more of the literature has reported that the local bed shear stress gradually decreases over time [
18,
19,
20], the scour reaches the equilibrium state, and its value is close to the constant. The constant is about (0.3~0.5) τ
c, in which τ
c is the bed critical shear stress [
21,
22]. However, other scholars pointed out that although the local bed shear stress was close to constant in the state of scouring equilibrium, the evolution process did not completely follow this rule, and the evolution characteristics were not further discussed in detail. It can be seen that based on the morphology evolution of scour hole profile, the evolution trend of local bed shear stress is an urgent issue for discussion.
This study intends to adopt clear-water scouring condition and sets different alignment angles to conduct experimental research, and carry out discussions on the evolution characteristics of scour hole morphology and the regulation of local bed shear stress. Relevant research results will enrich and improve the research contents of the local scour mechanism.
2. Experimental Setup and Procedures
The experiment was carried out in a circular recirculating flume, which is 50 m long and 0.8 m wide. The observation area was located in the middle of the flume and was 30 m long. The design alignment angles of spur dike are respectively
θ = 150°,
θ = 90° and
θ = 30°. The length of the spur dike is
L = 0.12 m, which changes with the alignment angle, and the projection length of the spur dike is
L’ =
L × sin
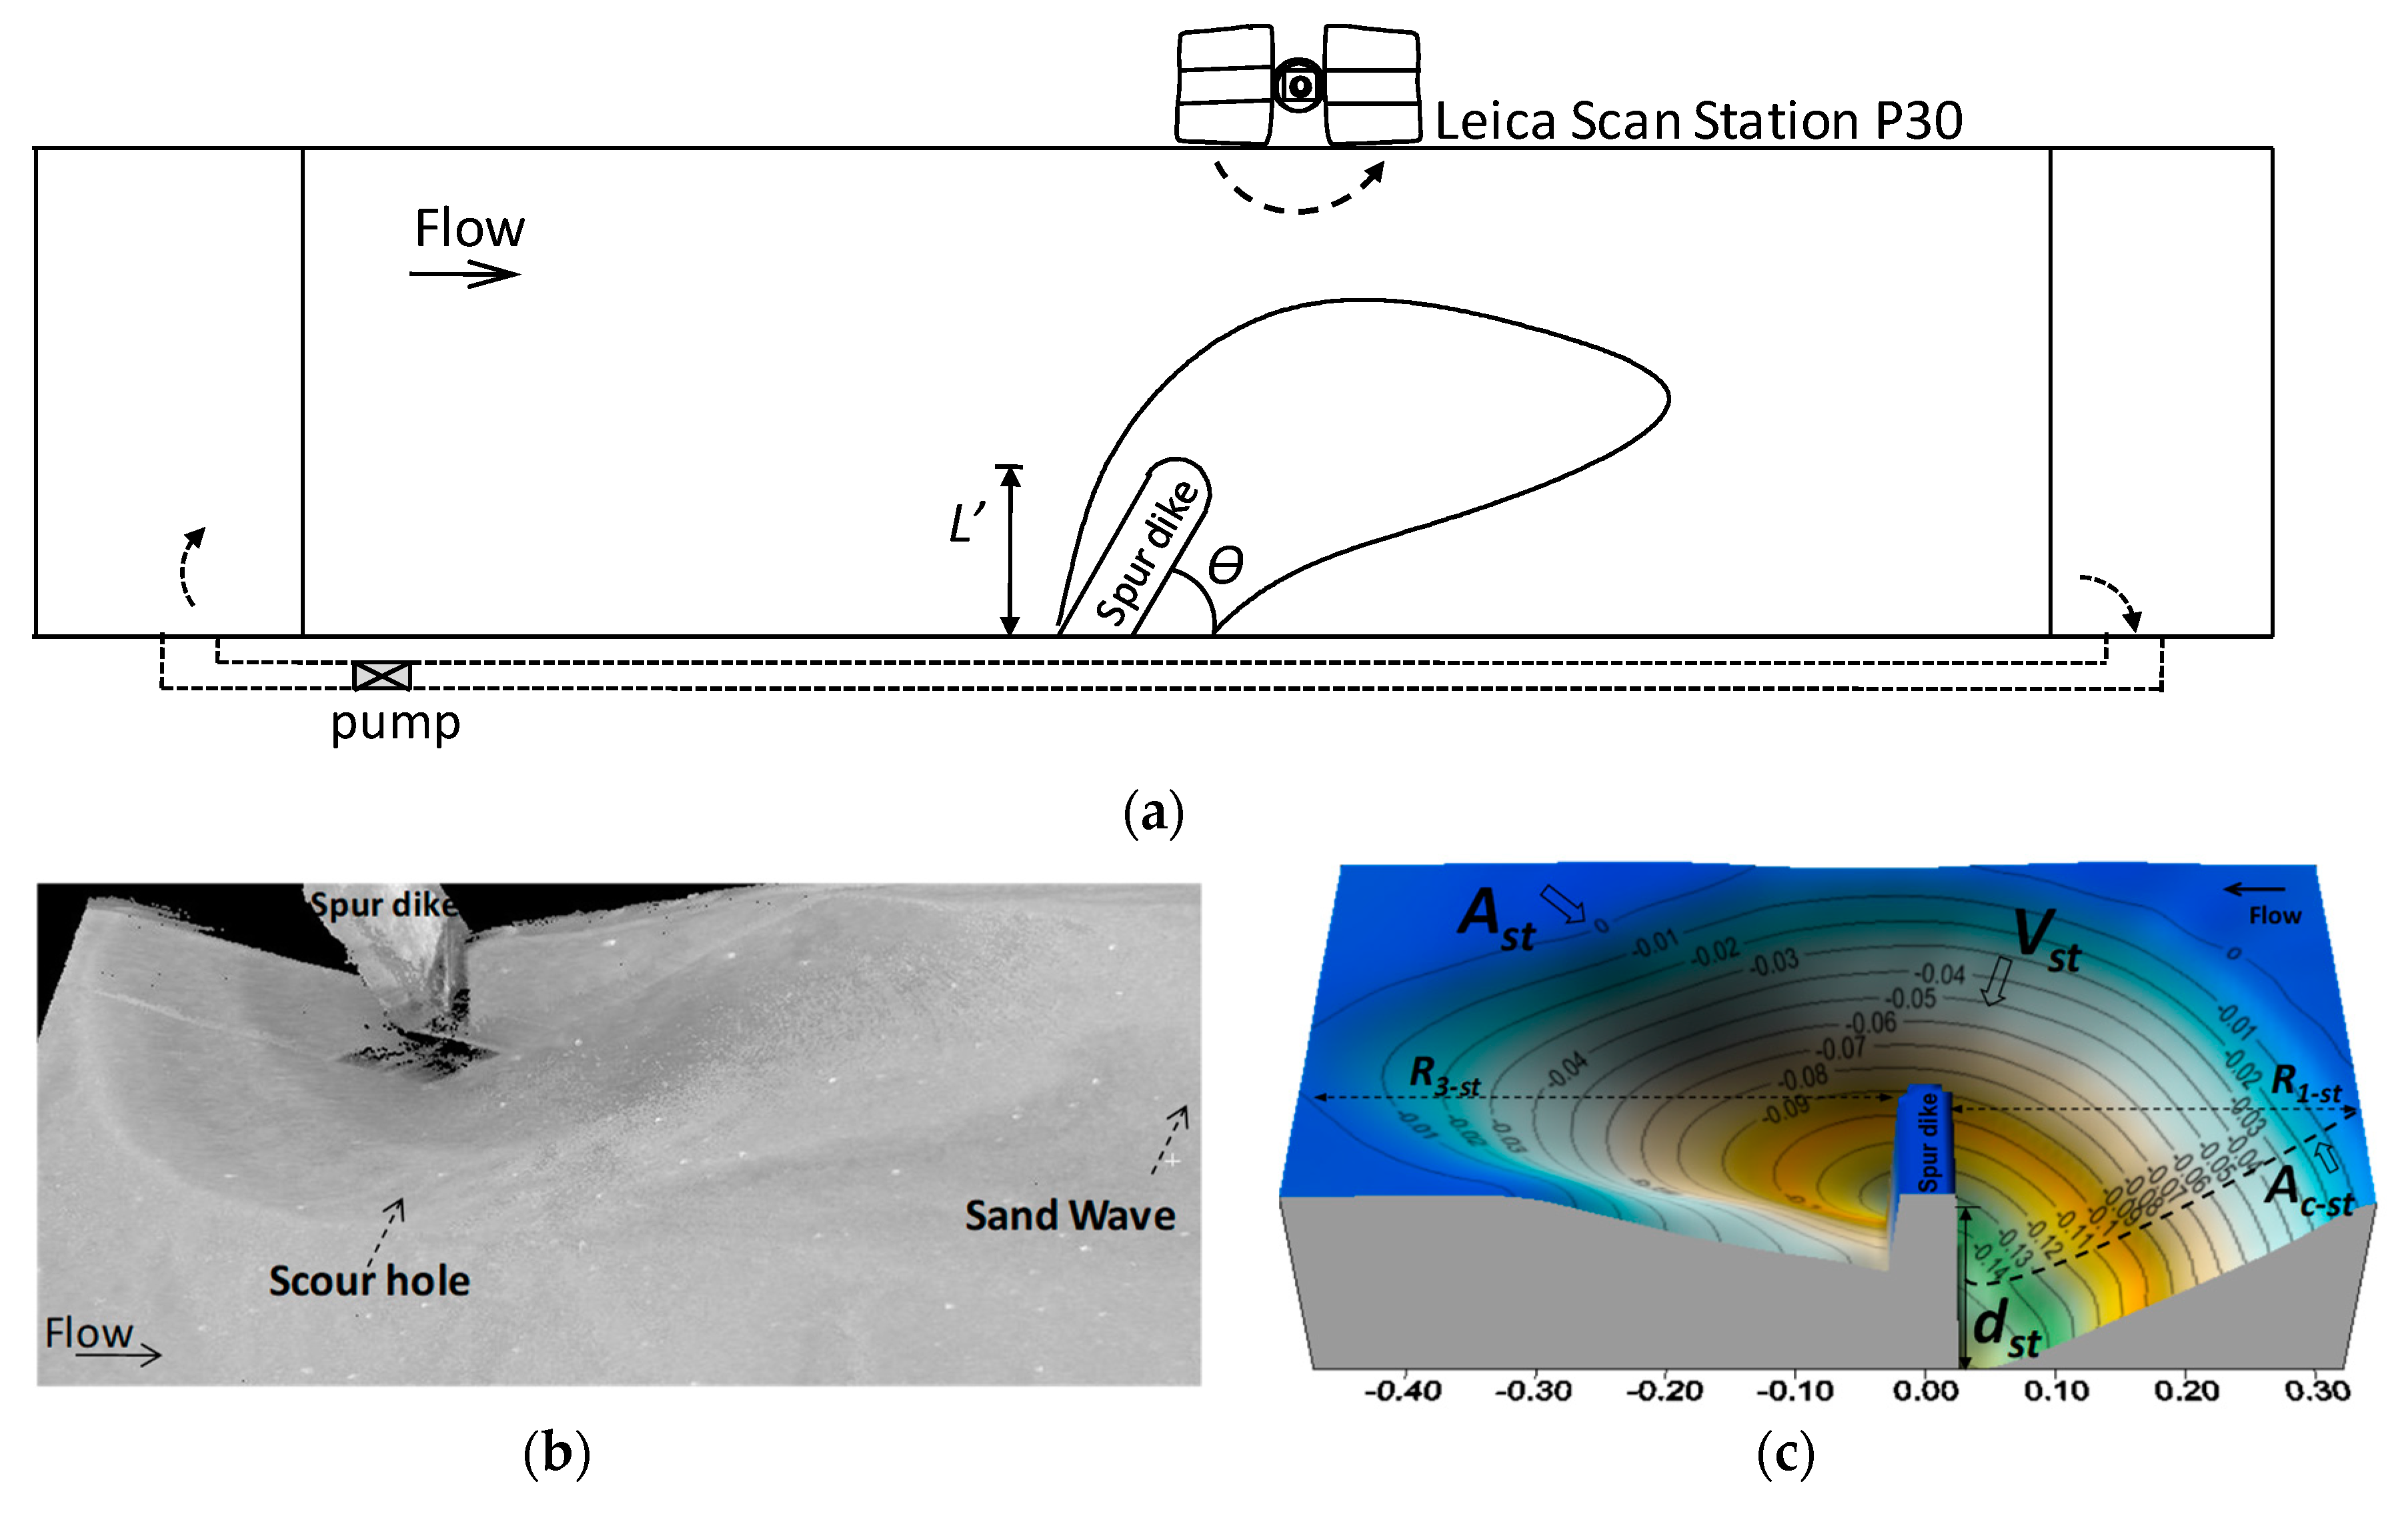
θ. The structure of spur dike is adopted Vertical wall Spur dike with semi-circular type. For the sketch of experimental plane alignment, see
Figure 1a. The sand adopted is uniform sand, with the median particle size
d50 = 0.7 mm, and the non-uniform coefficient
= 1.2. The flow depth and velocity at the upstream of the spur dike are all constant, at h = 0.15 m;
U = 0.21 m/s, respectively. The flow intensity
U/
Uc = 0.87,
Uc is the incipient velocity of sediment [
13], which belongs to Clear-Water scour conditions.
Before the experiment, the bed of the experimental area is kept flat, and the water was slowly stored in the flume to the design depth, adjusting the speed of the axial flow pump, reaching the design flow strength, and carrying out the scour experiment. The scouring duration of the experiment was t = 0.5, 1, 2, 3, 5, 12 and T = 48 h, respectively. After the designed scouring period is completed, stop the experiment, scour hole topography will be collected, and then the topography will be restored to the leveling state for the next scouring duration experiment. In particular, the flume is a closed circulation system, and the designed flow depth and velocity in each case are constant and consistent. Meanwhile, the erosion duration in each case is strictly controlled. These measures ensure the accuracy requirements of the experiment in each case.
The scour hole topography was collected using a high-speed laser scanner (Leica Scan Station P30-High-Definition 3D Laser Scanning Solution), and the scanning noise accuracy was 0.5 mm (within 50 m). The range accuracy is no more than 1.2 mm (within 1 km). The topography of scour experiment is constituted by point cloud data. Leica Cyclone 3D Point Cloud Processing Software, Golden Software Surfer and other related calculation programs are used to reconstruct the three-dimensional morphology of the scour hole and calculate the morphology parameters of the scour hole, such as the area and volume of scour hole. It is noted that due to flow intensity
U/
Uc < 1, the upstream bed of spur dike remains the original bed (zero plane) all the time, and larger sand waves are formed in the downstream of spur dike under all cases, as shown in
Figure 1b. In order to facilitate the discussion of the problem, when the three-dimensional morphology of scour hole is visualized, the large-scale sand waves in the downstream are ignored. When calculating the area and volume of the scour hole, zero plane is used as the reference surface. See
Figure 1c for details.
3. Experimental Results
3.1. The 3-D Structure of Scour Hole
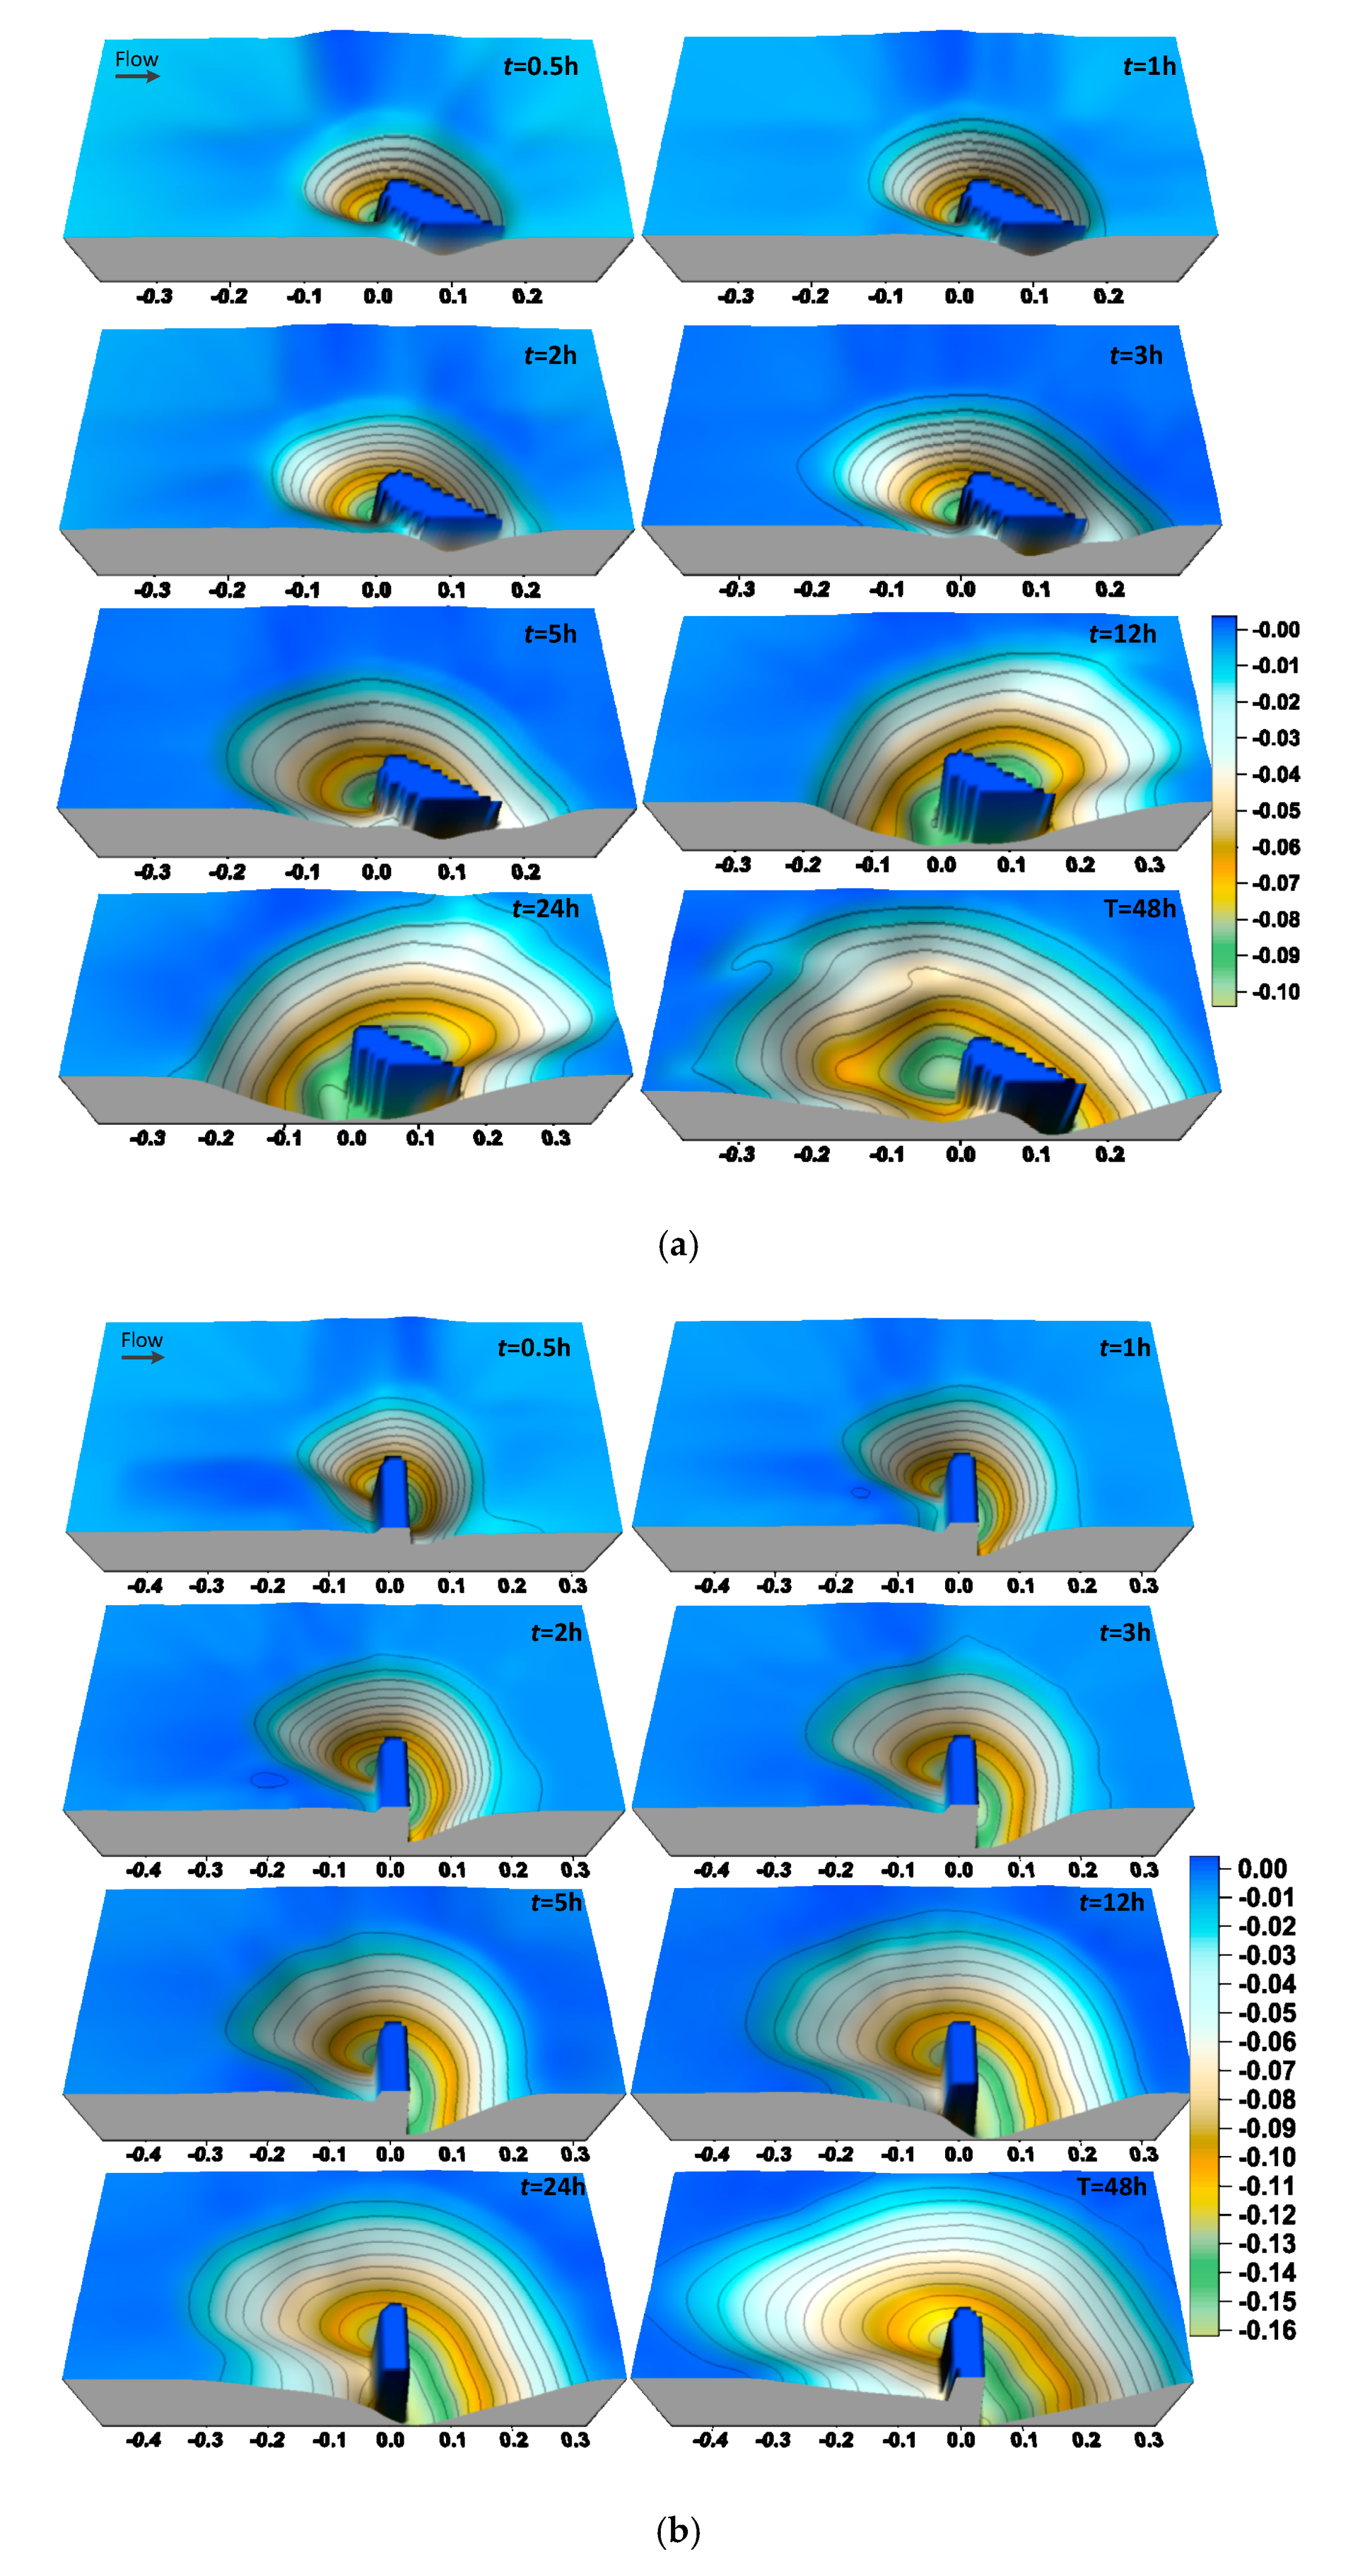
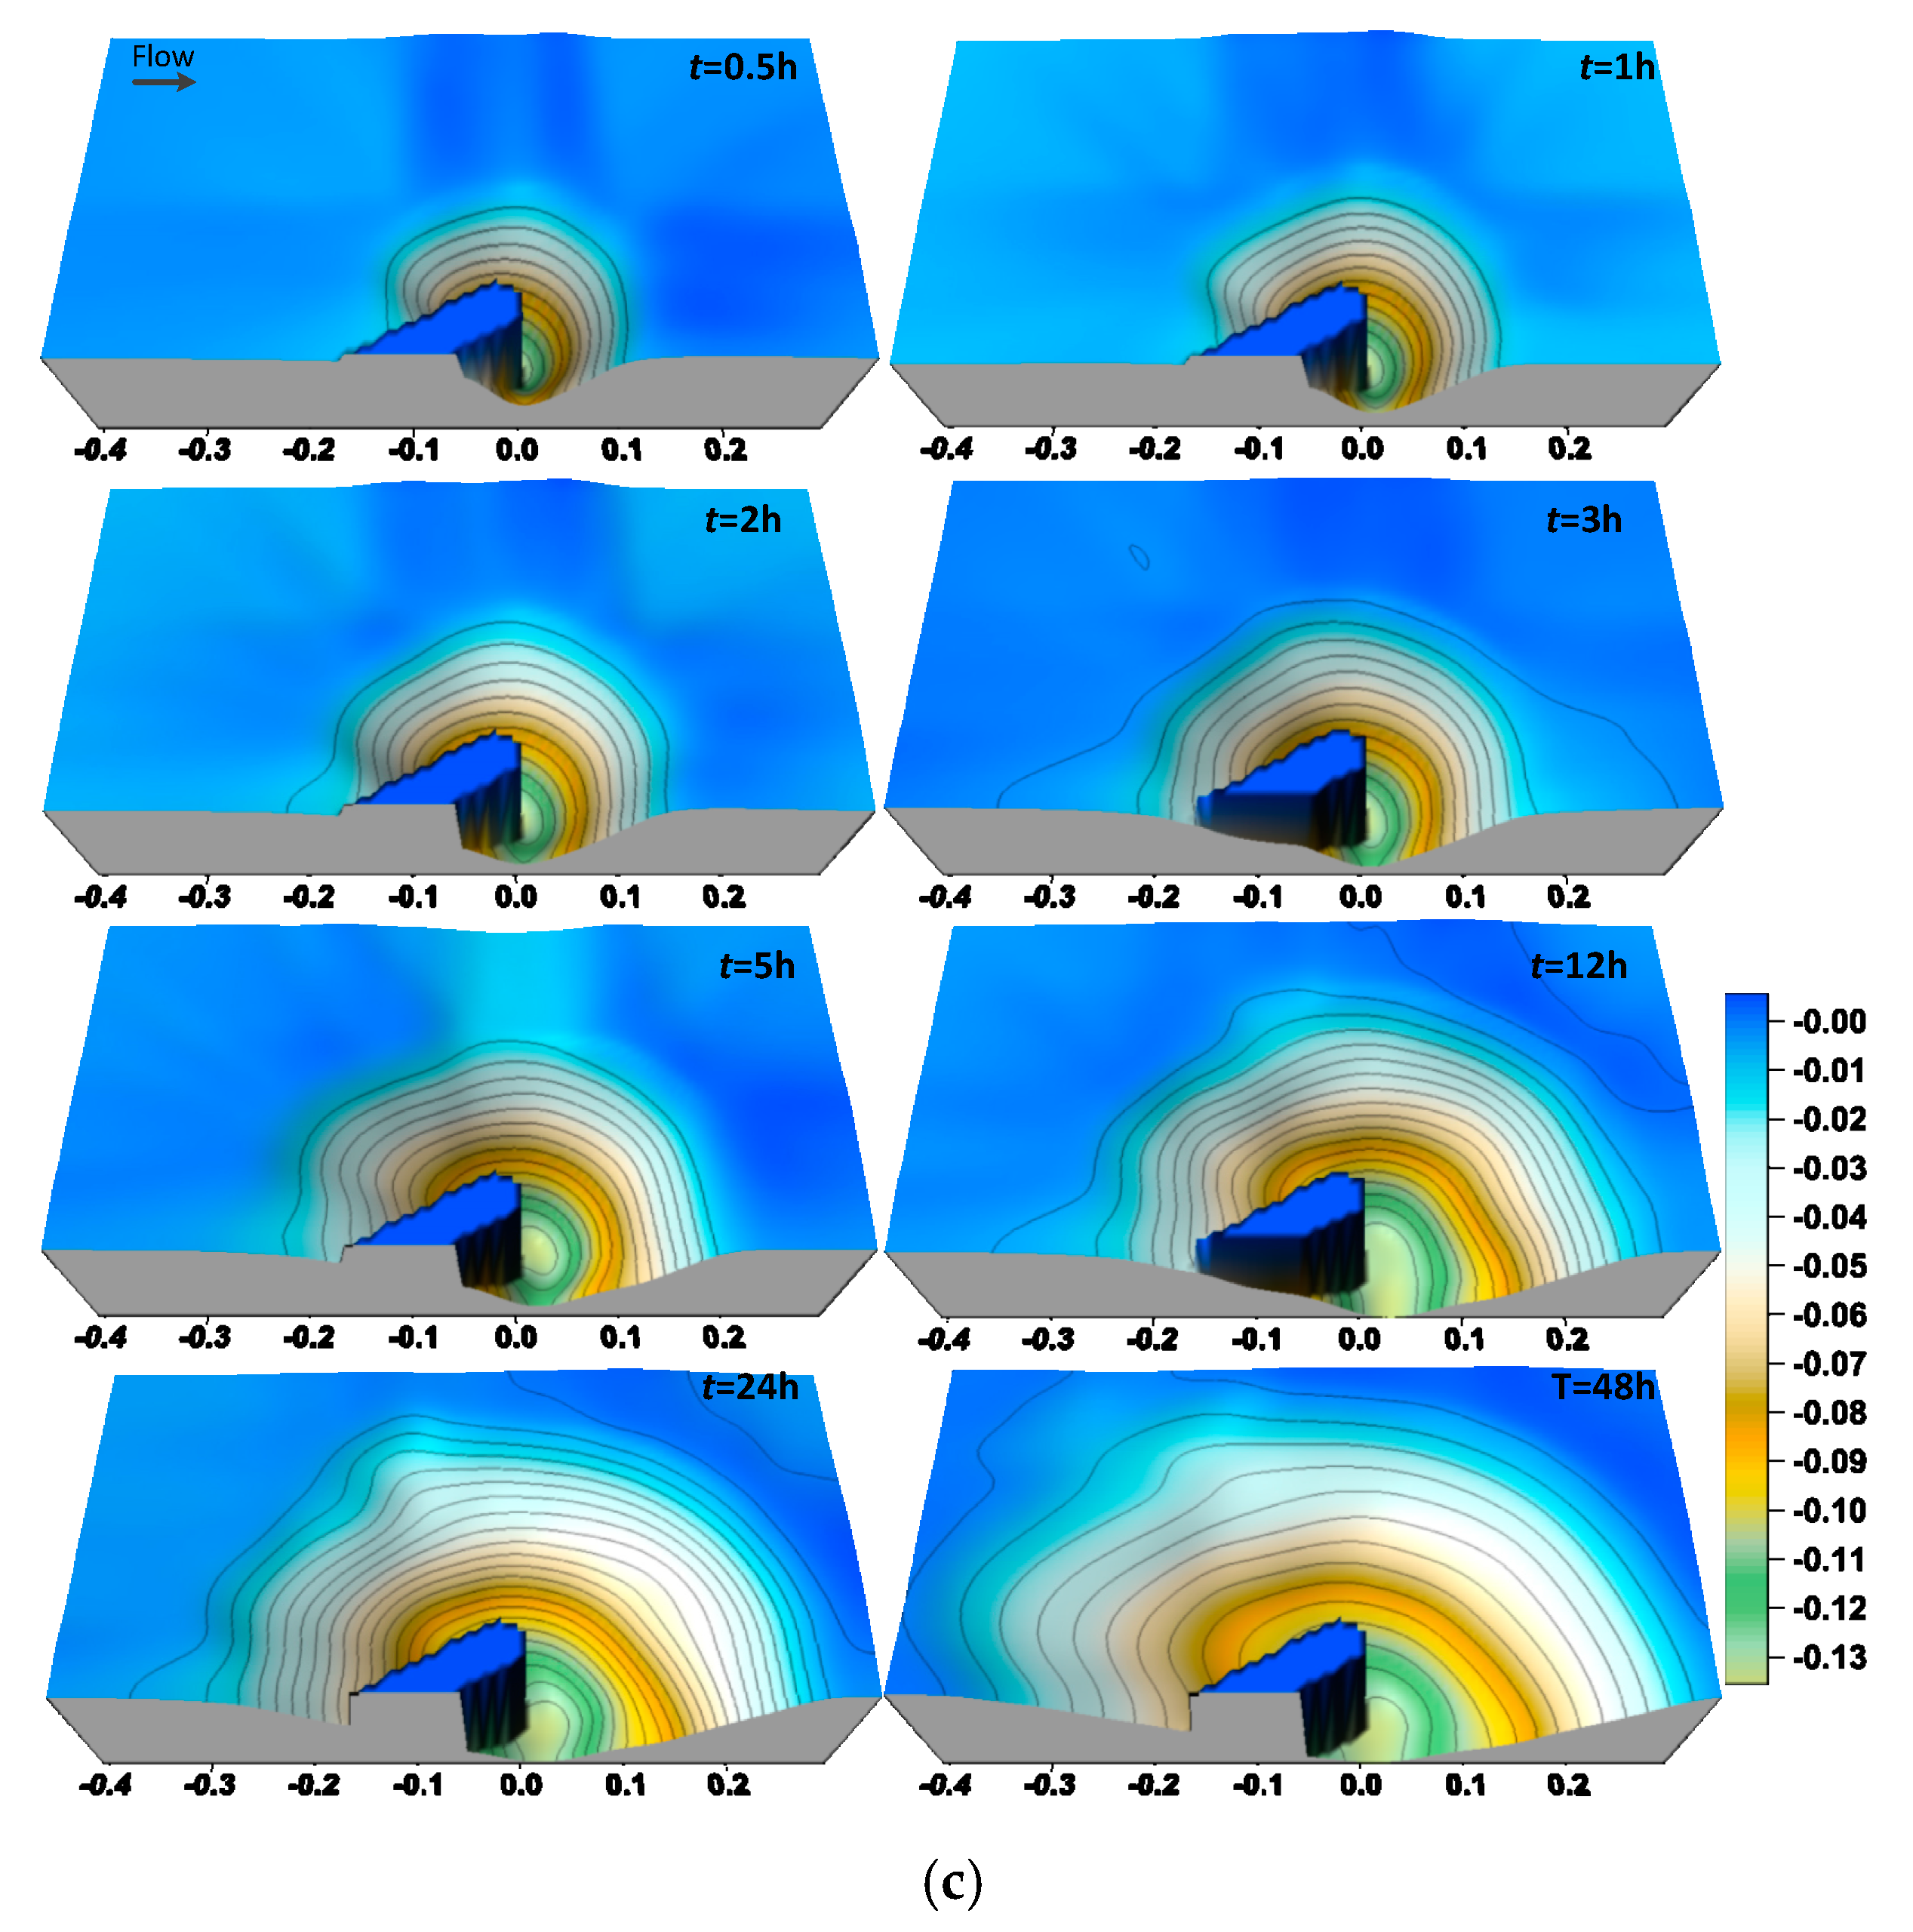
In order to more intuitively understand the 3-D structure evolution process of scour hole, based on the experimental topographic point cloud data, the 3-D morphology of scour hole at each moment is reconstructed and visualized in three alignments of spur dike, that is
θ = 150°,
θ = 90° and
θ = 30° respectively, as shown in
Figure 2.
It can be seen that both scour depth and the geometric size of the scour hole increase gradually over time. When the balance state was reached, the maximum depth was 13.9 cm, 16.3 cm and 10.7 cm respectively. By contrast, when θ = 90°, both the scour depth and geometry dimensioning of the scour hole are the largest. The scour range of the upstream and downstream of the spur dike is obviously changed due to the different the alignment angle of the spur dike; when θ = 150°, the scour area of upstream is significantly greater than that of downstream; when θ = 30°, the scour area of the spur dike downstream is slightly larger.
To the equilibrium state, when
θ = 90°, the 3-D structure of the scour hole is obviously regular, and the plane shape of scour hole is nearly semicircular; For
θ = 150°,
θ = 30° (it referred to as
θ ≠ 90° alignment, similarly hereinafter), the three-dimensional structure of scour hole is slightly irregular, and the plane shape of scour hole is closer to triangle. Along the axis of the spur dike, or Karman vortex street area, there is a step -in scour hole, at
θ = 30° this alignment is especially clear. This phenomenon should be closely related to the local flow characteristics, as shown in
Figure 2a,c; however, there is no literature that discusses this phenomenon.
3.2. The Evolution of Plane Area and Volume of Scour Hole
The flow conditions in each case were calculated, and scour depth, the plane area and volume of scour hole were calculated, as shown in
Table 1.
Under clean-water scour conditions, the research results of scour depth characteristics over time are extremely rich [
23], this will not be described again. The discussion results of the plane area
Ast~
Ase and scour hole-volume
Vst~
Vse over time are slightly deficient. According to the observation results of scour hole geometry parameters during the whole evolution process, the evolution characteristics are discussed.
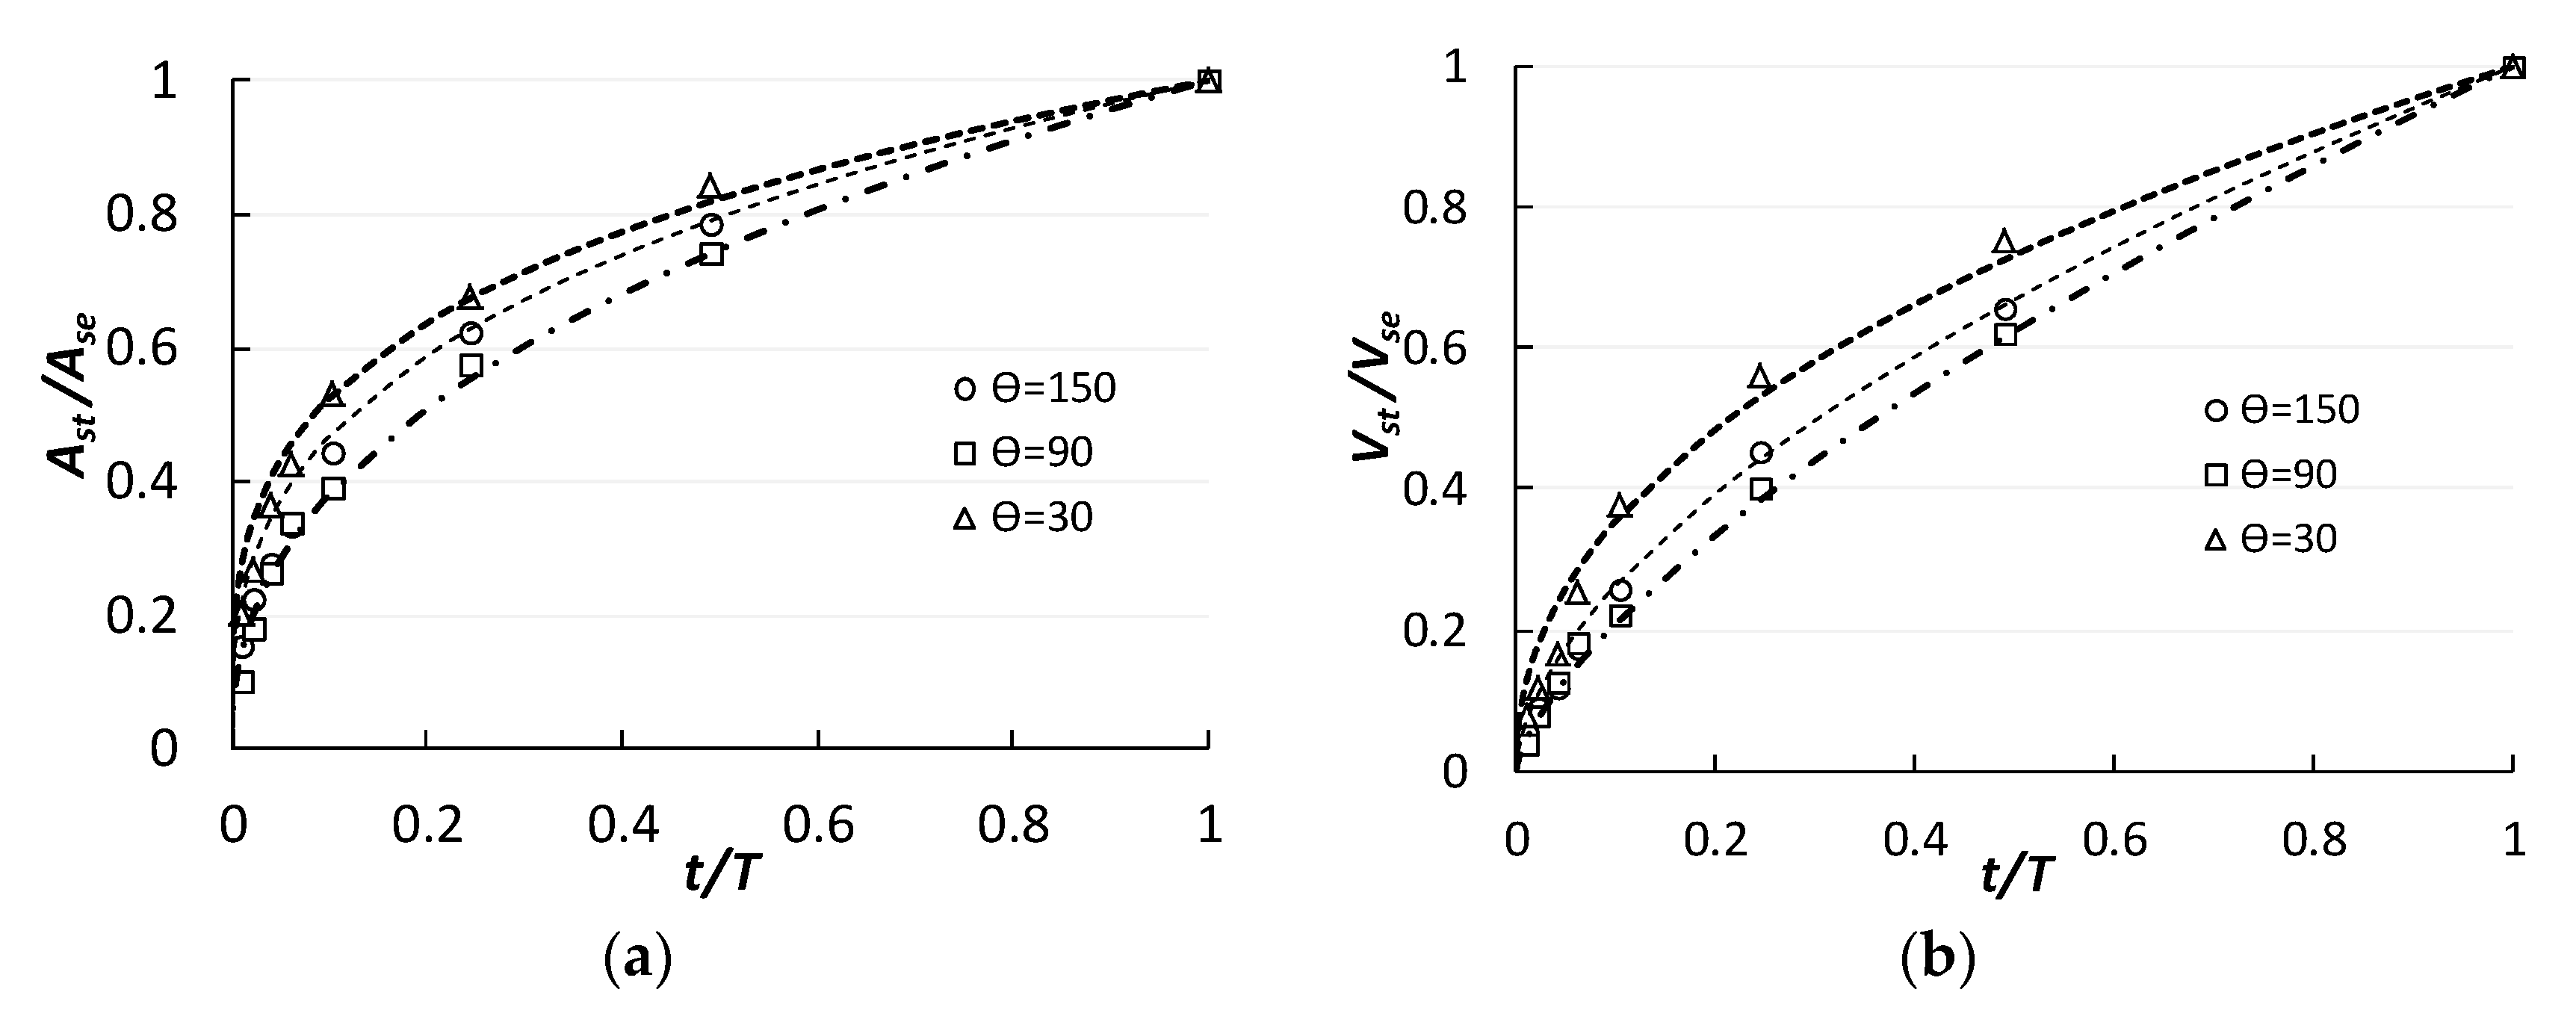
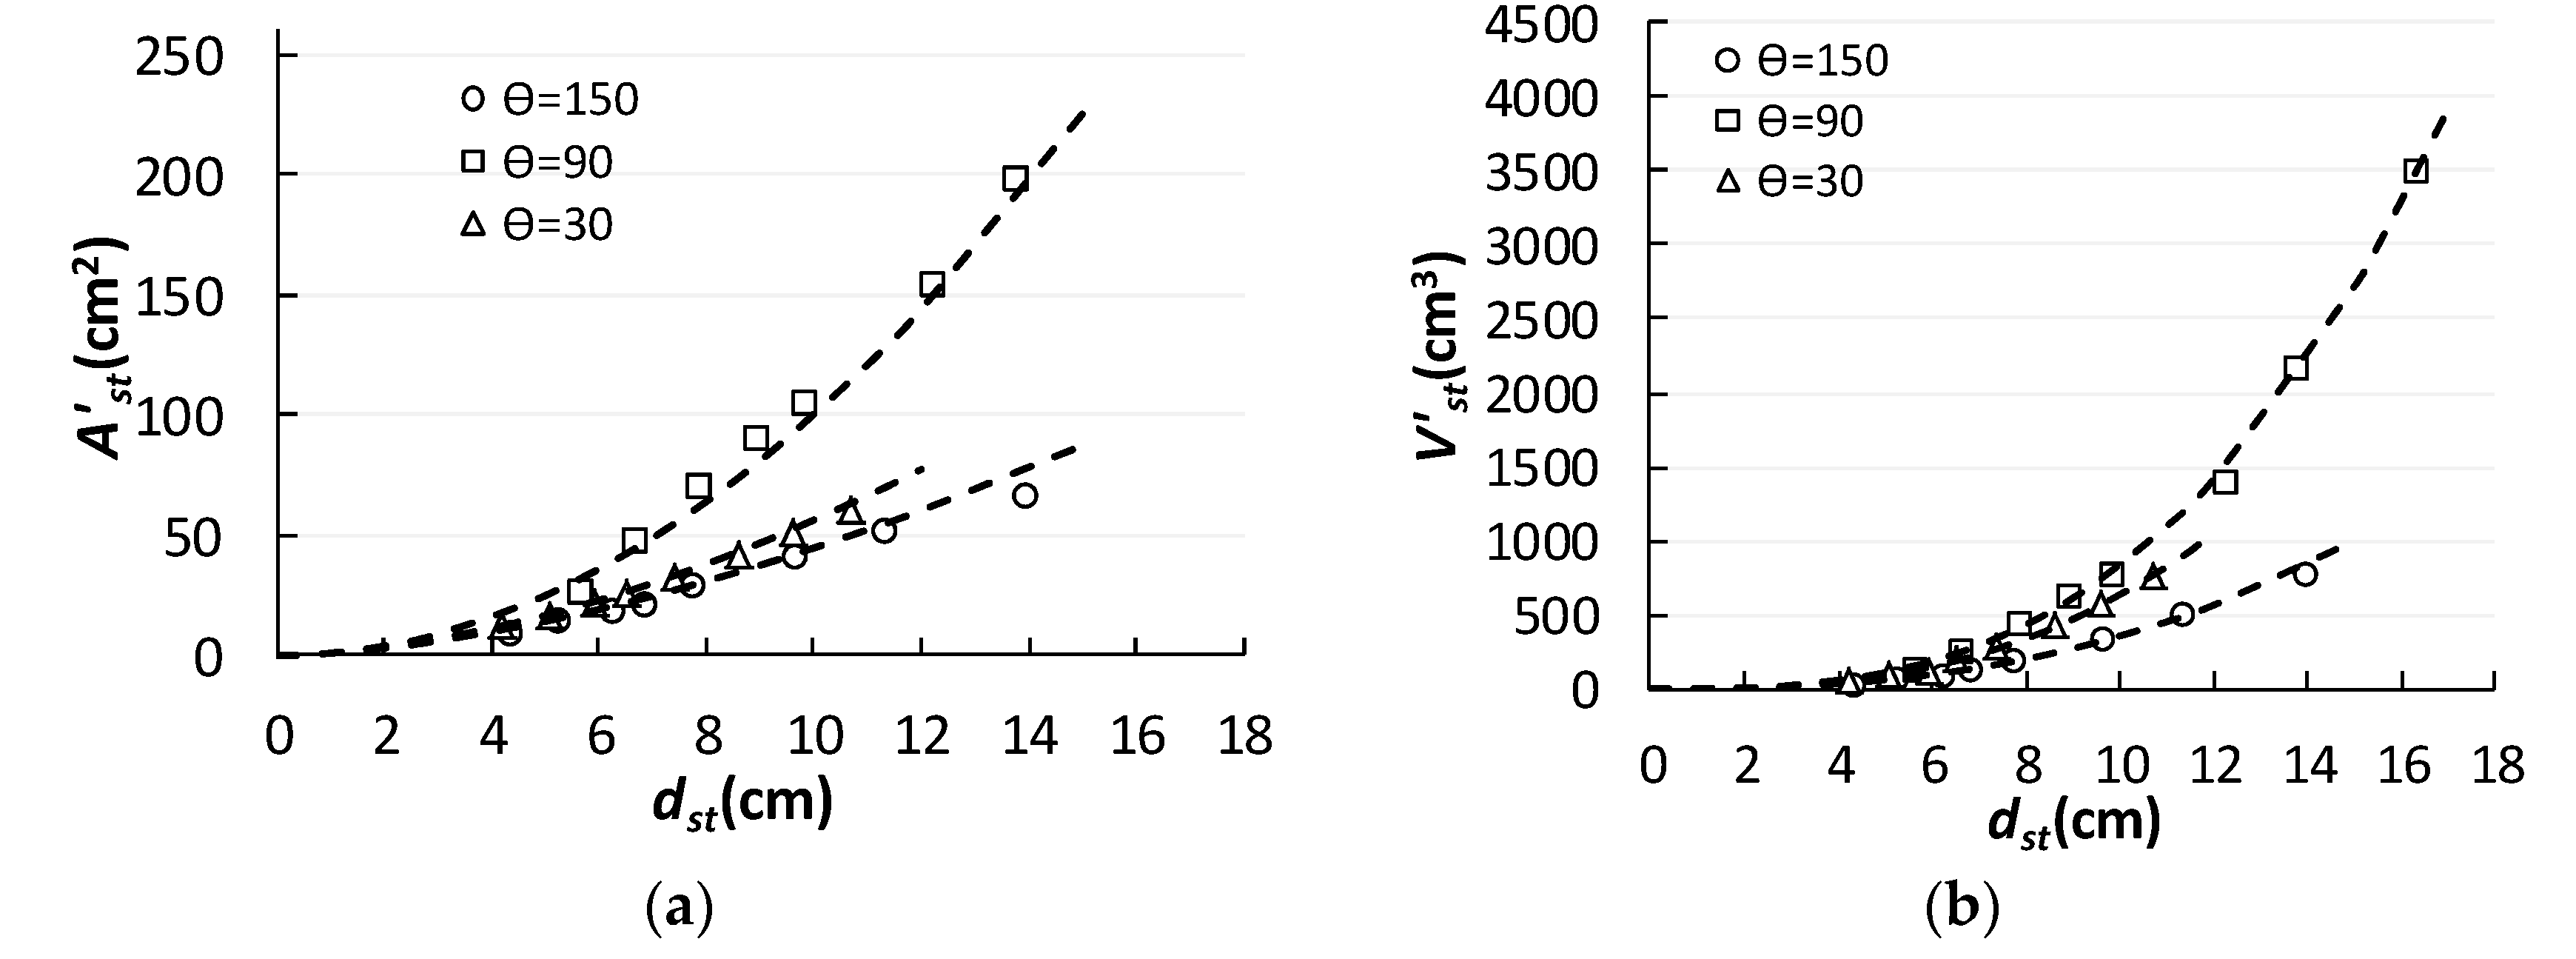
Similar to the scour depth evolution rule, the area and volume of scour hole also show a power function relation over time, and its expression is as follows:
where, C
1 and C
2 are constants;
m and
k are indices. Regression analysis showed that, for the three alignments:
θ = 150°,
θ = 90°,
θ = 30°, C
1 and C
2 were close to constant 1; the
m values were 0.33, 0.42 and 0.28 respectively;
k values were 0.58, 0.68 and 0.45 respectively. Kuhnle et al. [
7,
8] thought that when describing the evolution characteristics of scour hole-volume,
k = 0.579–0.653, the results were relatively close. It is believed that it is reasonable for
m = 0.28–0.42 and
k = 0.45–0.68 to describe the evolution characteristics of scour hole plane area and volume when
θ = 30–150°. By comparison, for
θ = 90°, the evolution curve is relatively straight, and the values of index
m and
k are slightly larger. For
θ ≠ 90°, the evolution curve is relatively curved, and the values of index
m and
k are slightly smaller, as shown in
Figure 3.
3.3. Difference of the Vertical and Longitudinal Dimension Evolution of Scour Hole
Here, Ast~dstp; Vst~dstq is adopted to discuss the differential characteristics of the vertical and longitudinal dimension evolution rates of scour hole, which was rewritten as the equal sign:
where, C
3 and C
4 are constants,
p and
q are exponents. For further deformation of Equation (2), the constant is normalized, so that
;
, the difference discriminant of the vertical and longitudinal dimension evolution rates of scour hole can be obtained:
where,
,
are respectively the plane area and volume of the scour hole after normalization. According to the experimental observation results and the values of exponential
p and
q, the difference between vertical and longitudinal dimension evolution of scour hole is discussed, as shown in
Figure 4.
Regression analysis showed that when
θ = 150°,
θ = 90°,
θ = 30°, the
p values were respectively 1.65, 2.0, and 1.75; while the
q values were 2.55, 2.92 and 2.8 respectively. If the longitudinal dimension evolution rate of scour hole is greater than that of vertical dimension evolution rate, then
p < 2,
q < 3; otherwise,
p > 2,
q > 3 [
4]. Therefore, it is easy to understand that for
θ = 90°, the
p and
q values were respectively close to 2.0, 3.0; the longitudinal and vertical dimension evolution rates of the scour hole are close to the same. For
θ ≠ 90°,
p < 2,
q < 3; the longitudinal dimension evolution rate of the scour hole is greater than that of vertical dimension evolution rate. It shows that there are also significant differences in the longitudinal and vertical dimension erosion rates of the scour hole in different spur dike alignments, which undoubtedly provides support for the theoretical model of scour evolution proposed by the literature [
4].
3.4. Constant Ratio of 3-D Morphological
Zhang et al. [
13] discussed the three-dimensional morphological spatial dimension characteristics of scour hole by conducting flume experiments and thought that the scour hole-volume has a proportional constant with the product of the plane area and the maximum scour depth, which is 0.32, and thought that the 3-D morphology of scour hole has a certain geometric similarity. However, it is still unclear whether the ratio relationship between
Vst and
dstAst still has the same characteristics throughout the evolution process of local scour. The discussion was conducted according to the experimental observation results (in
Table 1), as shown in
Figure 5.
It can be seen that Vs and Asds show a linear relationship with a slope of 0.34, that is, the ratio of Vs and Asds is still close to the proportional constant, which is the same as the existing observation results. Therefore, it can be considered that the morphology still has a certain degree of geometric similarity in the whole evolution process of the scour.
3.5. The Morphology and Area of Scour Hole Profile
According to the experimental topography of each evolution stage (
Figure 2), the profile morphology of scour hole on the upstream and downstream of the spur dike was extracted, and its orientation alignment and the calculation sketch of scour hole profile area
Ac-st were shown in
Figure 1c for details.
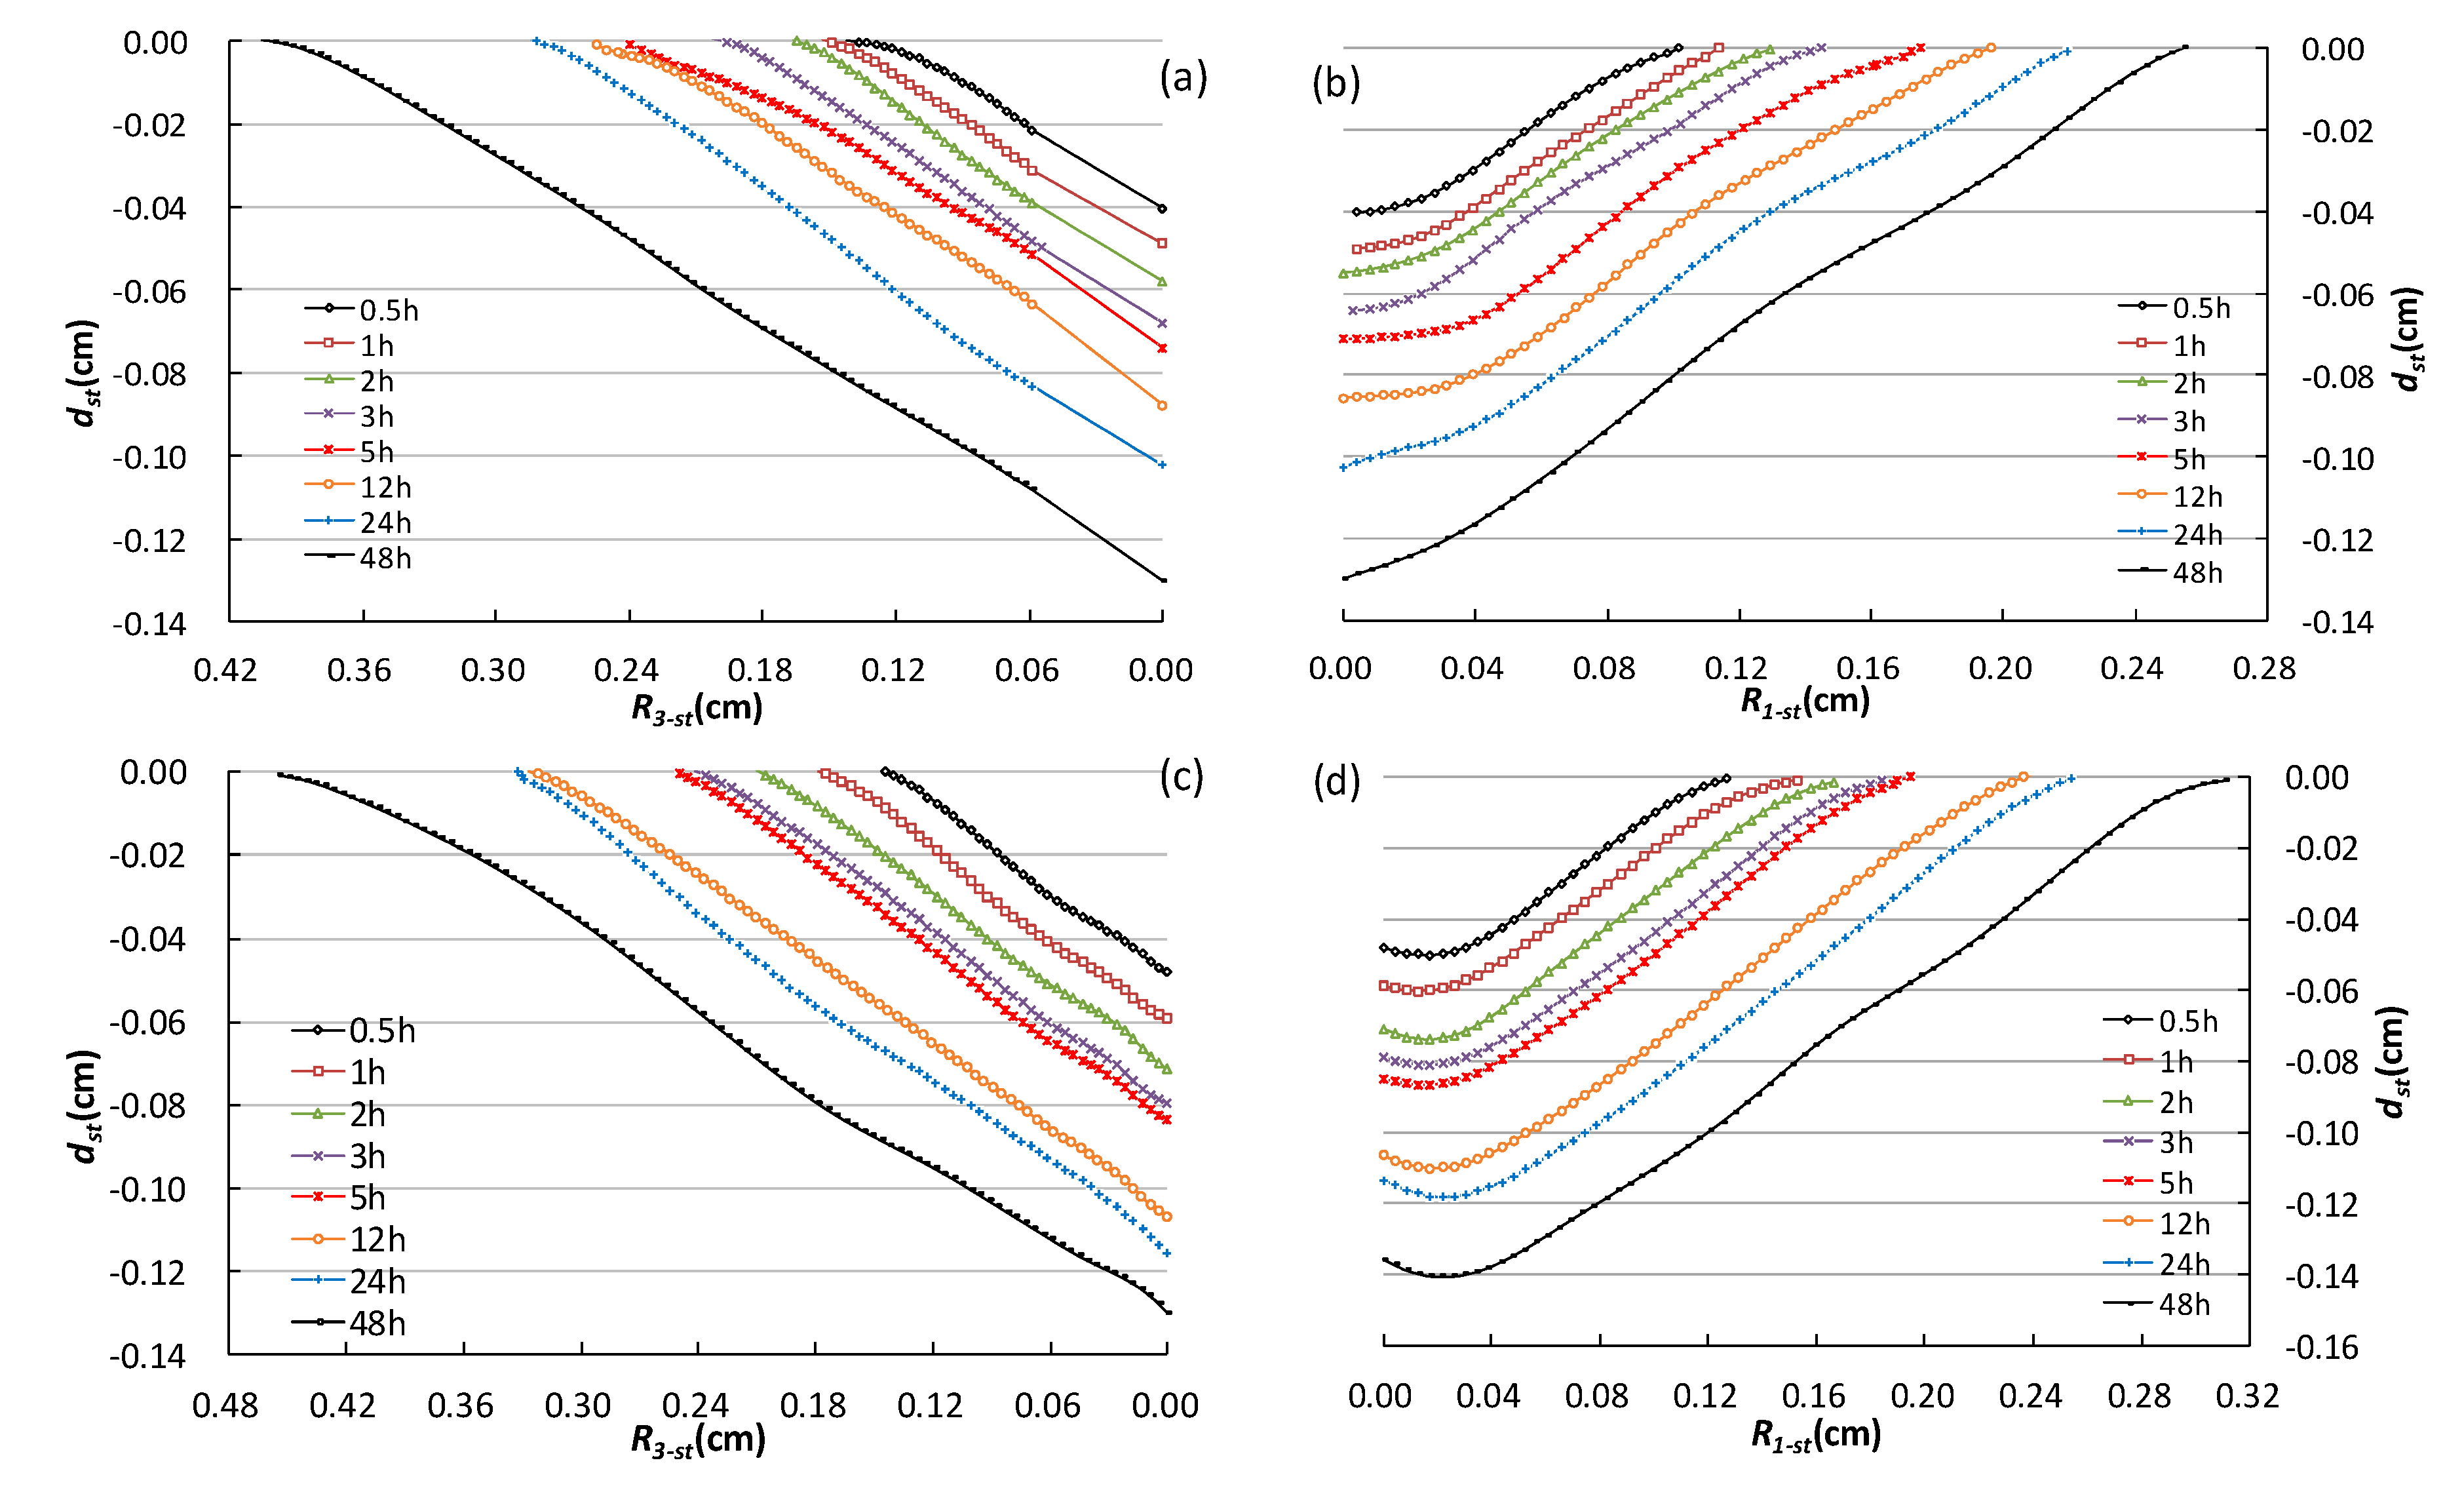
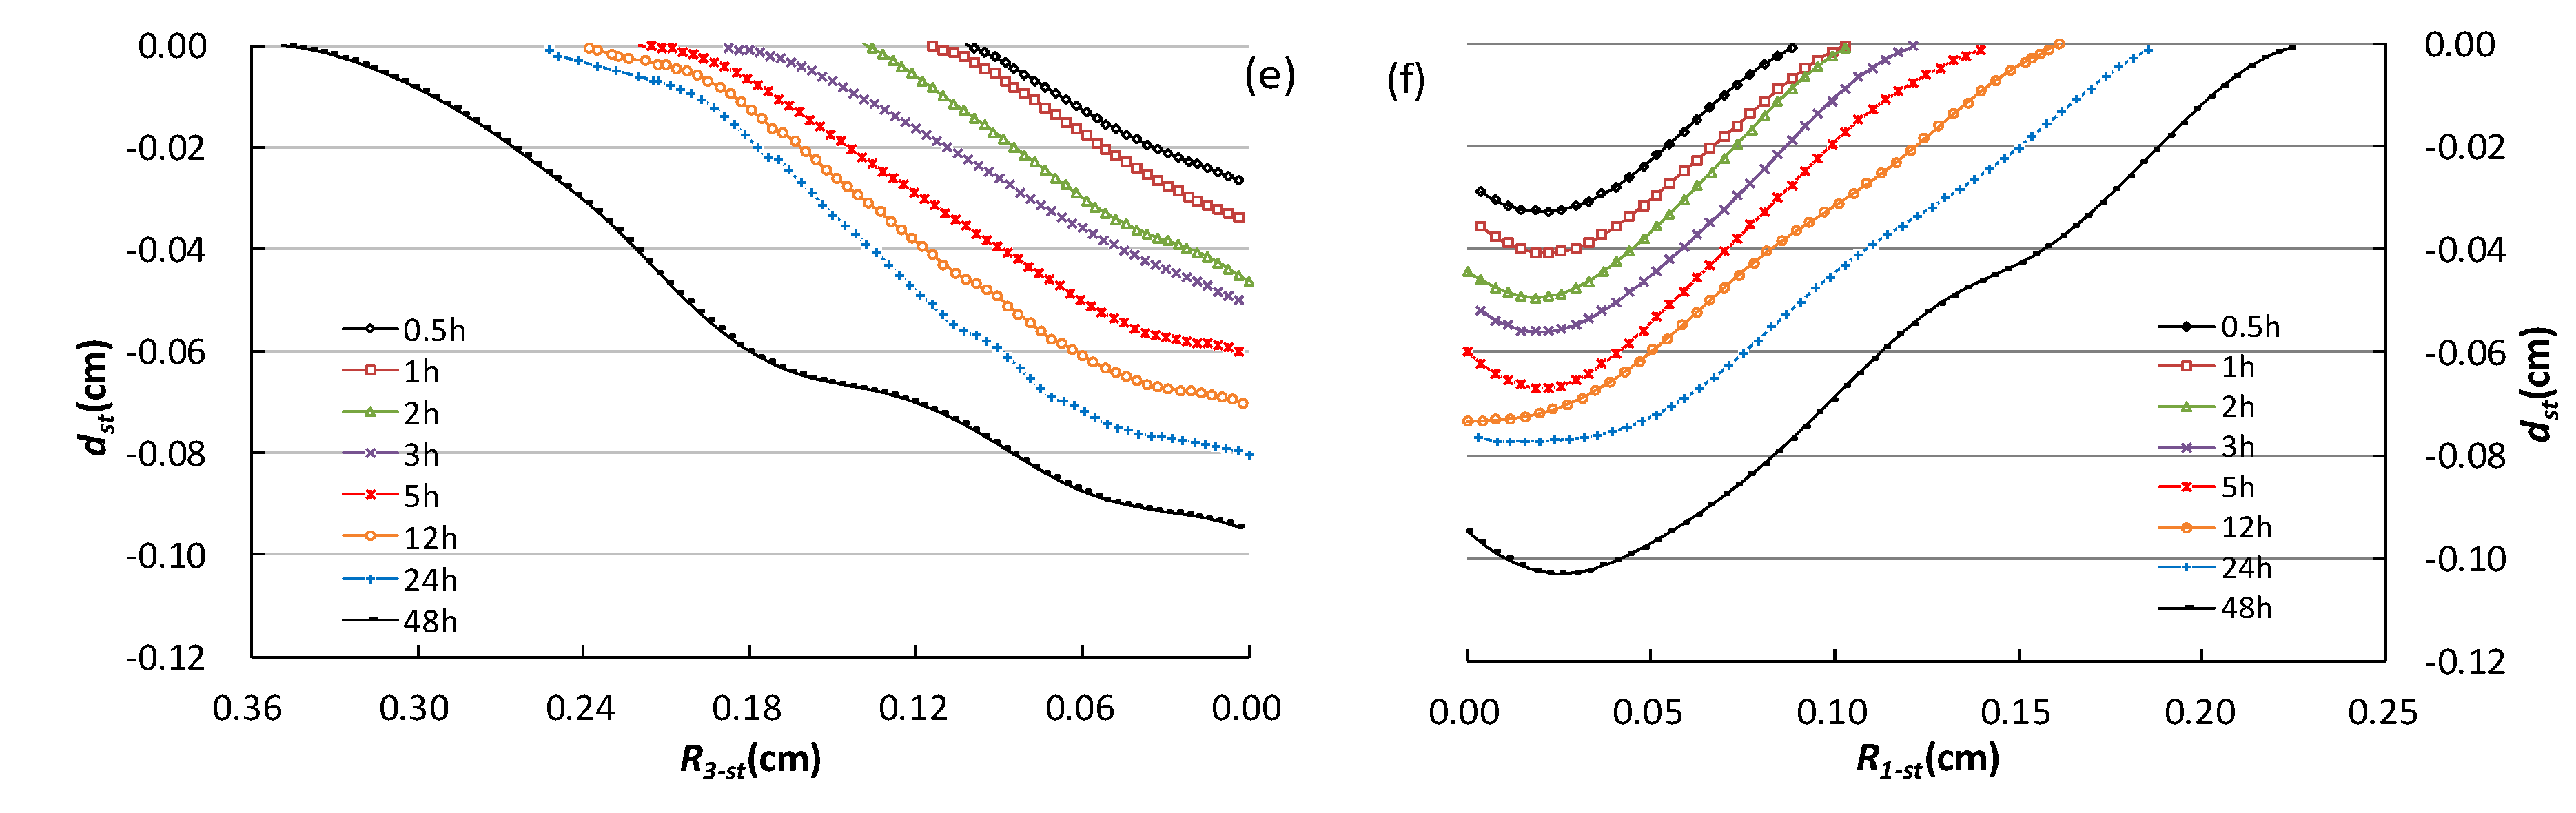
Figure 6 shows the morphology adjustment situation of scour hole profile on upstream and downstream of spur dike during the whole evolution process.
The discussion in the above section shows that there is a slight difference between the upstream and downstream scour range of different spur dikes. Geometrically, the upstream and downstream profile morphology of the scour hole is close to the inverted triangle with
R1-st and
R3-st as the base edge and scour depth
dst as the height. If it satisfies the following equation, it is in line with the golden section feature:
where the plane geometric lengths of scour hole on the upstream and downstream of spur dike are respectively represented by
R1-st and
R3-st.
The results of the experimental show that, when
θ = 150°, the mean values of Equation (4) both ends are 1.43 and 1.70 respectively; When
θ = 90°, 1.48–1.67;
θ = 30°, 1.35–1.74. All are close to the constant 1.618. That is to say, in the entire evolution process, the downstream and upstream geometric characteristic length of the spur dike approximately conforms to the golden section feature, and it is the closer to the scour balance state, the more obvious this characteristic is. The scour hole plane morphology of the bridge pier also accords with a similar characteristic [
24].
Geometrically, the upstream and downstream profile morphology of the scour hole is close to an inverted triangle. From the perspective of time dimension, its evolution process always remains constant. In fact, the distribution of horseshoe vortex core and vortex system in the scour hole of spur dike upstream is stable [
10,
25]. Therefore, the slope of profile remains relatively constant throughout the evolution over time. Equation (4) further indicates that the scour hole profile not only remains relatively constant throughout the evolution process, but also has a certain proportion relation, which forms a stable state when it is close to the golden section feature.
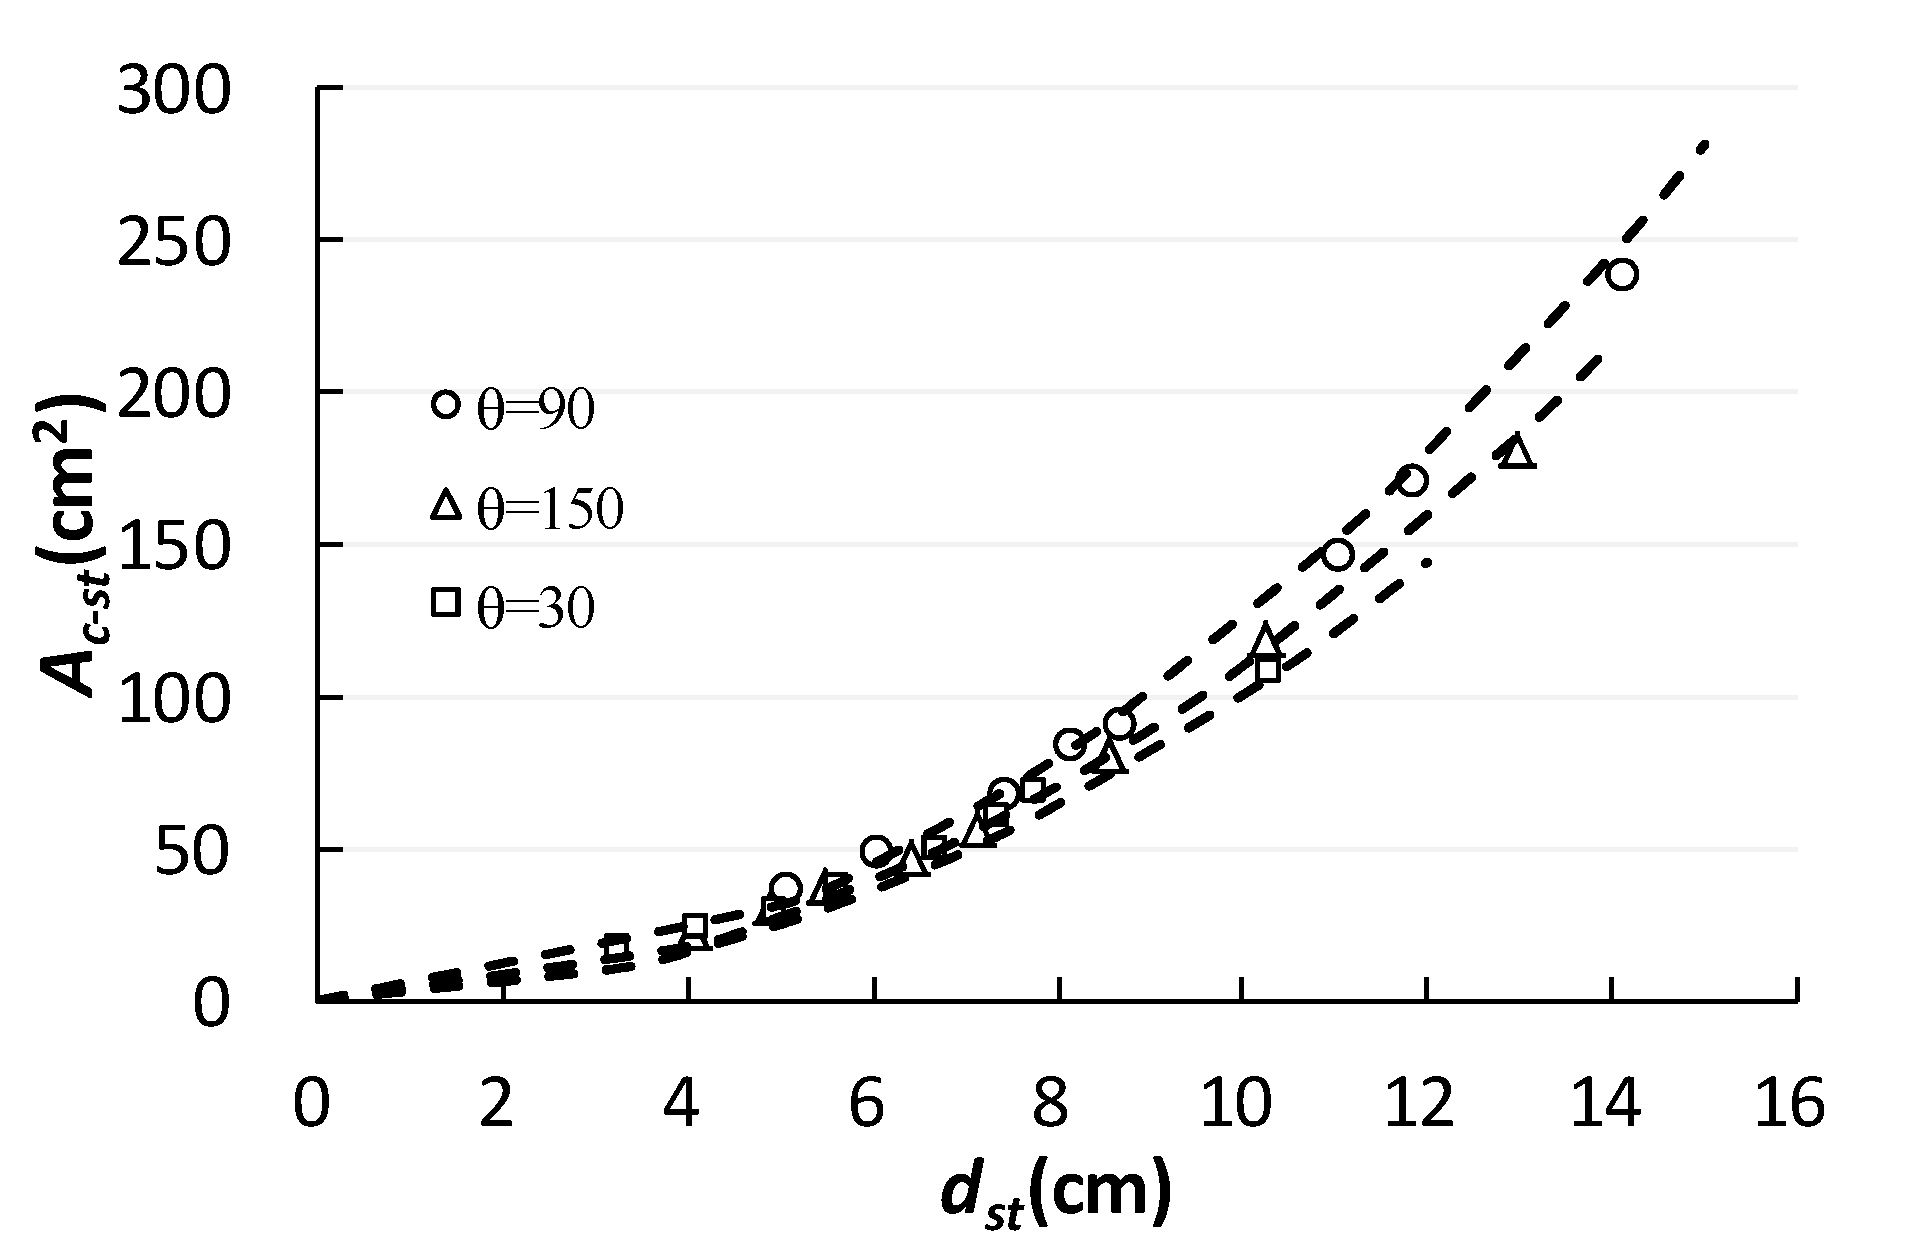
According to the profile morphology of scour hole in each evolution stage, the profile area of scour hole at each evolution stage is calculated (see
Table 2), and the relation between scour depth and the profile area of the scour hole is drawn, as shown in
Figure 7.
The regression analysis shows that the relation between scour depth
dst and the profile area of scour hole
Ac-st approximately conforms to the power function of index 2. Throughout the evolution process, the ratio of
Ac-st/
dst2 decreases, but both are greater than or equal to 1; when the scour reached a balance state, the dimensionless parameters
Ac-st/
dst2 were 1.07, 1.21 and 1.01 respectively for
θ = 150°,
θ = 90°,
θ = 30°, as shown in
Table 2.
3.6. The Local Bed Shear Stress Evolution
With time evolution, the scour range increases, the size of horseshoe vortex increases, the intensity of vortex decreases, and the local bed shear stress decreases gradually. Kothyari [
14] first proposed the local bed shear stress evolution model, as shown in the following formula:
where,
A0 is the initial area of the main vortex at
t = 0,
A0 = (π/4)(0.28
h(
L’/
h)
0.85)
2;
Ac-st is the area of the main vortex at
T, That is the area of a particular profile at upstream of the scour hole;
Ac-st = λ
dst2cosϕ, in which, ϕ is the sediment angle of repose; λ is constant. It can be seen from the ratio of the dimensionless parameter
Ac-st/
dst2 in the upper section that the process of evolution is λ ≥ 1. However, results of previous studies were all adopted for λ < 1 [
15]. Even consider the difference of sediment particle size, namely assuming ϕ = 30–44° [
6], cosϕ < 1 also exists. Obviously, the λ value should be several times larger. There are reasons to think that λ < 1 is also necessary to discuss.
d50 = 0.7 mm, the critical friction velocity
u*cr = 0.019 m/s was calculated, and the upstream flow shear stress was further calculated: τ
0 = 0.364 N/m
2, please refer to the literature [
26] for detailed process.
Barbhuiya et al. [
22] reported the evolution of local scour from
t = 0 to
T, and the characteristics of local bed shear stress evolution, namely:
in which, β is the constant, τ
c is the critical bed shear stress, calculated according to the shields parameter, τ
c = 0.34 N/m
2. In fact, the local erosion evolution process β is not constant, but it is still unclear.
According to Equation (5), in the whole evolution process, β =
f(
Ac-st→
Ac-se). The results of this study established and corrected the functional relationship between
dst2 and
Ac-st. Therefore, further modification of Equation (6) can be used to obtain the relationship describing the evolution characteristics of local bed shear stress:
According to Equation (7), the relationship between
τb/τ
c and
dst/
dse was established, and then the characteristics of local bed shear stress evolution at each stage of scour evolution were discussed (see
Figure 8).
In
Figure 8, clearly shows the adjustment process of the ratio of
τb/τ
c. With the evolution of scour depth, the overall trend of
τb/τ
c is decreasing, which approximately conforms to the exponential function.
Referring to three typical stages of local scour evolution [
27,
28]: The initial stage of the local scour, the ratio of
τb/τ
c is 4.5 from the upper limit, close to the results discussed in the literature [
14], and rapidly decline to 1.0, which indicates that the local bed shear stress decreases rapidly. Dodaro et al. [
29] also demonstrates a rapid decrease of bed shear stress with temporal evolution of the scour hole during the initial phase of scour development. When the local scour develops to the equilibrium stage, the ratio of
τb/τ
c is close to 1.0. At the equilibrium state of the scour hole, the ratio of
τb/τ
c is close to 0.3–0.6. The results show that the rate of shear stress decrease is slow. The value is consistent with the discussion results in the literature [
21,
22].
4. Discussion
4.1. Scour Hole Morphological Evolution Rate
Under clean-water scour conditions, it is a clear problem to discuss the morphology of the scour hole from a spatial dimension or a time dimension. Due to the improvement of means of measurement, 3-D structure, 2-D profile morphological evolution and visualization of scour hole have become a reality. Over time, scour depth, the plane area and volume of the scour hole all presented a power function increase (see
Table 1), which was confirmed by previous research results [
8,
10].
It is not difficult to find that when the evolution duration is the same, the percentage of
θ ≠ 90 for this alignment is slightly larger than that of
θ = 90° in completing the total scour charge (see
Figure 6); or the time needed for the former to reach the flush equilibrium state is less than the latter. In short, the morphology evolution of the scour hole is relatively slower for
θ = 90°, when
θ ≠ 90°, the morphology evolution of the scour hole is relatively faster.
Further discussion shows that when
θ = 90°, the entire process of evolution, longitudinal and vertical dimension erosion rate of the scour hole is consistent (see
Figure 4), namely the formation process of morphology obviously presents three-dimensional characteristics. It is easy to understand that the morphology evolution of the state of equilibrium is also relatively slower. When
θ ≠ 90°, the longitudinal dimension erosion rate of the scour hole is greater than that of the vertical dimension erosion rate; in other words, scour is mainly based on longitudinal dimension erosion, so the morphology evolution of the scour hole is relatively faster.
4.2. The Morphology and the Local Bed Shear Stress of Scour Hole
Under the clean-water scour condition, over time the scour range increases (the geometric size of the scour hole increases gradually over time.), the size of the horseshoe vortex increases, the intensity of the eddy decreases, and the shear stress of the local riverbed decreases and reaches the scouring equilibrium at
τb < τ
c [
19,
30]. The ratio adjustment law of
τb/τ
c indicated that in the whole process of evolution, there was a significant difference in the rate of local bed shear stress decline, which showed that the rate of decline at the initial stage of scouring was fast, then the rate of decline was slow, which was clearly shown in
Figure 8. Selamoğlu et al. [
31] also reported the decreasing trend of shear stress evolution of riverbed in the scour hole, believing that a rapid decrease in the initial stage of the scour was followed by largely maintaining constant. Bouratsis et al. [
11] also observed a similar phenomenon and pointed out that during the initial stage of the scour, the reduction of horseshoe vortex strength resulted in the reduction of local bed shear stress; In the development stage, the shear stress of the riverbed is still larger and lasts for a long time.
According to the evolution characteristics of scour hole morphology and the evolution trend of local bed shear stress, it is concluded that:
at τb > τc stage: It is shown that the local shear stress is very large at the initial stage of local scour, which leads to rapid evolution of scour hole morphology. At the same time, the local shear stress decreases rapidly as the scour range expands rapidly.
at τb = τc stage: It indicates that at the development stage of scouring, with the increase of scouring hole morphology, the local bed shear stress gradually approximates to the critical bed shear stress, thus causing the development rate of scour hole morphology to slow down and the local bed shear stress decrease to slow down.
at τb < τc stage: The local shear stress is far less than the critical bed shear stress, which causes the local scour to slowly evolve into the scour equilibrium state. The evolution rate of scour hole morphology and the decrease rate of local bed shear stress are close to constant.
To sum up, during the whole process of scour evolution, the riverbed shear stress of scour hole decreases at two different rates. When the local scour depth reaches about 30% of the total scour depth, the riverbed shear stress of scour hole decreases quickly. To the scour equilibrium state, it slowly decreases and tends to constant. At each stage of scour evolution, local riverbed shear stress presents three typical characteristics respectively: τb > τc, τb = τc and τb < τc.
5. Conclusions
Based on the flume experiment, this paper discusses the influence of spur dike alignment on the evolution characteristics of the scour hole around it.
Under the clean-water scour condition, the scour depth, the plane area and volume of scour hole, and evolution duration all present power function increases, and the scour hole profile area also accords with this function relation. Similar to scour depth evolution law, the plane area and volume of the scour hole also presents a power function over time. This characteristic has nothing to do with the alignment of the spur dike. However, the longitudinal dimension and vertical dimension erosion rate of the scour hole is affected significantly.
During the whole process of scour evolution and the development stage of the local scour, the local river bed shear stress of the scour hole decreases quickly. To the scour equilibrium state, it slowly decreases and tends to constant. Local scour evolution has three typical stages, and the local bed shear stress presents three characteristics respectively: τb > τc, τb = τc and τb < τc.
During the whole evolution process, the scour hole-volume has a proportional constant with the product of the plane area and the maximum scour depth, the profile morphology of scouring hole on the upstream and downstream of spur dike remains approximately constant. With the change of the alignment angle, the scour range of the upstream and downstream of the spur dike is distinct and close to the state of scour balance. The length of the geometric characteristic is close to the golden section feature.


