Review

Current Challenges in Orographic Flow Dynamics: Turbulent Exchange Due to Low-Level Gravity-Wave Processes

1
Met Office, Exeter EX1 3PB, UK
2
School of Earth and Environment, University of Leeds, Leeds LS2 9JT, UK
3
School of Environmental Sciences, University of East Anglia, Norwich NR4 7TJ, UK
4
National Center for Atmospheric Research, Earth Observing Laboratory, Boulder, CO 80307-3000, USA
*
Author to whom correspondence should be addressed.
Atmosphere 2018, 9(9), 361; https://doi.org/10.3390/atmos9090361
Submission received: 30 April 2018 / Revised: 30 July 2018 / Accepted: 13 September 2018 / Published: 18 September 2018
(This article belongs to the Special Issue Atmospheric Processes over Complex Terrain)

Abstract

:
This paper examines current understanding of the influence of orographic flow dynamics on the turbulent transport of momentum and scalar quantities above complex terrain. It highlights three key low-level orographic flow phenomena governed by gravity-wave dynamics: Foehn flow, atmospheric rotors and gravity-wave modulation of the stable boundary layer. Recent observations and numerical simulations are used to illustrate how these flows can cause significant departures from the turbulent fluxes, which occur over flat terrain. Orographically forced fluxes of heat, moisture and chemical constituents are currently unaccounted for in numerical models. Moreover, whilst turbulent orographic drag parameterisation schemes are available (in some models), these do not represent the large gravity-wave scales associated with foehn dynamics; nor do they account for the spatio-temporal heterogeneity and non-local turbulence advection observed in wave-rotor dynamics or the gravity waves, which modulate turbulence in the boundary layer. The implications for numerical models, which do not resolve these flows, and for the parametrisation schemes, which should account for the unresolved fluxes, are discussed. An overarching need is identified for improved understanding of the heterogeneity in sub-grid-scale processes, such as turbulent fluxes, associated with orographic flows, and to develop new physically-based approaches for parameterizing these processes.

1. Introduction

The influence of hills and mountains (orography) on both the local and large-scale weather and climate is well known and orographic flows have been the subject of extensive research over the past few decades. Considerable progress has been made in terms of understanding how complex terrain influences the environment locally, in terms of precipitation, wind flow and near-surface temperature. The way in which orographic processes such as gravity waves and upstream flow blocking affect the atmospheric momentum budget has also received considerable attention, in part because of the need to parametrise orographic drag in Global Circulation Models (GCMs) to alleviate westerly flow biases in the jet streams [1].
The influence of orographic flows on the turbulent fluxes of momentum, heat, moisture and other constituents is, however, much less studied and consequently poorly understood. There is a wide range of dynamical processes, many of which are related to orographically generated internal gravity waves, which can significantly modulate the exchange of momentum and scalar quantities between the atmospheric boundary layer and the land or sea surface, and between the atmospheric boundary-layer and the free troposphere. These aspects are not well represented in models, if at all. This is particularly problematic for regional numerical weather prediction (NWP) in complex terrain, for air-quality modelling in mountainous regions, and for global Earth System Models, which require the representation of complex processes such as atmospheric chemistry and aerosols among others. The application of models to forecast impacts such as avalanches, wild fires, or volcanic ash dispersion [2], also requires an improved treatment of the way orographic flows affect turbulent transport. In the case where atmospheric models are used to drive impact models, or where forecasts of hazardous turbulent gusts are required, diagnostics are needed which account for the sub-grid variability associated with these orographic processes.
The importance of orographically-generated gravity waves in redistributing momentum and energy in the atmosphere has long been recognised. However there still remain many challenges in observing and quantifying the importance of gravity waves, in accurately modelling their effects in high-resolution models, and in parametrizing their effects in lower-resolution models. This is an active area of research with a number of significant field campaigns in recent years [3,4].
The horizontal and vertical wavelength of orographically-generated gravity waves is such that they are largely unresolved in GCMs and so their effects need to be parametrised. Orographic gravity-wave drag parametrisation schemes have been widely used since the 1980’s to account for the effects of gravity waves on the mean flow [5]. Gravity waves are also known to cause mixing, either explicitly through wave breaking, or indirectly by increasing vertical wind shear, which in turn leads to Kelvin-Helmholtz instability [6]. Again, this wave-induced mixing of temperature and other atmospheric constituents is unresolved in weather and climate models, but unlike wave drag it is generally not parametrised either.
Wave breaking is a major cause of clear air turbulence (CAT), which poses a hazard to aviation, and such waves are often orographic in source, with for example clear hot spots of CAT over Greenland. High resolution global NWP models are now able to resolve the large-scale wave field associated with orographic gravity waves over broad mountain ranges, such as Greenland. Although the small-scale turbulence is unresolved, the large-scale wave field can be used as the basis for diagnostics to produce useful forecasts of CAT [7].
Here we provide a brief overview of recent progress in understanding key orographic flows and how these appear to influence the turbulent transport of momentum and scalar quantities. The focus is on the following low-level processes related to orographic gravity waves: Foehn flows (Section 2); turbulent rotors associated with orographic gravity waves (Section 3); and the modulation of turbulent fluxes by orographic gravity waves in the stably stratified boundary layer (Section 4). Each of these orographic flow processes illustrate heterogeneity in turbulent transports and highlight this topic as requiring future research attention. Challenges and opportunities for advancing knowledge and improving models are discussed in Section 5.

2. Turbulent Exchange in Foehn Flows

Foehn flows were first described more than a century ago, when two mechanisms for their warming and drying were postulated [8]. The first mechanism is the sourcing of foehn air from higher, potentially warmer and drier, altitudes upwind of the mountain barrier, due to the blocking of low-level flow by the mountain (the isentropic drawdown mechanism; [9]). The second mechanism is the well-known latent heating and precipitation mechanism: During ascent on the windward slopes, the air cools leading to condensation and latent heat gain; precipitation removes the condensed water, rendering this heat gain irreversible and leading to warmer drier air descending the lee slopes. These two mechanisms have been widely discussed in the literature with a long-running debate on which is the more important [10,11,12]. However, two other foehn mechanisms also exist: (a) Turbulent sensible heating and drying of the foehn flow via mechanical mixing above rough, mountainous terrain [13,14,15]; and (b) radiative heating of the low-level leeside, due to the dry, cloud-free foehn conditions [14,16,17]. These two additional mechanisms have, until recently, been either neglected or dismissed as unimportant.
The causes of foehn warming were directly quantified for the first time by Reference [9], assigning heating contributions to these four mechanisms via a Lagrangian heat-budget model. This model uses air-parcel back trajectories and output from high-resolution numerical weather prediction (NWP) simulations to calculate the contributions. The study focused on an ideal ‘natural laboratory’ for foehn—the Antarctic Peninsula—and their simulations use the Met Office Unified Model (UM), a seamless weather and climate prediction system that was configured here with a horizontal grid spacing of 1.5 km.
The Antarctic Peninsula presents a long high barrier to the prevailing atmospheric flow, with little to disturb this flow upwind (usually to the west) and a flat homogeneous ice shelf downwind (the Larsen C Ice Shelf), allowing foehn features to be clearly distinguished [18]. Aircraft-based observations have been used to investigate foehn characteristics and dynamics using a case study approach, and to validate NWP simulations [18,19]. In the cases investigated, foehn signatures in the wind, temperature and humidity fields are seen to persist for hundreds of kilometres downwind of the mountains. Figure 1 illustrates one such case; the north-westerly passage of air across and downwind of the Peninsula conveyed in wind vectors and back trajectories, and strong leeside foehn warming evident in a cross-Peninsula temperature gradient of up to 7 K. Note that ‘foehn jets’ are apparent on the ice shelf; these are a result of gap flow acceleration through mountain passes on the Antarctic Peninsula’s crest [18,20].
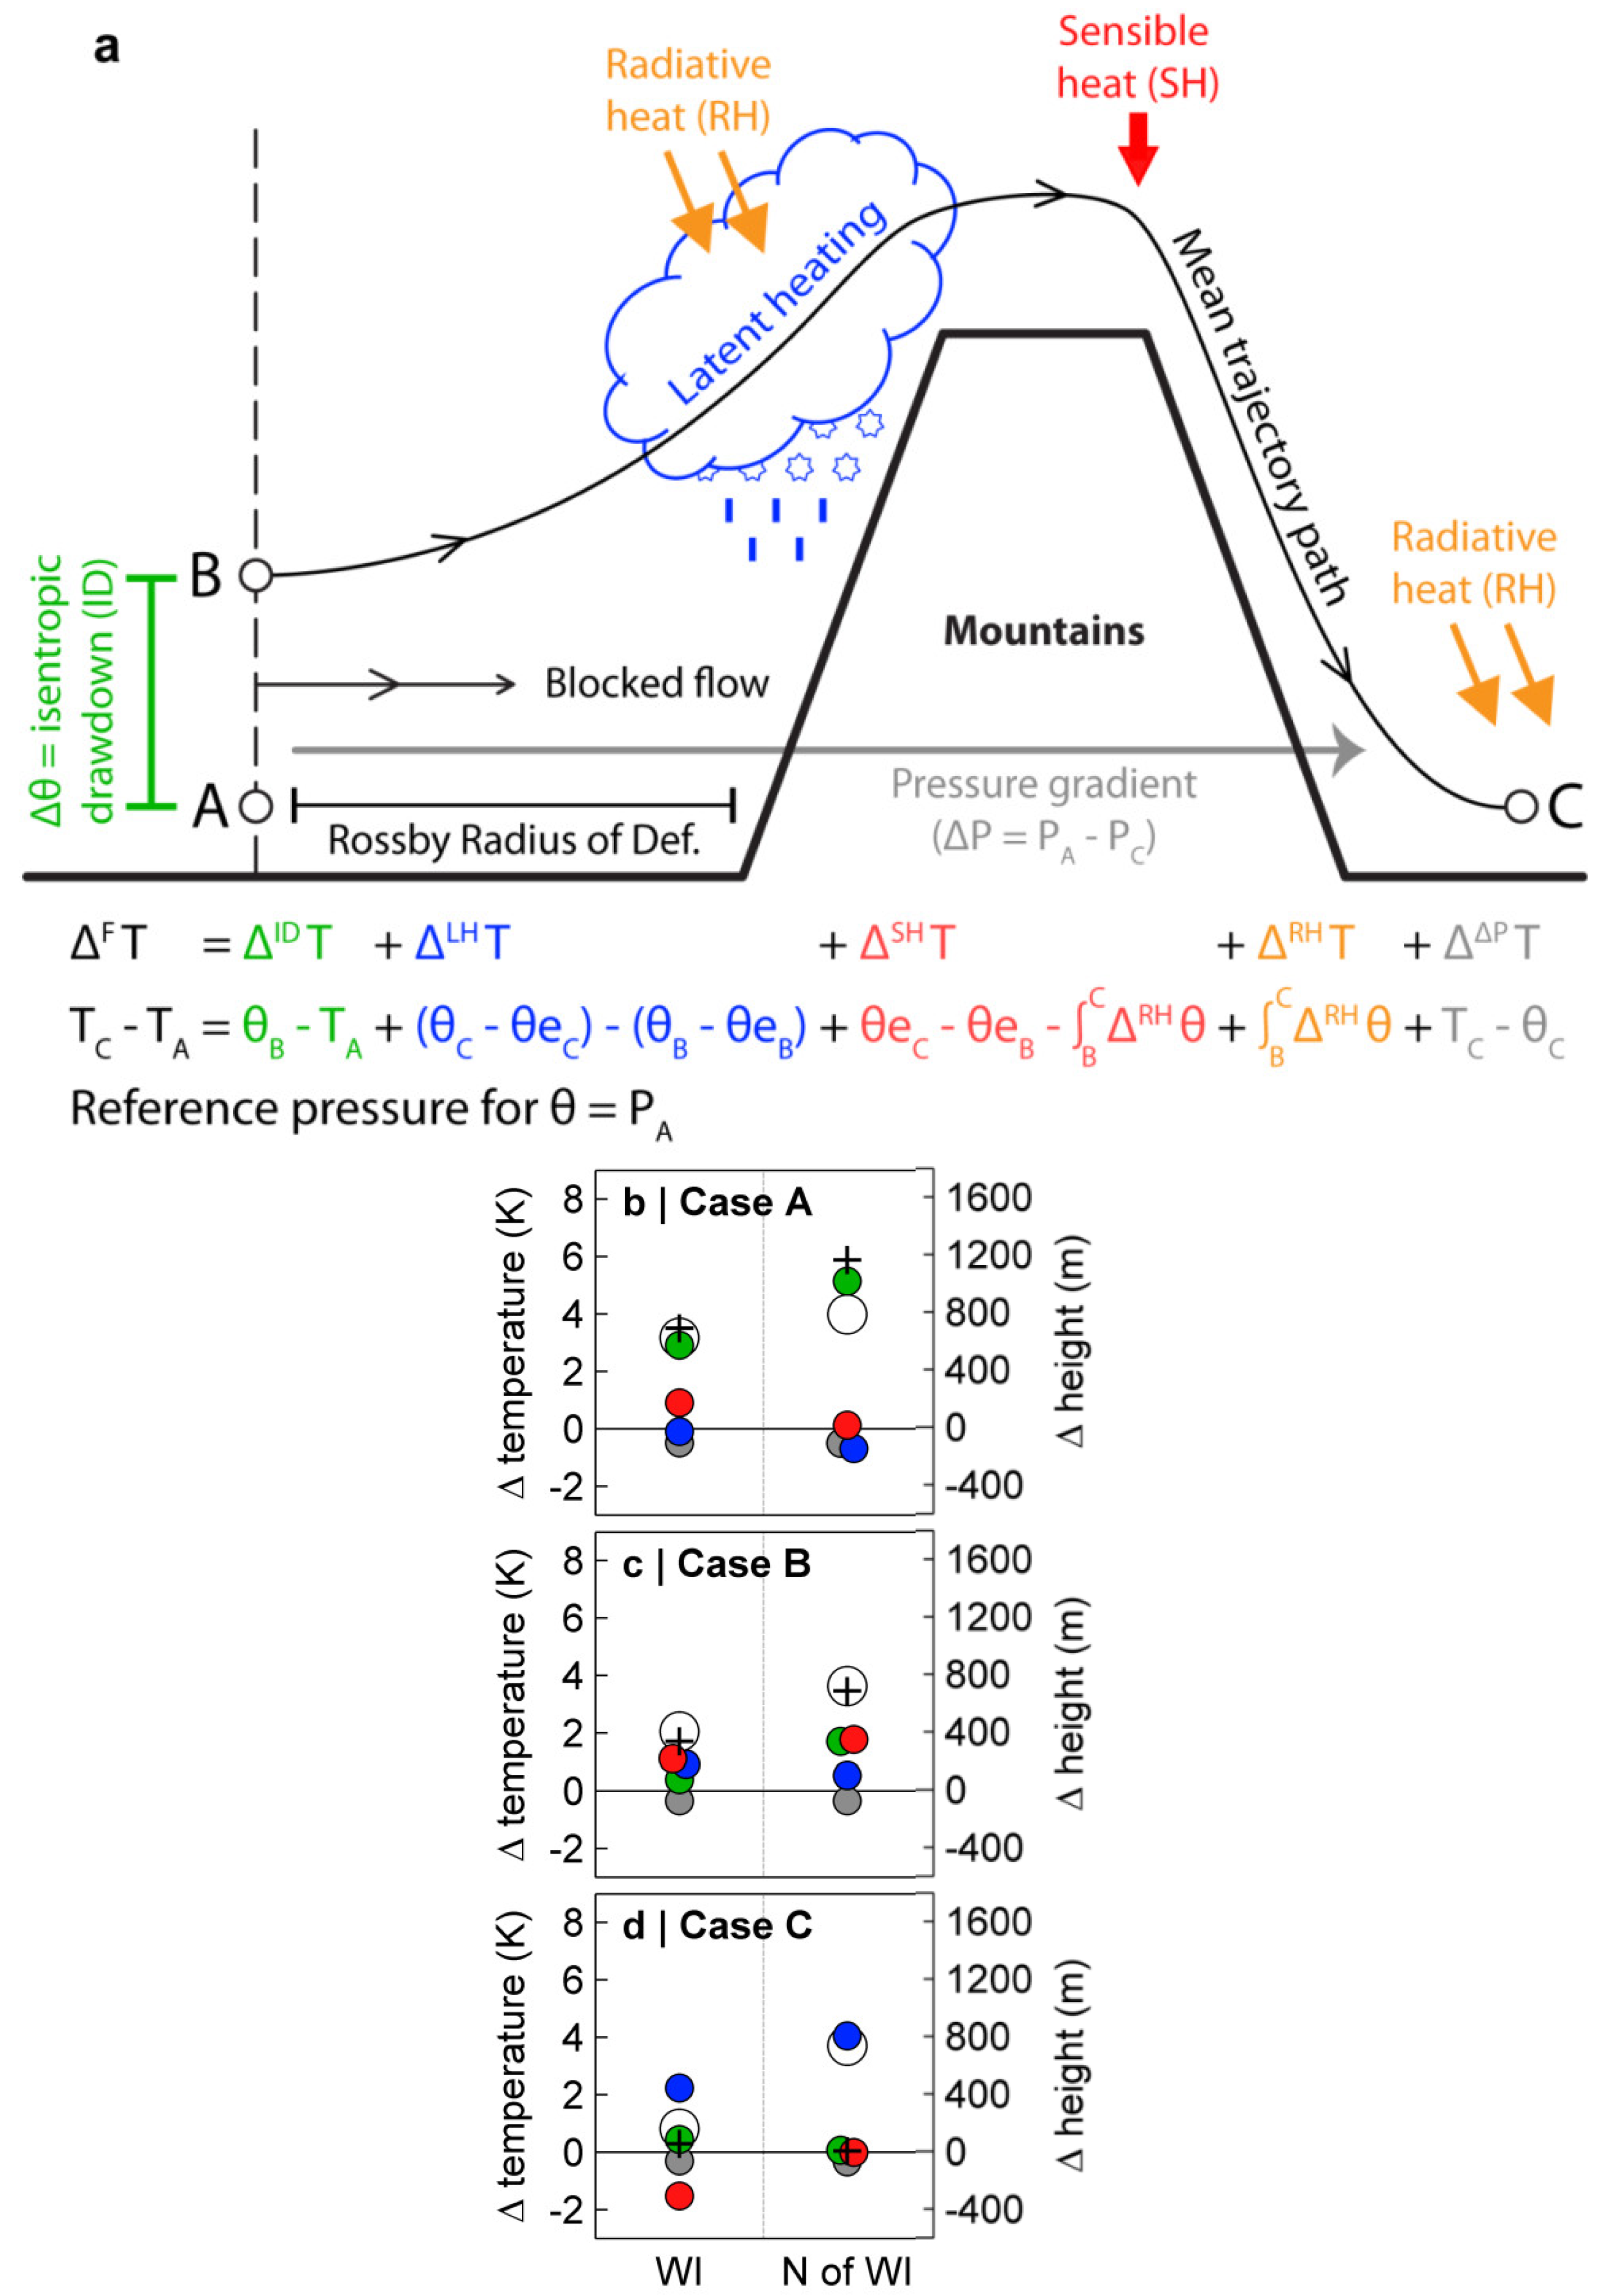
Figure 2 illustrates the key features of the novel Lagrangian heat-budget model of Reference [9]. The model quantifies foehn-warming contributions and attributes these to particular foehn mechanisms. It follows an air-parcel upwind from point C, near the surface in the immediate lee of the mountain range where the foehn flow has most impact, to point B via back trajectories that follow the flow backwards in time in Lagrangian space (e.g., Figure 1). The back trajectories are calculated using high-resolution NWP model winds that are output at very high frequency and fed into a trajectory model.
The foehn warming is the temperature change induced by the orographic disturbance, defined as ΔFT = TC − TA, where TC is the mean trajectory temperature at point C and TA is the mean temperature at point A. It is the sum of five contributions (as defined in Figure 2a), four of which can be equated to the foehn mechanisms described above (see Reference [9] for details). Foehn temperature anomalies and warming contributions from each mechanism are shown in Figure 2b–d for three case studies and for two exemplar regions: Whirlwind Inlet (WI) and North of WI (regions 1 and 2 on Figure 1b).
It is clear from Figure 2b–d that the isentropic drawdown, latent heating and mechanical mixing processes all make significant contributions to foehn warming. This finding overturns existing paradigms and instead finds a significant role for turbulence in causing warming during foehn flows. In fact, in case B sensible heating, due to mechanical mixing is dominant, providing the largest contribution in two of the five regions. This reflects the uplift of stably stratified air over the mountains in a turbulent, non-linear flow regime, with greater upwind ascent (i.e., less isentropic drawdown) than in case A and less upslope precipitation than in case C (Figure 2b). In general, the importance of each mechanism depends on both the orographically-forced flow dynamics and background meteorological conditions; and varies from case to case. A similar approach to that in Reference [9] was taken by the authors of Reference [21] who focused on several cases from the European Alps, using a similar Lagrangian air-parcel trajectory analysis approach, and also found a significant role for turbulent mixing during foehn flows.
A further important role of turbulent mixing is in determining whether foehn warming will reach the surface. In [22] it is shown that NWP forecasts with Polar WRF also over the Larsen C ice shelf frequently exhibited significant isentropic drawdown over the Antarctic Peninsula, however a surface signature of foehn was only observed for a fraction of these cases in automatic weather station measurements over the ice shelf. The supposition was that the very stable boundary layer over the ice shelf can inhibit the foehn penetrating down to the surface. Whether or not this occurs, and how widespread the inhibition is, will be highly dependent on the turbulent mixing induced by the foehn over and within the boundary layer. In other words, although we now believe turbulent mixing of heat is critical in foehn flows [9,21], its impact at the surface is dependent on how foehn flows and the atmospheric boundary layer interact. The propensity of scalar mixing in stable boundary layers is discussed in Section 4.
Although the theoretical picture of foehn events presented in most sources is two-dimensional, the simulations by both [8,23] demonstrate large spatial variations in the intensity and propagation of foehn winds: Strong jets from gap flows propagate much further across the ice shelf than the weaker flows behind peaks, which also leads to horizontal shear-generated mixing across the edges of these jets. These terrain-generated jets and wakes and the attendant low-level potential vorticity signatures (‘PV banners’) have been investigated previously in the lee of the Dinaric Alps with aircraft-based observations and high-resolution numerical simulations [24,25]. While the strong and long-extending ‘bora jets’ in the lee-side boundary-layer flow result from flow acceleration through terrain gaps, the wakes were found to be induced by dissipation associated with the low-level wave breaking, which locally tends to accelerate the boundary layer flow beneath the breaking regions. The turbulence characteristics of the bora flow in the cross-wind direction were found to be greatly influenced by the mesoscale flow structure, with interchange of jets and wakes, and to be principally generated by the local vertical wind shear along those horizontal shear lines [26].
The consequences of the above are a clear need for turbulent processes to be adequately represented (i.e., simulated or parametrised) in the modelling of foehn flows and the gravity wave motions which govern them. At present, only the turbulent momentum fluxes are (in some models) parametrised over sub-grid orography, in order to represent the turbulent orographic form drag. Typically, this is accomplished via an enhanced roughness length [27] or explicit turbulent orographic stresses [28], but both approaches are designed to represent the drag, due to hills with short horizontal length scales, smaller than the gravity-wave length scales associated with foehn dynamics. Although some attempt has been made to understand how the influence of such small-scale hills interacts with that of broader mountain ranges [29], this is only in the context of the orographic drag contribution to the large-scale momentum budget. Existing parametrisations do not account for the larger-scale foehn flow or represent the turbulent mixing of heat, moisture and constituents. The impacts of this omission are likely to be profound, for example with implications for weather forecasts in and downwind of mountainous regions; for hazard mitigation with respect to wild fires [30], clear air turbulence for aviation [12] and volcanic ash dispersion [2]; for modelling chemical transport and air quality [31]; and for long term predictions of ice sheet mass balance and stability [32].

3. Turbulent Exchange Associated with Atmospheric Rotors

Trapped lee waves occur when propagating gravity waves in stable flow over terrain are ducted and confined to a layer of the atmosphere (typically in the troposphere), thus leading to oscillations that extend downwind of the terrain. Trapped lee waves and their prediction have been extensively studied [33,34,35,36,37,38]. Atmospheric rotors are closely related to lee waves through wave-induced boundary-layer separation. While less well studied than lee waves, several rotor-focused observational studies have been undertaken recently [39,40,41,42], complementing the historic documentation of rotors of the previous century [43,44,45,46]. Conceptually, rotors represent an overturning recirculation beneath the crest of lee waves that have sufficiently large amplitudes to induce boundary-layer separation and cause flow reversal at the surface downwind of the separation point. Rotors may also accompany low-level wave breaking [47,48]. Various theoretical and numerical studies have examined the physical mechanisms involved in rotor formation and its prediction [35,47,48,49,50,51], including studies of the fine-scale turbulent structures within the rotor recirculation that are responsible for the greatest turbulence [52]. The morphology of rotor flows can contain a high degree of three-dimensionality and complexity, and can be affected by downwind terrain [53,54,55,56,57,58].
The horizontal variability, due to lee waves, has implications for turbulent transport both above and within the boundary layer. For instance, at the ground level, horizontal variations in wind associated with lee waves and rotors will alter the horizontally-averaged net momentum fluxes, with implications for surface drag parametrisation.
While some efforts to understand the influence of large-amplitude lee waves on wave drag have been undertaken [59,60,61], research devoted to understanding the effects of overturning (within rotors) and the lofting of intense turbulence on vertical exchange, is lacking. In order to begin to structure understanding around this, the anatomy of different types of rotor flow, and the structural complexity present in real lee-wave rotor flows are discussed below. A more detailed review of lee wave rotor research, including challenges around predictability, is given in Reference [62].

3.1. “Type 1” Rotors

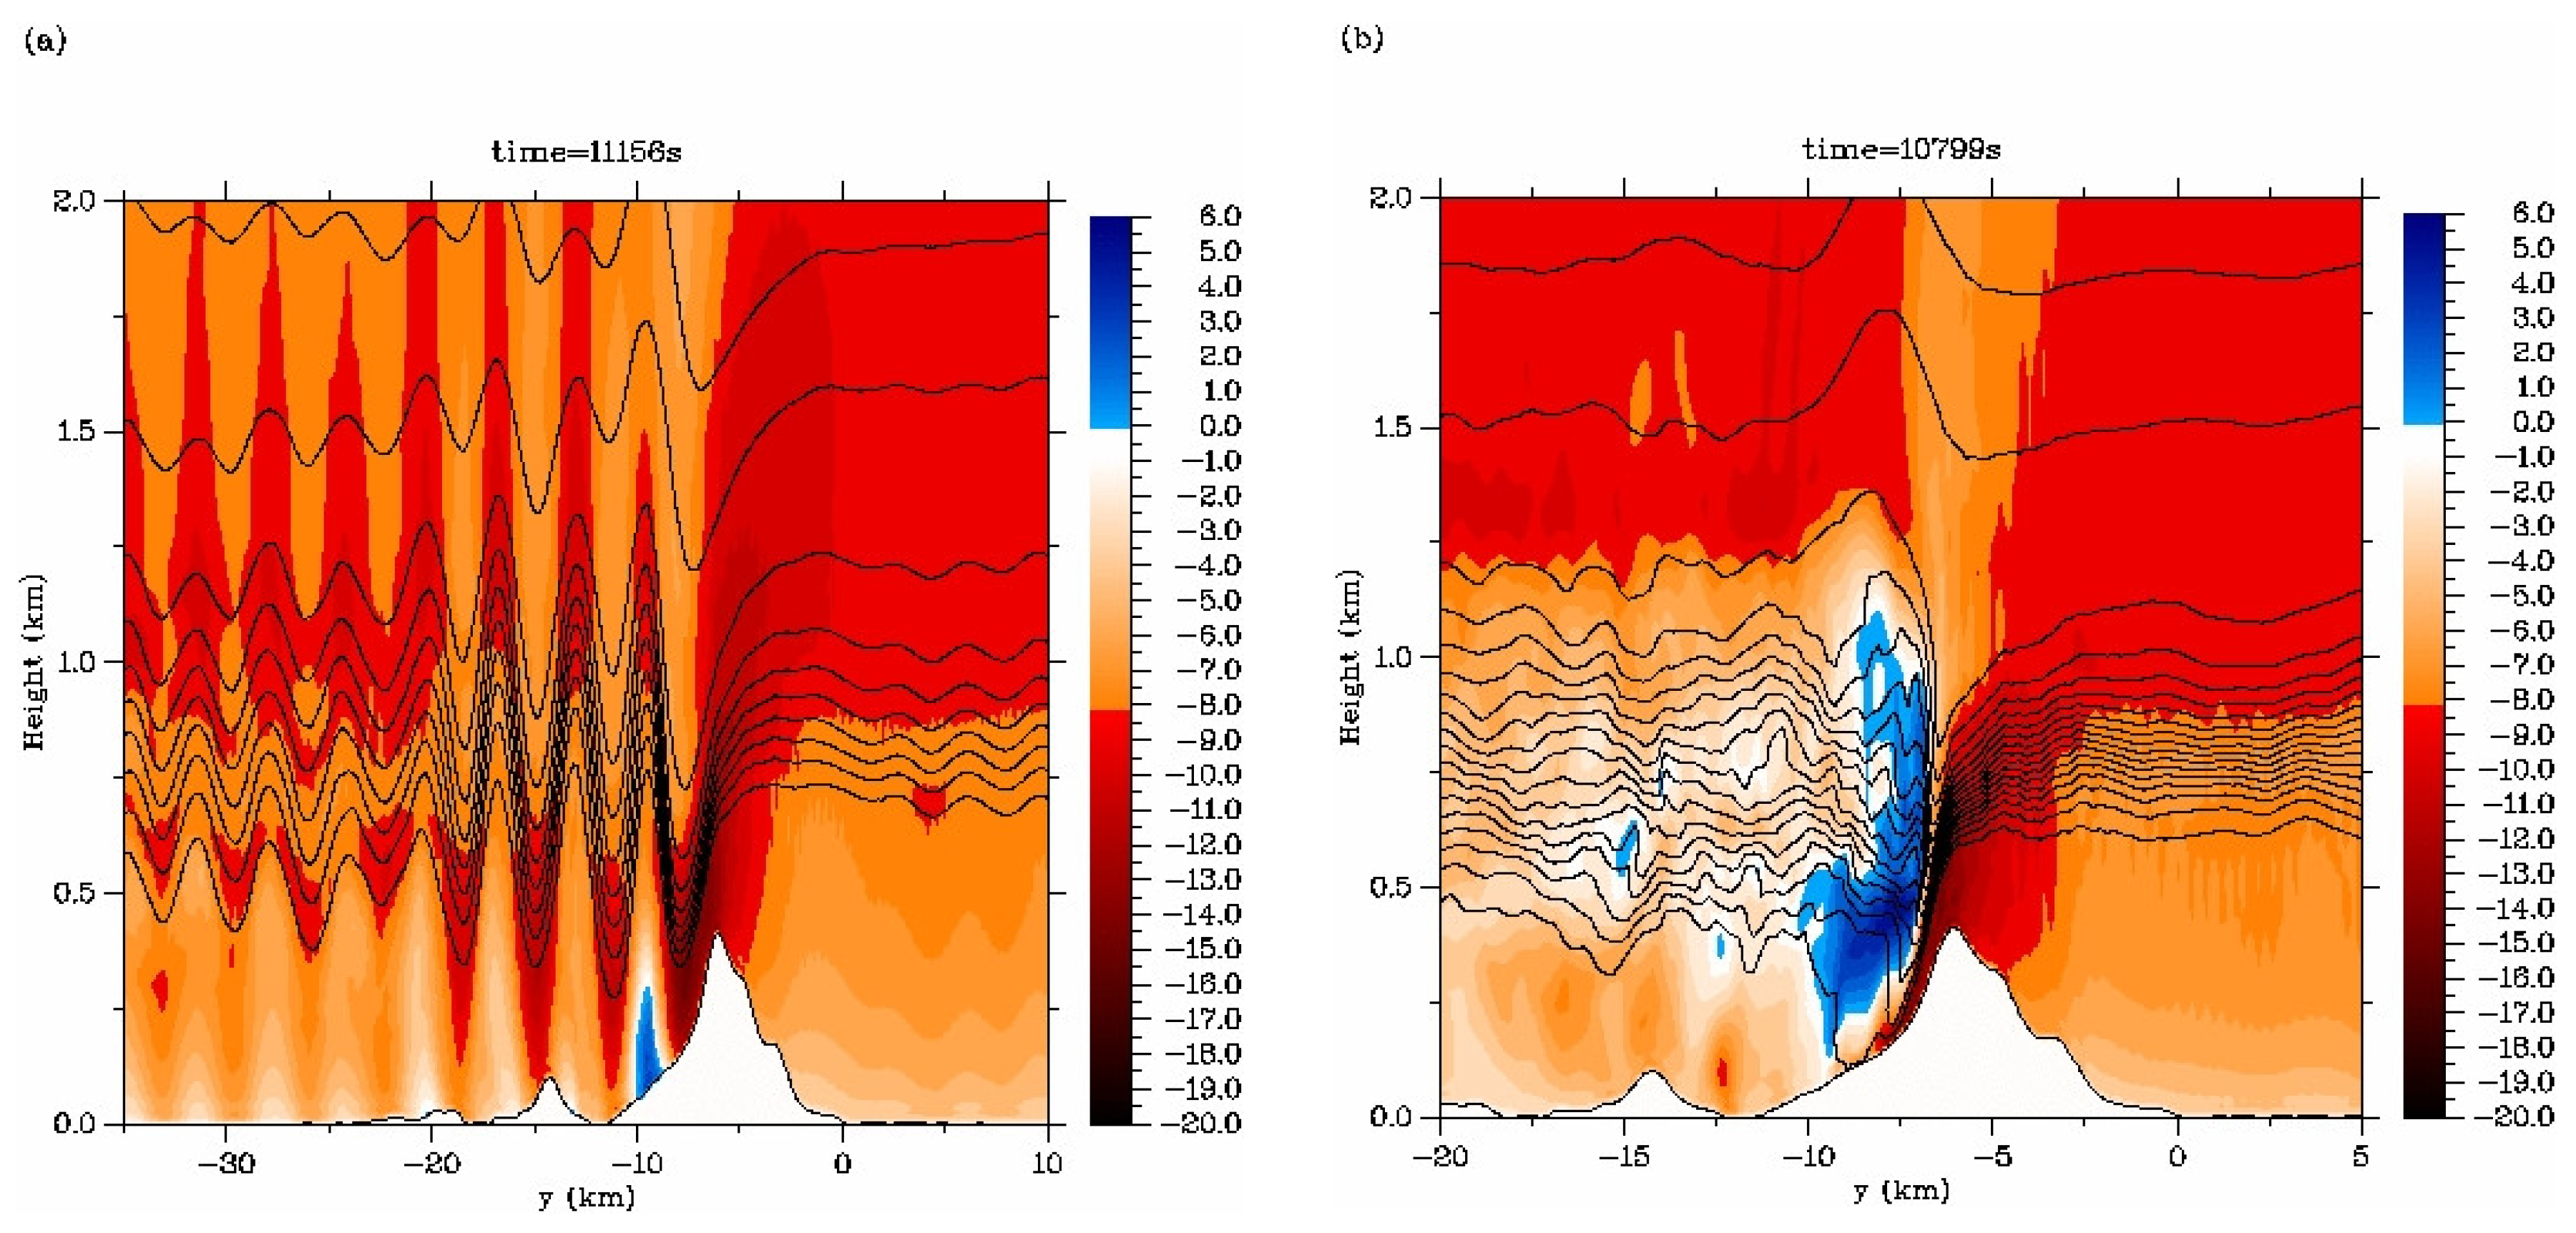
Rotors are frequently separated into two types, “Type 1”, beneath the crests of periodic, non-breaking lee waves, and the more severe “Type 2”, generally resembling a hydraulic jump [48]. Figure 3 shows vertical cross-sections of zonal velocity through two three-dimensional (3-D) idealised model simulations of northerly flow over the terrain of East Falkland, South Atlantic, reproduced from a previous study [53]. Figure 3a corresponds to a “Type 1” rotor flow pattern that occurs under a laminar lee wave pattern existing on a strong temperature inversion at the top of the boundary layer. The reversed flow at the surface and vertical motion aloft indicate overturning beneath the first wave crest.
An investigation of the behaviour in “Type 1” rotors at finer scales [52] depicted small “sub-rotor” vortices forming downwind of the flow separation point. The surface layer vorticity sheet is lofted upward into the rotor and becomes unstable and breaks down into small vortices that may intensify before passing around the top of the main rotor. This contributes to increased turbulence and gusty winds particularly just downwind of the flow separation point.
The implications of this rotor type for vertical exchange can be simplified by adopting a quasi-2-D picture of rotor flow dynamics, in which the Type 1 rotor flow can be separated into three zones:
  • Lee-wave trough (or downslope flow): Shallow, highly sheared boundary layer beneath a fast moving, (highly) stable laminar flow.
  • Flow separation region: Highly turbulent and unsteady with local overturning and strong vertical shear.
  • Lee-wave crest: Deeper boundary layer, light winds, but highly turbulent, topped by strong shear and stability.
In each zone, substantial differences in the vertical profiles of stability and shear imply an inhomogeneity in the vertical transport at fine scales, which may not be well represented in the fluxes parametrised in coarse resolution models, whose grid box vertical profile reflects no resolved lee wave motion.
Rotors furthermore involve non-local transport. The profile of turbulent fluxes in a column located at a rotor crest is not related simply to the mean profile of wind and temperature within that column, but is partly a result of turbulence generated in the shear under the upwind wave trough (or downslope flow). This is advected, intensifying, from the flow-separation point (or returning in the recirculation near the surface). Such departures from Monin-Obukhov similarity in rotors have been cited as the likely source of poor closure in a surface-layer energy budget on Niwot Ridge near Boulder, CO, USA [63]. In this situation, a column-based parametrisation of vertical exchange becomes inappropriate.
In high-resolution model simulations, the main rotor overturning may be resolved by the model, but the sub-rotor scale dynamics (and transport) parametrised or partly parametrised. Current parametrisations take no account of the above specifics of sub-rotor turbulence dynamics, which are unlikely to conform to standard scaling laws. This will lead to inaccuracies in fluxes around the rotor. As the sub-rotor scale becomes partly resolved, parametrisation of the remaining sub-grid turbulence may remain inaccurate.
Further research is needed to understand the extent of inaccuracies introduced by the structured, non-local nature of rotor turbulence. This could involve model resolution-dependence investigations to span the range from unresolved rotors to partially resolved sub-rotor spectra. Moreover, greater understanding of internal rotor turbulence from observations is needed to inform parametrisation development at a range of scales.

3.2. “Type 2” Rotors

The Type 2 rotor case resembles a hydraulic jump. In Figure 3b, this results from a stronger temperature inversion compared to Figure 3a [47]. This flow type may notionally be split into zones in a similar way to the Type 1 rotor case:
4.
Downslope flow: akin to a wave trough for Type 1, but more intense.
5.
Breaking region: Overturning aloft introduces convective instability, dramatically enhancing vertical transport and affecting a substantially deeper layer than Type 1 overturning; otherwise, at the surface, analogous to the flow separation region in the Type 1 case.
6.
Downwind region: Weak winds, but enhanced turbulence.
A transition from Type 1 to the more intense Type 2 would result in a step change in turbulent transport. This non-linearity represents a challenge for effective parametrisation. It has been shown how areas of overturning and instability (i.e., relating to point 5 in the above list) persist as they are transported downwind [48]. Additionally, lee wave fields evolve with changing conditions and, particularly in the Type 2 case, may be unsteady. Propagation of wave crests, either up- or downwind (Type 1) and migration of overturning regions (Type 2) extend the non-locality of rotor transport beyond the scale of the rotor itself. This adds another challenge for parametrisation, though some research does exist, which could be built upon [64].

3.3. Three-Dimensional Complexity

Real flows introduce cross-flow transport, flow collision (for instance of cross-ridge winds with along-valley flow [58]), wakes and vertically aligned vortices. This increases the scope for unsteadiness in the flow, and reveals the deficiency of a 2-D rotor framework.
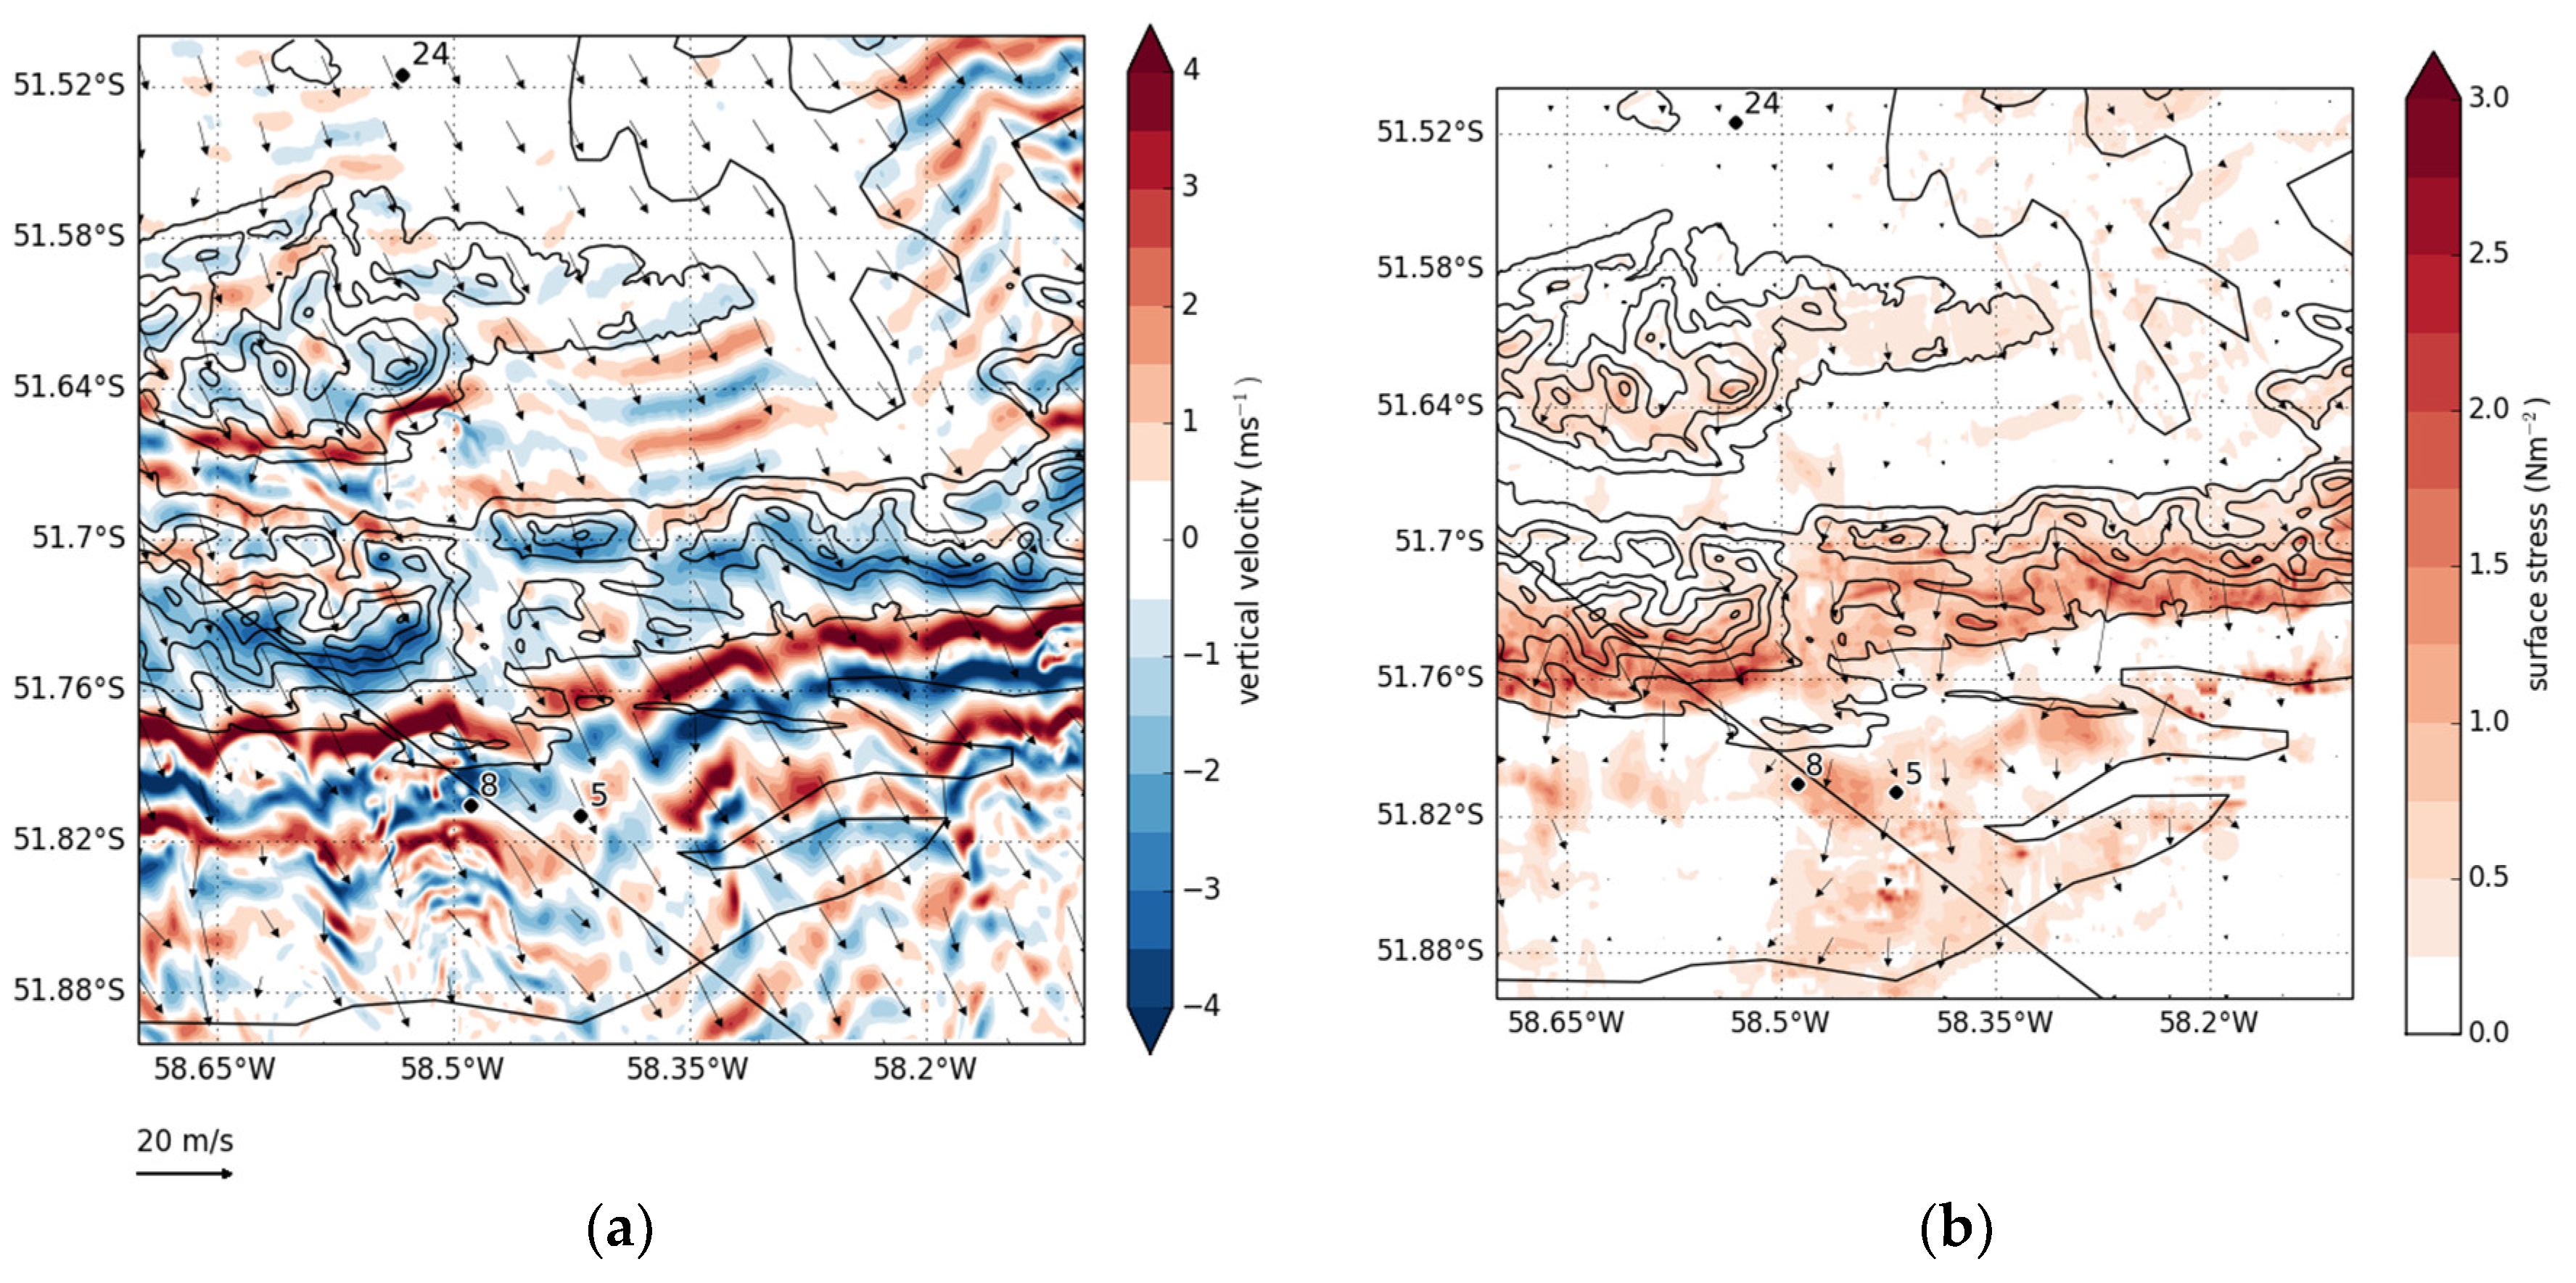
Figure 4a depicts vertical velocities at 500 m altitude in a nested UM simulation of a case (described in Reference [39]) of large amplitude lee waves observed over East Falkland on 9 February 2001. Figure 4b shows surface stress in the innermost nest (grid spacing 100 m). The images are zoomed over the measurement array described in Reference [39], and highlight the complexity of the flow in three dimensions, with a high degree of variability across-flow and the near absence of quasi-2-D structure. Nevertheless, the wave motion aloft is mirrored in the pattern of surface stress, which in turn reflects areas of acceleration and deceleration/reversal in the 10 m winds, as for the 2-D case.
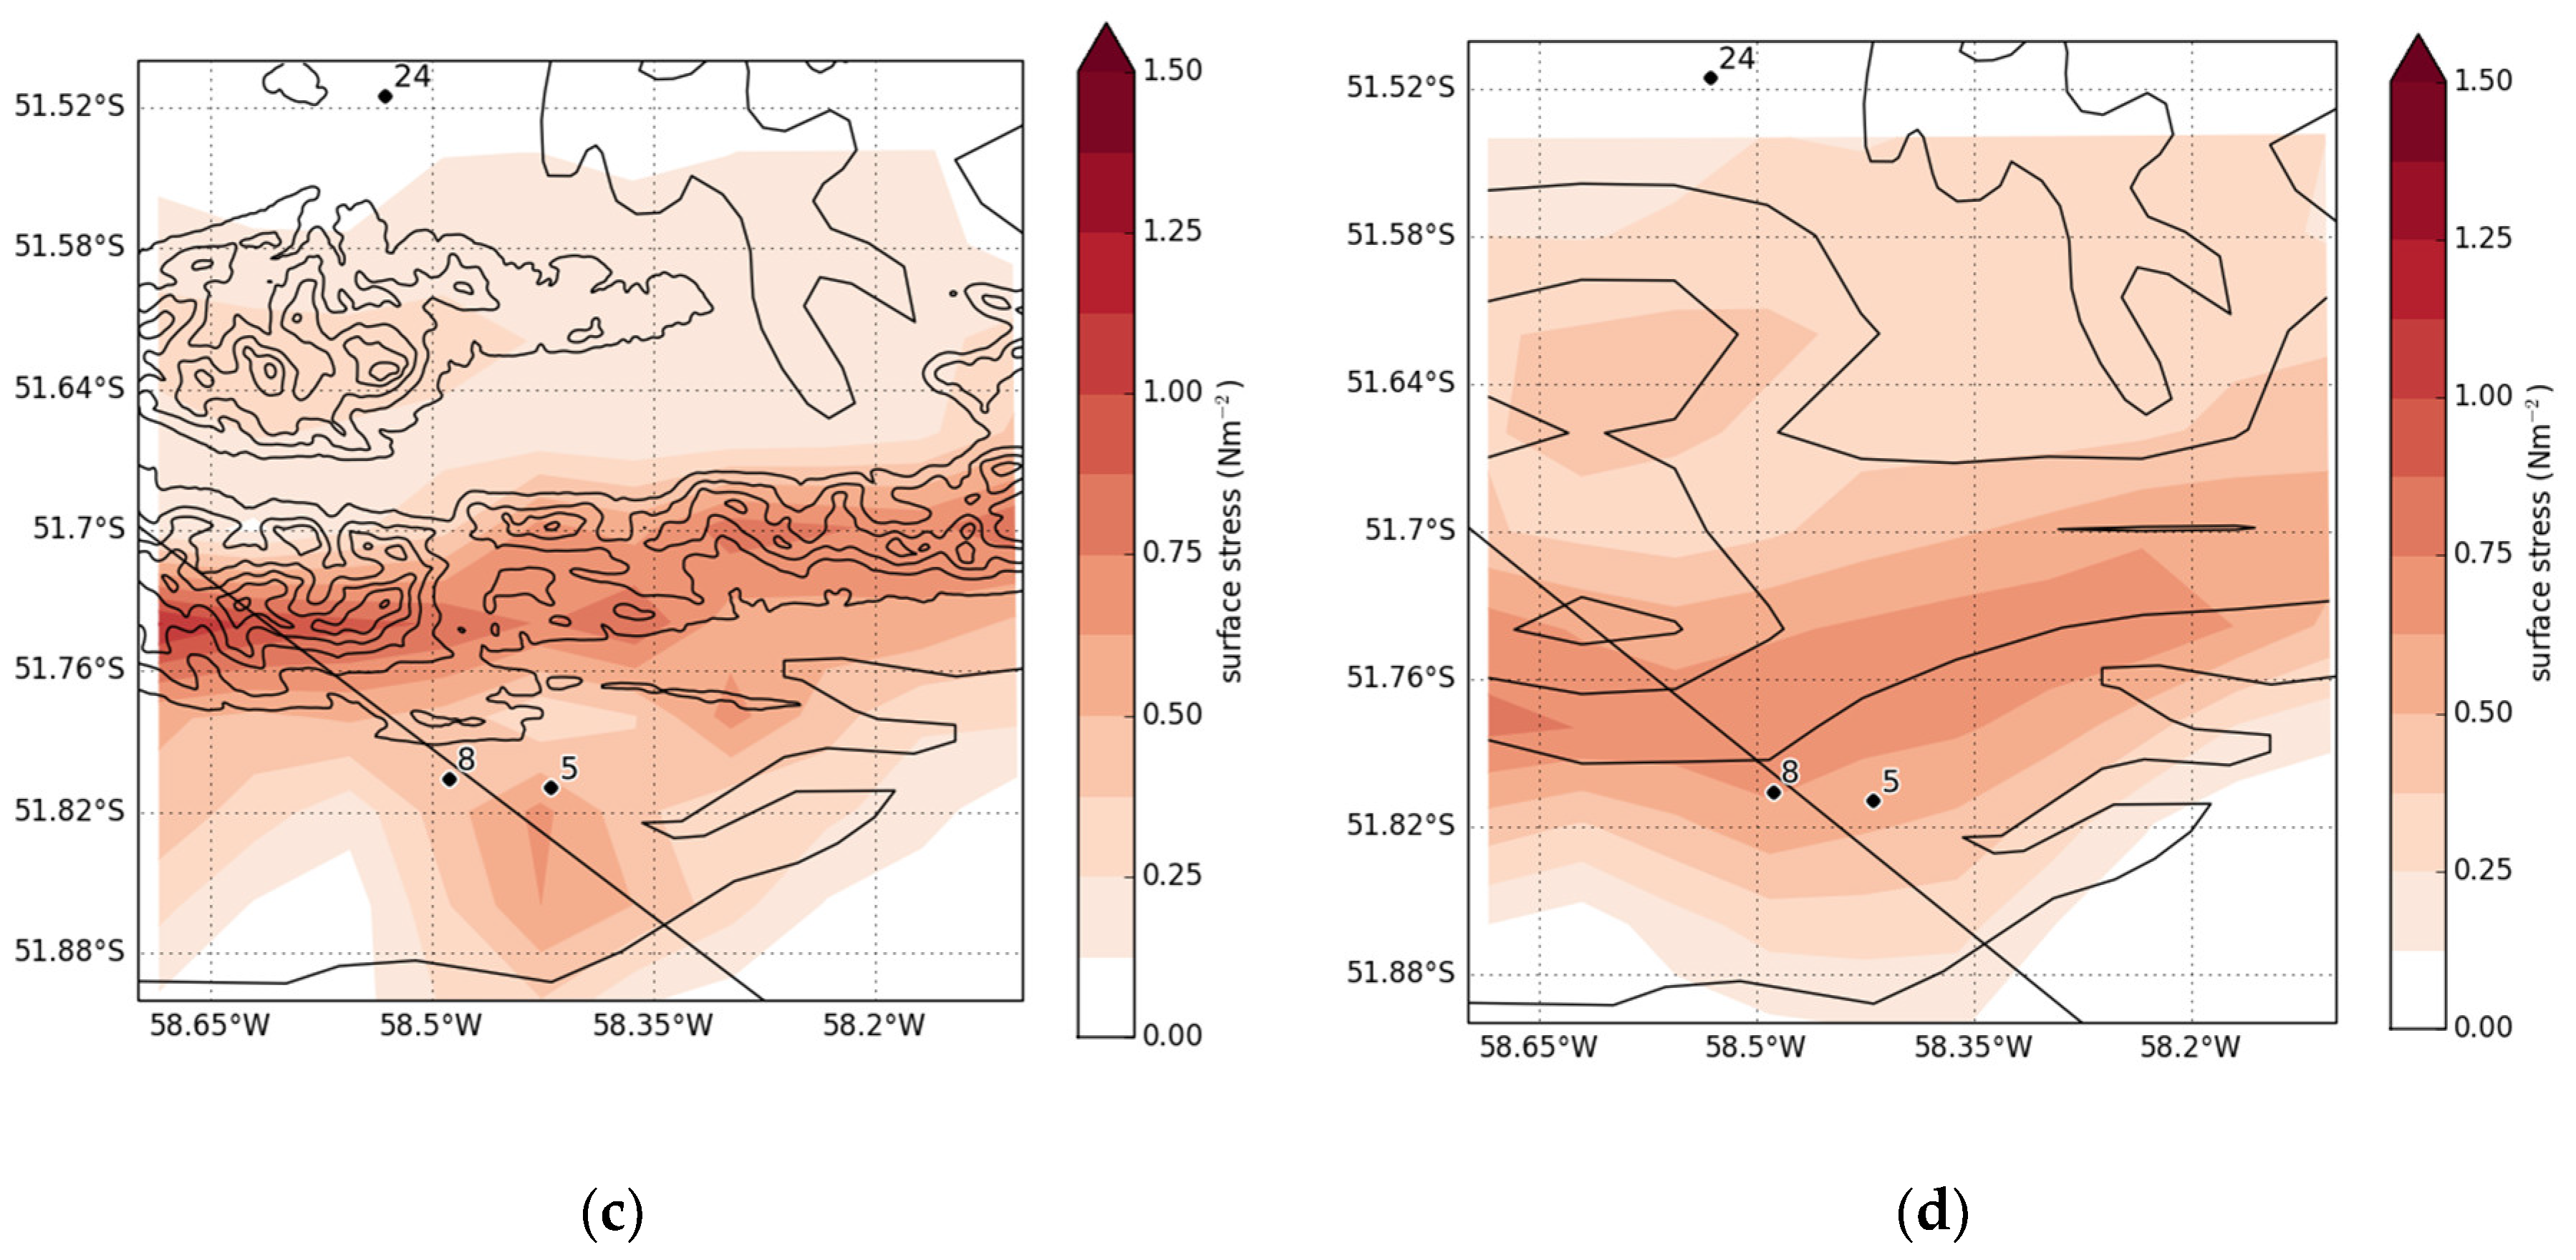
Figure 4d shows the surface stress in the 4.4 km resolution domain (more typical of modern regional NWP resolution), while Figure 4c shows the 100 m domain stress aggregated to the same grid. This illustrates the detail missing at 4.4 km resolution, both in terms of amplitude and complexity. The aggregated high resolution stress field is more intense than the 4.4 km resolution field and points to a shortfall in the parametrised stress in downslope windstorm/rotor cases. Effects on vertical exchange may be even more substantial away from the surface, due to the additional shear, turbulence and vertical motion induced by the resolved rotor flow. Exchange processes with non-linear dependence on sub-grid variability will display an even more pronounced shortfall.
A comparison of Figure 4d with Figure 4b highlights the difference in peak stress (or equivalently, u*) values. This is important for the parametrised diagnosis of gusts; a parametrisation designed as a “boost” to the mean wind in coarse models based on a Monin-Obukhov approach will egregiously overplay gusts at very high resolution where in any case gusts already begin to be resolved [65].
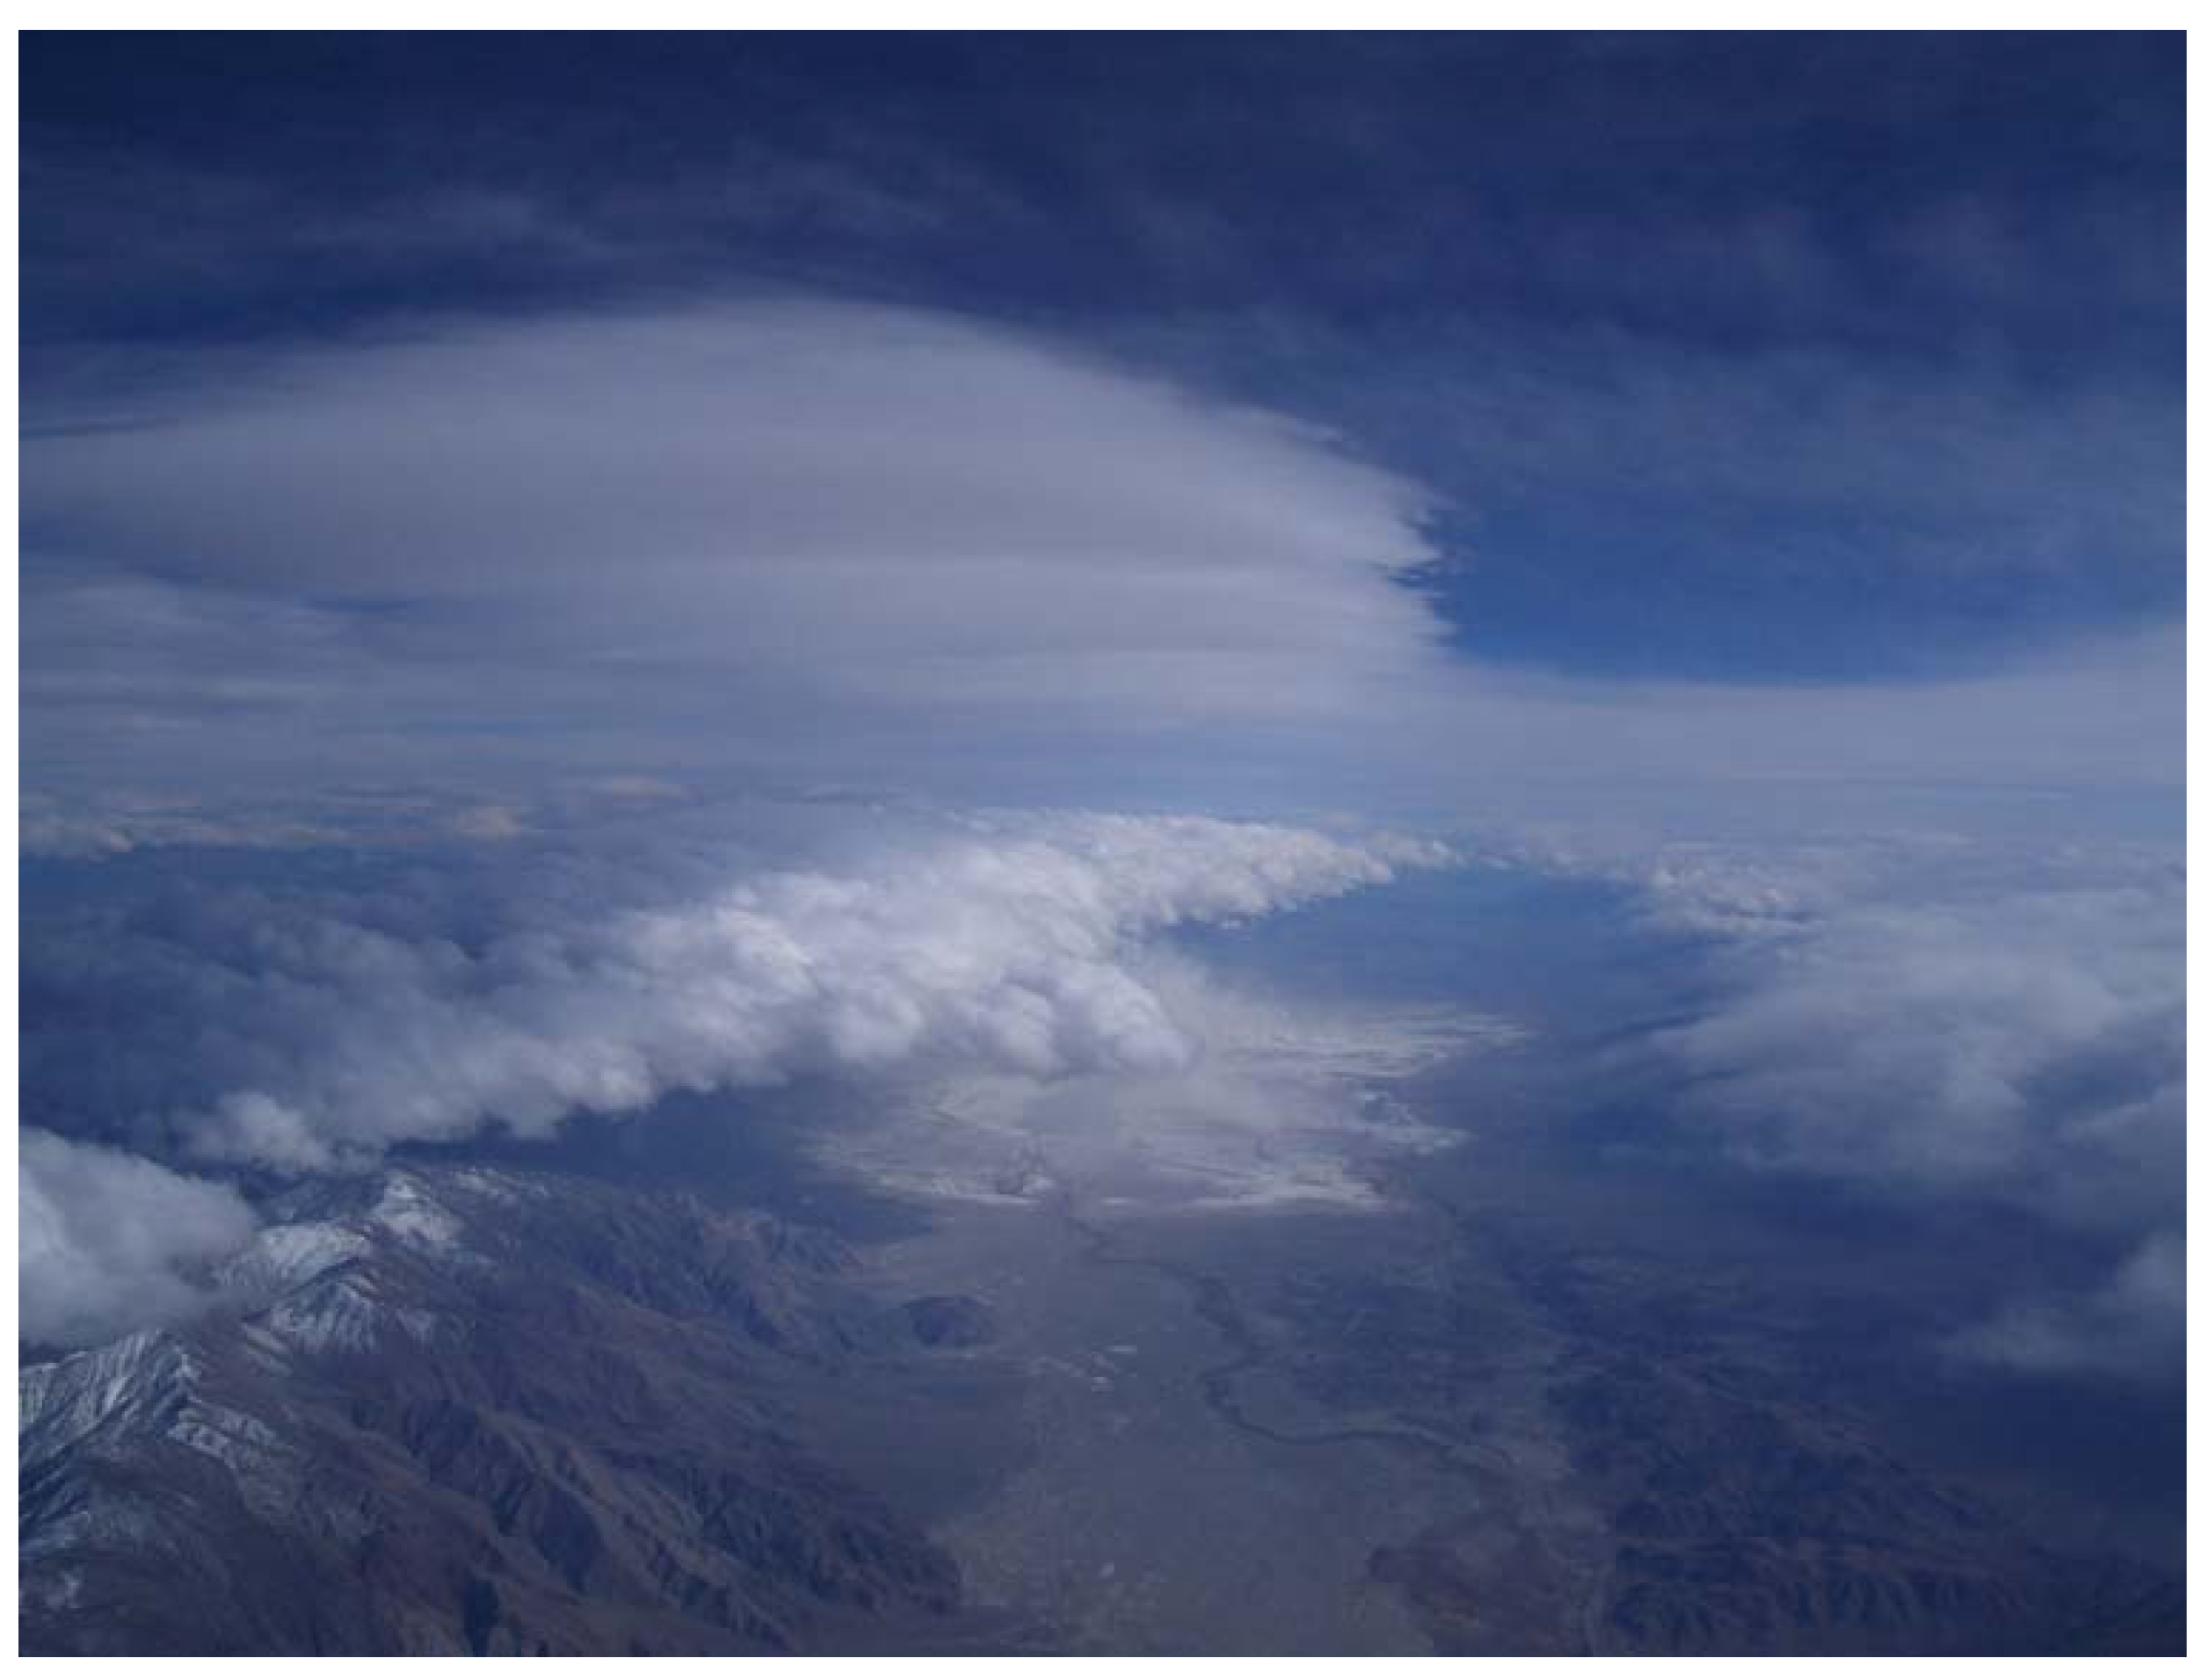
Rotors and associated downslope windstorms transport dust and chemical particulates away from the surface, with consequences for air quality. The photograph in Figure 5, taken during a rotor event in the T-REX campaign, shows a downslope wind-induced dust storm (see also Reference [66]). This is an example of a non-linear response to local winds, with winds/gusts above a threshold being required to loft dust.
Dynamically driven downslope wind and rotor systems can also be instrumental in venting valley pollution in the absence of the thermal forcing often associated with foehn [67,68]. On the other hand rotors can occur during foehn flows [11], potentially providing an additional source of turbulent mixing of heat and moisture and contributing to these budgets (c.f. Figure 2). Consequently, an inadequate simulation of rotors (or their affects) in such flows will lead to poor predictability of, for example, near-surface temperature and humidity. Rotors will also strongly affect transport of elevated chemical releases (similar to effects modelled in Reference [69]). These mechanisms are unresolved in Earth System Models, while their representation in Air Quality forecast models is resolution-dependent as for NWP models.

4. Modulation of Boundary-Layer Turbulence by Orographic Gravity Waves

Orographically generated gravity waves are often considered important, due to their role in transporting momentum vertically through the troposphere and into the middle atmosphere. Under the right conditions gravity waves can play an important role lower down in the boundary layer too. As an example, waves may be trapped within wave ducts, due to the stability profile in and above the boundary layer, in an analogous fashion to the trapped lee waves on a temperature inversion described in the previous section, which can lead to rotors and hydraulic jumps [37,47].
Gravity waves are also a common feature of stable boundary layers (SBLs) [70]. In the very stable boundary layer such wave motions are crucial. Strong stratification suppresses the turbulence seen ubiquitously in other atmospheric boundary layers, and instead sub-mesoscale motions, including waves, dominate and lead to intermittent patches of turbulence as these motions pass [71]. Various in-situ observational studies have identified wave-like motions associated with intermittent or enhanced turbulence [72,73,74]. Reference [74] showed the importance of these waves on modulating fluxes of heat and CO2 as well as momentum. This wave-turbulence interaction may be a result of direct wave breaking, but in the SBL it is often a result of waves changing the shear locally, and hence the Richardson number, leading to instability of the flow and turbulence [75]. Although wave activity can be relatively easily identified in observations, identifying the source of the waves can be much more challenging.
Not only do gravity waves directly interact with turbulence, but they can also modify other sub-mesoscale motions, which in turn cause turbulence. For example, Reference [75] identified gravity waves trapped within a stable boundary layer which led to oscillations in a shallow drainage flow, while Reference [76] identified gravity wave activity above a valley which modulated the cooling rate of the drainage flow within the valley. Reference [77] studied gravity waves formed on the top of a katabatic drainage flow. Although linear wave theory predicts no total vertical heat flux due to the waves, the authors of Reference [77] observed a heat flux divergence in their case study linked to the wave motions, likely due to the nonlinear nature of the waves. Katabatic flows can also generate internal gravity waves [78].
Gravity waves may impact the surface energy budget in other ways. Reference [79] presented a case study from the MATERHORN experiment where internal gravity waves with periods of ~20 min caused temperature fluctuations of up to 1 °C, which in turn led to periodic formation and dissipation of a shallow valley fog. Fog can significantly alter the local radiation budget, and hence the surface exchange of heat.
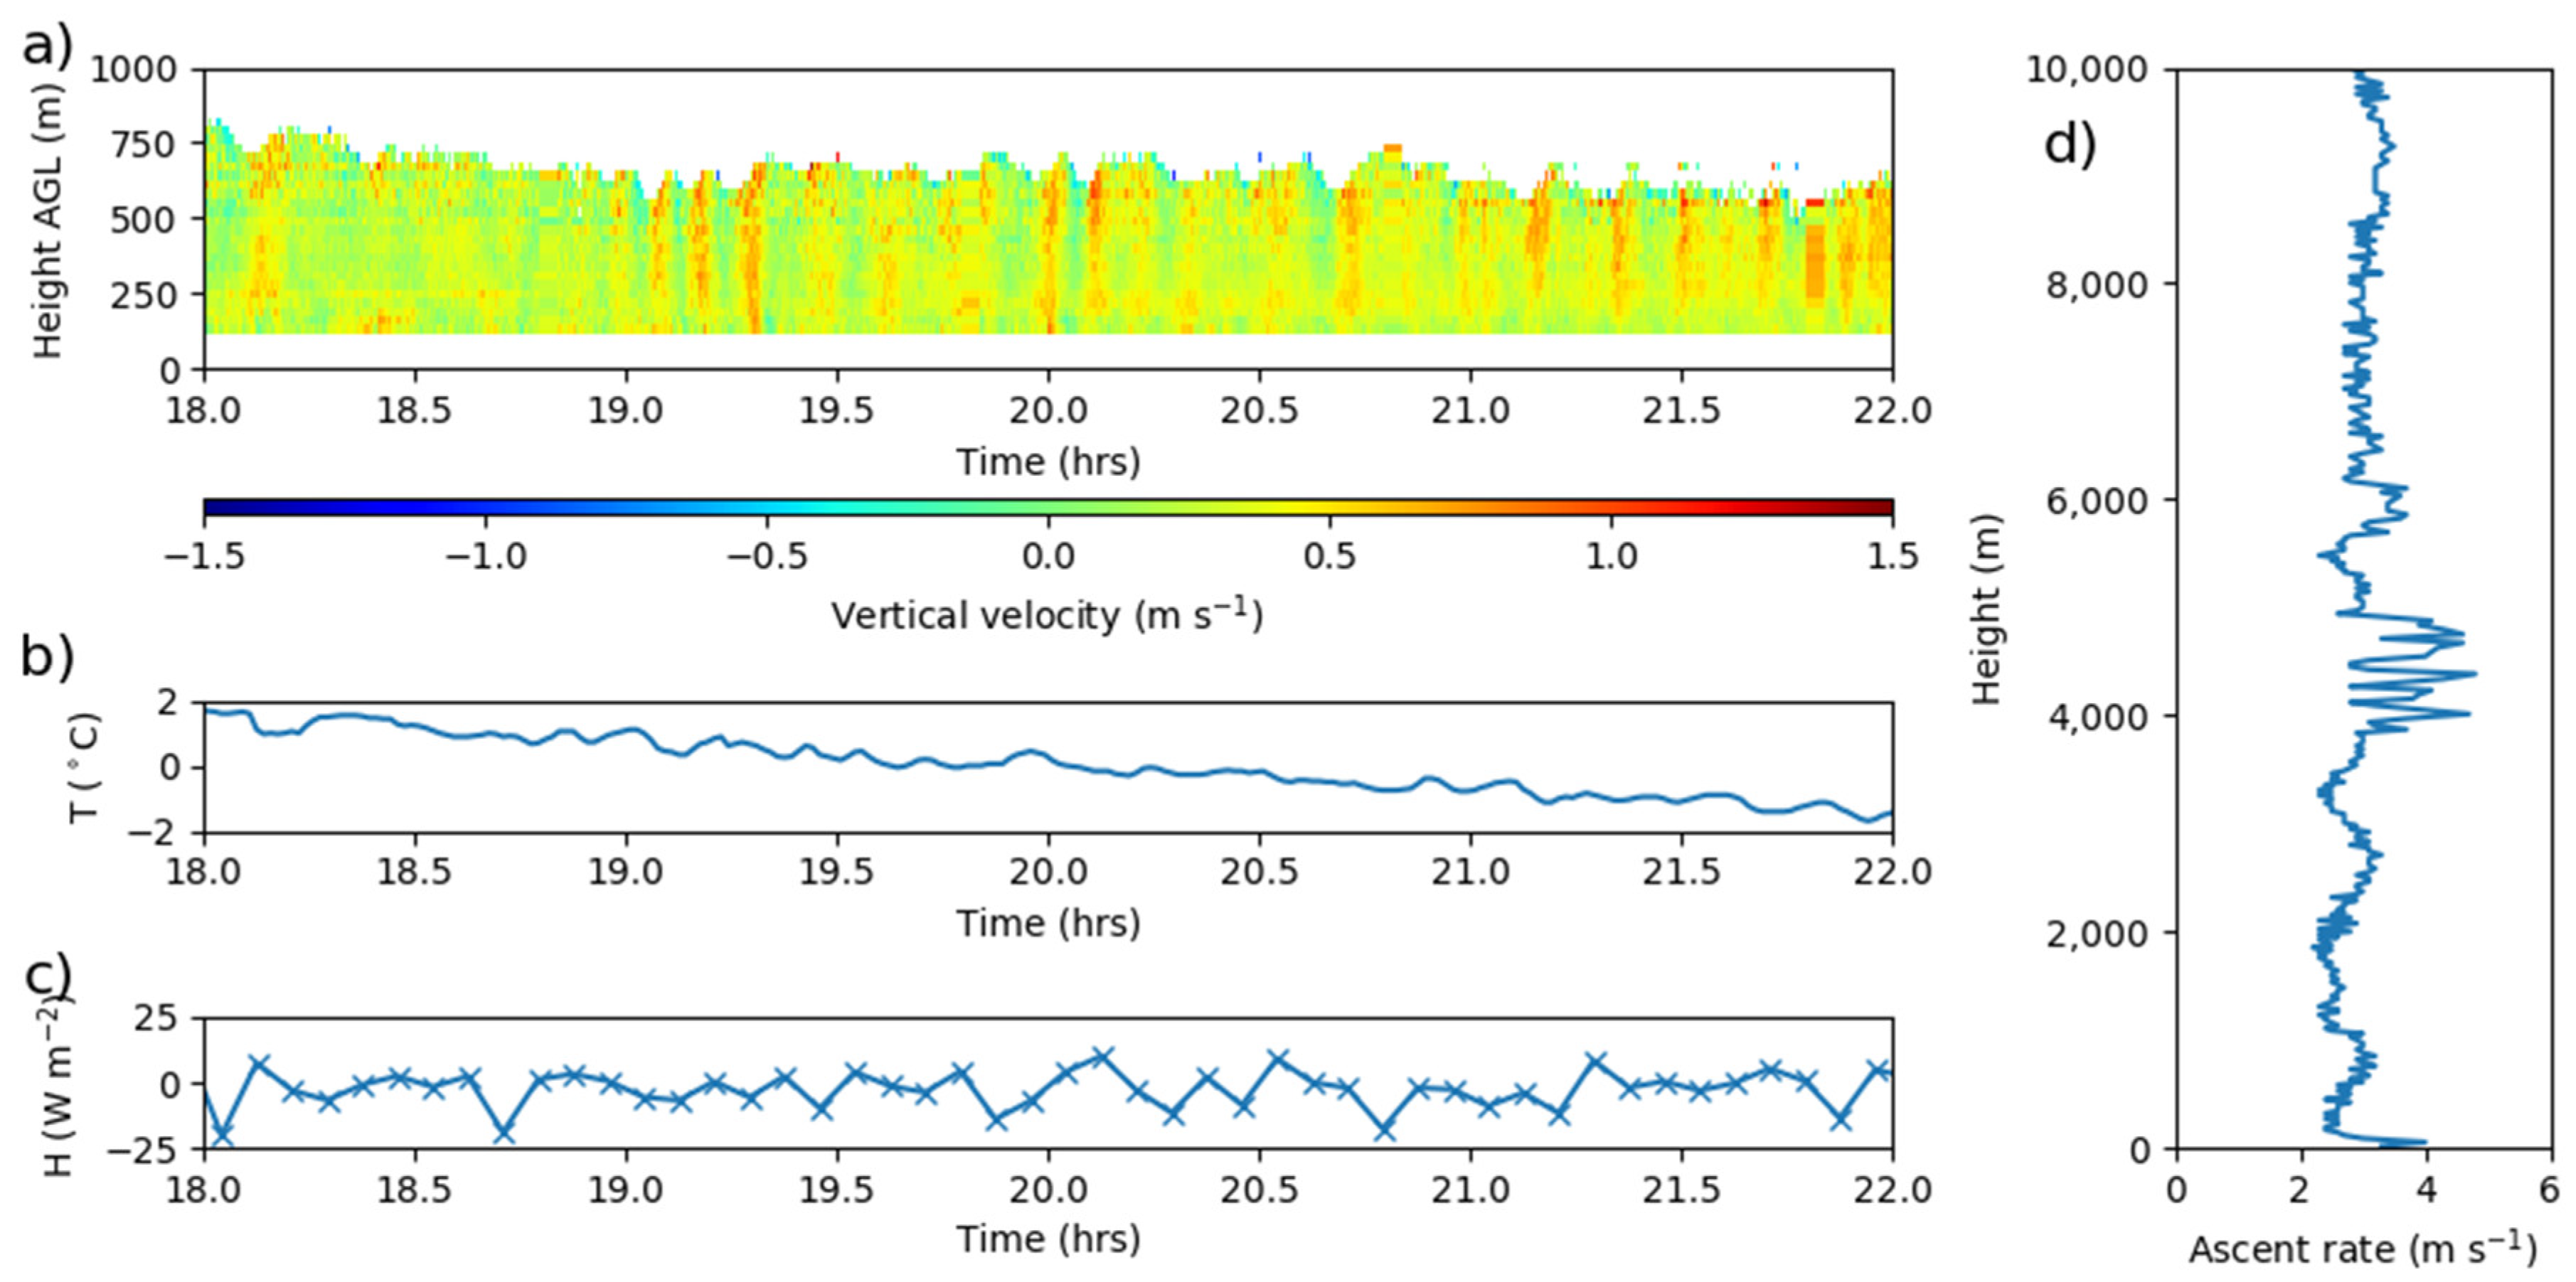
Figure 6 shows a case study from the COLPEX field experiment studied in Reference [76]. The figure shows data from a four hour period, 18–22 UTC on 10 December 2009, part of Intensive Observation Period (IOP) 10. Details of the experiment and instrumentation are contained in Reference [80]. Fog formed later in the night, but skies were clear at the times shown. Doppler lidar vertical velocity profiles show coherent wave-like patterns of ascent and decent with periods of 5–10 min, which extend from near the surface up to at least 700 m above ground level. These wave-like motions are correlated with fluctuations in the screen temperature (measured at 1.2 m) and also 5-min average sensible heat flux 50 m above the ground. The ascent rate from a radiosonde launched at 20 UTC shows a vertical wave structure up to a height of 4 km with a vertical wavelength of approximately 1 km. A neutrally stratified layer, which extends between 3.5 and 5 km (not shown) traps the wave, and so the wave amplitude is significantly reduced above this level. The observational evidence points to a trapped wave, which modulates both the temperature and the heat flux in the boundary layer. Like many of the studies above, this example demonstrates that although we frequently detect wave-like motions and correlated changes in mean quantities such as temperature or in fluxes, it is very hard from observations to make a causal link or to fully characterise the source and characteristics of the wave.
While identifying the source of small-scale gravity waves in the SBL from in-situ observations is difficult, there is some hope that remote sensing techniques, such as lidar, may offer opportunities to study the propagation of such wave features. Reference [81] discusses the range of measurement techniques available for observing turbulent exchange and transport in complex terrain. Future experiments should consider this when planning the deployment or scanning strategies for such instruments.
It is expected that many gravity waves in SBLs will have an orographic source, and so there is also some hope of predictability (at least stochastically), and this may offer a new way of modelling turbulent exchange in SBLs. Current turbulence schemes, which rely on some form of Reynolds-averaged decomposition of the equations of motion and assumptions about stationarity of the turbulence, often struggle with very stable conditions where these assumptions break down [71].
NWP models typically require the addition of extra drag in SBLs in order to reproduce the correct winds. This enhanced mixing (the so called “long tail”) can have a negative impact on other aspects of the forecast such as the near-surface temperature. Several recent studies have looked at the role of gravity-wave drag in the SBL, and whether this can explain the missing mixing [82,83,84]. These studies suggest that inclusion of a gravity wave drag parametrisation scheme for the SBL in numerical models may improve representation of low-level winds without the need for the physically unrealistic “long tail”. Such schemes could also improve low-level temperatures and perhaps the turbulent exchange of other quantities in the SBL.
Gravity waves (often orographically generated) do not directly transport atmospheric constituents, at least for linear waves, but may lead to turbulent mixing either through wave breaking or the generation of rotor motions beneath the smooth wave flow (as noted in Section 3), or through waves altering the local wind shear, and hence the Richardson number, leading to instability and the generation of turbulence. Such effects are well recognised higher up in the atmosphere, although they are often not well represented in numerical models. They are also important at low levels in the SBL, where they may be a major control on its development over complex terrain. However, the extent of their impact on turbulent fluxes is not well understood; indeed it is likely to be both intermittent and non-heterogeneous. Gravity wave processes are of course just one aspect of turbulent exchange in SBLs, and [85,86] offer a more thorough discussion of the scientific challenges associated with exchange processes in the boundary layer over complex terrain.

5. Discussion and Current Challenges

Foehn, gravity waves and their induced flow fields play an important role in modifying boundary-layer turbulence and turbulent exchange. Understanding these flows is key to accurately modelling this turbulent exchange, particularly in complex terrain. Although the role of gravity waves has been recognised, there remain a number of challenges in translating this into a quantitative understanding of the relative importance of different wave-related processes, and accurately representing these processes in both high-resolution research models and lower-resolution NWP and climate models.
From an observational perspective the heterogeneous, three-dimensional nature of turbulence and turbulent exchange over complex terrain makes it challenging to representatively sample the flow using in-situ measurements. The unsteady, often intermittent nature of the turbulence (particularly in the SBL) and the role of sub-mesoscale flows means that the traditional eddy-covariance methods used to measure turbulent exchange may not be sufficient and techniques such as multi-resolution flux decomposition (MRFD) [87] are often required to reduce the contamination of the turbulent fluxes by the wave motions. Additionally, the propagation and transient nature of gravity waves often makes it difficult to isolate the wave source from observations.
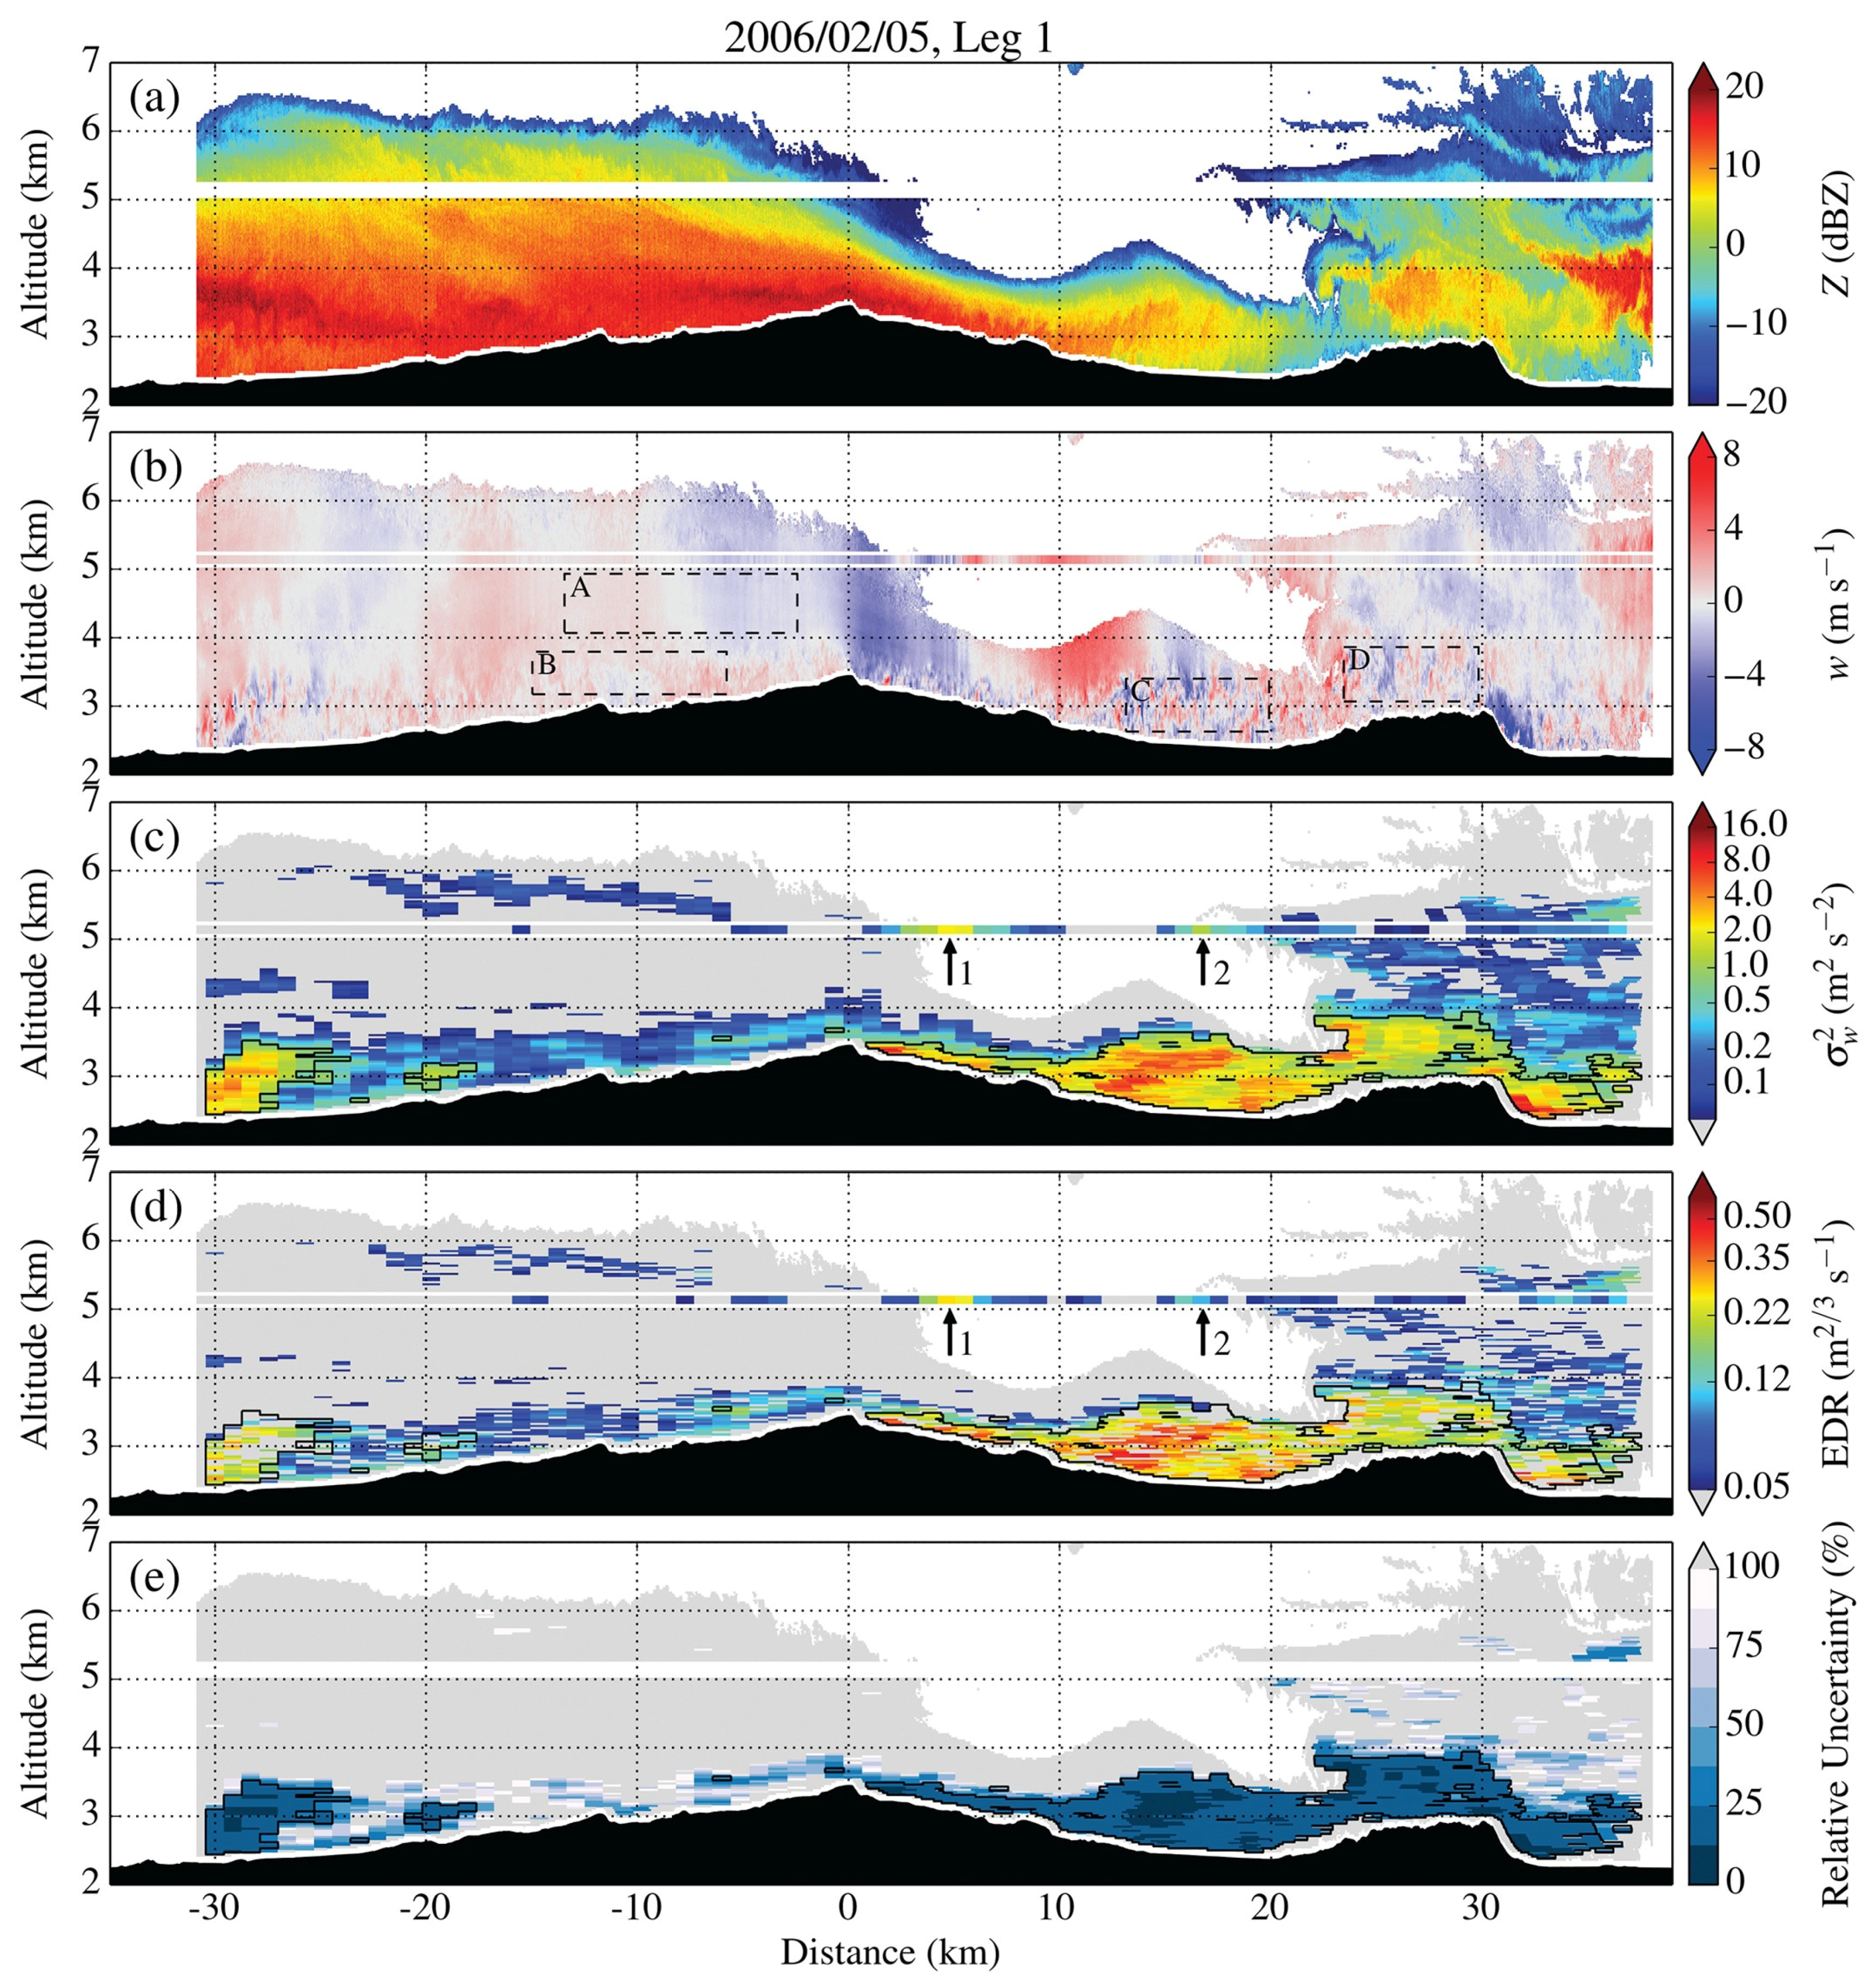
Here new remote sensing techniques, such as radar and lidar, offer the possibility to study more fully the spatial and temporal structure and propagation of wave motions, especially if combined with eddy-covariance observations. Remote sensing technologies provide an opportunity for detailed observations of the flow structure and derived turbulent intensity, including airborne cloud Doppler radar [57,88] and airborne Doppler wind lidar [89]. Figure 7 shows an example from Reference [57] of the detailed information on wind, turbulence parameters, and wave structure available from an airborne doppler radar pass during a case of mid-tropospheric mountain wave breaking. It is now also possible to determine 3-D wind fields from dual instruments [90] and vorticity from a single instrument [91], while error correction methods continue to improve [92]. The ability to map and quantify turbulence at high frequency within rotors and downslope windstorms may lead to generalised models of the behaviour of internal rotor turbulence and transport. New measurements will be needed in order to do this and these should be complemented with large-eddy simulations and high-resolution NWP modelling, to help interpret the observations.
High-resolution numerical simulations are a key tool in studying this spatial and temporal variability in turbulent exchange, as demonstrated by the examples in this manuscript. For larger-scale flows such as foehn these models have begun to allow a deeper understanding of the complexity of the induced turbulent exchange over complex terrain. The introduction of kilometre-scale NWP models has seen a step change in the representation of, for example, gap flows and convection; however these resolutions may still not be sufficient for representing the detailed motion in rotors where resolutions of order 100 m may be needed. Even large-eddy simulations at extremely high resolution, of the order of a few metres, can struggle to accurately model the stable boundary layer. Part of the challenge here is retaining the very high resolutions required to resolve turbulence in stable boundary layers, while also including the sub-mesoscale motions and gravity waves, which modulate the turbulence. A further challenge is ensuring that the ancillary data (e.g., terrain, land use, etc.) and the initial conditions and boundary conditions for the model are available at the same high resolution to accurately represent the small-scale, but important, wave motions.
For lower-resolution numerical models such as global NWP and climate models, where there may be significant sub-grid orography and where the effects of turbulence are parametrised, there are still significant challenges in accurately representing the bulk effects of foehn, rotors and SBL gravity waves on turbulent exchange. The current gravity-wave drag parametrisations need to be extended to represent these phenomena, and these extensions should include representation of the effects on boundary-layer turbulent fluxes, moving away from the classic models of homogeneous turbulence, implicit in current turbulence parametrisation schemes. Operational tuning, for example the “long tails” used in many NWP turbulence models for stable conditions, may alleviate some of the problems caused by not including the effects of these process. But more physically-based approaches to parametrizing these processes are required to improve the representation of turbulent exchange over complex terrain. Recent work on gravity-wave drag in the boundary layer [82,84] suggests this might be a fruitful avenue of research, and perhaps similar approaches are required for the effects of foehn and rotors. However, parameterisations of turbulence within the stable boundary layer itself are still a challenge in NWP models, which tend to rely on turbulence closures that limit representation [93]. Alternative closure schemes (e.g., Reference [94]) are available but have not been comprehensively evaluated for operational use.
Finally, much of the interest regarding parametrisation schemes to date has been focused on the impact on turbulent exchange of momentum, since this directly impacts on winds, however increasingly there is a need for accurate representation of the turbulent exchange of other quantities: Heat and moisture are also key for weather forecasting, volcanic ash for hazard forecasting and aerosols, particulates and chemical species are important for air quality forecasting. All are also important in the climate system. It is vital that future research includes this wider scope for parametrisation schemes.

Author Contributions

S.B.V. coordinated the paper, wrote the introduction and contributed to the foehn and rotor sections. I.A.R. and A.D.E. wrote the section on foehn. P.S. and V.G. wrote the section on rotors. A.N.R. wrote the section on gravity waves. S.B.V. and A.N.R. wrote the discussion and current challenges. All authors contributed to the editing of the manuscript and the integration of the sections together.

Funding

A.D.E. and I.A.R. acknowledge support from NERC grants NE/G014124/1, NE/G013578/1 and NE/N009754/1. The contribution of A.N.R. and S.B.V. was partially supported by NERC JWCRP grant NE/I007679/1. The National Center for Atmospheric Research is sponsored by the National Science Foundation.

Acknowledgments

P.S. would like to acknowledge the assistance of Stuart Webster and Helen Rance (Met Office) in running the nested MetUM simulations depicted in Figure 4. A.N.R. would like to acknowledge Jeremy Price from the Met Office Research Unit, Cardington for providing some of the data for Figure 6.

Conflicts of Interest

The authors declare no conflict of interest.

References

  1. Palmer, T.N.; Shutts, G.J.; Swinbank, R. Alleviation of a systematic westerly bias in general circulation and numerical weather prediction models through an orographic gravity wave drag parametrization. Q. J. R. Meteorol. Soc. 1986, 112, 1001–1039. [Google Scholar] [CrossRef]
  2. Poulidis, A.P.; Takemi, T.; Iguchi, M.; Renfrew, I.A. Orographic effects on the transport and deposition of volcanic ash: A case study of Mt. Sakurajima, Japan. J. Geophys. Res. Atmos. 2017, 122, 9332–9350. [Google Scholar] [CrossRef]
  3. Fritts, D.C.; Smith, R.B.; Taylor, M.J.; Doyle, J.D.; Eckermann, S.D.; Dörnbrack, A.; Rapp, M.; Williams, B.P.; Pautet, P.-D.; Bossert, K.; et al. The deep propagating gravity wave experiment (DEEPWAVE): An airborne and ground-based exploration of gravity wave propagation and effects from their sources through the lower and middle atmosphere. Bull. Am. Meteorol. Soc. 2016, 97, 425–453. [Google Scholar] [CrossRef]
  4. Jackson, D.R.; Gadian, A.; Hindley, N.P.; Hoffmann, L.; Hughes, J.; King, J.; Moffat-Griffin, T.; Moss, A.C.; Ross, A.N.; Vosper, S.B.; et al. The South Georgia wave experiment (SG-WEX)—A means for improving analysis of gravity waves and low-level wind impacts generated from mountainous islands. Bull. Am. Meteorol. Soc. 2018, 99, 1027–1040. [Google Scholar] [CrossRef]
  5. Nappo, C.J. An Introduction to Atmospheric Gravity Waves, 2nd ed.; Academic Press: Cambridge, MA, USA, 2012; ISBN 9780123852236. [Google Scholar]
  6. Fritts, D.C.; Alexander, M.J. Gravity wave dynamics and effects in the middle atmosphere. Rev. Geophys. 2003, 41, 1003. [Google Scholar] [CrossRef]
  7. Elvidge, A.D.; Vosper, S.B.; Wells, H.; Cheung, J.C.H.; Derbyshire, S.H.; Turp, D. Moving towards a wave-resolved approach to forecasting mountain wave induced clear air turbulence. Meteorol. Appl. 2017, 24, 540–550. [Google Scholar] [CrossRef]
  8. Hann, J. Lehrbuch der Meteorologie, 1st ed.; Verlag C. H. Tauchnitz: Leipzig, Germany, 1901; 805p. [Google Scholar]
  9. Elvidge, A.D.; Renfrew, I.A. The causes of foehn warming in the lee of mountains. Bull. Am. Meteorol. Soc. 2016, 97, 455–466. [Google Scholar] [CrossRef]
  10. Seibert, P. South foehn studies since the ALPEX experiment. Meteorol. Atmos. Phys. 1990, 43, 91–103. [Google Scholar] [CrossRef]
  11. Barry, R.G. Mountain Weather and Climate, 3rd ed.; Cambridge University Press: Cambridge, UK, 2008; ISBN 978-0521681582. [Google Scholar]
  12. Richner, H.; Hächler, P. Understanding and forecasting Alpine foehn. In Mountain Weather Research and Forecasting: Recent Progress and Current Challenges; Chow, F.K., de Wekker, S.F.J., Snyder, B.J., Eds.; Springer: Dordrecht, The Netherlands, 2013; ISBN 978-94-007-4097-6. [Google Scholar]
  13. Scorer, R.S. Environmental Aerodynamics; Ellis Horwood: Chichester, UK, 1978; ISBN 978-0132825269. [Google Scholar]
  14. Ólafsson, H. The heat source of the foehn. Hrvatski Meteorološki Časopis 2005, 40, 542–545. [Google Scholar]
  15. Minder, J.R.; Smith, R.B.; Nugent, A. The dynamics of ascent-forced orographic convection in the tropics: Results from Dominica. J. Atmos. Sci. 2013, 70, 4067–4088. [Google Scholar] [CrossRef]
  16. Hoinka, K.P. What is a foehn clearance? Bull. Am. Meteorol. Soc. 1985, 66, 1123–1132. [Google Scholar] [CrossRef]
  17. Takane, Y.; Kusaka, H. Formation mechanisms of the extreme high surface air temperature of 40.9 °C observed in the Tokyo metropolitan area: Considerations of dynamic foehn and foehnlike wind. J. Appl. Meteorol. Climatol. 2011, 50, 1827–1841. [Google Scholar] [CrossRef]
  18. Elvidge, A.D.; Renfrew, I.A.; King, J.C.; Orr, A.; Lachlan-Cope, T.A.; Weeks, M.; Gray, S.L. Foehn jets over the Larsen C Ice Shelf, Antarctica. Q. J. R. Meteorol. Soc. 2015, 141, 698–713. [Google Scholar] [CrossRef] [Green Version]
  19. Elvidge, A.D.; Renfrew, I.A.; King, J.C.; Orr, A.; Lachlan-Cope, T.A. Foehn warming distributions in non-linear and linear flow regimes: A focus on the Antarctic Peninsula. Q. J. R. Meteorol. Soc. 2016, 142, 618–631. [Google Scholar] [CrossRef] [Green Version]
  20. Mayr, G.J.; Armi, L.; Gohm, A.; Zängl, G.; Durran, D.R.; Flamant, C.; Gaberšek, S.; Mobbs, S.; Ross, A.; Weissmann, M. Gap flows: Results from the Mesoscale Alpine Programme. Q. J. R. Meteorol. Soc. 2007, 133, 881–896. [Google Scholar] [CrossRef] [Green Version]
  21. Miltenberger, A.K.; Reynolds, S.; Sprenger, M. Revisiting the latent heating contribution to foehn warming: Lagrangian analysis of two foehn events over the Swiss Alps. Q. J. R. Meteorol. Soc. 2016, 142, 2194–2204. [Google Scholar] [CrossRef]
  22. Turton, J.V.; Kirchgaessner, A.; Ross, A.N.; King, J.C. The spatial distribution and temporal variability of föhn winds over the Larsen C Ice Shelf, Antarctica. Q. J. R. Meteorol. Soc. 2018. [Google Scholar] [CrossRef]
  23. Turton, J.V.; Kirchgaessner, A.; Ross, A.N.; King, J.C. Does high-resolution modelling improve the spatial analysis of föhn flow over the Larsen C ice shelf? Weather 2017, 72, 192–196. [Google Scholar] [CrossRef]
  24. Grubišić, V. Bora-driven potential vorticity banners over the Adriatic. Q. J. R. Meteorol. Soc. 2004, 130, 2571–2603. [Google Scholar] [CrossRef] [Green Version]
  25. Jiang, Q.; Doyle, J.D. Wave breaking induced surface wakes and jets observed during a bora event. Geophys. Res. Lett. 2005, 32, L17807. [Google Scholar] [CrossRef]
  26. Večenaj, Ž.; Belušić, D.; Grubišić, V.; Grisogono, B. Along-coast features of the bora related turbulence. Bound.-Layer Meteorol. 2012, 143, 527–545. [Google Scholar] [CrossRef]
  27. Wood, N.; Mason, P.J. The pressure force induced by neutral, turbulent flow over hills. Q. J. R. Meteorol. Soc. 1993, 119, 1233–1267. [Google Scholar] [CrossRef]
  28. Beljaars, A.C.M.; Brown, A.R.; Wood, N. A new parametrization of turbulent orographic form drag. Q. J. R. Meteorol. Soc. 2004, 130, 1327–1347. [Google Scholar] [CrossRef] [Green Version]
  29. Vosper, S.B.; Brown, A.R. The effect of small-scale hills on orographic drag. Q. J. R. Meteorol. Soc. 2007, 133, 1345–1352. [Google Scholar] [CrossRef]
  30. Westerling, A.L.; Cayan, D.R.; Brown, T.J.; Hall, B.L.; Riddle, L.G. Climate, Santa Ana winds and autumn wildfires in southern California. EOS Trans. Am. Geophys. Union 2004, 85, 289–296. [Google Scholar] [CrossRef]
  31. Seibert, P.; Feldmann, H.; Neininger, B.; Bäumle, M.; Trickl, T. South foehn and ozone in the Eastern Alps–case study and climatological aspects. Atmos. Environ. 2000, 34, 1379–1394. [Google Scholar] [CrossRef]
  32. Luckman, A.; Elvidge, A.D.; Jansen, D.; Kulessa, B.; Munneke, P.K.; King, J.; Barrand, N.E. Surface melt and ponding on Larsen C Ice Shelf and the impact of föhn winds. Antarct. Sci. 2014, 26, 625–635. [Google Scholar] [CrossRef] [Green Version]
  33. Scorer, R.S. Theory of waves in the lee of mountains. Q. J. R. Meteorol. Soc. 1949, 75, 41–56. [Google Scholar] [CrossRef]
  34. Shutts, G. Operational lee wave forecasting. Meteorol. Appl. 1997, 4, 23–35. [Google Scholar] [CrossRef]
  35. Vosper, S.B. Development and testing of a high resolution mountain-wave forecasting system. Meteorol. Appl. 2003, 10, 75–86. [Google Scholar] [CrossRef] [Green Version]
  36. Reinecke, P.A.; Durran, D.R. Initial-condition sensitivities and the predictability of downslope winds. J. Atmos. Sci. 2009, 66, 3401–3418. [Google Scholar] [CrossRef]
  37. Sachsperger, J.; Serafin, S.; Grubišić, V. The amplitude of lee waves on the boundary layer inversion. Q. J. R. Meteorol. Soc. 2016, 143, 27–36. [Google Scholar] [CrossRef]
  38. Sheridan, P.F.; Vosper, S.B.; Brown, P. Mountain waves in high resolution forecast models: Automated diagnostics of wave severity and impact on surface winds. Atmosphere 2017, 8, 24. [Google Scholar] [CrossRef]
  39. Mobbs, S.D.; Vosper, S.B.; Sheridan, P.F.; Cardoso, R.; Burton, R.R.; Arnold, S.J.; Hill, M.K.; Horlacher, V.; Gadian, A.M. Observations of downslope winds and rotors in the Falkland Islands. Q. J. R. Meteorol. Soc. 2005, 131, 329–351. [Google Scholar] [CrossRef] [Green Version]
  40. Grubišić, V.; Billings, B.J. The intense lee-wave rotor event of Sierra Rotors IOP 8. J. Atmos. Sci. 2007, 64, 4178–4201. [Google Scholar] [CrossRef]
  41. Sheridan, P.F.; Horlacher, V.; Rooney, G.G.; Hignett, P.; Mobbs, S.D.; Vosper, S.B. Influence of lee waves on the near-surface flow downwind of the Pennines. Q. J. R. Meteorol. Soc. 2007, 133, 1353–1369. [Google Scholar] [CrossRef]
  42. Grubišić, V.; Doyle, J.D.; Kuettner, J.; Mobbs, S.; Smith, R.B.; Whiteman, C.D.; Dirks, R.; Czyzyk, S.; Cohn, S.A.; Vosper, S.; et al. The Terrain-Induced Rotor Experiment: A field campaign overview including observational highlights. Bull. Am. Meteorol. Soc. 2008, 89, 1513–1533. [Google Scholar] [CrossRef]
  43. Kuettner, J.P. Zurentstehung der foehnwalle. Beitr. Phys. Frei Atmos. 1939, 25, 251–299. [Google Scholar]
  44. Manley, G. The Helm Wind of Crossfell, 1937–1939. Q. J. R. Meteorol. Soc. 1945, 71, 197–219. [Google Scholar] [CrossRef]
  45. Förchtgott, J. Wave streaming in the lee of mountain ridges. Bull. Meteorol. Czech 1949, 3, 49. [Google Scholar]
  46. Holmboe, J.R.; Klieforth, H. Investigation of Mountain Lee Waves and the Airflow over the Sierra Nevada; Final Report; Department of Meteorology, University of California (UCLA): Los Angeles, CA, USA, 1957. [Google Scholar]
  47. Vosper, S.B. Inversion effects on mountain lee waves. Q. J. R. Meteorol. Soc. 2004, 130, 1723–1748. [Google Scholar] [CrossRef] [Green Version]
  48. Hertenstein, R.F.; Kuettner, J.P. Rotor types associated with steep lee topography: Influence of the wind profile. Tellus A Dyn. Meteorol. Oceanogr. 2005, 57, 117–135. [Google Scholar] [CrossRef]
  49. Doyle, J.D.; Durran, D.R. The dynamics of mountain-wave-induced rotors. J. Atmos. Sci. 2002, 59, 186–201. [Google Scholar] [CrossRef]
  50. Vosper, S.B.; Sheridan, P.F.; Brown, A.R. Flow separation and rotor formation beneath two-dimensional trapped lee waves. Q. J. R. Meteorol. Soc. 2006, 132, 2415–2438. [Google Scholar] [CrossRef] [Green Version]
  51. Sachsperger, J.; Serafin, S.; Grubišić, V. Dynamics of rotor formation in uniformly stratified two-dimensional flow over a mountain. Q. J. R. Meteorol. Soc. 2016, 142, 1201–1212. [Google Scholar] [CrossRef] [Green Version]
  52. Doyle, J.D.; Durran, D.R. Rotor and subrotor dynamics in the lee of three-dimensional terrain. J. Atmos. Sci. 2007, 64, 4202–4221. [Google Scholar] [CrossRef]
  53. Sheridan, P.F.; Vosper, S.B. Numerical simulations of rotors, hydraulic jumps and eddy shedding in the Falkland Islands. Atmos. Sci. Lett. 2006, 6, 211–218. [Google Scholar] [CrossRef]
  54. Mayr, G.J.; Armi, L. The influence of downstream diurnal heating on the descent of flow across the Sierras. J. Appl. Meteorol. Climatol. 2010, 49, 1906–1912. [Google Scholar] [CrossRef]
  55. Kühnlein, C.; Dörnbrack, A.; Weissmann, M. High Resolution Doppler Lidar Observations of Transient Downslope Flows and Rotors. Mon. Weather Rev. 2013, 141, 3257–3272. [Google Scholar] [CrossRef]
  56. Grubišić, V.; Serafin, S.; Strauss, L.; Haimov, S.J.; French, J.R.; Oolman, L.D. Wave-induced boundary-layer separation in the lee of the Medicine Bow Mountains. Part 2: Numerical modeling. J. Atmos. Sci. 2015, 72, 4865–4884. [Google Scholar] [CrossRef]
  57. Strauss, L.; Serafin, S.; Haimov, S.; Grubišić, V. Turbulence in breaking mountain waves and atmospheric rotors estimated from airborne in situ and Doppler radar measurements. Q. J. R. Meteorol. Soc. 2015, 141, 3207–3225. [Google Scholar] [CrossRef] [PubMed]
  58. Strauss, L.; Serafin, S.; Grubišić, V. Atmospheric rotors and severe turbulence in a long deep valley. J. Atmos. Sci. 2016, 73, 1481–1506. [Google Scholar] [CrossRef]
  59. Teixeira, M.A.C.; Argaín, J.L.; Miranda, P.M.A. Drag produced by trapped lee waves and propagating mountain waves in a two-layer atmosphere. Q. J. R. Meteorol. Soc. 2013, 139, 964–981. [Google Scholar] [CrossRef]
  60. Teixeira, M.A.C.; Argaín, J.L.; Miranda, P.M.A. Orographic drag associated with lee waves trapped at an inversion. J. Atmos. Sci. 2013, 70, 2930–2947. [Google Scholar] [CrossRef]
  61. Teixeira, M.A.C.; Miranda, P.M.A. Drag associated with 3D trapped lee waves over an axisymmetric obstacle in two-layer atmospheres. Q. J. R. Meteorol. Soc. 2017, 143, 3244–3258. [Google Scholar] [CrossRef]
  62. Doyle, J.D.; Jiang, Q.; Reinecke, P.A. Numerical Modeling and Predictability of Mountain Wave-Induced Turbulence and Rotors. In Aviation Turbulence; Sharman, R., Lane, T., Eds.; Springer: Cham, Switzerland, 2016. [Google Scholar]
  63. Turnipseed, A.A.; Anderson, D.E.; Burns, S.; Blanken, P.D.; Monson, R.K. Airflows and turbulent flux measurements in mountainous terrain Part 2: Mesoscale effects. Agric. For. Meteorol. 2004, 125, 187–205. [Google Scholar] [CrossRef]
  64. Hills, M.O.G.; Durran, D.R. Nonstationary Trapped Lee Waves Generated by the Passage of an Isolated Jet. J. Atmos. Sci. 2012, 69, 3040–3059. [Google Scholar] [CrossRef]
  65. Sheridan, P. Current gust forecasting techniques, developments and challenges. Adv. Sci. Res. 2018, 15, 159–172. [Google Scholar] [CrossRef]
  66. Doyle, J.D.; Durran, D.R. Recent developments in the theory of atmospheric rotors. Bull. Am. Meteorol. Soc. 2004, 85, 337–342. [Google Scholar] [CrossRef]
  67. Jiang, Q.; Doyle, J.D. Diurnal variation of downslope winds in Owens Valley during the Sierra Rotors Experiment. Mon. Weather Rev. 2008, 136, 3760–3780. [Google Scholar] [CrossRef]
  68. Serafin, S.; Strauss, L.; Grubišić, V. Climatology of westerly wind events in the lee of the southern Sierra Nevada. J. Appl. Meteorol. Climatol. 2017, 56, 1003–1023. [Google Scholar] [CrossRef]
  69. Dörnbrack, A.; Dürbeck, T. Turbulent dispersion of aircraft exhausts in regions of breaking gravity waves. Atmos. Environ. 1998, 32, 3105–3112. [Google Scholar] [CrossRef]
  70. Sun, J.; Nappo, C.J.; Mahrt, L.; Belušić, D.; Grisogono, B.; Stauffer, D.R.; Pulido, M.; Staquet, C.; Jiang, Q.; Pouquet, A.; et al. Review of wave-turbulence interactions in the stable atmospheric boundary layer. Rev. Geophys. 2015, 53, 956–993. [Google Scholar] [CrossRef] [Green Version]
  71. Mahrt, L. Stably stratified atmospheric boundary layers. Annu. Rev. Fluid Mech. 2014, 46, 23–45. [Google Scholar] [CrossRef]
  72. Meillier, Y.P.; Frehlich, R.G.; Jones, R.M.; Balsley, B.B. Modulation of small-scale turbulence by ducted gravity waves in the nocturnal boundary layer. J. Atmos. Sci. 2008, 65, 1414–1427. [Google Scholar] [CrossRef]
  73. Cava, D.; Giostra, U.; Katul, G. Characteristics of gravity waves over an Antarctic Ice Sheet during an Austral summer. Atmosphere 2015, 6, 1271–1289. [Google Scholar] [CrossRef]
  74. Zeri, M.; Sá, L.D.A. Horizontal and vertical turbulent fluxes forced by a gravity wave event in the nocturnal atmospheric surface layer over the Amazon forest. Bound.-Layer Meteorol. 2011, 138, 413–431. [Google Scholar] [CrossRef]
  75. Román-Cascón, C.; Yagüe, C.; Mahrt, L.; Sastre, M.; Steeneveld, G.-J.; Pardyjak, E.; van de Boer, A.; Hartogensis, O. Interactions among drainage flows, gravity waves and turbulence: A BLLAST case study. Atmos. Chem. Phys. 2015, 15, 9031–9047. [Google Scholar] [CrossRef]
  76. Jemmett-Smith, B.C. Cold Air Pools over Complex Terrain. Ph.D. Thesis, University of Leeds, Leeds, UK, 2014. Available online: http://etheses.whiterose.ac.uk/6414/1/BCJemmettSmith_Thesis_20140429.pdf (accessed on 30 April 2018).
  77. Viana, S.; Terradellas, E.; Yagüe, C. Analysis of gravity waves generated at the top of a drainage flow. J. Atmos. Sci. 2010, 67, 3949–3966. [Google Scholar] [CrossRef]
  78. Chemel, C.; Staquet, C.; Largeron, Y. Generation of internal gravity waves by a katabatic flow in an idealized alpine valley. Meteorol. Atmos. Phys. 2009, 103, 187–194. [Google Scholar] [CrossRef] [Green Version]
  79. Hang, C.; Nadeau, D.F.; Gultepe, I.; Hoch, S.W.; Román-Cascón, C.; Pryor, K.; Fernando, H.J.S.; Creegan, E.D.; Leo, L.S.; Silver, Z.; et al. A case study of the mechanisms modulating the evolution of valley fog. Pure Appl. Geophys. 2016, 173, 3011–3030. [Google Scholar] [CrossRef]
  80. Price, J.D.; Vosper, S.; Brown, A.; Ross, A.; Clark, P.; Davies, F.; Horlacher, V.; Claxton, B.; McGregor, J.R.; Hoare, J.S.; et al. COLPEX: Field and numerical studies over a region of small hills. Bull. Am. Meteorol. Soc. 2011, 92, 1636–1650. [Google Scholar] [CrossRef]
  81. Emeis, S.; Kalthoff, N.; Adler, B.; Pardyjak, E.; Paci, A.; Junkermann, W. High resolution observation of transport and exchange processes in mountainous terrain. Atmosphere 2018. submitted. [Google Scholar]
  82. Lapworth, A.; Claxton, B.M.; McGregor, J.R. The effect of gravity wave drag on near-surface winds and wind profiles in the nocturnal boundary layer over land. Bound.-Layer Meteorol. 2015, 156, 325–335. [Google Scholar] [CrossRef]
  83. Lapworth, A.; Osborne, S.R. Evidence for gravity wave drag in the boundary layer of a numerical forecast model: A comparison with observations. Q. J. R. Meteorol. Soc. 2016, 142, 3257–3264. [Google Scholar] [CrossRef]
  84. Tsiringakis, A.; Steenveld, G.J.; Holtsag, A.A.M. Small-scale orographic gravity wave drag in stable boundary layers and its impact on synoptic systems and near-surface meteorology. Q. J. R. Meteorol. Soc. 2017, 143, 1504–1516. [Google Scholar] [CrossRef]
  85. Serafin, S.; Adler, B.; Cuxart, J.; De Wekker, S.F.J.; Gohm, A.; Grisogono, B.; Kalthoff, N.; Kirshbaum, D.J.; Rotach, M.W.; Schmidli, J.; et al. Exchange processes in the atmospheric boundary layer over mountainous terrain. Atmosphere 2018, 9, 102. [Google Scholar] [CrossRef]
  86. Lehner, M.; Rotach, M.W. Current challenges in understanding and predicting transport and exchange in the Atmosphere over mountainous terrain. Atmosphere 2018, 9, 276. [Google Scholar] [CrossRef]
  87. Howell, J.F.; Mahrt, L. Multiresolution flux decomposition. Bound.-Layer Meteorol. 1997, 83, 117–137. [Google Scholar] [CrossRef]
  88. French, J.R.; Haimov, S.J.; Oolman, L.D.; Grubišić, V.; Serafin, S.; Strauss, L. Wave-induced boundary-layer separation in the lee of the Medicine Bow Mountains. Part 1: Observations. J. Atmos. Sci. 2015, 72, 4845–4863. [Google Scholar] [CrossRef]
  89. Chouza, F.; Reitebuch, O.; Jähn, M.; Rahm, S.; Weinzierl, B. Vertical wind retrieved by airborne lidar and analysis of island induced gravity waves in combination with numerical models and in situ particle measurements. Atmos. Chem. Phys. 2016, 16, 4675–4692. [Google Scholar] [CrossRef] [Green Version]
  90. Drechsel, S.; Mayr, G.J.; Chong, M.; Weissmann, M.; Dörnbrack, A.; Calhoun, R. Three-Dimensional Wind Retrieval: Application of MUSCAT to Dual-Doppler Lidar. J. Atmos. Ocean. Technol. 2009, 26, 635–646. [Google Scholar] [CrossRef] [Green Version]
  91. Weissmann, M.; Dörnbrack, A.; Doyle, J.D. Vorticity from Line-of-Sight Lidar Velocity Scans. J. Atmos. Ocean. Technol. 2009, 26, 2683–2690. [Google Scholar] [CrossRef]
  92. Witschas, B.; Rahm, S.; Dörnbrack, A.; Wagner, J.; Rapp, M. Airborne Coherent Doppler Wind Lidar measurements of vertical and horizontal winds for the investigation of orographically induced gravity waves. J. Atmos. Ocean. Technol. 2017, 34, 1371–1386. [Google Scholar] [CrossRef]
  93. Holtslag, A.A.M.; Svensson, G.; Baas, P.; Basu, S.; Beare, B.; Beljaars, A.C.M.; Bosveld, F.C.; Cuxart, J.; Lindvall, J.; Steeneveld, G.J.; et al. Stable atmospheric boundary layers and diurnal cycles: Challenges for weather and climate models. Bull. Am. Meteorol. Soc. 2013, 94, 1691–1706. [Google Scholar] [CrossRef]
  94. Sorbjan, Z. Gradient-based scales and similarity laws in the stable boundary layer. Q. J. R. Meteorol. Soc. 2010, 136, 1243–1254. [Google Scholar] [CrossRef]
Figure 1. Numerical simulations of a foehn wind event affecting the Antarctic Peninsula. (a) Low-level temperature and wind vectors; (b) Low-level wind speed and back trajectories (red lines) initiated in a foehn jet over the Larsen Ice Shelf within Whirlwind Inlet (WI). Annotated on the back trajectories are coloured dots at 0, 50, 100, and 150 km upwind of the Peninsula’s crest. The regions marked 1 and 2 are, respectively, the Whirlwind Inlet jet and N of Whirlwind Inlet wake trajectory initiation regions.
Atmosphere 09 00361 g001
Figure 2. Foehn heating contributions. Panel (a) illustrates the Lagrangian heat-budget model for air passing over a mountain and experiencing the following foehn warming mechanisms: Isentropic drawdown (ΔIDT), latent heating and precipitation (ΔLHT), sensible heating due to mechanical mixing (ΔSHT), and radiative heating (ΔRHT), as well as a pressure-gradient related cooling (ΔΔPT). These contributions sum to a total foehn heating (ΔFT). Panels (bd) show the foehn heating contributions as a change in temperature (K). The total foehn warming is plotted as a large open circle and the heating contributions are colour coded: Isentropic drawdown (green), latent heating (blue), sensible heating through mixing (red), and pressure-gradient cooling (grey). In these cases, the radiative heating contribution is negligible. Also shown is the cross-mountain descent (+). Six heat-budgets are illustrated, for three cases of foehn in Whirlwind Inlet (WI) and a region north of Whirlwind Inlet (N of WI)—see Figure 1 for locations. (Adapted from Reference [9]).
Atmosphere 09 00361 g002
Figure 3. Vertical cross-sections of cross-ridge wind and potential temperature through two idealised 3-D simulations of northerly flow over East Falkland in (a) “Type 1” and (b) “Type 2” rotor flows. The wind component is shaded (units are m s−1) and potential temperature contoured every 1 K. Flow is from the right. Reproduced from Reference [53].
Atmosphere 09 00361 g003
Figure 4. (a) Vertical velocities at 500 m altitude from a 100-m resolution simulation; (bd) surface stress from: (b) The 100-m resolution simulation; (c) coarse-grained onto a 4.4 km grid; and (d) simulated at 4.4-km resolution. Simulations are from a one-way nested MetUM simulation of flow over East Falkland at 12 UTC 9 February 2001. Note the colour scale in (c,d) is different to that in (b).
Atmosphere 09 00361 g004aAtmosphere 09 00361 g004b
Figure 5. Photo of a severe downslope windstorm/rotor in Owens Valley showing dust lofted by downslope winds passing over the dry Owens Lake bed. The view is to the south, along the Owens Valley, with the westerly flow from right to left. Taken during T-REX IOP-6 from the FAAM BAe-146 research aircraft (credit: Dr Barbara Brooks, National Centre for Atmospheric Science).
Atmosphere 09 00361 g005
Figure 6. Observations of vertical velocity from lidar (a), 1.2 m temperature at 1 min intervals (b), 5-min average sensible heat flux at 50 m (c) and ascent rate from a radiosonde launch at 20:00 (d). All from 10 December 2009, during Intensive Observation Period (IOP) 10 of the COLPEX field experiment.
Atmosphere 09 00361 g006
Figure 7. Radar data and derived turbulence parameters along a cross-mountain leg on 26 January 2006 at ~5200 m above sea level (ASL) in a flight across Medicine Bow Mountains (Wyoming, USA). (a) Radar reflectivity Z, (b) vertical Doppler velocity w, (c) variance of vertical velocity σw2, (d) eddy dissipation rate estimated using vertical velocity, EDRw, and (e) relative uncertainty of the estimate. The black contour in (ce) marks the region, in which the relative uncertainty of the σw2 estimate is lower than 25%. Arrows in (c,d) indicate local maxima in σw2 and EDR.
Atmosphere 09 00361 g007