1. Introduction
Mountain meteorology and atmospheric chemistry sites are often viewed as large-scale background climate indicators, free of direct influence from land-use changes and human activity. Many mountain observatories, like Mauna Loa on the Big Island of Hawaii for instance, were established in part to measure background or “baseline” atmospheric conditions of key meteorological variables and trace gases known to modify climate. These measurements require exposure to free tropospheric air masses, minimally influenced by local surface processes. However, many of the same observatories report regular exposure to planetary boundary layer (PBL) air [
1,
2,
3,
4,
5,
6], which may be transported upwards by a variety of processes. These include PBL convection [
7,
8], anabatic winds [
9,
10] that typically develop under stratified conditions and strong solar radiative forcing, orographic uplift [
4,
5], and synoptically-driven convergence in the PBL [
7]. Quantifying the degree of exposure to PBL air masses will contextualize whether or not, and to what degree, individual mountain sites should be viewed as indicators of background climate and air quality changes.
The exposure of mountain slopes and summits to PBL versus free tropospheric air impacts the air temperature, humidity [
3,
6], wind, air quality [
6,
11] and clouds of that location. Trends in minimum temperatures have been linked to PBL dynamics especially where stable and shallow PBLs form [
12]. It is thus quite plausible that the frequency with which high elevations are exposed to distinct air masses will affect their sensitivity to future changes in climate and air quality. Indeed, [
13] showed that characterizing PBL exposure is key for improving numerical simulations of aerosol concentrations at Whistler Peak, Canada.
In the free atmosphere (i.e., away from the direct influence of mountains), stability and potential temperature increase from the top of the PBL through the entrainment zone (EZ). Potential temperature often increases in the lower free troposphere (FT), too, but subsidence associated with a high pressure ridge is a way that stability can be neutral in the lower FT. Most of the time, humidity is highest in the PBL, then linearly decreases through the EZ to the value in the lower FT. Humidity, and to a lesser extent temperature, can vary across individual turbulent eddies in the EZ [
7,
8]. Similarly, wind speed is typically slower in the PBL than in the free troposphere, and the EZ exhibits a linear transition of speed between the air masses. This wind speed difference can be large during clear days when low momentum air from the surface convects upward to the EZ. Profiles of wind direction behave similarly to speed and are more variable in the turbulent EZ. At night, wind speed and direction in the residual layer may reach or exceed values similar to the free troposphere after several hours of decoupling from the effects of surface friction [
14].
Along mountain slopes, local surface layer heating/cooling and evapotranspiration can create meteorological differences with the free atmosphere at the same altitude over adjacent valleys. These differences are typically weakest when winds are strong and the flow is perpendicular to the mountain barrier [
15]. When winds are weak, sensible heating can develop buoyant surface layers that move upslope in relatively stable conditions, or convect vertically away from the slope in neutrally stable environments [
16]. During clear conditions, lower slopes are cooler than over the valley in the morning before strong insolation, and are warmer than over the valley in the afternoon when the ground is still relatively warm from daytime insolation [
17]. On the San Bernardino mountain slopes during the summer and fall, temperatures can be 1–5 °C warmer and mixing ratios 0.5–2.0 g kg
−1 higher than over the valley [
18]. Strong linear relationships (r
2 > 0.90) between the free atmosphere and slope temperatures were also found, but weaker relationships (r
2 ~ 0.48–0.77) for mixing ratio due to the influence of low-level maritime air masses [
18]. For humid, forested slopes, evapotranspiration is a primary control on differences in humidity [
8].
The effects of surface heating/cooling, friction, and orographic flow distortion can impact the elevation of air mass transitions along mountain slopes. The manner in which air flows over or around a mountain depends upon the vertical wind profile, the atmospheric stability structure, and the shape and height of the mountain [
15], and the Froude number is frequently used to diagnose the manner in which air will flow over or around an orographic obstacle [
7]. Low stability allows for more depth of an impinging air mass to flow over, as opposed to around, a mountain, thus causing PBL air to rise higher along the slopes [
7]. With increasing wind speed with height, a standing eddy or lee rotor can form and lift PBL air upward along the lee slopes [
7]. A more uniform wind speed profile typically results in minimal change in PBL height around the mountain [
7]. A more prominent mountain is more likely to see flow move around it than up its slopes, while a flatter, elongated ridge line is more effective at lifting air up its slopes. Lower stability typically results in more turbulence [
7], especially on the lee side, which helps to mix EZ and FT air downward and, theoretically, lower and increase the depth of the EZ in the presence of sufficient wind speed.
Local impacts on slope temperature, humidity and wind can complicate differentiating air mass type and air mass changes on a mountain. Despite the importance of understanding air mass exposure on surface conditions (e.g., for baseline measurements, for interpreting high-elevation variability), discriminating air masses is challenging. In addition, there are differences between windward and leeward slopes and turbulent motions may cause frequent changes in wind direction and shifts in the type of air mass on a mountain slope. Limited surface weather stations typical of montane regions may not be optimally placed to provide enough data to confidently discriminate PBL height and air mass type.
The goals of this study are to elucidate the ways in which the PBL-to-EZ-to-FT transition is modified by mountains and to help inform observational methods for robustly resolving these air mass transitions along mountain slopes. This observational case study examined variations in the evolution of atmospheric profiles on windward and leeward slopes of Mount Washington, New Hampshire and compared them to free air profiles during an intensive observation period (IOP) in late summer 2016. Extensive meteorological observations at the summit, along the west and east slopes, as well as surface profiling from mobile platforms and free air profiling with radiosondes, provided the tools necessary to evaluate air mass types and the unique character of their transitions along the mountain slopes. The ability to characterize air mass type near the summit of Mount Washington is important not only for qualifying the Observatory’s potential to provide baseline measurements of the FT, but also for evaluating the processes that make high-altitude environments uniquely sensitive to perturbations in climate and air quality.
2. Methods and Experiments
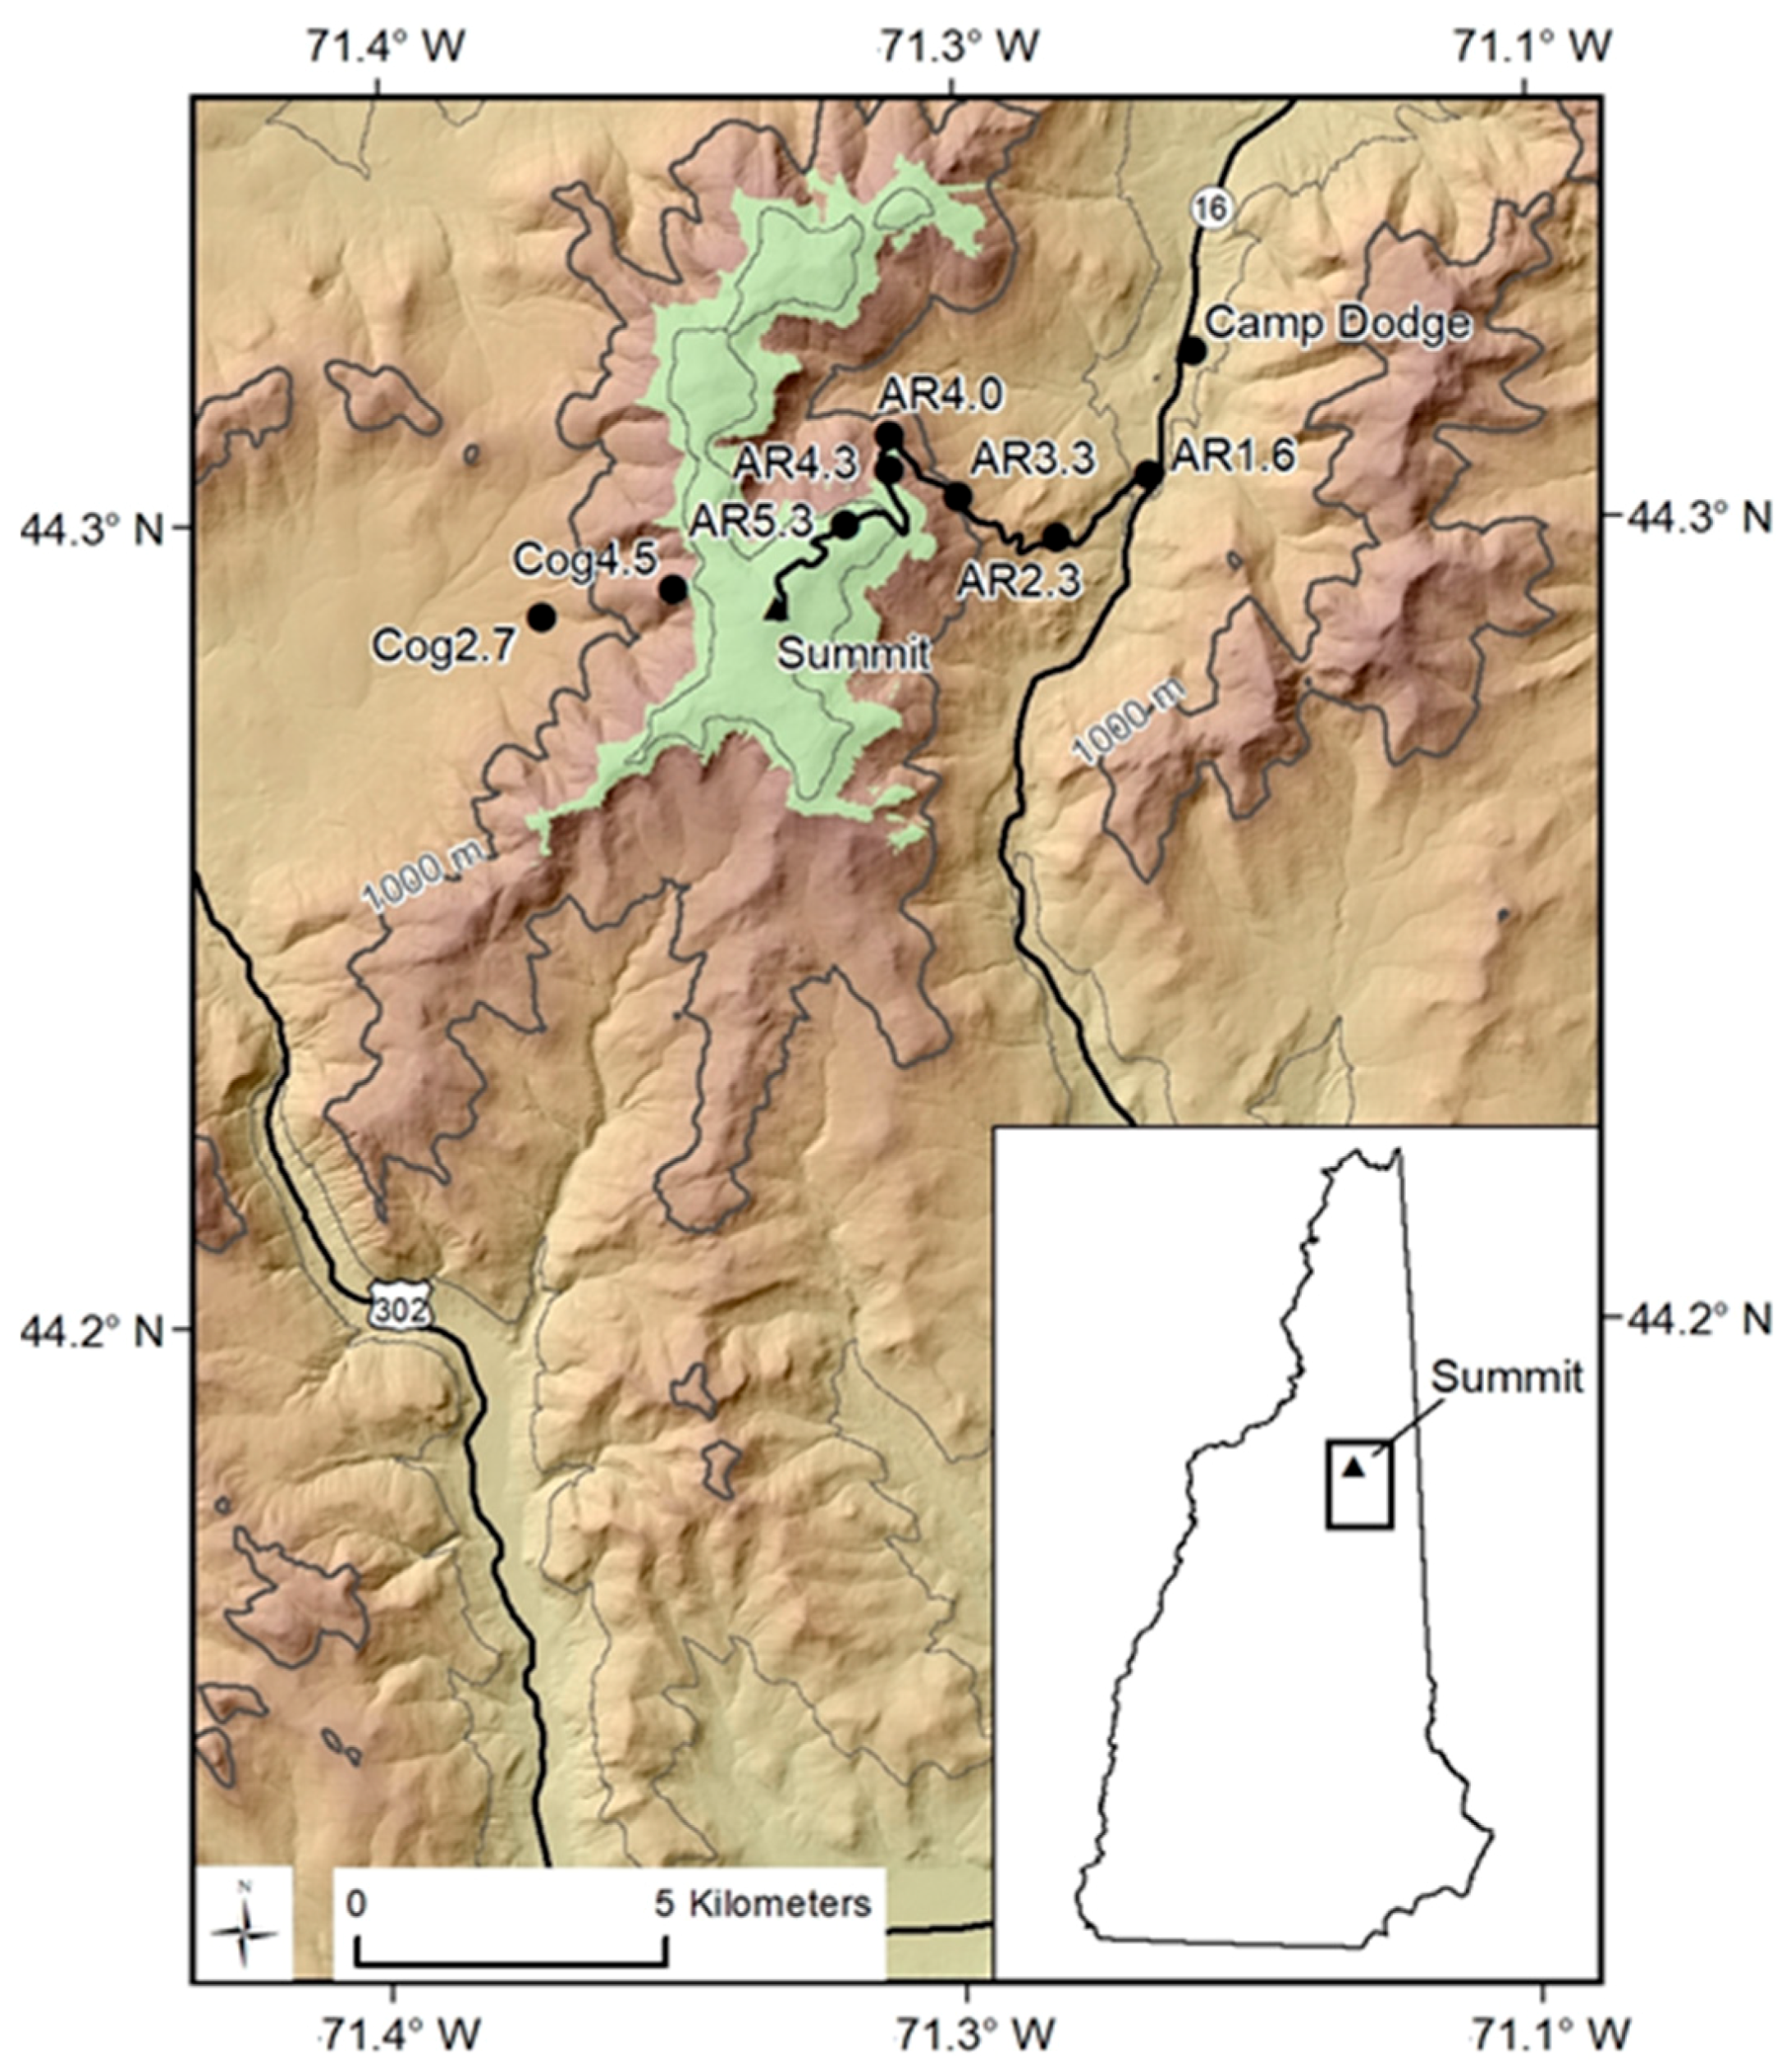
Mount Washington, New Hampshire, USA (44.2706° N, 71.3033° W, 1917 m asl,
Figure 1) is the tallest mountain in the Northeastern US and southeastern Canada. The summit is home to the longest continuously running mountaintop observatory in the US, Mount Washington Observatory (MWO; est. 1932). The summit facility is staffed year-round with Observers who meticulously observe and archive over a dozen meteorological variables each hour and report them to the National Weather Service (meteorological station identifier: KMWN). Hourly temperature and humidity have been measured with a mercurial sling psychrometer since 1932 [
2]. Also on the summit are a Campbell Scientific CS215 sensor (Campbell Scientific, Logan, UT, USA) that measures temperature and relative humidity and a Campbell Scientific T107 sensor (Campbell Scientific, Logan, UT, USA) that measures temperature every minute. A custom pitot static tube anemometer with two pressure transducers (0–6 and 0–30 inches of water) measures wind speed when winds are greater than ~11 m s
−1 and an RM Young anemometer is used when winds are less than ~11 m s
−1. A separate heated custom wind vane located ~1 m from the anemometers is used to measure wind direction. The prevailing wind is west-northwest, with winds reported from the west or northwest directions 70% of the time [
19]. Ozone concentrations are also measured by the Air Resources Division of the New Hampshire Department of Environmental Services in a summit building near the Observatory. During the summer season, concurrent measurements of ozone are made near the valley bottom at the US Forest Service Camp Dodge facility, at 450 m elevation asl on the east side of the mountain.
In addition to the summit weather station, MWO operates six mesonet stations along the 12.2 km-long Mount Washington Auto Road (a privately-owned toll road), which is predominantly on an east-facing slope, and two along the Cog Railway tracks on the west-facing slope. The automated weather stations along the Auto Road are located at 1600, 2300, 3300, 4000, 4300 and 5300 feet asl (488, 701, 1006, 1219, 1311, and 1615 m asl, respectively). Temperature and relative humidity are also measured near the Cog Railway on the west side of Mount Washington by automated weather stations at 2644 and 4500 feet asl (806 and 1372 m asl, respectively). The locations of these weather stations are shown in
Figure 1. All mesonet sites measure temperature and relative humidity with a Campbell Scientific CS215 sensor and temperature with a Campbell Scientific T107. Both Cog Railway sites, AR1600, AR4000 and AR5300 also measure wind using RM Young propeller anemometers. The naming convention for the Auto Road and Cog railway sites is “AR” or “Cog” followed by the site elevation asl in feet: AR1600, for example. With the exceptions of the two base stations (AR1600 and Cog2644), the mesonet stations are solar powered.
AR1600 is located in a large clearing in the valley on a mast extending off the north end of a peaked metal roof building. The height of the CS215 and T107 sensors is 5 m agl and the RM Young anemometer is 6.5 m agl. The sensors at the other stations along the Auto Road are mounted on tripods within 6 m of the road. AR2300 and AR3300 are located below treeline and are sheltered by the forest, except on the road side. AR4000, AR4300, and AR5300 are located above tree line primarily surrounded by boulders and rocks, bigelow sedge and other low stature grasses and shrubs. Cog2644 is located in a ~15 m diameter clearing in a forest. Cog4500 is mounted on a mast on the end of a small wooden building about 5 m by 3 m and 4 m tall.
On 19 August 2016, an IOP was performed to capture a detailed evolution of the PBL, EZ, and FT along the slopes of Mount Washington and over adjacent valleys. In addition to the existing meteorological observations on the mountain mentioned above, water vapor isotope ratios (δD and δ
18O) were measured using a Picarro L2120-i laser analyzer (Picarro, Santa Clara, CA, USA). Except during condensation and evaporation, δD and δ
18O are conserved variables that reflect the condensation history of an air mass and can be used to differentiate PBL versus FT air [
20,
21,
22,
23,
24,
25]. During the IOP, the isotopic analyzer was driven in a truck up and down the Auto Road along the eastern slopes of Mount Washington. Six full round trips (each approximately 60–80 min long) captured along-slope vertical profiles of water vapor δD and δ
18O and the water vapor volume mixing ratio, as well as the evolution of these profiles over the course of the day. Isotopic measurements were corrected for concentration biases and calibrated to the internationally recognized Vienna Standard Mean Ocean Water—Standard Light Antarctic Precipitation scale [
24].
To measure free air vertical profiles of temperature, relative humidity, wind and pressure, radiosondes were launched from the base of the Auto Road, which lies at the center of the valley to the east of Mount Washington. Launches occurred six times during the day at 0424, 0715, 1126, 1547, 1825, and 2008 Eastern Standard Time (EST), approximately 10–20 min after the truck left the base to measure profiles of the water vapor volume mixing ratio and isotope ratios. The lagged timing of the launches allowed the truck to reach treeline or higher by the time the radiosonde reached treeline altitude. The radiosonde profiles were compared with the surface meteorological data to elucidate the differences between the mountain surface air and the free atmosphere.
3. Results
On 19 August 2016, skies across the White Mountain region of New Hampshire were mostly clear with a north-south oriented ridge of high pressure stretching from western New York southward through the Appalachian Mountains. Upper air maps (not shown) suggest a weak cold front, associated with a trough over Québec, had passed through northern New Hampshire the night before (~1900 EST 18 August), causing a small decrease in dewpoint temperature. The station pressure at the summit rose slowly and steadily all day from 809.0 to 810.5 hPa as the ridge approached; however, the centerline of the high pressure ridge did not arrive at Mount Washington until the next day (20 August). As the Québec trough moved eastward away from New England, the 700 hPa height gradient relaxed and 700 hPa wind speeds decreased from 13–15 m s−1 to about 3–5 m s−1 during the morning.
Although skies were mostly clear regionally, the summit of Mount Washington was in the clouds during the early morning of 19 August with winds sustained between 12–17 m s
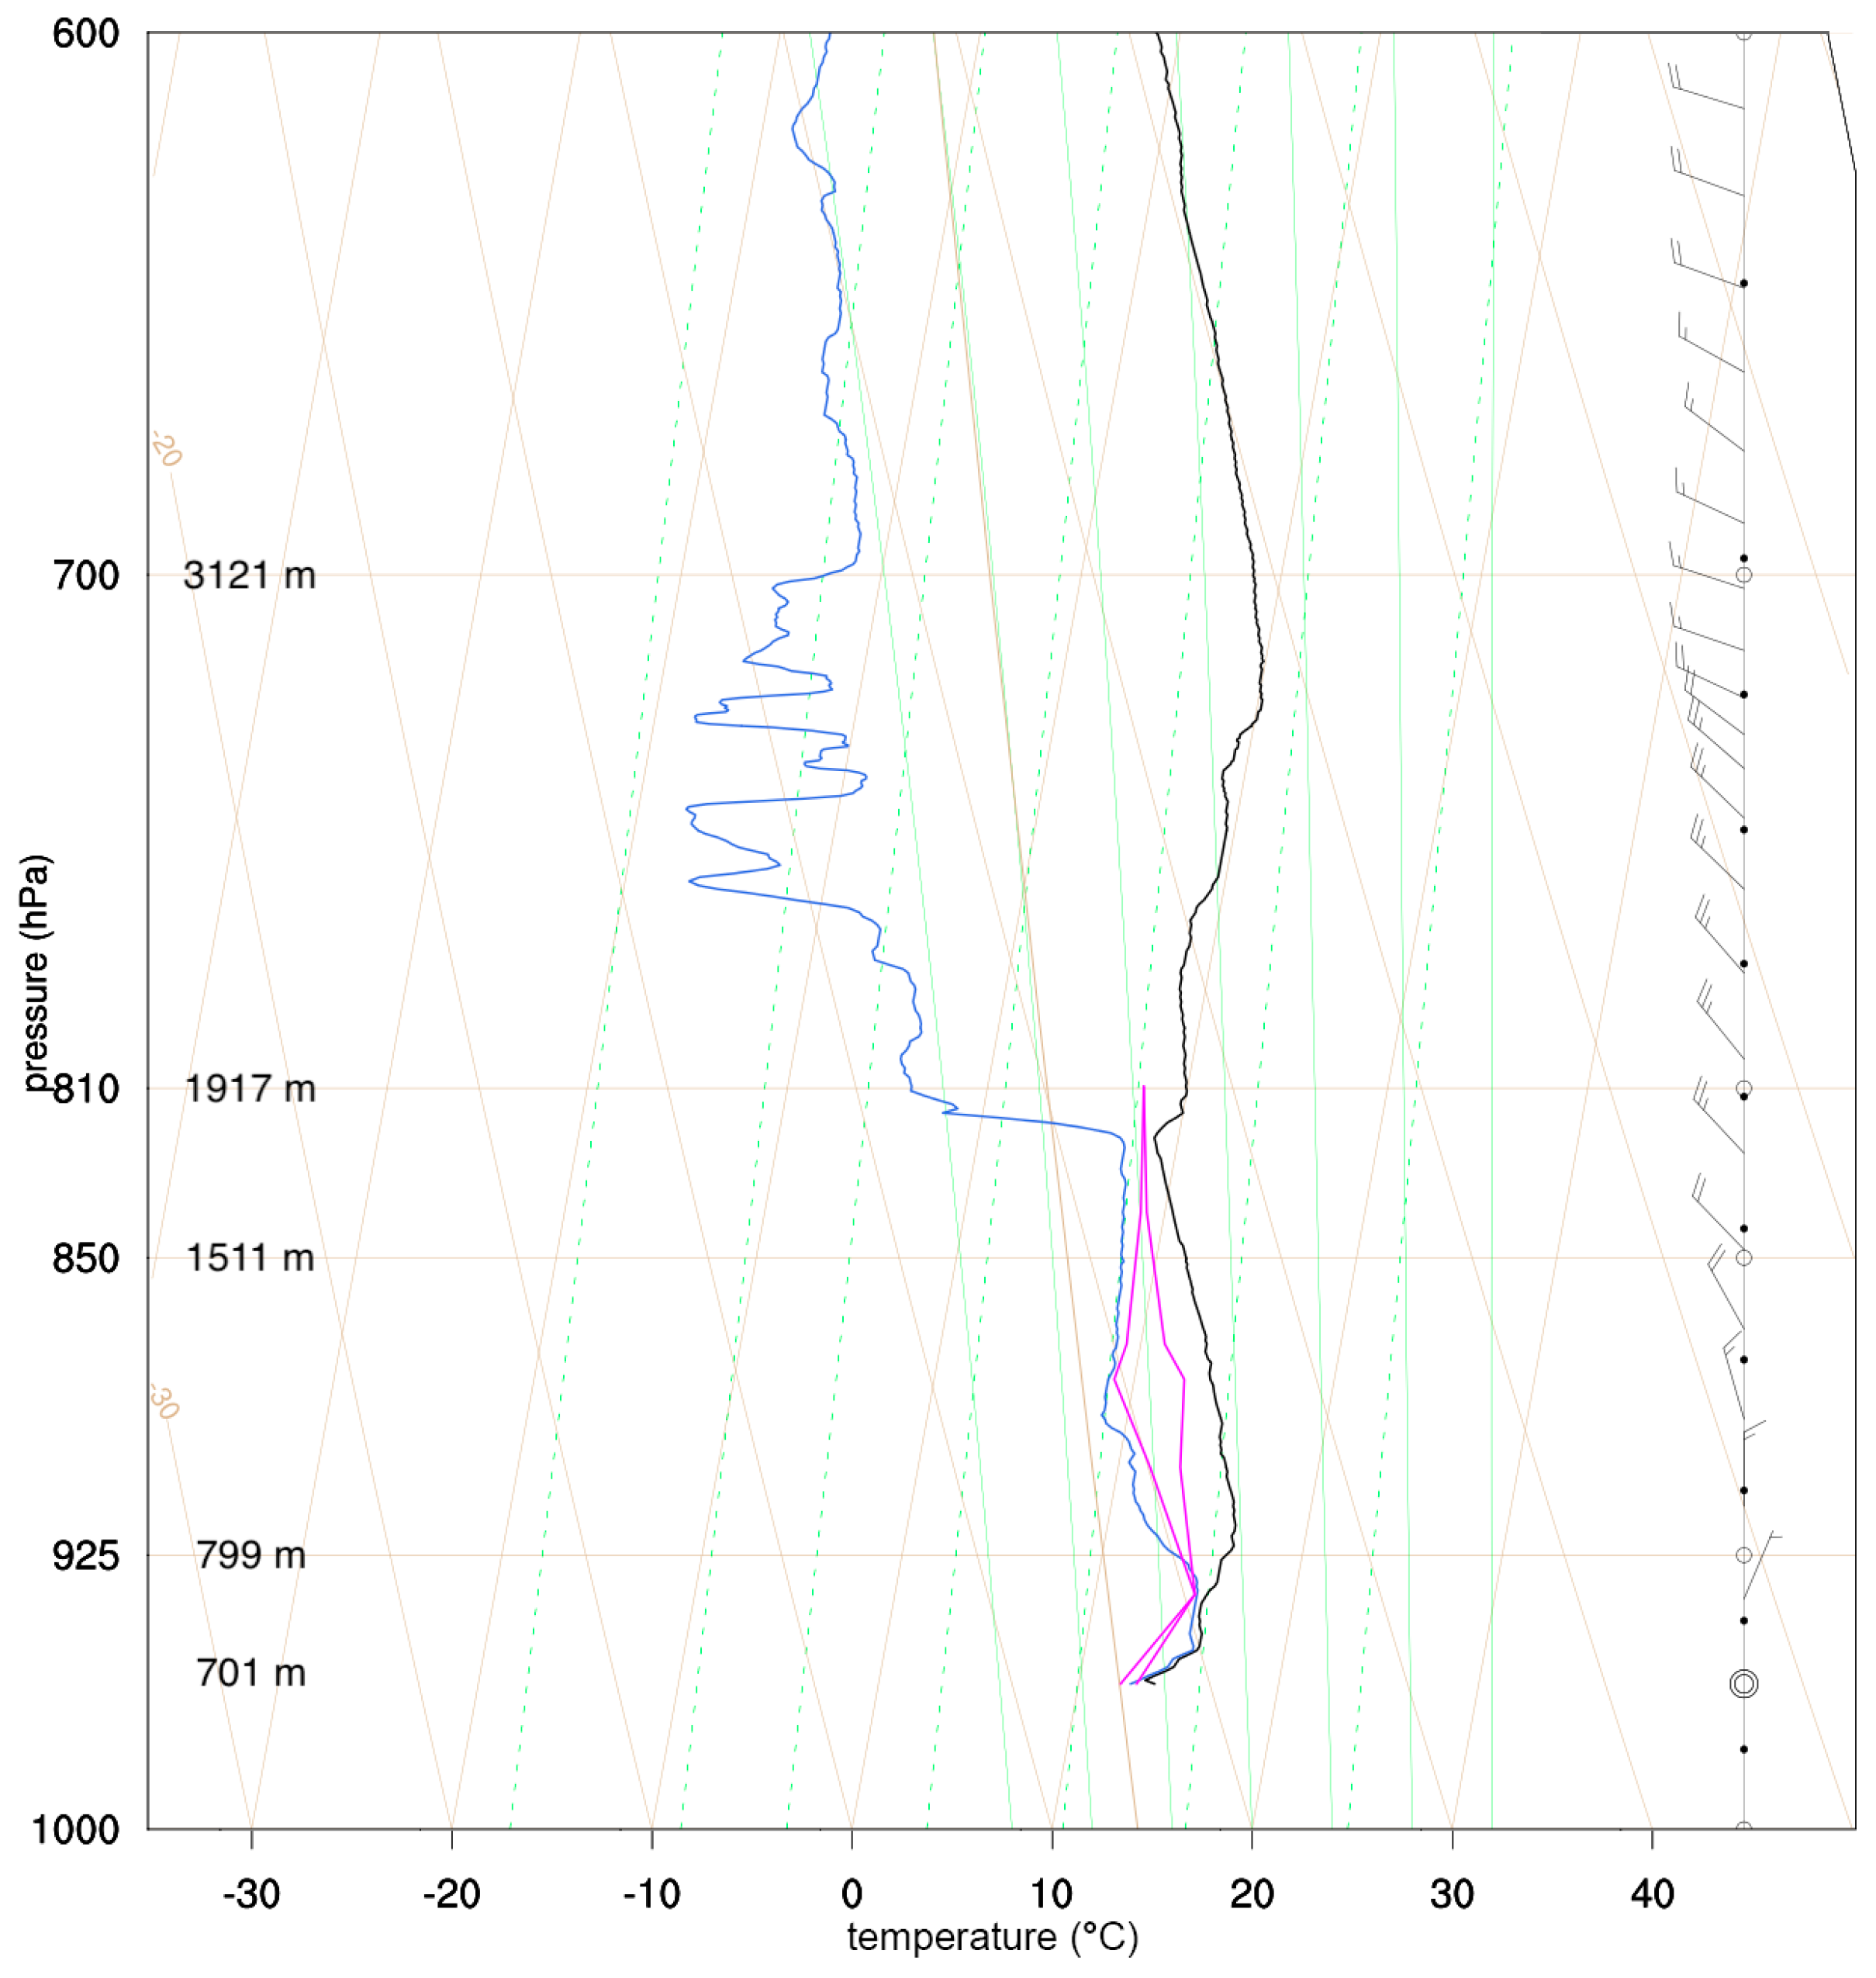
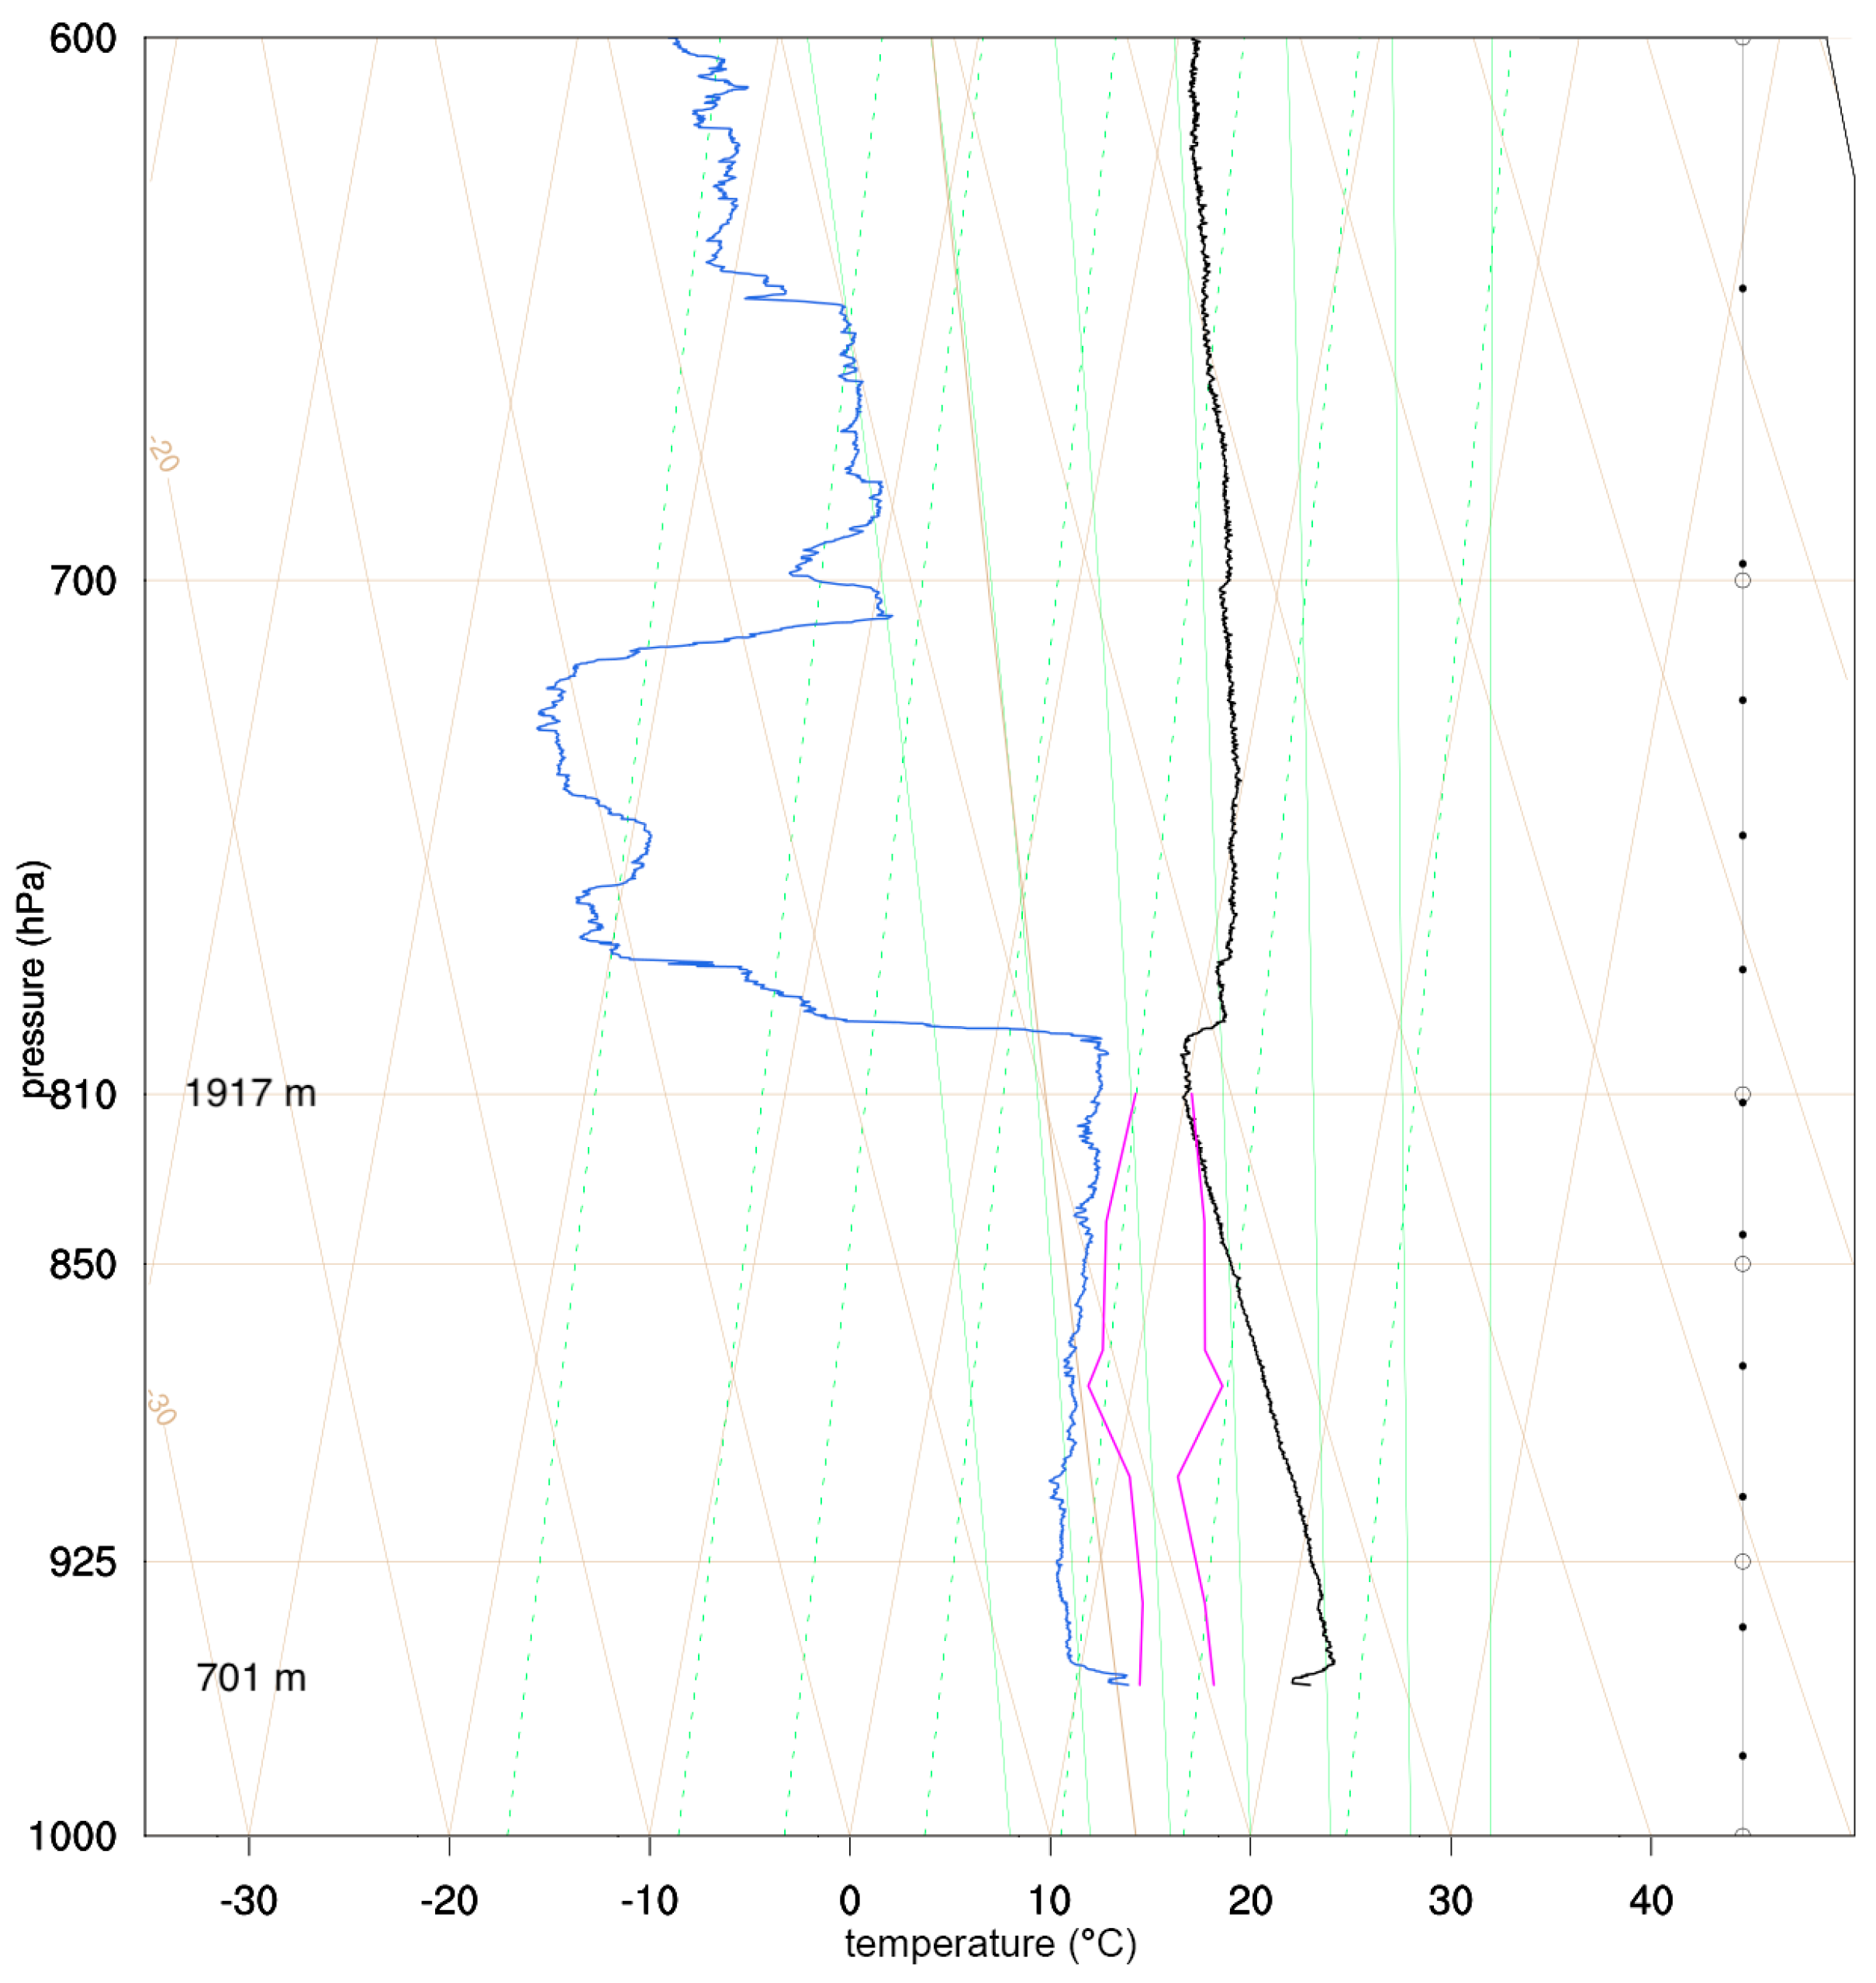
−1 from the west-northwest gradually turning to the northwest (not shown). Profiles of temperature and dewpoint measured by a radiosonde launched at 0424 EST from the base of the Auto Road indicate that a residual layer had formed between 890–820 hPa (
Figure 2)—~10 hPa below the summit altitude. However, the summit temperature and dewpoint (both 8 °C) were 2 °C cooler and 13 °C higher, respectively, than free air at the same height over the valley, indicating that the summit was exposed to residual layer air forced upslope from below. The low stability of this residual layer (
Figure 2) is consistent with this assessment. In the east valley of Mount Washington, clear skies and light winds during the night had allowed radiational cooling to create a cold pool that reached up to 600 m asl (
Figure 2).
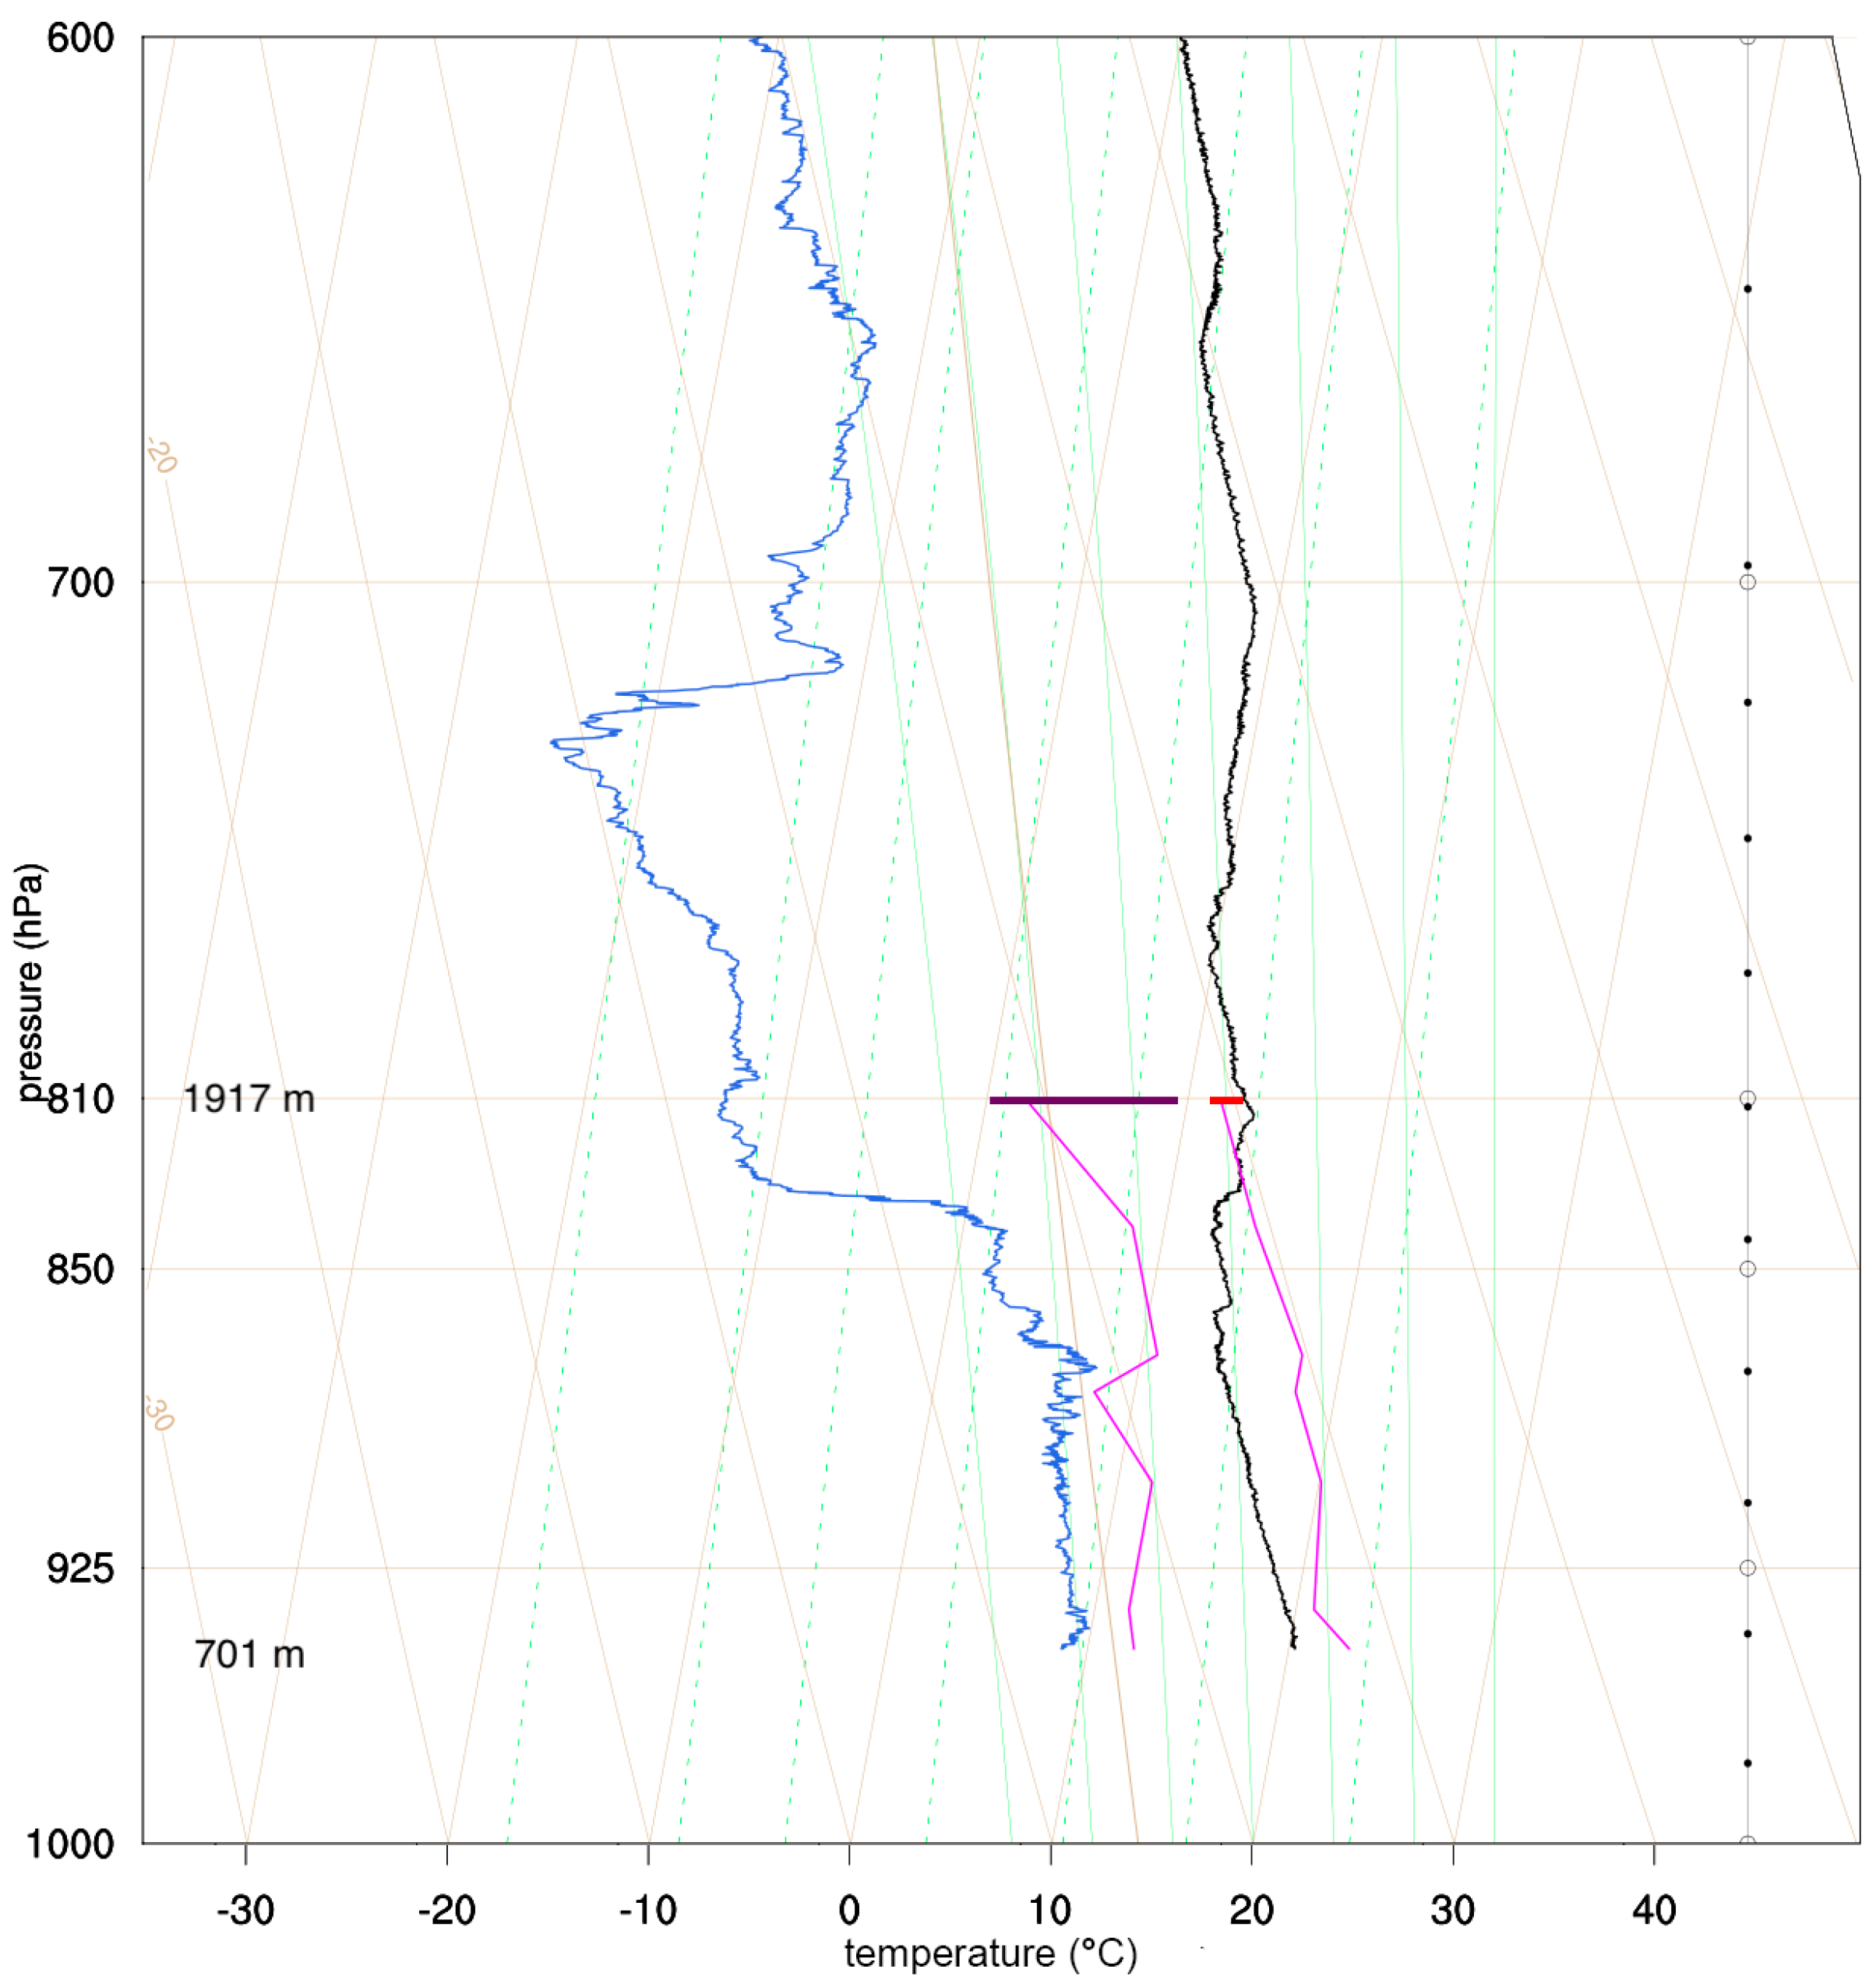
Radiosonde measurements suggest the height of the residual layer in the free atmosphere—which by late morning became a part of the new convective PBL—decreased in altitude to ~860 hPa by 1126 EST (
Figure 3). Synoptic-scale subsidence and low-level divergence associated with the approaching ridge likely lowered the boundary between the residual layer and capping inversion across the region. As a result, summit wind speed decreased to <7 m s
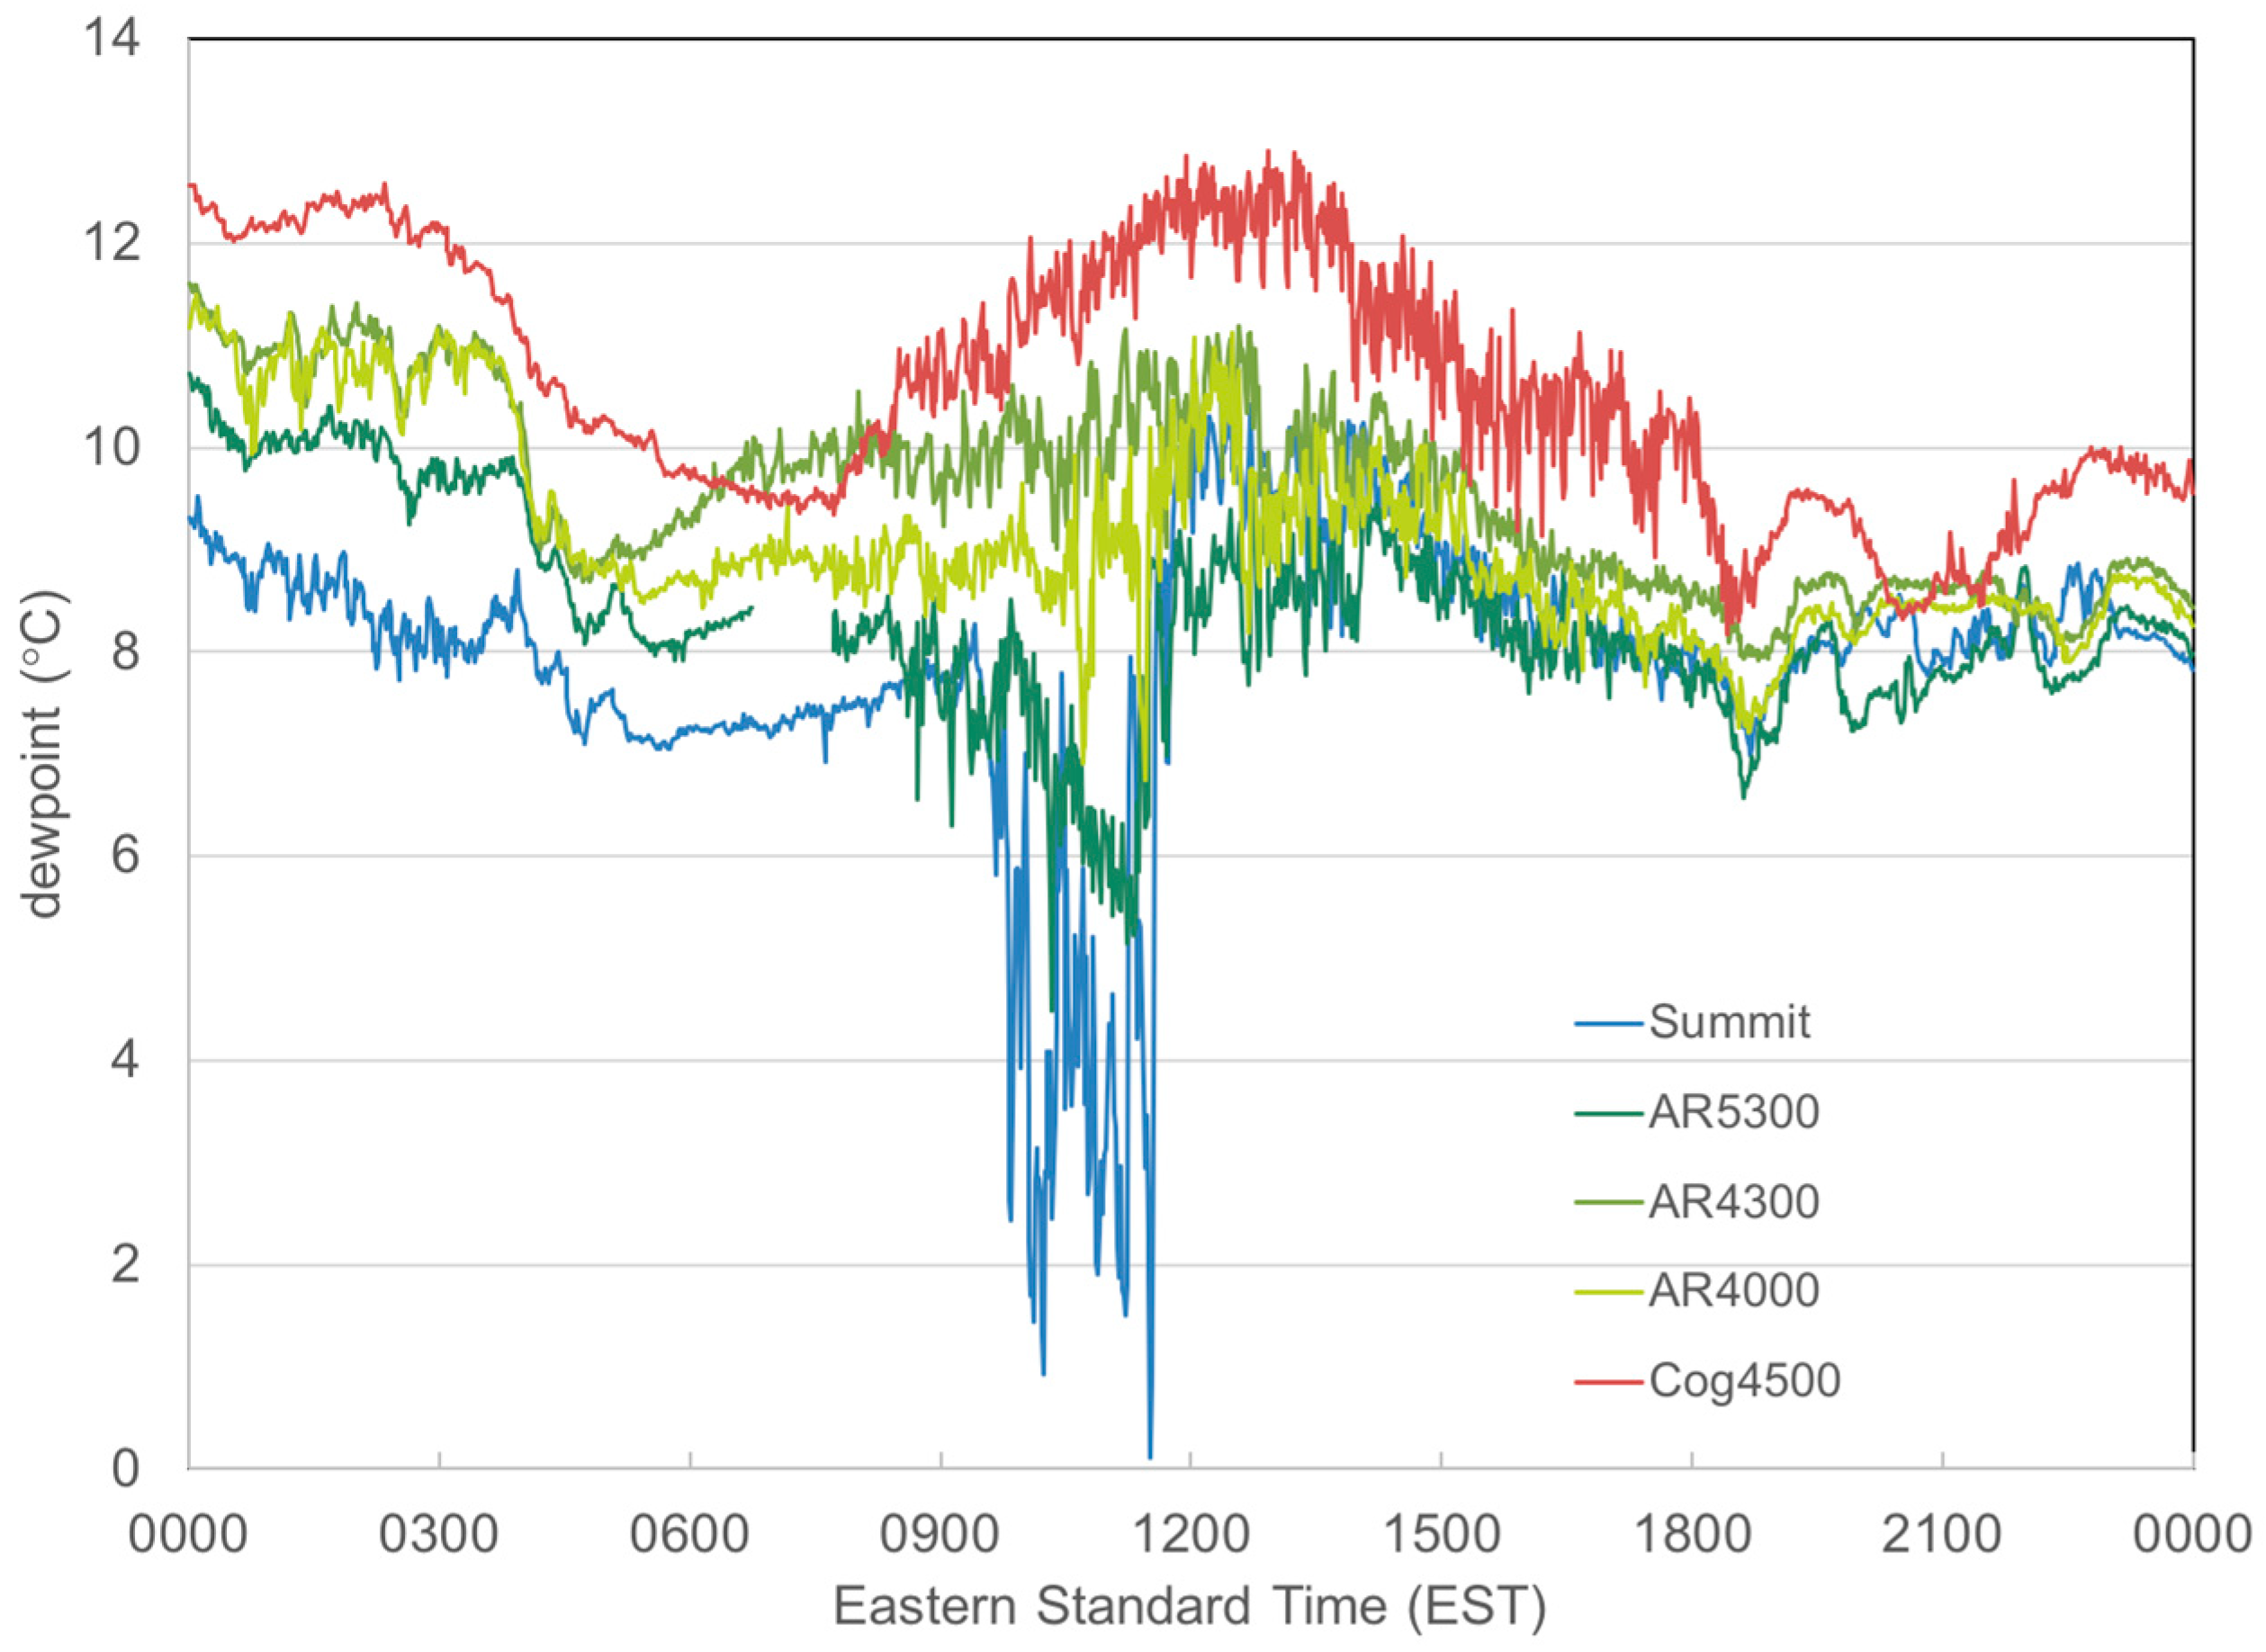
−1 by 1000 EST and the dewpoint dropped from 8 °C to as low as 0 °C and became highly variable between 0945 and 1200 EST (
Figure 4). These changes indicate the EZ descended to the altitude of the summit during the late morning hours. Indeed,
Figure 3 shows that the range in summit dewpoint during 1126–1136 EST, around the time of the 1126 EST radiosonde launch, matches well with values in the EZ air of the free atmosphere between 860–830 hPa. In contrast, the highest summit dewpoint values recorded during late morning (~9 °C) are indicative of PBL air from below, suggesting humid anabatic flow continued to mix with the EZ air at the summit. Consistent with this assessment is that the summit temperature is approximately equal to or slightly warmer than adiabatically lifted air from this same layer.
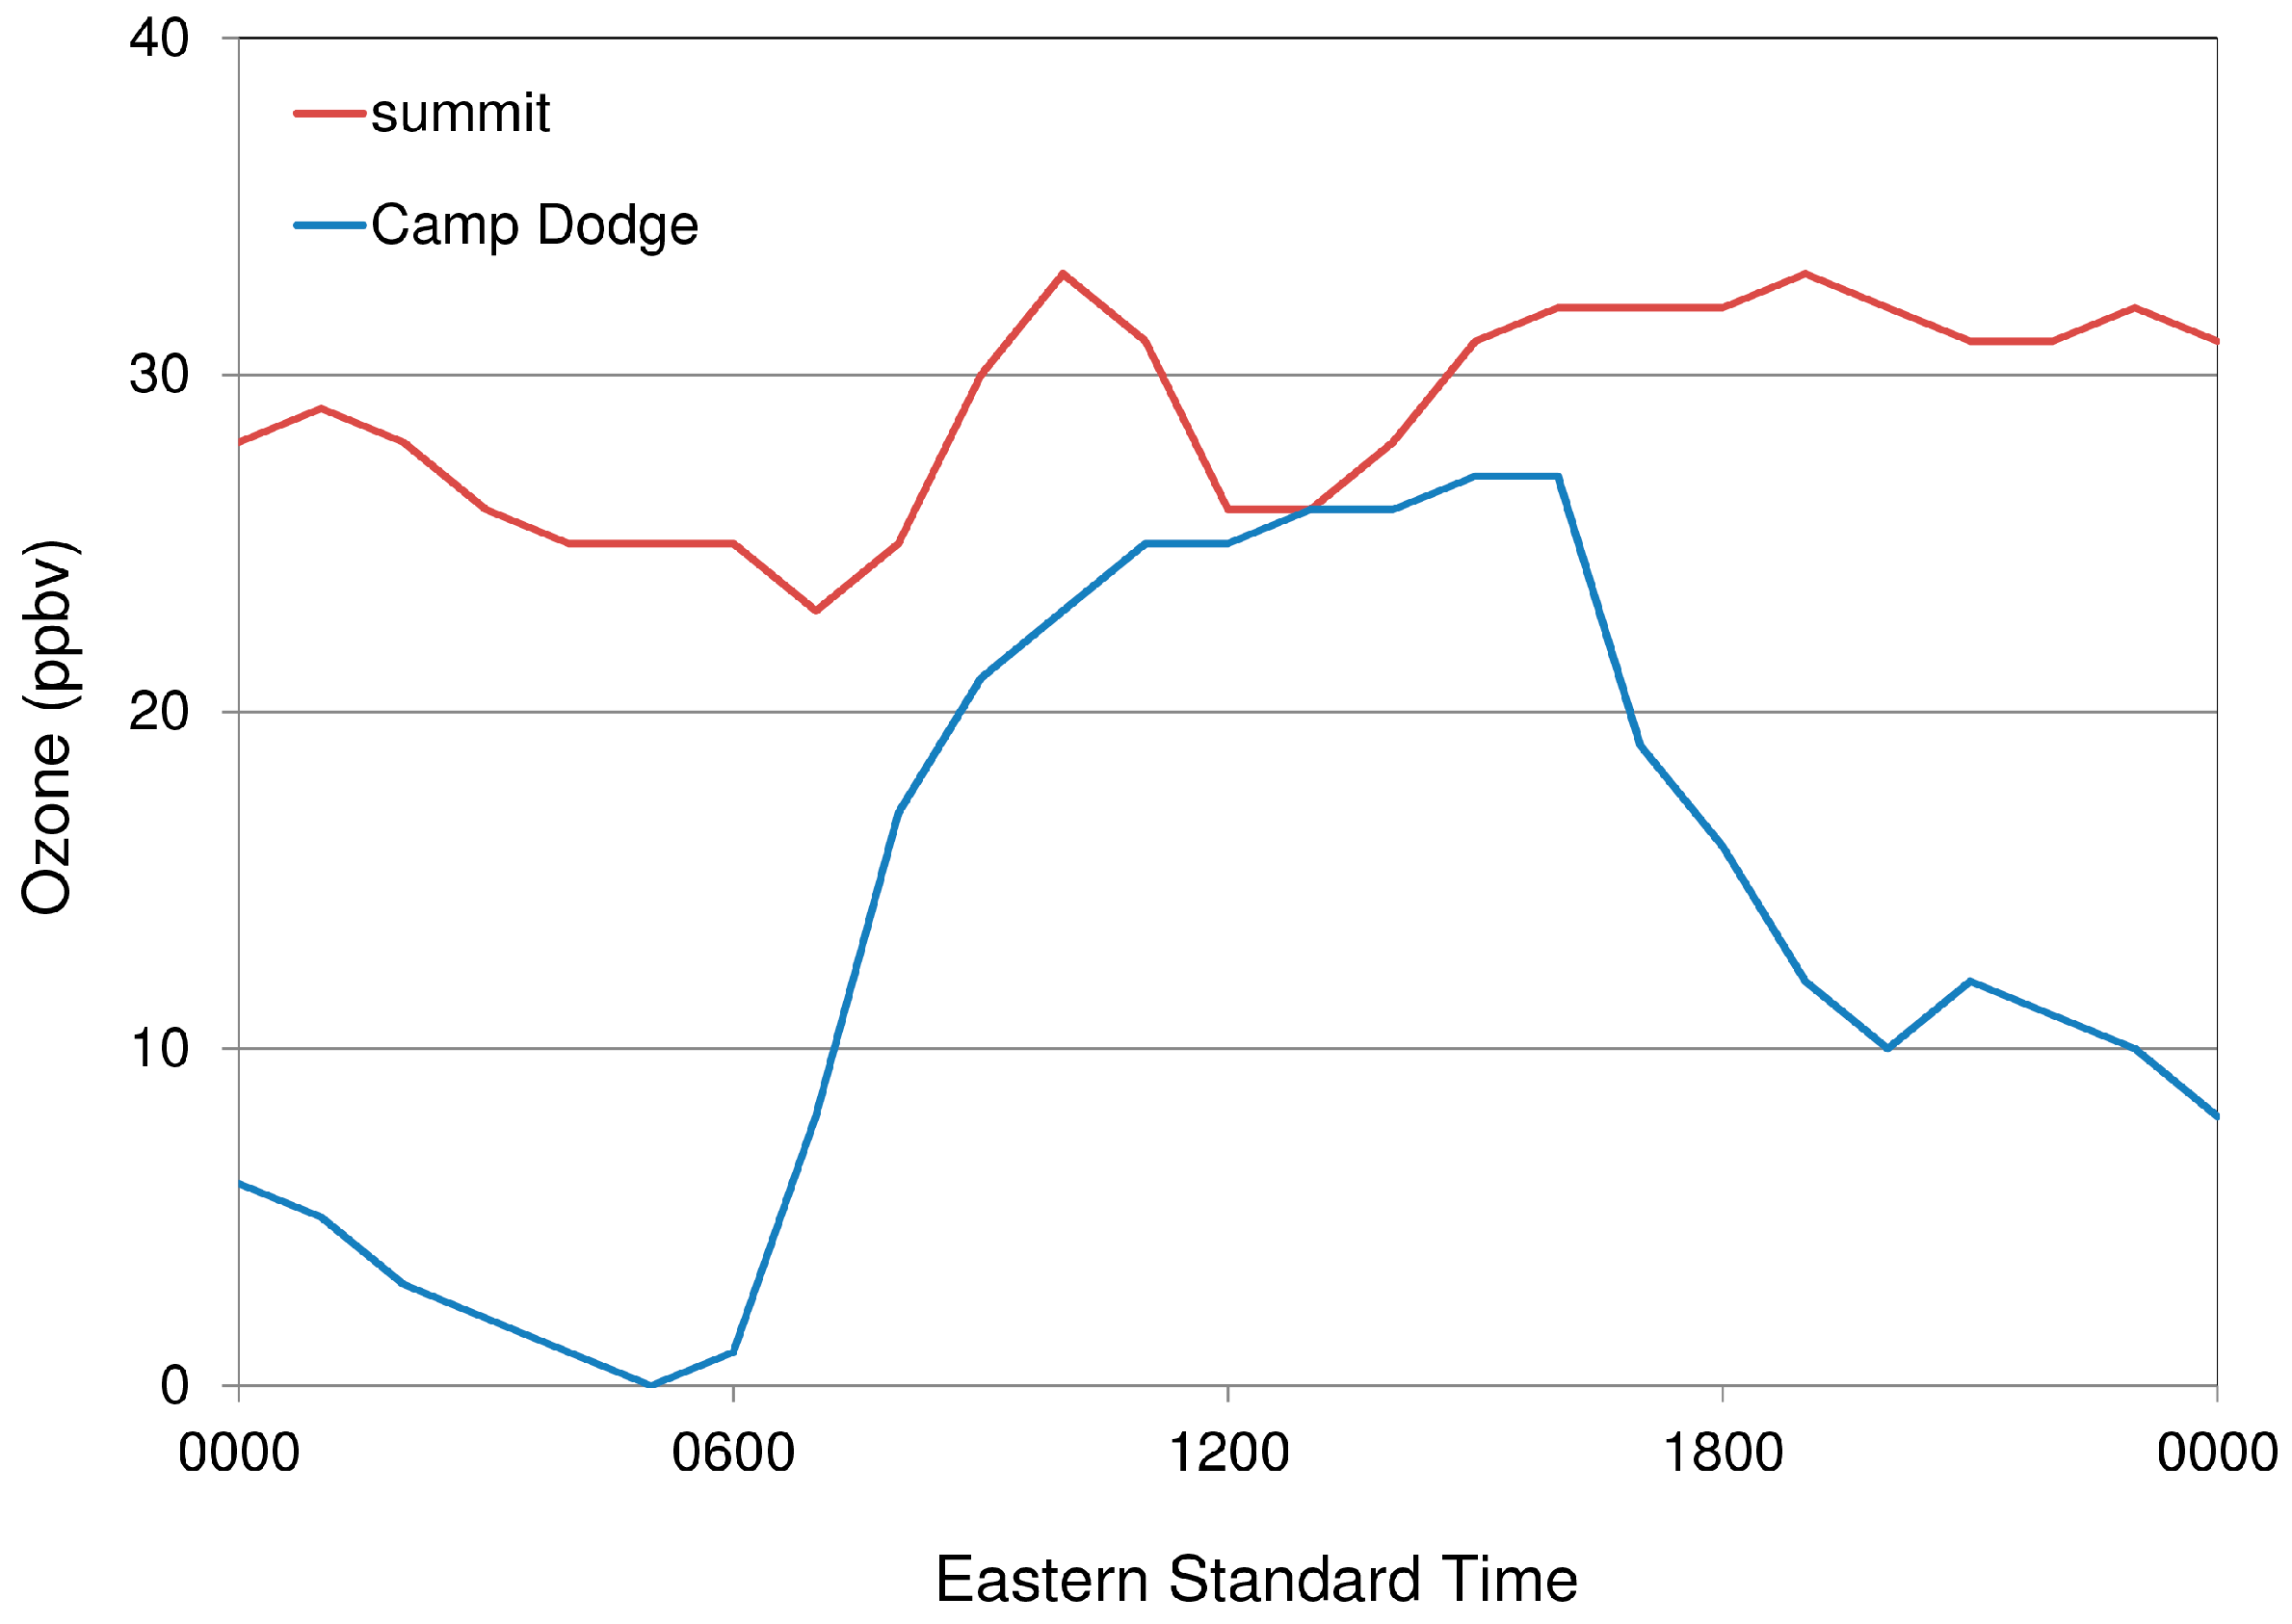
Evidence of the EZ descending to the summit is also supported by ozone measurements at the summit and by the profiles of water vapor isotope ratios along the Auto Road. Summit ozone peaked during 1000–1100 EST (
Figure 5); ozone concentrations are often elevated within the EZ due to residual overnight transport of urban air pollution [
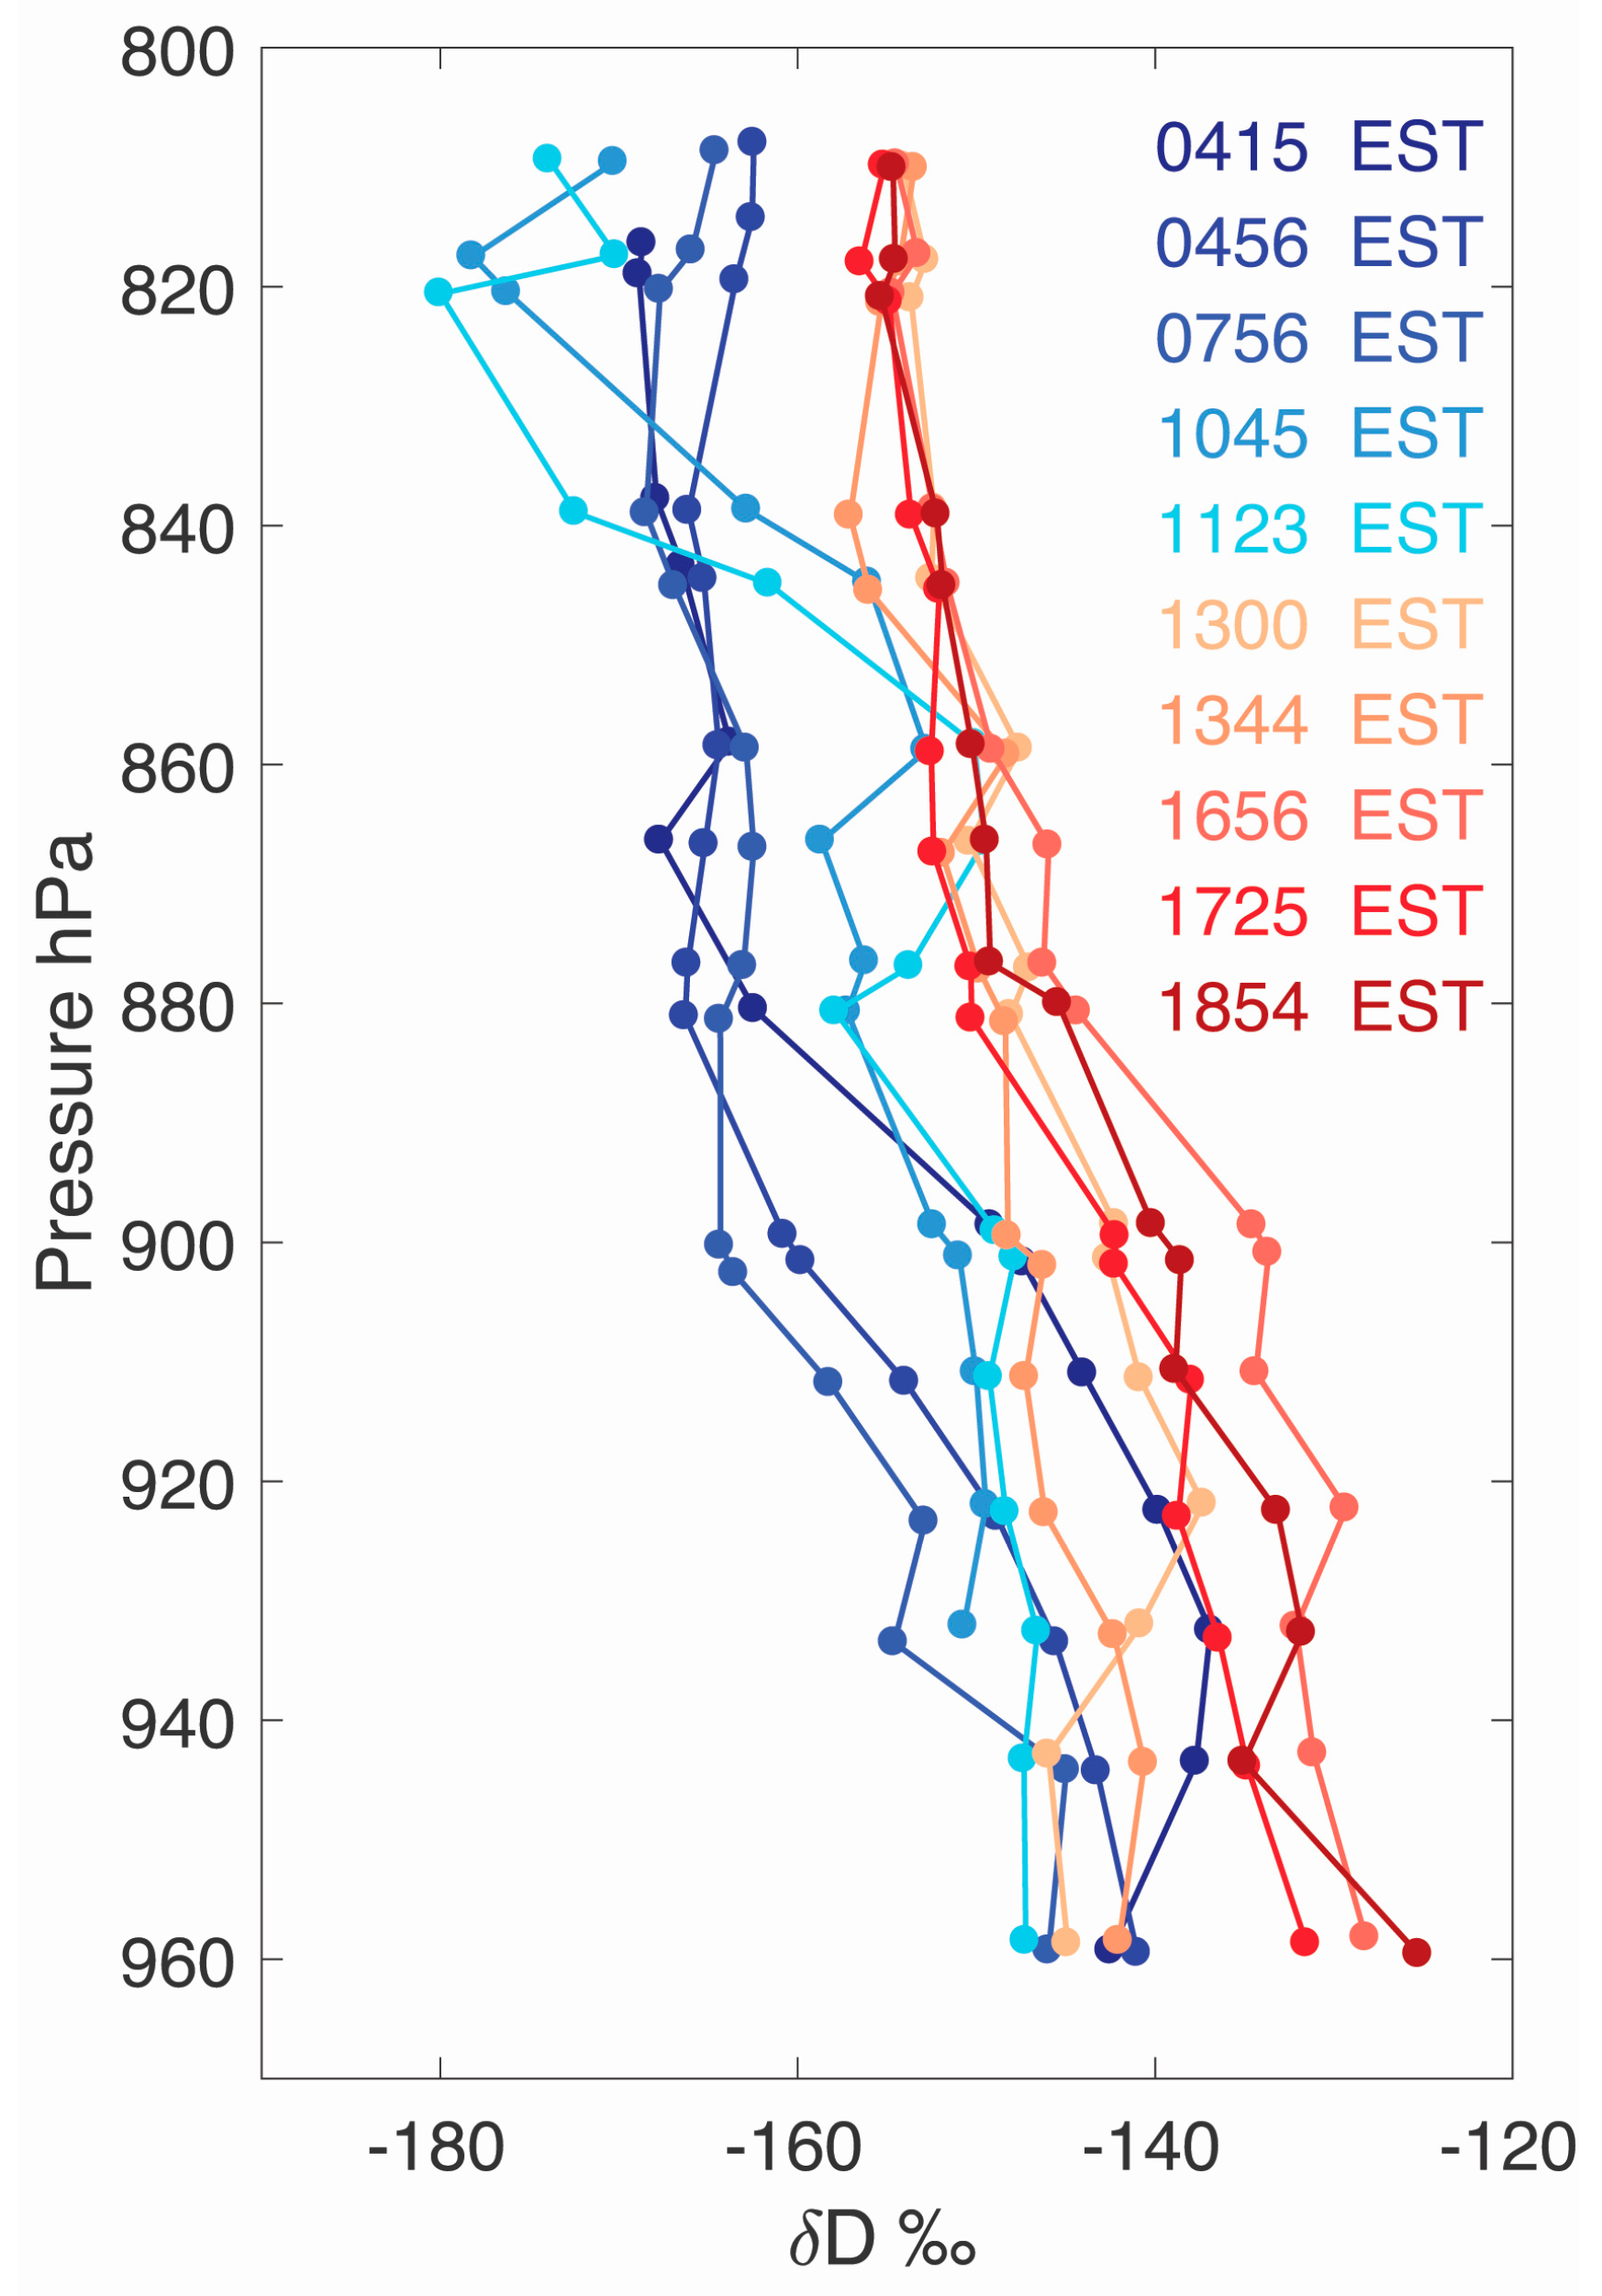
26]. Meanwhile, the vertical profiles of δD along the Auto Road from 1045 and 1123 EST show a dramatic decrease in δD of 10–25‰ affecting the top 300 m of the mountain (
Figure 6). Not only are lower δD values consistent with higher elevation air, but the fact that the decrease in δD was so large, compared to changes observed throughout the day, is also clear evidence that the summit was exposed to a distinct air mass at this time.
Episodic mixing of drier FT air was observed on the leeward side of the mountain at stations as low as AR5300 and AR4000 (1615 m and 1219 m asl) along the Auto Road when winds around the mountain were generally northwest to north at 1–4 m s
−1. On the windward side (i.e., the west side), mixing of dry FT air was not observed (
Figure 4). The low stability of the upwind free atmosphere likely facilitated flow over the Presidential Range and weak föehn flow [
10,
15] on the lee side of the mountain with periodic transport of drier EZ air downward. These observations indicate the mountain influenced the PBL development (differences on 2 sides) in the presence of a synoptic-scale forcing.
As the convective PBL grew to the summit elevation around 1200 EST, the summit dewpoint rebounded quickly to 8–10 °C and began to covary with AR5300, AR4300, and AR4000 dewpoint values (
Figure 4). EZ air ceased reaching these 4 sites in a span of 20 min, indicating rapid vertical growth of the convective PBL along the slopes of the mountain. Moreover, ozone concentrations at the summit and valley converged at 1200 and 1300 EST, indicating thorough mixing across the depth of the PBL. Concentrations diverged thereafter as ozone was eliminated in the valley due to surface deposition and photochemical reactions [
27].
Radiosonde profiles also show that the free air PBL grew past the summit elevation by 1547 EST (not shown). A dry adiabatic layer from the surface up through 798 hPa (~120 m above the summit)—the deepest surface-based convective PBL of the 6 radiosonde profiles—was observed at 1825 EST (
Figure 7). PBL height estimated by snow-level radar observations over Plymouth, New Hampshire, approximately 65 km to the southwest of Mount Washington (not shown), is consistent with the IOP observations. Additionally, the 0000 UTC (1900 EST) 20 August radiosonde profile (not shown) from the National Weather Service in Gray, Maine, 80 km to the southeast of Mount Washington, is remarkably similar in its temperature and dewpoint structure and height of the convective PBL. Given the strong synoptic-scale subsidence associated with the ridge, we thus speculate that the height of the convective PBL was relatively homogenous across the White Mountain region at its afternoon peak.
Nevertheless, free air-to-slope differences persisted into the evening when thermals began to cease within the valley and cold air began to pool in the eastern valley. A residual layer was already developing (
Figure 7) at the time of the 1825 EST radiosonde and the summit temperature (10.3 °C) was 0.4 °C warmer than the free air at 810 hPa—slightly warmer as a result of anabatic flow and surface heating throughout the day. Anabatic flow and/or local evapotranspiration also caused the summit dewpoint to remain higher than free air values in all but the lowest ~200 m above the valley floor. The largest dewpoint differences occurred below treeline where the humidity sensors are located in the more humid and sheltered subcanopy layer. Throughout the day, the free air dewpoint profiles showed only a slight decrease from the base of the mixed layer up to the EZ, which strongly suggests thorough mixing occurred.
4. Discussion
With continuous mountaintop weather observations since the 1930s and regular exposure to both the PBL and the FT, Mount Washington is a unique location for elucidating the processes that shape mountain weather and for evaluating climate changes in complex terrain. However, interpreting these changes requires a clear understanding of the type of air mass to which the summit is exposed. Not only are air masses characterized by distinct thermodynamic properties, which can result in different convective and radiative behaviors, but their unique trajectories—in vertical and horizontal coordinates—can expose the mountain’s sensitive alpine zone to a variety of pollution sources and concentration levels. [
26], for example, showed a dependence of Mount Washington’s summertime ozone concentrations on regional wind patterns using Lagrangian back trajectories. Little, however, has been done to try to distinguish the summit’s exposure to PBL and free tropospheric air—a distinction critical for process-level studies and baseline monitoring of climate.
What little is known about Mount Washington’s exposure to the PBL and FT is based on early work by [
28], who attempted to distinguish free tropospheric exposure at the summit by categorizing 24-hour periods according to their temperature patterns. “Free tropospheric” days were defined as those in which temperature linearly increased or decreased over the course of the diurnal cycle, under the assumption that temperature variations in the FT are dominated by synoptic-scale advection. Other days, in which temperatures followed a sinusoidal curve, were categorized as “radiative” [
2] then used these categories to estimate the frequency with which the summit is exposed to the PBL: 30–50% of the time in a given year.
This case study points to several shortcomings of the method employed by [
28] and the need for much more sophisticated techniques for distinguishing air mass type in complex terrain. In particular, because 19 August 2016 was a classic example of regional high pressure in which temperatures followed the characteristic “radiative” pattern of [
28], one might reasonably have expected the summit to have remained within the PBL throughout the day, or perhaps to have transitioned from the residual layer of FT to the PBL and back again. While radiosonde launches from the Mount Washington valley suggest equivalent pressure levels in the free atmosphere did transition from the FT to BL as the convective PBL grew, air mass transitions on the mountain were quite different, largely as a result of the mountain’s interaction with at least three processes: convection, synoptic-scale wind, and synoptic-scale subsidence and divergence.
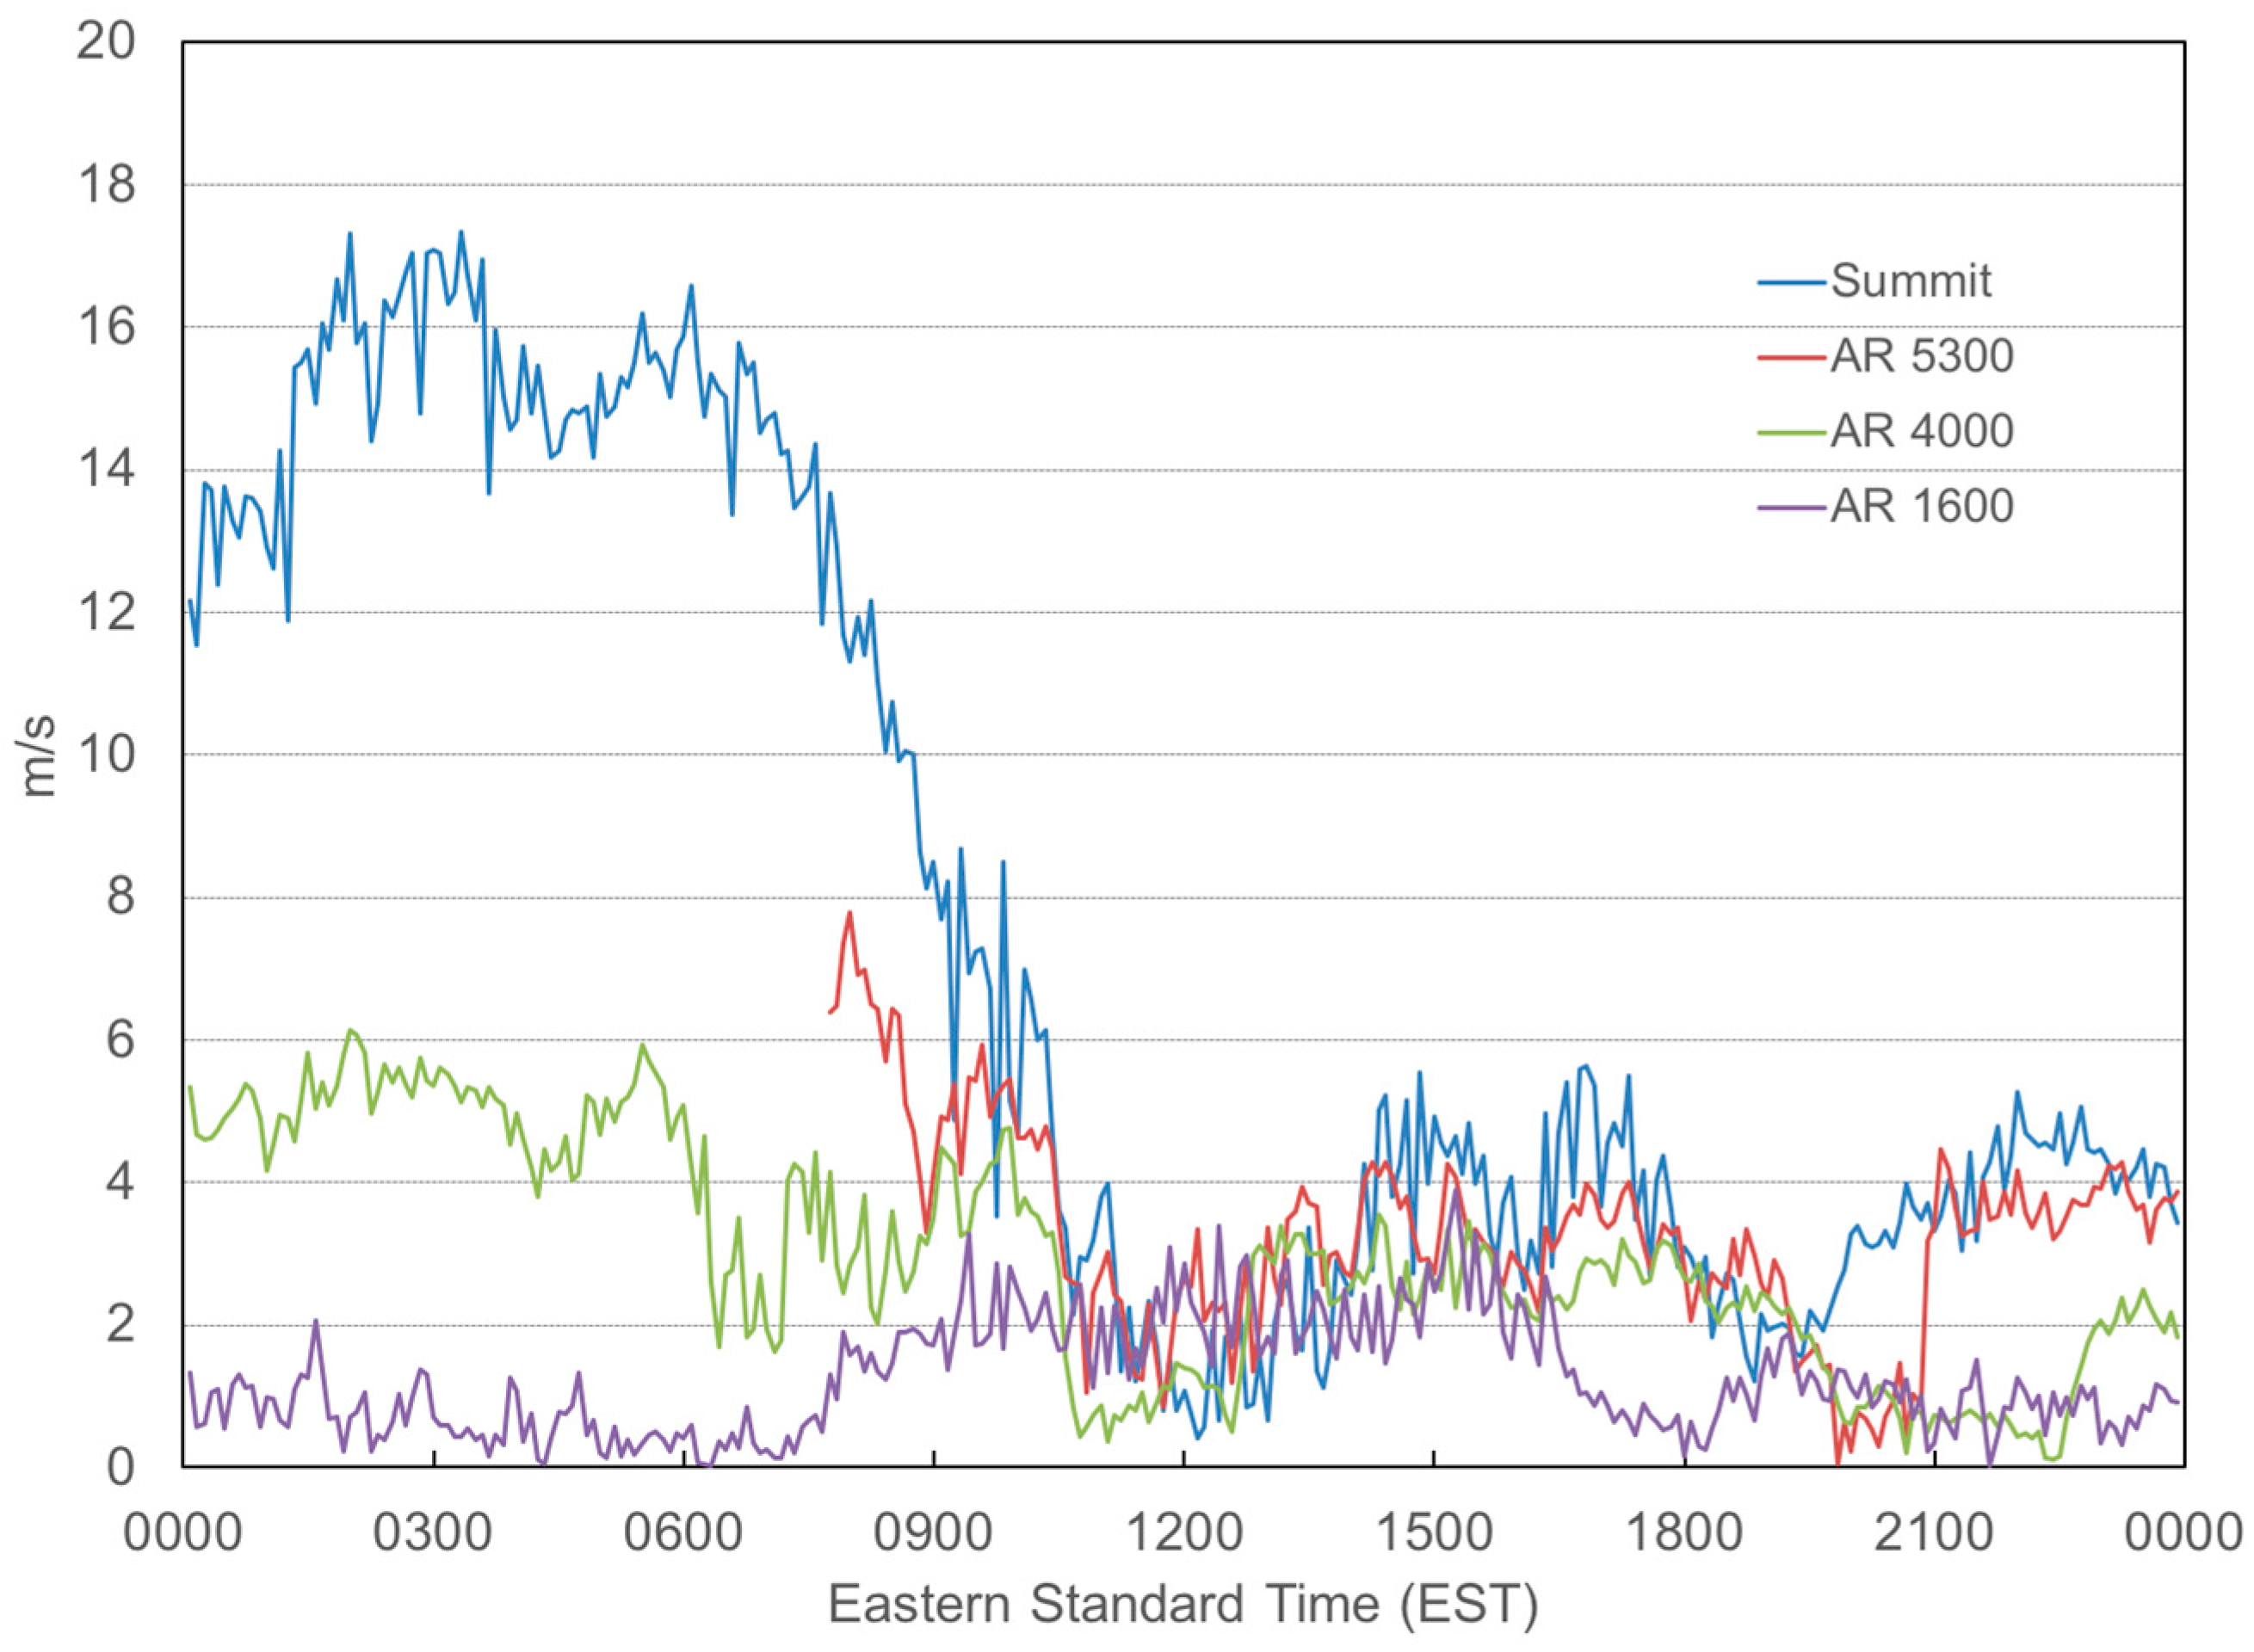
During the early morning, sustained winds of 12–17 m s
−1 (
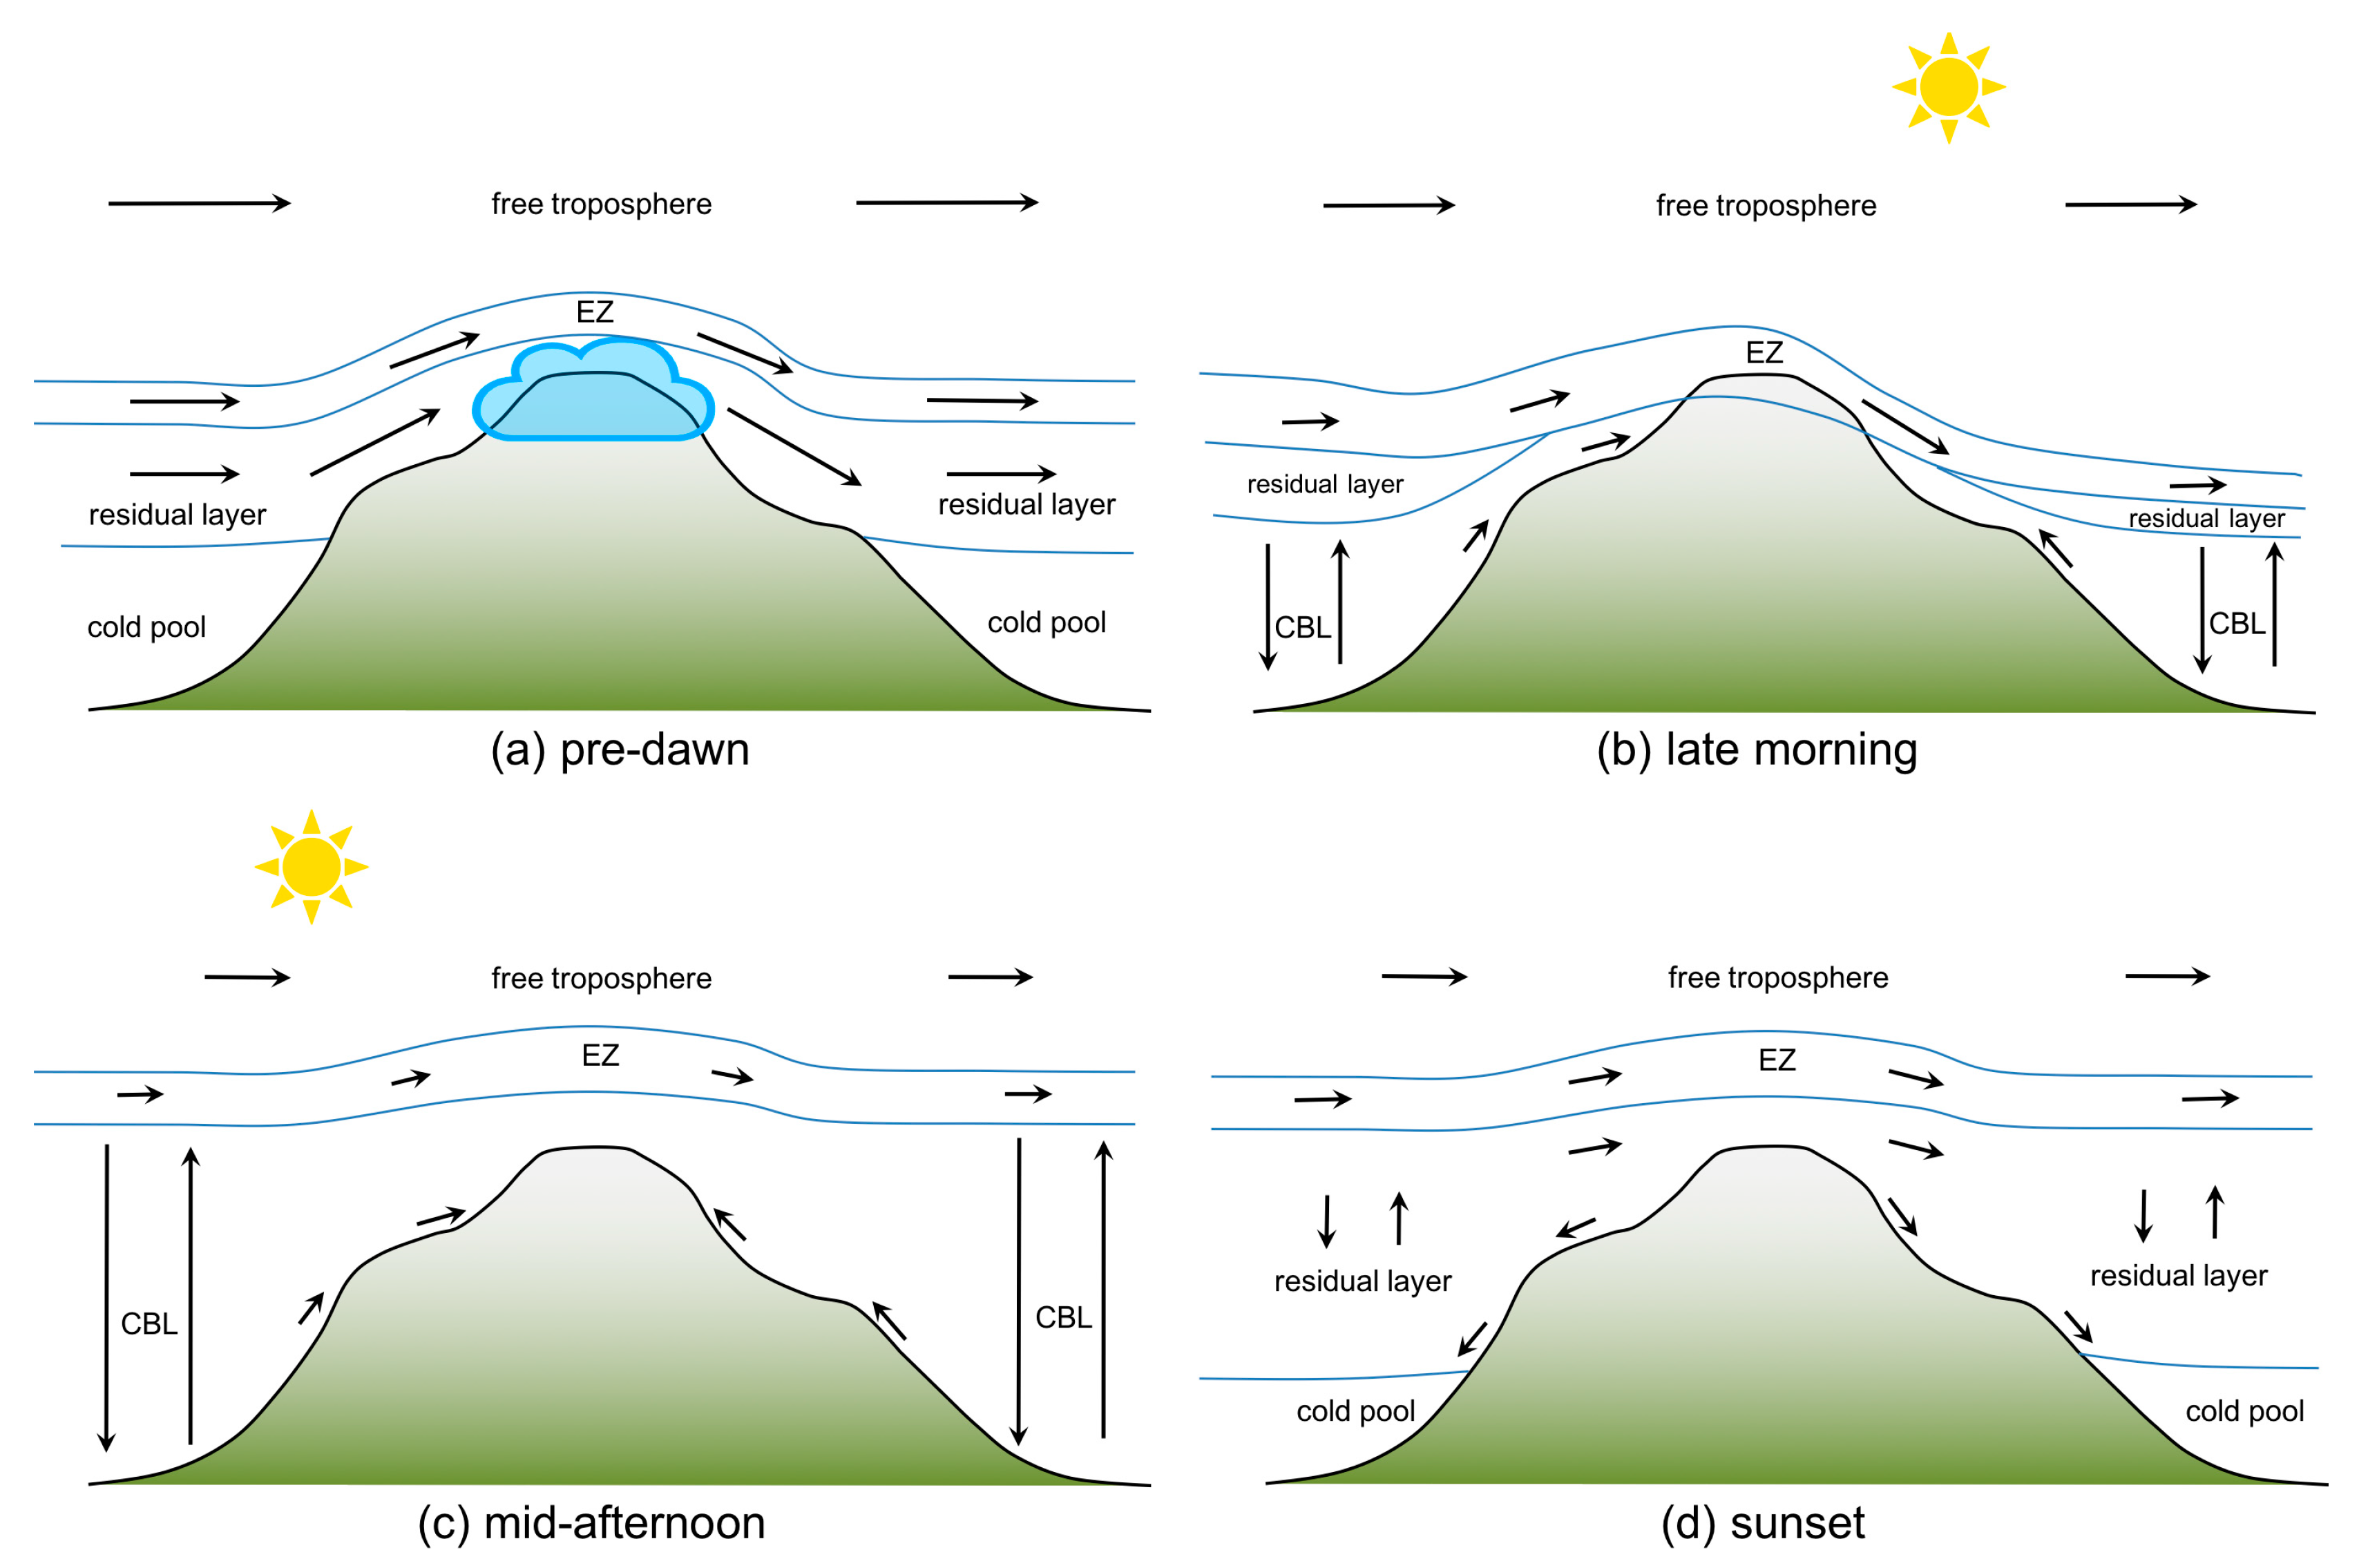
Figure 8)—not very fast by most mountain standards—were nevertheless strong enough to mechanically force the low-stability residual layer air upslope across the entire summit cone—some 120 m higher than the top of the residual layer over the valley (
Figure 9a). As the wind subsided mid-morning and inferred subsidence and PBL divergence associated with the approaching ridge increased across the region, the EZ began to descend to the summit (
Figure 9b). Temperature at the summit and AR5300 rose at its fastest rate all day (not shown). An associated decrease in dewpoint occurred at the summit (
Figure 4) and at the Auto Road sites above treeline (~4000 feet/1219 m). These finding suggest that the ~4–8 m s
−1 wind at the summit (
Figure 8) was sufficient to cause weak föehn flow [
10,
15] associated with periodic downward mixing of drier EZ air on the lee side of the mountain. Given that the drier air was observed at higher elevations during the time that the convective PBL was growing and orographic clouds had mostly dissipated, isentropic drawdown and/or mechanical mixing are probable contributors to this weak föehn flow [
29]. This drawdown competed with thermally forced anabatic winds to modulate temperature and humidity at higher elevations on the mountain, until the convective PBL finally enveloped the summit during the early afternoon (
Figure 9c). The rapid cessation of dry EZ air mixing down to AR4000 on the leeward slope caused by the growing convective PBL was likely assisted by the decrease in wind speed (<10 m s
−1). Summit and AR5300 temperatures varied around a steady temperature and did not increase as one might expect while in the convective PBL for several hours. A slight increase in summit wind to 10 m s
−1 during the afternoon (
Figure 8) likely kept the summit in predominantly free atmosphere PBL air (and not a mountain surface layer) by shedding the warming anabatic winds away from the summit cone, thus preventing them from enveloping the summit. Once the sun had set, radiational cooling led to the formation of cold air pools in the valleys and the decoupling of the mixed layer from the surface (
Figure 9d). The summit remained in contact with this residual layer through the end of the IOP.
The multiple air mass transitions that affected the summit and higher elevations throughout the day significantly shaped both the meteorology and chemistry observed. Summit exposure to the residual layer during the early morning hours resulted in much lower temperatures and higher dewpoints than the surrounding free atmosphere, facilitating the formation of thick orographic clouds, despite mostly clear skies regionally. Later in the morning, the descent of the EZ not only caused large fluctuations in summit humidity, but also exposed the mountain’s alpine zone to higher ozone concentrations. Then, in the afternoon, after the convective PBL had grown past the summit elevation, dewpoints measured along the mountain’s slopes remained higher than the surrounding free atmosphere. Indeed, summit dewpoint values exceeded all values in the PBL of the free atmosphere, except those in the lowest ~560 m of the valley floor. These high dewpoint temperatures were likely the result of a combination of two processes: anabatic winds transporting moisture upslope and evapotranspiration supplying moisture from the vegetated land surface of the mountain. The gradual shifting of PBL isotope ratio profiles toward less negative values throughout the daylit period is indeed consistent with a local evapotranspiration moisture source (
Figure 6) [
30]. Thus, these data provide compelling evidence that understanding the frequency with which higher elevations are exposed to different layers of the atmosphere may be critical for evaluating their sensitivity to changing climatic conditions.
Importantly, meteorological differences emerged not only between the summit and free atmosphere but also between the leeward and windward slopes. Perhaps the clearest example is the asymmetry in the dewpoint temperature response between the eastern and western slopes when large-scale subsidence lowered the height of the PBL regionally in the late morning. As a result, dewpoint temperatures dropped at the summit and the Auto Road sites above treeline on the leeward (east) side. However, no concurrent drop in dewpoint temperature was observed on the windward (west) side (
Figure 4). This discrepancy highlights the role of dynamically-driven föehn winds (i.e., isentropic drawdown and mechanical mixing) in transporting higher-elevation air mass characteristics to lower elevations.
The fact that both elevation and aspect shape PBL evolution and regulate the types of air masses to which complex terrain is exposed has important implications for observational programs hoping to characterize this exposure and its potential sensitivity to a warming climate. In particular, this case study reveals key limitations in using a simple conserved variable approach—based solely on measurements from the summit and surrounding valleys—to identify the presence of boundary layer air at higher elevations. Both dewpoint temperature and δD, for example, were characterized by well-mixed profiles along the mountain during the afternoon period, when the PBL was deepest. However, vertical gradients in both variables tended to persist below treeline (~4000 feet asl and 880 hPa,
Figure 6 and
Figure 7). This finding suggests that conserved variables measured at low elevations below a vegetated canopy may be influenced by subcanopy dynamics that are not fully coupled with the rest of the PBL. The second order deuterium excess parameter (
d = δD – 8 × δ
18O) provides strong supporting evidence of this decoupling [
31] (
Figure 10). Profiles from both the early morning and later afternoon show uniform
d above treeline, but positive gradients with elevation below treeline. Only profiles spanning approximately 0800–1400 EST—essentially midday—appear to be well-mixed in
d, which is consistent with a flushing of the sub-canopy environment as turbulence develops. Interestingly, only when the PBL was deepest and well mixed (~1400–1700 EST) did higher elevation δD values most closely resemble valley δD values. These results support [
32] that measurements from above the canopy (e.g., on an eddy flux tower) may be necessary to best characterize PBL air from the valley.
Ozone concentrations at the summit and valley similarly converged only briefly in time (
Figure 5), even though the summit remained within the well-mixed PBL throughout the afternoon period. After the summit moved from the EZ to the convective PBL at ~1200 EST, summit ozone levels increased while the valley concentration plateaued. These differences may have been caused by distinct transport regimes and distinct ozone elimination processes with elevation. We surmise that during the period when the summit was within the convective PBL, fresh ozone was being formed and/or delivered by light winds (between 2–4 m s
−1;
Figure 8). Moreover, lack of vegetation around the summit would result in limited ozone loss, since vegetative surfaces contribute to ozone’s physical elimination and biogenic emissions can contribute to its chemical destruction. In contrast, at Camp Dodge in the valley, winds likely remained closer to 2 m s
−1 as they did at AR1600 (
Figure 8) during the mid-afternoon, perhaps limiting delivery of fresh ozone and its precursors. Relatively higher rates of elimination would have also been facilitated by the thick forests in the valleys. Since much of the ozone that affects Mount Washington is transported from distant source regions, it is possible that even small differences in wind speed and direction around the complex terrain, in addition to hypothesized variations in elimination rates with elevation, could confound the use of ozone as a conservative tracer of air flow.
Compared with a simple conserved variable approach that requires only measurements from the summit and valley locations, along-slope measurement transects clearly provided a more reliable picture of air mass transitions across the mountain. In addition, unlike the free air soundings, these measurements provided a unique estimate of the height of the local PBL along the land surface and of the depth to which the EZ penetrated with assistance from locally driven vertical perturbations of the wind. Moreover, measurements of conserved variables from the lowest elevations above treeline closely matched summit observations during the period when the summit was within the PBL, providing a better sense of how well-mixed the PBL truly was compared with measurements from within the low-elevation forest canopy. These findings suggest that observational programs hoping to evaluate the changing character of PBL, EZ, and FT exposure at higher elevations will be best served by along-slope measurements from the elevations of interest and measurements of PBL air minimally influenced by subcanopy dynamics. High-resolution free air profiles, such as those by traditional radiosondes, ceilometers and LiDAR, provide a comparison with along-slope measurements that reveal slope-to-free air differences in temperature, humidity, and PBL/EZ height, help elucidate the processes leading to these differences, and provide independent support for PBL/EZ height verification along the mountain slopes.
