Effects of Forage Rice Cultivation on Carbon and Greenhouse Gas Balances in a Rice Paddy Field


Abstract
1. Introduction
2. Materials and Methods
2.1. Experimental Field, Setup, and Cultivation
2.2. GHG Flux Measurement
2.2.1. CH4 and N2O Fluxes
2.2.2. CO2 Flux (Organic Matter Decomposition)
2.2.3. Analysis and Calculation
2.3. Aboveground Dry Matter Weight of Rice and Net Primary Production (NPP)
2.4. Net Biome Production (Carbon Budget)
2.5. Net GHG Balance
25 + N2O (kg N2O m−2 year−1) × 298 − NBP (kg C m−2 year−1) × 44/12.
2.6. Statistical Analysis
3. Results
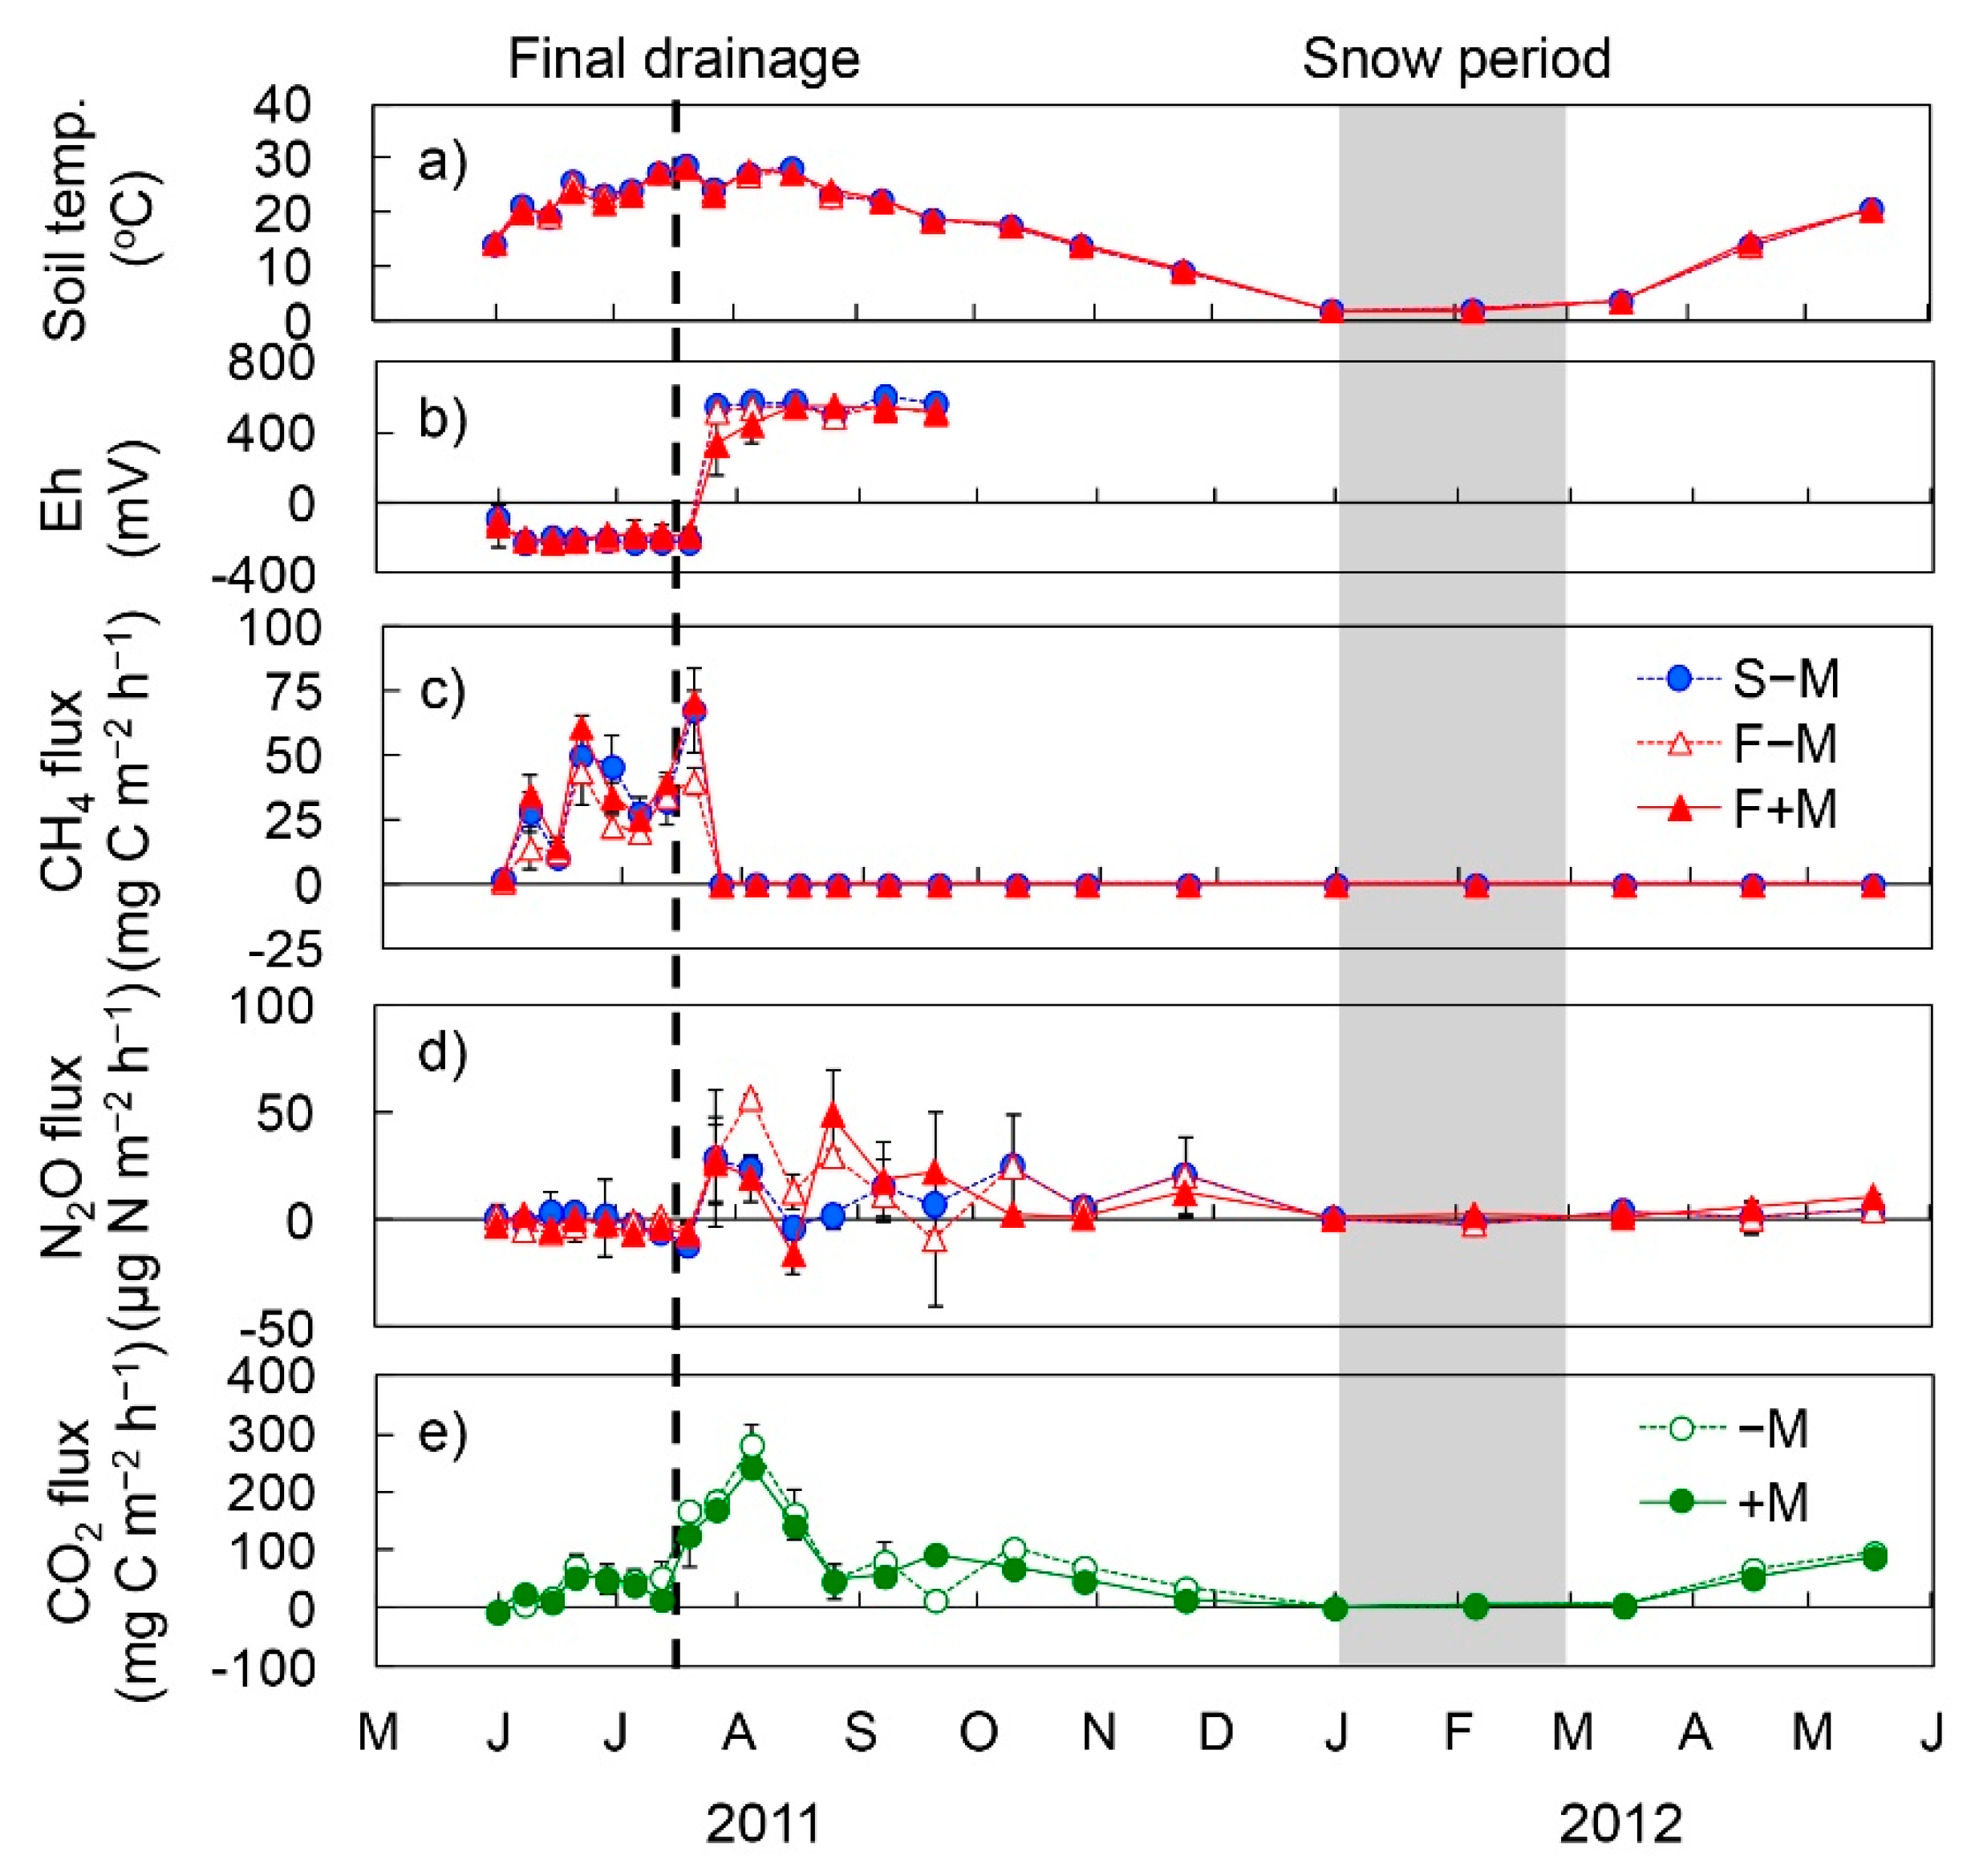
3.1. GHG Fluxes
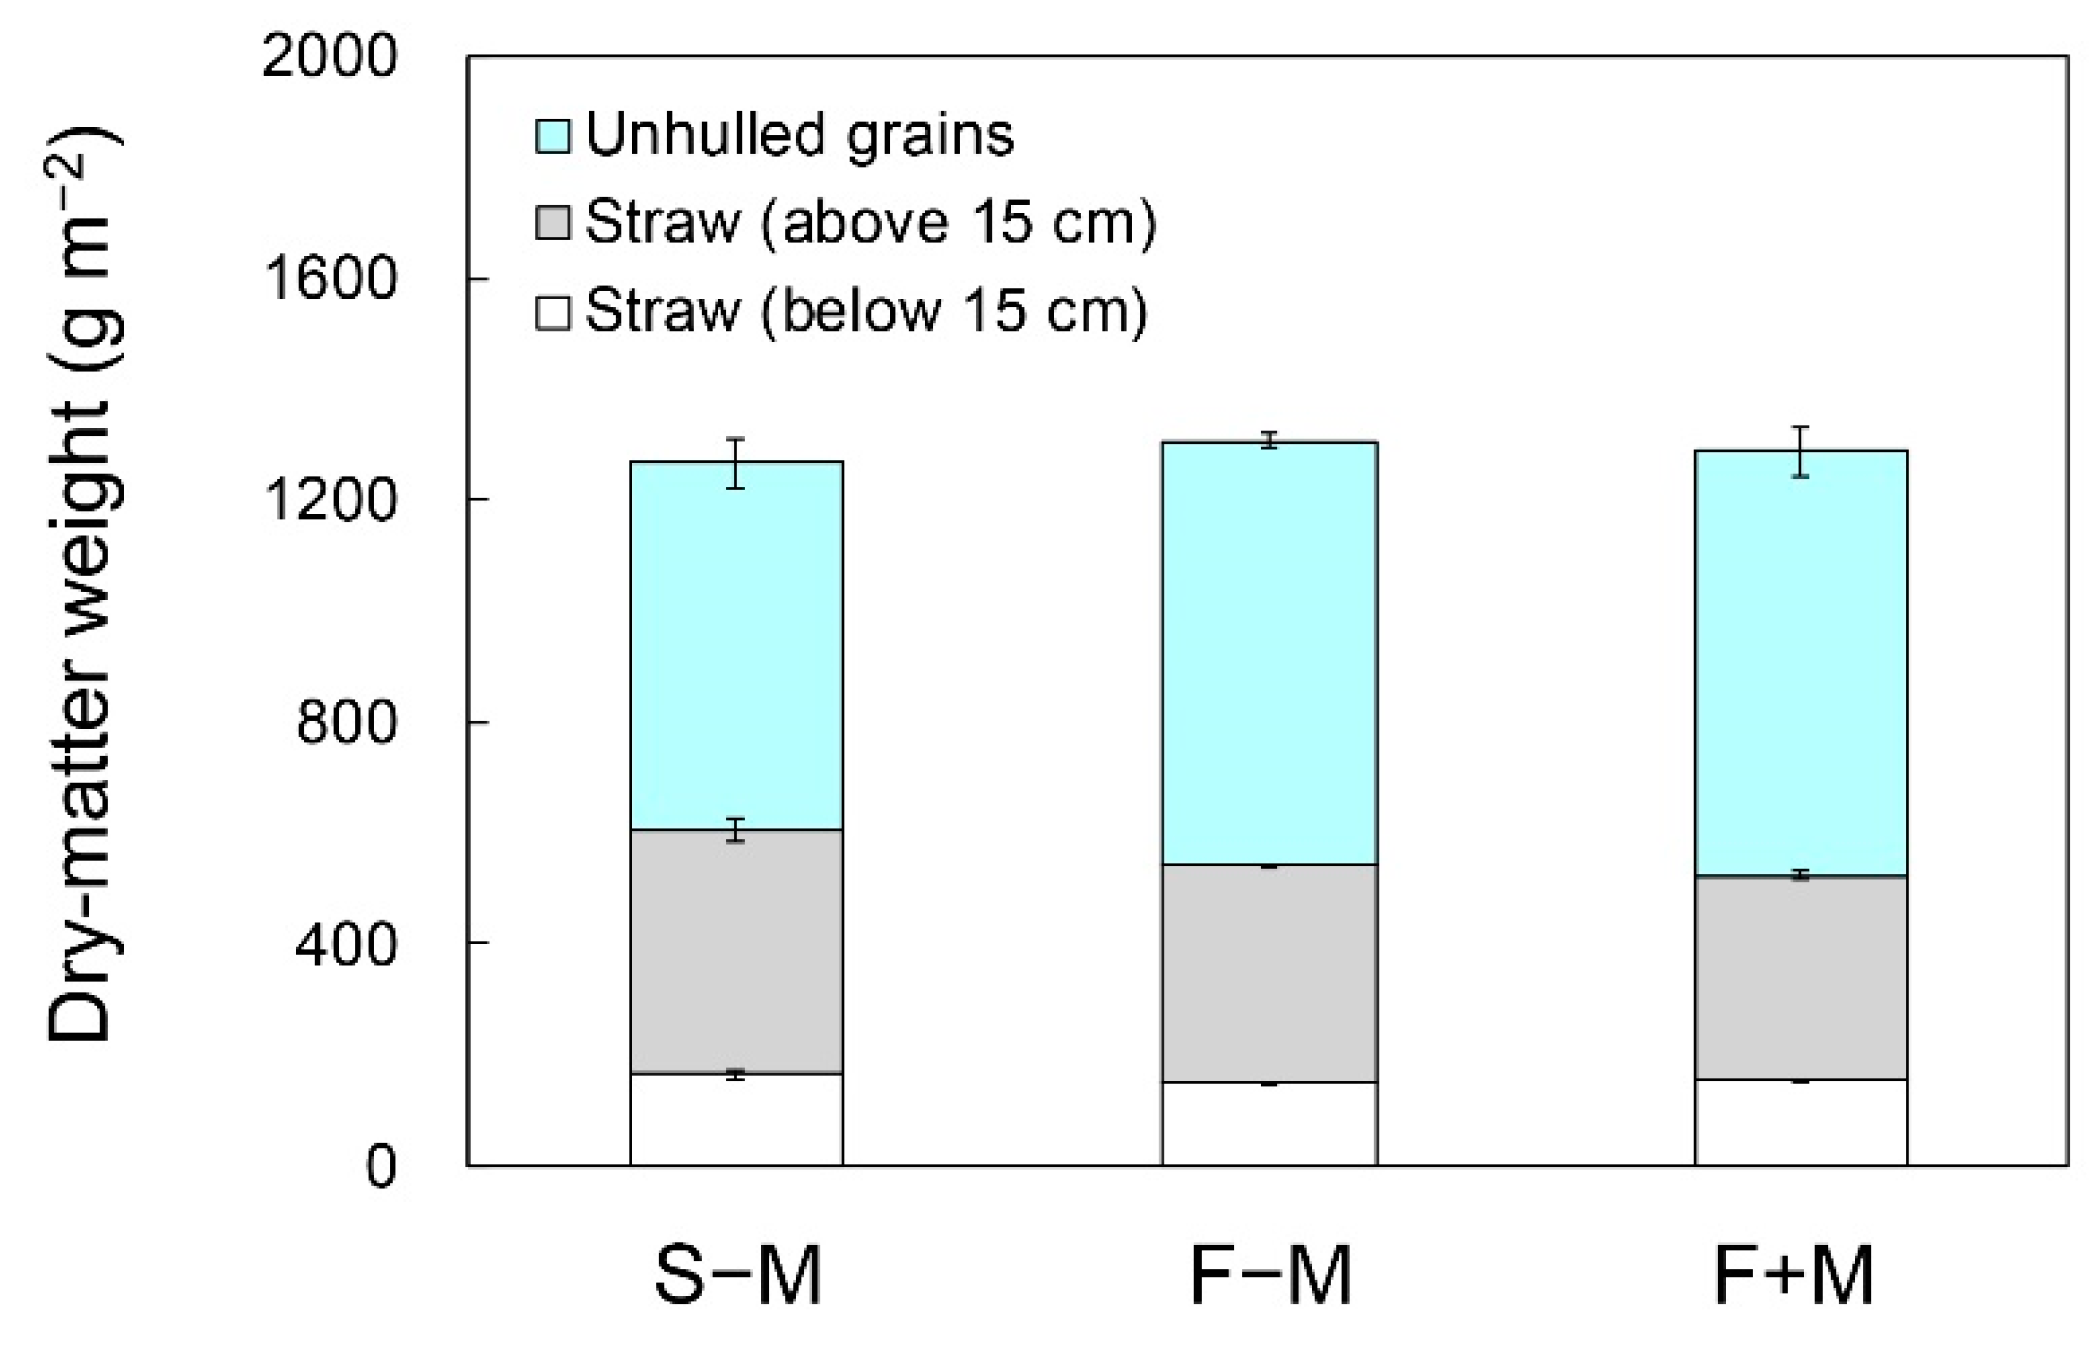
3.2. Aboveground Dry Matter Weight of Rice at the Harvest Stage
3.3. Net Biome Production (Carbon Budget)
3.4. Net GHG Balance
4. Discussion
5. Conclusions
Author Contributions
Acknowledgments
Conflicts of Interest
References
- Ministry of Agriculture, Forestry and Fisheries (MAFF). Situation over Feed. Available online: http://www.maff.go.jp/j/chikusan/sinko/lin/l_siryo/attach/pdf/index-293.pdf (accessed on 24 November 2018).
- Kato, H. Development of rice varieties for whole crop silage (WCS) in Japan. JARQ 2008, 42, 231–236. [Google Scholar] [CrossRef]
- Fukushima, A.; Ohta, H.; Yokogami, N.; Tsuda, N. Yielding ability of rice varieties and lines for feed in the Tohoku region of Japan. Jpn. J. Crop. Sci. 2018, 87, 30–36, (In Japanese with English summary). [Google Scholar] [CrossRef]
- Ohdaira, Y.; Nishida, M.; Fukujyu, N.; Mochida, H.; Ishikawa, H.; Katsube, T.; Saitoh, S.; Kikuchi, K.; Ono, H.; Shiratsuchi, H.; et al. Effect of swine compost application and the nitrogen application method on grain yield and protein content in brown rice of the high-yielding rice cultivar ‘Iwaidawara’ in the Tohoku region. Bull. NARO Agric. Res. Tohoku Reg. 2018, 120, 47–66, (In Japanese with English summary). [Google Scholar]
- Shirato, Y.; Yagasaki, Y.; Nishida, M. Using different versions of the Rothamsted carbon model to simulate soil carbon in long-term experimental plots subjected to paddy–upland rotation in Japan. Soil Sci. Plant Nutr. 2011, 57, 597–606. [Google Scholar] [CrossRef]
- Nishida, M. Decline in fertility of paddy soils induced by paddy rice and upland soybean rotation, and measures against the decline. JARQ 2016, 50, 87–94. [Google Scholar] [CrossRef]
- National Institute for Environmental Studies. National Greenhouse Gas Inventory Report of Japan; Greenhouse Gas Inventory Office of Japan, Center for Global Environmental Research, National Institute for Environmental Studies: Tsukuba, Japan, 2018; pp. 26–27.
- Takakai, F.; Ichikawa, J.; Ogawa, M.; Ogaya, S.; Yasuda, K.; Kobayashi, Y.; Sato, T.; Kaneta, Y.; Nagahama, K. Suppression of CH4 emission by rice straw removal and application of bio-ethanol production residue in a paddy field in Akita, Japan. Agriculture 2017, 7, 21. [Google Scholar] [CrossRef]
- Yagi, K.; Minami, K. Effect of organic matter application on methane emission from some Japanese paddy fields. Soil Sci. Plant Nutr. 1990, 36, 599–610. [Google Scholar] [CrossRef]
- Watanabe, A.; Satoh, Y.; Kimura, M. Estimation of the increase in CH4 emission from paddy soils by rice straw application. Plant Soil 1995, 173, 225–231. [Google Scholar] [CrossRef]
- Nakagomi, K.; Yamaguchi, M.; Kataoka, T.; Endo, T.; Takata, T.; Higashi, T.; Yokogami, N.; Kato, H.; Tamura, Y. Breeding of a new rice cultivar, “Bekoaoba”, for whole-crop silage adapted to direct seeding cultivation. Bull. Natl. Agric. Res. Cent. Tohoku Reg. 2006, 106, 1–14, (In Japanese with English summary). [Google Scholar]
- Nagata, K.; Yoshinaga, S.; Terashima, K.; Fukuda, A. Growth, yield and dry matter production of rice varieties for whole-crop silage bred for the Tohoku region of Japan. Bull. Natl. Agric. Res. Cent. Tohoku Reg. 2007, 107, 63–70, (In Japanese with English summary). [Google Scholar]
- FAO (Food and Agriculture Organization of the United Nations). World Reference Base for Soil Resources; FAO: Rome, Italy, 2006. [Google Scholar]
- Kaneta, Y. Single application of controlled availability fertilizer to nursery boxes in non-tillage rice culture. JARQ 1995, 29, 111–116. [Google Scholar]
- Kumagai, K.; Konno, Y.; Kuroda, J.; Ueno, M. The single application of fertilizer in nursery box on rice culture. Bull. Yamagata Agric. Exp. Stn. 1999, 33, 29–43, (In Japanese with English summary). [Google Scholar]
- Takakai, F.; Nakagawa, S.; Sato, K.; Kon, K.; Sato, T.; Kaneta, Y. Net greenhouse gas budget and soil carbon storage in a field with paddy–upland rotation with different history of manure application. Agriculture 2017, 7, 49. [Google Scholar] [CrossRef]
- Toma, Y.; Hatano, R. Effect of crop residue C:N ratio on N2O emissions from Gray Lowland soil in Mikasa, Hokkaido, Japan. Soil Sci. Plant Nutr. 2007, 53, 198–205. [Google Scholar] [CrossRef]
- Takakai, F.; Takeda, M.; Kon, K.; Inoue, K.; Nakagawa, S.; Sasaki, K.; Chida, A.; Sekiguchi, K.; Takahashi, T.; Sato, T.; et al. Effects of preceding compost application on the nitrogen budget in an upland soybean field converted from a rice paddy field on gray lowland soil in Akita, Japan. Soil Sci. Plant Nutr. 2010, 56, 760–772. [Google Scholar] [CrossRef]
- Shimizu, M.; Marutani, S.; Desyatkin, A.R.; Jin, T.; Hata, H.; Hatano, R. The effect of manure application on carbon dynamics and budgets in a managed grassland of Southern Hokkaido, Japan. Agric. Ecosyst. Environ. 2009, 130, 31–40. [Google Scholar] [CrossRef]
- Toma, Y.; Takakai, F.; Darung, U.; Kuramochi, K.; Limin, S.H.; Dohong, S.; Hatano, R. Nitrous oxide emission derived from soil organic matter decomposition from tropical agricultural peat soil in central Kalimantan, Indonesia. Soil Sci. Plant Nutr. 2010, 57, 436–451. [Google Scholar] [CrossRef]
- Intergovernmental Panel on Climate Change (IPCC). The Physical Science Basis. Contribution of Working Group I to the Fourth Assessment Report of the Intergovernmental Panel on Climate Change. In Climate Change 2007; Solomon, S., Qin, D., Manning, M., Eds.; Cambridge University Press: Cambridge, UK, 2007. [Google Scholar]
- Aulakh, M.S.; Wassmann, R.; Rennenberg, H. Methane transport capacity of twenty-two rice cultivars from five major Asian rice-growing countries. Agric. Ecosyst. Environ. 2002, 91, 59–71. [Google Scholar] [CrossRef]
- Lou, Y.; Inubushi, K.; Mizuno, T.; Hasegawa, T.; Lin, Y.; Sakai, H.; Cheng, W.; Kobayashi, K. CH4 emission with differences in atmospheric CO2 enrichment and rice cultivars in a Japanese paddy soil. Glob. Chang. Biol. 2008, 14, 2678–2687. [Google Scholar]
- Zhang, Y.; Jiang, Y.; Li, Z.; Zhu, X.; Wang, X.; Chen, J.; Hang, X.; Deng, A.; Zhang, J.; Zhang, W. Aboveground morphological traits do not predict rice variety effects on CH4 emissions. Agric. Ecosyst. Environ. 2015, 208, 86–93. [Google Scholar] [CrossRef]
- Cheng, W.; Kimani, S.M.; Kanno, T.; Tang, S.; Oo, A.Z.; Tawaraya, K.; Sudo, S.; Sasaki, Y.; Yoshida, N. Forage rice varieties Fukuhibiki and Tachisuzuka emit larger CH4 than edible rice Haenuki. Soil Sci. Plant Nutr. 2018, 64, 77–83. [Google Scholar] [CrossRef]
- Watanabe, A.; Takeda, T.; Kimura, M. Evaluation of carbon origins of CH4 emitted from rice paddies. J. Geophys. Res. 1999, 104, 23623–23630. [Google Scholar] [CrossRef]
- Kumagai, K.; Shiono, H.; Morioka, M.; Nagasawa, K.; Nakagawa, F. Effect of application of livestock dung compost instead of spring incorporation of rice straw on methane emission from paddy fields in Yamagata. Bull. Agric. Res. Yamagata Prefect 2010, 2, 1–18. [Google Scholar]
- Nagumo, Y.; Oyanagi, W.; Tanahashi, T. Estimate of methane emission potential of organic matter from amount of acid detergent soluble organism. Jpn. J. Soil Sci. Plant Nutr. 2016, 87, 455–457. (In Japanese) [Google Scholar]
- Shiono, H.; Saito, H.; Nakagawa, F.; Nishimura, S.; Kumagai, K. Effects of crop rotation and rice straw incorporation in spring on methane and nitrous oxide emissions from an upland paddy field in a cold region of Japan. Jpn. J. Soil Sci. Plant Nutr. 2014, 85, 420–430, (In Japanese with English summary). [Google Scholar]
- Akiyama, H.; Yagi, K.; Yan, X.Y. Direct N2O emissions from rice paddy fields: Summary of available data. Glob. Biogeochem. Cycles 2005, 19, GB1005. [Google Scholar] [CrossRef]
- Nishida, M.; Usui, M.; Tuschiya, K.; Moriizumi, M. Demonstration of discrepancy in N remaining rate of organic matter evaluated by N content and 15N content in the glass fiber-filter paper bag method. Soil Sci. Plant Nutr. 2003, 49, 297–300. [Google Scholar] [CrossRef]
- Shindo, H.; Kaneta, Y.; Kato, M.; Sakamoto, K.; Sato, H.; Togashi, Y.; Fujiwara, H. Machine broadcasting and nitrogen mineralization characteristics of the compost pellet made from animal waste. Tohoku Agric. Res. 2002, 55, 41–42. (In Japanese) [Google Scholar]
- Tsuchiya, K.; Nishida, M.; Yoshida, K.; Kawamoto, H. The effects of matured cattle manure and nitrogen fertilizer on the growth and yield of transplanted rice variety “Bekoaoba” for whole crop silage. Tohoku Agric. Res. 2012, 65, 11–12. (In Japanese) [Google Scholar]
- Minamikawa, K.; Sakai, N. Soil carbon budget in a single-cropping paddy field with rice straw application and water management based on soil redox potential. Soil Sci. Plant Nutr. 2007, 53, 657–667. [Google Scholar] [CrossRef]
- Nishimura, S.; Yonemura, S.; Sawamoto, T.; Shirato, Y.; Akiyama, H.; Sudo, S.; Yagi, K. Effect of land use change from paddy rice cultivation to upland crop cultivation on soil carbon budget of a cropland in Japan. Agric. Ecosyst. Environ. 2008, 125, 9–20. [Google Scholar] [CrossRef]
- Hu, R.; Hatano, R.; Kusa, K.; Sawamoto, T. Soil respiration and net ecosystem production in an onion field in central Hokkaido, Japan. Soil Sci. Plant Nutr. 2004, 50, 27–33. [Google Scholar] [CrossRef]
- Mu, Z.; Kimura, S.D.; Hatano, R. Estimation of global warming potential from upland cropping systems in central Hokkaido, Japan. Soil Sci. Plant Nutr. 2006, 52, 371–377. [Google Scholar] [CrossRef]
- Minamikawa, K.; Sakai, N. The practical use of water management based on soil redox potential for decreasing methane emission from a paddy field in Japan. Agric. Ecosyst. Environ. 2006, 116, 181–188. [Google Scholar] [CrossRef]
- Nishimura, S.; Yonemura, S.; Minamikawa, K.; Yagi, K. Seasonal and diurnal variations in net carbon dioxide flux throughout the year from soil in paddy field. J. Geophys. Res. Biogeosci. 2015, 120, 63–76. [Google Scholar] [CrossRef]
- Kusa, K.; Abe, K.; Ishikawa, T. Effects of cattle manure application on the leaching of nitrogen, phosphorus, and potassium from forage rice paddies-Results from lysimeter experiments. Jpn. J. Grassl. Sci. 2015, 61, 74–82, (In Japanese with English summary). [Google Scholar]
- Naser, H.M.; Nagata, O.; Tamura, S.; Hatano, R. Methane emissions from five paddy fields with different amounts of rice straw application in central Hokkaido, Japan. Soil Sci. Plant Nutr. 2007, 53, 95–101. [Google Scholar] [CrossRef]
- Kobayashi, A.; Suzuki, Y.; Saiten, H.; Morooka, M.; Ishida, H. Effects of early release of ponding water on growth and yield of wetland rice under heavy application if rice straw in clayey gley paddy soil. Bull. Hokuriku Agric. Exp. Stn. 2000, 43, 25–45. (In Japanese) [Google Scholar]
- Miura, Y. Rice straw management for mitigation of methane emission from paddy field. Spec. Bull. Fukushima Prefect. Agric. Exp. Stn. 2003, 7, 1–38. (In Japanese) [Google Scholar]
- Goto, E.; Miyamori, Y.; Hasegawa, S.; Inatsu, O. Reduction effects of accelerating rice straw decomposition and water management on methane emission from paddy fields in a cold distinct. Jpn. J. Soil Sci. Plant Nutr. 2004, 75, 191–201. (In Japanese) [Google Scholar]


| S − M | F − M | F + M | −M | +M | |
|---|---|---|---|---|---|
| CH4 (g C m−2 year−1) | 45.2 ± 9.3 a | 32.1 ± 6.7 a | 48.2 ± 5.4 a | - | - |
| N2O (mg N m−2 year−1) | 51.9 ± 48.0 a | 64.1 ± 38.2 a | 55.7 ± 2.3 a | - | - |
| CO2 (Organic matter decomposition) (g C m−2 year−1) | - | - | - | 476 ± 47 a | 406 ± 20 a |
| Carbon Flow (g C m−2 year−1) | ||||
|---|---|---|---|---|
| S − M | F − M | F + M | ||
| Input | Net primary production (Photosynthesis) | 500 ± 19 | 508 ± 2 | 501 ± 4 |
| Livestock manure compost | - | - | 363 | |
| Output | † Organic matter decomposition | 476 ± 47 | 476 ± 47 | 406 ± 20 |
| CH4 emission | 45 ± 9 | 32 ± 7 | 48 ± 5 | |
| Harvest (Unhulled grains) | 278 ± 10 | 321 ± 3 | 321 ± 8 | |
| Harvest (Straw) | - | 137 ± 6 | 130 ± 3 | |
| ‡ NBP | −299 ± 34 b | −457 ± 40 a | −40 ± 12 c | |
| (Without straw harvesting in forage rice) | - | (−320 ± 40) | (89 ± 8) | |
| † Net GHG Balance (kg CO2-eq m−2 year−1) | |||
|---|---|---|---|
| S − M | F − M | F + M | |
| CO2 (−NBP) | 1.10 ± 0.12 | 1.67 ± 0.15 | 0.15 ± 0.04 |
| CH4 | 1.51 ± 0.31 | 1.07 ± 0.22 | 1.61 ± 0.01 |
| N2O | 0.02 ± 0.02 | 0.03 ± 0.02 | 0.03 ± 0.00 |
| ‡ Total | 2.63 ± 0.16 b | 2.77 ± 0.06 b | 1.78 ± 0.13 a |
| (Without straw harvesting in forage rice) | - | (2.27 ± 0.06) | (1.30 ± 0.15) |
© 2018 by the authors. Licensee MDPI, Basel, Switzerland. This article is an open access article distributed under the terms and conditions of the Creative Commons Attribution (CC BY) license (http://creativecommons.org/licenses/by/4.0/).
Share and Cite
Takakai, F.; Kobayashi, M.; Sato, T.; Yasuda, K.; Kaneta, Y. Effects of Forage Rice Cultivation on Carbon and Greenhouse Gas Balances in a Rice Paddy Field. Atmosphere 2018, 9, 504. https://doi.org/10.3390/atmos9120504
Takakai F, Kobayashi M, Sato T, Yasuda K, Kaneta Y. Effects of Forage Rice Cultivation on Carbon and Greenhouse Gas Balances in a Rice Paddy Field. Atmosphere. 2018; 9(12):504. https://doi.org/10.3390/atmos9120504
Chicago/Turabian StyleTakakai, Fumiaki, Masahiro Kobayashi, Takashi Sato, Kentaro Yasuda, and Yoshihiro Kaneta. 2018. "Effects of Forage Rice Cultivation on Carbon and Greenhouse Gas Balances in a Rice Paddy Field" Atmosphere 9, no. 12: 504. https://doi.org/10.3390/atmos9120504
APA StyleTakakai, F., Kobayashi, M., Sato, T., Yasuda, K., & Kaneta, Y. (2018). Effects of Forage Rice Cultivation on Carbon and Greenhouse Gas Balances in a Rice Paddy Field. Atmosphere, 9(12), 504. https://doi.org/10.3390/atmos9120504