Article

Effects of Grazing Pattern on Ecosystem Respiration and Methane Flux in a Sown Pasture in Inner Mongolia, China

1
School of Ecology and Environment, Inner Mongolia University, Hohhot 010021, China
2
State Key Laboratory of Atmospheric Boundary Layer Physics and Atmospheric Chemistry, Institute of Atmospheric Physics, Chinese Academy of Science, Beijing 100029, China
3
Department of Natural Resources and the Environment, University of New Hampshire, Durham, NH 03824, USA
4
Institute grassland research of Chinese Academy Agricultural Sciences, Hohhot 010010, China
5
Earth Systems Research Center, Institute for the Study of Earth, Oceans and Space, University of New Hampshire, Durham, NH 03824, USA
*
Author to whom correspondence should be addressed.
Atmosphere 2019, 10(1), 5; https://doi.org/10.3390/atmos10010005
Submission received: 16 October 2018 / Revised: 16 December 2018 / Accepted: 17 December 2018 / Published: 26 December 2018
(This article belongs to the Special Issue C and N Cycling and Greenhouse Gases Emission in Agroecosystem)

Abstract

:
The establishment of sown pasture is an important agricultural practice in many landscapes. Although both native grassland and sown pasture play a key role in the global carbon cycle, due to lack of data and field experiments, our understanding of grassland CH4 fluxes and CO2 emissions remains limited, especially when it comes to sown pasture. We measured ecosystem respiration and CH4 fluxes in response to a variety of potential drivers (soil temperature, soil moisture, ammonium nitrogen, nitrate nitrogen and dissolved organic carbon) in CG (continuous grazing), RG (rotational grazing) and UG (ungrazed) plots in sown grassland for one year in Inner Mongolia. Fluxes of CH4 and ecosystem respiration were measured using static opaque chambers and gas chromatography. Grazing significantly reduced ecosystem respiration (p < 0.01), and grazing pattern significantly influenced respiration in CG and RG plots (p < 0.01). We find that the sown grassland is a net sink for atmospheric CH4. No influence of grazing pattern was observed on CH4 flux in CG, RG and UG (p > 0.05). Soil temperature is the most important factor influencing ecosystem respiration and CH4 flux in the sown grassland, with soil moisture playing a secondary role to soil temperature. Variation in levels of ammonium nitrogen, nitrate nitrogen and dissolved organic carbon had little influence on ecosystem respiration or CH4 flux (except in UG plots). The values obtained for ecosystem respiration of grasslands have a large uncertainty range, which may be due to spatial variability as well as differences in research methods. Mean CH4 fluxes measured only during the growing season were much higher than the annual mean CH4 fluxes.

1. Introduction

Methane (CH4) and carbon dioxide (CO2), two of the three major greenhouse gases (CH4, CO2, N2O) play a significant role in the radiative balance of the earth’s atmosphere. Atmospheric concentrations of CH4 and CO2 have grown by 150% and 40% respectively from about 1750 to 2011 and this increase is the main driver of climate change [1].
Semiarid grasslands, which cover about 11 percent of the global land surface, act as important sources or sinks of greenhouse gases and are widely used as pasture [2,3,4,5]. Although pastures cover a large fraction of Earth’s ice-free land (about 26%) [6], because of increases in human population and overgrazing, degradation and fragmentation of steppe are inevitable [7]. Grazing intensity is currently increasing and is likely to continue rising as demand for animal products increases. However, at some point in the future, because of the degradation and fragmentation of native grassland, reduction of grazing intensity on native grassland is likely to occur and the establishment of sown pasture will become essential, as it can alleviate not only the grazing pressure on native grassland but also the imbalance in grassland use in terms of space and time [8,9]. Though both native grassland and sown pasture play a key role in the global carbon cycle [10,11,12], due to lack of data and field experiments, our understanding of grassland CH4 fluxes and ecosystem respiration remains limited, especially for sown pasture.
Grasslands in Inner Mongolia are representative of the Eurasian grassland belt [13] and grazing is the dominant land use there [14]. Current studies show that grassland soils are significant sinks for atmospheric CH4 and sources for CO2 [15,16]. However, the potential of Inner Mongolian grassland soils to act as sources or sinks may be affected by grazing regime [17,18,19]. The response of CH4 fluxes and ecosystem respiration when pastures receive increased grazing pressure or changed grazing methods remains uncertain. Nor are the effects of soil moisture, soil temperature and soil disturbance, which have been identified as important factors controlling the soil-atmosphere exchange of CH4 and CO2 well documented for grazing lands [20,21,22]. Grazing regime as well as changes of soil moisture, soil temperature and soil disturbance will increase uncertainties in the measurement on the CH4 flux and ecosystem respiration of sown pasture.
In this study, we measure CH4 flux and ecosystem respiration (Re) over an entire year (from July 2012 to July 2013) from a sown pasture in Inner Mongolia in order to investigate the effects of grazing pattern as well as soil moisture, soil temperature and other soil properties on soil-atmosphere exchange of CH4 and ecosystem respiration.

2. Materials and Methods

2.1. Site Description

This study was conducted in a sown pasture belonging to the Chinese Academy of Agricultural Science, located in Shaerqin town, Tumd Left Banner, Huhhot, Inner Mongolia, China (40°34′ N, 111°34′ E, 1055 m). It has a typical temperate semi-arid climate. Mean annual rainfall ranges from 350 to 450 mm and mean annual air temperature ranges from 5.8 to 7.3 °C, with a maximum monthly mean of 23.3 °C in July and a minimum of −11.0 °C in January, with ≥10 °C accumulated temperature of above 2700 °C and frost-free period of around 130 d (The weather bureau of Hohhot, China). Soils are Castanozems in the “Food and Agriculture Organization of the United Nations (FAO) nomenclature”. Soil properties of the upper 300 mm of the soil profile were: pH of 8.5, salt content 0.03%, total N 0.035%, organic matter of 0.8% (Institute of Grassland Research of Chinese Academy of Agricultural Sciences). The experimental site was built and fenced in 2008 and then a mixture of Medicago sativa, Lespedeza floribunda, Leymus chinensis, Elymus dahuricus Turcz and Bromus inermis Leyss was sown in 2009. Grazing by sheep began in 2010.

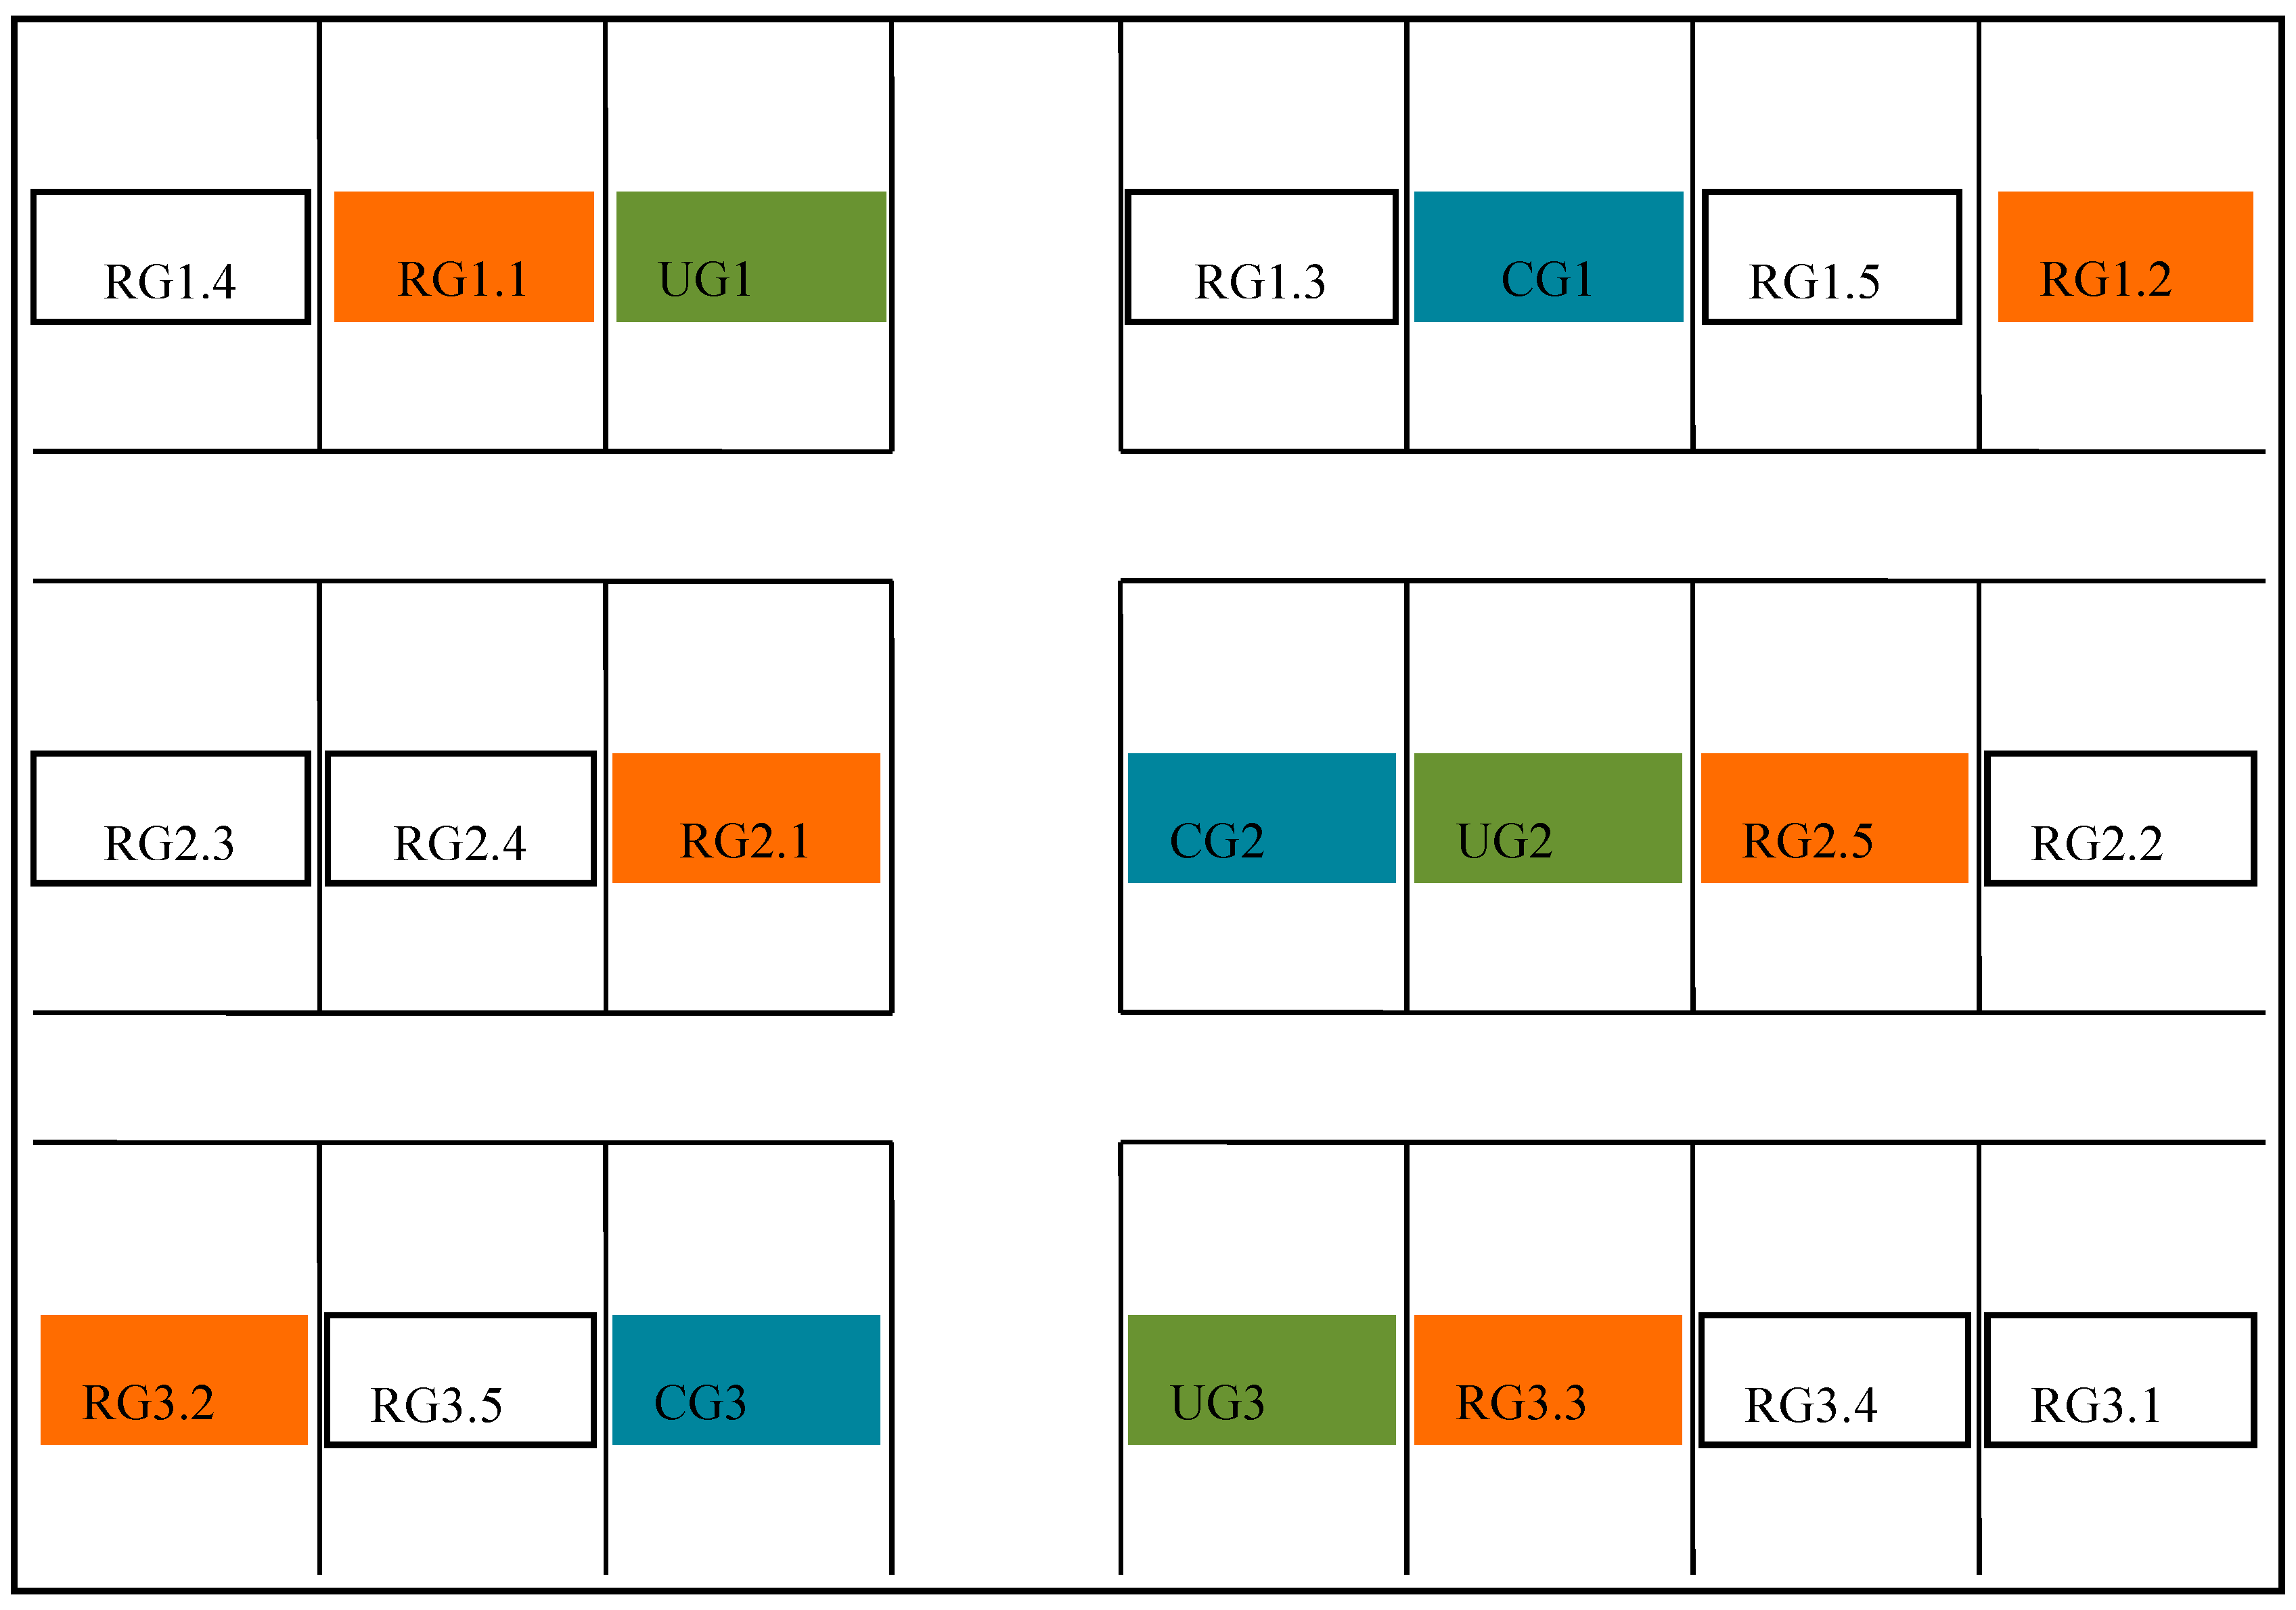
2.2. Experimental Design

The sown pasture was divided into 3 equal transects, with each transect including 7 experimental plots. Within these 7 plots, there are 5 rotational grazing plots (RG), 1 continuous grazing plot (CG) and 1 ungrazed plot (UG) assigned randomly. Thus, there are in total 15 rotational grazing plots, 3 continuous grazing plots and 3 ungrazed plots in the 3 transects. We randomly chose 6 of the 15 rotational grazing plots as our experimental sites (Figure 1). Each plot covered about 0.67 ha. To ensure the spatial representativeness of the greenhouse gas measurements, there were two sampling points in every UG and CG plot and there was one sampling point in every RG plot that we chose. Thus we had 6 replicate sampling points for each treatment (UG, CG and RG).
Grazing was allowed from June to October since 2010 and the sheep stayed in the winter sheepfold the rest of year. The grazing treatments were set by Institute of Grassland Research of Chinese Academy of Agricultural Sciences, as they represent the traditionally used grazing practices in this region. During the grazing period, the 30 sheep were grazed in every RG plot rotationally (rotational grazing in five plots, one plot for 6 days, so it has a whole rotational grazing every 30 days); the 6 sheep were continuously grazed in every CG plot; and in the meantime grazing was forbidden in all UG plots. All factors considered, the grazing rate in CG, which was consistent with that in RG, was 9 sheep per hectare per 5 grazing months per year. Management details and soil properties were summarized in Table 1.

2.3. Gas Flux Measurements

Fluxes of CH4 and ecosystem respiration (Re, CO2) were measured using static opaque chambers and gas chromatography [23]. The static chambers were made of stainless steel (thickness = 1 mm) and consisted of two parts. The first part was a pentahedral chamber (length × width × height = 0.4 m × 0.4 m × 0.4 m) with removable bottom, covered with a 3 cm thick layer of foam insulation in order to avoid plant photosynthesis and prevent heat exchange inside and outside the chamber. The chamber was fitted with a gas balance tube, a digital display thermometer and a gas samples interface. The second part of the static chamber was a square base frame without a top and bottom (length × width × height = 0.4 m × 0.4 m × 0.2 m). In the six RG plots one base frame was inserted into soil and in every CG two base frames were installed but at least 10 m apart and were observed simultaneously. Settings in UG were the same way as in CG. Meanwhile, in order to reduce direct destruction and disturbance to the sampling area, all base frames were installed at least one week before sampling. During every sampling time, five air samples were collected from the closed chambers at fifteen-minute intervals using 60 mL plastic syringes only from 9:00 to 13:00. On the basis of variation in concentrations over time of 5 gas samples, we used a nonlinear fitting method to obtain gas flux rates at the outset of the measurement [24,25]. In order to avoid pressure changes in the chamber when sampling, the chambers included gas balance tubes. We collected the air samples once a week in the growing season, twice a week during periods of freeze-thaw (around March) and twice a month during periods when the soil was frozen.
Concentrations of CH4 and CO2 were analyzed by a gas chromatograph (Agilent 7890A) equipped with a flame ionization detector (FID) operated at 200 °C. CH4 was detected directly by FID through a 2 m × 2 mm stainless steel column packed with 13XMS (60/80). CO2 was separated from other components in a 2 m × 2 mm stainless steel column packed with Porapak Q (60/80) and entered a nickel catalytic converters (375 °C) where it was converted by hydrogen into CH4 so that it could be detected by FID. The column oven temperature was 55 °C and the carrier gas was N2 (99.999%) flowing at 30 mL min−1; combustion gas was H2 (99.99%) flowing at 35 mL min−1; assistant combustion gas was air flowing at 400 mL min−1. All gas samples were analyzed within 24 h of sampling.

2.4. Auxiliary Measurements

Soil temperature (at 5 cm depth) and soil moisture (0–6 cm) were measured by digital thermocouples (JM624, Liwen Electronics LTD, Tianjin, China) and a portable moisture probe meter (MPKit, Ruidisheng Science and Technology LTD, Nanjing, China) during the gas sample collection. Daily precipitation and air temperature were obtained from the local meteorological station. During the winter time, when soil was frozen, samples of the soil layer (0–6 cm) were taken back to laboratory and dried at 105 °C for 24 h to determine the gravimetric water content. Then both volumetric water content and gravimetric water content were converted into water filled pore space (WFPS, %), calculation as follows:
Volumetric water content = gravimetric water content × soil bulk density
Total porosity = 1 − soil bulk density/2.65
WFPS (%) = volumetric water content /total porosity
Soil samples at the depth of 0–15 cm were collected during the gas sampling process and were taken back to the laboratory to measure NH4+-N, NO3-N (1 mol/L KCL extraction) and DOC (dissolved organic carbon, water-extraction). The bulk density, soil organic matter and soil available nitrogen were measured once a year and soil properties are summarized in Table 1.

2.5. Statistical Analysis

For statistical analysis and figure preparation, we used SPSS 20.0 and Origin 8.5 (Origin Lab Corporation, Northampton, MA, USA). To detect whether different treatments (RG, CG and UG) brought significant differences to CH4 flux and ecosystem respiration, an ANOVA was employed. Pearson correlation analysis was used to analyze the correlation between CH4 flux, ecosystem respiration and their influencing factors.

3. Results

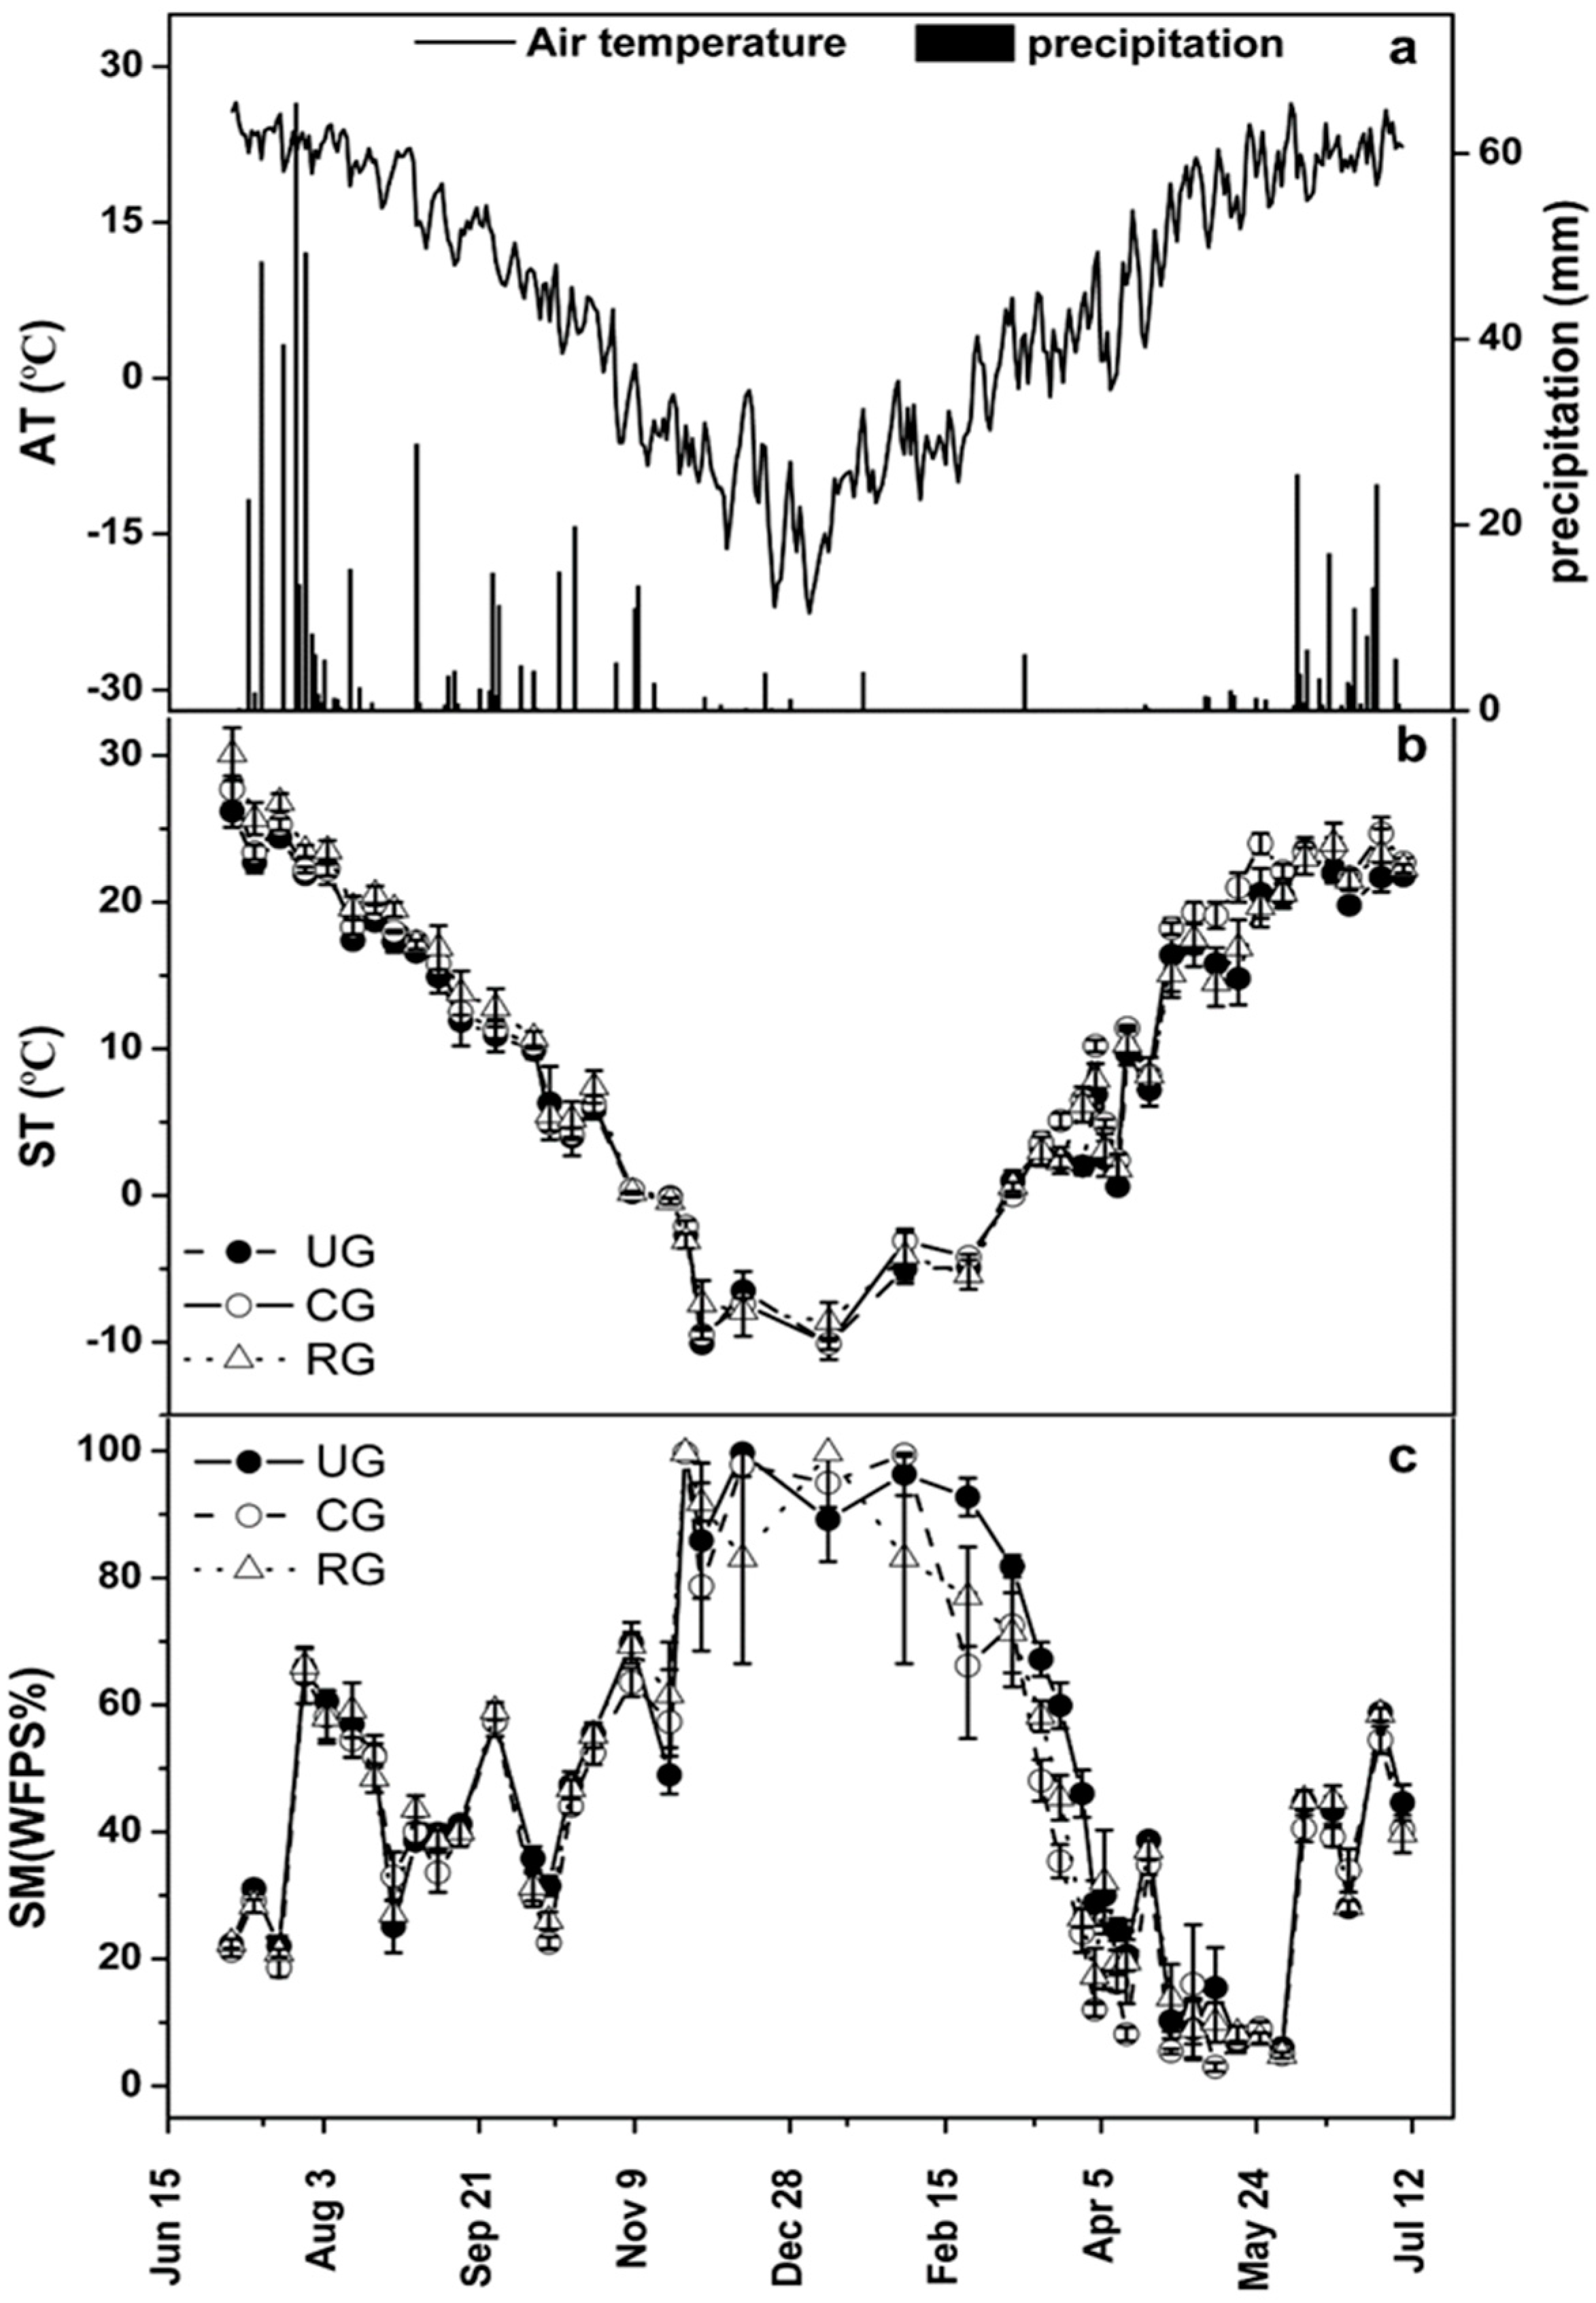
3.1. Environmental Factors

Figure 2 shows that precipitation, air temperature, soil temperature and soil moisture all have a distinct seasonal variation. The annual precipitation was 581 mm and the annual mean air temperature was 7.3 °C during the study period (from 5 July 2012 to 9 July 2013). The annual precipitation was above the longer-term average value (400 mm) and 82% of it occurred in June-September. The annual mean air temperature was slightly higher than the historic mean, with the maximum daily mean air temperature (26.5 °C) and minimum daily mean air temperature (−22.6 °C) occurring in July and January, respectively. We obtained the daily mean air temperature and daily precipitation data for the whole year of 2012 and 2013 from the weather bureau of Hohhot, China. We find that there is no significant difference between the two year’s daily mean air temperature (p = 0.47) and daily precipitation (p = 0.75).
There was a similar pattern for the soil temperature in CG, RG and UG plots. There were no significant differences in soil temperature among the three treatments (CG, RG and UG) (p > 0.05) (Figure 2b). Annual mean soil moisture was also not significantly different between CG, RG and UG plots (p > 0.05, WFPS %), with 41.6% in CG, 46.4% in UG and 44.0% in RG (Figure 2c). As can be seen in Figure 2, from November 2012 to February 2013 soil moisture was the highest of the entire period of observation while soil temperature dropped under 0 °C and precipitation barely occurred. In order to gain a better understanding of the seasonal variation of greenhouse gas emissions during the period of observation, we divided the whole year into three periods: the growing season (from July 2012 to October 2012 and from May 2013 to July 2013), the freezing period (when the water was frozen in the soil, from November 2012 to February 2013), and the freezing-thawing period (from March 2013 to April 2013).

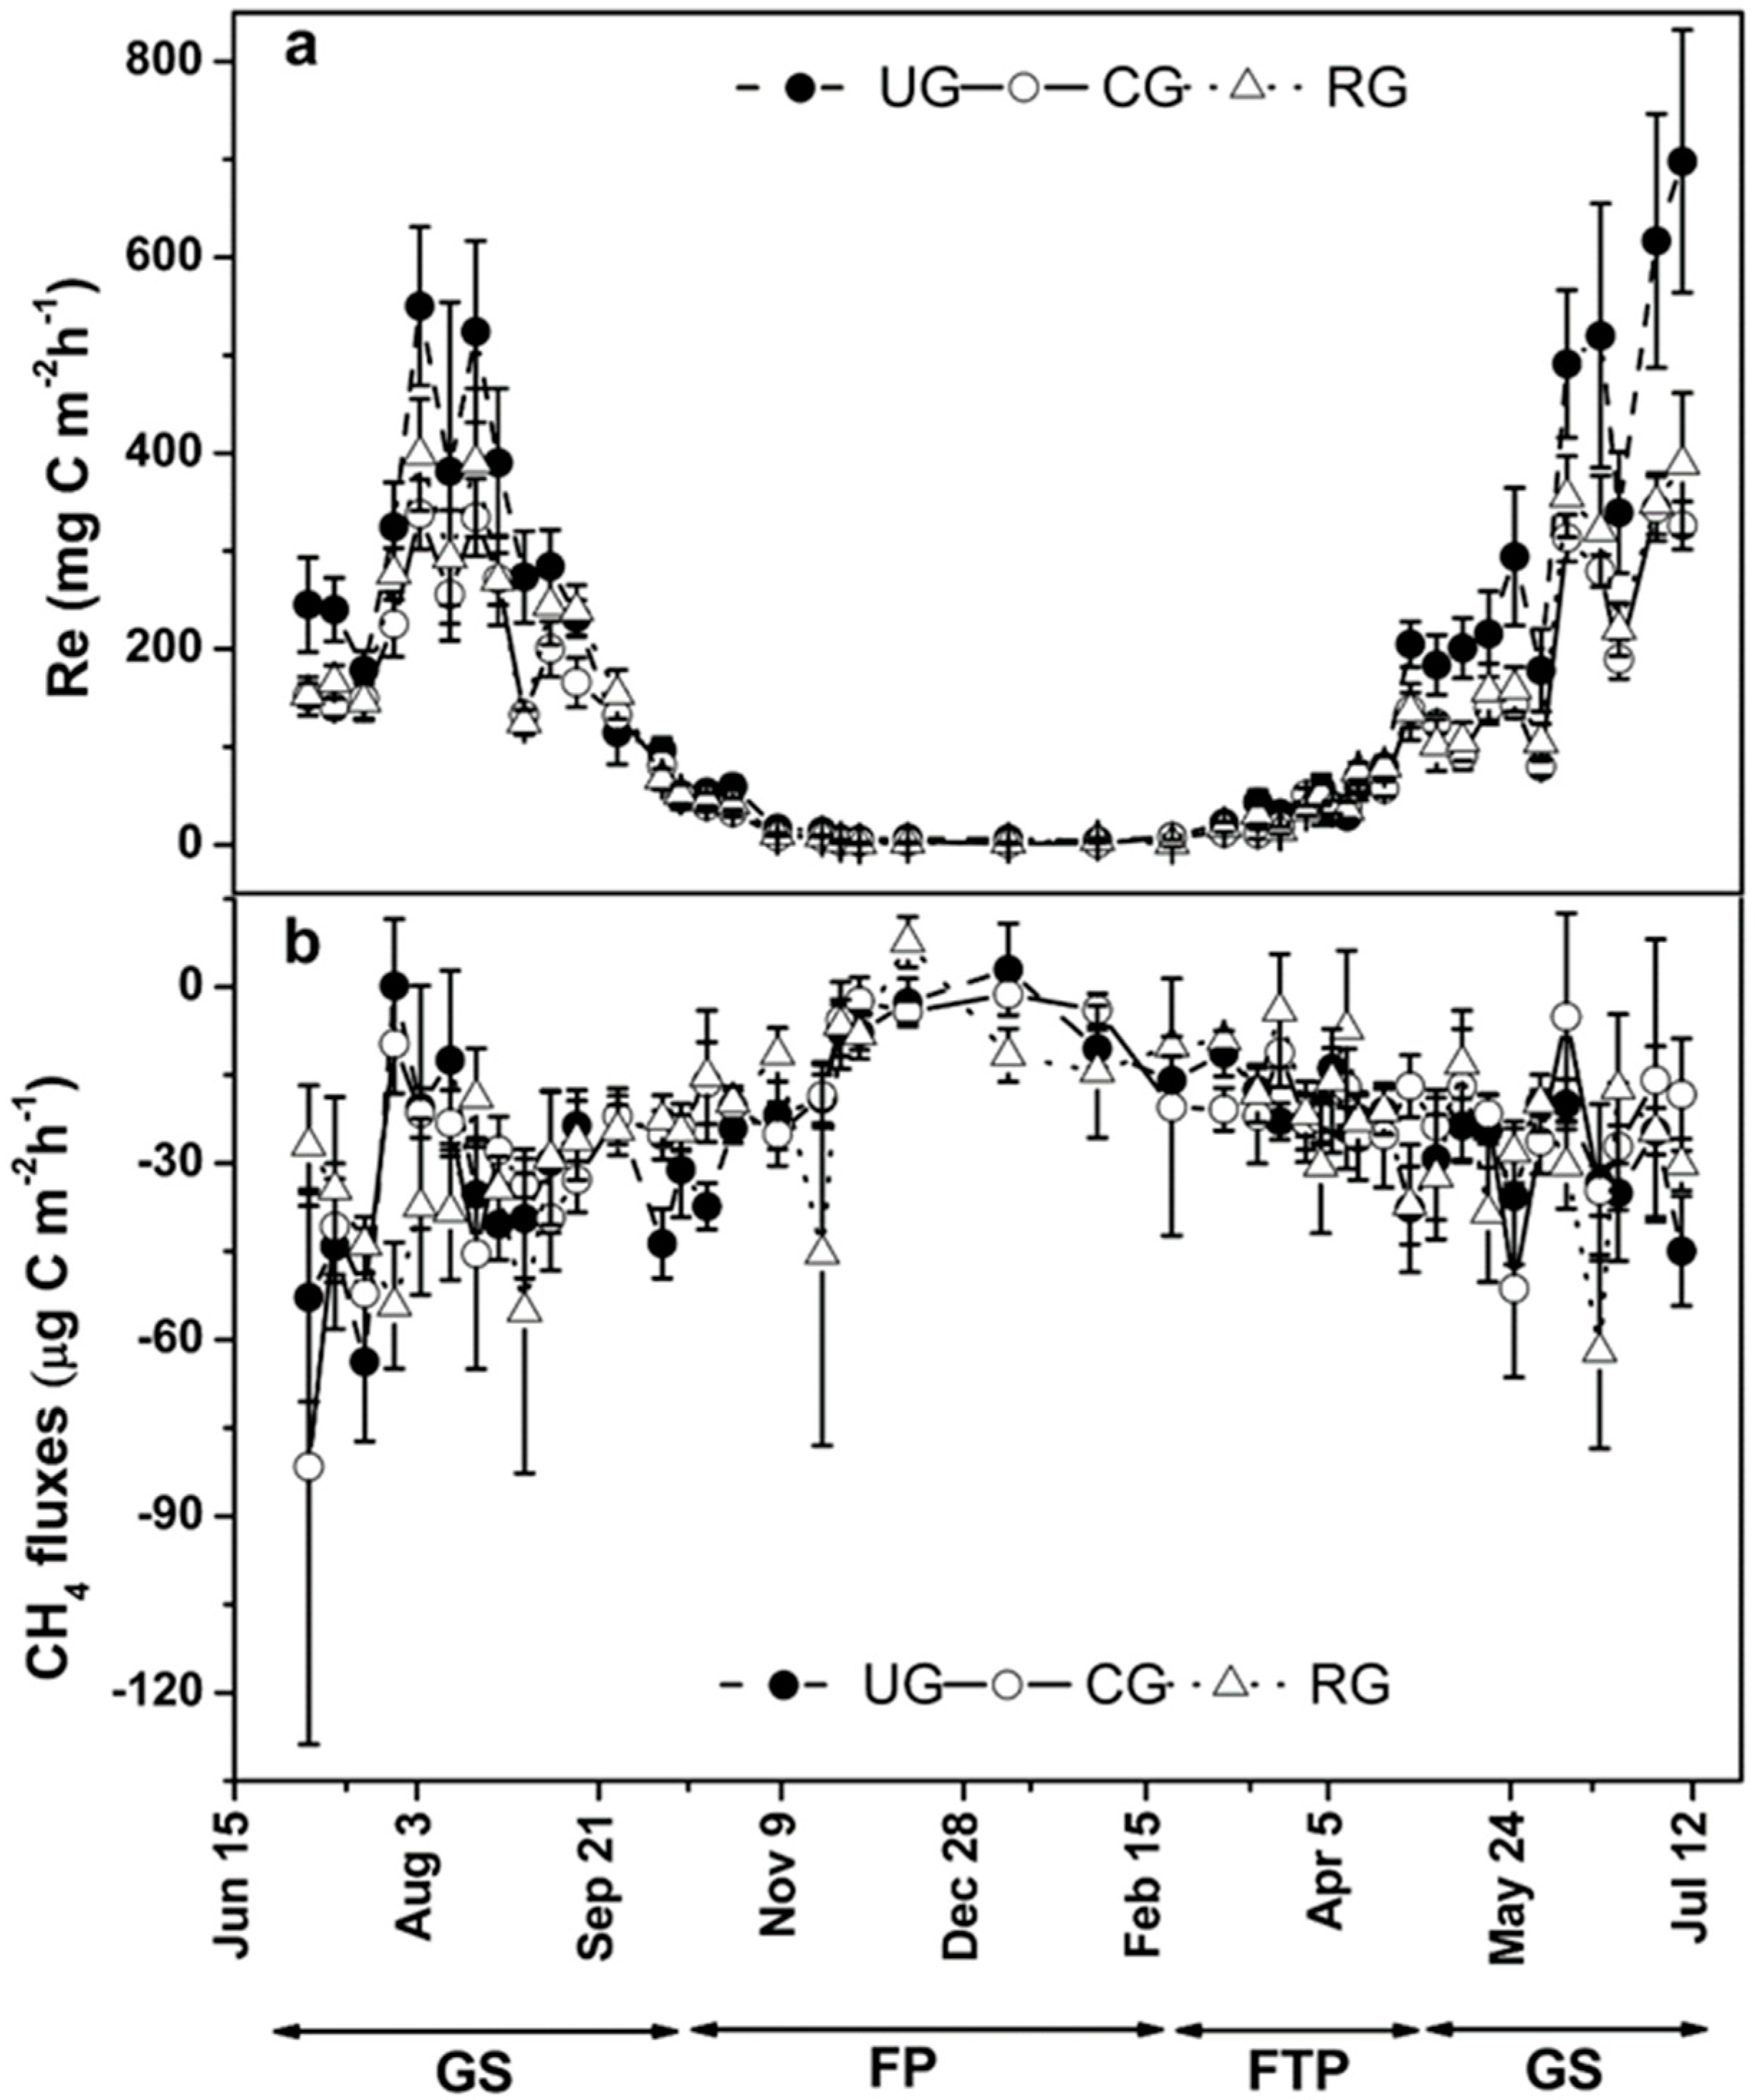
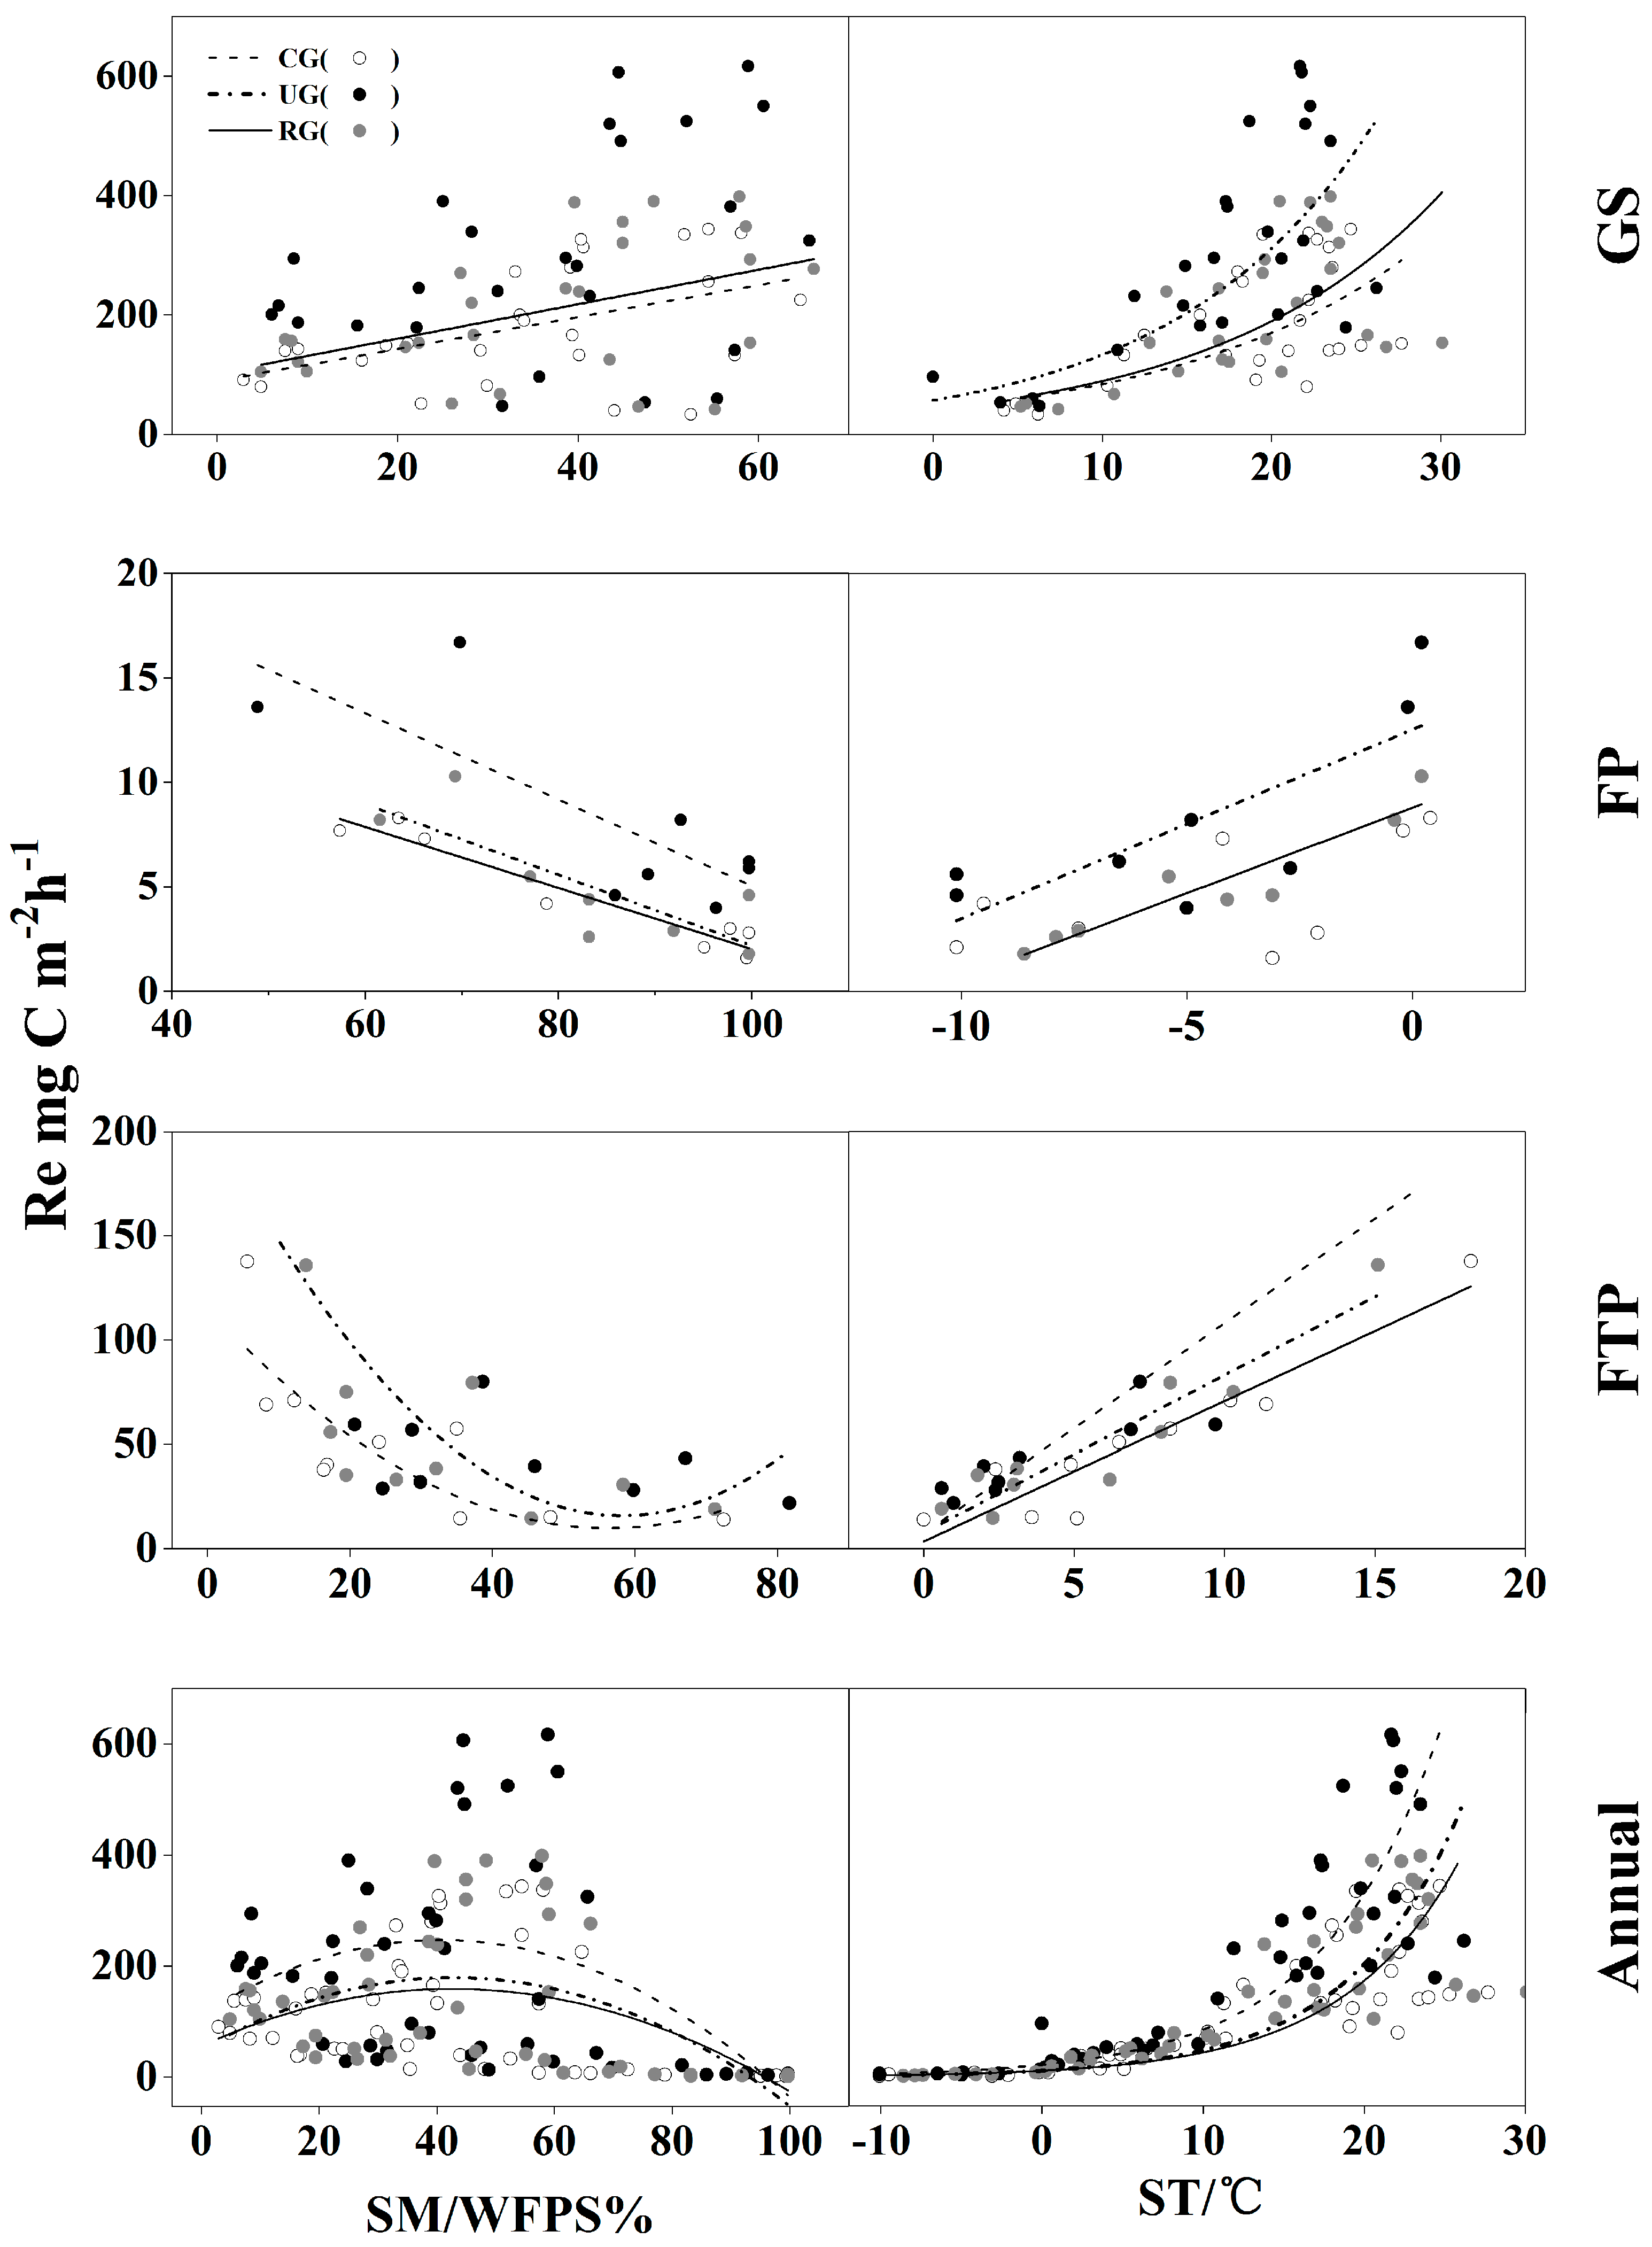
3.2. Ecosystem Respiration
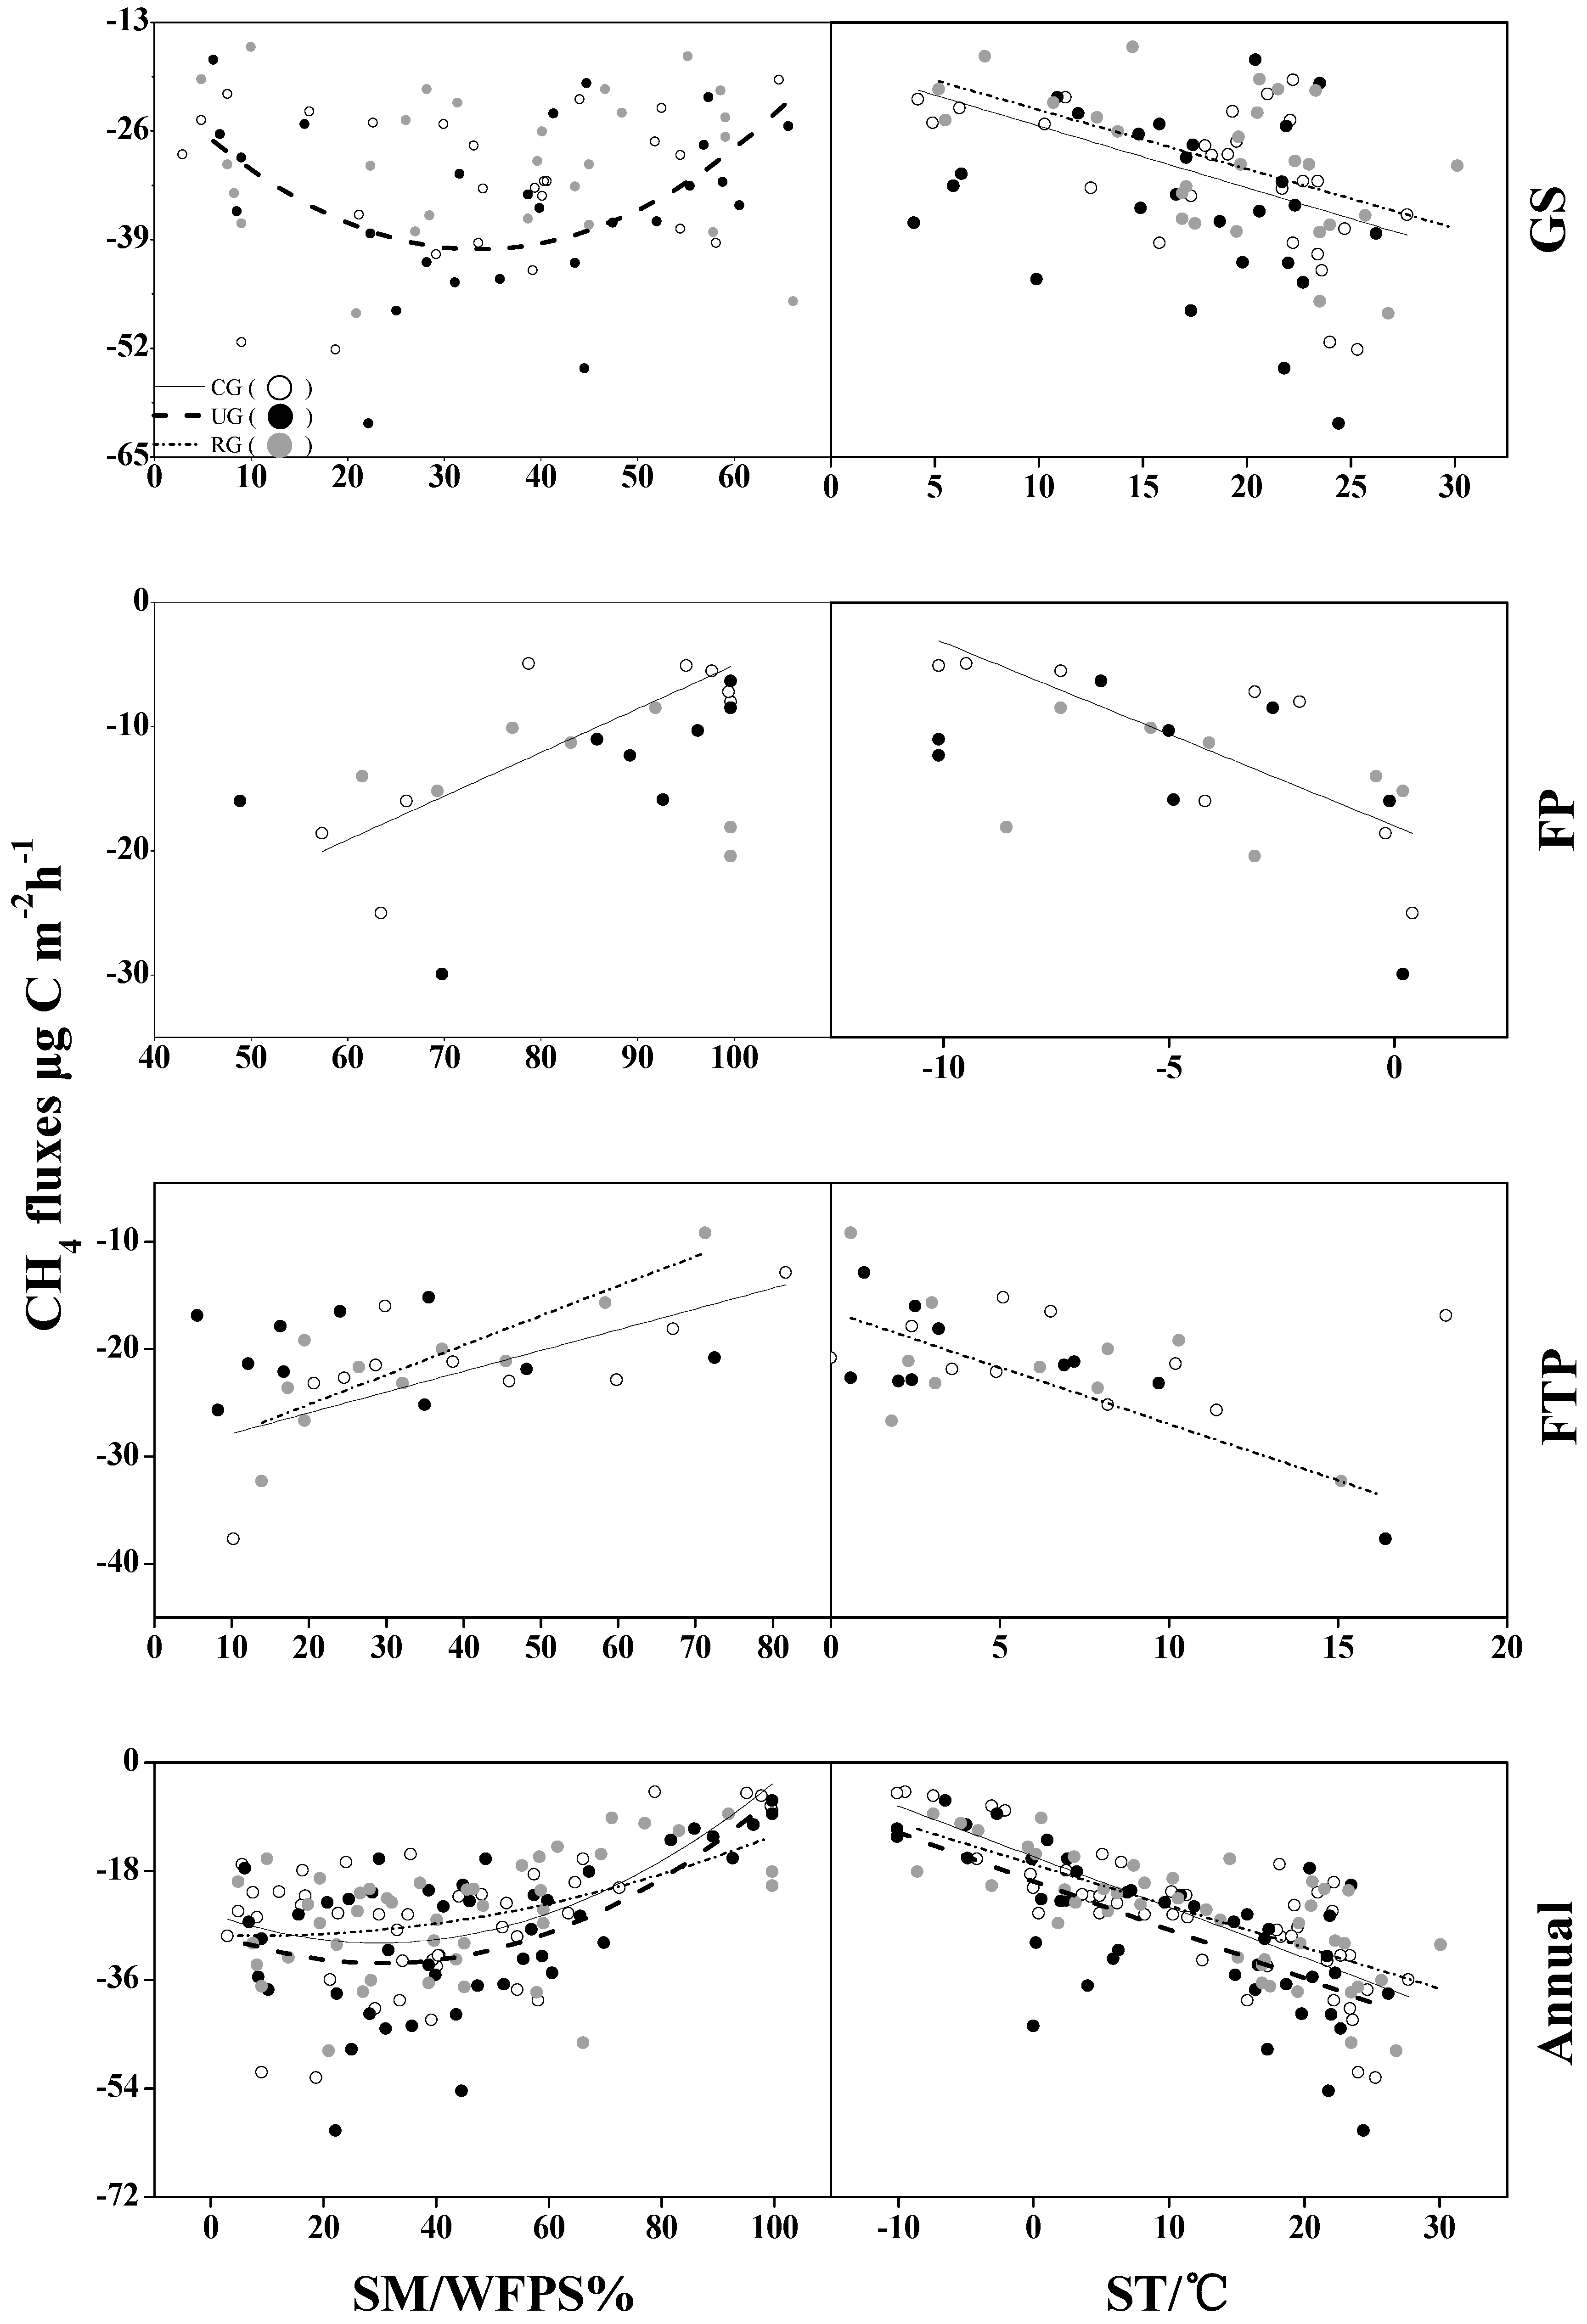
The ecosystem respiration of all plots ranged from 1.6 to 617 mg C m−2 h−1, with the peak value occurring on 2 July 2013 in UG and the lowest value recorded on 2 February 2013 in CG. During the observation period, there were significant differences between CG and UG (p < 0.01), RG and UG (p < 0.01), RG and CG (p < 0.01) in CO2 emission. Grazing did not change the seasonal pattern of CO2 emission in CG, RG and UG (Figure 3a). The annual mean CO2 emissions for CG, UG and RG were 119.9 ± 108.7 mg C m−2 h−1, 189.8 ± 185.6 mg C m−2 h−1 and 134.0 ± 124.8 mg C m−2 h−1, respectively. The mean CO2 emission in UG was 62.6% and 44.1% higher than that in CG and RG during the growing season and 43.2% and 38.3% higher during the freezing period and 14.6% and 13.1% higher during the freezing-thawing period (Table 2). Ecosystem respiration in the growing season accounted for 88.9% (in CG), 90.3% (in UG) and 90% (in RG) of the annual emission, respectively.
Soil temperature and soil moisture are both important in controlling CO2 production but their importance varies with different observation periods. According to the regression equations in Table 3, soil temperature was the primary environmental factor that determined CO2 emission in the growing season, in the freezing-thawing period and on a full year scale (CG, UG, RG). Soil moisture became relevant to CO2 emission on a full year scale (CG, UG, RG) and in the growing season (CG, UG) (Table 3). The data for that time frame are reflected in the Figure 2 and Figure 3. Meanwhile, NH4+-N, NO3-N and DOC seemed to have little effect on CO2 emissions except for the UG treatment (Table 3).
As Table 4 shows, CO2 emissions were positively affected by soil temperature (p < 0.01) in all the treatments except the freezing period in CG. There was a significant positive linear relationship between CO2 emission and soil moisture in CG and RG during the growing season and there was a negative linear relationship in UG, CG and RG during the freezing period and those two showed a significant nonlinear correlation in UG and CG during the freezing-thawing period (Figure 4). For the whole year, a nonlinear correlation illustrated that the annual CO2 emission reached a peak while soil moisture was around 42.8%, 40.6% and 42.8% (WFPS) in CG, UG and RG, respectively (Table 4 and Figure 4).

3.3. Methane Fluxes

The CH4 fluxes from CG, UG and RG were nearly all negative, meaning that the pasture was a net sink for atmospheric CH4. The annual mean CH4 fluxes for CG, UG and RG were −25.4 ± 11.0 μg C m−2 h−1, −27.9 ± 12.2 μg C m−2 h−1 and −25.1 ± 9.4 μg C m−2 h−1 (mean ± stdev), respectively (Table 2). The CH4 fluxes were not significantly affected by the three different grazing patterns (CG, UG and RG) (p > 0.05) during the observation period (Figure 3b). The highest measured CH4 flux (−81.6 μg C m−2 h−1) occurred on July 5, 2012 in CG, while the minimum CH4 flux (−1.3 μg C m−2 h−1) occurred on 9 January 2013 in CG. Comparing to the freezing period and freezing-thawing period, CH4 fluxes were highest in the growing season (Table 2). During the growing season, CH4 uptake accounted for 70% (CG), 65.2% (UG) and 61.9% (RG) of the annual uptake, respectively.
According to stepwise regression analysis, soil temperature was the most important environmental factor driver of temporal variability in CH4 fluxes (Table 5), explaining 45.2%–63.9% of the annual variation in the three grazing pattern plots (Table 6). Annual CH4 fluxes in the three treatments plots were strongly negatively correlated with soil temperature (p < 0.01). However, as Figure 5 shows, instead of a linear relation, annual CH4 flux showed a concave-shaped relationship with soil moisture, namely, for each peak of CH4 absorption in CG, RG and UG there is a distinct optimum soil moisture value (30.0% in CG, 32.4% in RG and 30.7% in UG) (Table 6 and Figure 5). In addition, Table 5 reveals that variability in NH4+, NO3 and DOC had little effect on CH4 flux (except for the UG treatment).

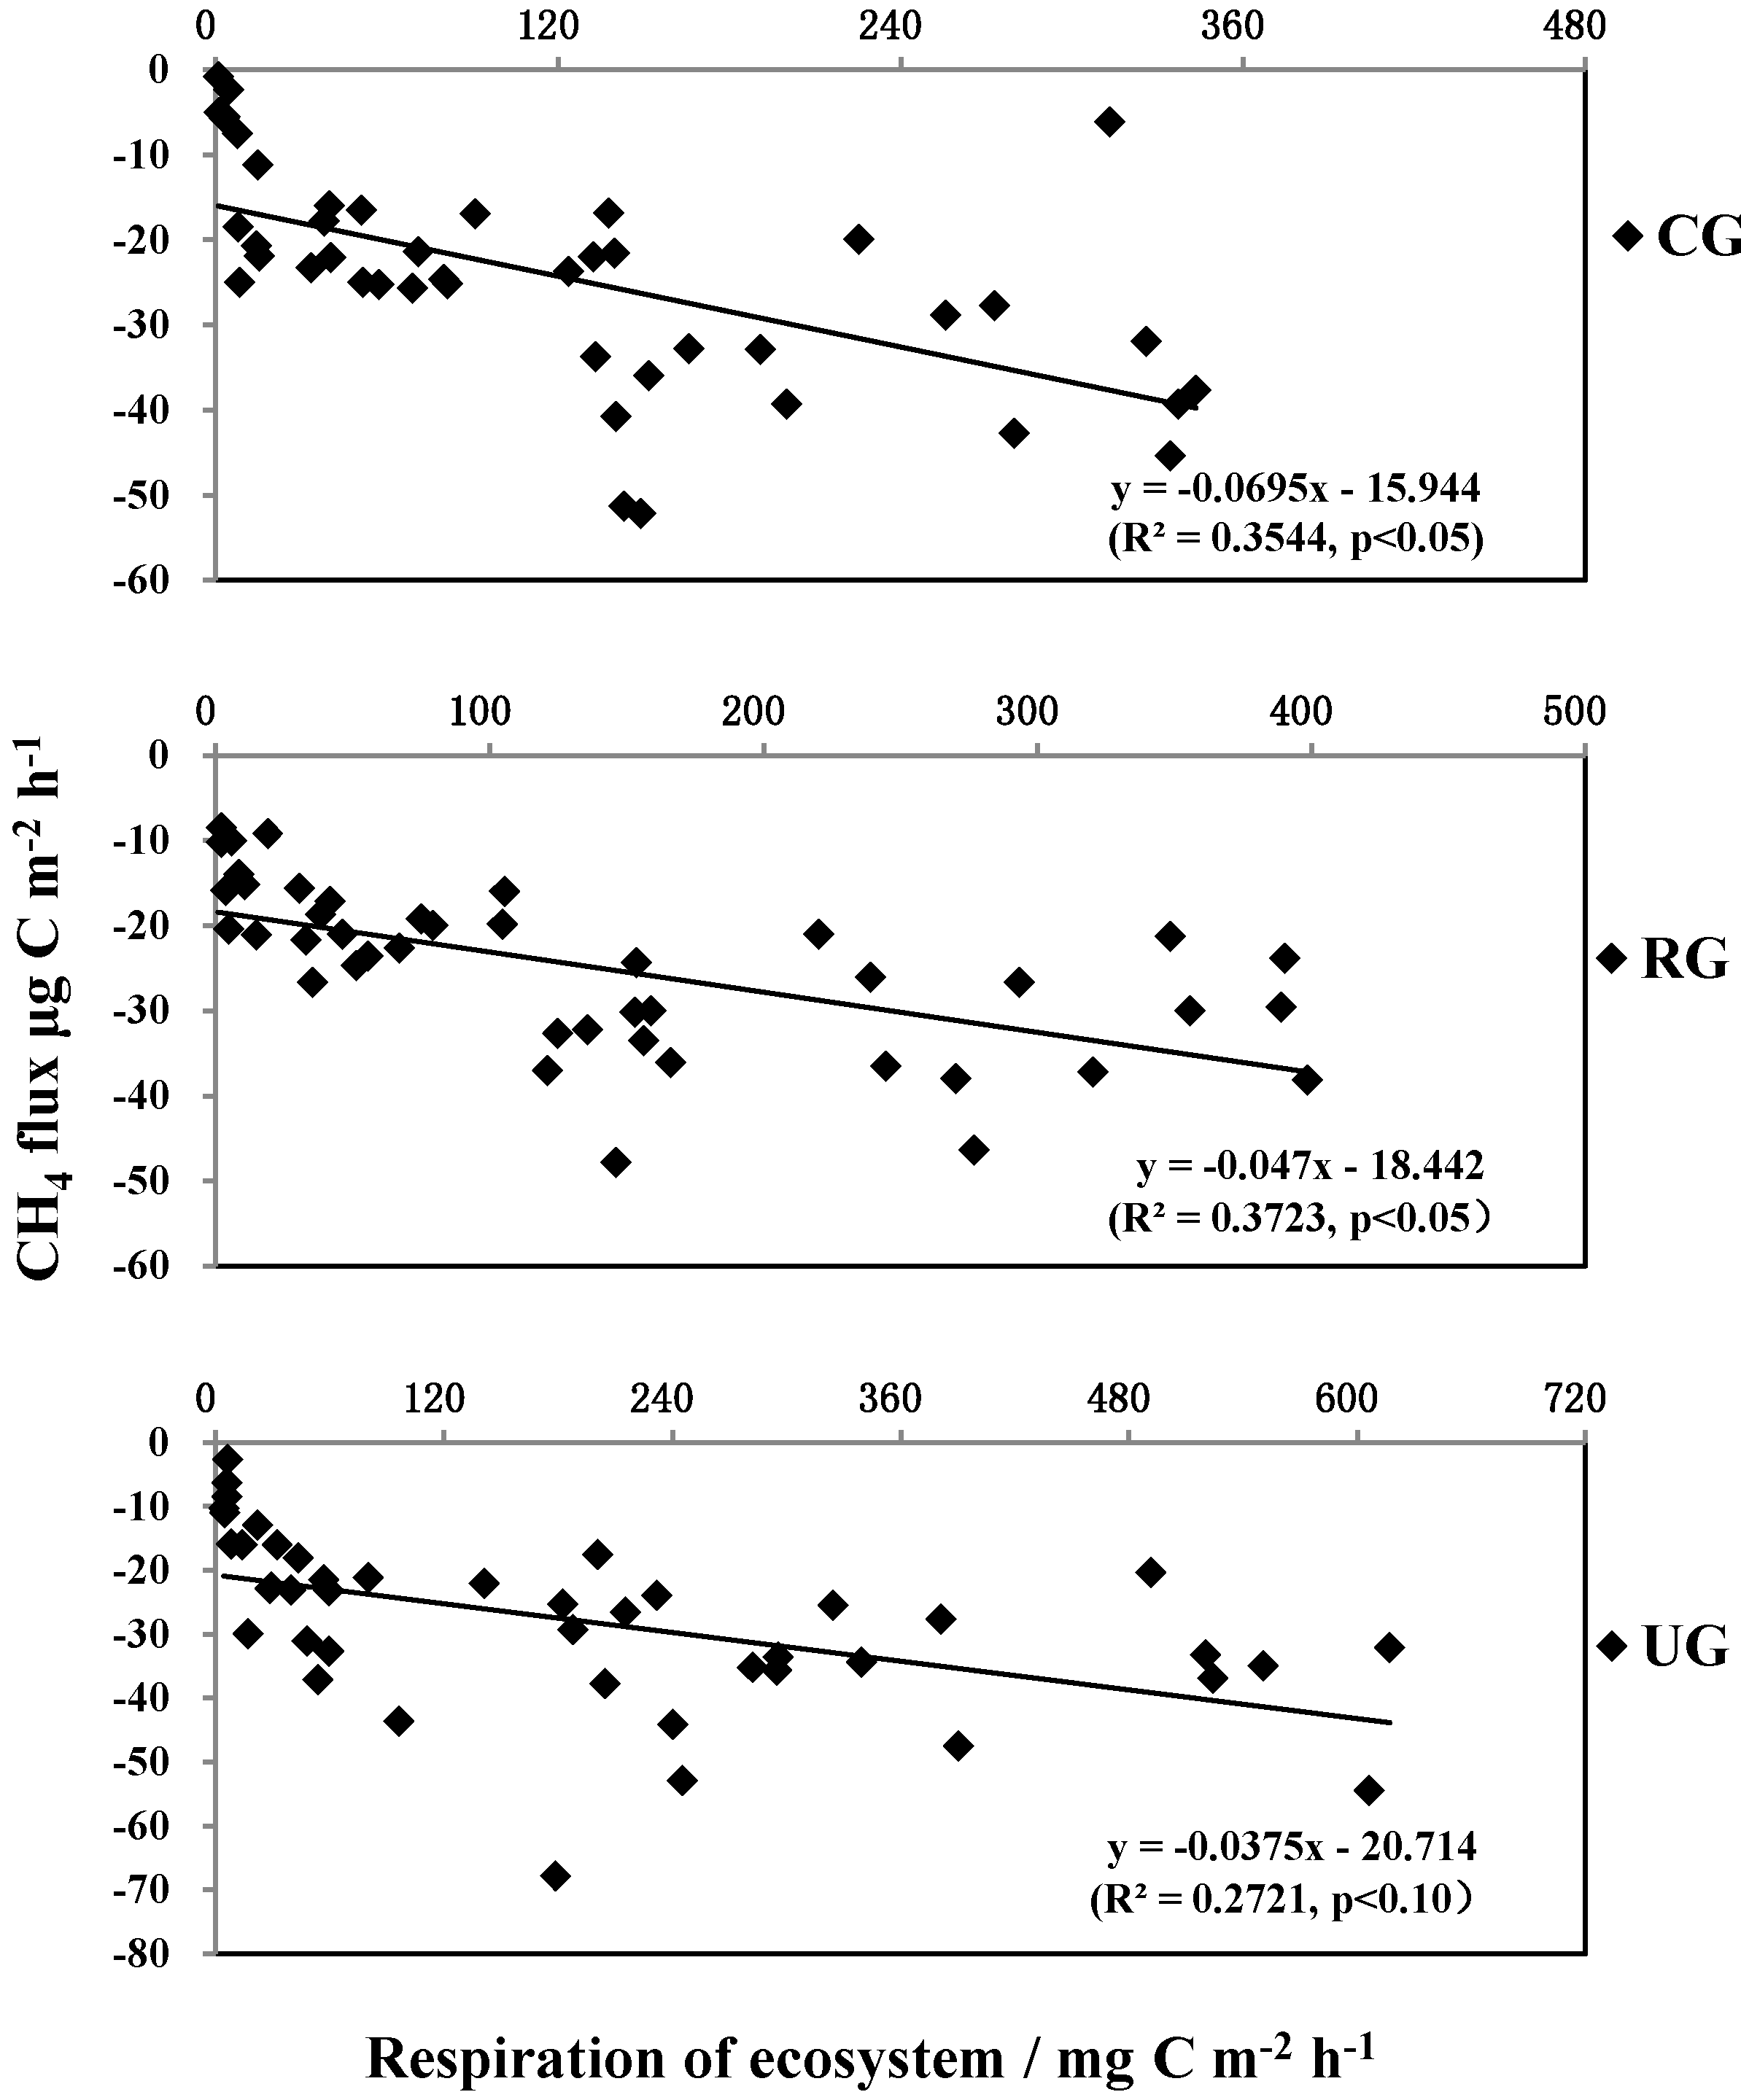
3.4. The Relationship between CH4 Flux and Ecosystem Respiration (Re)

There is a significant linear correlation between CH4 flux and ecosystem respiration in CG (p < 0.05) and RG (p < 0.05) plots but the correlation in UG (0.05 < p < 0.10) is not significant (Figure 6). In all grazing treatments, higher respiration values are associated with more negative CH4 fluxes.

4. Discussion

4.1. Ecosystem Respiration (Re)

Respiration plays a key role in the global carbon cycle and it can prominently influence soil-atmospheric CO2 exchange and net soil organic carbon (SOC) storage [26]. Similar to results obtained in other studies, we found a peak in respiration (88.9%–90.3% of annual Re) occurred during the growing season. Highest values of Re also tended to be associated with soil moisture, as observed in other works [16,27]. Re peaked in UG on 2 July 2013 right after four consecutive days of rainfall, which might have affected respiration in two ways: high soil moisture may have enhanced biological activities and the large amount of surface litter fall in UG plots, which resulted from the lack of grazing, supplied substrate for microbial respiration.
The Re observed in grassland has a large uncertainty. In our study, mean annual Re ranged from 119.9 mg C m−2 h−1 in CG to 189.8 mg C m−2 h−1 in UG. For comparison, we selected studies that have vegetation and climate similar to our site, as illustrated in Table 7. Fu et al. [28] reported considerably lower rates of respiration, which may be the result of methodological differences (eddy covariance versus the static opaque chamber—gas chromatography technique that we used). When measuring soil CO2 efflux, the results from eddy covariance and chamber methods are in agreement at night but they are significantly different during daytime [29,30].The results from Yan et al. [31] are close to ours, which might be because we both used the chamber method. And furthermore, Cheng et al. [32] measured Re in soils along a transect from southern Inner Mongolia to the whole Ningxia province, concluding that Re from soils with plant cover ranged from 44 to 345 mg C m−2 h−1 with a mean value of 133 mg C m−2 h−1, which was consistent with our results. But their results also have a large range, which might be due to spatial variability among those experimental sites in drivers such as precipitation and soil temperature. In addition, the general lack of annual observation data in very cold regions also creates considerable uncertainty. For example, there are few long-term continuous measurements of arctic tundra CO2 fluxes over the full annual cycle [33]. Even if the soil is frozen, CO2 emissions still occur. Lange et al. reported that once the soil was frozen, CO2 concentrations increased throughout the frozen period, even during very cold conditions, indicating net CO2 production [34].
Annual CO2 emission was best predicted by soil moisture and temperature, which explained 70.8%–79.5% of the variation in annual CO2 emission. The same results were found in an earlier experiment conducted in a typical steppe in central Mongolia. Using a stepwise multiple regression analysis, the authors found that soil volumetric water content, soil temperature and aboveground green biomass were the three main factors that affect ecosystem respiration, and that aboveground green biomass was the primary factor related to ecosystem respiration [16]. Other studies also found that soil temperature and soil moisture played the major role in driving the temporal CO2 emission variation [35,36]. For example, Bai et al. think that soil moisture and temperature were positively correlated with CO2 emissions [35]. Sun et al. obtained similar the same results of Bai et al., they pointed out that temporal variations of CO2 emission were strongly correlated with air and sediment temperatures [36].These results suggest that higher soil temperatures affect the root systems, enhancing root respiration and microbiological activity along with soil organic matter mineralization [37]. In this study, there is an exponential relationship between ecosystem respiration and soil temperature on a yearly scale and during the growing season (Figure 4). These results agree with many other studies ([38,39]). For example, Wagle and Kakani reported that exponential temperature–respiration functions provided a good fit for soil temperature <30 °C and <23 °C during the 2011 (a) and 2012 (b) growing seasons. Ecosystem respiration declined beyond 30 °C in 2011 and beyond 23 °C in 2012, and the exponential functions were highly significant (p < 0.0001) after excluding data points beyond these ranges [38]. We think that the consistency of the results in Wagle and Kakani’s study and our study may be because of the consistency of the soil temperature in the two studies. Almost all of the soil temperature values (44 data points were observed in a year) in our study are below 30 °C and most of them are below 23 °C (Figure 2). However, when soil temperature is low, such as in freezing period (FP) and freezing-thawing period (FWP), the relationship between ecosystem respiration and soil temperature becomes linear (Figure 4).

4.2. CH4 Flux

Recent evidence suggests that semiarid grassland is an important sink for atmospheric CH4 ([40,41,42]) and results from our study). With a mean annual CH4 uptake of 26.1 µg C m−2 h−1 (Table 8), mean CH4 uptake from all three treatments ranged from 25.1 to 27.9 µg C m−2 h−1 (Table 2). As Table 8 shows, in comparison with rates of annual mean CH4 uptake [11,42], mean rates of CH4 uptake measured during the growing season only were much higher [40,43,44]. Moreover, results from our study show that CH4 uptake in the non-growing season accounts for 25%–33% of the annual CH4 uptake (Table 2), which is consistent with the result (15%–30%) of an experiment conducted in a short-grass steppe in North America [45]. Current estimates of annual CH4 exchange rates between steppe soils and the atmosphere will have high uncertainty if CH4 uptake is only measured during the growing season [46]. From Table 8, we can see that CH4 uptake rate will be overestimated when it is measured only in the growing season, because the CH4 uptake rate in the growing season is always higher than average annual rates.
In our study, annual CH4 fluxes had a significant negative correlation with soil temperature in all plots (p < 0.01, Table 6), similar to results obtained by other researchers [13,21]. Some researchers have concluded that higher temperature and reduced moisture increase net CH4 uptake in terrestrial ecosystems, as they invariably increase gas diffusion rates and microbial access to oxygen and atmospheric CH4 [47]. Even though the effect of soil moisture on CH4 flux is less important than the influence of soil temperature (Table 5), a concave-shaped relationship was found between annual CH4 fluxes and soil moisture in all three treatments (Figure 5). A similar relationship was also observed in an experiment conducted in the High Plains Grasslands (United States) and the relationship between CH4 uptake and WFPS was hump-shaped with an optimum WFPS around 24% [48]. This might be due to the fact that the CH4 uptake rate is limited by low diffusivity of CH4 into the soil at high soil moisture contents, while very low moisture contents limit the biological activity of methanotrophs.
Some other studies found that soil temperature and soil moisture played the major role in driving temporal variation in CH4 emissions [49,50,51]. Among them, Zhao et al. found that during the growing season, soil temperature played the dominant role in driving CH4 emissions [49]. Rong et al. reported that seasonality of CH4 uptake was related to monthly mean temperature and precipitation, which together explained 56% (range: 40%–83%) of the variability in monthly cumulative soil CH4 uptake [50]. Roy Chowdhury et al. concluded that temporal dynamics of CO2 production and methanogenesis at −2 °C showed evidence of fundamentally different mechanisms of substrate limitation and inhibited microbial growth at soil water freezing points compared to warmer temperatures [51].

4.3. Effects of Grazing on Ecosystem Respiration and CH4 Flux

Alternative and appropriate grazing management can be beneficial to increase plant production and decrease ecosystem respiration, mitigating the negative effects of global climate change on the CO2 balance in grassland ecosystems [52,53]. We obtained similar results in our study, as ecosystem respiration was 5.4 t C ha−1 year−1 lower in CG and 4.4 t C ha−1 year−1 lower in RG than that in UG. If we allot this ecosystem respiration to the sheep (which ate grass in the CG and RG plots), each sheep reduced CO2 emission by 1.2 kg C ha−1 year−1 in CG and 1.0 kg C ha−1 year−1 in RG, showing that grazing significantly reduces ecosystem respiration (p < 0.01). The reason for this decline might be the reduction of aboveground biomass caused by sheep grazing in CG and RG. Moreover, different grazing patterns (CG and RG) have significantly different influences on Re. The Re in CG plots is significantly lower than that in RG plots (p < 0.01). It may be because the rotational grazing method gives recovery time for grass, so there is more aboveground biomass in RG plots than that in CG plots and there is more Re emission in RG than that in CG. However, because we have no data of carbon uptake (The absorption of carbon by photosynthesis was not considered), we can only provide limited information on the carbon balance.
Some previous studies have found that grazing exerts a considerable negative impact on CH4 uptake in semi-arid steppes at regional scales during wintertime [19] but light-to-moderate grazing did not significantly change the annual CH4 uptake [14]. Another study in China got a similar result, finding that heavy grazing depressed soil CH4 uptake by 36% but light and moderate grazing had no significant effects in grassland ecosystems. The response of grassland soil CH4 uptake to grazing also was found to depend upon grazing intensity, grazing duration and climatic types [54]. The CG and RG in our study can be characterized as moderate grazing and did not result in any significant difference in CH4 uptake among the CG, UG and RG plots. Although the grazing pattern was different in CG and RG, grazing intensity was the same on an annual scale by 9 sheep ha−1 year−1. As shown in Table 2, CH4 uptake in CG and RG were 0.23 kg C ha−1 year−1 and 0.20 kg C ha−1 year−1 lower than that of UG respectively. This may be attributed to the soil compaction caused by sheep trampling, which leads to an anaerobic environment. However, the influence is not statistically significant. In summary, moderate grazing (CG and RG in our study) did not influence CH4 uptake significantly.
Not all results from past studies are consistent. For example, a study, in an alpine steppe on the Tibetan Plateau, China, thought that no grazing enhanced CH4 uptake by 17.8% and 33.8% in 2009 and 2010, respectively, while its effect on CO2 emission (ecosystem respiration) was not significant [55]. Gao et al. reported that long-term cattle grazing increased soil CO2 fluxes, while the grazing effect on CH4 uptake depended on precipitation [56]. The effects of grazing on ecosystem respiration and methane flux are complex. Different results obtained from different locations may be due to different climate and soil characteristics, not just due to grazing.

5. Conclusions

In the sown grassland, grazing significantly reduced ecosystem respiration, with reductions in both continuously grazed and rotationally grazed plots. We find that the sown grassland is a net sink for atmospheric CH4, but no influence of grazing pattern was observed on CH4 flux in CG, RG and UG. Soil temperature is the most important factor influencing ecosystem respiration and CH4 flux in the sown grassland, with soil moisture playing second only to soil temperature. Variation in levels of ammonium nitrogen, nitrate nitrogen and dissolved organic carbon had little influence on ecosystem respiration or CH4 flux (except UG plots). The values obtained for ecosystem respiration of grasslands have a large uncertainty range, which may be due to spatial variability as well as differences in research methods. Mean CH4 uptake measured only during the growing season was much higher than the annual mean CH4 uptake. Methane uptake rate will thus be overestimated when it is measured only in the growing season. In this study we measured ecosystem respiration, but future work should measure carbon uptake and changes in biomass to illustrate CO2 exchange, not just ecosystem respiration. Availability of NH4+-N, NO3-N and DOC in soils seemed to have little effect on ecosystem respiration and CH4 fluxes except for the UG treatment, a finding that will be explored in more detail with collection of additional data.

Author Contributions

Conceptualization, Z.Z.; Formal analysis, Z.Y.; Funding acquisition, B.M.; Investigation, H.Y.; Methodology, B.M. and X.Z.; Project administration, X.Z.; Resources, Q.Z.; Supervision, B.M.; Writing—original draft, H.Y.; Writing—review & editing, W.H.M.

Funding

The National Natural Science Foundation of China: 41665010.

Acknowledgments

This work is funded by the following projects: The National Natural Science Foundation of China (No.41665010) and the National Key Research and Development Program of China (No.2016YFA0600804). We wish to thank Zhuoyi Wang, Hongxia Wang, Shuxin Tian, Aruhan, Gaojie Ren and Suhe for their help in field experiments and laboratory experiments. The authors are also grateful to Junjie Duan for his help at the experimental site.

Conflicts of Interest

The authors declare no conflicts of interest.

References

  1. Intergovernmental Panel on Climate Change (IPCC). Climate Change 2013: The Physical Science Basis, in Contribution of Working Group I to the Fifth Assessment Report of the Inter-Governmental Panel on Climate Change. Chapter 6 Carbon and Other Biogeochemical Cycles. 2013, p. 467. Available online: https://www.ipcc.ch/report/ar5/wg1/ (accessed on 18 August 2017).
  2. Davidson, E.A. The contribution of manure and fertilizer nitrogen to atmospheric nitrous oxide since 1860. Nat. Geosci. 2009, 2, 659–662. [Google Scholar] [CrossRef]
  3. Dijkstra, F.A.; Morgan, J.A.; Follett, R.F.; LeCain, D.R. Climate change reduces the net sink of CH4 and N2O in a semiarid grassland. Glob. Chang. Biol. 2013, 19, 1816–1826. [Google Scholar] [CrossRef] [PubMed]
  4. Galbally, I.E.; Kirstine, W.V.; Meyer, C.P.; Wang, Y.P. Soil–Atmosphere Trace Gas Exchange in Semiarid and Arid Zones. J. Environ. Qual. 2008, 37, 599–607. [Google Scholar] [CrossRef] [PubMed]
  5. Schönbach, P.; Wolf, B.; Dickhöfer, U.; Wiesmeier, M.; Chen, W.; Wan, H.; Gierus, M.; Butterbach-Bahl, K.; Kögel-Knabner, I.; Susenbeth, A.; et al. Grazing effects on the greenhouse gas balance of a temperate steppe ecosystem. Nutr. Cycl. Agroecosyst. 2012, 93, 357–371. [Google Scholar] [CrossRef]
  6. Foley, J.A.; Ramankutty, N.; Brauman, K.A.; Cassidy, E.S.; Gerber, J.S.; Johnston, M.; Mueller, N.D.; O’Connell, C.; Ray, D.K.; West, P.C.; et al. Solutions for a cultivated planet. Nature 2011, 478, 337–342. [Google Scholar] [CrossRef] [PubMed] [Green Version]
  7. Zou, C.; Wang, K.; Wang, T.; Xu, W. Overgrazing and soil carbon dynamics in eastern Inner Mongolia of China. Ecol. Res. 2006, 22, 135–142. [Google Scholar] [CrossRef]
  8. Schwenke, G.D.; McLeod, M.K.; Murphy, S.R.; Harden, S.; Cowie, A.L.; Lonergan, V.E. The potential for sown tropical perennial grass pastures to improve soil organic carbon in the North-West Slopes and Plains of New South Wales. Soil Res. 2013, 51, 726–737. [Google Scholar] [CrossRef]
  9. Wang, C.; Wang, G.; Liu, W.; Wang, Y.; Hu, L.; Ma, L. Effects of establishing an artificial grassland on vegetation characteristics and soil quality in a degraded meadow. Isr. J. Ecol. Evol. 2013, 59, 141–153. [Google Scholar] [CrossRef]
  10. Lodge, G.M.; King, K.L. Soil microbial biomass, labile and total carbon levels of grazed sown and native pastures in northern New South Wales. Aust. J. Agric. Res. 2006, 57, 837–845. [Google Scholar] [CrossRef]
  11. Wolf, B.; Chen, W.; Brüggemann, N.; Zheng, X.; Pumpanen, J.; Butterbach-Bahl, K. Applicability of the soil gradient method for estimating soil–atmosphere CO2, CH4, and N2O fluxes for steppe soils in Inner Mongolia. J. Plant Nutr. Soil Sci. 2011, 174, 359–372. [Google Scholar] [CrossRef]
  12. Laubach, J.; Hunt, J.E. Greenhouse-gas budgets for irrigated dairy pasture and a winter-forage kale crop. Agric. For. Meteorol. 2018, 258, 117–134. [Google Scholar] [CrossRef]
  13. Wu, X.; Yao, Z.; Brüggemann, N.; Shen, Z.Y.; Wolf, B.; Dannenmann, M.; Zheng, X.; Butterbach-Bahl, K. Effects of soil moisture and temperature on CO2 and CH4 soil–atmosphere exchange of various land use/cover types in a semi-arid grassland in Inner Mongolia, China. Soil Biol. Biochem. 2010, 42, 773–787. [Google Scholar] [CrossRef]
  14. Chen, W.; Wolf, B.; Zheng, X.; Yao, Z.; Butterbach-Bahl, K.; BrÜGgemann, N.; Liu, C.; Han, S.; Han, X. Annual methane uptake by temperate semiarid steppes as regulated by stocking rates, aboveground plant biomass and topsoil air permeability. Glob. Chang. Biol. 2011, 17, 2803–2816. [Google Scholar] [CrossRef]
  15. Liu, C.; Holst, J.; Yao, Z.; Brüggemann, N.; Butterbach-Bahl, K.; Han, S.; Han, X.; Tas, B.; Susenbeth, A.; Zheng, X. Growing season methane budget of an Inner Mongolian steppe. Atmos. Environ. 2009, 43, 3086–3095. [Google Scholar] [CrossRef]
  16. Nakano, T.; Shinoda, M. Modeling gross primary production and ecosystem respiration in a semiarid grassland of Mongolia. Soil Sci. Plant Nutr. 2014, 61, 106–115. [Google Scholar] [CrossRef] [Green Version]
  17. Chen, W.; Zheng, X.; Chen, Q.; Wolf, B.; Butterbach-Bahl, K.; Brüggemann, N.; Lin, S. Effects of increasing precipitation and nitrogen deposition on CH4 and N2O fluxes and ecosystem respiration in a degraded steppe in Inner Mongolia, China. Geoderma 2013, 192, 335–340. [Google Scholar] [CrossRef]
  18. Jia, B.; Zhou, G.; Wang, Y.; Wang, F.; Wang, X. Effects of temperature and soil water-content on soil respiration of grazed and ungrazed Leymus chinensis steppes, Inner Mongolia. J. Arid Environ. 2006, 67, 60–76. [Google Scholar] [CrossRef]
  19. Liu, C.; Holst, J.; Brüggemann, N.; Butterbach-Bahl, K.; Yao, Z.; Yue, J.; Han, S.; Han, X.; Krümmelbein, J.; Horn, R.; et al. Winter-grazing reduces methane uptake by soils of a typical semi-arid steppe in Inner Mongolia, China. Atmos. Environ. 2007, 41, 5948–5958. [Google Scholar] [CrossRef]
  20. Hao, Y.; Wang, Y.; Mei, X.; Cui, X.; Zhou, X.; Huang, X. The sensitivity of temperate steppe CO2 exchange to the quantity and timing of natural interannual rainfall. Ecol. Inform. 2010, 5, 222–228. [Google Scholar] [CrossRef]
  21. Wang, Y.; Xue, M.; Zheng, X.; Ji, B.; Du, R.; Wang, Y. Effects of environmental factors on N2O emission from and CH4 uptake by the typical grasslands in the Inner Mongolia. Chemosphere 2005, 58, 205–215. [Google Scholar] [CrossRef]
  22. Wang, Y.; Zhou, G.; Wang, Y. Environmental effects on net ecosystem CO2 exchange at half-hour and month scales over Stipa krylovii steppe in northern China. Agric. For. Meteorol. 2008, 148, 714–722. [Google Scholar] [CrossRef]
  23. Wang, Y.; Ma, X.; Ji, B.; Du, R.; Chen, Z.; Wang, G.; Wang, Y.; Wan, X. Diurnal and seasonal variation in methane and nitrous oxide fluxes in meadow steppe of Inner Mongolia. Zhiwu Shengtai Xuebao 2003, 27, 792–796. [Google Scholar] [CrossRef]
  24. Kroon, P.S.; Hensen, A.; Bulk, W.C.M.v.d.; Jongejan, P.A.C.; Vermeulen, A.T. The importance of reducing the systematic error due to non-linearity in N2O flux measurements by static chambers. Nutr. Cycl. Agroecosyst. 2008, 82, 175–186. [Google Scholar] [CrossRef]
  25. Liu, C.; Zheng, X.; Zhou, Z.; Han, S.; Wang, Y.; Wang, K.; Liang, W.; Li, M.; Chen, D.; Yang, Z. Nitrous oxide and nitric oxide emissions from an irrigated cotton field in Northern China. Plant Soil 2010, 332, 123–134. [Google Scholar] [CrossRef]
  26. Oertel, C.; Matschullat, J.; Zurba, K.; Zimmermann, F.; Erasmi, S. Greenhouse gas emissions from soils—A review. Chem. Erde Geochem. 2016, 76, 327–352. [Google Scholar] [CrossRef]
  27. Chang, C.T.; Sabate, S.; Sperlich, D.; Poblador, S.; Sabater, F.; Gracia, C. Does soil moisture overrule temperature dependence of soil respiration in Mediterranean riparian forests? Biogeosciences 2014, 11, 6173–6185. [Google Scholar] [CrossRef] [Green Version]
  28. Fu, Y.; Zheng, Z.; Yu, G.; Hu, Z.; Sun, X.; Shi, P.; Wang, Y.; Zhao, X. Environmental influences on carbon dioxide fluxes over three grassland ecosystems in China. Biogeosciences 2009, 6, 2879–2893. [Google Scholar] [CrossRef] [Green Version]
  29. Dore, S.; Hymus, G.J.; Johnson, D.P.; Hinkle, C.R.; Valentini, R.; Drake, B.G. Cross validation of open-top chamber and eddy covariance measurements of ecosystem CO2 exchange in a Florida scrub-oak ecosystem. Glob. Chang. Biol. 2003, 9, 84–95. [Google Scholar] [CrossRef]
  30. Janssens, I.A.; Kowalski, A.S.; Ceulemans, R. Forest floor CO2 fluxes estimated by eddy covariance and chamber-based model. Agric. For. Meteorol. 2001, 106, 61–69. [Google Scholar] [CrossRef]
  31. Yan, L.; Chen, S.; Huang, J.; Lin, G. Increasing water and nitrogen availability enhanced net ecosystem CO2 assimilation of a temperate semiarid steppe. Plant Soil 2011, 349, 227–240. [Google Scholar] [CrossRef]
  32. Cheng, J.; Lee, X.; Theng, B.K.G.; Fang, B.; Yang, F.; Wang, B.; Zhang, L. Spatial Variability of CO2, CH4, and N2O Fluxes during Midsummer in the Steppe of Northern China. Pol. J. Environ. Stud. 2014, 23, 319–328. [Google Scholar]
  33. Euskirchen, E.S.; Bret-Harte, M.S.; Shaver, G.R.; Edgar, C.W.; Romanovsky, V.E. Long-Term Release of Carbon Dioxide from Arctic Tundra Ecosystems in Alaska. Ecosystems 2017, 20, 960–974. [Google Scholar] [CrossRef]
  34. Lange, S.F.; Allaire, S.E.; Cuellar Castillo, M.A.; Dutilleul, P. N2O and CO2 dynamics in a pasture soil across the frozen period. Can. J. Soil Sci. 2016, 97, 497–511. [Google Scholar] [CrossRef]
  35. Bai, Y.; Li, X.; Wen, W.; Mi, X.; Li, R.; Huang, Q.; Zhang, M. CO2, CH4 and N2O flux changes in degraded grassland soil of Inner Mongolia, China. J. Arid Land 2018, 10, 347–361. [Google Scholar] [CrossRef]
  36. Sun, W.; Sun, Z.; Mou, X.; Sun, W.J. Short-Term Study on Variations of Carbon Dioxide and Methane Emissions from Intertidal Zone of the Yellow River Estuary during Autumn and Winter. Wetlands 2018, 1–20. [Google Scholar] [CrossRef]
  37. Scala Júnior, N.L.; Simas, F.N.B.; Mendon, E.D.S.; Souza, J.V.; Panosso, A.R.; Schaefer, C.E.; Gilkes, R.J.; Prakonkep, N. Spatial and temporal variability of soil C-CO2 emissions and its relation with soil temperature in King George Island, Maritime Antarctica. Polar Sci. 2010, 479–487. [Google Scholar] [CrossRef]
  38. Wagle, P.; Kakani, V.G. Confounding Effects of Soil Moisture on the Relationship Between Ecosystem Respiration and Soil Temperature in Switchgrass. Bioenergy Res. 2014, 7, 789–798. [Google Scholar] [CrossRef]
  39. Xu, L.; Baldocchi, D.D.; Tang, J. How soil moisture, rain pulses, and growth alter the response of ecosystem respiration to temperature. Glob. Biogeochem. Cycle 2004, 18. [Google Scholar] [CrossRef] [Green Version]
  40. Geng, Y.; Luo, G.; Yuan, G. CH4 uptake flux of Leymus chinensis steppe during rapid growth season in Inner Mongolia, China. Sci. China-Earth Sci. 2010, 53, 977–983. [Google Scholar] [CrossRef]
  41. Holst, J.; Liu, C.; Yao, Z.; Brüggemann, N.; Zheng, X.; Giese, M.; Butterbach-Bahl, K. Fluxes of nitrous oxide, methane and carbon dioxide during freezing–thawing cycles in an Inner Mongolian steppe. Plant Soil 2008, 308, 105–117. [Google Scholar] [CrossRef]
  42. Luo, G.J.; Kiese, R.; Wolf, B.; Butterbach-Bahl, K. Effects of soil temperature and moisture on methane uptake and nitrous oxide emissions across three different ecosystem types. Biogeosciences 2013, 10, 3205–3219. [Google Scholar] [CrossRef] [Green Version]
  43. Zhang, L.; Huo, Y.; Guo, D.; Wang, Q.; Bao, Y.; Li, L. Effects of Multi-nutrient Additions on GHG Fluxes in a Temperate Grassland of Northern China. Ecosystems 2014, 17, 657–672. [Google Scholar] [CrossRef]
  44. Tang, S.; Wang, C.; Wilkes, A.; Zhou, P.; Jiang, Y.; Han, G.; Zhao, M.; Huang, D.; Schönbach, P. Contribution of grazing to soil atmosphere CH4 exchange during the growing season in a continental steppe. Atmos. Environ. 2013, 67, 170–176. [Google Scholar] [CrossRef]
  45. Mosier, A.R.; Parton, W.J.; Valentine, D.W.; Ojima, D.S.; Schimel, D.S.; Delgado, J.A. CH4 and N2O fluxes in the Colorado shortgrass steppe: 1. Impact of landscape and nitrogen addition. Glob. Biogeochem. Cycle 1996, 10, 387–399. [Google Scholar] [CrossRef]
  46. Wang, C.; Tang, S.; Wilkes, A.; Jiang, Y.; Han, G.; Huang, D. Effect of stocking rate on soil-atmosphere CH4 flux during spring freeze-thaw cycles in a northern desert steppe, China. PLoS ONE 2012, 7, e36794. [Google Scholar] [CrossRef] [PubMed]
  47. Singh, B.K.; Bardgett, R.D.; Smith, P.; Reay, D.S. Microorganisms and climate change: Terrestrial feedbacks and mitigation options. Nat. Rev. Microbiol. 2010, 8, 779–790. [Google Scholar] [CrossRef] [PubMed]
  48. Dijkstra, F.A.; Morgan, J.A.; von Fischer, J.C.; Follett, R.F. Elevated CO2 and warming effects on CH4 uptake in a semiarid grassland below optimum soil moisture. J. Geophys. Res. 2011, 116. [Google Scholar] [CrossRef]
  49. Zhao, J.; Peichl, M.; Nilsson, M.B. Enhanced winter soil frost reduces methane emission during the subsequent growing season in a boreal peatland. Glob. Chang. Biol. 2016, 22, 750–762. [Google Scholar] [CrossRef] [PubMed]
  50. Rong, Y.; Ma, L.; Johnson, D.A. Methane uptake by four land-use types in the agro-pastoral region of northern China. Atmos. Environ. 2015, 116, 12–21. [Google Scholar] [CrossRef]
  51. Roy Chowdhury, T.; Herndon, E.M.; Phelps, T.J.; Elias, D.A.; Gu, B.; Liang, L.; Wullschleger, S.D.; Graham, D.E. Stoichiometry and temperature sensitivity of methanogenesis and CO2 production from saturated polygonal tundra in Barrow, Alaska. Glob. Chang. Biol. 2015, 21, 722–737. [Google Scholar] [CrossRef]
  52. Kang, X.; Hao, Y.; Cui, X.; Chen, H.; Li, C.; Rui, Y.; Tian, J.; Kardol, P.; Zhong, L.; Wang, J.; et al. Effects of grazing on CO2 balance in a semiarid steppe: Field observations and modeling. J. Soils Sediments 2013, 13, 1012–1023. [Google Scholar] [CrossRef]
  53. Kang, X.; Hao, Y.; Li, C.; Cui, X.; Wang, J.; Rui, Y.; Niu, H.; Wang, Y. Modeling impacts of climate change on carbon dynamics in a steppe ecosystem in Inner Mongolia, China. J. Soils Sediments 2011, 11, 562–576. [Google Scholar] [CrossRef]
  54. Tang, S.; Zhang, Y.; Zhai, X.; Wilkes, A.; Wang, C.; Wang, K. Effect of grazing on methane uptake from Eurasian steppe of China. BMC Ecol. 2018, 18, 11. [Google Scholar] [CrossRef] [PubMed]
  55. Da, W.; Xu, R.; Wang, Y.; Wang, Y.; Liu, Y.; Yao, T. Responses of CO2, CH4 and N2O fluxes to livestock exclosure in an alpine steppe on the Tibetan Plateau, China. Plant Soil 2012, 359, 45–55. [Google Scholar] [CrossRef]
  56. Gao, X.; Thomas, B.W.; Beck, R.; Thompson, D.J.; Zhao, M.; Willms, W.D.; Hao, X.J. Long-term grazing alters soil trace gas fluxes from grasslands in the foothills of the Rocky Mountains, Canada. Land Degrad. Dev. 2018, 29, 292–302. [Google Scholar] [CrossRef]
Figure 1. Experimental design of sown pasture.
Atmosphere 10 00005 g001
Figure 2. Daily precipitation, daily air temperature (AT), soil temperature (ST) and soil moisture (SM). Bars indicate standard error (SE).
Atmosphere 10 00005 g002
Figure 3. Ecosystem respiration (Re) and CH4 fluxes in CG, UG and RG plots during the observing period. GS, FP, FTP represent growing season (from July to October 2012 and from May to July 2013), freezing period (from November 2012 to February 2013) and freezing-thawing period (from March to April 2013), respectively. Bars indicate standard error (SE).
Atmosphere 10 00005 g003
Figure 4. Correlations of Re (ecosystem respiration) with soil temperature and soil moisture. ST: soil temperature (°C), SM: soil moisture (WFPS, %), GS: growing season (from July to October 2012 and from May to July 2013). FP: freezing period (from November 2012 to February 2013). FTP: freezing-thawing period (from March to April 2013), Annual (from July 2012 to July 2013).
Atmosphere 10 00005 g004
Figure 5. Correlations of CH4 flux with soil temperature and soil moisture. ST: soil temperature (°C), SM: soil moisture (WFPS, %), GS: growing season (from July to October 2012 and from May to July 2013). FP: freezing period (from November 2012 to February 2013). FTP: freezing and thawing period (from March to April 2013). Annual (from July 2012 to July 2013).
Atmosphere 10 00005 g005
Figure 6. Correlation of CH4 flux with ecosystem respiration.
Atmosphere 10 00005 g006
Table 1. Experiment management details and soil properties.
Experiment
Site
Number of Sampling PointsDuration of Grazing Period (d)Grazing Rate (sheep ha−1)pHSOM
0–20 cm
(g kg−1)
SAN
0–20 cm
(g kg−1)
SBD
(0–10 cm)
(g/m3)
RG1.113098.58 ± 0.1113.54 ± 1.630.07 ± 0.011.51
RG1.213098.28 ± 0.1612.84 ± 3.200.07 ± 0.021.51
RG2.113098.46 ± 0.149.92 ± 0.760.06 ± 0.021.40
RG2.513098.32 ± 0.179.45 ± 1.670.06 ± 0.021.40
RG3.213098.33 ± 0.0314.93 ± 3.110.07 ± 0.011.55
RG3.313098.08 ± 0.5713.36 ± 3.650.08 ± 0.031.55
CG1215098.33 ± 0.4716.9 ± 6.450.07 ± 0.021.65
CG2215098.50 ± 0.2710.63 ± 3.060.05 ± 0.011.46
CG3215098.24 ± 0.3012.03 ± 3.440.04 ± 0.041.49
UG12--8.53 ± 0.1312.08 ± 0.670.07 ± 0.011.39
UG22--8.56 ± 0.1110.01 ± 1.600.05 ± 0.011.56
UG32--8.57 ± 0.1316.20 ± 5.040.08 ± 0.021.46
SOM: Soil Organic Matter; SAN: Soil Available Nitrogen; SBD: Soil Bulk Density; The given data represent the mean ± standard error.
Table 2. Seasonal and annual mean cumulative of ecosystem respiration (Re) and CH4 flux.
TreatmentSeasonReCH4 Flux
Mean a
(mg C m−2 h−1)
CVCumulative
(t C ha−1)
Mean a
(μg C m−2 h−1)
CVCumulative
(kg C ha−1)
CGGS182.0 ± 98.10.548.10−31.7 ± 8.80.28−1.40
FP4.6 ± 2.70.590.15−11.3 ± 7.60.67−0.29
FTP50.7 ± 37.30.740.81−20.36 ± 3.60.18−0.33
Annual119.9 ± 108.70.908.97−25.4 ± 11.10.44−2.02
UGGS295.9 ± 170.60.5812.96−34.6 ± 10.30.30−1.50
FP8.1 ± 4.60.570.28−13.8 ± 7.30.53−0.39
FTP59.4 ± 54.00.911.08−21.9 ± 6.50.30−0.36
Annual189.8 ± 185.60.9814.32−27.9 ± 12.30.44−2.25
RGGS205.4 ± 114.00.569.00−29.5 ± 8.50.29−1.28
FP5.0 ± 2.90.570.17−13.9 ± 4.30.31−0.43
FTP51.6 ± 36.60.910.83−21.3 ± 6.20.29−0.34
Annual134.0 ± 124.80.9310.0−25.1 ± 9.50.38−2.05
GS: growing season (from July 2012 to October 2012 and from May 2013 to July 2013). FP: freezing period (from November 2012 to February 2013). FTP: freezing and thawing period (from March to April 2013). Annual (from July 2012 to July 2013). a: mean ± stdev. CV: Coefficient of Variation. Re: ecosystem respiration.
Table 3. Stepwise regression equations of Re (ecosystem respiration) and main environmental factors in CG, UG and RG.
SiteSeasonRegression EquationFSig.R2
CGGSy = −129.41 + 10.937x1 + 7.604x220.847<0.0010.654
FPy = 16.861 − 0.363x251.601<0.0010.910
FTPy = 6.307 + 6.507x155.066<0.0010.871
Annualy = −78.973 + 10.635x1 + 4.377x255.665<0.0010.766
UGGSy = −132.329 + 18.836x1 + 7.238x219.358<0.0010.671
FPy = 20.954 − 2.231x311.806<0.050.730
FTPy = −121.547 + 9.7x1 + 22.571x3 + 0.791x5914.285<0.0010.997
Annualy = −111.769 + 18.622x1 + 5.723x261.013<0.0010.795
RGGSy = −22.394 + 12.249x113.749<0.0010.478
FP----
FTPy = 5.09 + 7.798x149.791<0.0010.859
Annualy = −79.807 + 12.077x1 + 4.061x234.881<0.0010.708
x1: soil temperature (°C), x2: soil moisture (WFPS, %), x3: NH4+-N (mg N kg−1 dry soil), x4: NO3-N (mg N kg−1 dry soil), x5: DOC (mg C kg−1 dry soil). GS: growing season (from July 2012 to October 2012 and from May 2013 to July 2013). FP: freezing period (from November 2012 to February 2013). FTP: freezing and thawing period (from March to April 2013), Annual (from July 2012 to July 2013). “-”: no fitting regression equation was found.
Table 4. Correlation between Re (ecosystem respiration) and main environmental factors.
SiteSeasonSM (WFPS, %)ST (5 cm, °C)
CGGS (n = 26)R20.201 *
89.561 + 6.497x
0.485 **
41.649e0.070x
f(x)
FP (n = 8)R20.915 **
16.644 − 0.355x
0.219
6.371 + 0.386x
f(x)
FTP (n = 10)R20.546 *
115.598 − 9.128x + 0.19703x2
0.871 **
3.4 + 6.712x
f(x)
Annual (n = 44)R20.172 **
56.275 + 11.706x − 0.333x2
0.840 **
11.197e0.137x
f(x)
UGGS (n = 26)R20.093
172.168 + 8.242x
0.602 **
56.944e0.085x
f(x)
FP (n = 8)R20.564 **
25.714 − 0.502x
0.548 *
12.536 + 0.905x
f(x)
FTP (n = 10)R20.432 *
208.147 − 16.069x + 0.336x2
0.83 **
7.271 + 10.052x
f(x)
Annual (n = 44)R20.135 *
113.743 + 15.923x − 0.476x2
0.882 **
21.889e0.136x
f(x)
RGGS (n = 26)R20.187 *
102.403 + 7.022x
0.506 **
41.811e0.076x
f(x)
FP (n = 8)R20.576 *
19.125 − 0.412x
0.861 **
8.7856 + 0.817x
f(x)
FTP (n = 10)R20.271
134.223 − 9.4x + 0.195x2
0.869 **
7.526 + 7.539x
f(x)
Annual (n = 44)R20.163 **
49.172 + 14.775x − 0.419x2
0.850 **
11.359e0.144x
f(x)
f(x): Re (ecosystem respiration), ST: soil temperature, SM: soil moisture, GS: growing season (from July to October 2012 and from May to July 2013). FP: freezing period (from November 2012 to February 2013). FTP: freezing and thawing period (from March 2013 to April 2013), Annual (from July 2012 to July 2013). **: a significance level of 0.01, *: a significance level of 0.05.
Table 5. Stepwise regression equations between CH4 fluxes and environmental factors.
SiteSeasonRegression EquationFSig.R2
CGGSy = −17.092 − 0.766x19.051<0.010.277
FPy = −20.102 − 1.809x111.174<0.050.670
FTP----
Annualy = −15.874 − 0.799x150.524<0.0010.579
UGGS----
FP----
FTPy = −5.427 − 0.805x1 − 0.213x422.313<0.010.859
Annualy = −35.084 + 3.189x3 − 0.367x113.658<0.0010.485
RGGSy = −13.105 − 0.987x116.377<0.0010.490
FP----
FTPy = −29.6 + 0.567x27.814<0.050.460
Annualy = −16.149 − 0.825x141.391<0.0010.591
y: CH4 fluxes, x1: soil temperature (°C), x2: soil moisture (WFPS, %), x3: NH4+-N (mg N kg−1 dry soil), x4: NO3-N (mg N kg−1 dry soil), x5: DOC (mg C kg−1 dry soil). GS: growing season (from July 2012 to October 2012 and from May 2013 to July 2013). FP: freezing period (from November 2012 to February 2013). FTP: freezing-thawing period (from March to April 2013), Annual (from July 2012 to July 2013). “-”: no fitting regression equation was found.
Table 6. Correlations between CH4 flux and main environmental factors.
SiteSeasonSM (0–6 cm, WFPS %)ST (5 cm, °C)
CGGS (n = 26)R20.117
−21.475 − 1.563x + 0.055x2
0.268 **
−18.015 − 0.739x
f(x)
FP (n = 8)R20.635 *
−40.182 + 0.855x
0.557 *
−17.965 − 1.476x
f(x)
FTP (n = 10)R20.381 *
−29.798 + 0.193x
−0.125
-
f(x)
Annual (n = 44)R20.382 **
−25.066 − 0.785x + 0.032x2
0.639 **
−15.61 − 0.836x
f(x)
UGGS (n = 26)R20.193 *
−20.791 − 2.805x + 0.102x2
0.014
−27.683 − 0.399x
f(x)
FP (n = 8)R20.258
−35.149 + 0.61x
0.21
−18.905 − 1.047x
f(x)
FTP (n = 10)R2−0.123
-
0.255
−16.673 − 0.786x
f(x)
Annual (n = 44)R20.374 **
−28.099 − 0.829x + 0.033x2
0.452 **
−19.671 − 0.804x
f(x)
RGGS (n = 26)R2−0.086
-
0.257 **
−16.383 − 0.709x
f(x)
FP (n = 8)R2−0.057−0.157
f(x)--
FTP (n = 10)R20.697 **
−30.677 + 0.671x
0.588 **
−16.464 − 1.051x
f(x)
Annual (n = 44)R20.169 **
−28.545 − 0.08x + 0.012x2
0.558 **
−16.929 − 0.684x
f(x)
f(x): CH4 fluxes, ST: soil temperature, SM: soil moisture. GS: growing season (from July to October 2012 and from May to July 2013). FP: freezing period (from November 2012 to February 2013). FTP: freezing and thawing period (from March 2013 to April 2013). Annual (from July 2012 to July 2013). **: a significance level of 0.01, *: a significance level of 0.05, “-”: no fitting regression equation was found.
Table 7. Comparison of Ecosystem Respiration among different sites in Inner Mongolia.
SiteEcosystem TypeRe (mg C m−2 h−1)PeriodSource
Inner Mongolia
(43°26′ N, 116°40′ E, 1189 m)
Temperate steppe47.72004[28]
20.52005
Inner Mongolia
(42°27′ N, 116°41′ E, 1350 m)
Temperate steppe223.3 ± 9.92006.6–9[31]
138.7 ± 6.92007.6–9
Inner Mongolia
(40°34′ N, 111°34′ E, 1055 m)
Sown pasture147.9 ± 21.32012.7–2013.7This study
227.8 ± 34.7GS
Re (ecosystem respiration) = mean ± standard error but the standard error in [28] are not found. GS: growing season (from July 2012 to October 2012 and from May 2013 to July 2013).
Table 8. Comparison of CH4 flux among different sites in Inner Mongolia.
SiteEcosystem TypeSM (0–6 cm, v/v %)ST (5 cm, °C)CH4 Flux (μg C m−2 h−1)PeriodSource
Inner Mongolia
(43°33′ N, 116°40′ E, 1268 m)
Temperate steppe13.5 ± 0.5 a-−38.72007.8–2008.8[42]
Inner Mongolia
(43°38′ N, 116°42′ E)
Temperate steppe14.012.5−43.8 ± 2.5 a2007.10–2008.10[11]
Inner Mongolia
(43°33′ N, 116°40′ E, 1250 m)
Temperate steppe17.2-−66.6 ± 4.2 a2008.7–9[40]
Inner Mongolia
(42°02′ N, 116°17′ E)
Temperate steppe8.216.9−60.72009.5–9[43]
12.516.5−78.72010.5–9
Inner Mongolia
(43°11′–43°27′ N, 116°22′-117°00′ E)
Temperate steppe13.7 ± 0.8 a18.5−98.6 ± 10.4 a2010.5–10[44]
Inner Mongolia
(40°34′ N, 111°34′ E, 1055 m)
Sown pasture18.1 ± 0.6 a11.1 ± 0.4 a−26.1 ± 0.9 a2012.7–2013.7This study
14.6 ± 0.2 a18.0 ± 0.8 a−31.9 ± 1.5 aGS
ST: soil temperature, SM: soil moisture. a: mean± standard error. GS: growing season (from July 2012 to October 2012 and from May2013 to July 2013).

