Impact of Meteorological Conditions on PM2.5 Pollution in China during Winter


 ,
,
Abstract
1. Introduction
2. Data and Methods
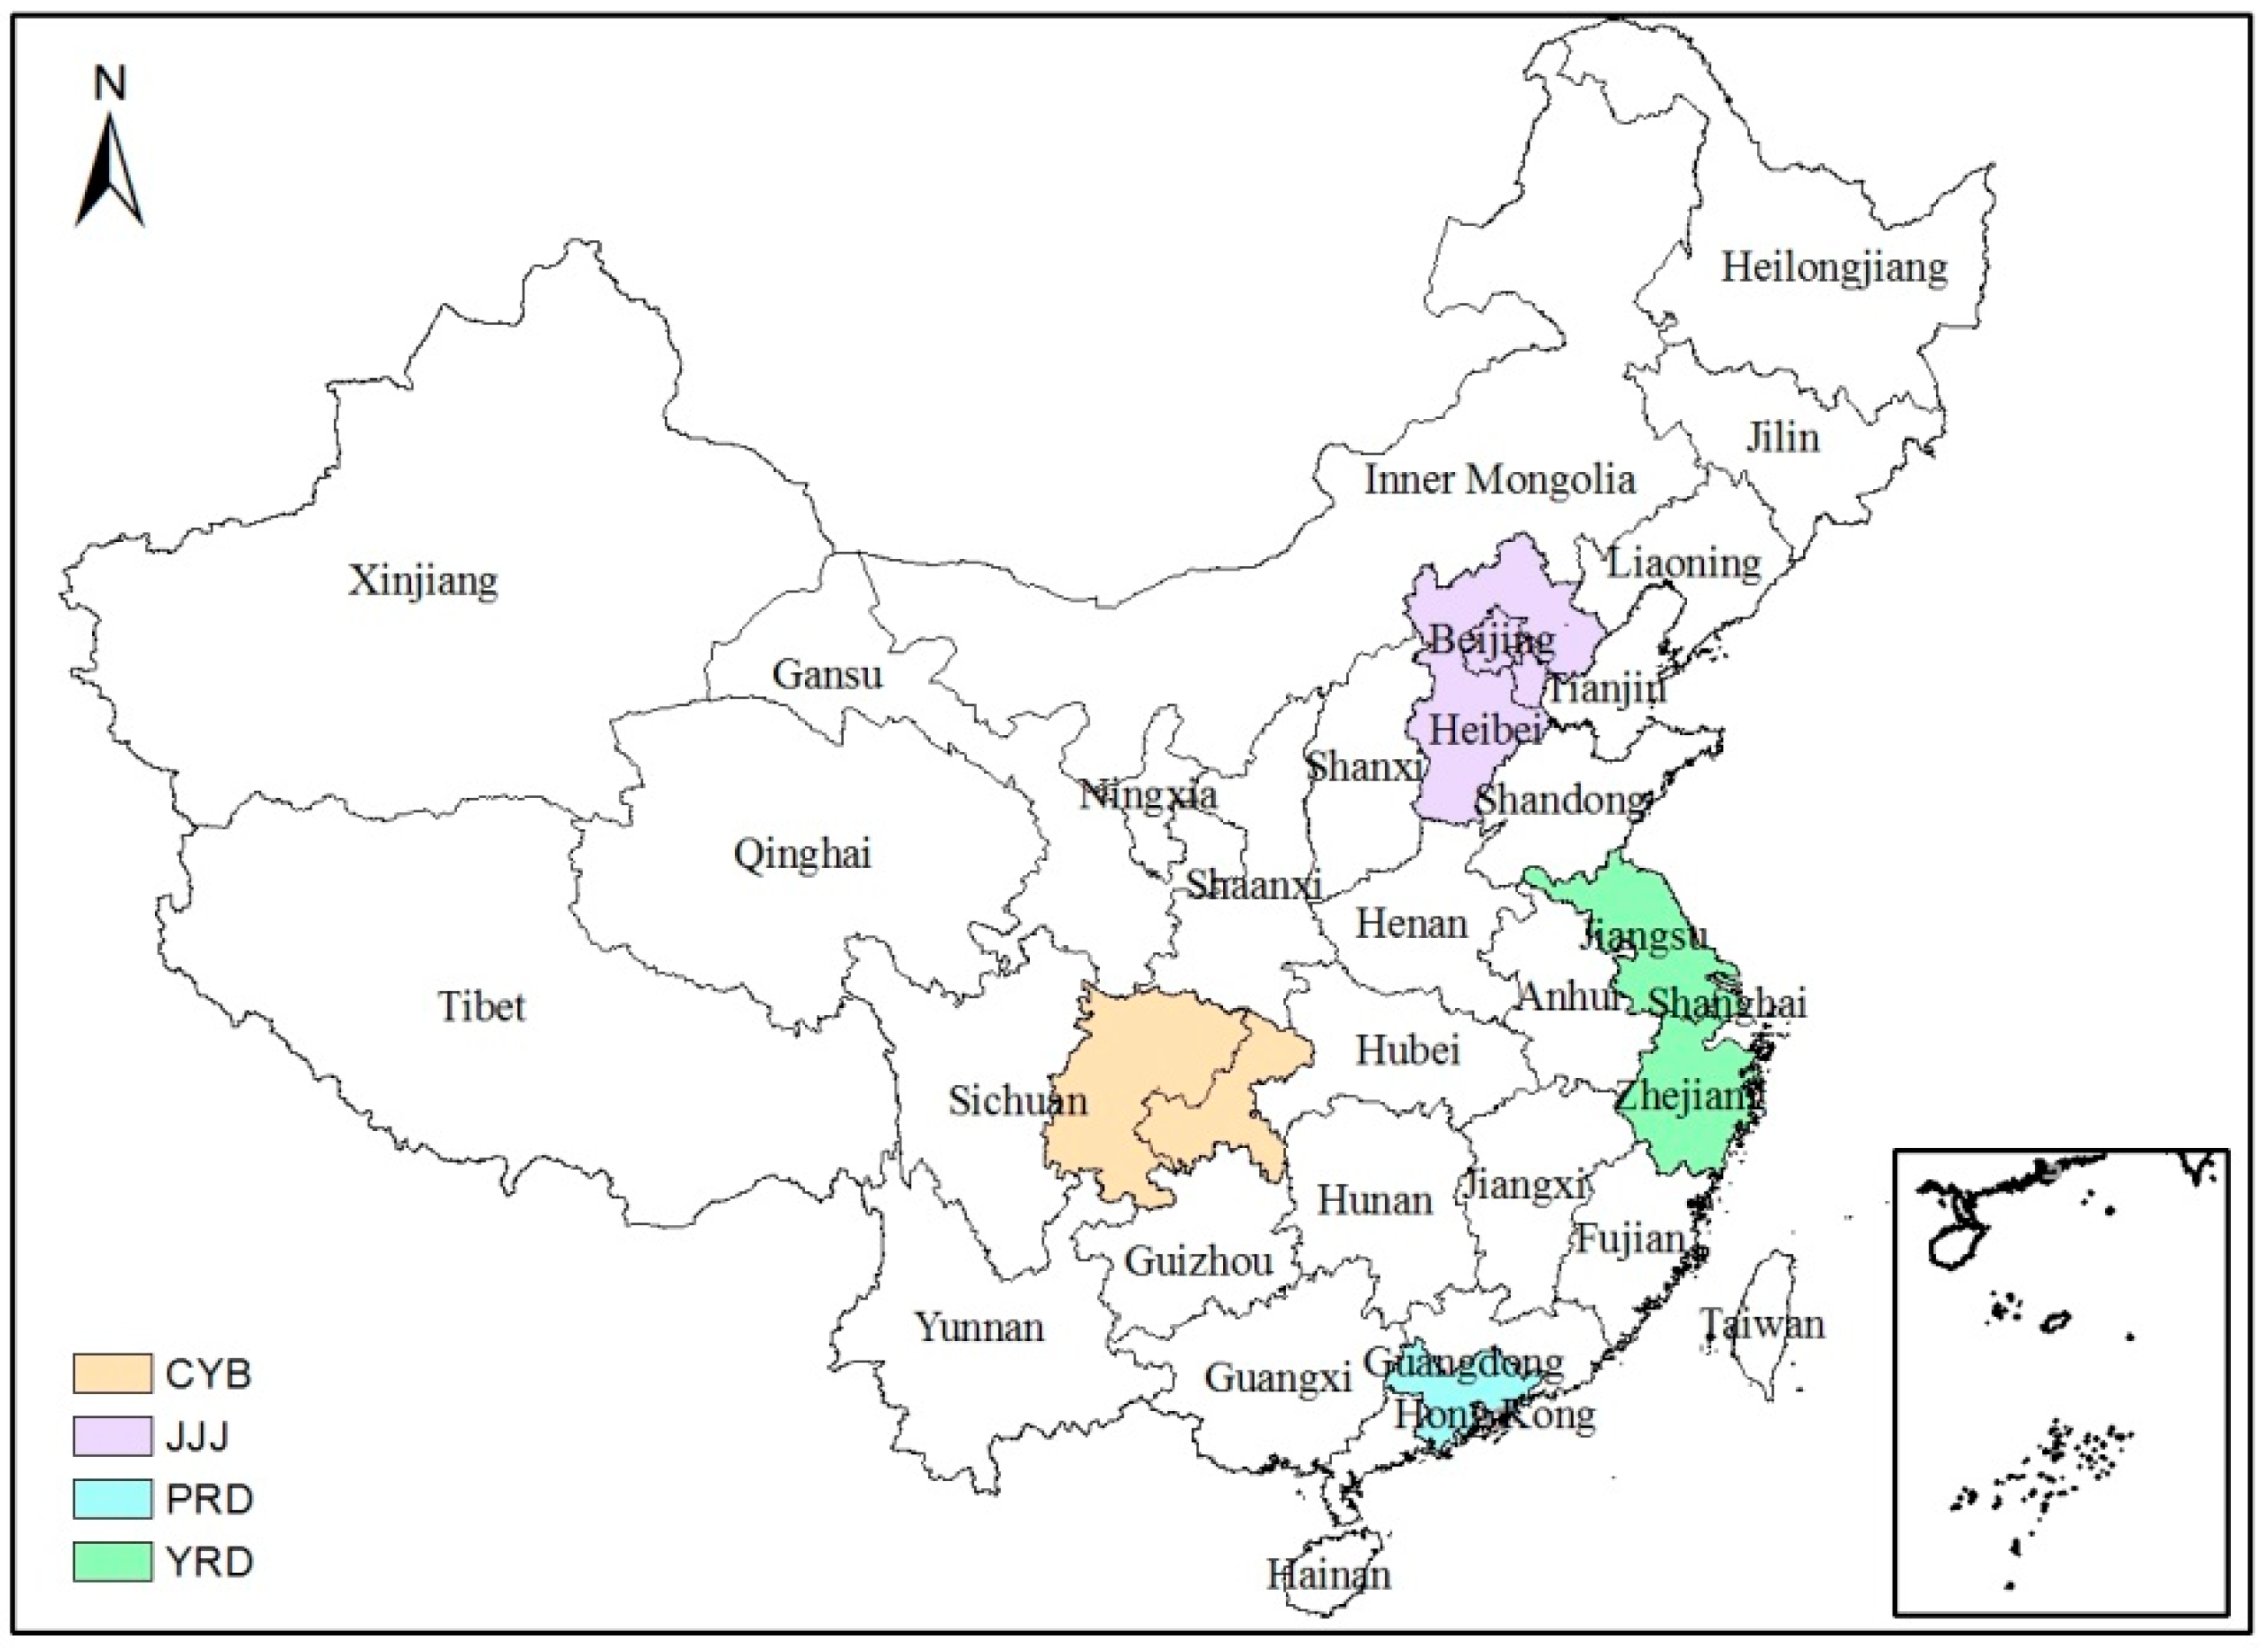
2.1. Study Area
2.2. Observational Data
2.2.1. Meteorological Data
2.2.2. Ambient Air Quality Data
2.2.3. Sampling Program
2.3. Emission Inventory
2.4. Modeling System
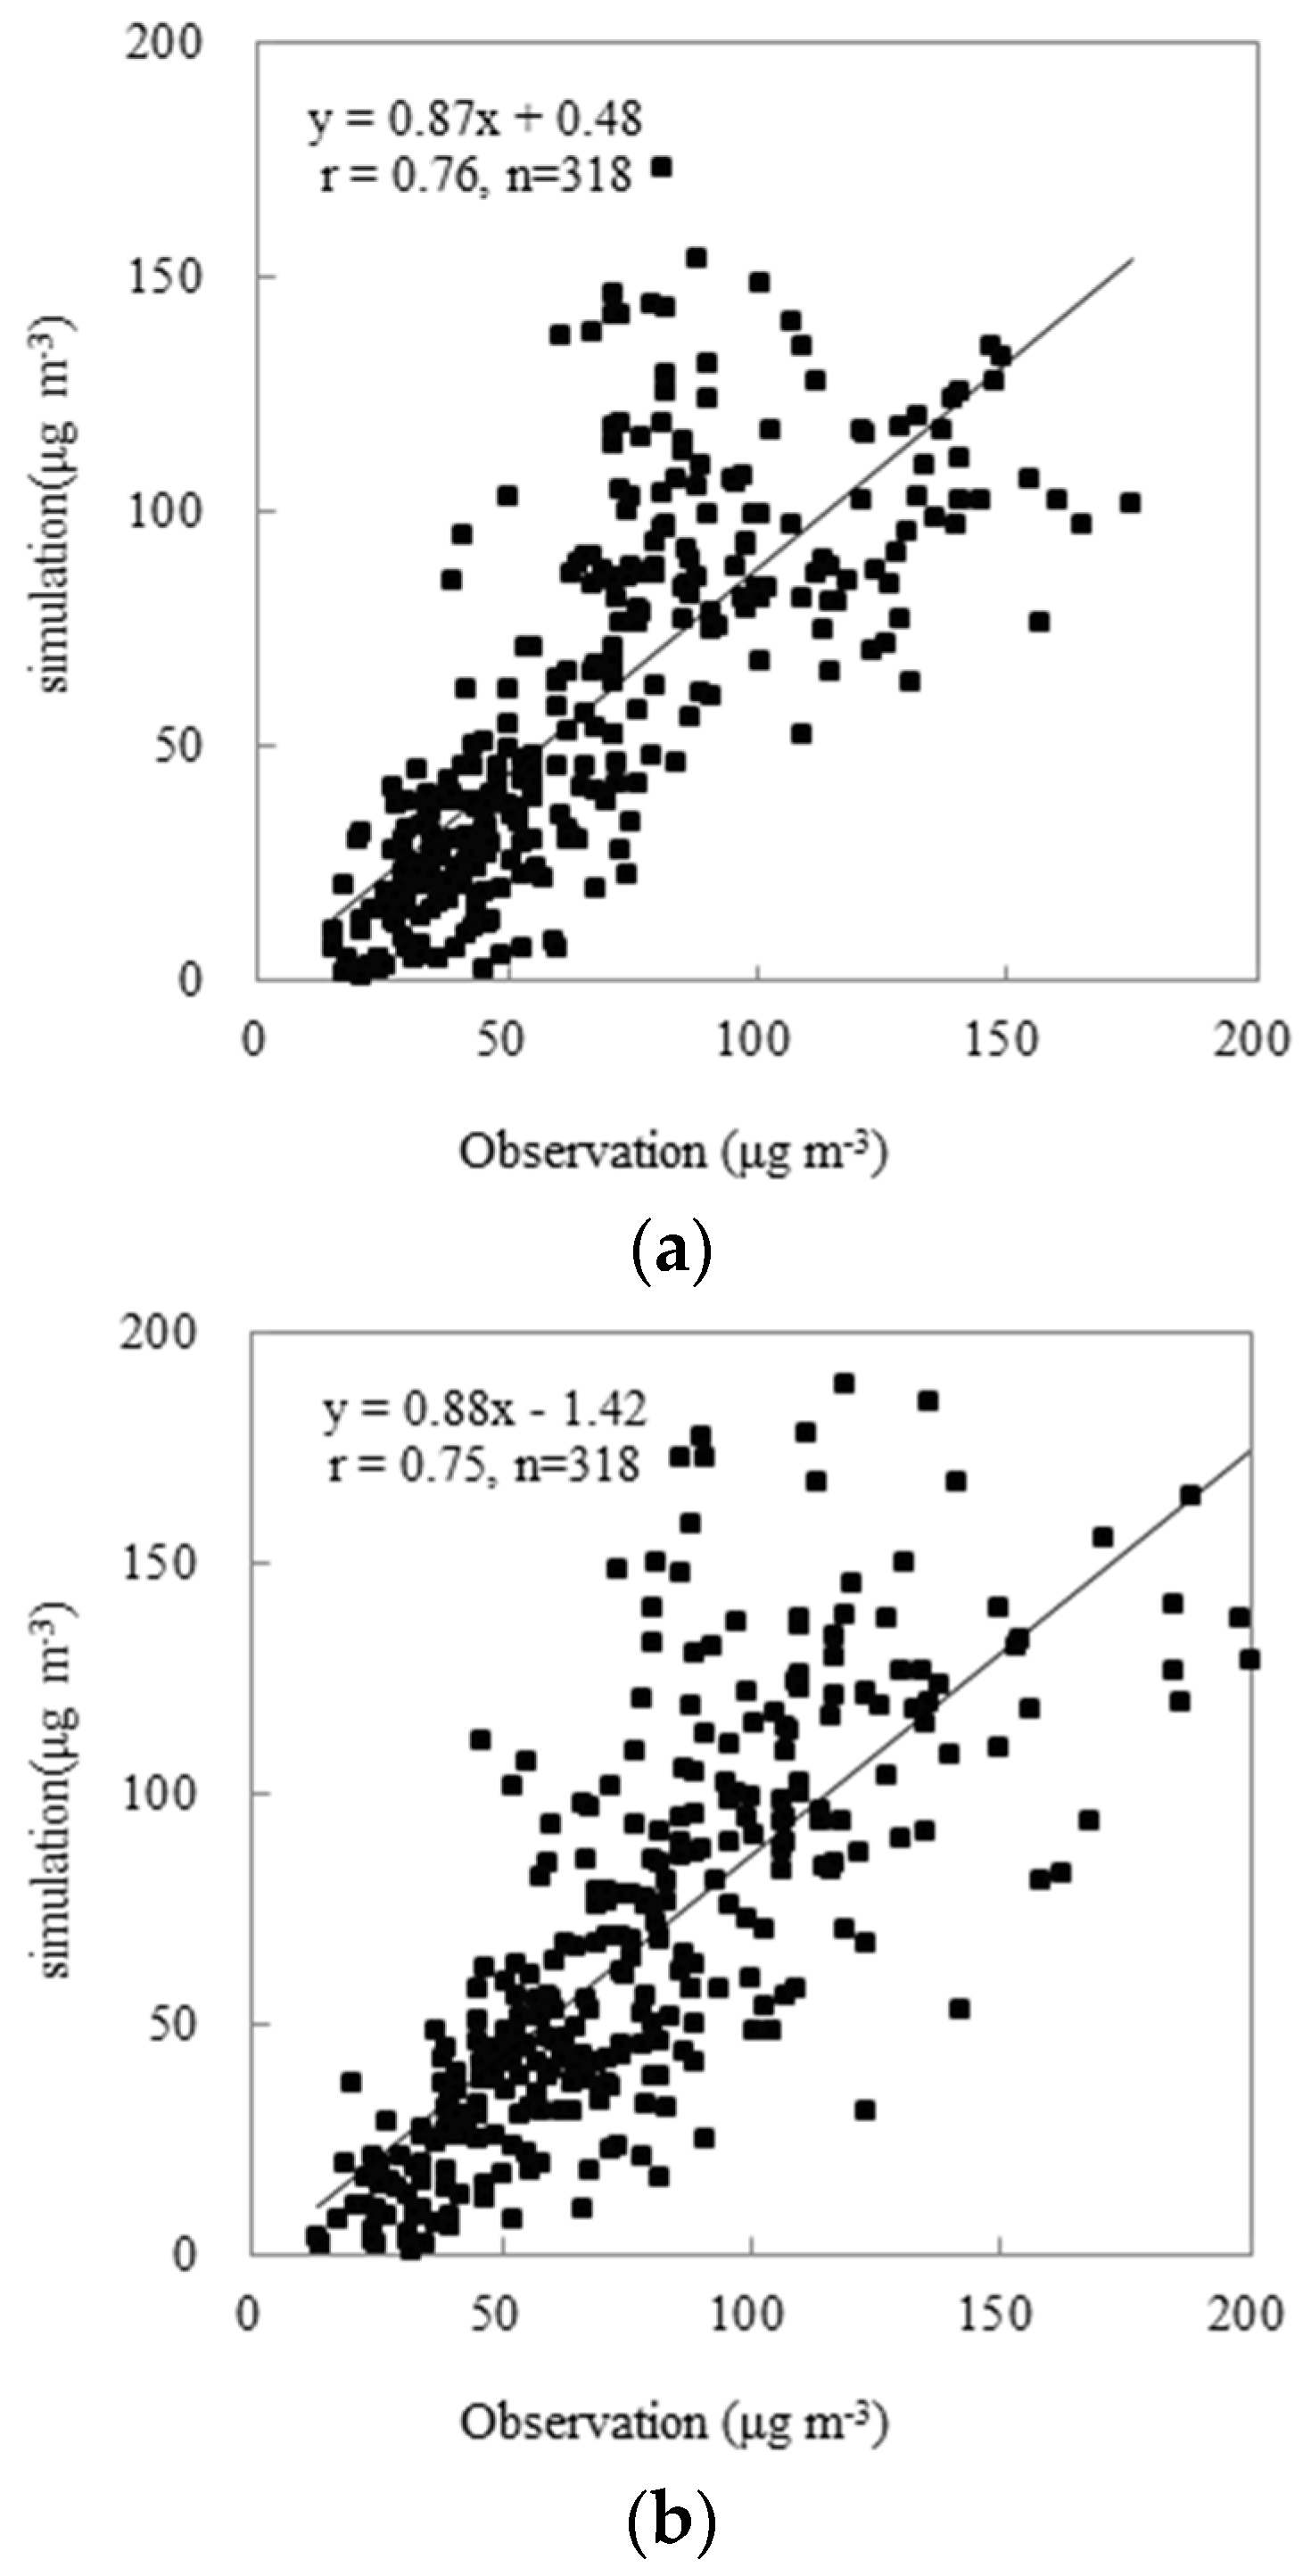
2.5. Model Performance
2.6. Quantitative Analysis of the Contribution of Meteorology to the PM2.5 Concentration
3. Results and Discussion
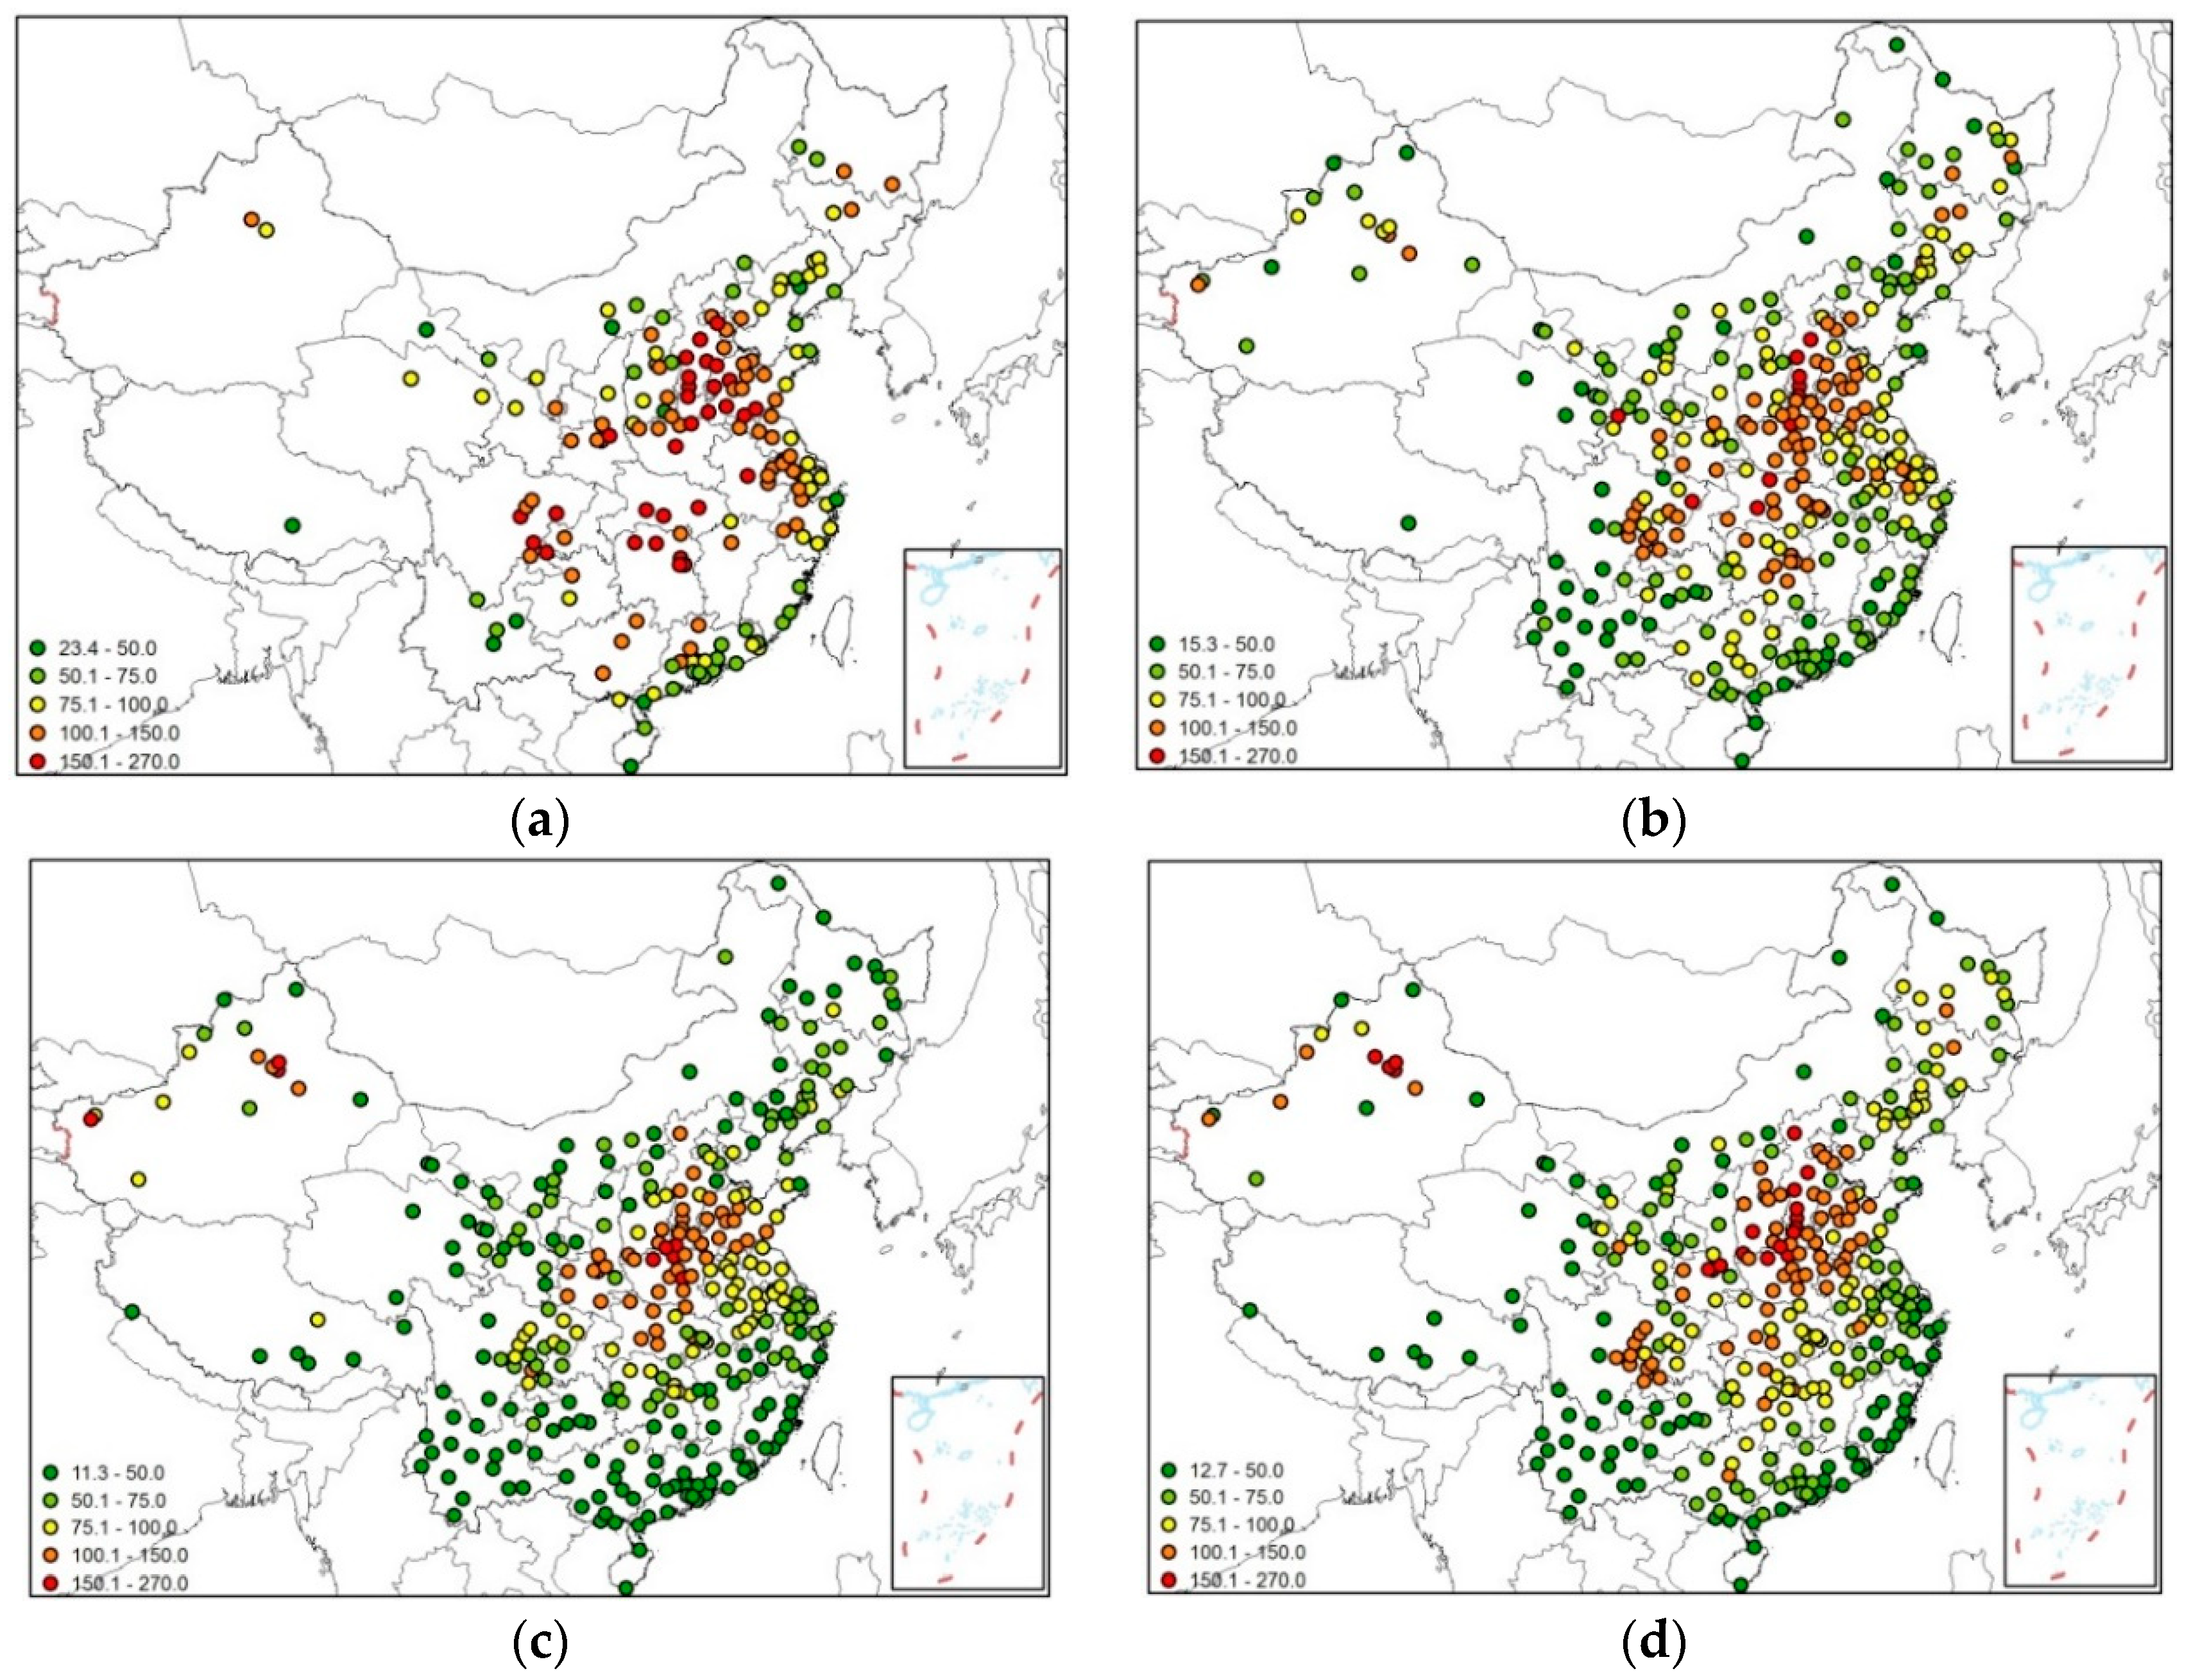
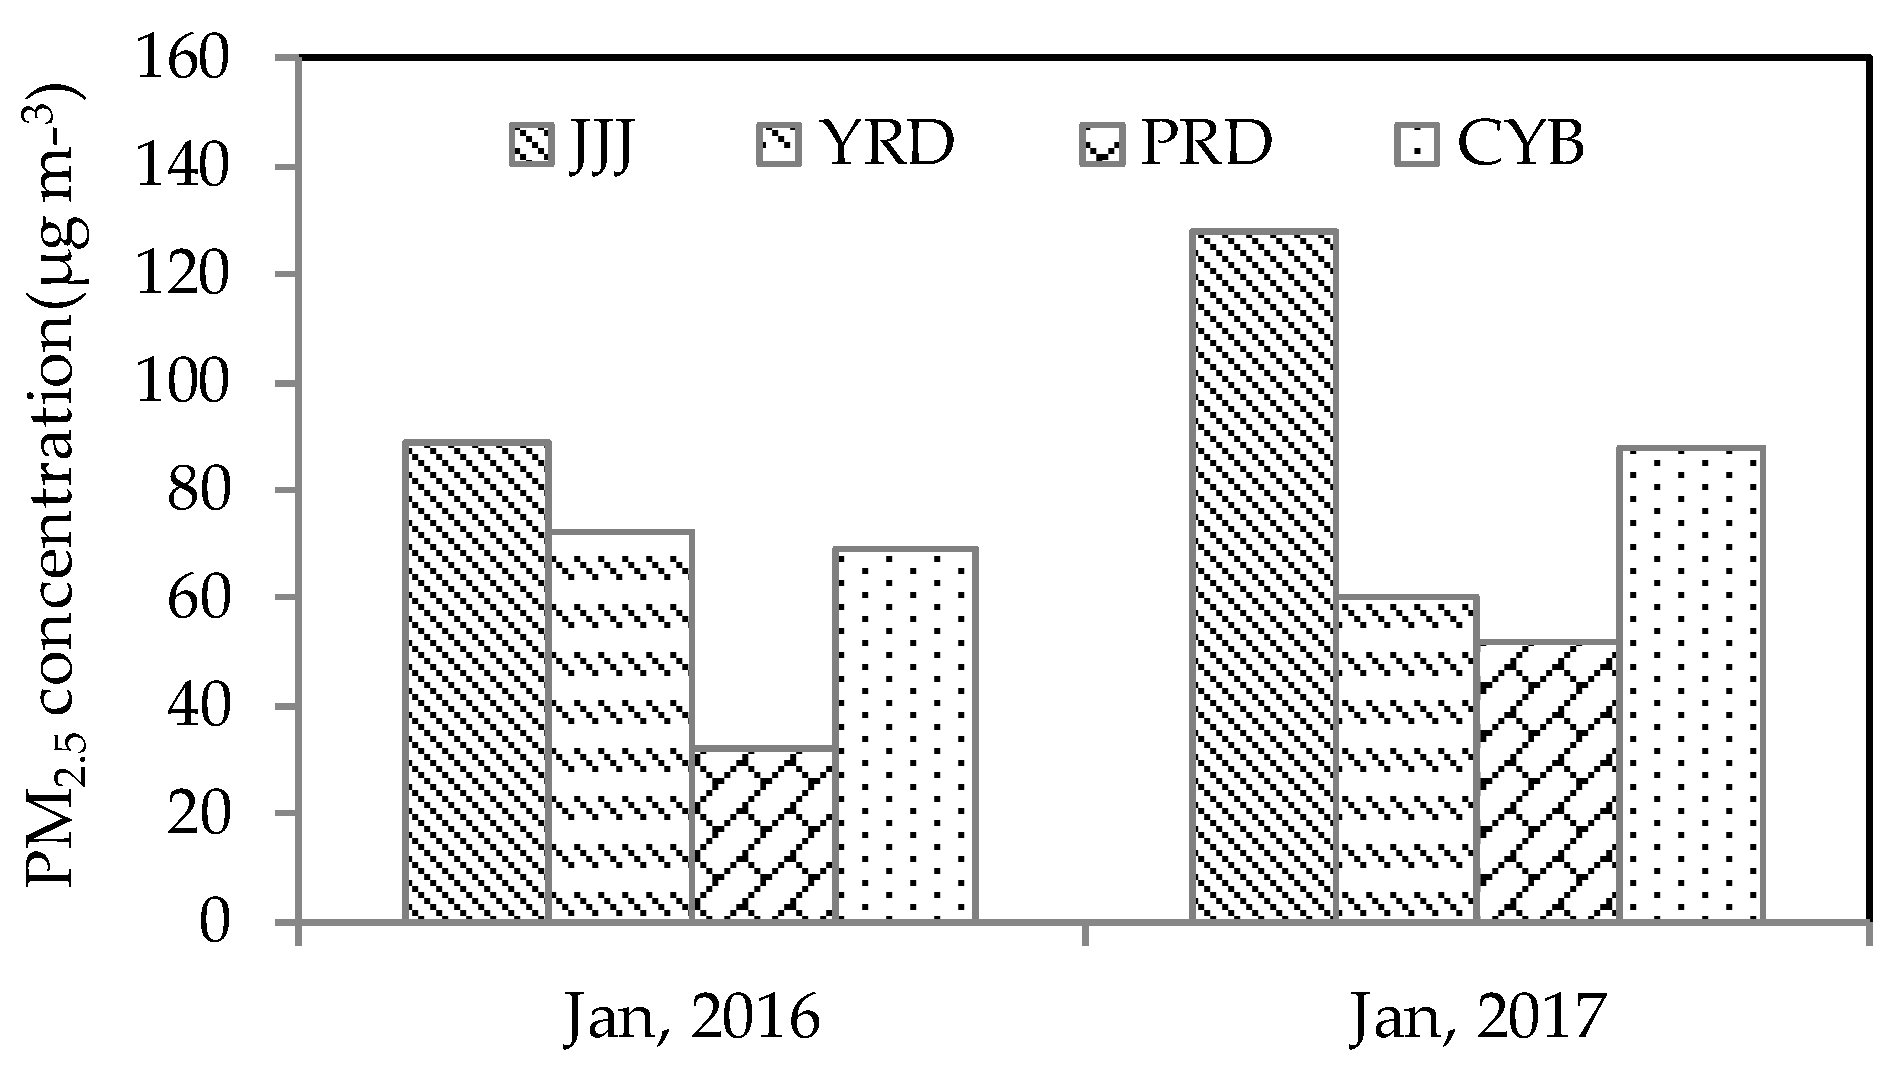
3.1. Distribution Characteristics of the PM2.5 Concentration
3.2. The Impact of Meteorology on the PM2.5 Pollution
3.2.1. Relationships between Meteorological Parameters and the PM2.5 Concentration
3.2.2. Simulation of the Impact of the Meteorology on the PM2.5 Pollution
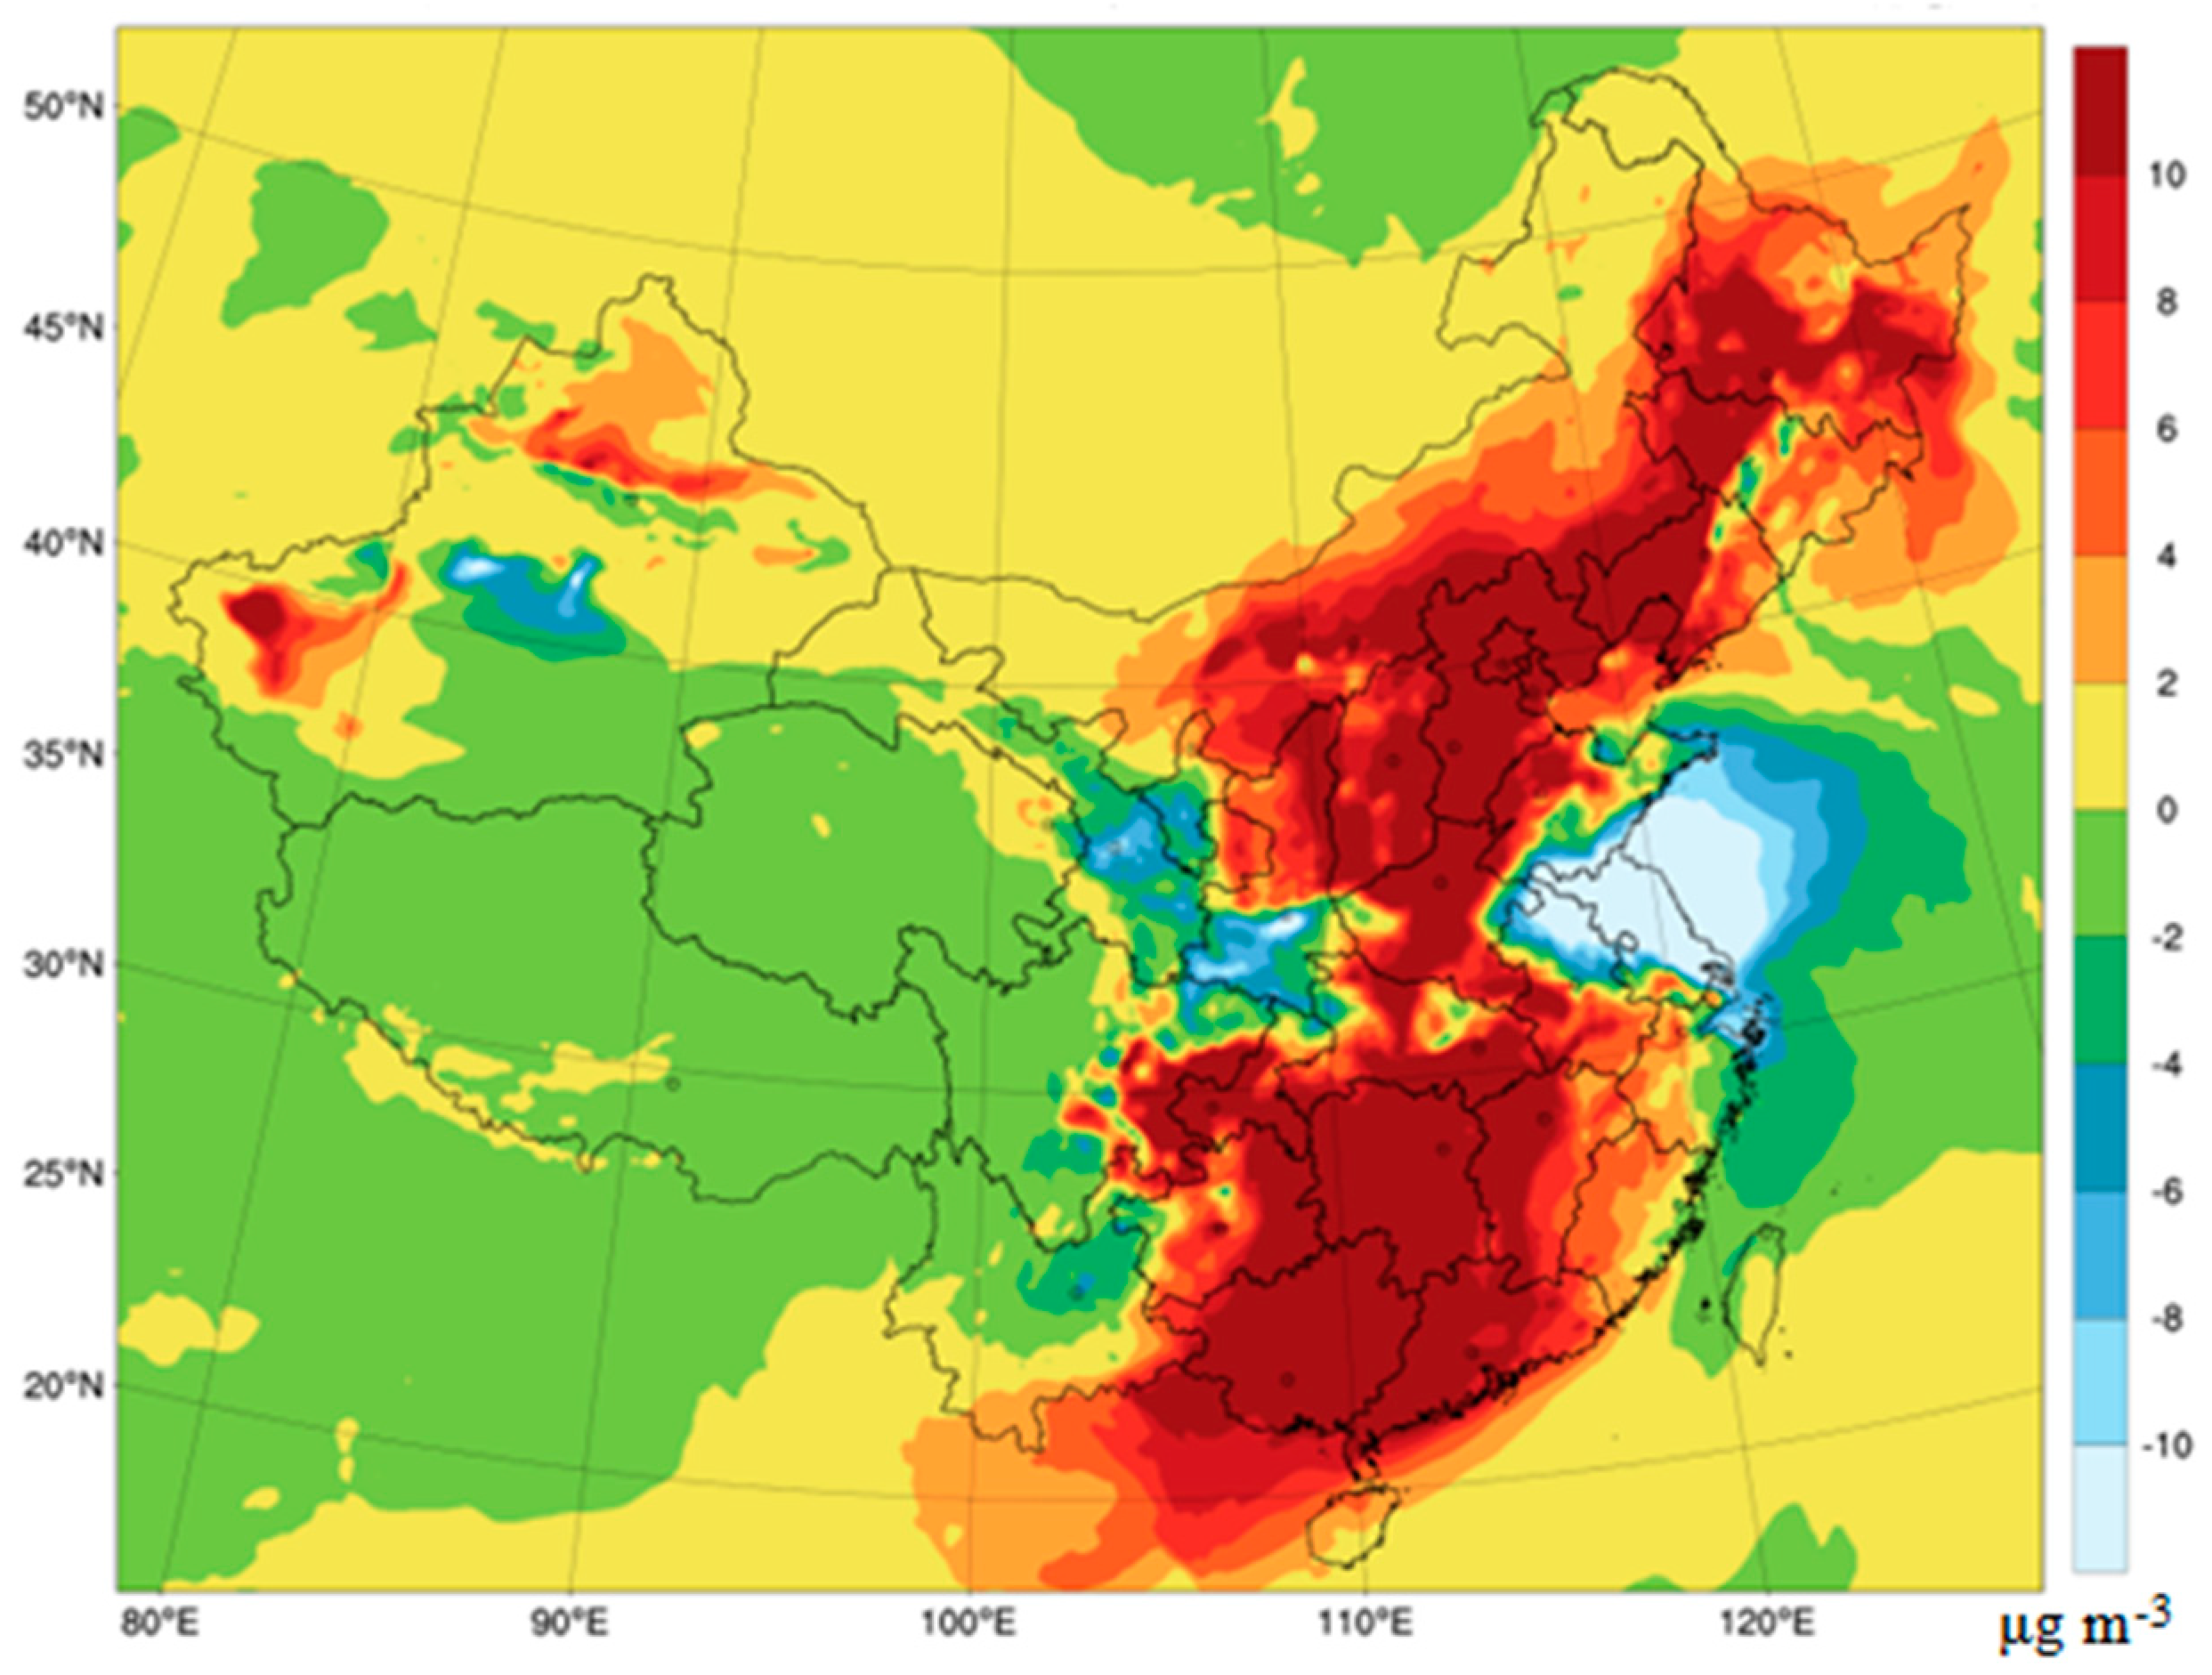
Nationwide Overall Condition
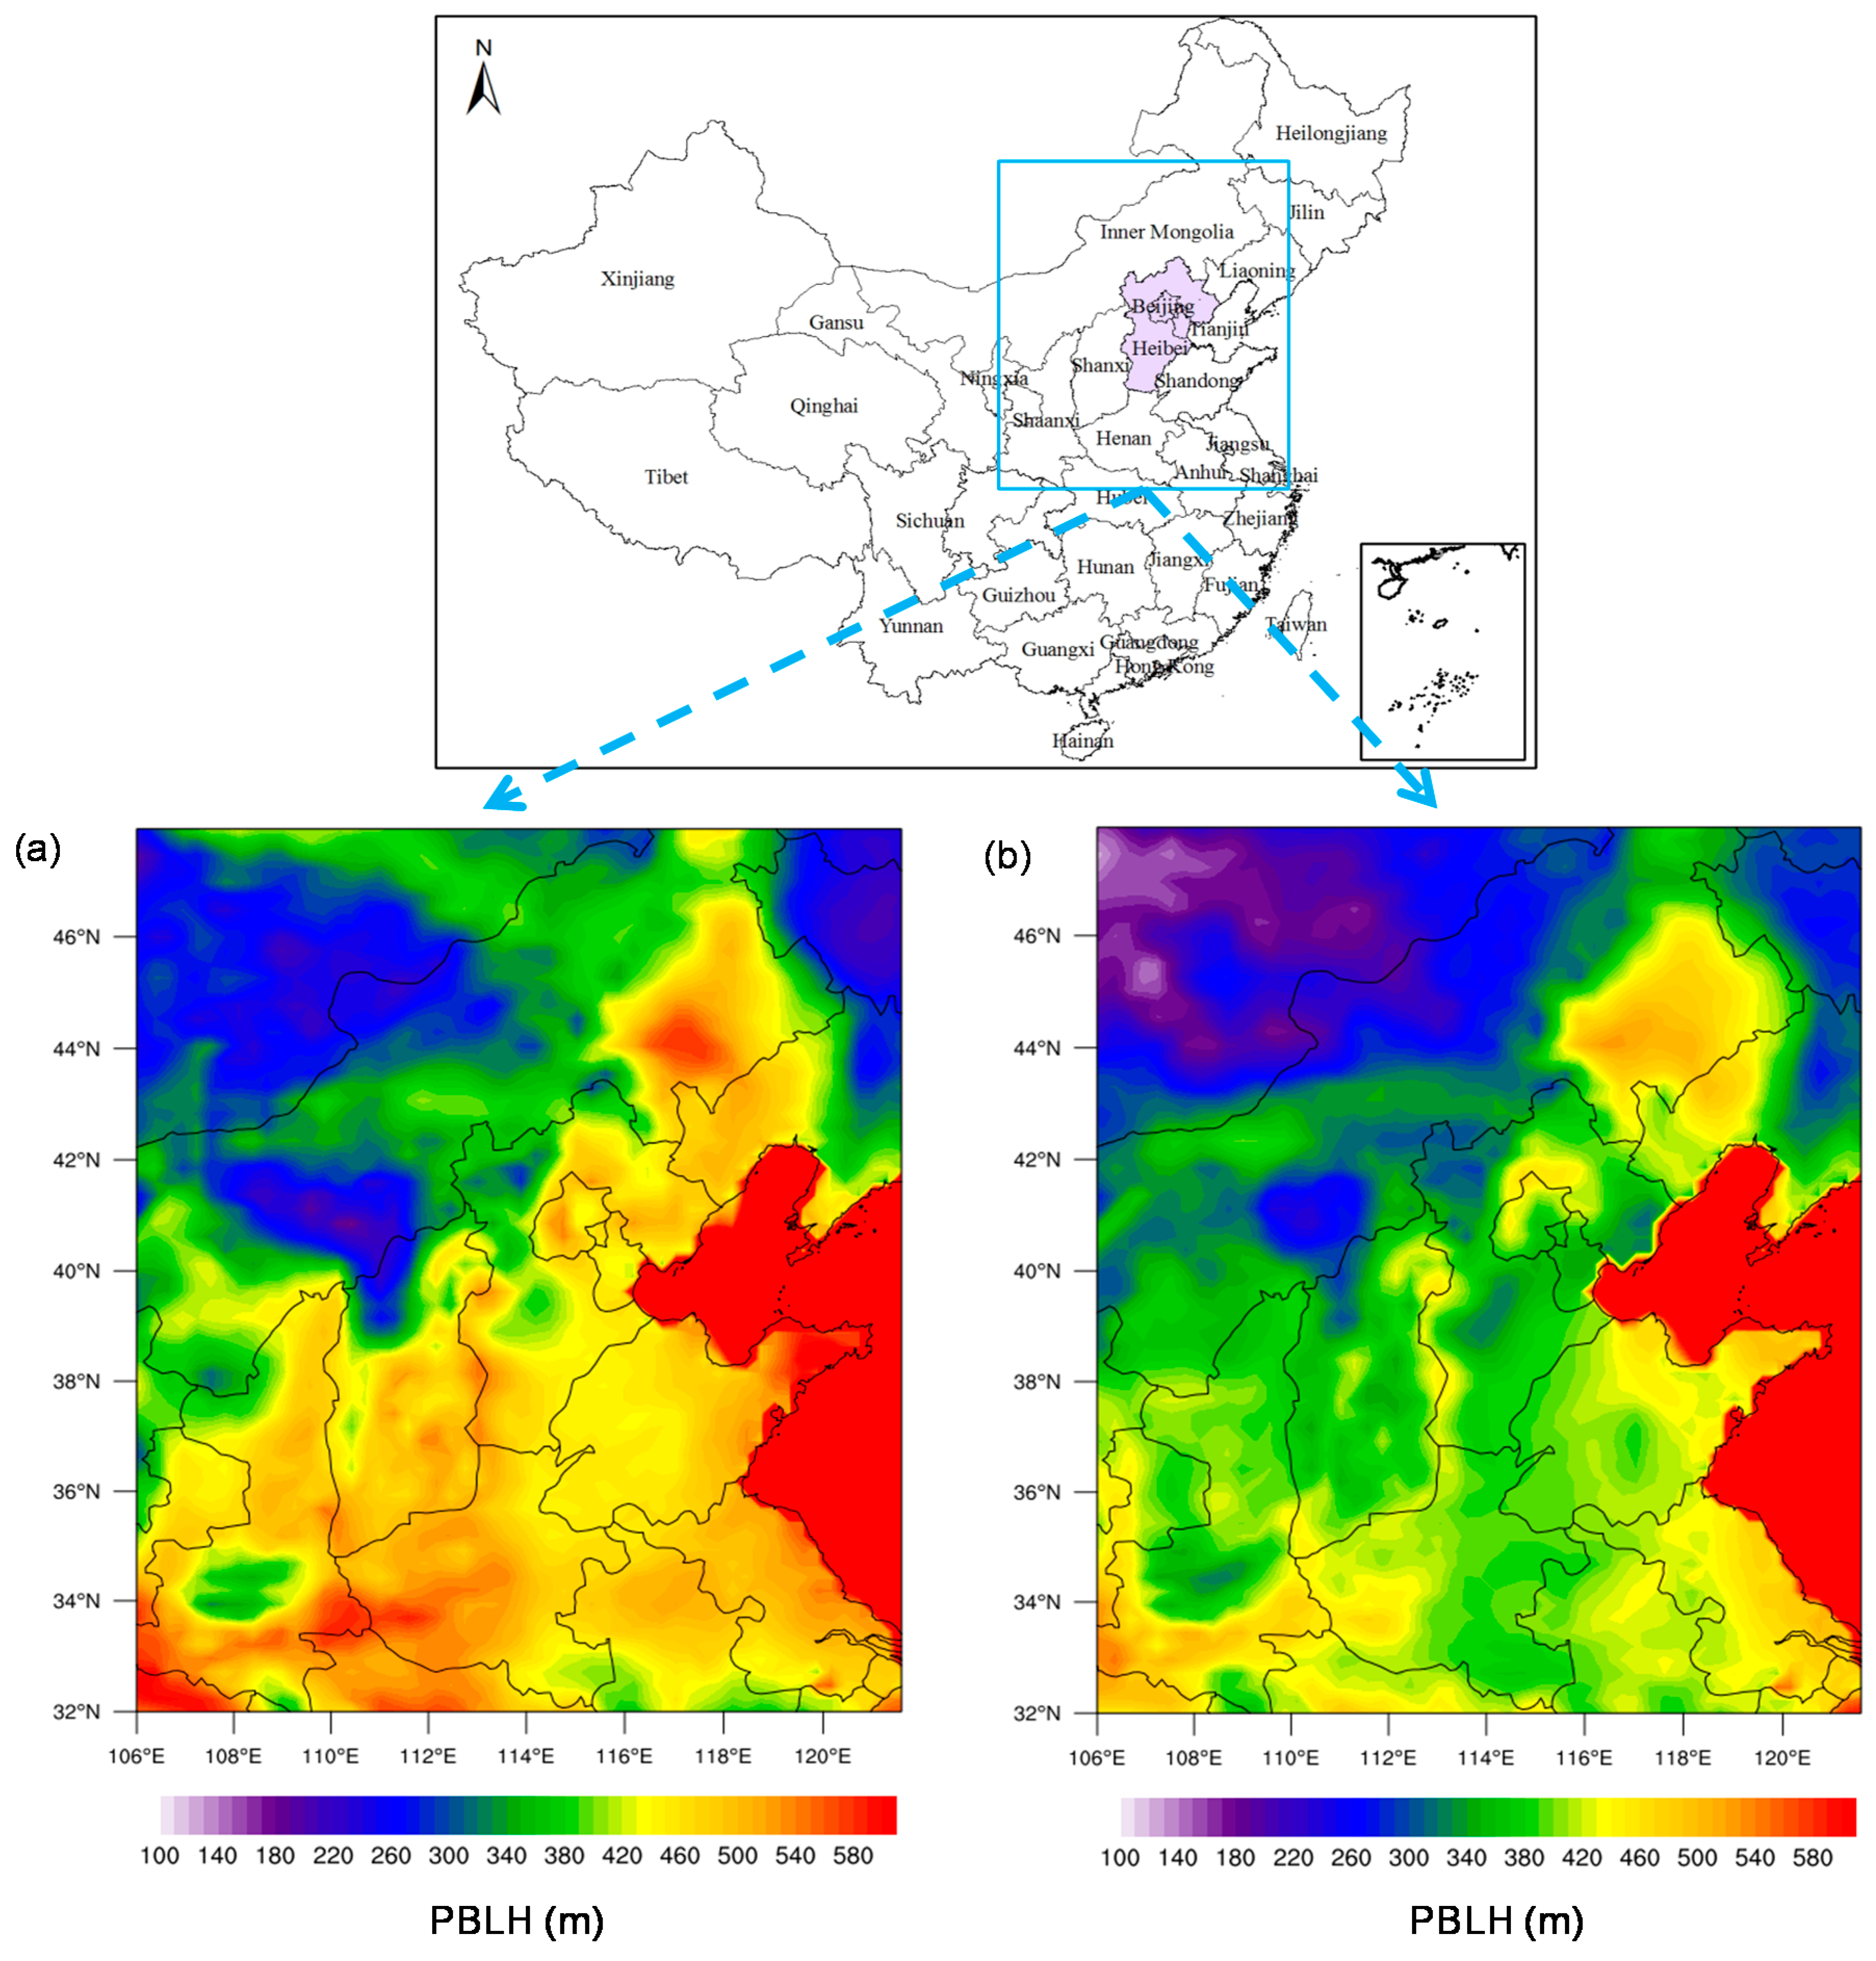
Major Regions
4. Conclusions
Author Contributions
Funding
Acknowledgments
Conflicts of Interest
References
- Lin, G.; Fu, J.; Jiang, D.; Hu, W.; Dong, D.; Huang, Y.; Zhao, M. Spatio-temporal variation of PM2.5 concentrations and their relationship with geographic and socioeconomic factors in China. Int. J. Environ. Res. Public Health 2013, 11, 173–186. [Google Scholar] [CrossRef] [PubMed]
- Liu, M.; Bi, J.; Ma, Z. Visibility-based PM2.5 concentrations in China: 1957–1964 and 1973–2014. Environ. Sci. Technol. 2017, 51, 13161–13169. [Google Scholar] [CrossRef] [PubMed]
- Zhang, Q.; Quan, J.; Tie, X.; Li, X.; Liu, Q.; Gao, Y.; Zhao, D. Effects of meteorology and secondary particle formation on visibility during heavy haze events in Beijing, China. Sci. Total Environ. 2015, 502, 578–584. [Google Scholar] [CrossRef] [PubMed]
- Liu, X.; Li, C.; Tu, H.; Wu, Y.; Ying, C.; Huang, Q.; Wu, S.; Xie, Q.; Yuan, Z.; Lu, Y. Analysis of the effect of meteorological factors on PM2.5-associated PAHs during autumn-winter in urban Nanchang. Aerosol Air Qual. Res. 2016, 16, 3222–3229. [Google Scholar] [CrossRef]
- Cao, J.; Xu, H.; Xu, Q.; Chen, B.; Kan, H. Fine particulate matter constituents and cardiopulmonary mortality in a heavily polluted Chinese city. Environ. Health. Perspect. 2012, 120, 373–378. [Google Scholar] [CrossRef] [PubMed]
- Ailshire, J.A.; Clarke, P. Fine particulate matter air pollution and cognitive function among U.S. older adults. J. Gerontol. B Psychol. Sci. Soc. Sci. 2014, 70, 322–328. [Google Scholar] [CrossRef] [PubMed]
- Liao, Z.H.; Gao, M.; Sun, J.R.; Fan, S.J. The impact of synoptic circulation on air quality and pollution-related human health in the Yangtze River delta region. Sci. Total Environ. 2017, 607, 838–846. [Google Scholar] [CrossRef] [PubMed]
- Jędruszkiewicz, J.; Czernecki, B.; Marosz, M. The variability of PM10 and PM2.5 concentrations in selected polish agglomerations: The role of meteorological conditions, 2006–2016. Int. J. Environ. Health Res. 2017, 27, 441–462. [Google Scholar] [CrossRef] [PubMed]
- Cheng, Y.-H.; Li, Y.-S. Influences of traffic emissions and meteorological conditions on ambient PM10 and PM2.5 levels at a highway toll station. Aerosol Air Qual. Res. 2010, 10, 456–462. [Google Scholar] [CrossRef]
- Wang, P.; Cao, J.; Ti, X.; Wang, G.; Li, G.; Hu, T.; Wu, Y.; Xu, Y.; Xu, G.; Zhao, Y.; et al. Impact of meteorological parameters and gaseous pollutants on PM2.5 and PM10 mass concentrations during 2010 in Xi’an, China. Aerosol Air Qual. Res. 2015, 15, 1844–1854. [Google Scholar] [CrossRef]
- Zhang, J.P.; Zhu, T.; Zhang, Q.H.; Li, C.C.; Shu, H.L.; Ying, Y.; Dai, Z.P.; Wang, X.; Liu, X.Y.; Liang, A.M.; et al. The impact of circulation patterns on regional transport pathways and air quality over Beijing and its surroundings. Atmos. Chem. Phys. 2012, 12, 5031–5053. [Google Scholar] [CrossRef]
- Wang, H.; Xu, J.; Zhang, M.; Yang, Y.; Shen, X.; Wang, Y.; Chen, D.; Guo, J. A study of the meteorological causes of a prolonged and severe haze episode in January 2013 over central-eastern China. Atmos. Environ. 2014, 98, 146–157. [Google Scholar] [CrossRef]
- Chuang, M.-T.; Chou, C.C.K.; Lin, N.-H.; Takami, A.; Hsiao, T.-C.; Lin, T.-H.; Fu, J.S.; Pani, S.K.; Lu, Y.-R.; Yang, T.-Y. A simulation study on PM2.5 sources and meteorological characteristics at the northern tip of Taiwan in the early stage of the Asian haze period. Aerosol Air Qual. Res. 2017, 17, 3166–3178. [Google Scholar] [CrossRef]
- Kozáková, J.; Pokorná, P.; Černíková, A.; Hovorka, J.; Braniš, M.; Moravec, P.; Schwarz, J. The association between intermodal (PM1–2.5) and PM1, PM2.5, coarse fraction and meteorological parameters in various environments in Central Europe. Aerosol Air Qual. Res. 2017, 17, 1234–1243. [Google Scholar] [CrossRef]
- Liang, P.; Zhu, T.; Fang, Y.; Li, Y.; Han, Y.; Wu, Y.; Hu, M.; Wang, J. The role of meteorological conditions and pollution control strategies in reducing air Pollution in Beijing during APEC 2014 and Victory parade 2015. Atmos. Chem. Phys. 2017, 17, 13921–13940. [Google Scholar] [CrossRef]
- Chen, Z.; Cai, J.; Gao, B.; Xu, B.; Dai, S.; He, B.; Xie, X. Detecting the causality influence of individual meteorological factors on local PM2.5 concentration in the Jing-Jin-Ji region. Sci. Rep. 2017, 7, 40735. [Google Scholar] [CrossRef] [PubMed]
- Liu, T.; Gong, S.; He, J.; Yu, M.; Wang, Q.; Li, H.; Liu, W.; Zhang, J.; Li, L.; Wang, X.; et al. Attributions of meteorological and emission factors to the 2015 winter severe haze pollution episodes in China’s Jing-Jin-Ji area. Atmos. Chem. Phys. 2017, 17, 2971–2980. [Google Scholar] [CrossRef]
- Hu, J.; Chen, J.; Ying, Q.; Zhang, H. One-year simulation of ozone and particulate matter in China using WRF/CMAQ modeling system. Atmos. Chem. Phys. 2016, 16, 10333–10350. [Google Scholar] [CrossRef]
- Zheng, B.; Zhang, Q.; Zhang, Y.; He, K.B.; Wang, K.; Zheng, G.J.; Duan, F.K.; Ma, Y.L.; Kimoto, T. Heterogeneous chemistry: A mechanism missing in current models to explain secondary inorganic aerosol formation during the January 2013 haze episode in North China. Atmos. Chem. Phys. 2015, 15, 2031–2049. [Google Scholar] [CrossRef]
- Zheng, Y.; Xue, T.; Zhang, Q.; Geng, G.; Tong, D.; Li, X.; He, K. Air quality improvements and health benefits from China’s clean air action since 2013. Environ. Res. Lett. 2017, 12, 114020. [Google Scholar] [CrossRef]
- Geng, G.; Zhang, Q.; Martin, R.V.; Lin, J.; Huo, H.; Zheng, B.; Wang, S.; He, K. Impact of spatial proxies on the representation of bottom-up emission inventories: A satellite-based analysis. Atmos. Chem. Phys. 2017, 17, 4131–4145. [Google Scholar] [CrossRef]
- Zhao, Y.; Nielsen, C.P.; Lei, Y.; McElroy, M.B.; Hao, J. Quantifying the uncertainties of a bottom-up emission inventory of anthropogenic atmospheric pollutants in China. Atmos. Chem. Phys. 2011, 11, 2295–2308. [Google Scholar] [CrossRef]
- Qi, J.; Zheng, B.; Li, M.; Yu, F.; Chen, C.; Liu, F.; Zhou, X.; Yuan, J.; Zhang, Q.; He, K. A high-resolution air pollutants emission inventory in 2013 for the Beijing-Tianjin-Hebei region, China. Atmos. Environ. 2017, 170, 156–168. [Google Scholar] [CrossRef]
- Hu, J.; Wang, P.; Ying, Q.; Zhang, H.; Chen, J.; Ge, X.; Li, X.; Jiang, J.; Wang, S.; Zhang, J.; et al. Modeling biogenic and anthropogenic secondary organic aerosol in China. Atmos. Chem. Phys. 2017, 17, 77–92. [Google Scholar] [CrossRef]
- Xue, W.B.; Wang, J.N.; Niu, H.; Yang, J.T.; Han, B.P.; Lei, Y.; Chen, H.L.; Jiang, C.L. Assessment of air quality improvement effect under the national total emission control program during the twelfth national five-year plan in China. Atmos. Environ. 2013, 68, 74–81. [Google Scholar] [CrossRef]
- Dominici, F.; Wang, Y.; Correia, A.W.; Ezzati, M.; Pope, C.A.I.; Dockery, D.W. Chemical composition of fine particulate matter and life expectancy: In 95 US counties between 2002 and 2007. Epidemiology 2015, 26, 556–564. [Google Scholar] [CrossRef] [PubMed]
- Zhang, C.; Ni, Z.; Ni, L. Multifractal detrended cross-correlation analysis between PM2.5 and meteorological factors. Phys. A Stat. Mech. Appl. 2015, 438, 114–123. [Google Scholar] [CrossRef]
- Fu, X.; Wang, S.; Chang, X.; Cai, S.; Xing, J.; Hao, J. Modeling analysis of secondary inorganic aerosols over China: Pollution characteristics, and meteorological and dust impacts. Sci. Rep. 2016, 6, 35992. [Google Scholar] [CrossRef] [PubMed]
- He, J.; Gong, S.; Yu, Y.; Yu, L.; Wu, L.; Mao, H.; Song, C.; Zhao, S.; Liu, H.; Li, X.; et al. Air pollution characteristics and their relation to meteorological conditions during 2014–2015 in major Chinese cities. Environ. Pollut. 2017, 223, 484–496. [Google Scholar] [CrossRef] [PubMed]
- Liu, X.; Hu, F.; Zou, H.; Cao, X.; Dou, J. Analysis on characteristic of atmospheric boundary layer during a typical heavy fog process in Beijing area. Plateau Meteorol. 2010, 29, 1174–1182. [Google Scholar]


| Regions | Land Area (%) | GDP (%) | Population (%) |
|---|---|---|---|
| JJJ | 2 | 10 | 8 |
| YRD | 2 | 6 | 12 |
| PRD | 2 | 10 | 8 |
| CYB | 6 | 6 | 8 |
| Total of the four regions | 12 | 32 | 36 |
| No. | City | Sampling Site | Sampling Height | Surrounding Environment |
|---|---|---|---|---|
| 1 | Beijing | Beijing Normal University | 35 m | Intensive traffic but little industrial activities |
| 2 | Shijiazhuang | Residential building | 20 m | Residential buildings and traffic roads |
| 3 | Tangshan | Environmental monitoring station | 15 m | Offices and residential buildings |
| Parameterization Scheme | Name of the Selected Solution |
|---|---|
| Micro-physics scheme | WSM6 |
| Longwave radiation scheme | New Goddard scheme |
| Shortwave radiation scheme | RRTM |
| Near-ground scheme | Pleim Xiu |
| Land surface scheme | Pleim Xiu |
| Boundary layer scheme | ACM2 |
| Cumulus convection scheme | Kain–Fritsch |
| Model Parameter | CMAQ |
|---|---|
| Model version | 5.0.2 |
| Grid nested mode | Single-layer grid |
| Horizontal resolution | 20 km |
| Number of vertical layers | 14 |
| Gas phase chemical mechanism | CB05 |
| Aerosol chemical mechanism | AERO5 |
| Photochemical reaction rate | In-line |
| Sand and dust | Off |
| Boundary condition | Default |
| Initial condition | Restart each day |
| Statistic | January 2016 | January 2017 |
|---|---|---|
| n | 318 | 318 |
| R | 0.76 | 0.75 |
| NMB (%) | −11.75 | −13.92 |
| NME (%) | 31.59 | 30.56 |
| Province | Meteorological Impact Degree | Variation Amount of PM2.5 Caused by Meteorology |
|---|---|---|
| Beijing | 73.08 | 49.70 |
| Tianjin | 23.74 | 17.50 |
| Hebei | 27.46 | 25.41 |
| Shanxi | 25.58 | 21.00 |
| Inner Mongolia | 35.78 | 14.13 |
| Liaoning | 18.63 | 11.45 |
| Jilin | 6.87 | 4.51 |
| Heilongjiang | 29.12 | 12.91 |
| Shanghai | −15.41 | −10.78 |
| Jiangsu | −10.77 | −8.91 |
| Zhejiang | −2.29 | −1.38 |
| Anhui | −0.73 | −0.59 |
| Fujian | 9.16 | 3.01 |
| Jiangxi | 22.39 | 12.25 |
| Shandong | 1.43 | 1.60 |
| Henan | 17.41 | 23.95 |
| Hubei | 21.28 | 20.72 |
| Hunan | 31.34 | 22.30 |
| Guangdong | 44.29 | 14.38 |
| Guangxi | 54.11 | 21.37 |
| Hainan | 20.29 | 3.72 |
| Chongqing | 11.55 | 8.17 |
| Sichuan | 7.64 | 5.26 |
| Guizhou | 15.59 | 5.76 |
| Yunnan | −0.75 | −0.23 |
| Tibet | −17.51 | −6.38 |
| Shaanxi | −0.13 | −0.13 |
| Gansu | −9.56 | −4.78 |
| Qinghai | 2.15 | 0.90 |
| Ningxia | −1.54 | −0.95 |
| Xinjiang | 10.69 | 10.66 |
| Nationwide | 13.55 | 9.17 |
| Region | ||
|---|---|---|
| JJJ | 29.70 | 26.43 |
| YRD | −8.51 | −6.13 |
| PRD | 42.60 | 13.63 |
| CYB | 7.89 | 5.44 |
| City Name | ||
|---|---|---|
| Beijing | 73.08 | 49.70 |
| Tianjin | 23.74 | 17.50 |
| Shijiazhuang | 24.87 | 32.75 |
| Tangshan | 30.76 | 24.16 |
| Qinhuangdao | 57.69 | 23.33 |
| Handan | 15.25 | 16.65 |
| Xingtai | 19.22 | 24.79 |
| Baoding | 23.82 | 35.59 |
| Zhangjiakou | 60.98 | 16.60 |
| Chengde | 68.93 | 31.11 |
| Cangzhou | 7.25 | 6.17 |
| Langfang | 59.94 | 52.98 |
| Hengshui | 19.62 | 26.23 |
© 2018 by the authors. Licensee MDPI, Basel, Switzerland. This article is an open access article distributed under the terms and conditions of the Creative Commons Attribution (CC BY) license (http://creativecommons.org/licenses/by/4.0/).
Share and Cite
Xu, Y.; Xue, W.; Lei, Y.; Zhao, Y.; Cheng, S.; Ren, Z.; Huang, Q. Impact of Meteorological Conditions on PM2.5 Pollution in China during Winter. Atmosphere 2018, 9, 429. https://doi.org/10.3390/atmos9110429
Xu Y, Xue W, Lei Y, Zhao Y, Cheng S, Ren Z, Huang Q. Impact of Meteorological Conditions on PM2.5 Pollution in China during Winter. Atmosphere. 2018; 9(11):429. https://doi.org/10.3390/atmos9110429
Chicago/Turabian StyleXu, Yanling, Wenbo Xue, Yu Lei, Yang Zhao, Shuiyuan Cheng, Zhenhai Ren, and Qing Huang. 2018. "Impact of Meteorological Conditions on PM2.5 Pollution in China during Winter" Atmosphere 9, no. 11: 429. https://doi.org/10.3390/atmos9110429
APA StyleXu, Y., Xue, W., Lei, Y., Zhao, Y., Cheng, S., Ren, Z., & Huang, Q. (2018). Impact of Meteorological Conditions on PM2.5 Pollution in China during Winter. Atmosphere, 9(11), 429. https://doi.org/10.3390/atmos9110429