1. Introduction
Interactions between clouds and aerosols are among the largest sources of uncertainty in estimating human impacts on climate. As stated in the Intergovernmental Panel on Climate Change (IPCC) 5th Assessment Report [
1] Chapter 7, “Clouds and aerosols continue to contribute the largest uncertainty to estimates and interpretations of the Earth’s changing energy budget ... the quantification ... of aerosol–cloud interactions continues to be a challenge.” To address this challenge, a large number of scientists have pursued research using various approaches. Since about 2005, these efforts included the analysis of satellite observations with the goal of examining the relationship between aerosol properties and regional cloud coverage [
2,
3,
4,
5]. Later, scientists also examined how aerosol properties vary with the distance to the nearest clouds using observations from satellites, aircraft, and/or the ground [
6,
7,
8,
9]. The remote sensing studies were complimented by studies that used in situ observations to gain insights into some processes contributing to near-cloud aerosol changes such as swelling or chemical cloud processing [
10,
11,
12]. In the meantime, other studies used time series of observations to characterize how aerosol populations change after clouds formed in the area [
13,
14], or used modeling to better understand inter-cloud regions [
15,
16], in some cases combining models with observations [
17,
18,
19,
20]. Based on results from such studies, the IPCC 5th Assessment Report [
1] summarized the issue as follows: “... aerosol measured in the vicinity of clouds is significantly different than it would be were the cloud field, and its proximate cause (high humidity), not present. The latter results from humidification effects on aerosol optical properties, contamination by undetectable cloud fragments and the remote effects of radiation scattered by cloud edges on aerosol retrieval.”
Thoroughly characterizing near-cloud aerosols and understanding the causes of near-cloud particle changes are critical for accurate representations of aerosol–cloud interactions and aerosol radiative forcing. This is because we live in a cloudy world and, as it will be discussed later in this paper, a large portion of clear-sky areas are so close to clouds that their aerosol populations are significantly modified by cloud-related processes. As a result, excluding near-cloud areas from aerosol studies would cause two major problems. First, this would substantially reduce the available data volume. For example, [
21] found that in images taken by the Moderate Resolution Imaging Spectroradiometer (MODIS), 20% of all pixels are deemed too cloudy for aerosol retrievals and not cloudy enough for cloud retrievals. As a result, roughly 20% of pixels are not considered in MODIS-based global estimates of either “clear sky” or “cloudy sky” radiative effects. Second, excluding near-cloud areas would underestimate the aerosol direct radiative forcing because aerosol amounts are higher, and physical and optical properties are different in near-cloud pixels than in far-from-cloud pixels [
10,
22]. Moreover, near-cloud aerosol observations influence not only our estimates of aerosol direct radiative effects, but also have a dramatic impact on satellite-based estimates of aerosol indirect radiative effects. For example, ref. [
23] found that satellite-based estimates of indirect effects drop by about half if near-cloud observations are excluded, while [
24] found that the first indirect effect of aerosols is greatly underestimated if we do not take into account the aerosol swelling that occurs near clouds. Finally, characterizing near-cloud aerosols is also important for better understanding and simulating the wide range of physical and chemical processes through which aerosols and clouds influence each other.
While satellites offer excellent opportunities for a wide range of aerosol studies, it is important to keep in mind that satellite-based aerosol measurements face additional challenges in the vicinity of clouds. For example, as mentioned above, undetected cloud particles or sunlight scattered from nearby clouds can result in overestimations of aerosol amounts (even if retrievals use multiangle polarized radiance measurements and strict data filtering techniques [
25]), which in turn can lead to overestimations of aerosol radiative effects [
17,
26]. Recognizing these challenges, researchers have been exploring new avenues to mitigate remote sensing uncertainties; some of the ongoing efforts and possible future approaches are discussed at the end of this paper.
Our research group started examining this topic just over a decade ago, and at this juncture, this paper presents a brief overview of our decade-long efforts on characterizing cloud-related changes in aerosol observations. The outline of the paper is as follows. First,
Section 2 will discuss the characterization of the transition zone surrounding clouds, where satellite measurements show systematic cloud-related changes. Next,
Section 3 will discuss the analysis of relationships between aerosol properties and regional cloud fraction. Finally,
Section 4 will present a brief summary and conclusions.
2. Characterization of the Transition Zone Surrounding Clouds
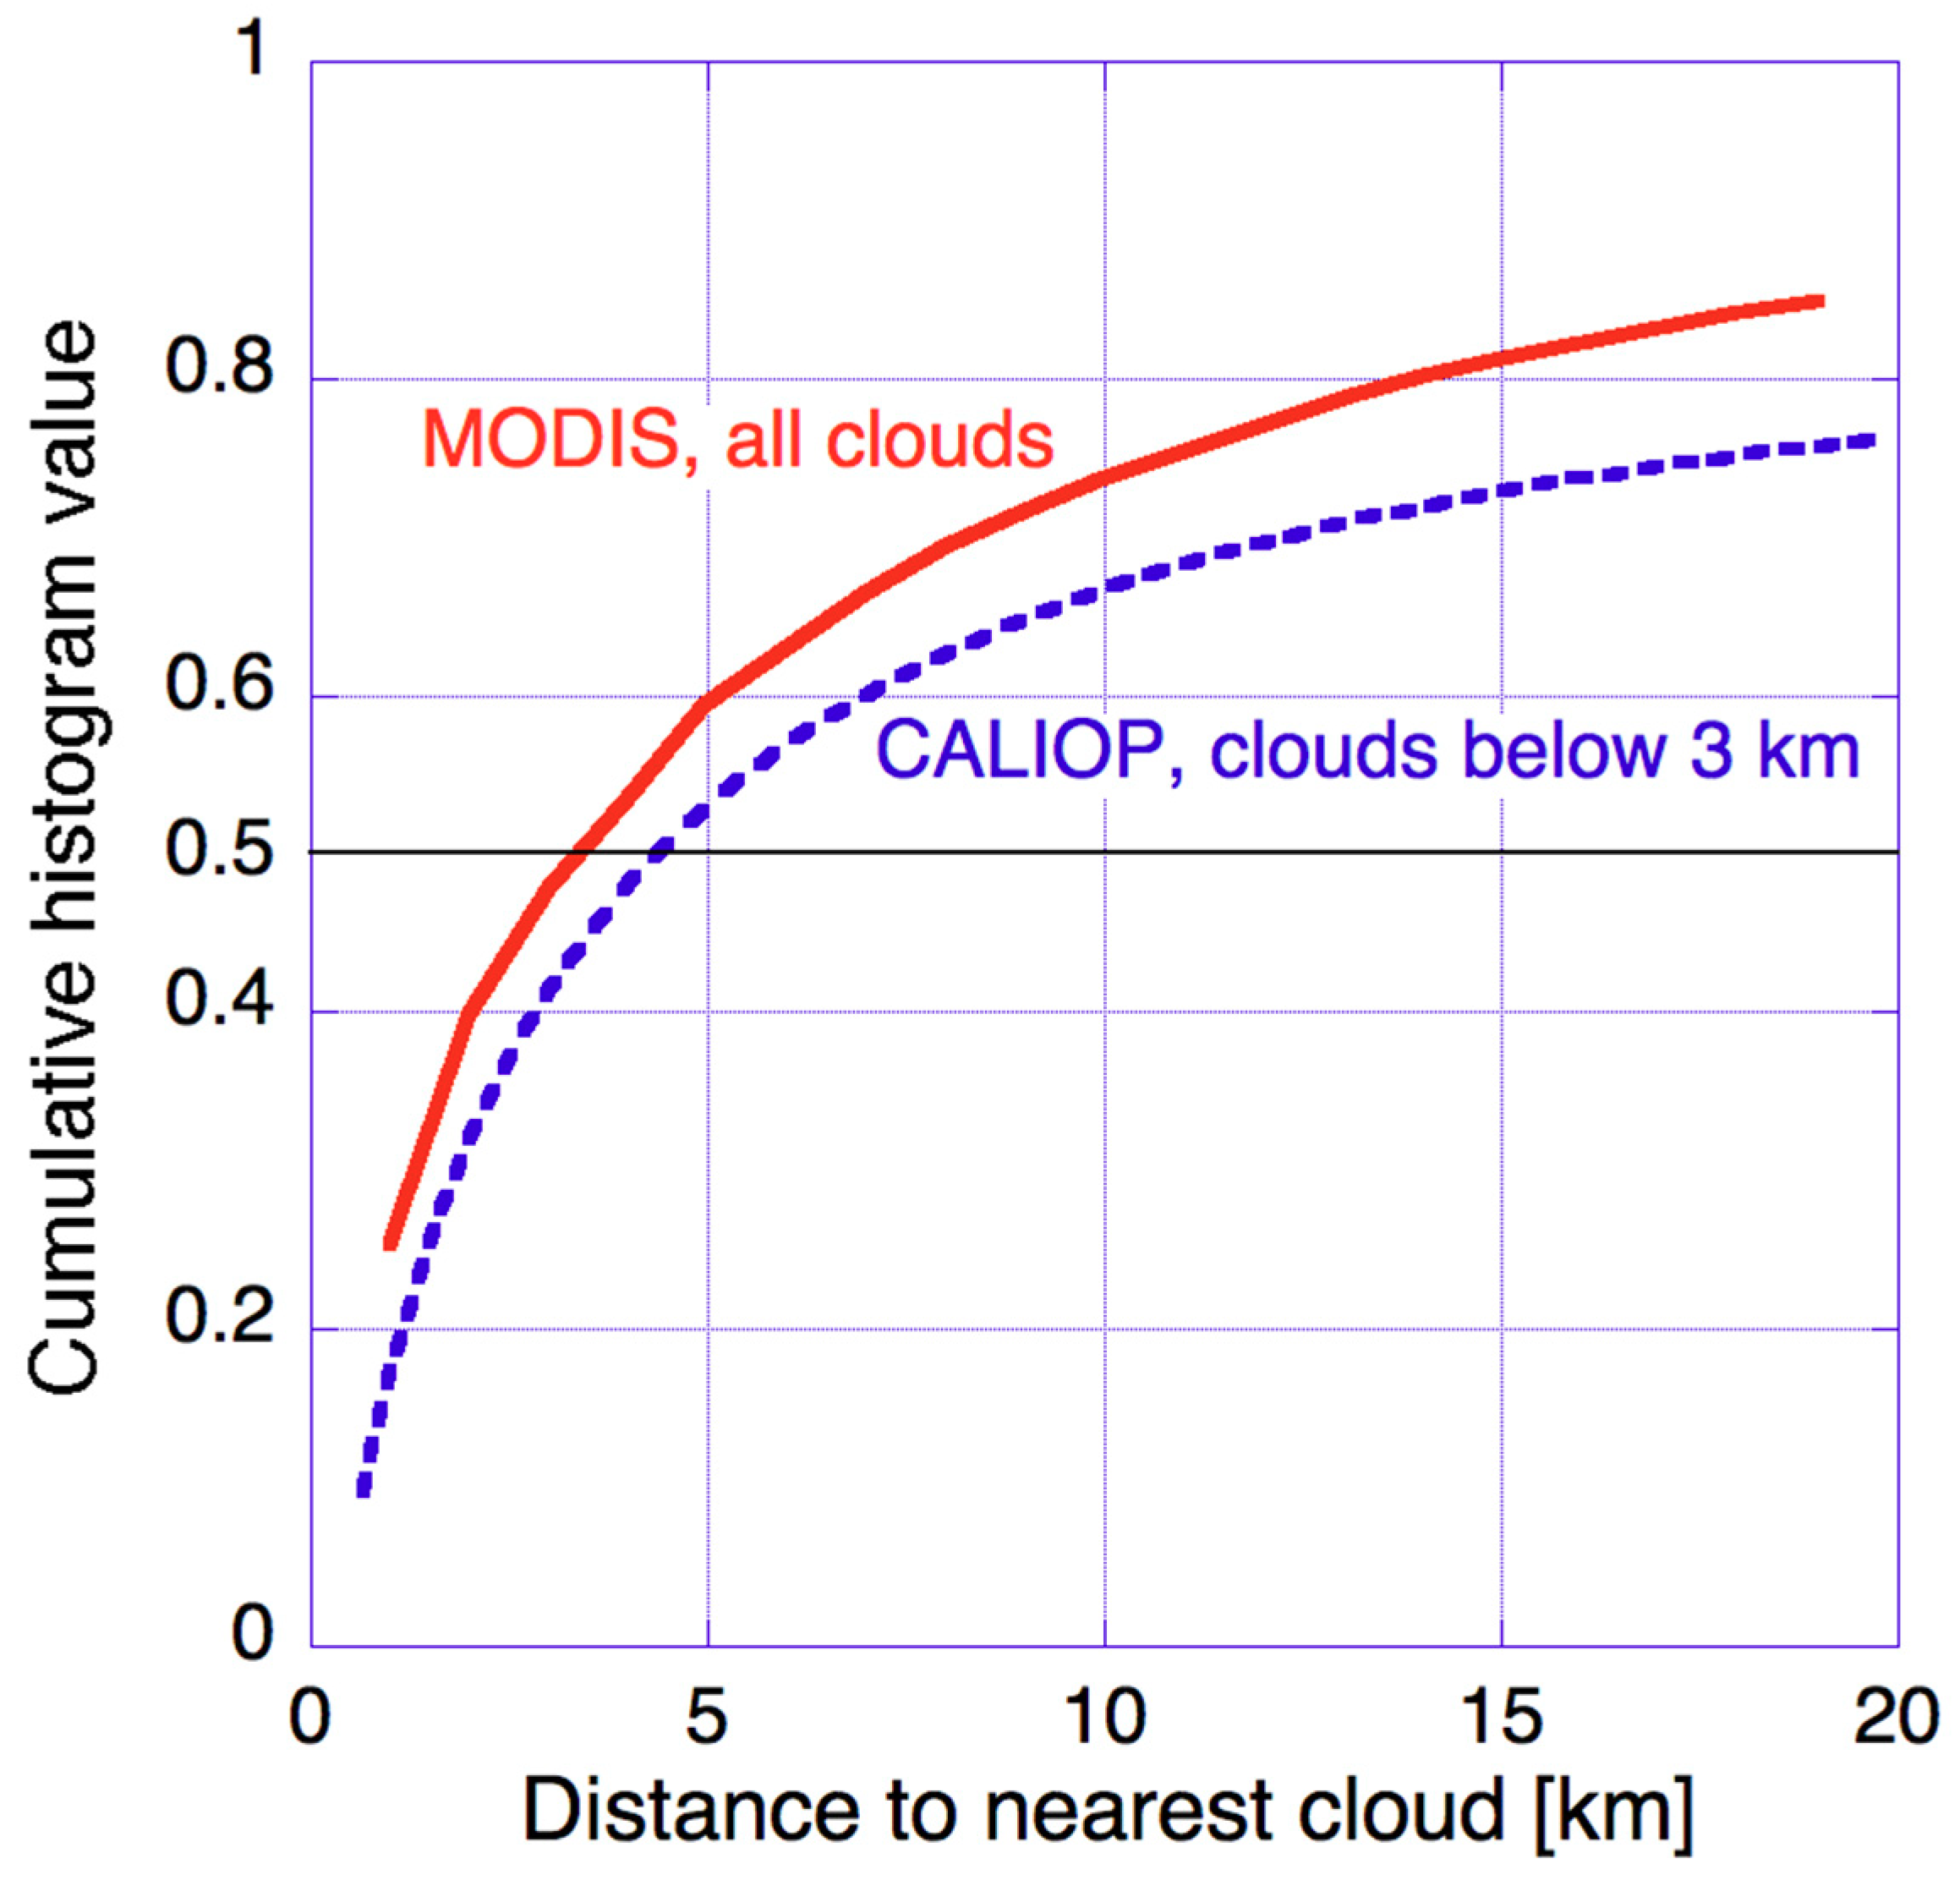
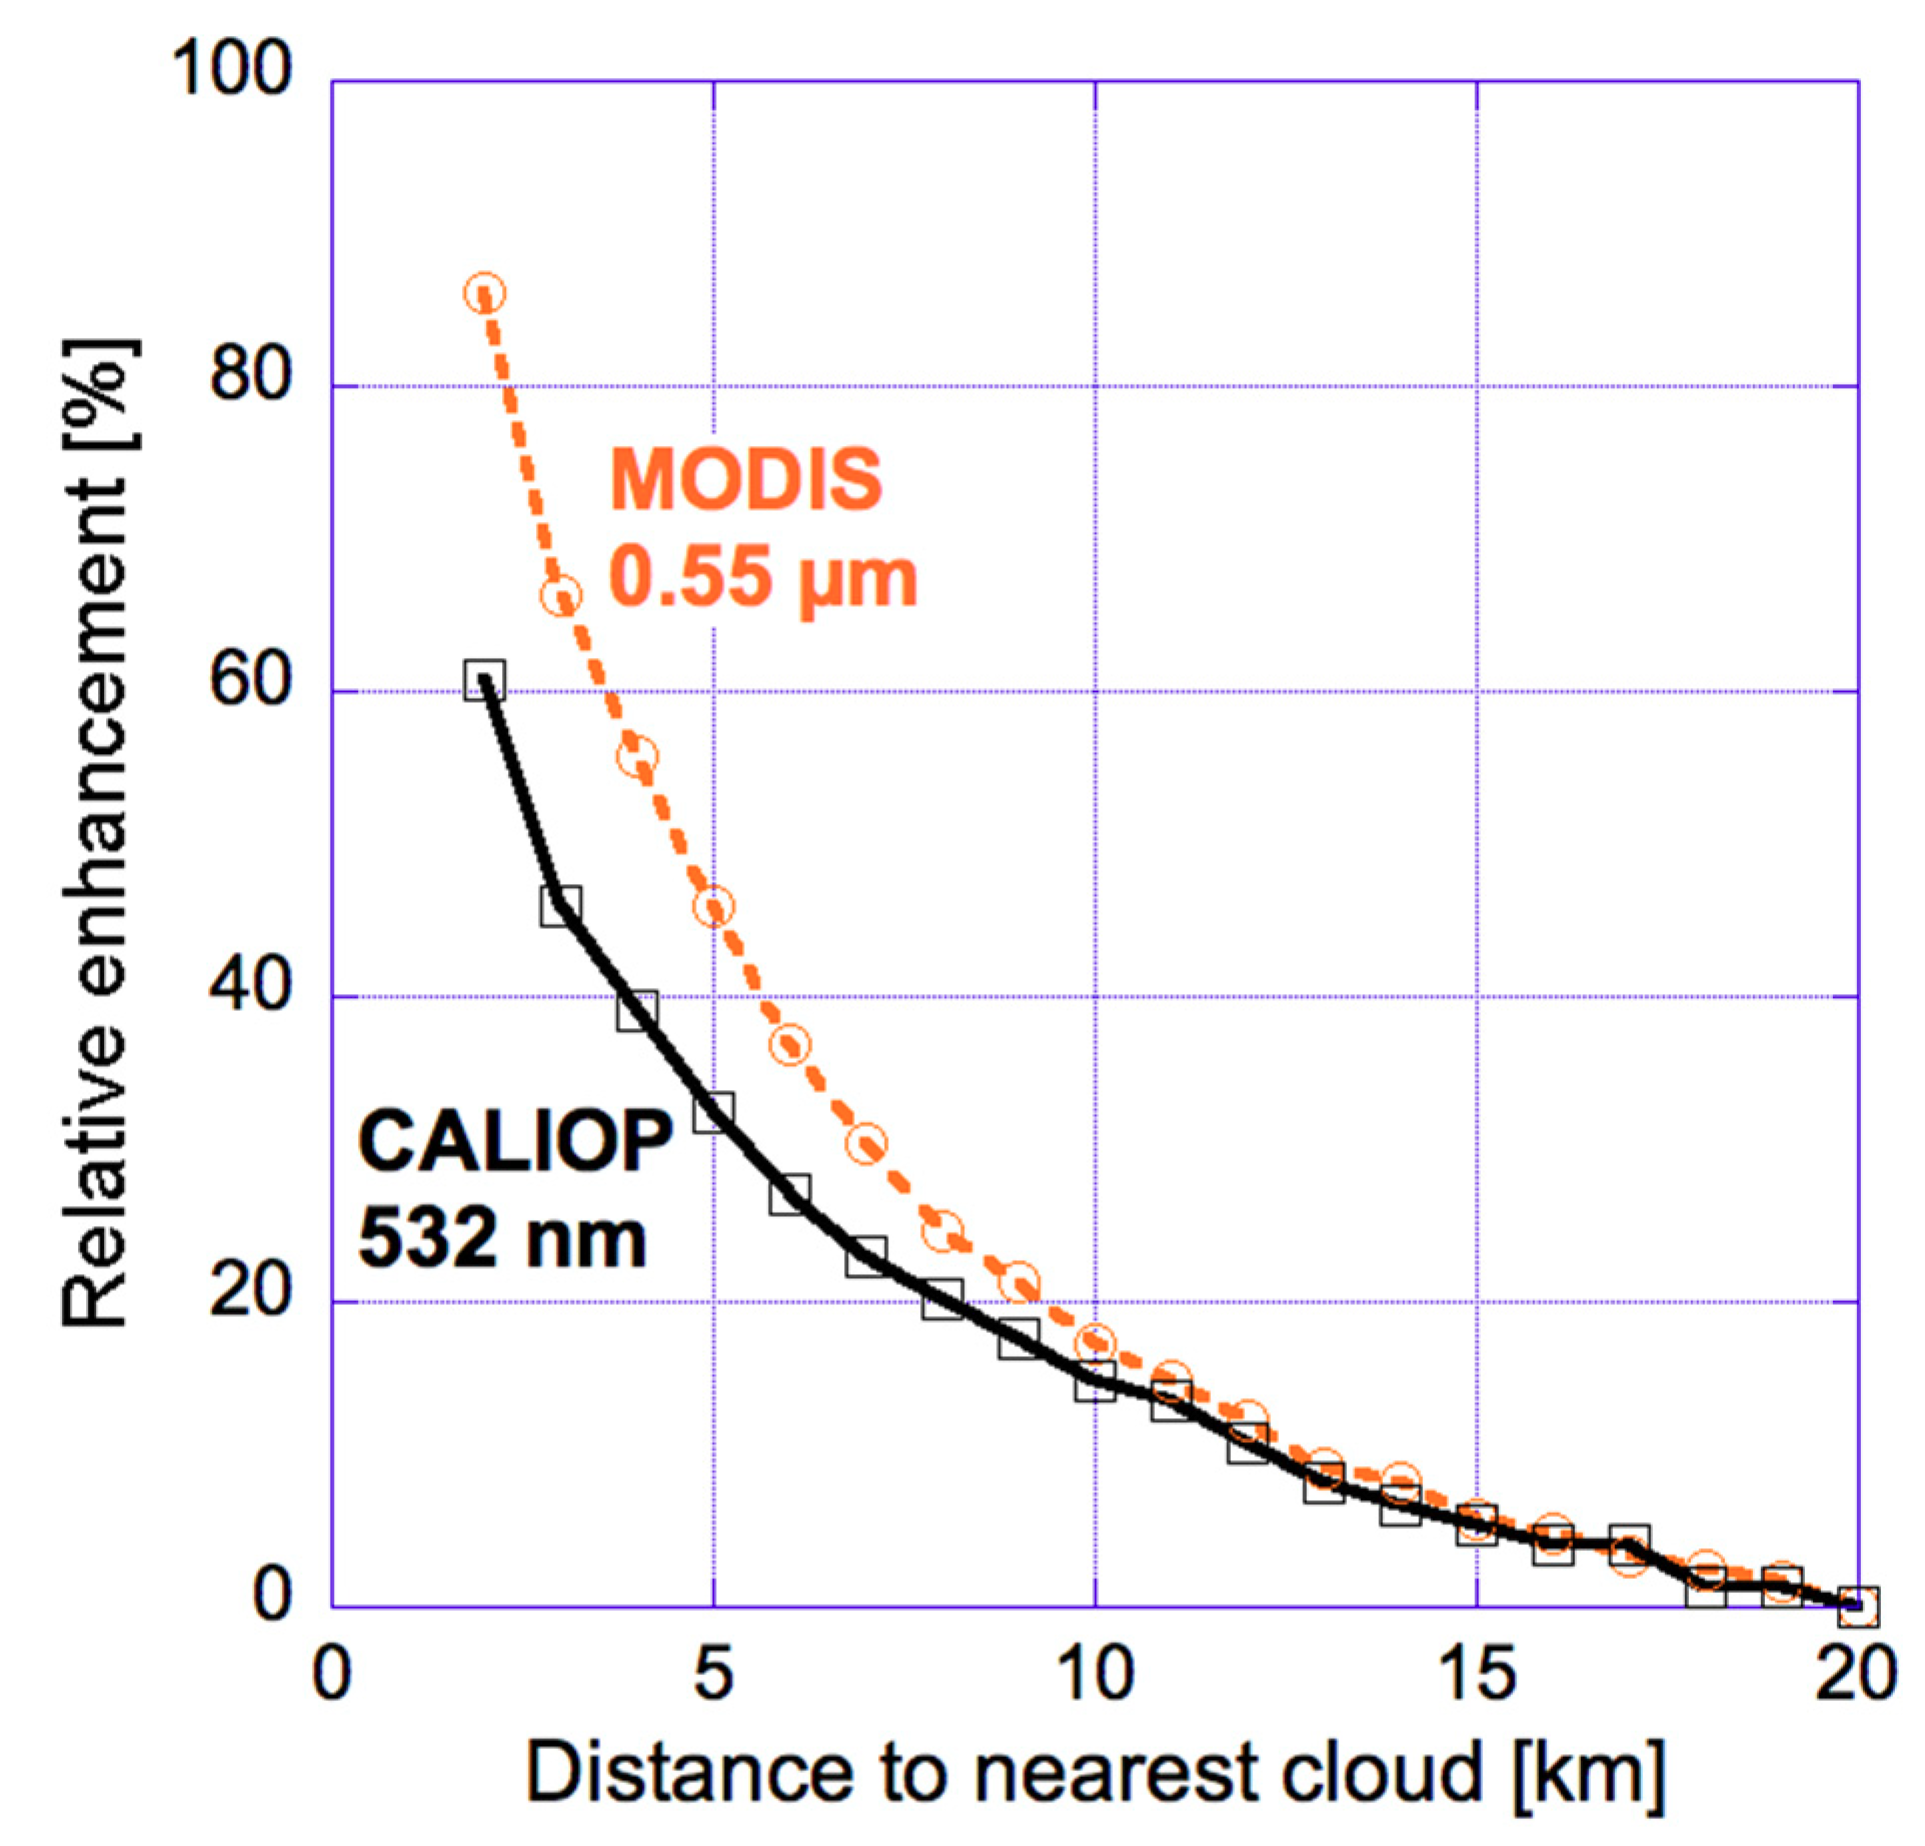
As mentioned in the introduction, we started examining cloud-related changes in aerosol properties building on the accomplishments of numerous earlier studies. One reason for the sustained interest in near-cloud aerosols is that aerosol populations are different in the presence of nearby clouds. Another reason is that the transition zone surrounding clouds (the zone of pronounced cloud-related changes in observed aerosol properties) covers a substantial portion of all cloud-free atmospheric columns. This is illustrated in
Figure 1, which shows that for half of all clear columns over oceans, MODIS images indicate the nearest cloud within 3 km, while Cloud-Aerosol Lidar with Orthogonal Polarization (CALIOP) data indicates the nearest low-altitude (below 3 km) cloud within 4 km.
We note that while the solid curve in
Figure 1 represents clear areas near any cloud, all subsequent plots that consider “distance to clouds” are for clear areas near low-level clouds. When analyzing MODIS data throughout this paper, cloud-free and cloudy pixels are distinguished using the MOD35/MYD35 operational MODIS cloud mask product. Clouds are considered “low-altitude” if the value of the MODIS cloud top pressure product exceeds 700 hPa, which implies that the cloud top is below about 3 km. When analyzing CALIOP data in the absence of co-located MODIS data, we use the 1 km resolution CALIOP cloud mask which detects clouds along the single line of the CALIOP track. (This issue will be discussed in more detail later in this paper.) Our work has focused on the vicinity of low-level clouds, because high clouds can affect aerosols quite differently (and may not affect much of the aerosols that occur at lower altitudes). Therefore, the presented results represent mainly the vicinity of shallow cumulus and broken stratocumulus clouds.
In turn,
Figure 2 illustrates that clear-sky reflectances systematically increase near clouds, and the changes can extend well beyond 5 km. As discussed in a wide range of studies (see [
15]), several factors may contribute to the observed changes: (1) aerosols swelling in the humid air surrounding clouds [
10,
17], (2) presence of undetected cloud droplets in otherwise cloud-free columns, for example due to detrainment, subpixel-size clouds, few large droplets lingering after a cloud dissipates, or a few droplets appearing before stable clouds could form [
15,
28,
29], (3) cloud processing that involves liquid phase chemical reactions transforming precursor gases into new aerosols [
30] or modifies aerosol size distributions by changing the hygroscopicity of pre-existing aerosols [
31], or merges aerosol particles when the cloud droplets forming around them merge through collision–coalescence and then evaporate [
9,
32], (4) three-dimensional radiative processes in which clouds scatter radiation into nearby clear areas, and air molecules, aerosols, or the surface then scatter it toward the satellite sensor [
33,
34,
35], (5) instrument blurring caused by stray light contamination [
36]. However, while several studies provided valuable insights [
17,
26], the relative importance of these factors is not yet clear.
A notable feature of
Figure 2 is that the near-cloud enhancements are stronger at shorter wavelengths. This is consistent with enhanced aerosol concentrations near clouds (as aerosol particles scatter more light at shorter wavelengths) but also with 3-D radiative effects: The stronger Rayleigh scattering at shorter wavelengths has a larger impact in redirecting the light coming from clouds toward a satellite above [
33,
35]. In contrast, undetected cloud particles scatter light fairly similarly at all wavelengths, which means that they cannot explain the wavelength dependence of enhancements in
Figure 2. For example, the absolute increase would be roughly similar at 0.47 µm and 2.13 µm if undetected droplets were the main cause—and so the observed increase being much larger at 0.47 µm than at 2.13 µm points to other causes such as 3-D effects and enhanced aerosol scattering. (It is interesting to note that the relative increase is smaller at 0.47 µm than at 2.13 µm; this occurs because 0.47 µm reflectances are greatly enhanced by Rayleigh scattering and surface reflection, and this constant enhancement reduces the relative magnitude of near-cloud increases.) We point out, however, that undetected clouds (and instrument blurring) are still likely to contribute and to be especially important at 2.13 µm, where aerosol scattering is weak and Rayleigh scattering is negligible.
Naturally, the near-cloud enhancements in
Figure 2 will influence the aerosol properties estimated from the observed reflectances. For example,
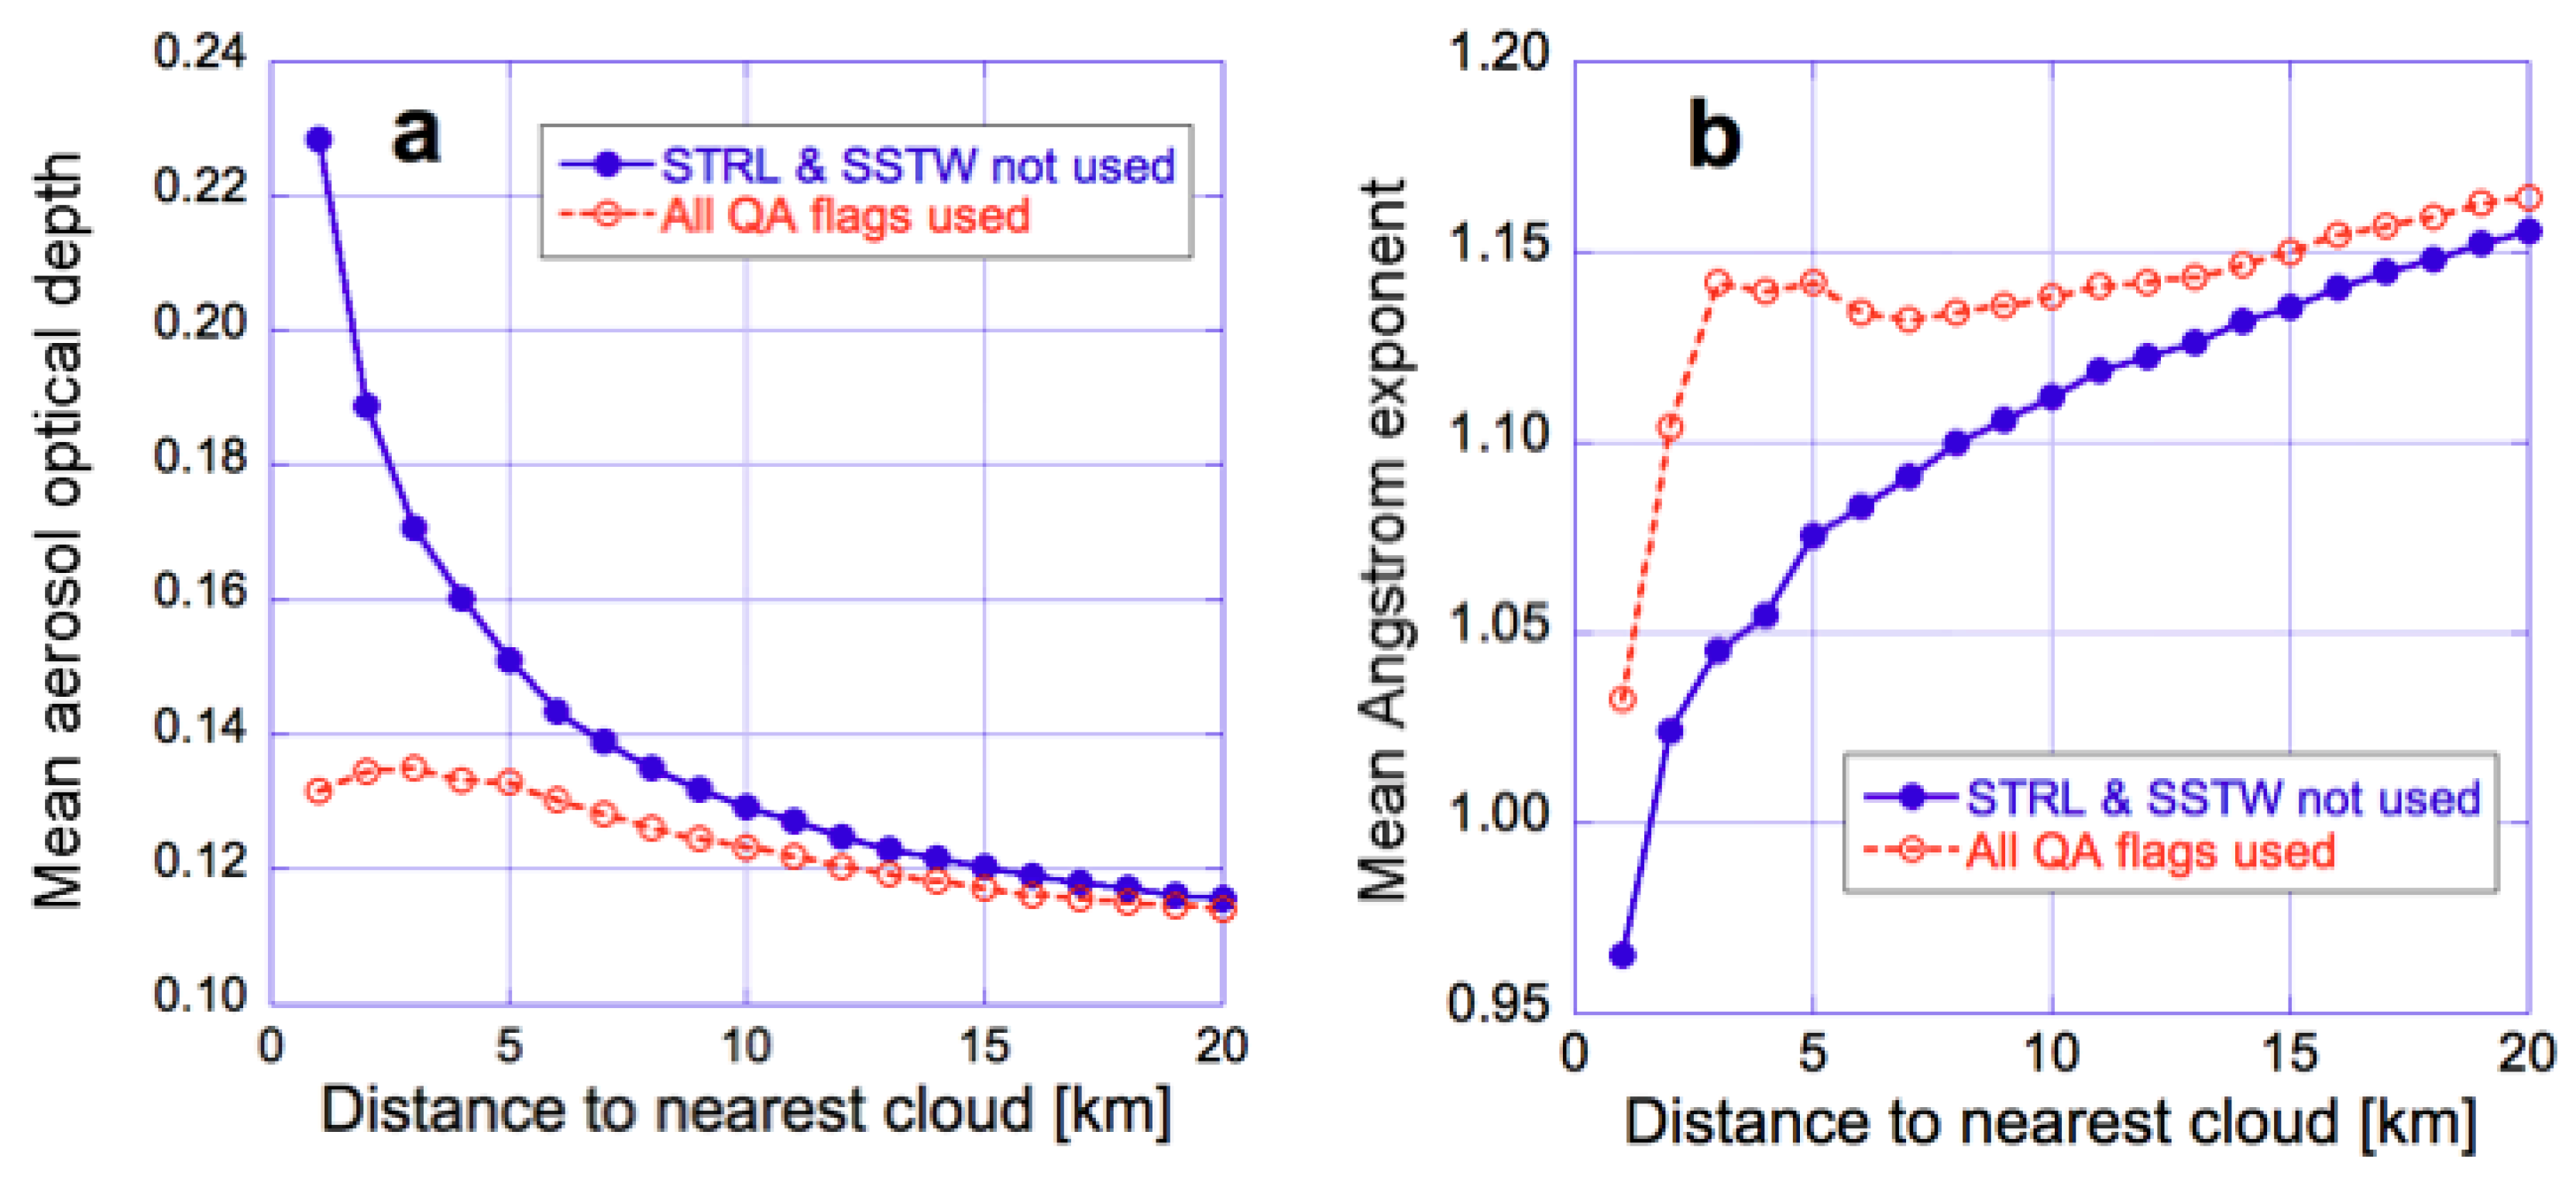
Figure 3 illustrates the impact on aerosol optical depth (AOD) and Angstrom exponent (AE) values reported in the MODIS Ocean Color product [
39,
40,
41]. The solid blue line shows that when we use pixels regardless of whether or not clouds may occur nearby (that is, we ignore the Stray light (STRL) or Sea surface temperature warning (SSTW) quality assessment flags), mean AOD sharply increases as we approach clouds: The mean retrieved AOD is in fact 50% higher within 5 km from clouds than father away from them. At the same time, the mean Angstrom exponent drops significantly near clouds. To put the AE changes in perspective, we mention that, as illustrated in Figure 8c of [
42], AE dropping by 0.1 can correspond to a change of 0.1 in coarse mode fraction or to an at least 0.02 µm increase in the effective radius of small mode particles. (Assuming small mode aerosol models used in the MODIS Dark target product [
43], this corresponds to a 20–30% increase in effective radius.)
In contrast, the red dotted curves in
Figure 3 indicate that if we used the STRL and SSTW QA flags to exclude pixels near bright/thick clouds, the cloud-related increases (near thin/small clouds) would become much weaker. In this case, however, we could use 5 times fewer pixels within 5 km from clouds, and this would make our dataset much less representative of the overall aerosol population of partly cloudy regions.
Seeking insights into the origins of the observed near-cloud changes,
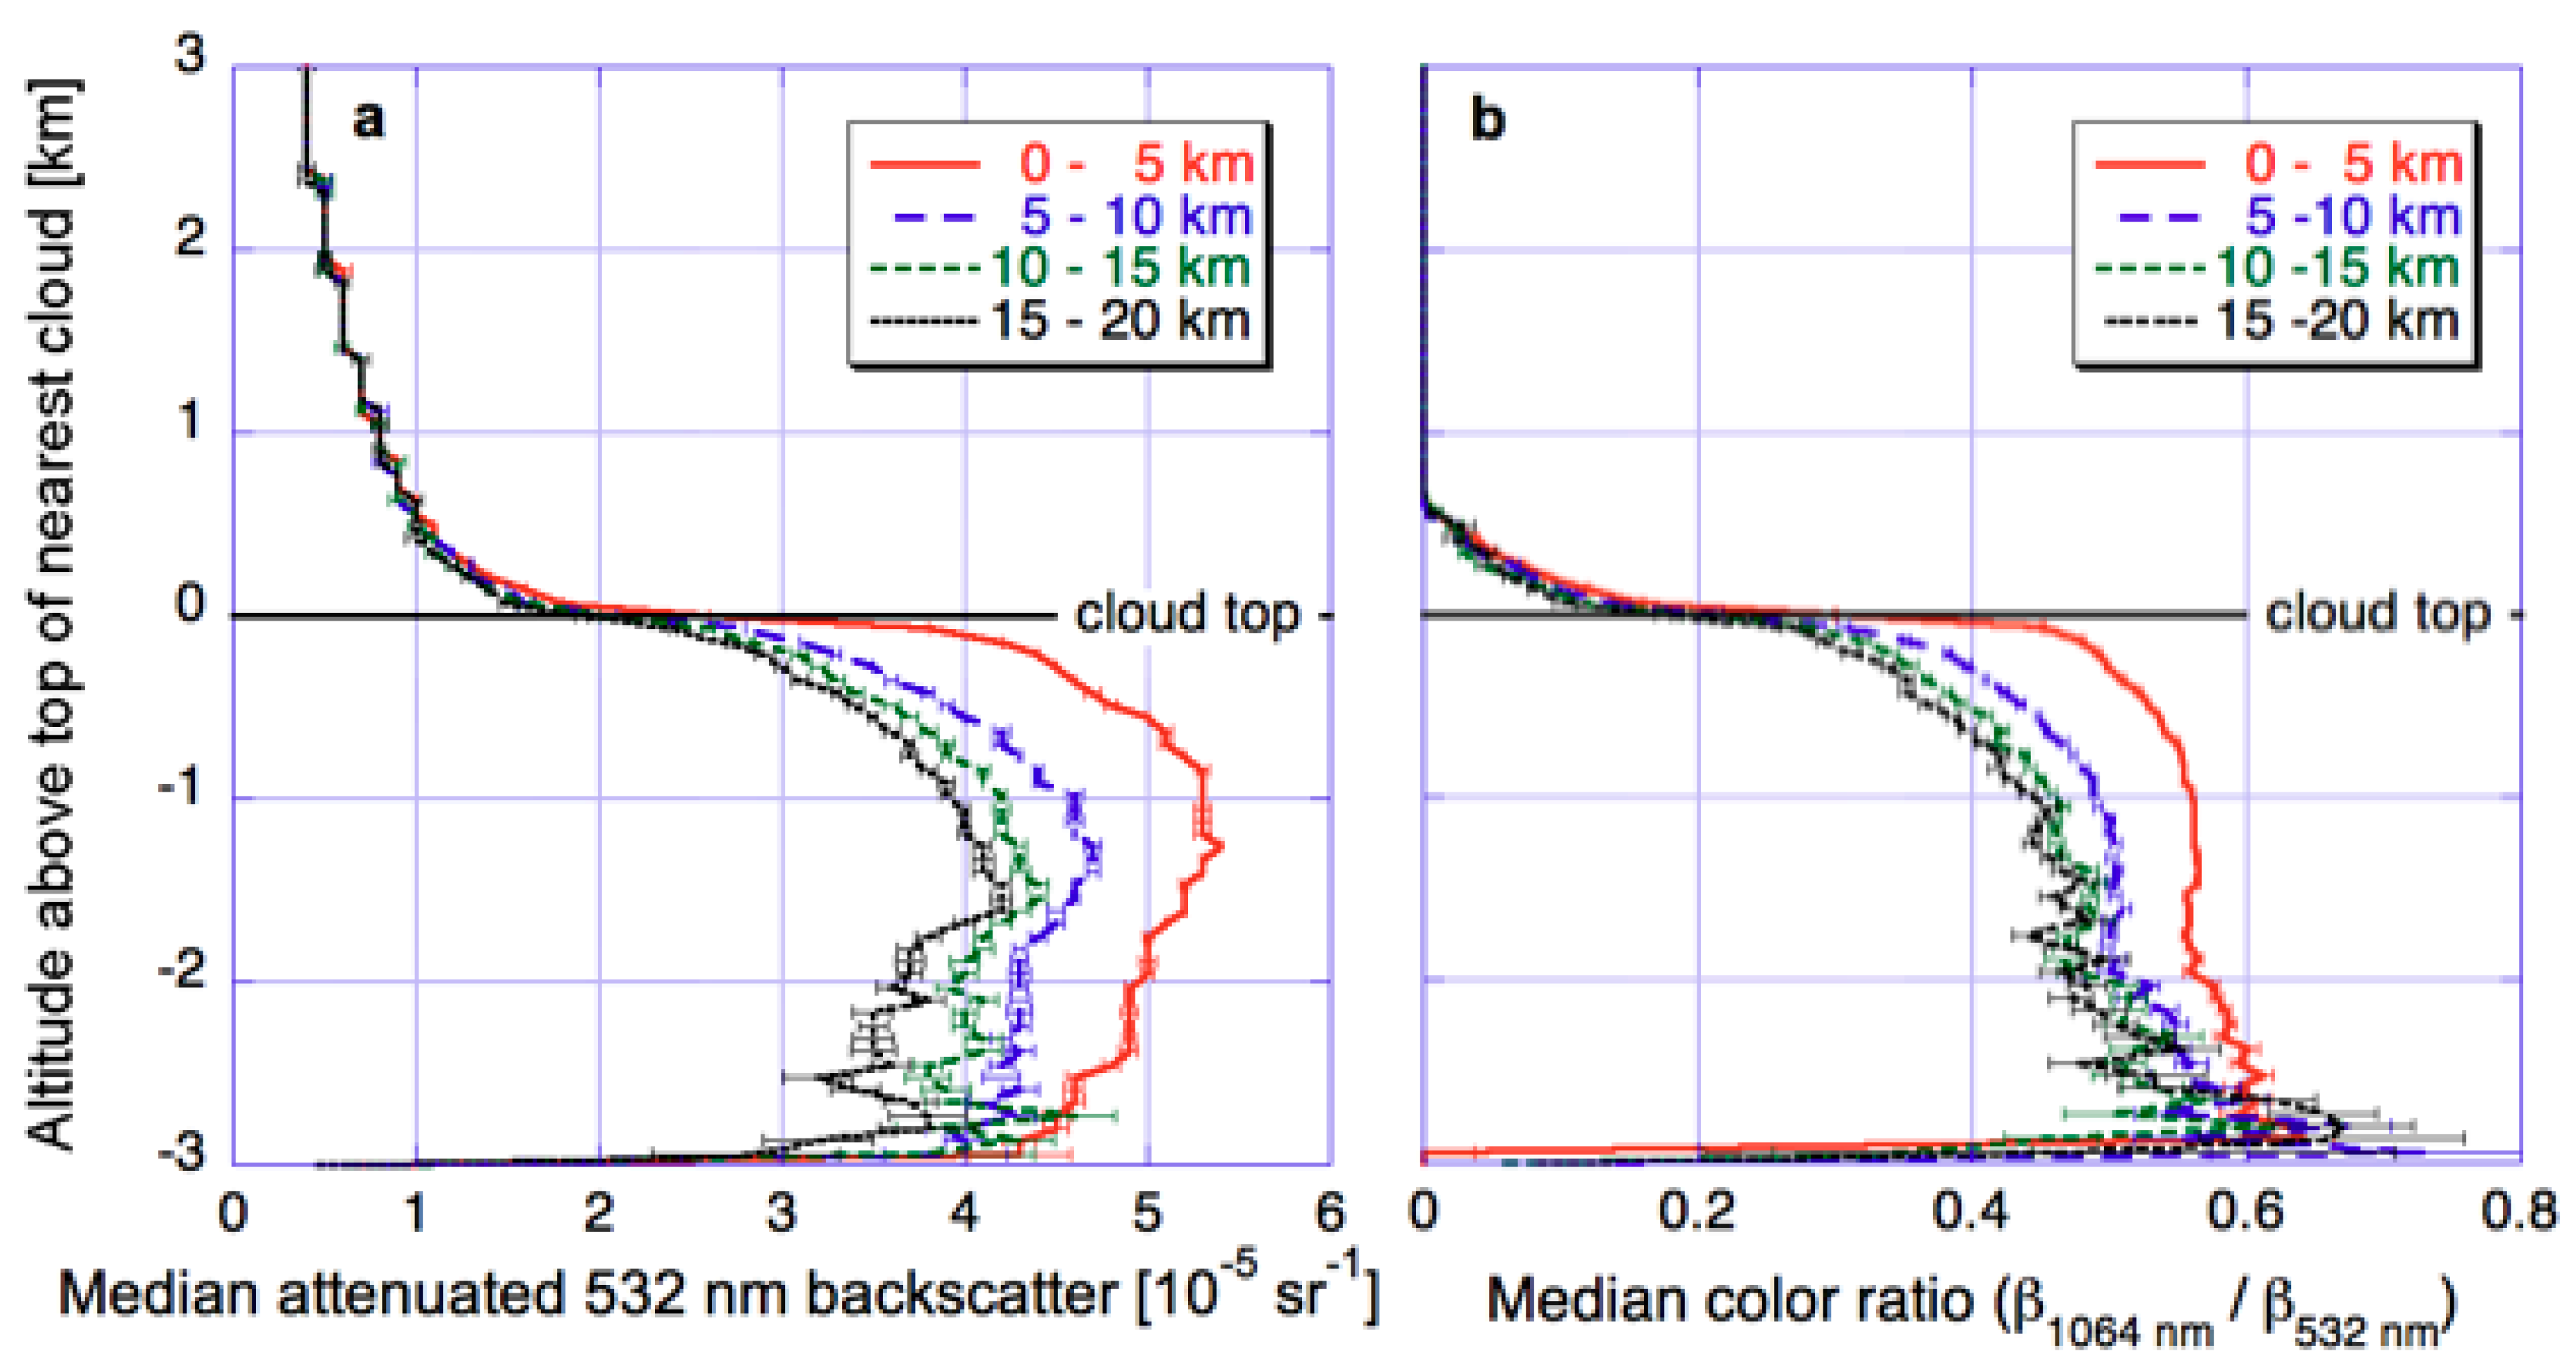
Figure 4 shows the way CALIOP lidar returns change near clouds. Panel
a shows that in a global dataset of oceanic cloud-free columns that occur near low-altitude clouds, lidar backscatter drops dramatically above the cloud top altitude of nearest clouds. This is because boundary layer convection is not likely to move aerosols from low levels to above cloud tops, and because any undetected cloud particles should also occur below cloud top altitude. Moreover, the figure also indicates that near-cloud increases in both backscatter (i.e., particle concentration) and color ratio (i.e., particle size) occur below cloud top altitude. The cloud-related changes being confined to the low altitudes containing boundary layer clouds was also apparent in Figure 7 of [
45]. The figure revealed that in observing Saharan dust over the Atlantic Ocean, CALIOP indicates near-cloud increases in backscatter, color ratio, and depolarization (indicating that dust particles become more spherical as they swell in the humid air near clouds) at altitudes below, but not above, 2 km.
Next,
Figure 5 examines the way enhancements in clear sky reflectance depend on the optical thickness of nearby clouds. The figure separates clear pixels into four sub-categories based on the maximum cloud thickness of the 3 by 3 array centered on the nearest cloudy pixel. In addition, the figure also illustrates asymmetries in reflectances by separately showing reflectance increases in two subsets of our dataset. The ‘‘illuminated’’ subset includes clear pixels whose closest cloudy neighbor is to the Northeast—which implies that the clear pixel is closest to an illuminated, Southwestern cloud side. In contrast, the shadowy subset includes clear pixels whose nearest cloudy neighbor lies to the South—implying that the clear pixel is closest to a shadowy, Northern cloud side.
The figure shows that cloud optical thickness has a strong influence on reflectance enhancements at surrounding clear areas. Near sunlit cloud sides, the dominant feature is that thicker clouds reflect more light and thus cause stronger enhancements in nearby clear-sky reflectances. Near shadowy cloud sides, this effect dominates only farther away from clouds: Because shadowing dominates closer to clouds, the enhancement is smaller near thicker clouds that cast darker shadows. In fact, the enhancement may even have a negative sign, according to the simulations in [
34]. The transition occurs at about 3–4 km away from clouds, which is comparable to the length of shadows expected for 48° mean solar zenith angle of the dataset, and 3 km cloud altitude. Finally,
Figure 5 also reveals that cloud thickness makes a larger difference at shorter wavelengths, which is consistent with 3-D effects being stronger at those wavelengths.
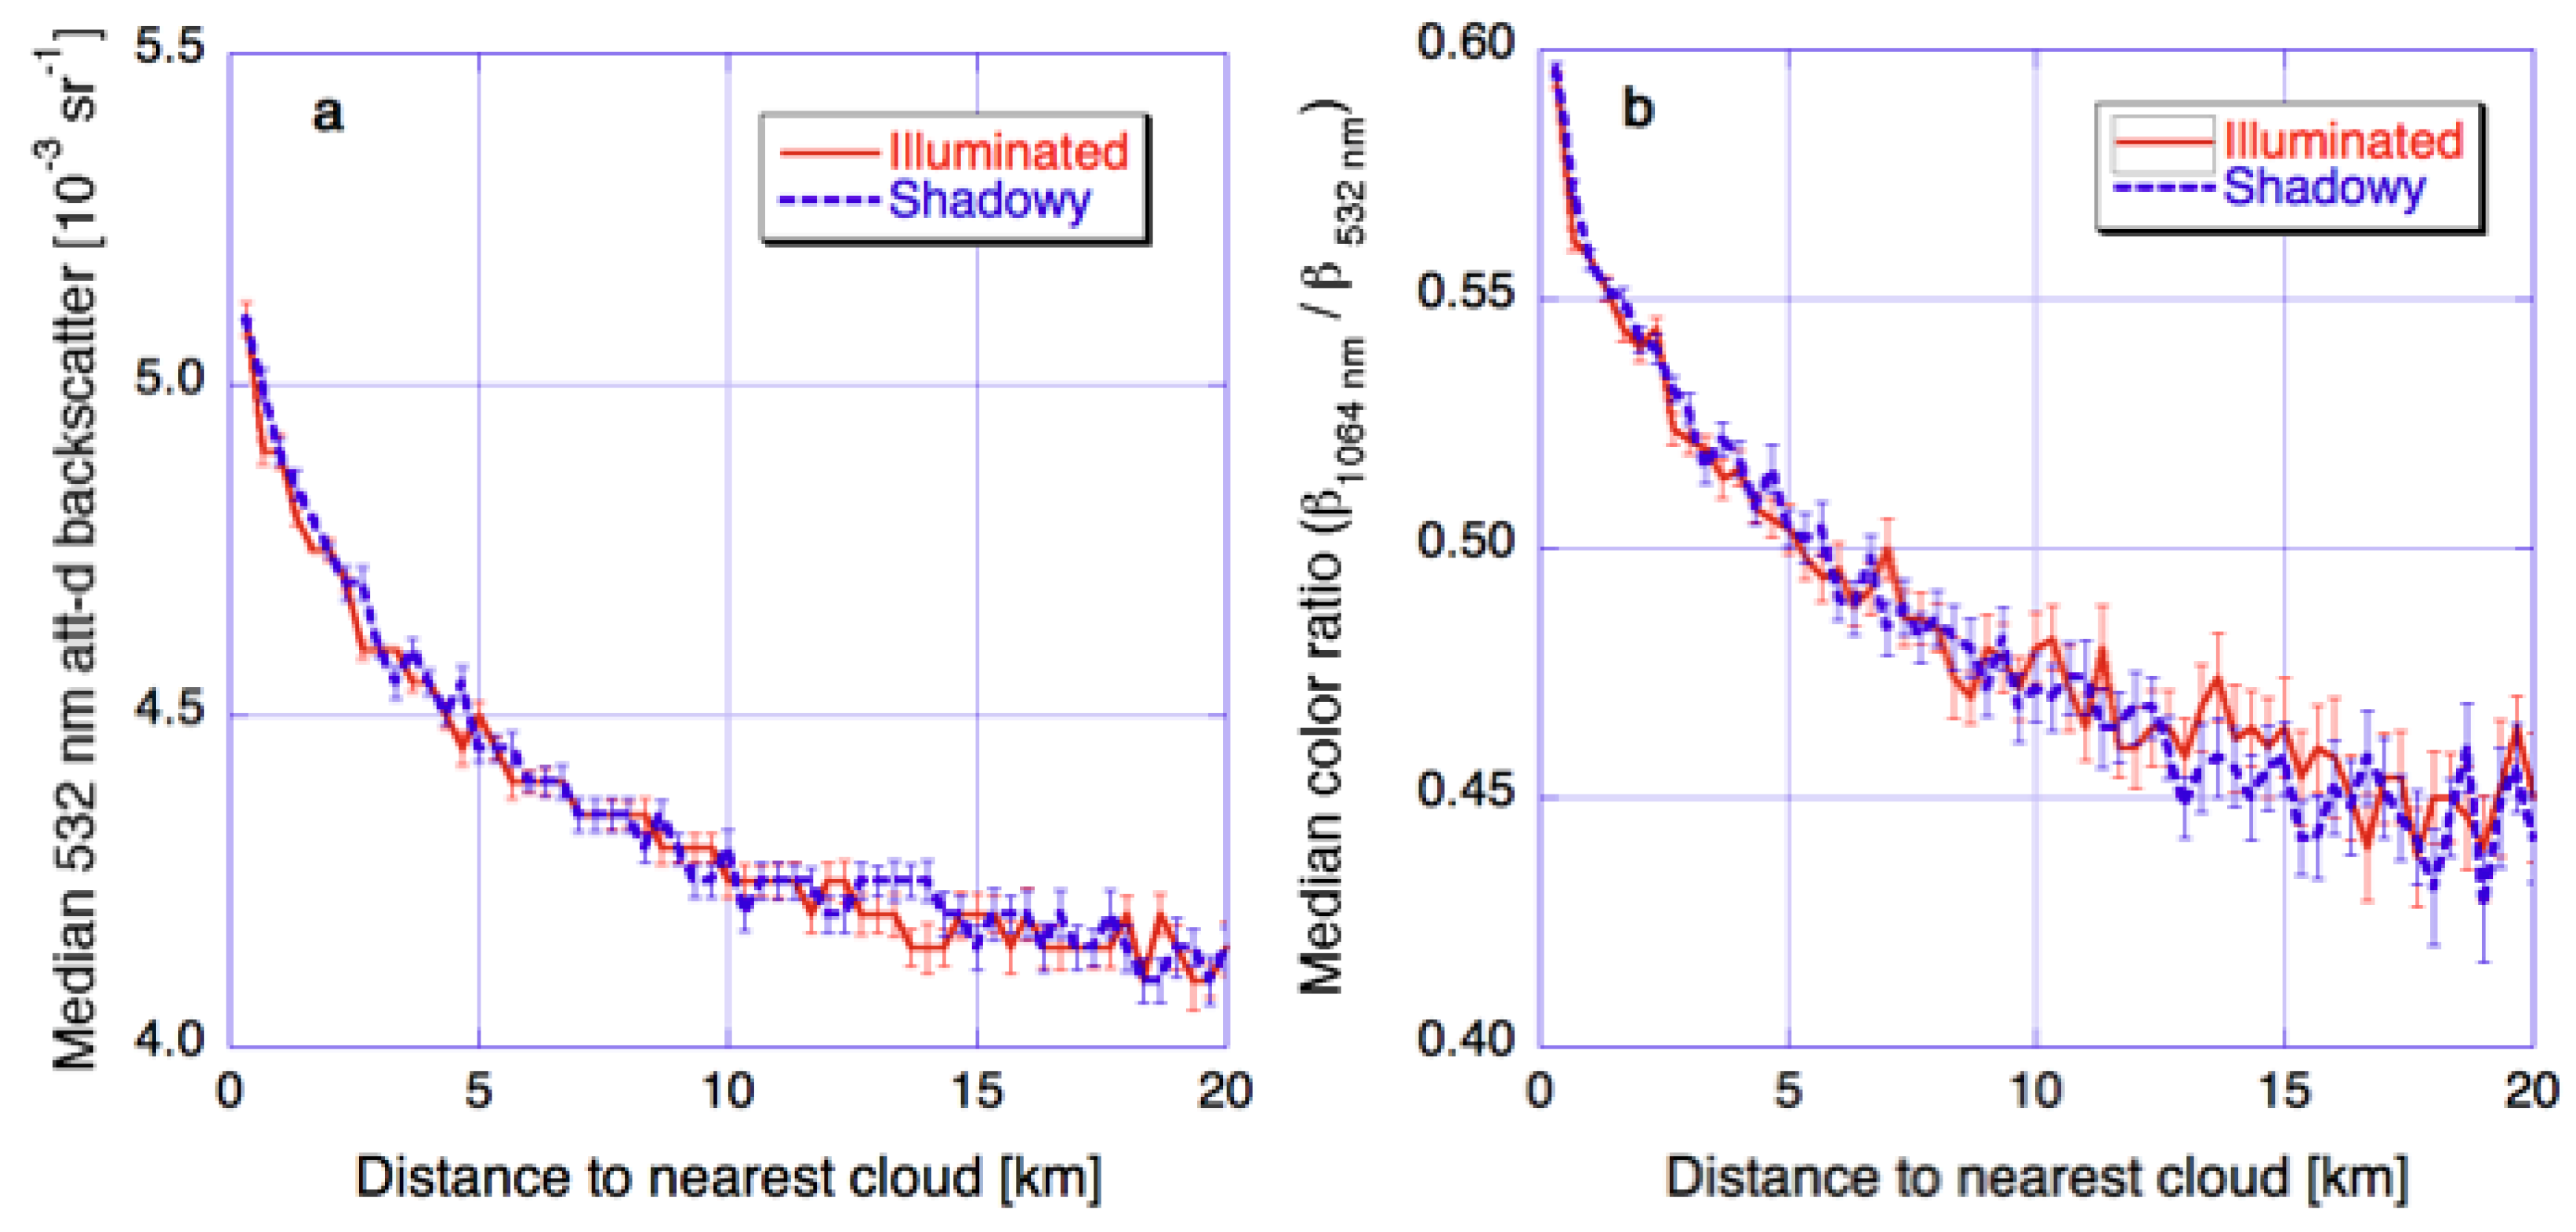
Figure 6 confirms the importance of 3-D radiative processes in creating the solar reflectance enhancements observed near clouds. This figure shows median CALIOP lidar backscatter and color ratio values for clear columns that are on the sunlit or shadowy sides of the nearest clouds. Using lidar data helps, because lidar observations are not affected by 3-D radiative enhancements or shadowing. The figure indicates that actual particle populations are similar near the sunlit and shadowy sides of clouds, which implies that the asymmetries in
Figure 5 are indeed caused by 3-D radiative effects. Therefore, the combination of
Figure 5 and
Figure 6 reveals that 3-D radiative processes play an important role in creating the observed near-cloud enhancements in solar reflectances.
In order to help estimate the contribution of 3-D radiative effects to the observed near-cloud enhancements in solar reflectance,
Figure 7 compares relative enhancements in particle scattering for collocated CALIOP and MODIS observations. The key step needed for this comparison is the calculation of MODIS
Rp and CALIOP β
p, the contributions of (aerosol and undetected cloud) particle scattering to the MODIS 555 nm reflectance and to the CALIOP 532 nm backscatter vertically integrated below 3 km altitude, respectively.
Rp is obtained by removing from the
R555 observed reflectance values the contributions of surface reflection and Rayleigh scattering. The combined surface and Rayleigh contributions are estimated as the reflectances expected for completely aerosol- and cloud-free columns by the MODIS Dark Target aerosol retrieval algorithm [
46]. In turn, β
p is obtained by removing from the β
532 lidar attenuated backscatter values the effects of Rayleigh scattering and ozone absorption. This removal uses the air and ozone molecular density profiles provided in the Level 1 CALIOP product files.
The fact that
Figure 7 shows good agreement between CALIOP and MODIS curves far from clouds suggests that 3-D radiative processes and instrument blurring are insignificant farther than about 10 km from clouds. Within 5 km from clouds, however, MODIS enhancements significantly exceed CALIOP enhancements: the relative difference between the two enhancements near clouds is about 30% of MODIS enhancements. This implies that changes in aerosols and undetected cloud particles explain roughly two thirds (70%) of MODIS reflectance enhancements near clouds, with the remaining third likely coming from 3-D and instrumental effects. We note that simulations based on a MODIS instrument point spread function [
36] indicated that instrument blurring plays a fairly modest role farther than 1 km away from clouds [
47]; this implies that 3-D effects contribute roughly 30% of the observed enhancements.
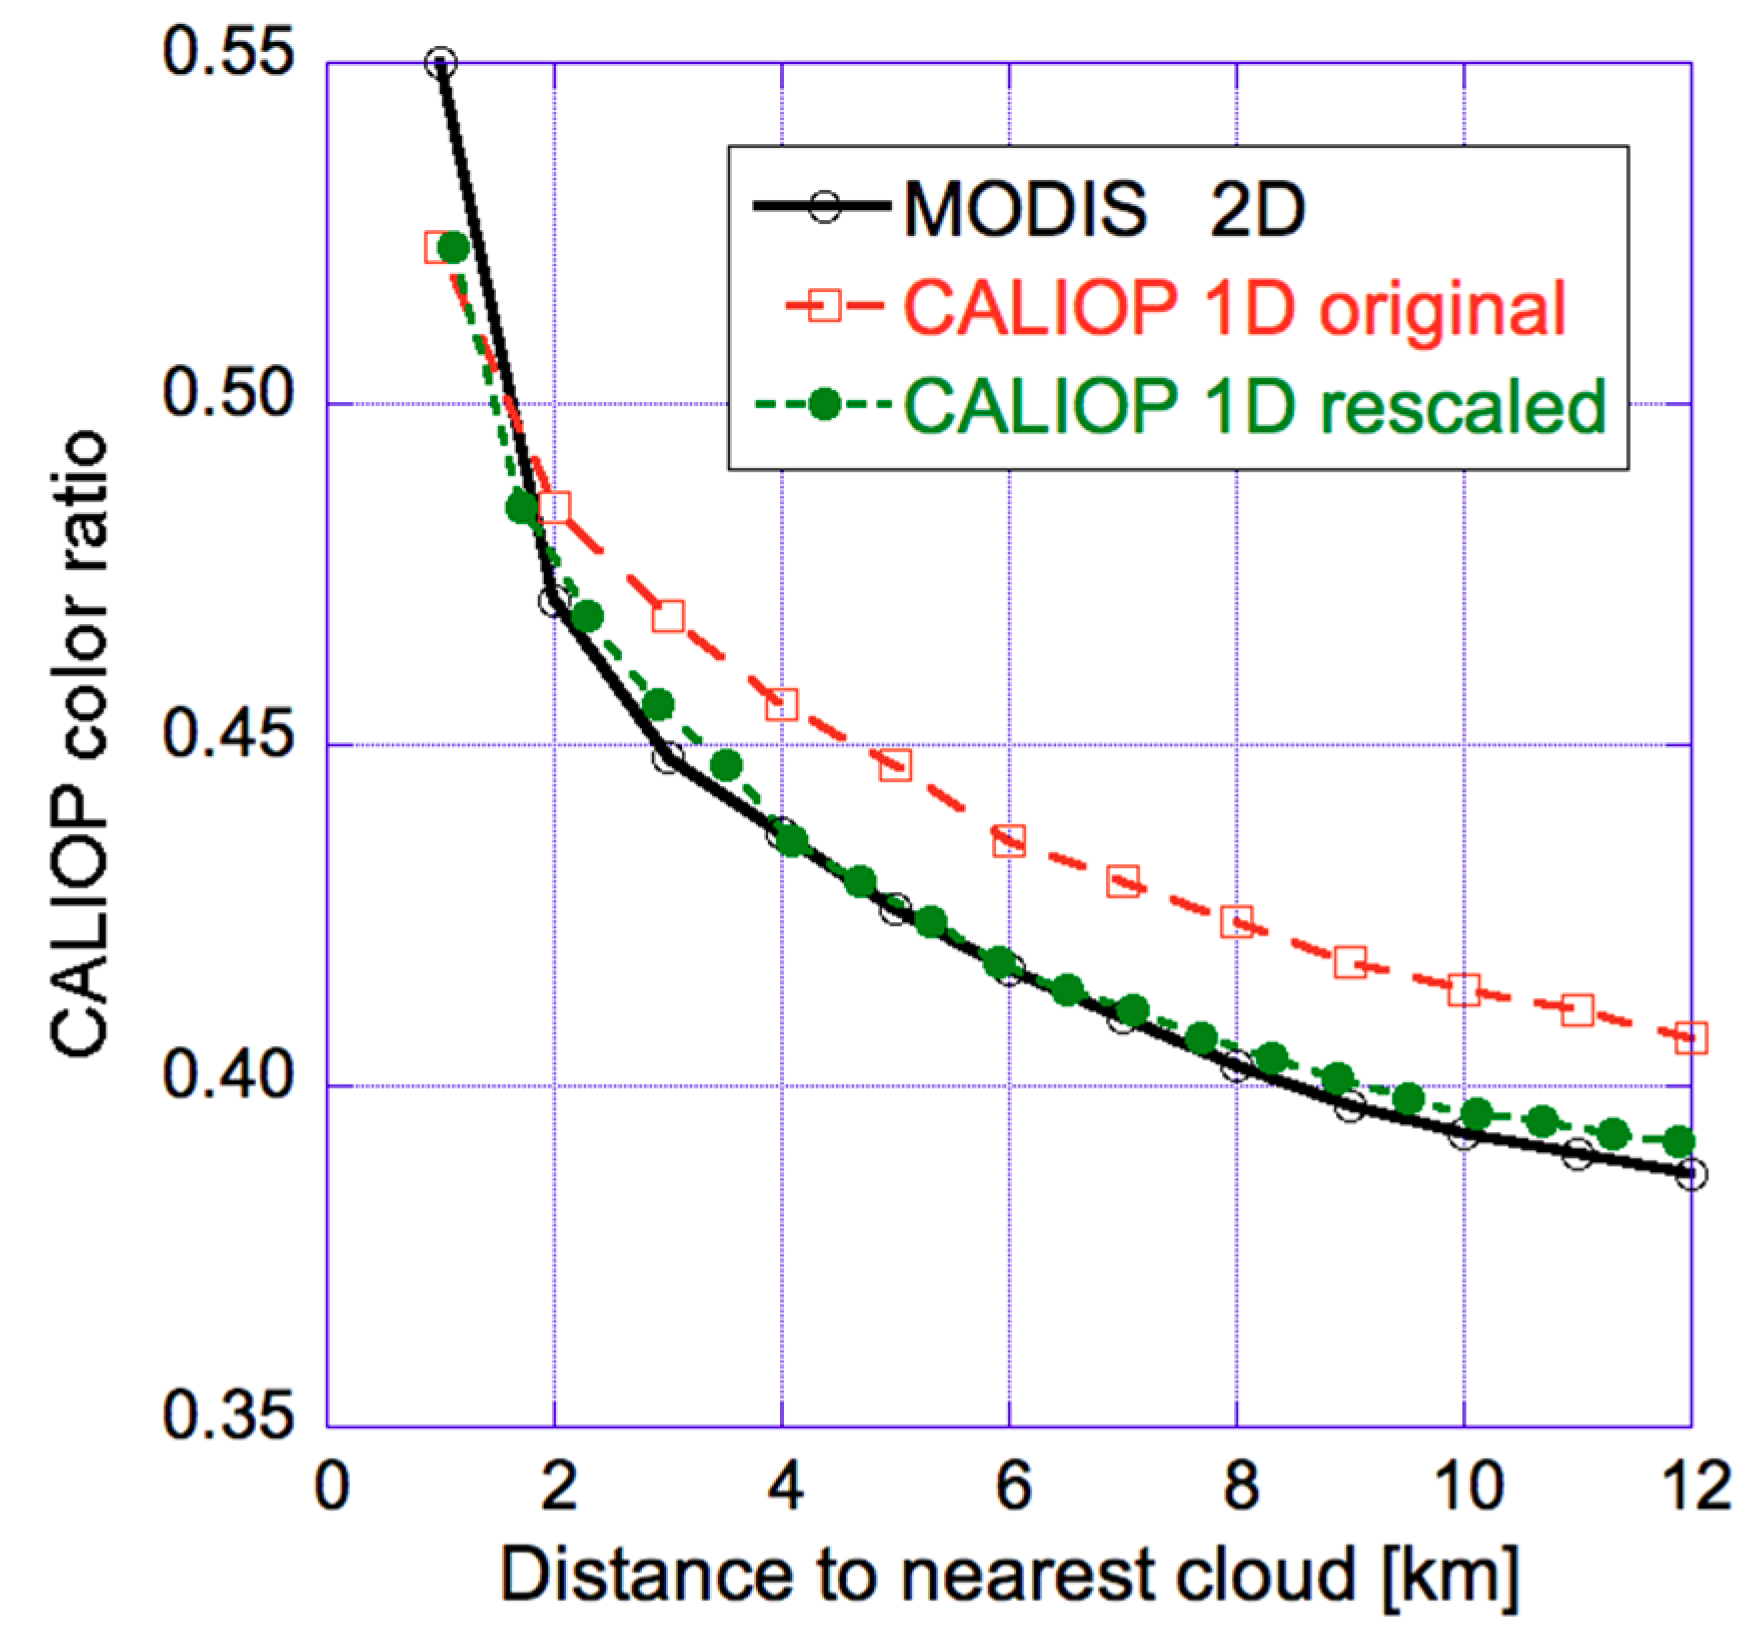
One should note that the collocated MODIS and CALIOP observations could be compared in
Figure 7 because MODIS could reveal distance to clouds even for the CALIOP observations. When CALIOP data is used by itself, however, the distance to clouds is known only along the single line of the lidar track, and this can make one overestimate the distance to clouds if the nearest cloud is off to the side from the lidar track (and remains unnoticed by CALIOP). For statistically isotropic clouds however, this bias can be eliminated by rescaling the CALIOP-estimated distance-to-cloud values [
48].
Figure 8 illustrates that after a such rescaling, the systematic near-cloud increase in CALIOP color ratio is nearly identical regardless of whether or not MODIS information on off-track clouds is used.
3. Dependence of Aerosol Properties on Regional Cloud Fraction
Complementing the studies that examined how aerosol properties change with distance to clouds, other studies examined how aerosol properties change with regional cloud amount [
2,
3,
4,
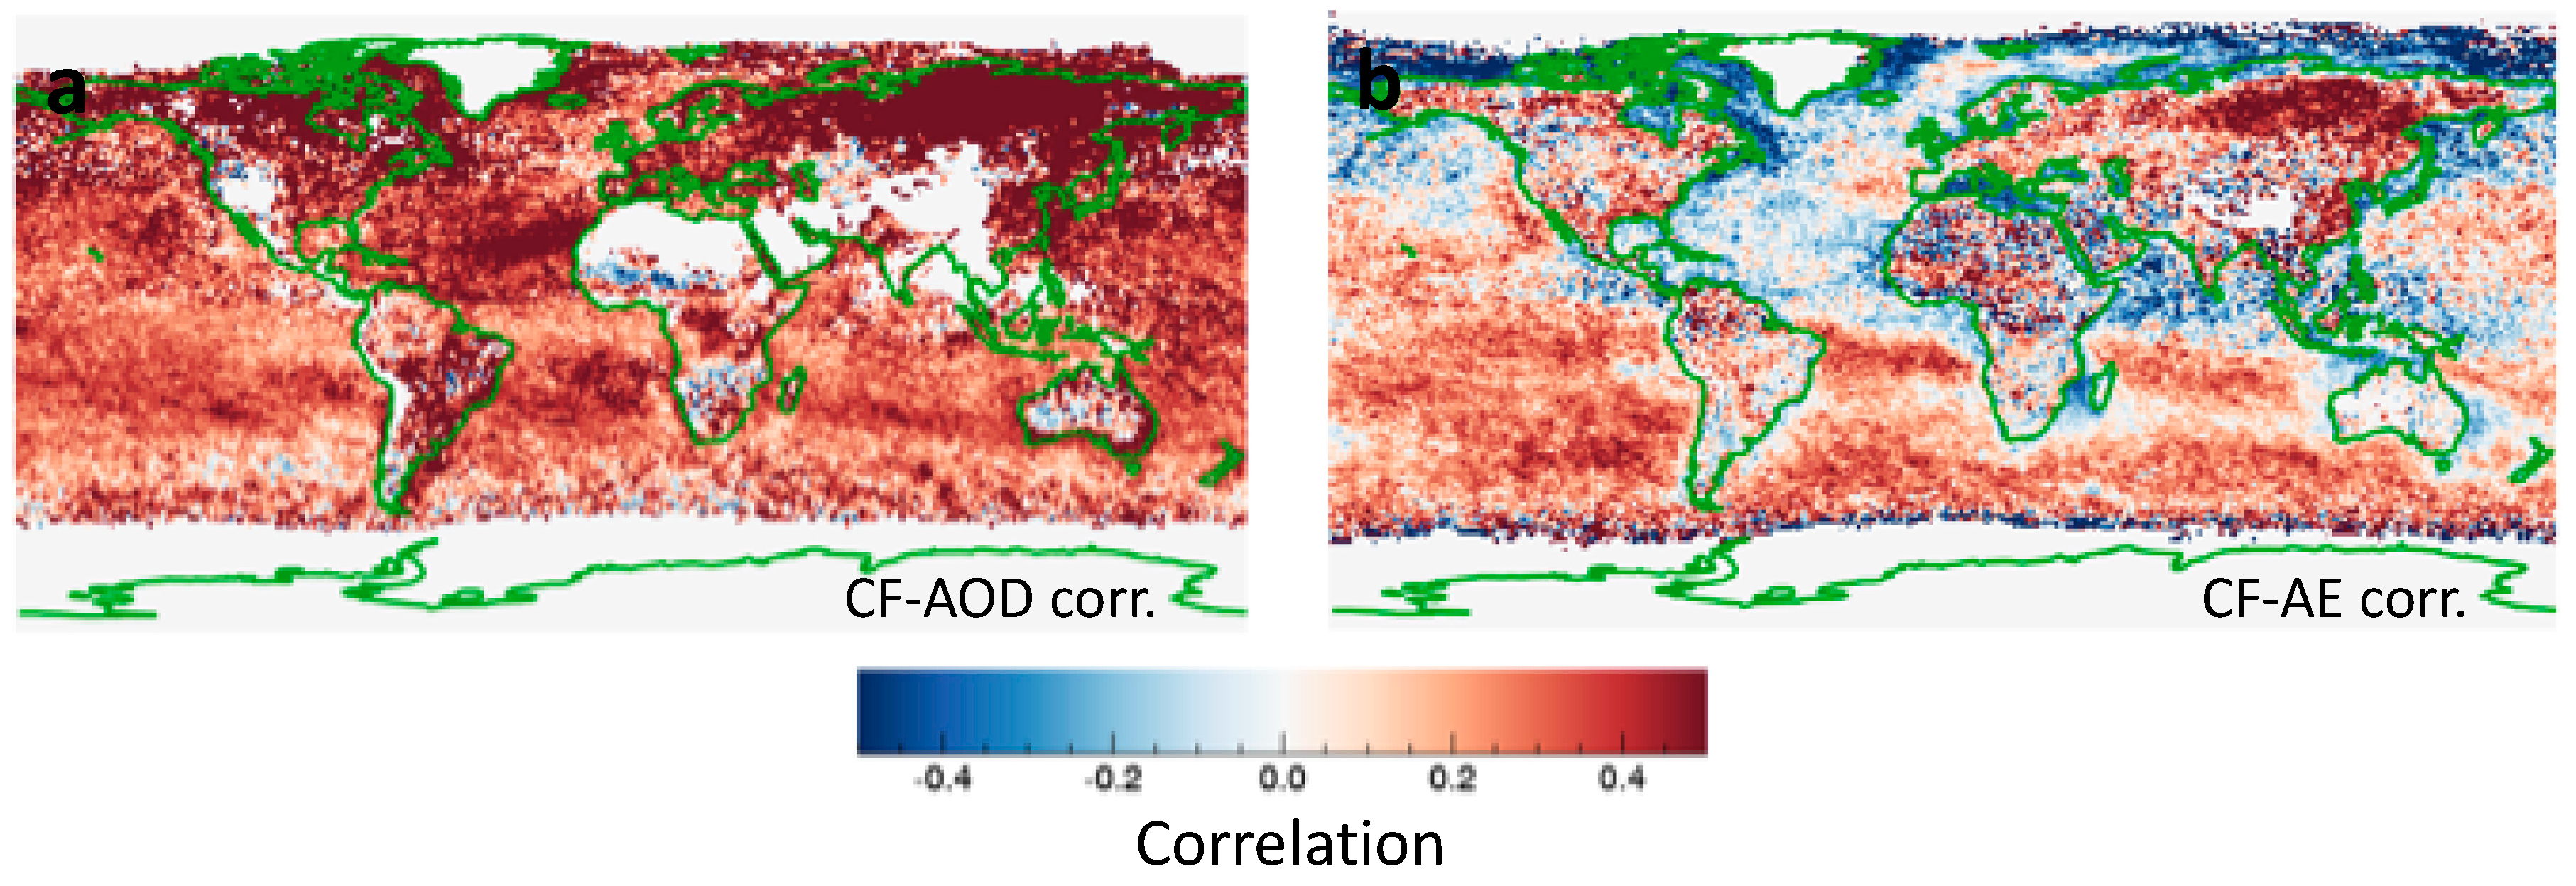
17]. Illustrating the impact of cloud amount,
Figure 9a shows that MODIS observations indicate a positive correlation between cloud fraction (CF) and AOD throughout the globe: the AOD tends to be higher in cloudier days almost everywhere. We note that studies found positive CF-AOD correlations not only at most locations, but also in all seasons, and in regions dominated by any key aerosol type considered: sea salt, dust, sulfates, or carbonaceous. Several factors contribute to this steady CF-AOD relationship, from cloud lifetime effect to cloud processing, with aerosol swelling in the humid air around clouds playing a key role [
26]. Moreover, the CF-AOD relationship being stronger in satellite datasets than in global models point toward remote sensing artifacts (especially cloud detection uncertainties and 3-D radiative processes) also playing an important role in the strong positive correlations.
In contrast,
Figure 9b shows that the CF-AE correlation can have either positive or negative sign in different regions. A negative correlation is consistent with aerosols swelling in cloudier (hence more humid) days, as decreasing AE values imply an increasing particle size. Such correlations are consistent with
Figure 3b,
Figure 4b,
Figure 6b and
Figure 8, all of which indicate larger particle in the vicinity of clouds. However,
Figure 9b also features large regions with positive CF-AE correlations, indicating that in large parts of the planet, higher cloud fraction is associated with smaller aerosol particles.
To seek a better understanding of cloud-related changes in aerosol particle size,
Figure 10 shows the relationship of AE to both CF and D for the region and time period examined in
Figure 2,
Figure 3 and
Figure 5—an area Southwest from the UK where the CF-AE correlation is slightly positive (
Figure 9b).
Figure 10a shows that farther and farther away from clouds, a higher and higher portion of the data comes from areas with low cloud fractions. This raises the question whether CF-AOD correlations in
Figure 8a are positive because (
i) AOD is higher near louds (e.g.,
Figure 3) and (
ii) there are more near-cloud pixels for higher cloud fractions (
Figure 10a). However,
Figure 10b shows that even though CF and D are related (after all, the nearest cloud is likely to be closer if there are more clouds), they capture different components of cloud-related aerosol variability: Retrieved AOD values change even if only one of CF and D changes while the other remains steady. This is because variations in CF involve changes in the large-scale atmospheric environment, whereas approaching clouds (reducing D) occurs within the same large-scale environment and can reveal the impact of the clouds we approach. This implies that characterizing aerosols in partly cloudy regions as a function of cloud fraction (CF) or distance to nearest cloud (D) offer different opportunities and advantages. In practical terms, CF is easier to use in studies involving global simulations (which calculate CF but not D) and can help in studying both cloud effects on aerosols and aerosol effects on clouds [
49], whereas D can be used more readily in characterizing the processes through which clouds impact their surroundings (such as liquid-phase chemical reactions or detrainment of cloud fragments).
Figure 10c illustrates in a single plot that large-scale processes and individual cloud effects have opposite impacts on Angstrom exponent: the mean AE increases with both D and CF. In other words, AE decreases (bigger particles) approaching individual cloud and increases (smaller particles) with more cloudiness. To complement
Figure 10—which shows results for only two CF values—
Figure 11 shows explicitly the CF-dependencies.
Seeking further insights into the CF-AE correlations, let us examine the CF-AOD correlations separately for the coarse-mode and small-mode AOD values provided in the MODIS Dark Target product [
51]. We note that in the Dark Target retrievals over ocean the assumed size of aerosol particles is fixed [
43], and so variations in AE correspond to variations in the relative amount of coarse-mode and small-mode aerosols. A comparison of
Figure 12a,b reveals that almost everywhere, CF is significantly more correlated with AOD for small-mode than for coarse-mode aerosols. This may occur for several reasons, for example if small aerosols are more hygroscopic, if liquid-phase chemical processes in cloud droplets create aerosol particles, or if coarse mode aerosols occur above the boundary layer affected by cloud-related humidity variations. As discussed in [
42], in much of the Earth AOD varying with CF more for small mode than for coarse mode aerosols implies that in those regions cloud contamination is not the dominant reason for the CF-AOD correlations observed in
Figure 9a.
AOD varying with CF more for small mode than for coarse mode aerosols also implies that aerosol swelling can explain not only the negative CF-AE correlations in
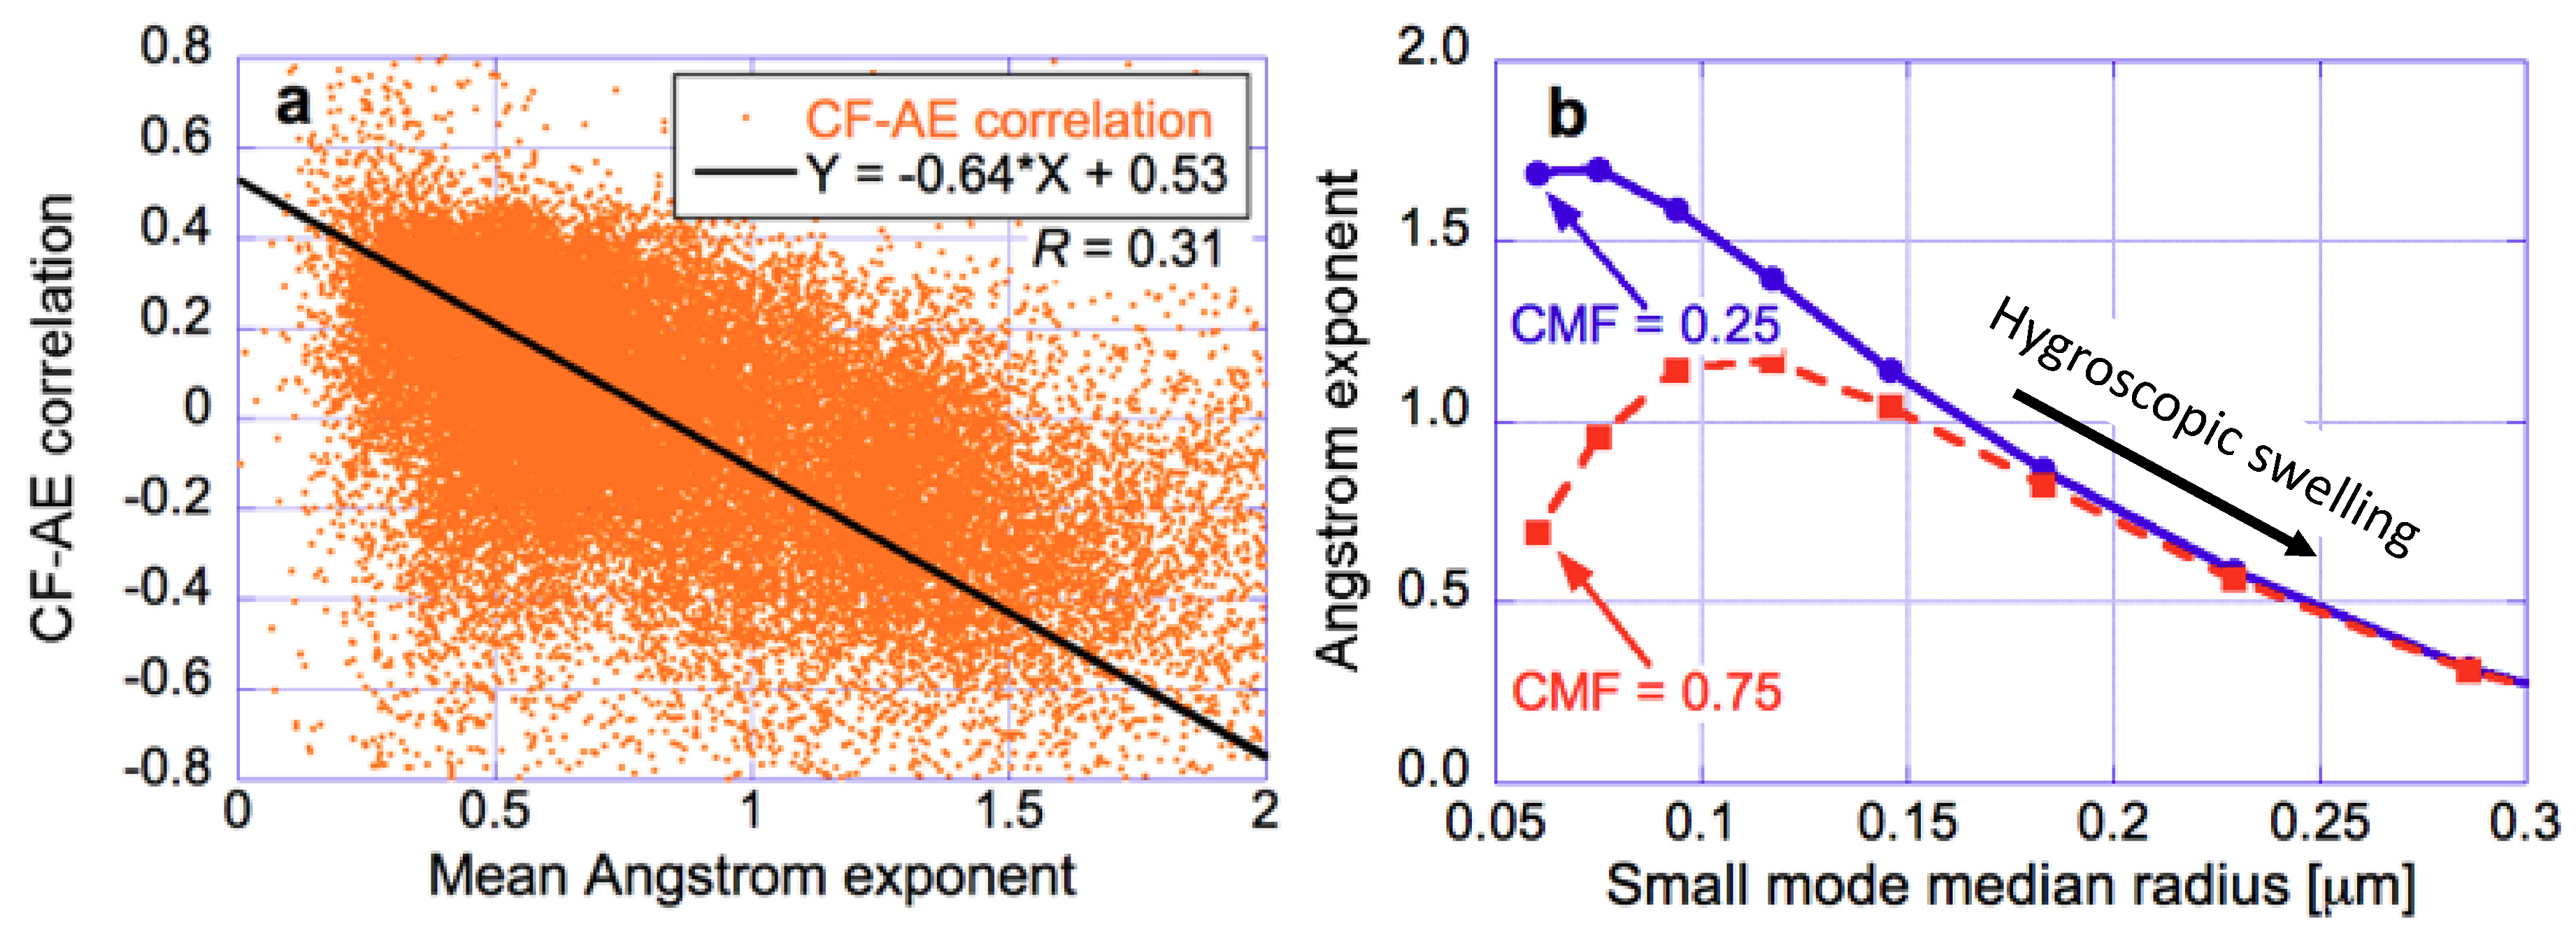
Figure 9b, but also the positive correlations. To illustrate this,
Figure 13 demonstrates that the same cloud-related swelling of small-mode particles can have opposite effects on the overall AE, depending on the abundance of coarse-mode particles. First, Panel
a shows that in MODIS observations, AE tends to increase (decrease) with increasing CF in areas with small (large) mean AE values—that is, in areas of high (low) coarse mode fractions. Panel
b then offers an explanation to this behavior using Mie calculations. It shows that if swelling increases the median radius of fine-mode particles from 0.07 to 0.12 μm, the overall (550–869 nm) AE of a bimodal particle population will decrease along the solid blue line in cases of large AE (low coarse-mode fraction; CMF = 0.25) but will increase along the dashed red line in cases of small AE (high coarse-mode fraction; CMF = 0.75). We note that the AE of the bimodal population increases along the red line even though the AE of small mode particles actually decreases: The overall AE of bimodal aerosol populations will increase with increasing CF if swelling caused by cloud-related humidity-surges enhance the radiative impact of small particles relative to the impact of coarse-mode particles, and this shifts the effective particle size of bimodal distributions toward smaller sizes [
42]. This complex behavior illustrates that the sign of AE changes by itself cannot reveal the direction of particle size changes, and so the effect of clouds on aerosol particle size cannot always be adequately described by changes in Angstrom exponent alone.
4. Conclusions
This paper provided a brief overview of our group’s efforts over the past decade to characterize and better understand cloud-related changes in aerosol properties. These efforts involved primarily the statistical analysis of global or regional datasets of MODIS and CALIOP aerosol and cloud observations.
The analysis found that a substantial part—in oceanic regions, over half—of aerosol measurements by passive satellite instruments come from near-cloud areas, where aerosols are impacted by clouds or cloud-related processes. The data showed that aerosol optical depth and particle size both increase systematically and significantly as we approach clouds. The increases occur below cloud top altitude, where clouds and cloud-related processes can affect them. Aerosol optical depth was found to also increase with the amount of nearby clouds almost everywhere on Earth, regardless of season or if any (and which) aerosol type dominates. However, the spectral dependence of aerosol scattering indicated that the effective particle size can either increase or decrease with cloudiness. Combining the data analysis with microphysical modeling revealed that particles likely always grow larger with increasing cloud fraction, but the effective size of bimodal aerosol size distributions can still decrease if small mode particles grow more than coarse mode particles. Overall, the findings imply that the most detailed information can be obtained if aerosol changes are not characterized only through distance to nearest cloud or cloud fraction, and not only through a single Angstrom exponent, but through a combination of these—and possibly other—parameters. For example, [
42] suggested using Angstrom exponents over two different wavelength ranges that are more sensitive to small mode fraction and the size of small mode particles, respectively.
Seeking insights into the causes of cloud-related changes in measured aerosol properties, the analysis indicated that in many regions of the Earth, cloud contamination (the presence of undetected cloud droplets) is not the dominant cause of observed cloud fraction-aerosol optical depth correlations. We also found that 3D radiative processes are significant and cause roughly 30% of the observed near-cloud AOD increase.
Taken together, the remote sensing uncertainties and systematic aerosol changes near clouds create a dilemma: Excluding observations data from the transition zone in order to avoid remote sensing uncertainties [
21] can create a bias toward low aerosol optical depths and weak radiative effects [
10,
23], but including data from the transition zone despite the remote sensing uncertainties can create a bias toward high aerosol optical depths and strong radiative effects. To resolve this dilemma, we need to improve our ability to measure aerosols near clouds. We need to improve the treatment of ambiguities in cloudy-clear separation [
52], and we need to account for 3D radiative processes in aerosol retrievals [
35,
53,
54,
55].
Recognizing the need for improved aerosol measurements in partly cloudy regions, researchers have explored new types of observations and data interpretation methods. For example, multiangle observations offer new opportunities in cloud detection and in characterizing the size and type of near-cloud aerosols. Recently, a new set of aerosol products [
56] from the Multiangle Imaging SpectroRadiometer (MISR) has become available at a higher, 4.4 km spatial resolution that allows examining many near-cloud aerosol changes—and the MISR team is actively pursuing the new opportunities. Planned future satellites such as the Multi-Angle Imager for Aerosols (MAIA) or the Plankton, Aerosol, Cloud, ocean Ecosystem (PACE) missions will offer even more detailed multiangle observations, along with polarization data. Polarization can reveal, for example, particle shape changes if non-spherical aerosols swell in the humid air and become more spherical as we approach clouds [
45]. Additionally, observations with very high spatial resolutions (e.g., tens of meters) can also offer new opportunities. For example, they can identify small cloud fragments and thus reduce the impact of cloud detection uncertainties both on aerosol statistics and on aerosol forcing estimates [
29].
In addition to new observations, new data interpretation methods also offer promising opportunities. For example, the Multi-Angle Implementation of Atmospheric Correction (MAIAC) algorithm [
57] may reduce cloud detection uncertainties affecting near-cloud aerosol data [
58] by taking advantage of time series of co-located observations. Also, as mentioned above, a new algorithm now under development may help reduce aerosol retrieval uncertainties caused by 3D radiative effects [
35,
54,
55].
Another possibility for future advancement is to combine different types of satellite data. For example, new high-resolution humidity data in the MAIAC product [
59] may help determine the role of near-cloud aerosol swelling, and time series of geostationary satellite data may help identify the lasting impact of dissipated clouds on aerosols. Further studies combining passive and active (lidar) measurements may also help, for example by indicating what fraction of aerosols in a column are at altitudes where they can be affected by cloud processes. Even coarse-resolution reanalysis datasets such as MERRA-2 [
60] can help, for example by providing information on aerosol precursor gas concentrations or aerosol age; two factors that can affect in-cloud aerosol formation or hygroscopic swelling, respectively [
30,
61]. Finally, advances may also come from additional case studies and global or regional statistical analyses, possibly enhanced by approaches such as principal component analysis, conditional probabilities [
49], learning algorithms, or statistical comparisons of observations and radiative transfer simulations [
47].
In turn, the advances in scene characterization can help improve the representation of near-cloud aerosols in regional and global models, for example by helping improve the way climate models estimate cloudiness-related subgrid scale humidity variations and their impacts on aerosol radiative effects [
62]. Ultimately, the modeling, laboratory, satellite, ground-based and airborne remote sensing and in situ studies can mutually benefit each other, enhancing future advances in understanding and simulating aerosols and their radiative effects in partly cloudy regions.
