1. Introduction
It is becoming increasingly clear that understanding wave driving from below is critical for predicting large and small scale structures in the ionosphere and thermosphere (IT) system, such as ionospheric scintillations important to communication and navigation, and testing and improving models for orbit propagation and collision warnings. However, the relevant coupling processes operating within the neutral atmosphere, and between the neutral atmosphere and ionosphere, involve a host of multi-scale dynamics that are not fully understood at present [
1]. Atmospheric tide is one of the key players for inducing the multi-scale dynamics in the IT system. Owing to rotation of the planet, periodic absorption of solar radiation in local time (LT) and longitude (e.g., by troposphere H
2O and stratosphere O
3) excites a spectrum of thermal tides having periods and zonal (east-west) wavenumbers (or harmonics) defined by the planetary rotation period and longitudinal variability, respectively. Solar heating can be approximated by a rectified cosine profile so that Fourier transformation can be used to decompose the tidal components into periods of sub-harmonics of a solar day: Diurnal (24 h), semidiurnal (12 h), and terdiurnal (8 h) etc. Tides can be allotted into two distinct categories, migrating and nonmigrating tides. Migrating (sun-synchronous) tides propagate westward with the apparent motion of the Sun. Nonmigrating tides do not follow the apparent motion of the Sun and can propagate westward, eastward, or be stationary. Different tidal components are identified as follows: “DWs” or “Des” denotes a westward or eastward propagating diurnal tide, respectively, with zonal wave number, s. The standing oscillation of a 24 h period is denoted as DS0. Of these tidal components, DW1 is the migrating tide and the rest are nonmigrating tides. In this paper, we focus on the nonmigrating diurnal tide—DW2.
Tidal variability has been observed to occur on time scales ranging from days [
2] to years [
3], and may arise due to a variety of factors. The possible causes have not been clearly sorted out, but are generally thought to fall into three categories: (1) variability of tropospheric and/or stratospheric tidal sources [
3]; (2) propagation modulation due to altered background mean wind [
4]; and (3) nonlinear interaction with planetary waves [
5] and possibly gravity waves [
6].
Short-term variability (periods < 30 days) of atmospheric tides have regularly been observed to fluctuate in amplitude at periodicities similar to those of planetary waves (from quasi-two-day to quasi-stationary) presenting at the same time, indicative of a nonlinear interaction between the migrating tide and the planetary waves [
7,
8]. Teitelbaum and Vial (1991) [
5] proposed that nonlinear coupling between the migrating tides and stationary planetary waves can also generate nonmigrating tides, which are the child waves that have frequencies and wavenumbers equal to the sum and difference of those of the parent waves. Observed correlations between the migrating tides and planetary wave activity provide evidence for this mechanism [
7,
8,
9,
10]; modeling studies have also shown that this interaction can produce nonmigrating tides with large amplitudes [
11,
12,
13,
14].
Despite the above studies, it was also noted that the global distribution of the nonmigrating tides in the lower thermosphere showed a strong sensitivity to the background zonal mean zonal wind profile [
15], and the planetary-wave-induced background atmosphere changes can drive tidal variability at levels greater than tidal/planetary wave interaction [
16]. Xu et al. (2009) [
17] questioned the time scales of the strong correlations between the planetary wave and the nonmigrating tides seen within the observations. Their results showed that the strong correlation in their multi-site radar observations is contributed to largely by the low frequency fluctuations (>15 days). Du et al. (2014) [
18] examined the global-scale correlations of the amplitudes of the migrating tides, DW1/SW2, and the stationary planetary wave 1 (SPW1) and the assumed “child” nonmigrating tides. The results indicate that the correlations are highly time scale-dependent and the significant correlations seen with the original time series are mainly due to longer-term variations (>18 days). There are no consistent global correlations associated with the short-term variations (<18 days) among these waves.
Major sudden stratospheric warmings (SSWs) involve anomalous planetary wave propagation and dissipation in the polar stratosphere, which typically increase the temperature of the stratosphere by as much as 40–50 K in just a few days [
19]. While the relationship between the planetary wave activity and the SSWs is well studied, the one for the tidal activity, unfortunately, is still poorly understood. Although quasi-stationary planetary waves are generally trapped below mesopause, and through the interaction with the tides, the impact of the SSWs can be felt well into the IT region, and even tropical ionosphere [
20,
21,
22,
23,
24,
25,
26,
27]. Pedatella and Forbes (2010) [
23] suggest that planetary wave-tide interactions are the primary mechanism coupling SSWs to ionospheric variability.
During an SSW event, the polar vortex generally deforms into one of the two distinctly different ways. The first is when the vortex drifts away from the pole toward lower latitudes. This is known as a “displacement” type event. The other type of events is when the vortex is split into two smaller vortexes and each of these drifts separately away from the pole before dissipating, such events are known as split type events. For example, the 2006 warming is characterized as a “vortex displacement” and the 2009 warming as a “vortex split”. Often a correlation is made between the type of planetary waves that caused the SSW and the type of event: If the waves which cause the event are mostly of wavenumber 1, it is a displacement event, and if they are wavenumber 2, it is a split event [
28].
The anomalous strong planetary wave activity during SSWs provides excellent opportunity to study tidal/planetary wave interaction. For example, the nonmigrating diurnal components (child waves: DS0 and DW2) are generated from the nonlinear interaction between the SPW1 and the migrating diurnal tide DW1 [
12]. Indeed, Leiberman et al. (2015) [
8] presented clear evidence that in the winter of 2009–2010 (a split SSW event), the DW2 temperature amplitude evolution appears to track the SPW1 amplitudes (Figure 8 of their paper).
The main objective of this paper is to examine: (1) Does DW2 and SPW1 amplitudes track each other in every winter, or is the 2009–2010 winter just an exception? (2) Does SSW types govern the relationship between DW2 and SPW1 in any way? For an SSW-displacement event, SPW1 tends to be stronger; does this mean a stronger correlation between DW2 and SPW1? We use a 31.5-year run (1979–2010) from the extended Canadian Middle Atmospheric Model (eCMAM) to answer the above two questions. We first calculate the correlation coefficients between DW2 and SPW1 for all 31 winters then classify the 31-winters into four categories: SSW-D (displacement), SSW-S (split), minor-SSW, no-SSW, and investigate if a stronger interaction is observed between DW2 and SPW1 during SSW-D winters when SPW1 is supposed to be stronger than usual. The paper is arranged as follows.
Section 2 gives an introduction of the model.
Section 3 shows the main results of our findings.
Section 4 presents the discussion and
Section 5 is the conclusions.
2. Data and Model
The eCMAM [
29,
30,
31,
32] has a top at 2 × 10
−7 hPa, which is geopotential height at ~220 km, but is dependent on the solar cycle. The new version of the model is enhanced by the inclusion of neutral and ion chemistry. The model has a triangular spectral truncation of T32, corresponding to a 6° horizontal grid. There are 87 levels in the vertical, and the resolution varying from several tens of meters in the lower troposphere to ~2.5 km in the mesosphere and thermosphere. The model includes the non-local thermal equilibrium (LTE) parameterization for the 15 μm CO
2 band, solar heating due to absorption by O
2 in the Schumann-Runge bands (SRB) and continuum (SRC), and by O
2, N
2, and O in the extreme ultraviolet spectral region, parameterized chemical heating, molecular diffusion and viscosity, and ion drag. The current version of the eCMAM also includes comprehensive stratospheric chemistry [
33] with radiatively interactive O
3 and H
2O, a simplified ion chemistry scheme over a vertically limited domain, and non-LTE treatment of the near-infrared CO
2 heating [
34]. The Hines (1997 a, b) [
35,
36] non-orographic GWD scheme is used in this model. The model includes realistic tidal forcing due to radiative heating, convective processes, and latent heat release [
37]. These processes have been shown to provide the forcing necessary to generate the migrating and nonmigrating tides [
18,
38,
39,
40,
41].
Recently, the horizontal winds and temperature below 1 hPa from this version of the eCMAM are nudged (i.e., relaxed) to the 6 hourly horizontal winds and temperature from the European Centre for Medium-Range Weather Forecasts (ECMWF) Re-Analysis (ERA) Interim reanalysis data [
42] from January 1979 to June 2010 (thus named as eCMAM30). The nudging approach is designated to primarily constrain synoptic space and times scales in the model, which are well represented in the reanalysis data. This is accomplished by performing the relaxation in spectral space and applying it only to horizontal scales with n ≤ T21, where n is the total wavenumber. The nudging tendency has the form −(X − X
R)/τ
0, where τ
0 = 24 h is the relaxational timescale, and X and X
R are, respectively, the model and reanalysis spectral vorticity, divergence, or temperature coefficients [
43]. Linear interpolation is used to compute the reanalysis variables at intermediate times between adjacent 6 h intervals [
44]. No nudging of chemistry fields is included in eCMAM30.
We validated the climatology of the background temperature and the diurnal tides (from DW5 to DE5) from eCMAM30 with SABER observations [
45]. The model is doing a remarkable job in simulating the tides, and their altitudinal-latitudinal structures and seasonal variations are in very good agreement with SABER observations. The nudged version of the model shows better capability in simulating tides than the free-running version of the model. McLandress et al. (2013) [
44] compared CMAM30 results with Aura MLS observations of mesospheric temperature, carbon monoxide (CO), and derived zonal wind during the 2006 and 2009 SSW and found good agreement. The nudged eCMAM has also been shown to represent well the dynamics of the upper mesosphere/lower thermosphere during some of the strongest SSWs in recent years [
46].
3. Results
Since Figure 8 in Lieberman et al. (2015) [
8] motivated this research, we reproduced Figure 8 with the eCMAM data to evaluate again the NOGAPS and SABER used in Lieberman et al. (2015).
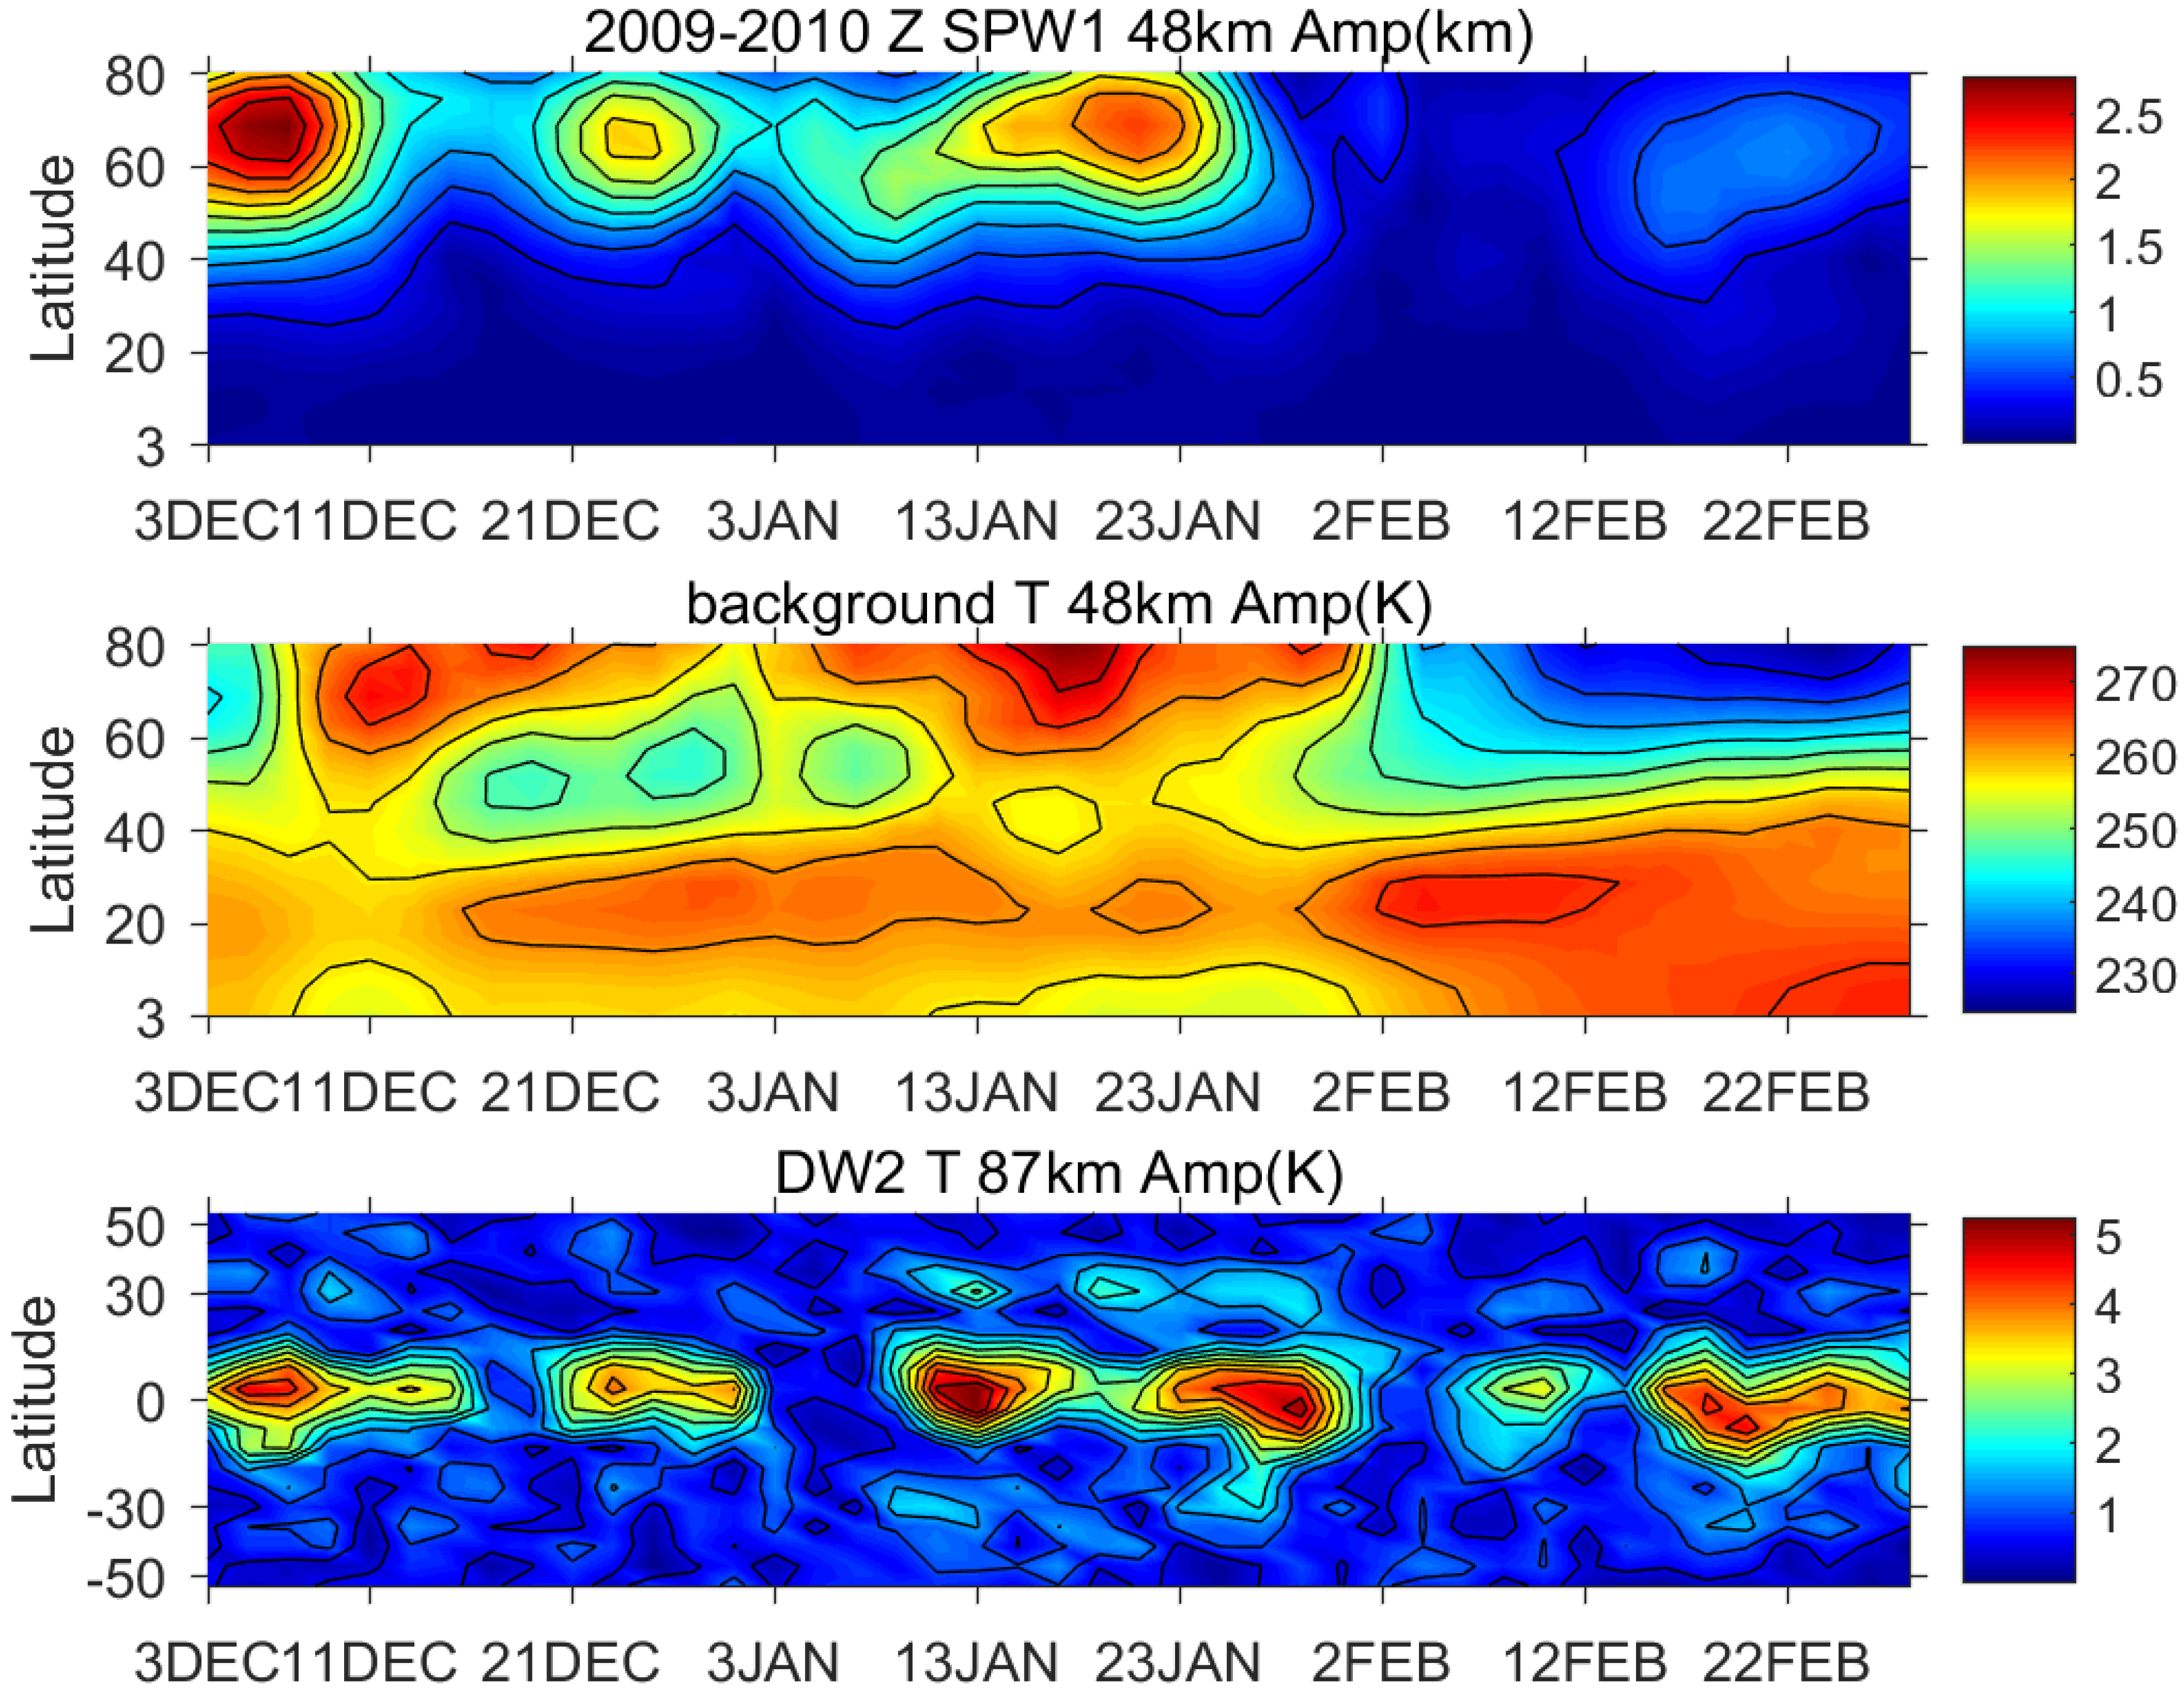
Figure 1 shows the evolution of stratospheric SPW1 geopotential height (Z) amplitude, zonal mean temperature (T), and mesospheric DW2 T amplitude during December 2009 to February 2010 from the eCMAM30 run. Here, the eCMAM simulations for the same event are compared to both the NOGAPS model and SABER. It is obvious that all three fields (SPW1 Z amplitude, background T, DW2 T) compare very well with both NOGAPS and SABER. There are four SPW1 maxima during this period. DW2 T amplitude maximizes at the equator and presents similar maxima and its evolution appears to track the SPW1 Z amplitudes. As Lieberman et al. (2015) [
8] has indicated, during this period, there is indeed a strong correlation between the SPW1 and DW2 amplitudes. SABER DW2 amplitudes shown in Figure 8 (fourth panel) of Lieberman et al. (2015) [
8] are in good agreement with eCMAM as well. These results show that eCMAM produces realistic simulations and provides high quality data for the following analysis. We have also compared eCMAM DW2 T amplitudes and SABER observations in several other winters, and the agreement is as good as that in 2009–2010 (figures not shown).
Our question is that if the relationship observed between DW2 in the equatorial mesopause region and the SPW1 in the polar stratosphere in the 2009–2010 winter happens every year, or is it just a special case. Since the 2009–2010 winter has a strong split SSW event (stronger SPW2), does this mean we should see a stronger relationship between SPW1 and DW2 during winters with a displacement SSW event (stronger SPW1)? We answer this question by performing correlation analysis between the two waves for all winters from 1979 to 2010, and further separate each winter into no SSW event, minor SSW, displacement SSW, and split SSW events. We calculate correlations at zero lag between SPW1 and DW2. The SPW1 and DW2 amplitudes are calculated with a four-day average window and shifting by one-day. The time of the average window is longer than the time of propagation from stratosphere to mesopause (one to two days) for DW2, thus, lagged correlation is unnecessary.
The amplitude evolution of the SPW1 and DW2 can change with altitude adjacent to the 48 and 87 km as shown in
Figure 1.
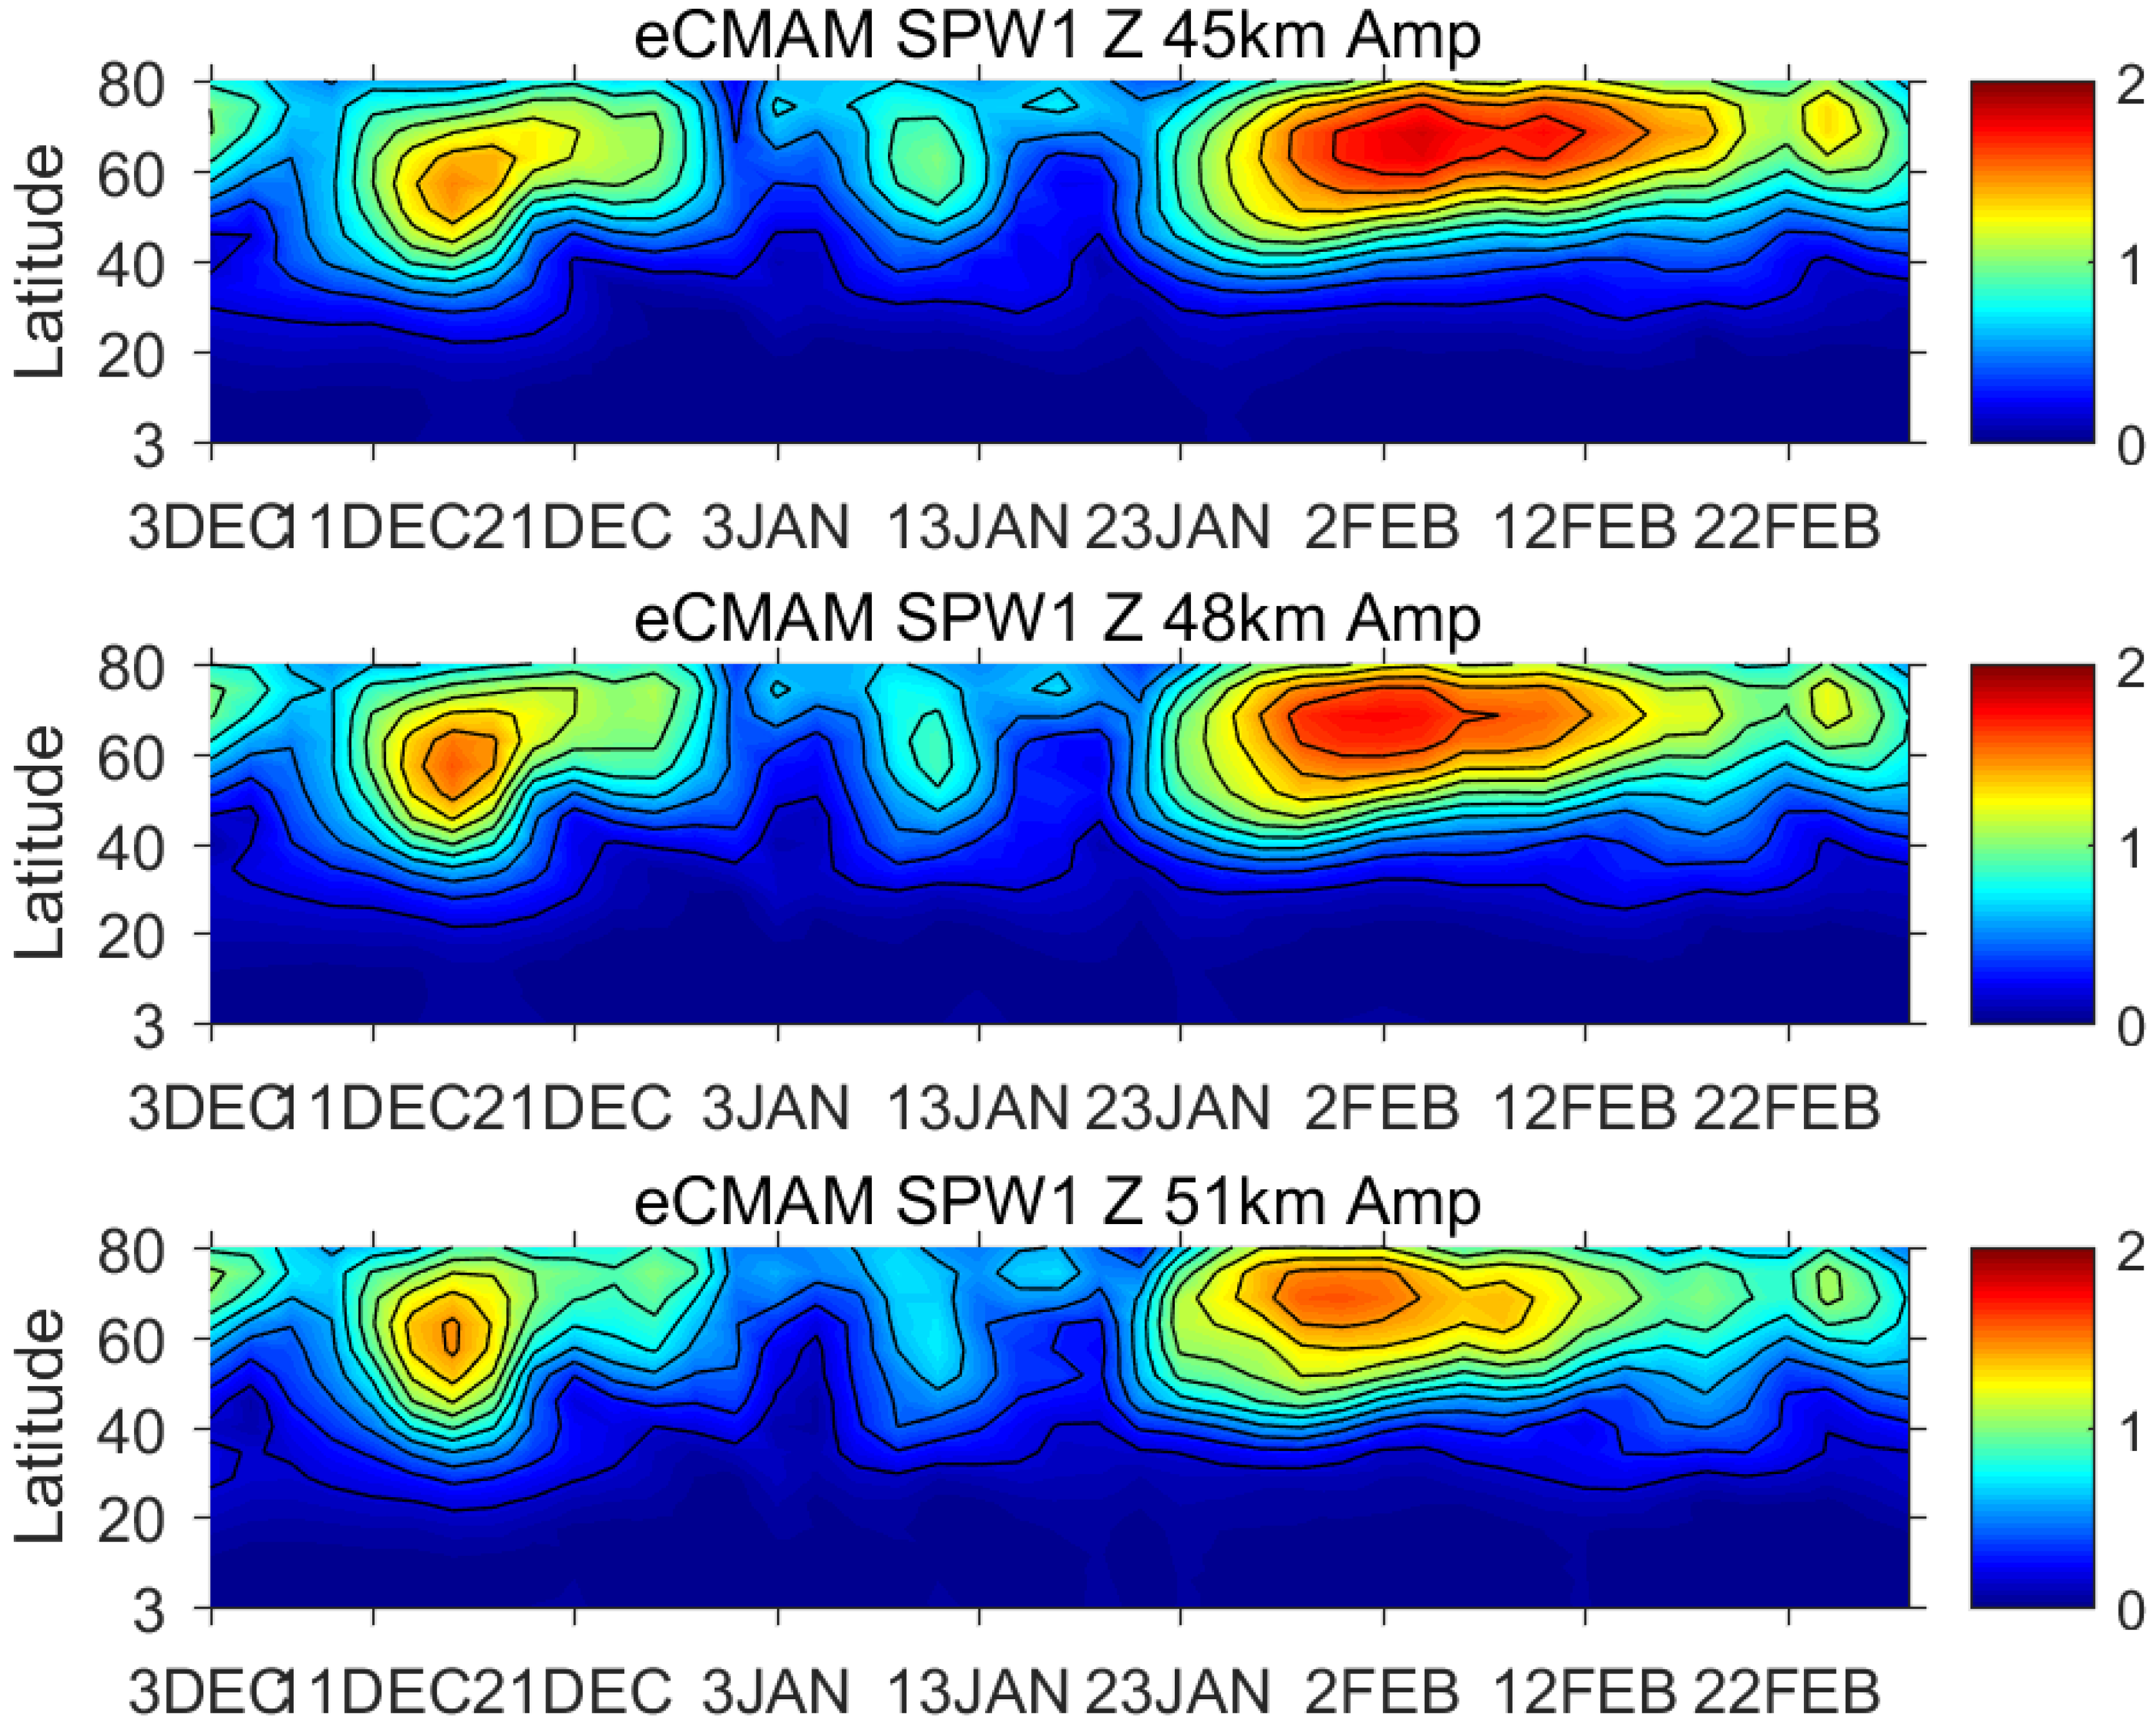
Figure 2 gives an example of the SPW1 Z amplitude for the winter of 2009–2010 at 45, 48, and 51 km. The overall latitudinal structure and time evolution are very similar at all three heights, but there are slight differences of the relative amplitude, which will affect the correlation coefficient depending on the height and latitude chosen.
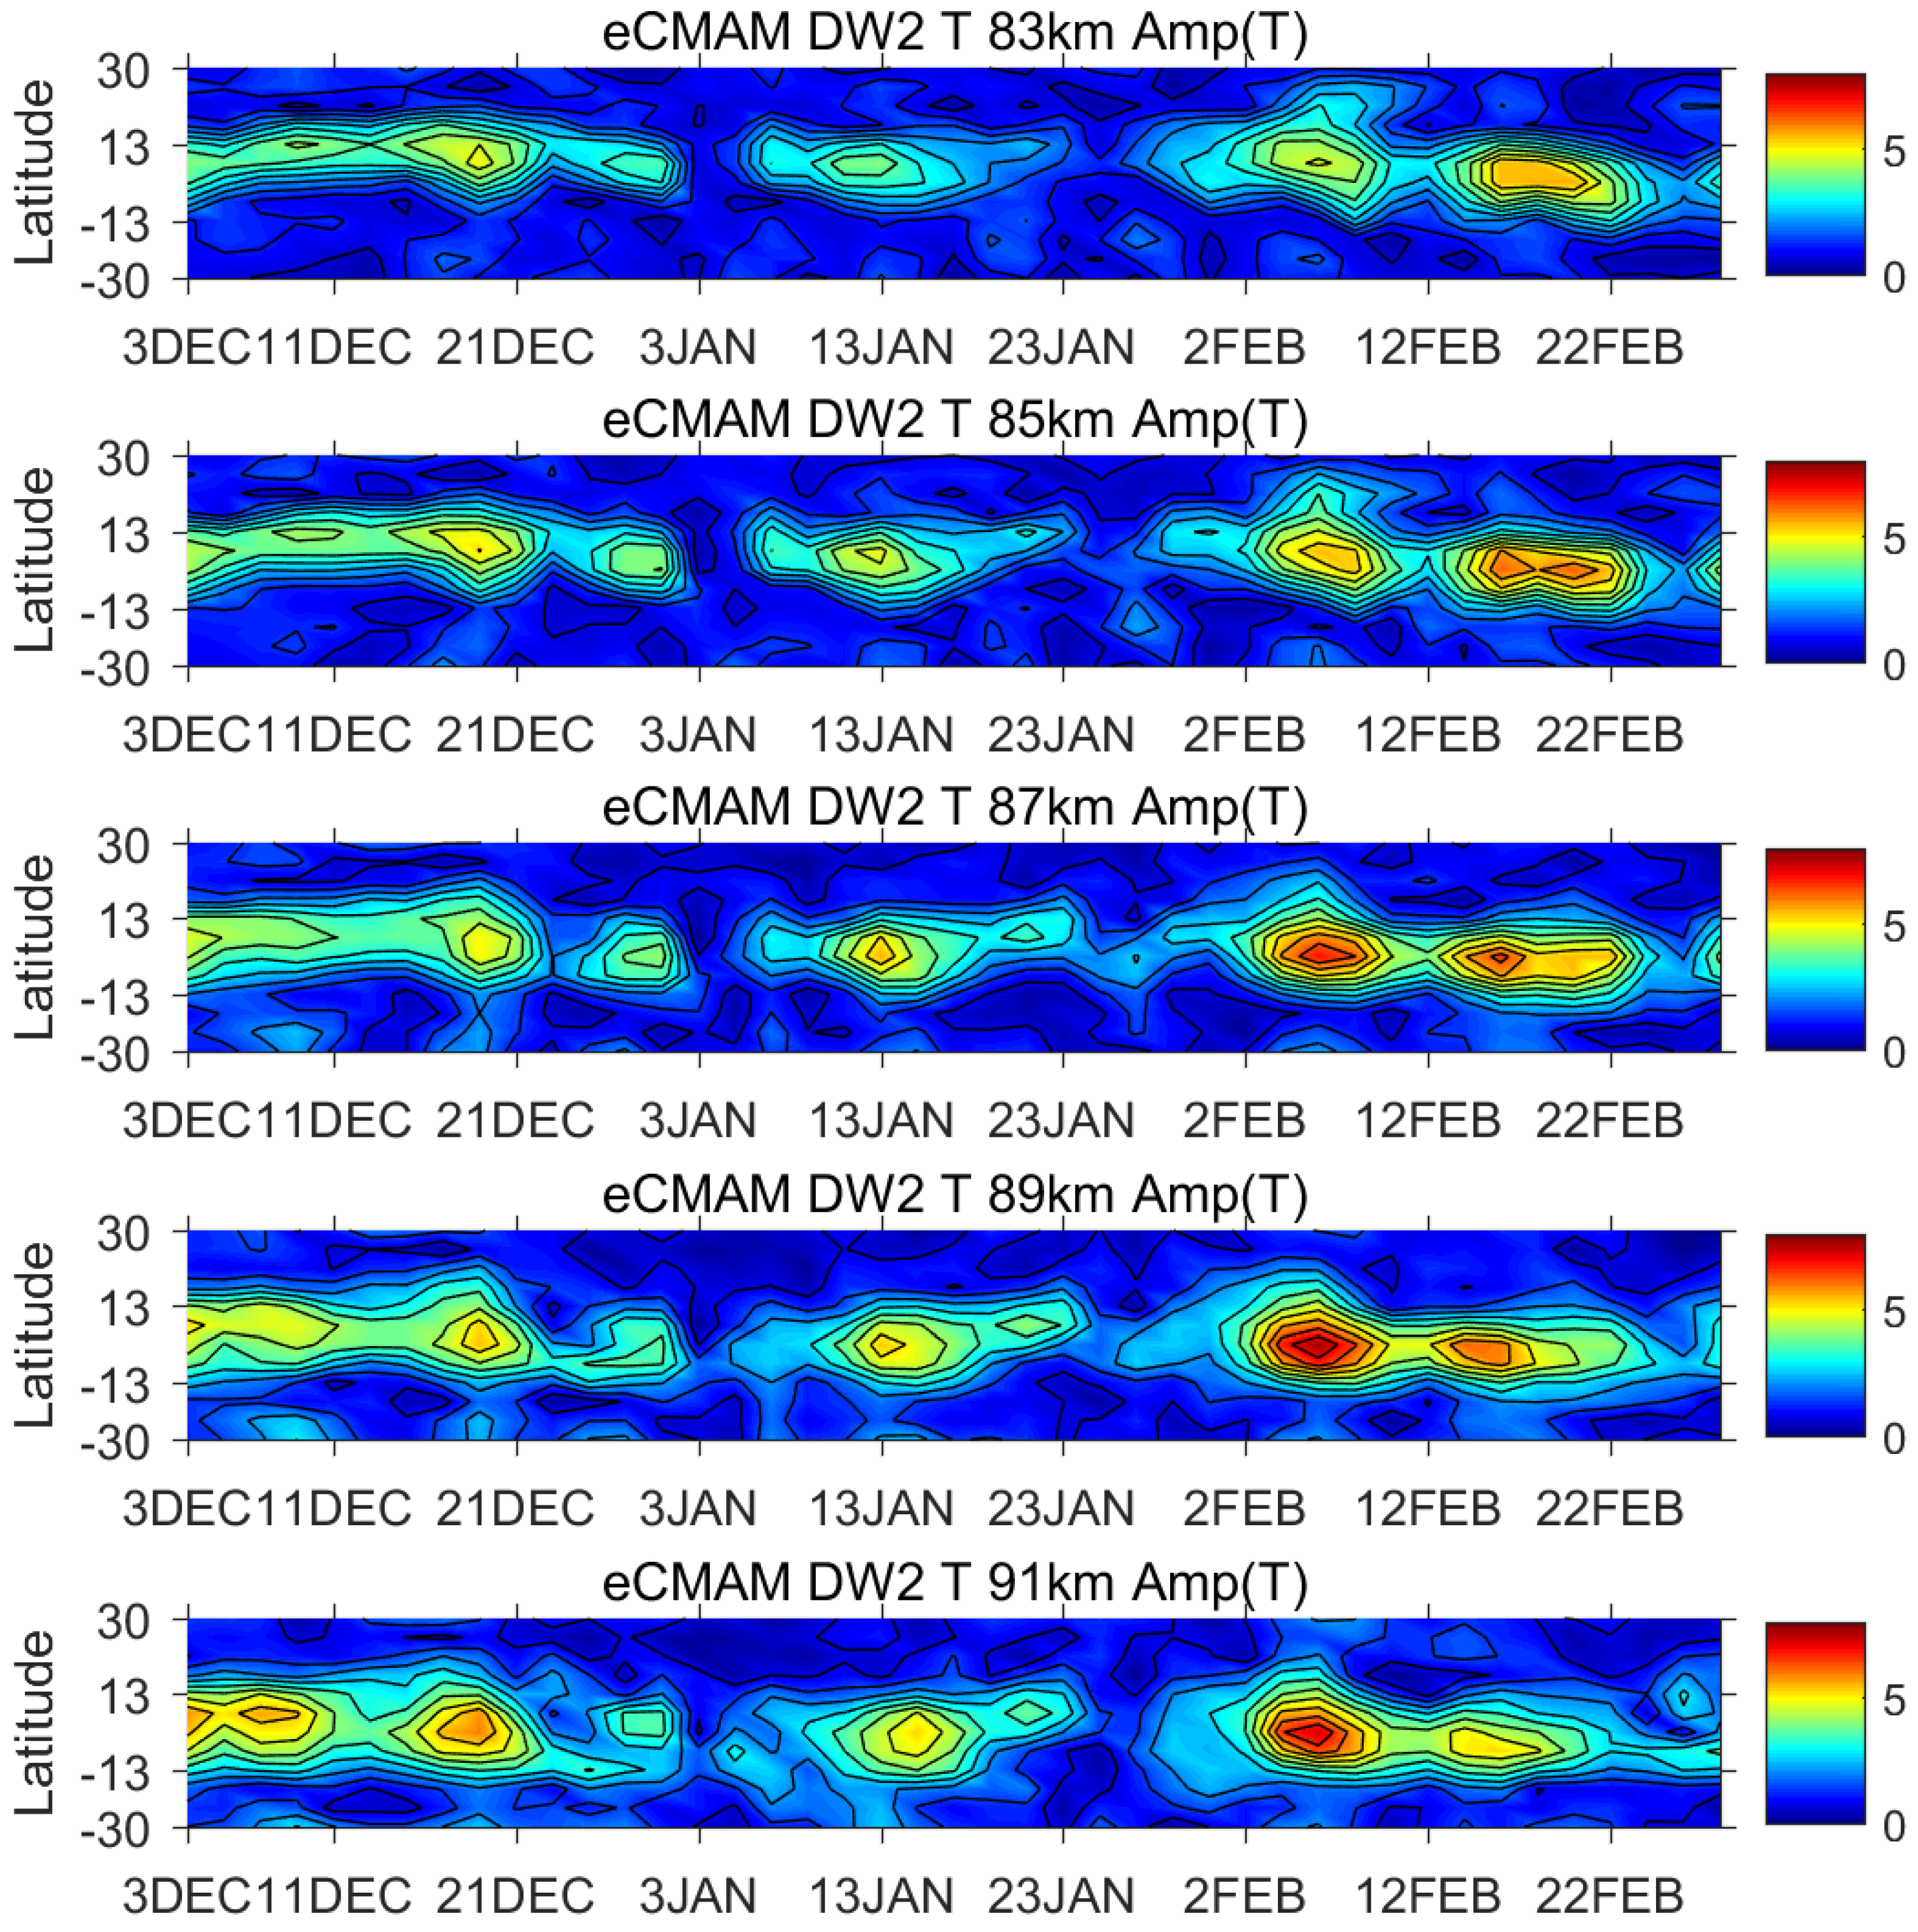
Figure 3 illustrates similar behavior observed in DW2 T field at 83, 85, 87, 89, and 91 km.
To have a better quantitative evaluation of the correlations between SPW1 and DW2, our study computes correlation coefficients for different combinations of heights and latitudes. We select three heights (45, 48, and 51 km) and six latitudes (47°, 53°, 58°, 64°, 69°, and 75° N) at which stratospheric SPW1 maximizes. Similarly, five heights (83, 85, 87, 89, and 91 km) and four latitudes (8° S, 3° S, 3° N, and 8° N) are chosen for DW2 T field. Therefore, 360 (3 × 6 × 5 × 4) combinations of correlation coefficients are computed for each winter between the two waves. The maximum correlation is chosen to compare with other winters.
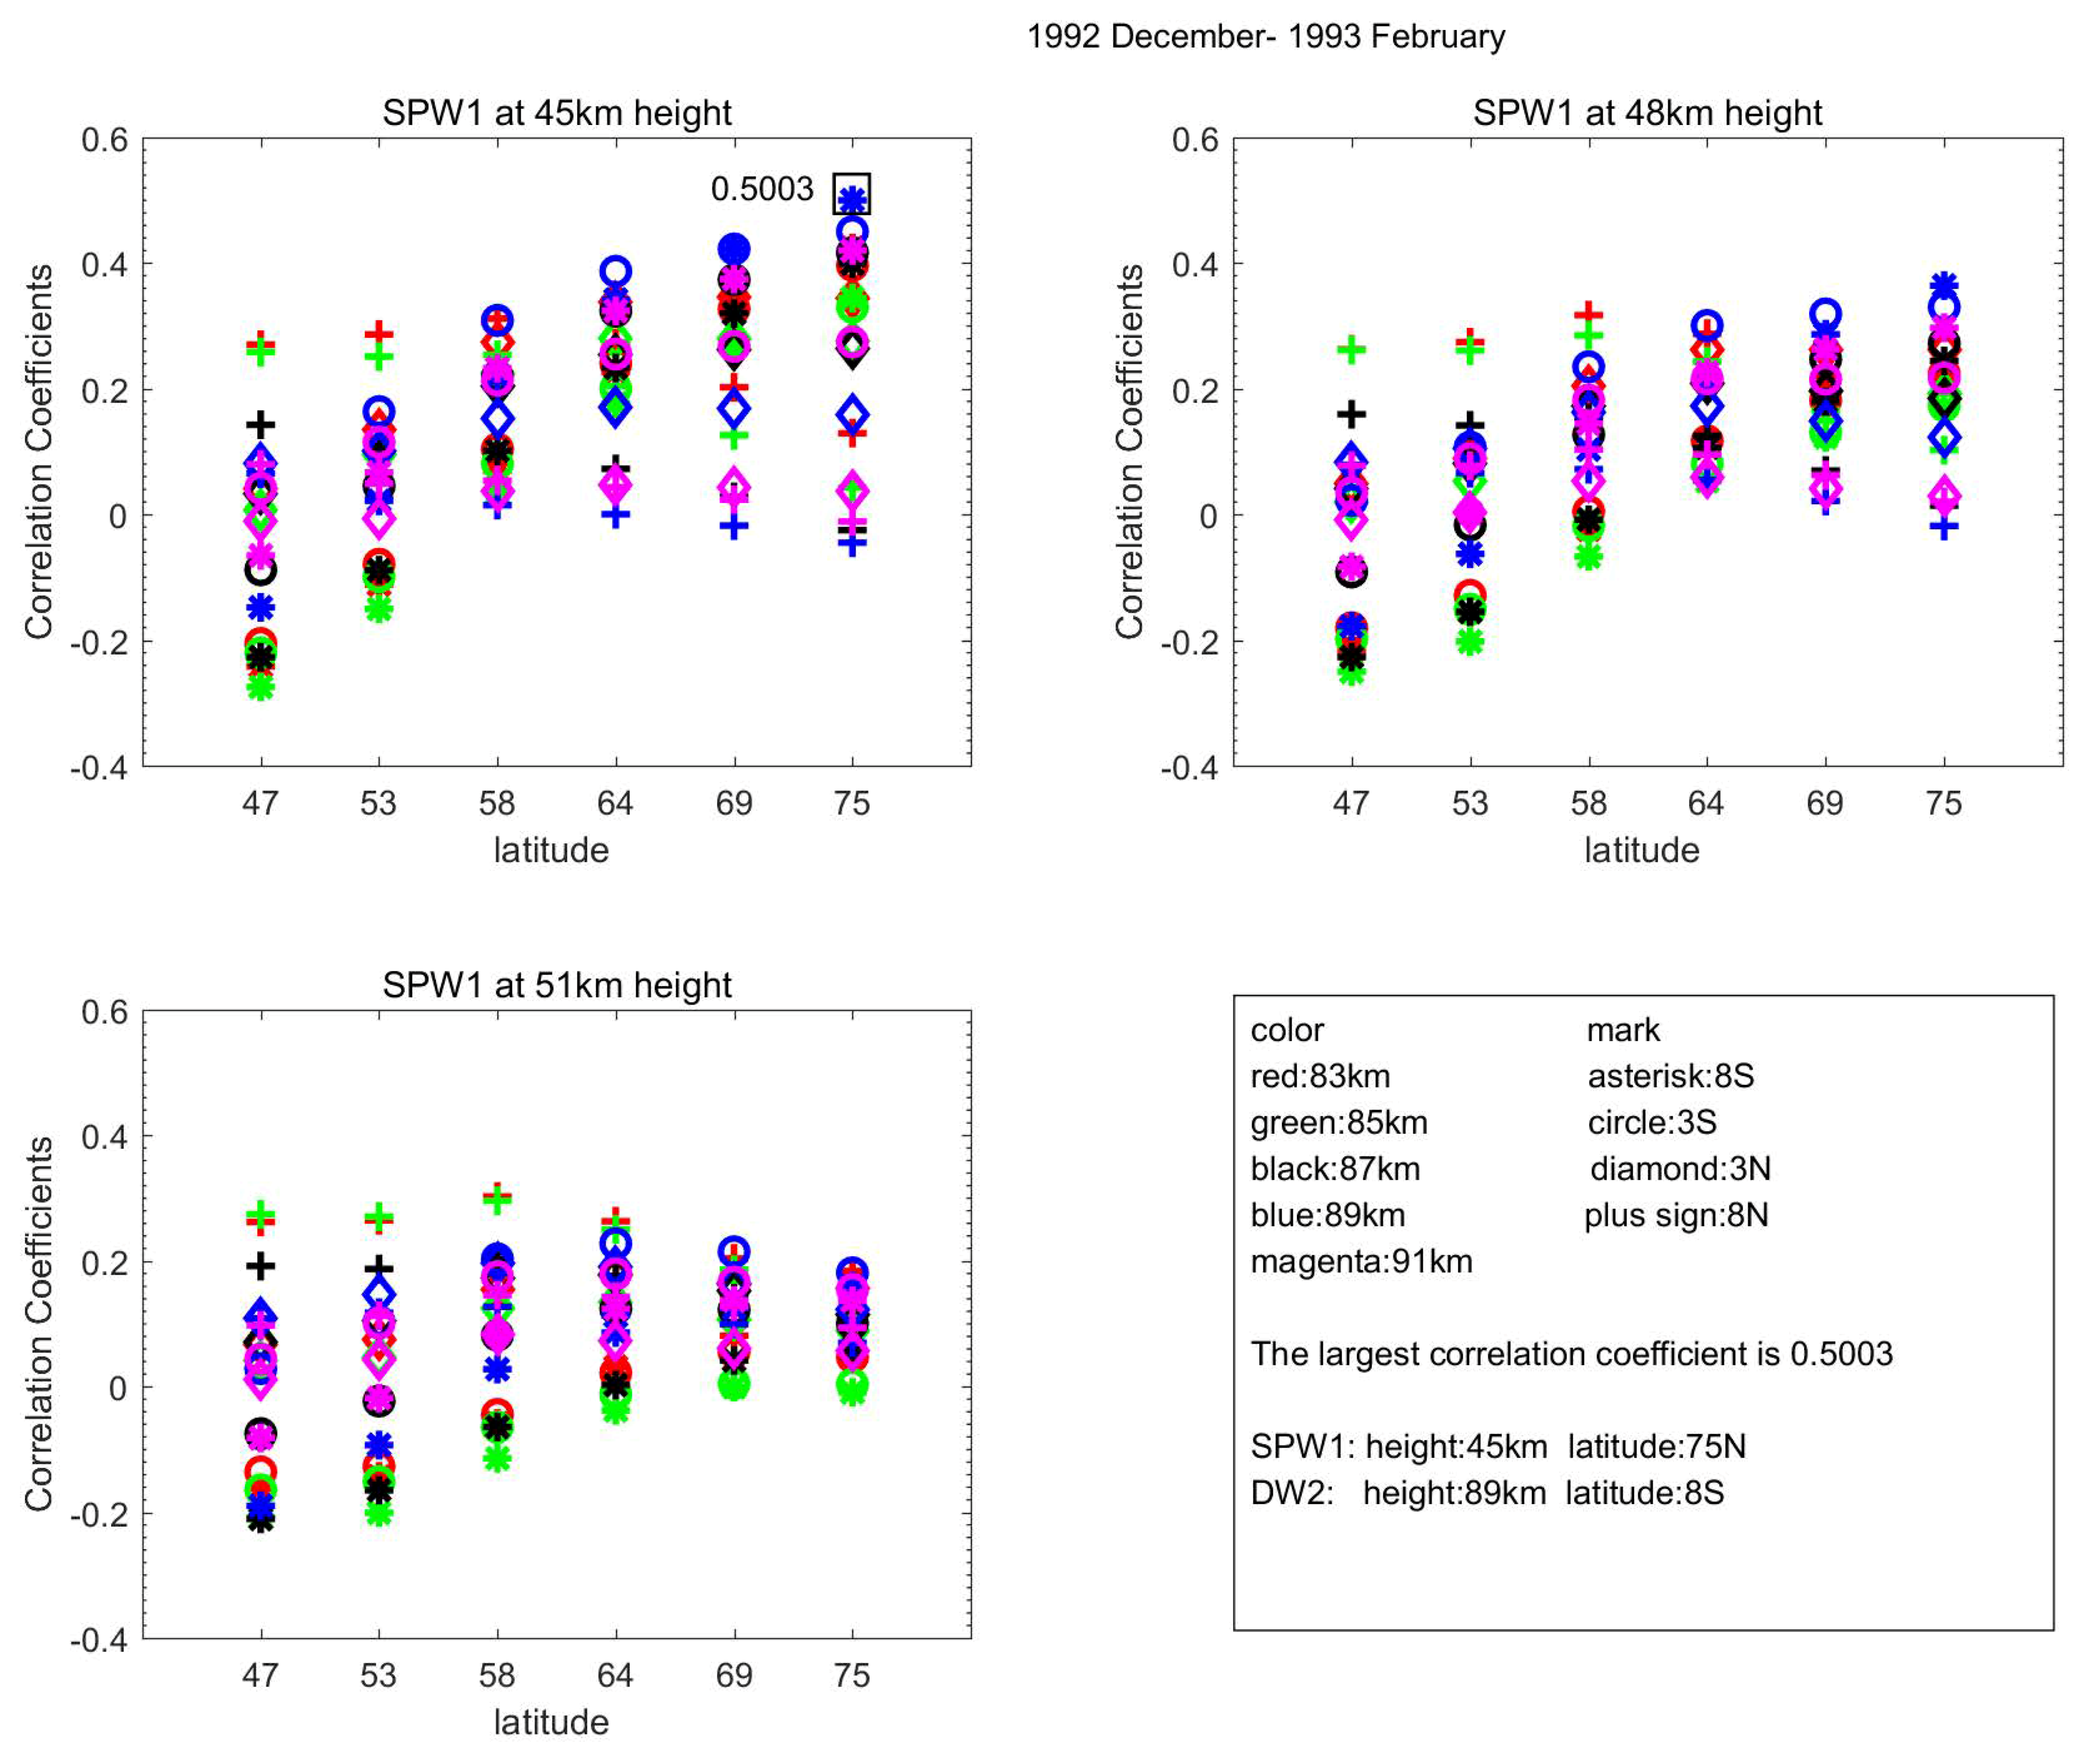
Figure 4 gives such an example for the 1992–1993 winter. The plots show the correlation coefficients between SPW1 and DW2 at all combinations of latitudes and heights. For example, the first column in
Figure 4’s left top panel represents the correlations between SPW1 at 45 km and 47 °N and DW2 at 20 combinations of latitudes and heights denoted by different colors and marks specified in
Figure 4’s bottom right panel. The highest correlation (0.5003) for this particular winter occurs between SPW1 at 45 km and 75° N with DW2 at 89 km and 8° S. These results show that the correlation can change significantly depending on chosen location.
This procedure is repeated for all the winters and the highest correlation is sought between SPW1 and DW2 at locations where their maxima occur. We also separate the 31 winters (1979–2010) into four categories: Major SSW displacement, major SSW split, minor SSW, and no-SSW (
Table 1). We define a stratospheric warming as the reversal of the zonal-mean zonal wind from westerly to easterly at 60° N, 10 hPa to identify major stratospheric warming events [
47,
48,
49]. Minor warming is defined when the meridional temperature gradient reverses for five consecutive days, but the zonal wind does not change direction (according to the World Meteorological Organization). The meridional temperature gradient is obtained by computing the zonal mean temperature for all latitudes from 60–90° N, and then averaging them. The technique used to classify the polar vortex type follows that of Charlton and Polvani (2007) [
48]. Cohen and Jones (2011) [
49] did similar analysis on the National Centers for the Environmental Prediction–National Center for Atmospheric Research (NCEP–NCAR) reanalysis data, and the ERA-40 and interim reanalysis, and found that the results were not sensitive to the reanalysis chosen.
The eCMAM lower atmosphere was nudged to ERA-interim reanalysis. As shown in
Table 1, out of the 31 winters between 1979 and 2010, there are eight winters that are major SSW displacement, eight that are major SSW split events, four that had minor SSW, and 11 winters with no SSW events.
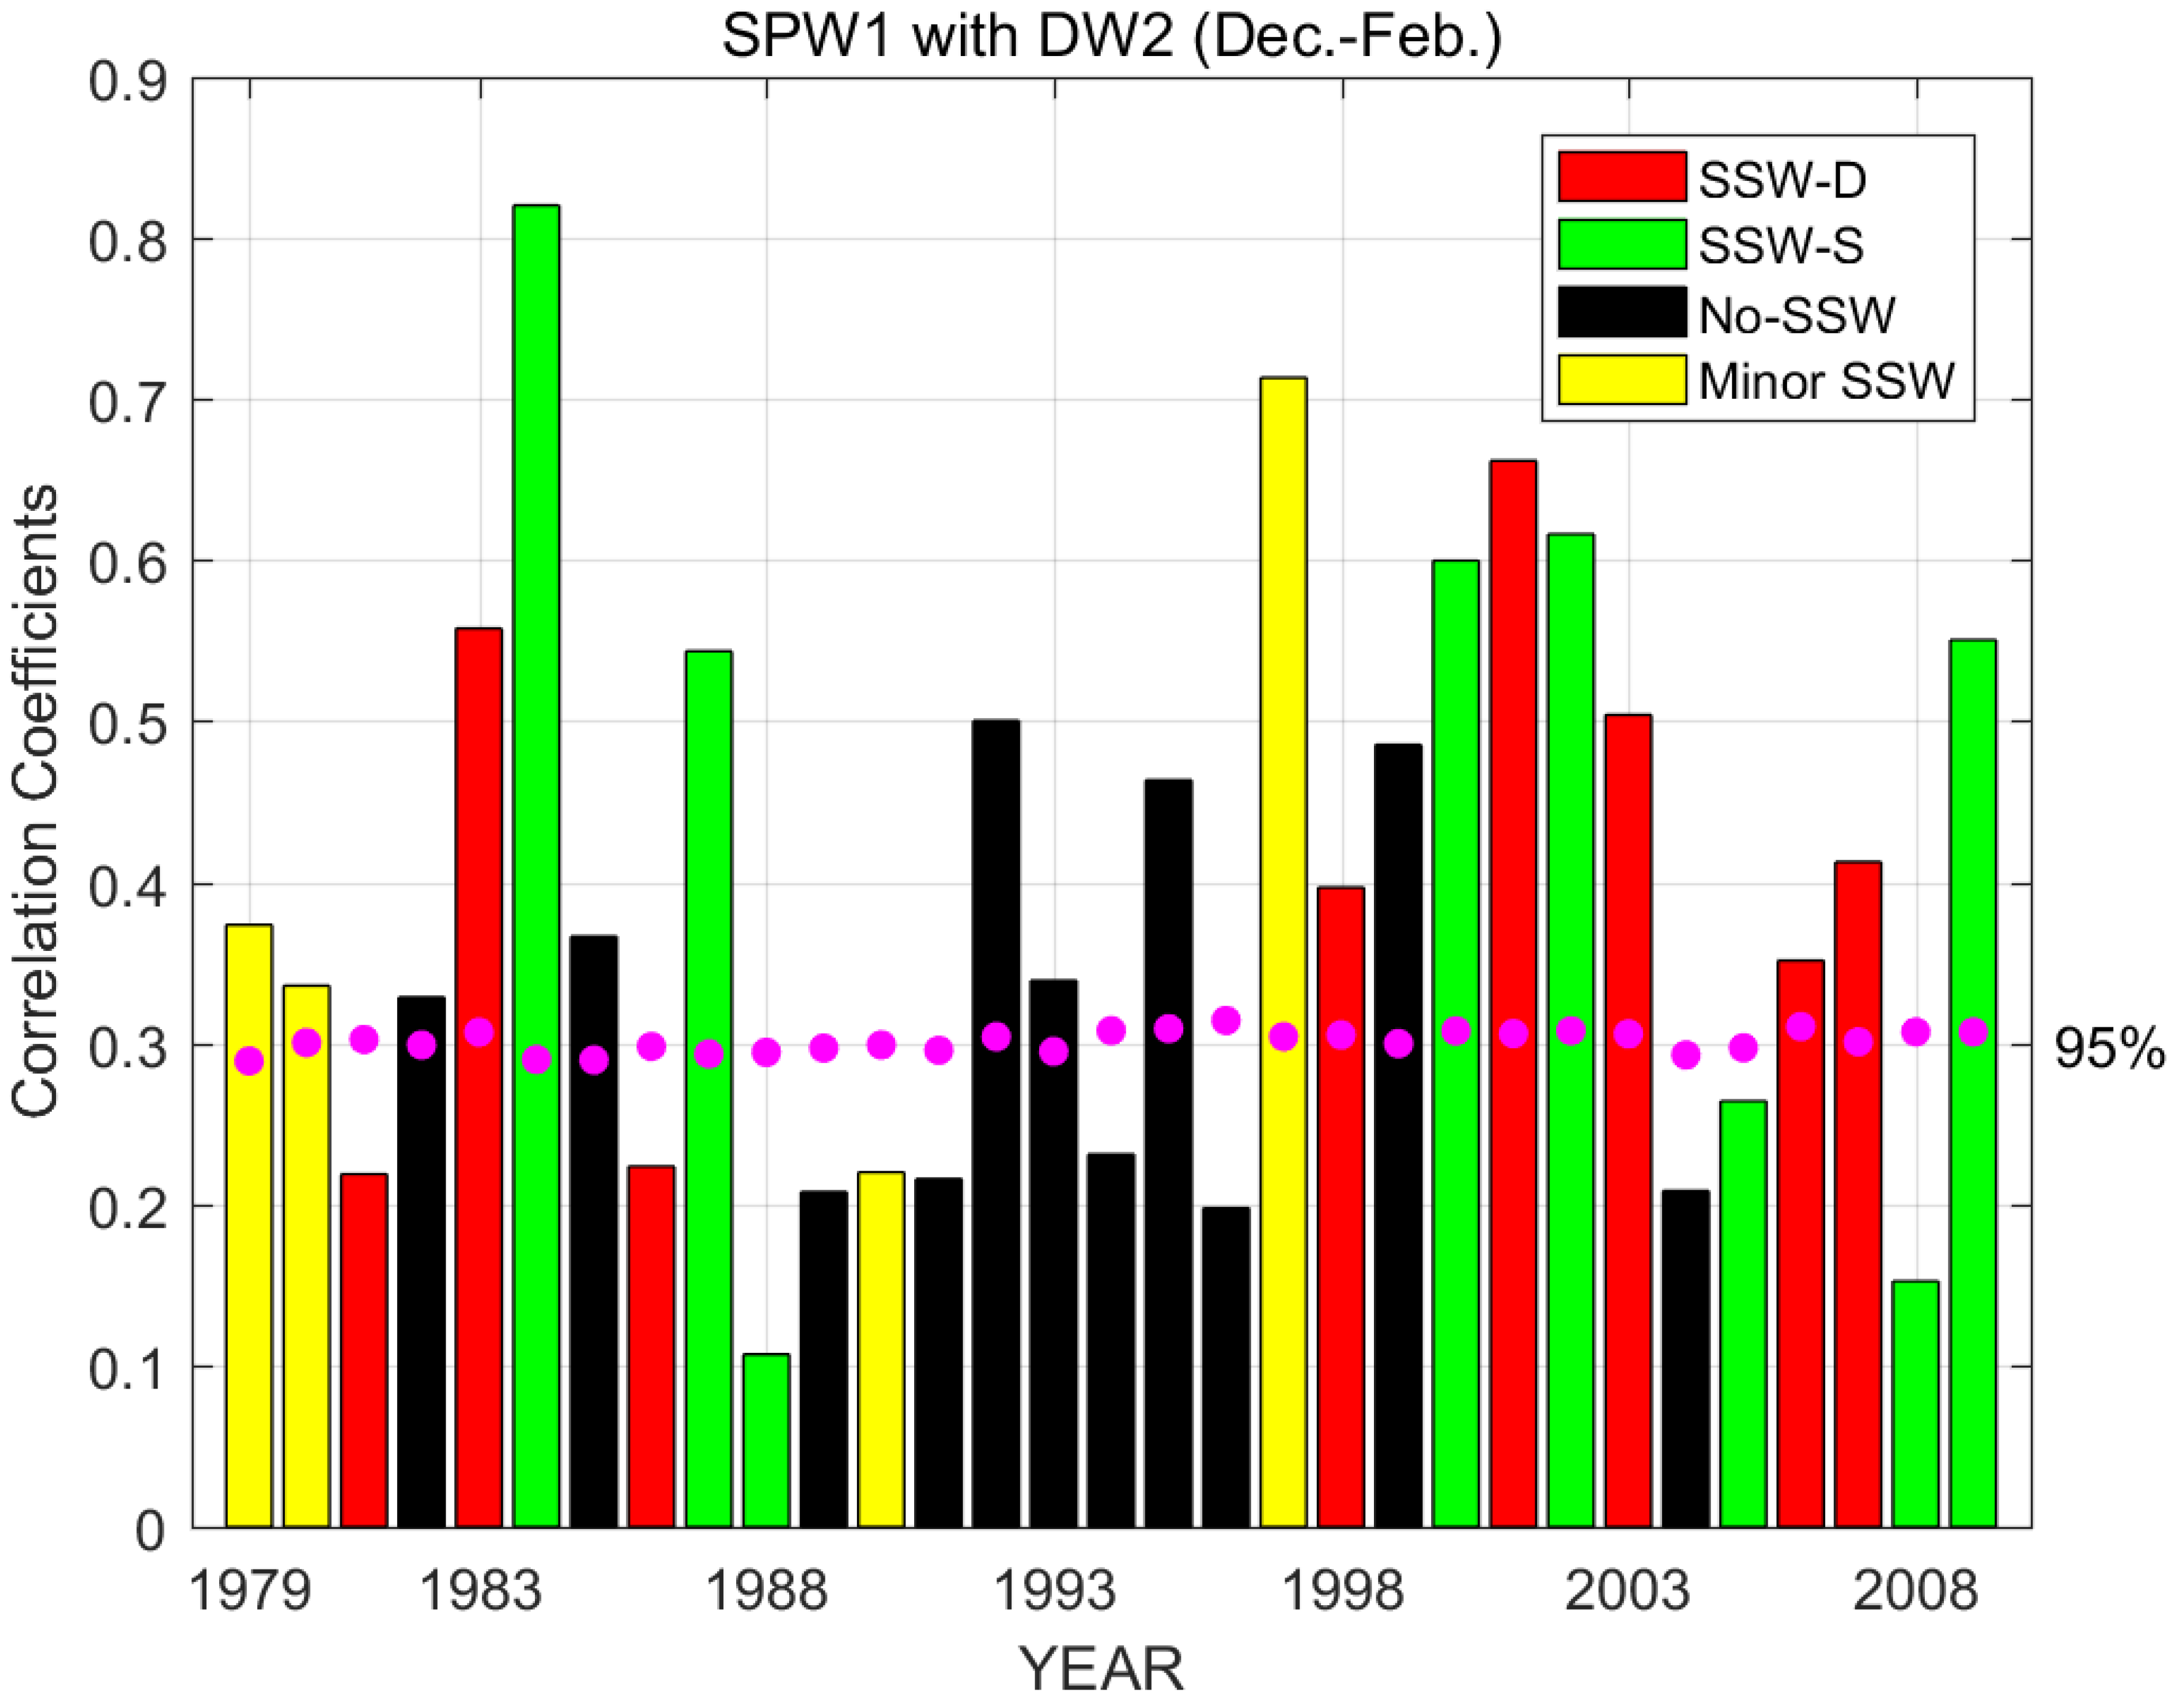
Figure 5 provides the highest correlations between SPW1 in the polar stratosphere and DW2 in the equatorial mesopause region for 31 NH winters from 1979 to 2010. Red bars represent all the winters with an SSW-D event, green is for SSW-S events, black for no-SSW winters, and yellow for minor SSW events (corresponding to
Table 1). The significance test is conducted at the 95% confidence level with Monte Carlo white noise time series and presented in magenta.
It can be seen that 20 out of 31 years (65%) have passed the significance test. The correlation varies significantly from year to year. Three out of four minor-SSW (75%), six out of eight SSW-D (75%), five out of eight (62.5%) SSW-S, and six out of 11 no-SSW (54.5%) winters show significant correlations between the two waves. The highest correlation (0.82) occurred in the 1984–1985 winter, which has an SSW split event. The winter of 2009–2010 (SSW-S) presented by Lieberman et al. (2015) [
8] shows a decent high correlation of 0.55. The lowest correlation is 0.1 for the winter of 1988–1989 (SSW-S). The average correlation for all SSW-D winters is 0.42, while it is 0.46 for SSW-S winters. The average is 0.41 and 0.32 for minor-SSW and no-SSW winters, respectively. We further investigate the relationship between SSW categories and the correlations through a student t-test. There is no significant correlation difference detected among all four SSW categories (table not shown). This result indicates that the nonlinear interactions between these two waves are not particularly stronger during winters with SSW events, or have preference over the type of the SSW events. However, there are overall significant correlations between the two waves in 65% of all winters (out of the 31-winter statistics).
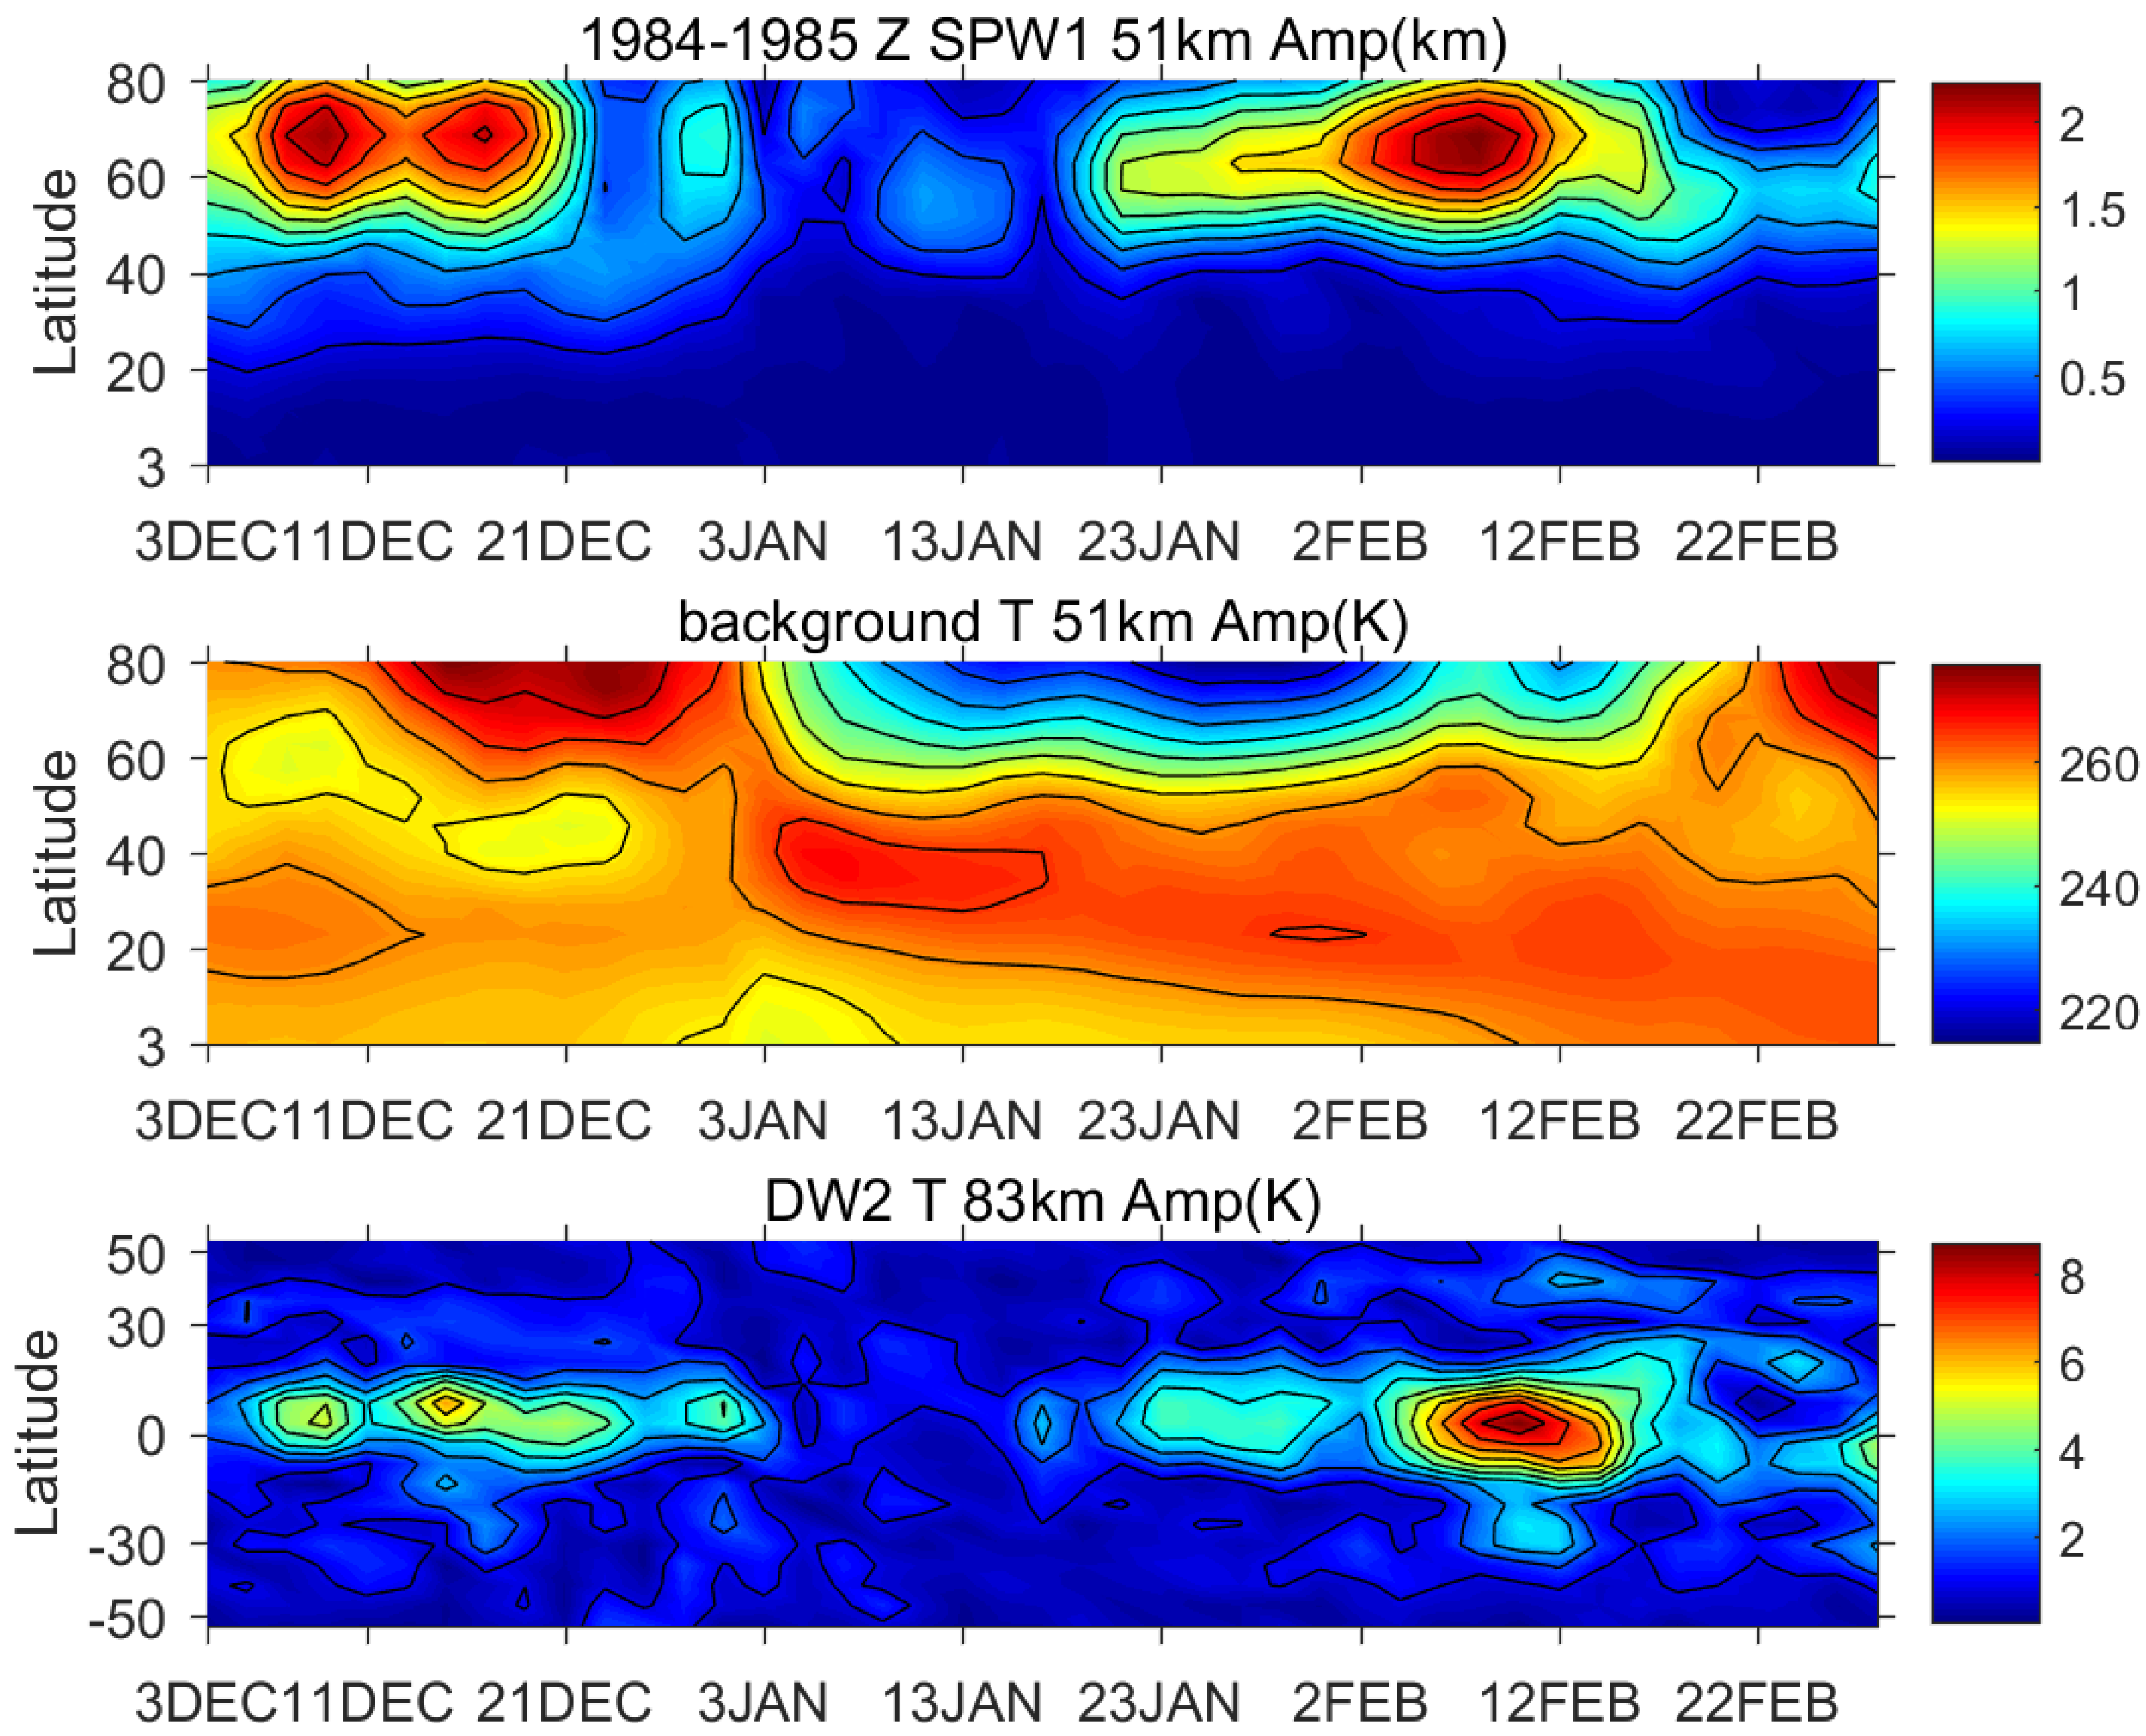
Figure 6 gives the highest correlation between the two waves in the winter of 1984–1985. In a similar format as
Figure 1, and Figure 8 in Lieberman et al. (2015),
Figure 6 shows the evolution of stratospheric SPW1 geopotential height (Z) amplitude, zonal mean temperature (T), and mesospheric DW2 T amplitude from December 1984 to February 1984 from eCMAM30. There is an SSW-S event in December 1984. The time evolution of the two waves matches very well with multi-peaks during the warming and one distinct peak after the warming. The correlation between these two waves is even higher than the 2009–2010 winter shown in Lieberman et al. (2015) [
8]. On the other hand,
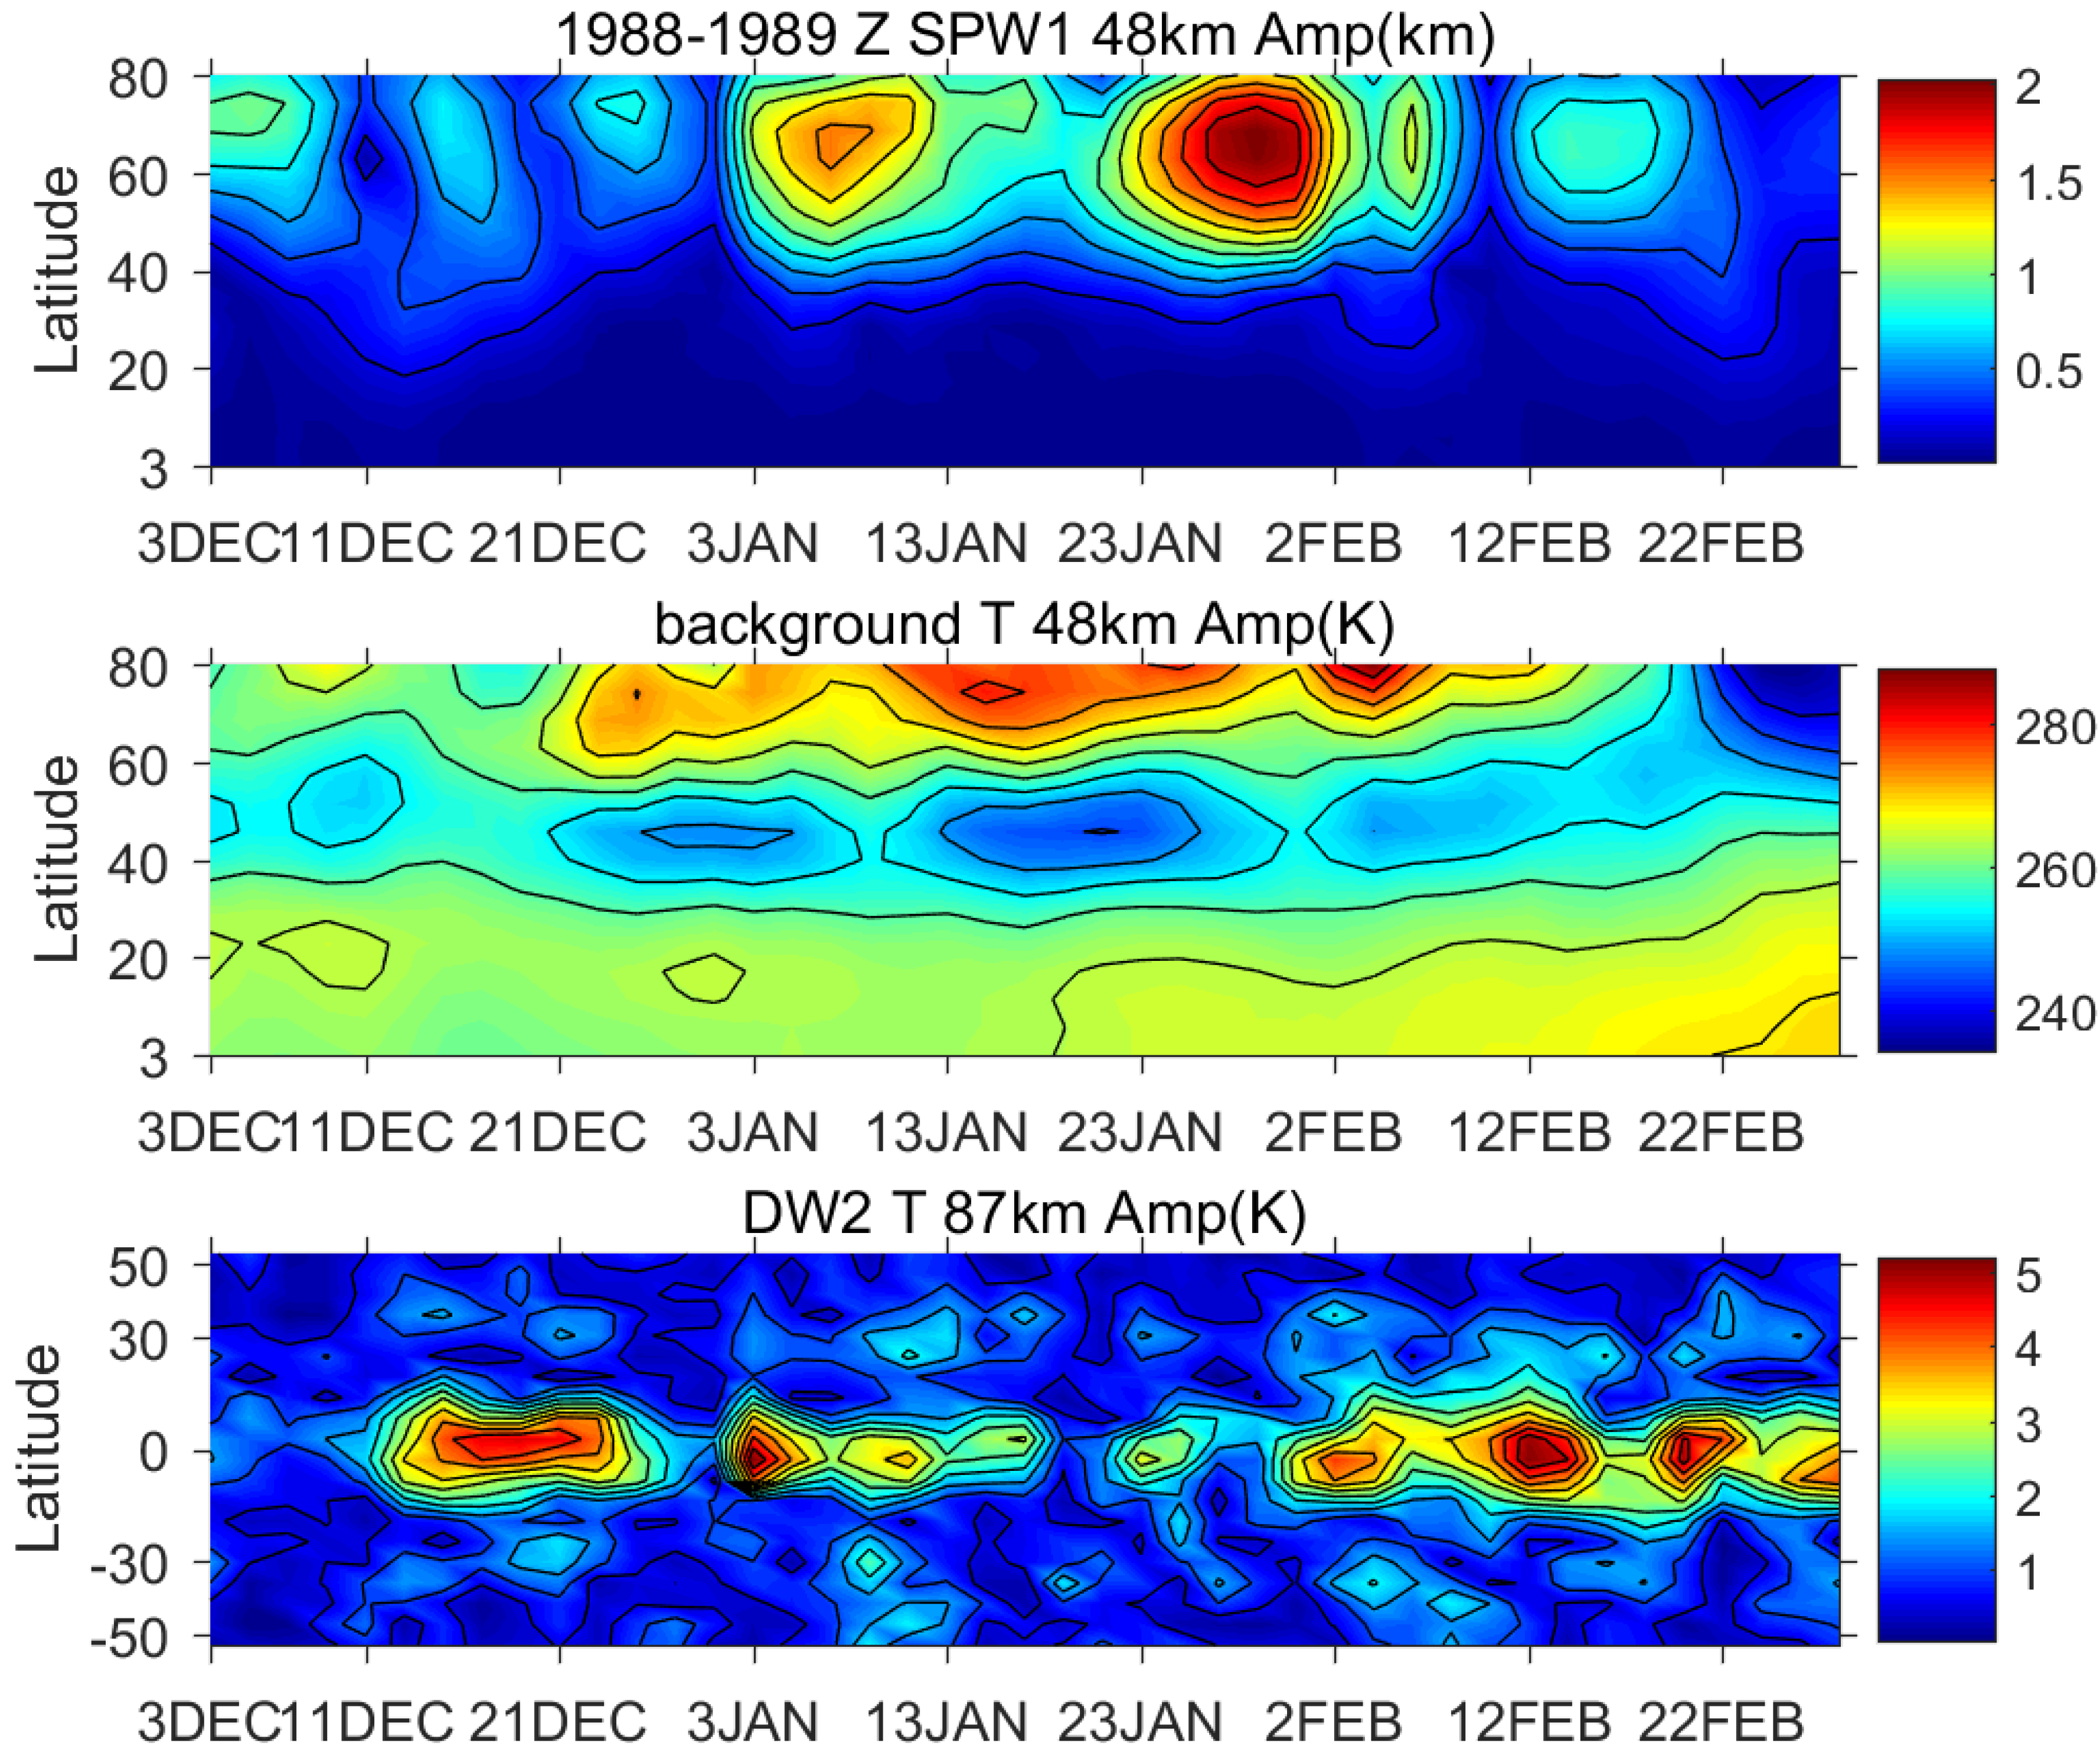
Figure 7 is the same as
Figure 6, but shows the lowest correlation winter between the two waves: 1988–1989. There was also an SSW-S event that happened later and lasted longer than the one in 1984–1985. The time evolution between the waves does not match well with the correlation of 0.01. As shown in
Figure 7, there are seven peaks in the SPW1 and nine peaks in the DW2. The duration of each peak does not match well between the two waves. A closer look at the zonal mean temperature fields between the two winters reveals that in 1984–1985, the warming peaks at around 20 December, although the polar region got cooler afterwards; however, there is an equatorward propagation of the warming, which lasted for the rest of the winter. A similar feature is also observed in the winter of 2009–2010 (
Figure 1). Whereas in the winter of 1988–1989, the warming was more confined in the polar region, and there was no equatorward propagation. This might be the reason why these two winters are so different. The subject of source mechanisms deserves a detailed future study, but is beyond the scope of the current paper.
4. Discussion
The other ‘child’ wave from the SPW-DW1 interaction is DS0. Lieberman et al. (2015) [
8] mainly focused on DW2 and little about DS0 is presented. DS0 maximized around 30° N and 110 km. We did similar plots for DS0 as the DW2 presented in the paper (not shown). The DS0 amplitude had more variability than DW2 in the winter of 2009–2010, and the tracking of the SPW1 amplitude was not as obvious as that for DW2. This is probably the reason that Lieberman et al. (2015) [
8] mainly focused on DW2 instead of DS0. We calculated the correlation between DS0 and SPW1 for the winter of 2009–2010 and it is around 0.45 compared to ~0.55 for SPW1 and DW2. We calculated the correlations between SPW1 and DS0 for all 31 winters. The mean correlation for SPW1/DS0 and SPW1/DW2 was very similar (both around 0.39). Surprisingly, there are more winters that SPW1 showed significant correlations with DS0 (24 winters) than DW2 (20 winters). Overall, we do see that SPW1 leaves a significant imprint on both DW2 and DS0 in about half of all the winters (16 out of 31). The rest of the 15 winters is separated into winters (3) that had no significant correlations for neither of the two, and winters (12) that only one child wave had a significant correlation with SPW1.
Both DS0 and DW2 showed no preference over SSW types in terms of correlation with SPW1. The highest correlation between SPW1 and DW2 was the winter of 1984–1985, which had a split SSW event. The second highest correlation happened in a minor SSW winter of 1997–1998, and the third highest is the 2001–2002 winter with a displacement SSW event. The winter of 2009–2010 showed in Lieberman et al. (2015) [
8] had a split SSW event. Since SSW-D years have stronger SPW1 than normal, one would expect stronger interactions between SPW1 and DW2. However, this seems not to be the case. Similarly, SPW2 was stronger during SSW-S, and we assume that similar conclusions apply to the SPW2 and DW1 interaction (child wave DE1 and DW3): The interaction between SPW2 and DW1 was not particularly stronger in the winters with SSW-S events. This assumption will be tested in future work.
This paper shows that nonlinear interaction of SPW1 and DW1 is indeed a source for DW2 and DS0. Significant correlations were observed between the child waves and SPW1 in the majority of the winters. However, the correlations change year to year, implying the strength of the nonlinear interaction changes year to year. Thus, the first significant question is: What governs the strength of the nonlinear interaction? Since the DW1 structure is essentially fixed and fairly steady, the strength of the nonlinear interaction should lie within the structure of the SPW1. Maybe the background is more favorable for SPW1 to propagate equatorward than other years to interact with DW1. Lieberman et al. (2015) [
8] investigated the advective process that couple SPW1 and DW2 and found that meridional advection of SPW1 zonal momentum by DW1 (migrating diurnal tide) is a significant source of lower thermosphere DW2 for the winter of 2009–2010. To investigate the difference of nonlinear forcing in every winter, this approach should extended to every winter, and their magnitudes and shapes compared. Furthermore, the change in SPW1 that governs the strength of the nonlinear interaction seems to be unrelated to the type of SSW.
Besides the nonlinear interaction, DW2 has another significant source: Latent heat. The relative role of these two sources is another challenging question. One needs to first examine if latent heat source for DW2 has significant year-to-year variation. We have learned from this study that the nonlinear interaction source presents large changes year-to-year. Similar correlation analysis should be performed between DW2 and DW2 latent heat. The physical mechanisms that govern the variability of DW2 will be investigated vigorously in a following study.
5. Conclusions
Inspired by Lieberman et al. (2015) [
8], this paper investigated if the time evolution of the SPW1 in the polar stratosphere and DW2 in the equatorial mesopause matches in every NH winter. In theory, during an SSW-D event, the SPW1 is particularly stronger, which can possibly result in a stronger interaction between the two waves. This paper also investigated if the time evolution of these two waves matches better for winters with an SSW-D event. We used a 31.5-year (1979–2010) run from the eCMAM. The lower atmosphere of the eCMAM was nudged to the ERA-interim reanalysis data. The eCMAM simulations compared well with the NOGAPS model and SABER for the 2009–2010 winter shown in Lieberman et al. (2015) [
8].
Correlation coefficients were calculated between the two waves at locations around their maximum amplitudes, and highest correlations were recorded and compared among all winters. The results show that significant correlations were present between the two waves in 20 (65%) winters in 31 years from 1979 to 2010. This study shows that nonlinear interaction of SPW1 and DW1 was indeed a source for DW2 and DS0. Significant correlations were observed between the child waves and SPW1 in the majority of the winters. However, the correlations change year to year, implying the strength of the nonlinear interaction changed year to year.
We then separated all winters into four categories: SSW-displacement, SSW-split, minor-SSW, and no-SSW. Significant correlations were present in all categories of winters: Three out of four minor-SSW (75%), six out of eight SSW-D (75%), five out of eight SSW-S (62.5%), and six out of 11 no-SSW (54.5%). Student t-test shows that there is no significant difference among the four categories in terms of correlations between the two waves. Although SPW1 was usually stronger during a SSW-D winter, this does not warrant a stronger interaction with DW2. This implies that the SPW1 structure change that governs the strength of the nonlinear interaction year-to-year was irrelevant to the type of SSW. Vigorous study of the physical mechanisms that governs the DW2 variability will be pursued in a future study and must also include the latent heating source.
