Article

Modeling of Aerosol Radiation-Relevant Parameters in the Troposphere of Siberia on the Basis of Empirical Data

by
Mikhail V. Panchenko
,
Svetlana A. Terpugova
*,
Victor V. Pol’kin
,
Valerii S. Kozlov
and
Dmitry G. Chernov
V.E. Zuev Institute of Atmospheric Optics, 1, Ak. Zuev square, 634055 Tomsk, Russia
*
Author to whom correspondence should be addressed.
Atmosphere 2018, 9(11), 414; https://doi.org/10.3390/atmos9110414
Submission received: 30 May 2018 / Revised: 12 October 2018 / Accepted: 15 October 2018 / Published: 23 October 2018
(This article belongs to the Special Issue Radiative Transfer in the Earth Atmosphere)

Abstract

:
The paper presents the generalized empirical model of the aerosol optical characteristics in the lower 5-km layer of the atmosphere of West Siberia. The model is based on the data of long-term airborne sensing of the vertical profiles of the angular scattering coefficient, aerosol disperse composition, as well as the content of absorbing particles. The model provides for retrieval of the aerosol optical characteristics in visible and near IR wavelength ranges (complex refractive index, scattering and absorption coefficients, optical depth, single scattering albedo, and asymmetry factor of the scattering phase function). The main attention in the presented version of the model is given to two aspects: The study of the effect of the size spectrum of the absorbing substance in the composition of aerosol particles on radiative-relevant parameters (the single scattering albedo (SSA) and the asymmetry factor (AF)) and the consideration of different algorithms for taking into account the relative humidity of air. The ranges of uncertainty of SSA and AF at variations in the modal radius of the absorbing fraction at different altitudes in the troposphere are estimated.

1. Introduction

Atmospheric aerosol is an inherent component of the atmosphere and plays an essential role in the formation of its optical properties. At present, a large amount of data is available on aerosol optical and microphysical characteristics and principal processes of aerosol generation and transformation in all the altitude ranges where the presence of particles can affect the optical properties of the atmosphere [1,2,3,4].
The lower troposphere (i.e., the altitude range up to 5 km), where more than 80% of particles are concentrated, is the most complex subject for study. It is the altitude range where the majority of sources of particles, aerosol-producing vapors, and the main processes determining aerosol sinks occur. The lower troposphere is characterized by the strongest spatiotemporal variability of almost all parameters because of complex geophysical, synoptic, and meteorological factors. According to the International Panel on Climate Change (IPCC), the current lowest level of scientific understanding in estimates of radiative forcing of different atmospheric constituents is assigned to aerosols [4,5].
Improvement of radiative and chemical transport models of the cloudless atmosphere depends to a large extent on correctly setting the scattering and absorbing properties of atmospheric aerosol [6,7,8,9,10,11,12,13]. However, obtaining accurate quantitative information on the aerosol parameters is very difficult, due to its strong spatial–temporal variations and the great variety of the particles’ chemical composition [14]. The modern development of climatic models requires an appropriate level of knowledge about the radiative-relevant optical characteristics, such as the aerosol optical depth, the single scattering albedo, and the asymmetry factor of the scattering phase function. The most important aspect is the relationship between the scattering and absorbing properties of the aerosol [15].
This paper presents the results of modeling the radiative-relevant characteristics of an aerosol containing black carbon (single scattering albedo and asymmetry factor of the scattering phase function). Single scattering albedo is one of the principal parameters determining the aerosol radiative effects. It is the parameter that causes the role of the aerosol in the atmosphere as either a cooling or heating factor. Its magnitude strongly depends not only on the mass ratio of the absorbing and non-absorbing aerosol substance, but also on how and in what size range the absorbing substance is concentrated inside the submicron fraction of particles, which in turn determines the aerosol radiative forcing in the visible wavelength range. Another important parameter is the asymmetry factor of the scattering phase function, which, on average, characterizes the direction of propagation of the scattered radiation [16,17,18].
In previous versions of this model [18,19,20,21], we simulated the vertical profile of the aerosol scattering coefficient on the basis of its near-ground value. The algorithm of retrieval of the vertical profile of the scattering coefficient was developed taking into account season, type of air mass, time of day, and aerosol optical depth [18]. At the next stage, other optical parameters of the aerosol were retrieved, considering the particle size distribution function at several altitudes [19]. In the most recent version, we introduced the aerosol absorbing properties into the model [22], though the dependence of absorption on the particle size was not taken into account. The main purpose of the present paper is the further development of the model, namely an estimation of the sensitivity of the aerosol radiative-relevant characteristics to the size distribution of the absorbing substance inside the aerosol particles.

2. Construction of the Empirical Model

2.1. Experimental Data

The model of the optical and microphysical characteristics of the aerosol for the troposphere over West Siberia was created using the statistically ensured experimental dataset obtained over a long-term period of routine aircraft measurements [23].
In order to study the aerosol optical characteristics, we have developed an airborne nephelometric setup based on the Photoelectric Aerosol Nephelometer (PHAN), which is capable of measuring the coefficient of directed light scattering at an angle of 45° and at three visible wavelengths (0.41, 0.52, and 0.63 μm) [24]. To study the role of geophysical factors, only the data obtained at λ = 0.52 μm are analyzed in this paper. Meteorological parameters of the atmosphere (temperature and relative humidity) were measured simultaneously during all the flights.
The nephelometer was installed inside an aircraft. This creates no limits to the work at daytime. The main advantage of this arrangement over airborne nephelometers with an open working volume is the possibility of a direct action on aerosol. This makes it possible to increase the information capacity of the experiment by studying the effect of meteorological parameters on aerosol optical properties.
However, when working with a close scattering volume, it is necessary to avoid distortions at air sampling. Possible changes of the particles’ number density when moving along the collection path are connected firstly with their diffusion and sedimentation on the walls, and secondly with the inertial settling on the wall bends that are not completely avoided in the construction of the air transport path. Estimates made according to Reference [25] show that the loss of particles of submicron size did not exceed 1%. The loss of particles with the size d ≥ 10 μm can reach several tens of percent. Therefore, the applied air-sampling path enabled us to perform correct measurements of, mainly, accumulative fraction of particles.
For the arrangement of the measurement setup inside the aircraft aerosol, drying is unavoidable in the air transport path due to the difference between air temperature outside and inside the aircraft (this difference was decreased by heat–isolation). Additionally, a lamp in the immediate working volume additionally heated the nephelometer chamber. In the majority of events, the difference between temperature inside the working volume and out of the aircraft exceeded 25 °C. Therefore, almost all measurements were carried out at low values of relative humidity, and, in first approximation, one can assume that the properties of “dry” particles were studied.
Hygrograms (the dependencies of scattering coefficient on relative humidity RH at artificial moistening up to RH ~90%) were recorded during each flight at different altitudes. The meteorological parameters (temperature and relative humidity) of air outside the aircraft and in the immediate scattering volume were recorded simultaneously with nephelometric measurements. Knowing the dependence of the optical signal on relative humidity enabled us to more correctly estimate the value of the scattering coefficient of “dry” particles. The same dependence was used for reconstructing the true values of the scattering coefficient in situ.
To calibrate the nephelometer, we developed a technique based on recording the scattering coefficients of clear air at different altitudes (i.e., at different values of air pressure). The calibration procedure is described in detail in Reference [24]. First, the air was blown through a purification system that almost completely trapped the aerosol particles, and then its scattering coefficient was measured. These measurement data enabled us to consider the signal due to molecular scattering as a function of ambient air pressure P and then to calibrate the instrument’s scale in units of the molecular scattering coefficient as well as to estimate the level of the background produced within the nephelometer chamber. To provide better accuracy and reliability for this technique, we also calibrated the instrument by the molecular scattering of pure gases under laboratory conditions. The gases He, N2, CO2, Ar, Kr, and Xe, whose scattering coefficients are known, were used as working substances. Thus, the scale of the device was calibrated in absolute units and the nephelometric chamber background was determined. The sensitivity of determining the aerosol scattering coefficient was ~10–15% of the molecular scattering at a given altitude.
Measurements are ongoing, so in this version of the model we used the data obtained in 2009–2016 (Figure 1). The flights were carried out during daytime under conditions of stably cloudless and mostly cloudless weather. Such choice of weather conditions enables the assumption that the dataset formed from these measurements may characterize the certain background state of aerosol weather in the region that is of special interest for assessing the aerosol radiative effect. The model was developed and tested to evaluate the radiation effects of the aerosol in a cloudless atmosphere [22] and in conditions of enhanced turbidity of the atmosphere caused by wildfire smokes [26,27].
The mean values of the angular scattering coefficient at the wavelength λ = 0.51 μm of dry submicron fraction μ (45°) and mass concentration of absorbing matter (black carbon) MBC obtained from the aircraft sounding data were used as the input parameters of the model. Figure 1 demonstrates the distributions of the values of μ (45°) and MBC for winter and summer (minimum, maximum, and mean values, as well the values at 25% and 75% of the total number of realizations) and the number of profiles included in the arrays.

2.2. Modeling of the Aerosol Size Distribution and Complex Refractive Index

The aerosol size distribution function at each altitude—0, 0.5, 1, 2, 3, 4, and 5 km—was modeled as a sum of two lognormal functions (the submicron fraction A and the coarse fraction B) with the use of an empirical microstructure model [19,22]. The parameters of the fractions (median radius ri, half-width of the distribution νi, and the volume concentration of fraction Vi, i = 1,2) were selected such that the Mie-calculated angular scattering coefficient of the dry submicron fraction μ0 (45°, λ = 0.51 μm) coincided with the seasonal mean value [23] at a given altitude. Non-absorbing aerosol particles were assumed with the real part of the refractive index naer = 1.5 Parameters of the fractions A and B for winter and summer are presented in Table 1.
Most problems with the microphysical approach are associated with the determination of the complex refractive index of particles for different size ranges. As a rule, optical constants of substance are retrieved from the chemical composition measurements. However, relying only upon observations of the chemical composition of atmospheric aerosol particles makes it almost impossible to take into account, a priori, the contribution of non-recorded small concentrations of chemical elements and their compounds to the real (n) and imaginary (χ) parts of the refractive index. It should be stressed that considerable non-controlled errors may be a consequence of the neglect of the contribution from chemical elements having large values of n and χ (such as metals). Moreover, the contribution of organic compounds to the atmospheric aerosol is still poorly understood. However, most atmospheric aerosol constituents have a refractive index close to 1.5 [28]. A different refractive index of aerosol particles is introduced in summer and winter, considering different mass concentration of black carbon in the aerosol composition.
In the previous version of the model, the absorbing matter was considered in the form of an internal mixture and, according to the empirical data obtained at that time, 90% of mass MBC was included into fraction A, and 10% to fraction B [22]. The computation of optical constants of particles in each of them was carried out by assuming that black carbon is uniformly distributed in the whole fraction volume. However, our preliminary estimates of the single scattering albedo carried out under different assumptions of the absorbing matter size distribution showed that the aerosol absorbing properties strongly depend on the form of existence of the absorbing substance as a separate fraction or as an internal admixture in the composition of the submicron fraction of aerosol particles [29]. Based on these results, the authors of the present paper introduced the concept of “absorbing” subfraction C. Absorbing matter is considered uniformly distributed within the particle volume (“living alone” in the atmosphere subfraction C does not exist; it was separated only for the sake of clearer perception and simplification of the scheme for computation of optical constants of the absorbing particles).
Figure 2 shows a schematic presentation of the absorbing matter distribution within the total distribution of aerosol particles.
Parameters of the fraction C were set based on measurements of the absorbing matter size distribution. The problem of determining the size spectrum of the absorbing substance is the focus of various research groups [29,30,31,32,33,34,35,36,37,38,39,40,41]. Round-the-clock monitoring measurements using a diffusion spectrometer of absorbing matter [42,43] started at the aerosol monitoring station of the Institute of Atmospheric Optics of the Siberian Branch of Russian Academy of Sciences (IAO SB RAS) [44] at the end of 2013. The spectrometer provides a measurement of the absorbing matter mass concentration distribution in the size range of 10–1000 nm [45]. The method is based on a combination of a particle selector (an 8-section diffusion battery of grid type) and a Multiwavelength Diffusion Aethalometer (MDA) [46] developed at IAO SB RAS to measure the concentration of absorbing matter on each section of the diffusion battery. The size distribution is determined from the solution of the inverse problem in the form of a unimodal lognormal function. Figure 3 illustrates the measured monthly average size distributions of the absorbing matter in 2016 (Figure 3a) and the temporal variability of its median diameter from 2014–2016 (Figure 3b).
It can be seen from Figure 3 that the peculiarities of the temporal dynamics in the median diameter of the absorbing substance are the same for each year of observation. Usually, it is characterized by a maximum in winter and a minimum in summer. To estimate the range of possible variations of the median radius of the distribution and, hence, variations of the optical characteristics, we used the mean values of the median radius for winter and summer for our computations and the maximum and minimum radius values were estimated as the mean radius ± root-mean-square deviation. Thus, the following values of the median radius were taken: Summer—r = 0.04, 0.08, and 0.17 μm, and winter—r = 0.046, 0.095, and 0.19 μm. For the half-width of the distribution, its mean value s (ln r) = 0.6 was used.
The complex refractive index for dry particles was computed following the volume mixture rule:
nk = (nk × Vk + nBC × VBC,k)/(Vk + VBC,k), χk = χBC,k × VBC,k/(Vk + VBC,k)
where nk and χk are the real and imaginary parts of the refractive index of dry non-absorbing particles of the kth fraction (m = 1.5 − 0 × i); nBC,k and χBC,k are the real and imaginary parts of the refractive index of black carbon (m = 1.8 − 0.74 × i), respectively; Vk is the volume of particles of the kth fraction; VBC,k is the volume of black carbon in the kth fraction [28].

2.3. Relative Humidity in the Model
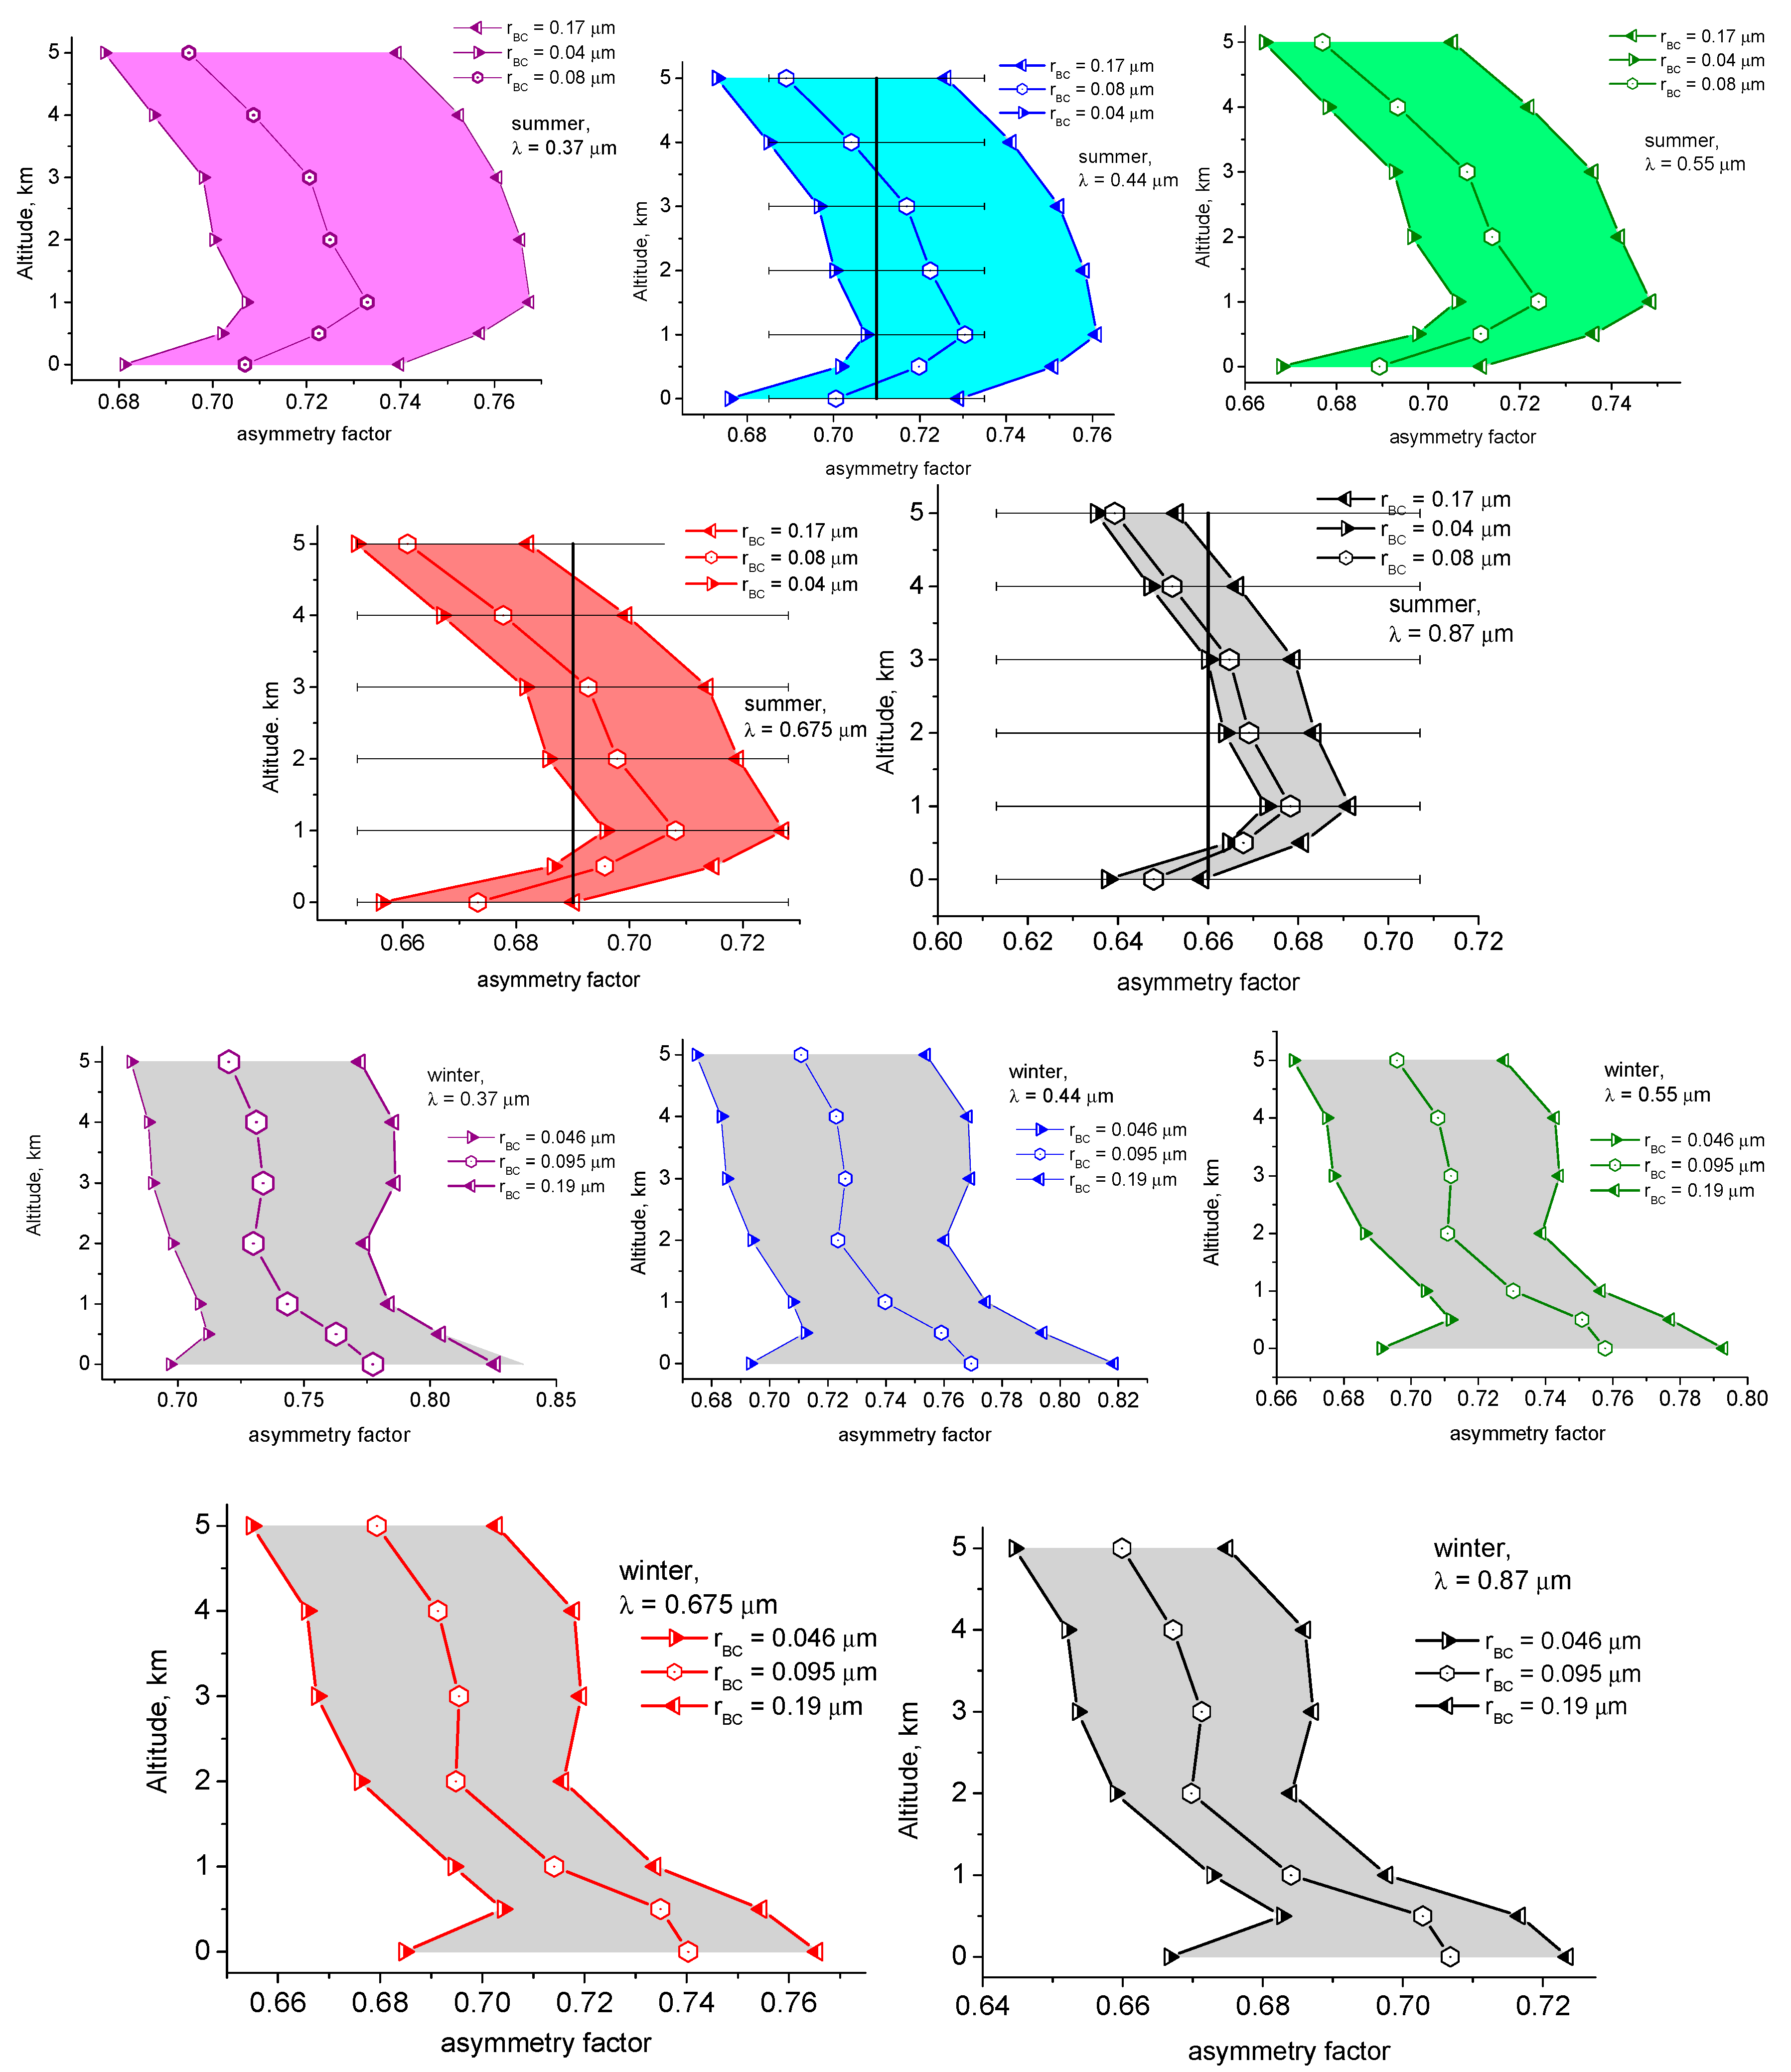
We then recalculated the refractive index of the dry aerosol in accordance with the seasonal mean relative humidity RH at different altitudes that were obtained during aircraft sensing [19].
Relative humidity of air is one of the main parameters causing variations in the optical and microphysical characteristics of an atmospheric aerosol [45,46]. The hygroscopicity of particles and their ability to serve as condensation nuclei make a great contribution to the radiative characteristics of the earth–atmosphere system. Therefore, when constructing models of the aerosol optical and radiative characteristics, it is necessary to correctly take into account the transformation of the optical properties of particles under the effect of the relative humidity of the air.
Previously, the increase in submicron fraction volume along with air humidity variations was computed from a formula derived taking into account the data of aircraft measurements concerning the dependence of the angular scattering coefficient μ (45°) on the relative air humidity RH and the parameter of condensation activity γ:
μwet (z) = μ0(z) × (1 − RH(z))−γ(z)
where μ0 is the scattering coefficient for zero relative humidity, RH(z) is the seasonal mean relative humidity at altitude z, and γ(z) is the seasonal mean parameter of the condensation activity at the corresponding altitude.
The γ values at different altitudes, except those near the ground (z = 0), are one of the input parameters of the empirical model; they were obtained from the period of aircraft measurements in 1986–1988 [19]. The seasonal average data of multiyear measurements in Tomsk were taken as the near-ground γ value [45]. In the summer period, the parameter of the condensation activity was γ = 0.3 at z = 0 and γ = 0.5 at all the other altitudes; in winter, it was γ = 0.4 at z = 0 and γ = 0.5 at all the other altitudes.
The principal parameter here is the seasonal mean value of the parameter of condensation activity γ for the scattering coefficient at an angle of 45° and a wavelength of 0.51 μm [45]. However, theoretical and experimental research of various authors [46,47,48,49,50,51], including our study in this field of research [52], shows undoubted dependence of the aerosol hygroscopic properties on the particle size. On the other hand, the aerosol model for radiative calculations should be relatively simple and contain a small number of input parameters.
Therefore, in order to correctly take into account the relative humidity of air in our model calculations, we decided to compare the results of our measurements with A.G. Laktionov’s approach [48]. He suggested a semi-empiric theory of equilibrium growth of atmospheric aerosol particles. The equilibrium radius of particle rRH at an air relative humidity RH is related to the radius of dry particle r0 by the following relationship:
r R H = r 0 ( 1 B E v ln R H ) 1 / 3
where B = 1.13 − 0.422·RH for the continental III aerosol type. The value EV is determined as the ratio of the volume of the water-soluble particles to the volume of all dry particles. To describe the function Ev(r), it was proposed to use the single-mode lognormal distribution of the form [48]:
E v = A exp ( 0.5 × [ ln ( r / x c ) s ] 2 )
The choice of parameters of this function was carried out by fitting the calculations based on Mie theory and through comparison with experimental data on the degree of linear polarization of the scattered light at an angle of 90° [53]: xc = 0.32 μm; A = 0.4; s = 0.6. However, further experimental investigations showed that the parameter xc (the position of the maximum of Ev on the size scale) can vary for different atmospheric conditions within the limits xc = 0.1–0.4 μm. Therefore, two sets of the parameters of Equation (4) were selected for calculations:
(1) xc = 0.32 μm; A = 0.4; s = 0.6;
(2) xc = 0.15 μm; A = 0.2; s = 0.6.
Next, the scattering and extinction coefficients in the visible wavelength range were calculated using Mie formulas for the obtained distributions. Calculations were carried out considering the average seasonal value of relative humidity at all altitudes (Table 2). The refractive index of the wet aerosol fraction was determined using the volume mixture rule under the assumption that, during wetting, the volume of particles increases due to water uptake alone:
nwet = (ndry × Vdry + nwater × (Vwet − Vdry)/Vwet, χwet = χdry × Vdry/Vwet,
where the refractive index of water nwater = 1.33.
The values of relative humidity at different altitudes, as well as the resulting refractive indices of all fractions, are presented in Table 2.
To verify the calculations, the optical characteristics obtained were compared with the results of field measurements. The data on the aerosol extinction coefficient derived from the measurements of the spectral transparency of the atmosphere on a 1 km long near-ground horizontal path were used as a reference [54].
Figure 4 shows the spectral dependences of the near-ground aerosol extinction coefficients calculated using different algorithms for accounting for the relative humidity in comparison with the average experimental data for July of different years. The array of 2012 consists only of the data obtained when one can assume the smoke of the vast wildfires observed in the region that year to be absent.
One should not expect an exact agreement between the absolute values of the extinction coefficients calculated for some “long-term average image” of the aerosol with the experimental values for the specific year of measurements. However, it is seen in Figure 4 that selectivity of the spectral dependence of the extinction coefficient in 2013 and 2014 were practically the same. The data from 2012 show different spectral behavior, because, in spite of removal of the days with smoke in the region from consideration, the residual effect of smoke is still observed. Regarding the selectivity of the spectral behavior, the variant of taking into account relative humidity using Equation (4) with the parameters xc = 0.32 μm and s = 0.6 is the closest to the experimental data.
Parameter A in Equation (4) was selected so that the parameter of condensation activity γ (Equation (2)) coincides with the experimental seasonal mean values at each altitude [19].
To verify the model, the spectral aerosol optical depth (AOD) was computed using the retrieved values of the extinction coefficient in the altitude range of 0–5 km. The obtained data were compared with the results of sun-photometer measurements in Tomsk from 1995–2013 [55,56,57,58] (Figure 5). It is clear that the spectral variations of AOD in the background model and average long-term data of the sun-photometer measurements are in good agreement: The Angstrom exponent in summer is equal to approximately 1.4 in both cases. In winter, the values of AOD measured by the sun photometer are greater than those computed from the extinction vertical profile retrieved using the presented model. This can be explained by the fact that airborne sounding was carried out under background conditions, but the photometer was arranged in the suburbs of the city of Tomsk, and, on some occasions, an urban pollution cup was found in the field of view of the photometer [57]. One should note that the spectral behavior of the aerosol optical depth obtained using the described model in the case of mean median radius of the size distribution of the absorbing substance is in best agreement with the spectral behavior of AOD measured by the sun photometer.
Thus, the characteristics retrieved in the empirical model framework provide an adequate description of the aerosol optical characteristics under average background conditions of atmosphere.

3. Results

At the final stage, the single scattering albedo and the asymmetry factor of the scattering phase function were computed using the scattering and extinction coefficients at each altitude retrieved using the present model. Figure 6 shows the single scattering albedo (SSA) at different wavelengths for different median radii of the size distribution of the absorbing substance in summer and winter, and Figure 7 presents analogous data on the asymmetry factor of the scattering phase function. Black vertical lines show the columnar mean values of the single scattering albedo and the asymmetry factor obtained from the data measured at the Tomsk AERONET site in summer, averaged over the period 2002–2017 [59]. Unfortunately, there are very few data for winter, so we do not present the comparison for this season.
It is seen that in both seasons, the lowest values of SSA are observed in the case of the maximum median radius of the absorbing substance and the highest SSA values are at the minimum median radius rBC. The minimum of the SSA in winter is observed near the ground, because of the highest values of the mass concentration of the absorbing substance in this layer. The range of variations of the SSA in winter is greater than in summer. Furthermore, the range of variations of SSA is greater at altitudes above 1 km than in the near-ground atmospheric layer.
The asymmetry factor of the scattering phase function is greater at the maximum median radius of the absorbing substance size distribution. Its range of variations in winter is widest in winter near the ground (altitude z = 0), it then becomes narrower, and at altitudes above 1 km it widens again.

4. Conclusions

Summarizing the material presented, a generalized empirical model of the optical characteristics of an aerosol for the lower 5-km layer of the atmosphere of Western Siberia is presented schematically here. It is based on data of long-term aircraft sounding of vertical profiles of directional scattering coefficients, disperse composition of atmospheric aerosol, and the mass concentration of absorbing particles and their size distribution. It should be emphasized that the results given in this paper refer to the average values of the measured and retrieved characteristics for each of the seasons. Clearly, the mean seasonal profiles, averaged for the entire variety of synoptic situations, can hardly be applied to detailed radiation estimates. At this stage of constructing the model, we revealed that the size dependence of the hygroscopic properties of aerosol particles should be considered in radiative computations, as well as the size distribution of the absorbing substance.
Thus, the size distribution of the absorbing substance was considered in computations of the aerosol optical scattering and extinction to estimate the possible range of variations of the radiative-relevant characteristics (the single scattering albedo and the asymmetry factor). Therefore, the variations in the single scattering albedo are around 5% at all altitudes, and variations in the asymmetry factor are around 10%.

Author Contributions

Methodology: M.V.P.; Measurements: S.A.T., V.S.K., V.V.P., D.G.C.; Calculations: V.V.P., S.A.T.; Analysis of calculation results: M.V.P., S.A.T.; Writing and figures: S.A.T.

Funding

The work was supported in part by The Program of Presidium of the Russian Academy of Sciences No. 51 «Climate change: reasons, risks, subsequences, problems of adaptation and regulation».

Conflicts of Interest

The authors declare no conflicts of interest.

References

  1. Seinfield, J.H.; Pandis, S.N. Atmospheric Chemistry and Physics: From Air Pollution to Climate Change, 2nd ed.; Wiley-Interscience: Hoboken, NJ, USA, 2006. [Google Scholar]
  2. Haywood, J.; Boucher, O. Estimates of the direct and indirect radiative forcing due to tropospheric aerosols: A review. Rev. Geophys. 2000, 38, 513–543. [Google Scholar] [CrossRef] [Green Version]
  3. Andrews, E.; Sheridan, P.J.; Ogren, J.A. Seasonal differences in the vertical profiles of aerosol optical properties over rural Oklahoma. Atmos. Chem. Phys. 2011, 11, 10661–10676. [Google Scholar] [CrossRef] [Green Version]
  4. Jaenicke, R. Atmospheric aerosol and global climate. J. Aerosol Sci. 1980, 11, 577–588. [Google Scholar] [CrossRef]
  5. Intergovernmental Panel on Climate Change. IPCC Fifth Assessment Report: Climate Change. 2013. Available online: http://www.ipcc.ch/report/ar5/ (accessed on 24 July 2018).
  6. Hansen, J.; Sato, M.; Ruedy, R.; Nazarenko, L.; Lacis, A.; Schmidt, G.A.; Russell, G.; Aleinov, I.; Bauer, M.; Bauer, S.; et al. Eficacy of climate forcings. J. Geophys. Res. 2005, 110, D18104. [Google Scholar] [CrossRef]
  7. Takemura, T.; Nakajima, T.; Dubovik, O.; Holben, B.; Kinne, S. Single-scattering albedo and radiative forcing of various aerosol species with a global three-dimensional model. J. Clim. 2002, 15, 333–352. [Google Scholar] [CrossRef]
  8. Yu, H.; Kaufman, Y.; Chin, M.; Feingold, G.; Remer, L.; Anderson, T.; Balkanski, Y.; Bellouin, N.; Boucher, O.; Christopher, S.; et al. A review of measurement-based assessments of the aerosol direct radiative effect and forcing. Atmos. Chem. Phys. 2006, 6, 613–666. [Google Scholar] [CrossRef] [Green Version]
  9. Hartley, S.W.; Hobbs, P.V.; Ross, J.L.; Russell, P.B.; Livingston, J.M. Properties of aerosols aloft relevant to direct radiative forcing of the mid-Atlantic coast of the United States. J. Geophys. Res. 2000, 105, 9859–9885. [Google Scholar] [CrossRef]
  10. Haywood, J.M.; Ramaswamy, V. Global sensitivity studies of the direct radiative forcing due to anthropogenic sulphate and black carbon aerosols. J. Geophys. Res. 1998, 103, 6043–6058. [Google Scholar] [CrossRef]
  11. Zhuravleva, T.B. Simulation of solar radiative transfer under different atmospheric conditions. Part I: Deterministic atmosphere. Atmos. Ocean. Opt. 2008, 21, 99–114. [Google Scholar]
  12. Zhuravleva, T.B.; Kabanov, D.M.; Sakerin, S.M.; Firsov, K.M. Simulation of direct aerosol radiative forcing for typical summer conditions of Siberia. Part 1: Method of calculation and choice of the input parameters. Atmos. Ocean. Opt. 2009, 22, 63–73. [Google Scholar] [CrossRef]
  13. Gorchakov, G.I.; Karpov, A.V.; Vasiliev, A.V.; Gorchakova, I.A. Brown and black carbons in megacity smogs. Atmos. Ocean. Opt. 2017, 30, 248–254. [Google Scholar] [CrossRef]
  14. Bates, T.S.; Anderson, T.L.; Baynard, T.; Bond, T.; Boucher, O.; Carmichael, G.; Clarke, A.; Erlick, C.; Guo, H.; Horowitz, L.; et al. Aerosol direct radiative effects over the northwest Atlantic, northwest Pacific, and North Indian Oceans: Estimates based on in-situ chemical and optical measurements and chemical transport modeling. Atmos. Chem. Phys. 2006, 6, 1657–1732. [Google Scholar] [CrossRef]
  15. Penner, J.E.; Zhang, S.Y.; Chuang, C.C. Soot and smoke aerosol may not warm climate. J. Geophys. Res. 2003, 108. [Google Scholar] [CrossRef] [Green Version]
  16. Sviridenkov, M.A.; Mikhailov, E.F.; Nebos’ko, E.Y. Parameterization of asymmetry factor of atmospheric aerosol scattering phase function. Atmos. Ocean. Opt. 2017, 30, 435–440. [Google Scholar] [CrossRef]
  17. Andrews, E.; Sheridan, P.J.; Fiebig, M.; McComiskey, M.; Ogren, J.A.; Arnott, P.; Covert, D.; Elleman, R.; Gasparini, R.; Collins, D.; et al. Comparison of methods for deriving aerosol asymmetry parameter. J. Geophys. Res. 2006, 111, D05S04. [Google Scholar] [CrossRef]
  18. Bedareva, T.V.; Zhuravleva, T.B. Retrieval of aerosol scattering phase function and single scattering albedo according to data of radiation measurements in solar almucantar: Numerical simulation. Atmos. Ocean. Opt. 2011, 24, 373–385. [Google Scholar] [CrossRef]
  19. Panchenko, M.V.; Terpugova, S.A.; Tumakov, A.G. Annual variations of submicron aerosol fraction as assessed from the data of airborne nephelometric measurements. Atmos. Res. 1996, 41, 203–215. [Google Scholar] [CrossRef]
  20. Panchenko, M.V.; Terpugova, S.A. Reconstruction of the scattering coeffcient in the lower troposphere using ground-based measurement. J. Atmos. Sci. 2002, 59, 581–589. [Google Scholar] [CrossRef]
  21. Panchenko, M.V.; Terpugova, S.A.; Pol’kin, V.V. Empirical model of the aerosol optical properties in the troposphere over West Siberia. Atmos. Ocean. Opt. 1998, 11, 532–539. [Google Scholar]
  22. Panchenko, M.V.; Zhuravleva, T.B.; Terpugova, S.A.; Polkin, V.V.; Kozlov, V.S. An empirical model of optical and radiative characteristics of the tropospheric aerosol over West Siberia in summer. Atmos. Meas. Tech. 2012, 5, 1513–1527. [Google Scholar] [CrossRef] [Green Version]
  23. Kozlov, V.S.; Shmargunov, V.P.; Panchenko, M.V. Seasonal Variability of the Vertical Profiles of Absorption Parameters of Submicron Aerosol in the Troposphere. Atmos. Ocean. Opt. 2009, 22, 413–420. [Google Scholar] [CrossRef]
  24. Panchenko, M.V.; Terpugova, S.A.; Tumakov, A.G.; Belan, B.D.; Rasskazchikova, T.M. Some aspects of a technique for airborne nephelometric studies of the tropospheric aerosol on a regional scale. Atmos. Ocean. Opt. 1994, 7, 546–551. [Google Scholar]
  25. Fuchs, N.A. The Mechanics of Aerosol; The McMillan Company: New York, NY, USA, 1964. [Google Scholar]
  26. Zhuravleva, T.; Kabanov, D.; Nasrtdinov, I.; Russkova, T.; Sakerin, S.; Smirnov, A.; Holben, B. Radiative characteristics of aerosol under smoke mist conditions in Siberia during summer 2012. Atmos. Meas. Tech. 2017, 10, 179–198. [Google Scholar] [CrossRef]
  27. Panchenko, M.V.; Zhuravleva, T.B.; Kozlov, V.S.; Nasrtdinov, I.M.; Pol’kin, V.V.; Terpugova, S.A.; Chernov, D.G. Estimation of Aerosol Radiation Effects under Background and Smoke-haze Atmospheric Conditions over Siberia from Empirical Data. Russ. Meteorol. Hydrol. 2016, 41, 104–111. [Google Scholar] [CrossRef]
  28. Zuev, V.E.; Krekov, G.M. Optical Models of the Atmosphere; Gidrometeoizdat: Leningrad, Russia, 1986. [Google Scholar]
  29. Terpugova, S.A.; Panchenko, M.V.; Kozlov, V.S. Estimation of the effect of black carbon on the single scattering albedo of submicron aerosol. In Proceedings of the Abstracts of European Aerosol Conference, Ghent, Belgium, 28 August–2 September 2005; p. 704. [Google Scholar]
  30. Hitzenberger, R.; Tohno, S. Comparison of black carbon (BC) aerosols in two urban areas–concentrations and size distributions. Atmos. Environ. 2001, 35, 2153–2167. [Google Scholar] [CrossRef]
  31. Reischl, G.P.; Majerovicz, A.; Ankilov, A.; Baklanov, A.; Eremenko, S.I.; Mavliev, R.A. Comparison of the Novosibirsk automated diffusion battery with Vienna electromobility spectrometer. J. Aerosol Sci. 1991, 22, 325–331. [Google Scholar] [CrossRef]
  32. Hőler, R.; Tohno, S.; Kasahara, M.; Hitzenberger, R. Long–term characterization of carboneous aerosol in Uji, Japan. Atmos. Environ. 2002, 36, 1267–1275. [Google Scholar] [CrossRef]
  33. Kristjansson, J.E. Studies of the aerosol indirect effect from sulfate and black carbon aerosols. J. Geophys. Res. 2002, 107. [Google Scholar] [CrossRef] [Green Version]
  34. Magi, B.I.; Hobbs, P.V.; Schmid, B.; Redemann, J. Vertical profiles of light scattering, light absorption and single scattering albedo during the dry, biomass burning season in southern Africa and comparisons of in-situ and remote sensing measurements of aerosol optical depth. J. Geophys. Res. 2003, 108, 8504. [Google Scholar] [CrossRef]
  35. Sheridan, P.J.; Arnott, W.P.; Ogren, J.A.; Andrews, E.; Atkinson, D.B.; Covert, D.S.; Moosmuller, H. The Reno Aerosol Optics Study: An evaluation of aerosol absorption measurement methods. Aerosol. Sci. Technol. 2005, 39, 1–16. [Google Scholar] [CrossRef] [Green Version]
  36. Tikhomirov, A.B.; Firsov, K.M.; Kozlov, V.S.; Panchenko, M.V.; Ponomarev, Y.N.; Tikhomirov, B.A. Investigation of spectral dependence of shortwave radiation absorption by ambient aerosol using time-resolved photoacoustic technique. Opt. Eng. 2005, 4, 071203. [Google Scholar] [CrossRef]
  37. Virkkula, A.; Ahlquist, N.C.; Covert, D.S.; Arnott, W.P.; Sheridan, P.J.; Quinn, P.K.; Coffman, D.J. Modification, calibration and a field test of an instrument for measuring light absorption by particles. Aerosol. Sci. Technol. 2005, 36, 68–83. [Google Scholar] [CrossRef]
  38. Bond, T.C.; Bergstrom, R.W. Light absorption by carbonaceous particles: An investigative review. Aerosol Sci. Technol. 2006, 40, 27–67. [Google Scholar] [CrossRef]
  39. Kecorius, S.; Madueño, L.; Vallar, E.; Alas, H.; Betito, G.; Birmili, W.; Cambaliza, M.O.; Catipay, G.; Gonzaga-Cayetano, M.; Galvez, M.C.; et al. Aerosol particle mixing state, refractory particle number size distributions and emission factors in a polluted urban environment: Case study of Metro Manila, Philippines. Atmos. Environ. 2017, 170, 169–183. [Google Scholar] [CrossRef]
  40. He, C.; Liou, K.-N.; Takano, Y.; Zhang, R.; Levy Zamora, M.; Yang, P.; Li, Q.; Leung, L.R. Variation of the radiative properties during black carbon aging: Theoretical and experimental intercomparison. Atmos. Chem. Phys. 2015, 15, 11967–11980. [Google Scholar] [CrossRef]
  41. Bauer, S.E.; Menon, S.; Koch, D.; Bond, T.C.; Tsigaridis, K. A global modeling study on carbonaceous aerosol microphysical characteristics and radiative effects. Atmos. Chem. Phys. 2010, 10, 7439–7456. [Google Scholar] [CrossRef] [Green Version]
  42. Kozlov, V.S.; Shmargunov, V.P.; Panchenko, M.V.; Chernov, D.G.; Kozlov, A.S.; Malyshkin, S.B. Seasonal variability of Black Carbon size distribution in the atmospheric aerosol. Russ. Phys. J. 2016, 58, 1804–1810. [Google Scholar] [CrossRef]
  43. Kozlov, V.S.; Shmargunov, V.P.; Panchenko, M.V. Modified aethalometer for monitoring of black carbon concentration in atmospheric aerosol and technique for correction of the spot loading effect. Proceed. SPIE 2016, 10035, 1003530. [Google Scholar] [CrossRef]
  44. Available online: http://aerosol.iao.ru (accessed on 17 April 2018).
  45. Panchenko, M.V.; Terpugova, S.A.; Kozlov, V.S.; Pol’kin, V.V.; Yausheva, E.P. Annual behavior of the condensation activity of submicron aerosol in the atmospheric surface layer of Western Siberia. Atmos. Ocean. Opt. 2005, 18, 607–611. [Google Scholar]
  46. Gassfio, S.; Hegg, D.A.; Covert, D.S.; Noone, K.J.; Ostrom, E.; Schmid, B.; Russell, P.B.; Livingston, J.M.; Durkee, P.A.; Jonsson, H.H. Influence of humidity on the aerosol scattering coeffcient and its effect on the upwelling radiance during ACE-2. Tellus 2000, 52B, 546–567. [Google Scholar] [CrossRef]
  47. Meszaros, A. On the concentration and size distribution of atmospheric sulfate particles under rural conditions. Atmos. Environ. 1978, 12, 2425–2428. [Google Scholar] [CrossRef]
  48. Laktionov, A.G. Equilibrium Heterogeneous Condensation; Gidrometeoizdat: Leningrad, Russia, 1988. [Google Scholar]
  49. Wang, Z.; Cheng, Y.; Ma, N.; Mikhailov, E.; Pöschl, U.; Su, H. Dependence of the hygroscopicity parameter κ on particle size, humidity and solute concentration: Implications for laboratory experiments, field measurements and model studies. Atmos. Chem. Phys. Discuss. 2017. [Google Scholar] [CrossRef]
  50. Gruzdev, A.N.; Isakov, A.A.; Shukurova, L.M. Analysis of relationship between condensation activity of surface aerosol and its chemical composition and relative air humidity according to measurements at the Zvenigorod Scientific Station. Atmos. Ocean Opt. 2014, 27, 169–175. [Google Scholar] [CrossRef]
  51. Isakov, A.A.; Tikhonov, A.V. Relationship between aerosol parameters and air masses in central Russia. Atmos. Ocean Opt. 2014, 27, 475–478. [Google Scholar] [CrossRef]
  52. Terpugova, S.A.; Panchenko, M.V.; Sviridenkov, M.A.; Dokukina, T.A. Relationships between optical and microphysical parameters of the near-ground aerosol condensation variability. Atmos. Oceanic Opt. 2009, 22, 405–412. [Google Scholar] [CrossRef]
  53. Panchenko, M.V.; Polkin, V.V.; Terpugova, S.A.; Uzhegov, V.N.; Pkhalagov, Y.A. Testing the algorithms for taking into account relative humidity of air in the model of optical characteristics of absorbing aerosol. Proceed. SPIE 2015, 9680, 96802R. [Google Scholar] [CrossRef]
  54. Uzhegov, V.N.; Kabanov, D.M.; Pkhalagov, Y.A.; Sakerin, S.M. Correlation between variations of aerosol extinction of visible and IR radiation in the near-ground layer and atmospheric column. Atmos. Ocean. Opt. 2009, 22, 338–345. [Google Scholar] [CrossRef]
  55. Sakerin, S.M.; Beresnev, S.A.; Kabanov, D.M.; Kornienko, G.I.; Nikolashkin, S.V.; Poddubny, V.A.; Tashchilin, M.A.; Turchinovich, Y.S.; Holben, B.N.; Smirnov, A. Analysis of Approaches to Modeling the Annual and Spectral Behaviors of Atmospheric Aerosol Optical Depth in Siberia and Primorye. Atmos. Ocean. Opt. 2015, 28, 145–157. [Google Scholar] [CrossRef]
  56. Kabanov, D.M.; Beresnev, S.A.; Gorda, S.Yu.; Holben, B.N.; Kornienko, G.I.; Nikolashkin, S.V.; Sakerin, S.M.; Smirnov, A.; Taschilin, M.A. Annual behavior of the aerosol optical depth in some regions of Asian part of Russia. Proceed. SPIE 2014, 9292, 929241. [Google Scholar]
  57. Kabanov, D.M.; Zhamsueva, G.S.; Zayakhanov, A.S.; Kornienko, G.I.; Naguslaev, S.A.; Pavlov, A.N.; Panchenko, M.V.; Pestunov, D.A.; Sakerin, S.M.; Shmirko, K.A. About results of two-site measurements of the aerosol optical depth of the atmosphere in certain regions of Russia. Atmos. Ocean. Opt. 2016, 29, 960–971. [Google Scholar]
  58. Sakerin, S.M.; Kabanov, D.M. Spectral dependence of the atmosphere aerosol optical depth near 0.37–4 μm. Atmos. Ocean. Opt. 2007, 20, 141–149. [Google Scholar]
  59. Tomsk, Version 3, Level 2.0. Available online: https://aeronet.gsfc.nasa.gov (accessed on 12 March 2018).
Figure 1. Distributions of the angular scattering coefficient (a,b) and mass concentration of absorbing substance (black carbon) (c,d) at different altitudes in summer (a,c) and winter (b,d).
Atmosphere 09 00414 g001aAtmosphere 09 00414 g001b
Figure 2. Schematic presentation of absorbing matter distribution within the total distribution of aerosol particles.
Atmosphere 09 00414 g002
Figure 3. Monthly average size distributions of the absorbing matter in 2016 (a) and temporal dynamics of the absorbing matter median diameter Dm in 2014–2016 (b) (solid curves are monthly average values at 30-day smoothing; dots show the daily average values).
Atmosphere 09 00414 g003aAtmosphere 09 00414 g003b
Figure 4. Measured and computed spectral dependences of the aerosol extinction coefficients.
Atmosphere 09 00414 g004
Figure 5. Comparison of the values of aerosol optical depth (AOD) computed using the presented model with the results of sun-photometer measurements in Tomsk in 1995–2013 in summer (a) and winter (b) [27,28].
Atmosphere 09 00414 g005
Figure 6. Vertical profiles of the single scattering albedo in summer and winter at different wavelengths at different median radii of the absorbing substance size distribution.
Atmosphere 09 00414 g006aAtmosphere 09 00414 g006b
Figure 7. Vertical profiles of the asymmetry factor in summer and winter at different wavelengths at different median radii of the absorbing substance size distribution.
Atmosphere 09 00414 g007
Table 1. Parameters of lognormal distributions of the submicron (A) and coarse (B) fractions.
Winter
Fraction A
H (km)rAνAVA × 1012nχ
00.0930.816.82741.50
0.50.0930.83.86441.50
10.0930.82.09381.50
20.0930.81.06451.50
30.0930.80.65741.50
40.0930.80.54871.50
50.0930.80.53571.50
Fraction B
H (km)rBνBVB × 1012nχ
03.630.7520.05531.5030.00685
0.51.7740.751.84541.5030.0086
11.7780.751.2171.50150.0038
21.7860.750.88091.5010.003
31.7940.750.61751.5020.0042
41.8020.750.51541.5020.0044
51.810.750.50321.5020.0042
Summer
Fraction A
H (km)rAνAVA × 1012nχ
00.0990.89.00961.50
0.50.0780.89.431.50
10.0780.87.661.50
20.0780.83.221.50
30.0780.81.6081.50
40.0780.81.111.50
50.0780.80.9321.50
Fraction B
H (km)rBνBVB × 1012nχ
02.0780.655.82151.50110.00266
0.51.8030.657.96391.50040.000937
11.7970.656.26871.50040.001
21.7840.652.46491.50070.00164
31.7710.651.19611.50070.00163
41.7580.650.73041.50100.00237
51.7450.650.56251.50110.0027
Table 2. Relative humidity and refractive indices of fraction at different altitudes in winter and summer.
Summer
Altitude (km)RH (%)Fraction AFraction BFraction C
rBC = 0.04 μmrBC = 0.08 μmrBC = 0.17 μm
nχnχnχnχnχ
0721.45101.5010.00271.5260.0881.4680.0171.4390.021
0.5701.43501.5000.000941.4880.0151.4390.0061.4090.012
1751.42501.500.0011.4840.0191.4290.0061.4000.011
2711.43301.500.00161.4930.0291.4390.0091.4100.019
3691.43701.500.0161.4940.0291.4430.0091.4140.019
4621.44701.500.0241.5010.0381.4540.0131.4280.028
5531.45701.5010.0271.5060.0411.4650.0151.4410.033
Winter
Altitude (km)RH (%)Fraction AFraction BFraction C
rBC = 0.046 μmrBC = 0.095 μmrBC = 0.19 μm
nχnχnχnχnχ
0841.41301.5030.00681.54130.18841.43040.04701.510.163
0.5781.41101.5030.00861.50120.09351.41830.02291.40100.0321
1721.42401.5010.00381.49360.05341.42830.01441.41020.0269
2621.43901.5010.0031.50650.06451.44670.01931.42960.0368
3611.44101.5020.00421.52240.10231.45280.03091.43980.0589
4601.44201.5020.00441.52450.10591.45460.03221.44230.0617
5501.45301.5020.00421.52870.10531.46650.03421.45660.0674

