Effects of Atmospheric Dry Deposition on External Nitrogen Supply and New Production in the Northern South China Sea


Abstract
1. Introduction
2. Methodology
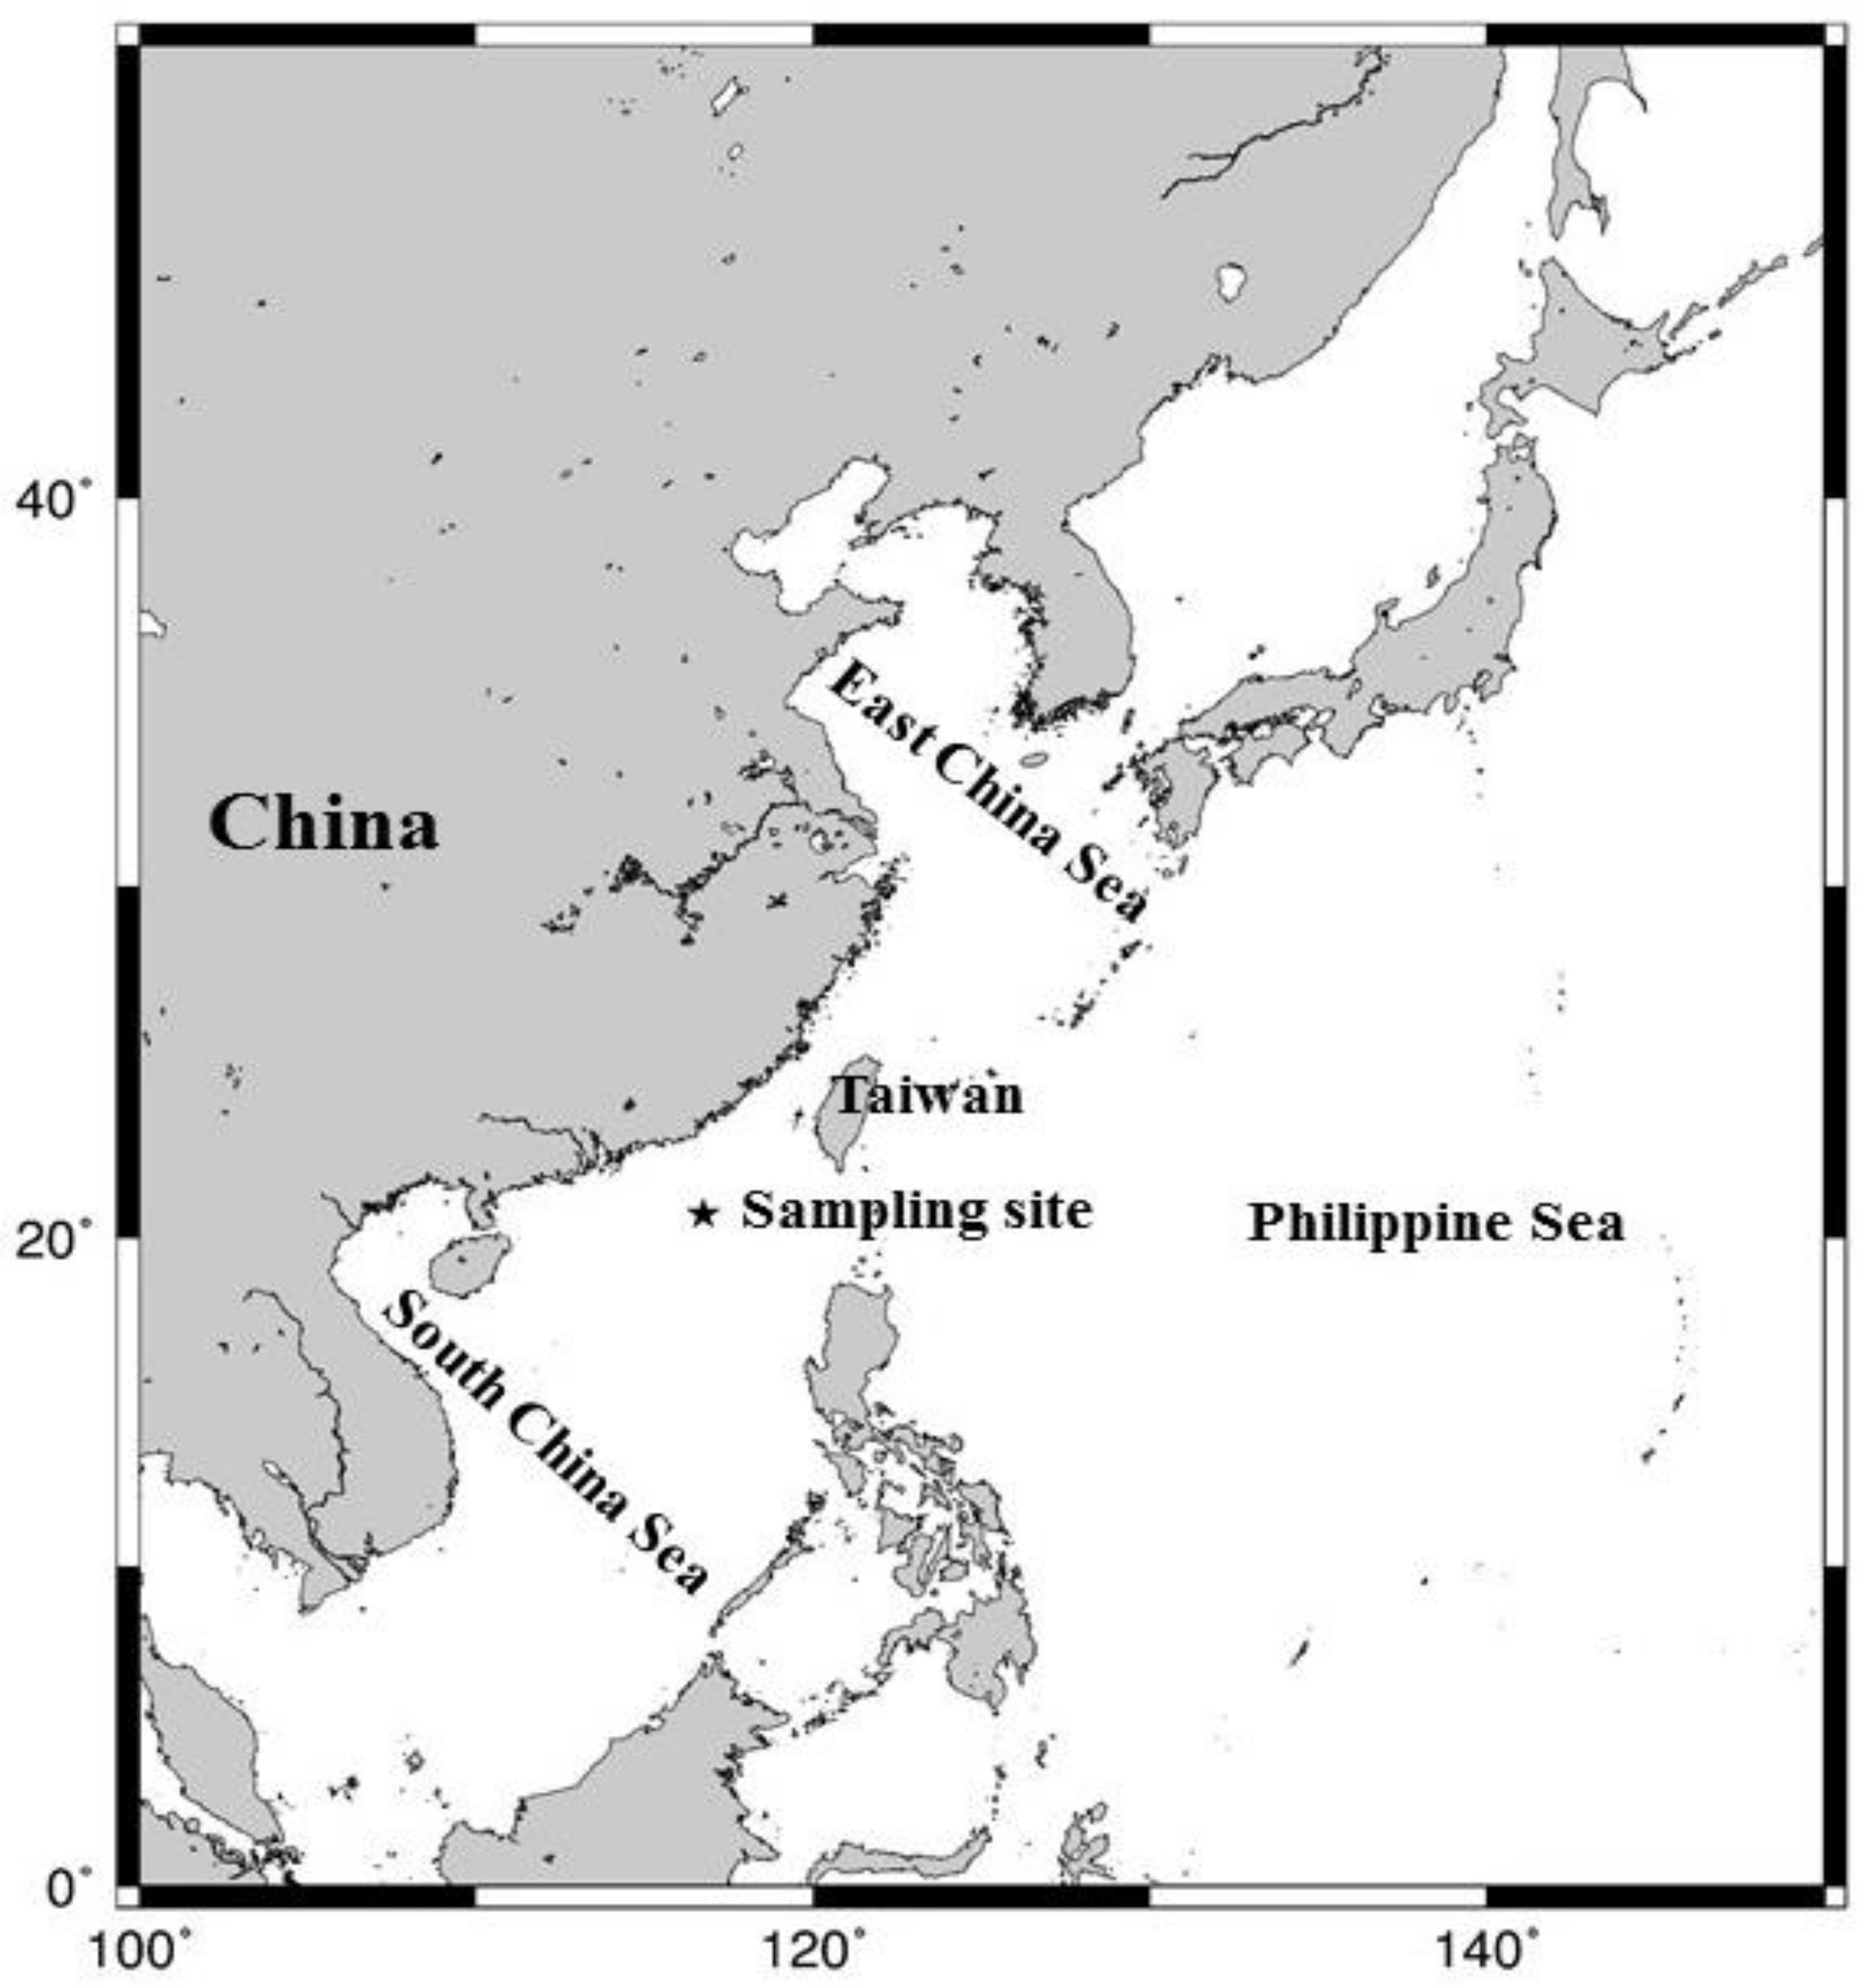
2.1. Sampling
2.2. Chemical Analysis
3. Results and Discussion
3.1. Meteorological Characteristics and Air Masses
- (1)
- Northern sources: air masses originating from inland and north-eastern China that are transported by the north-east monsoon.
- (2)
- Southern sources: air masses originating from the Indochinese Peninsula and SCS that are transported by the south-west monsoon.
- (3)
- Marine sources: air masses originating from high-pressure areas over the Pacific Ocean that do not pass over land.
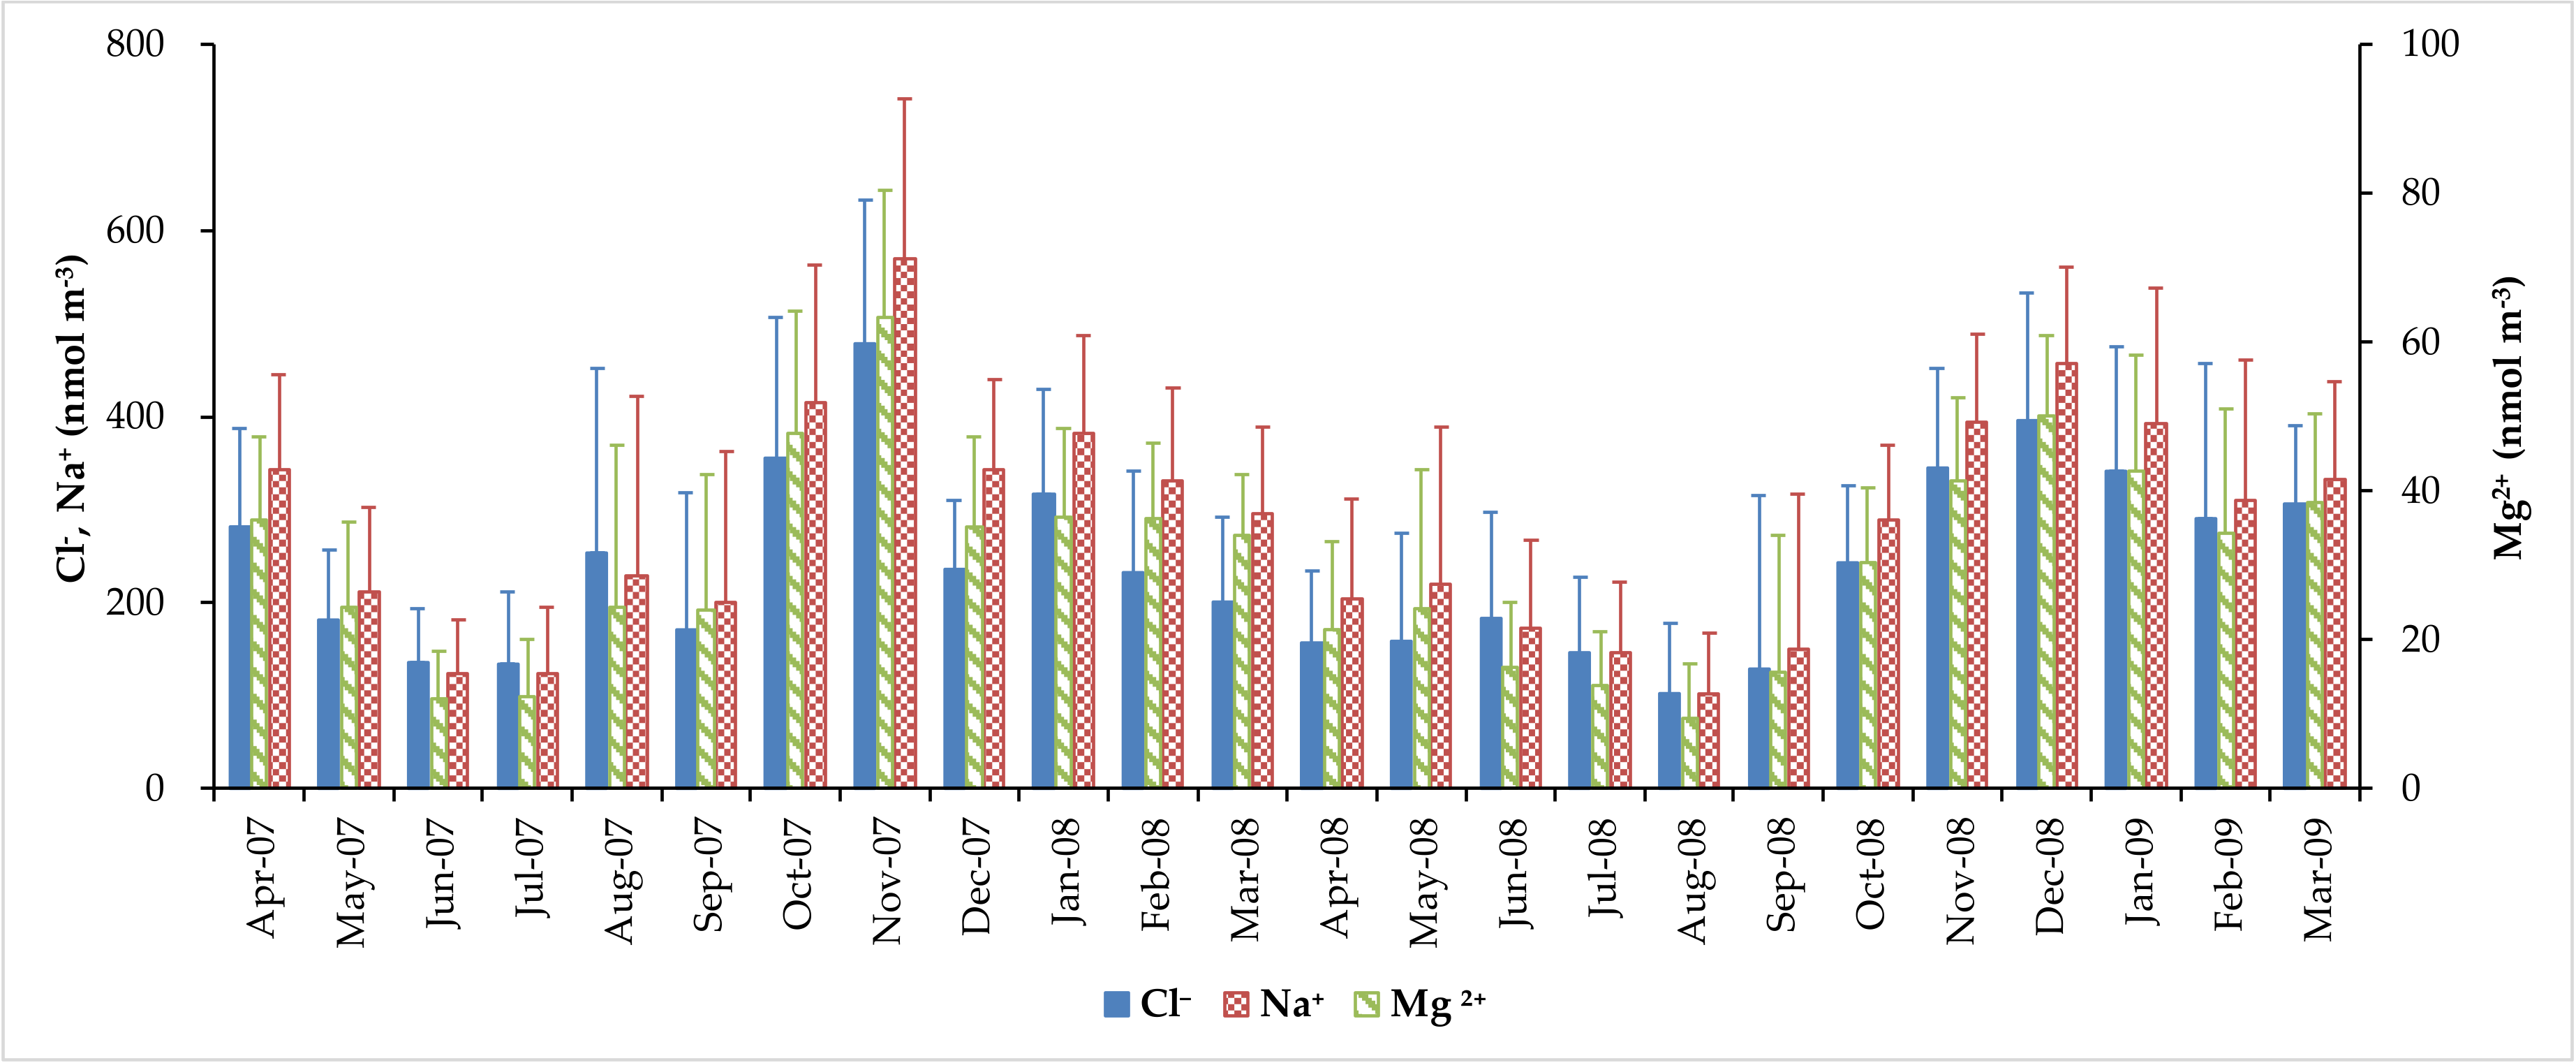
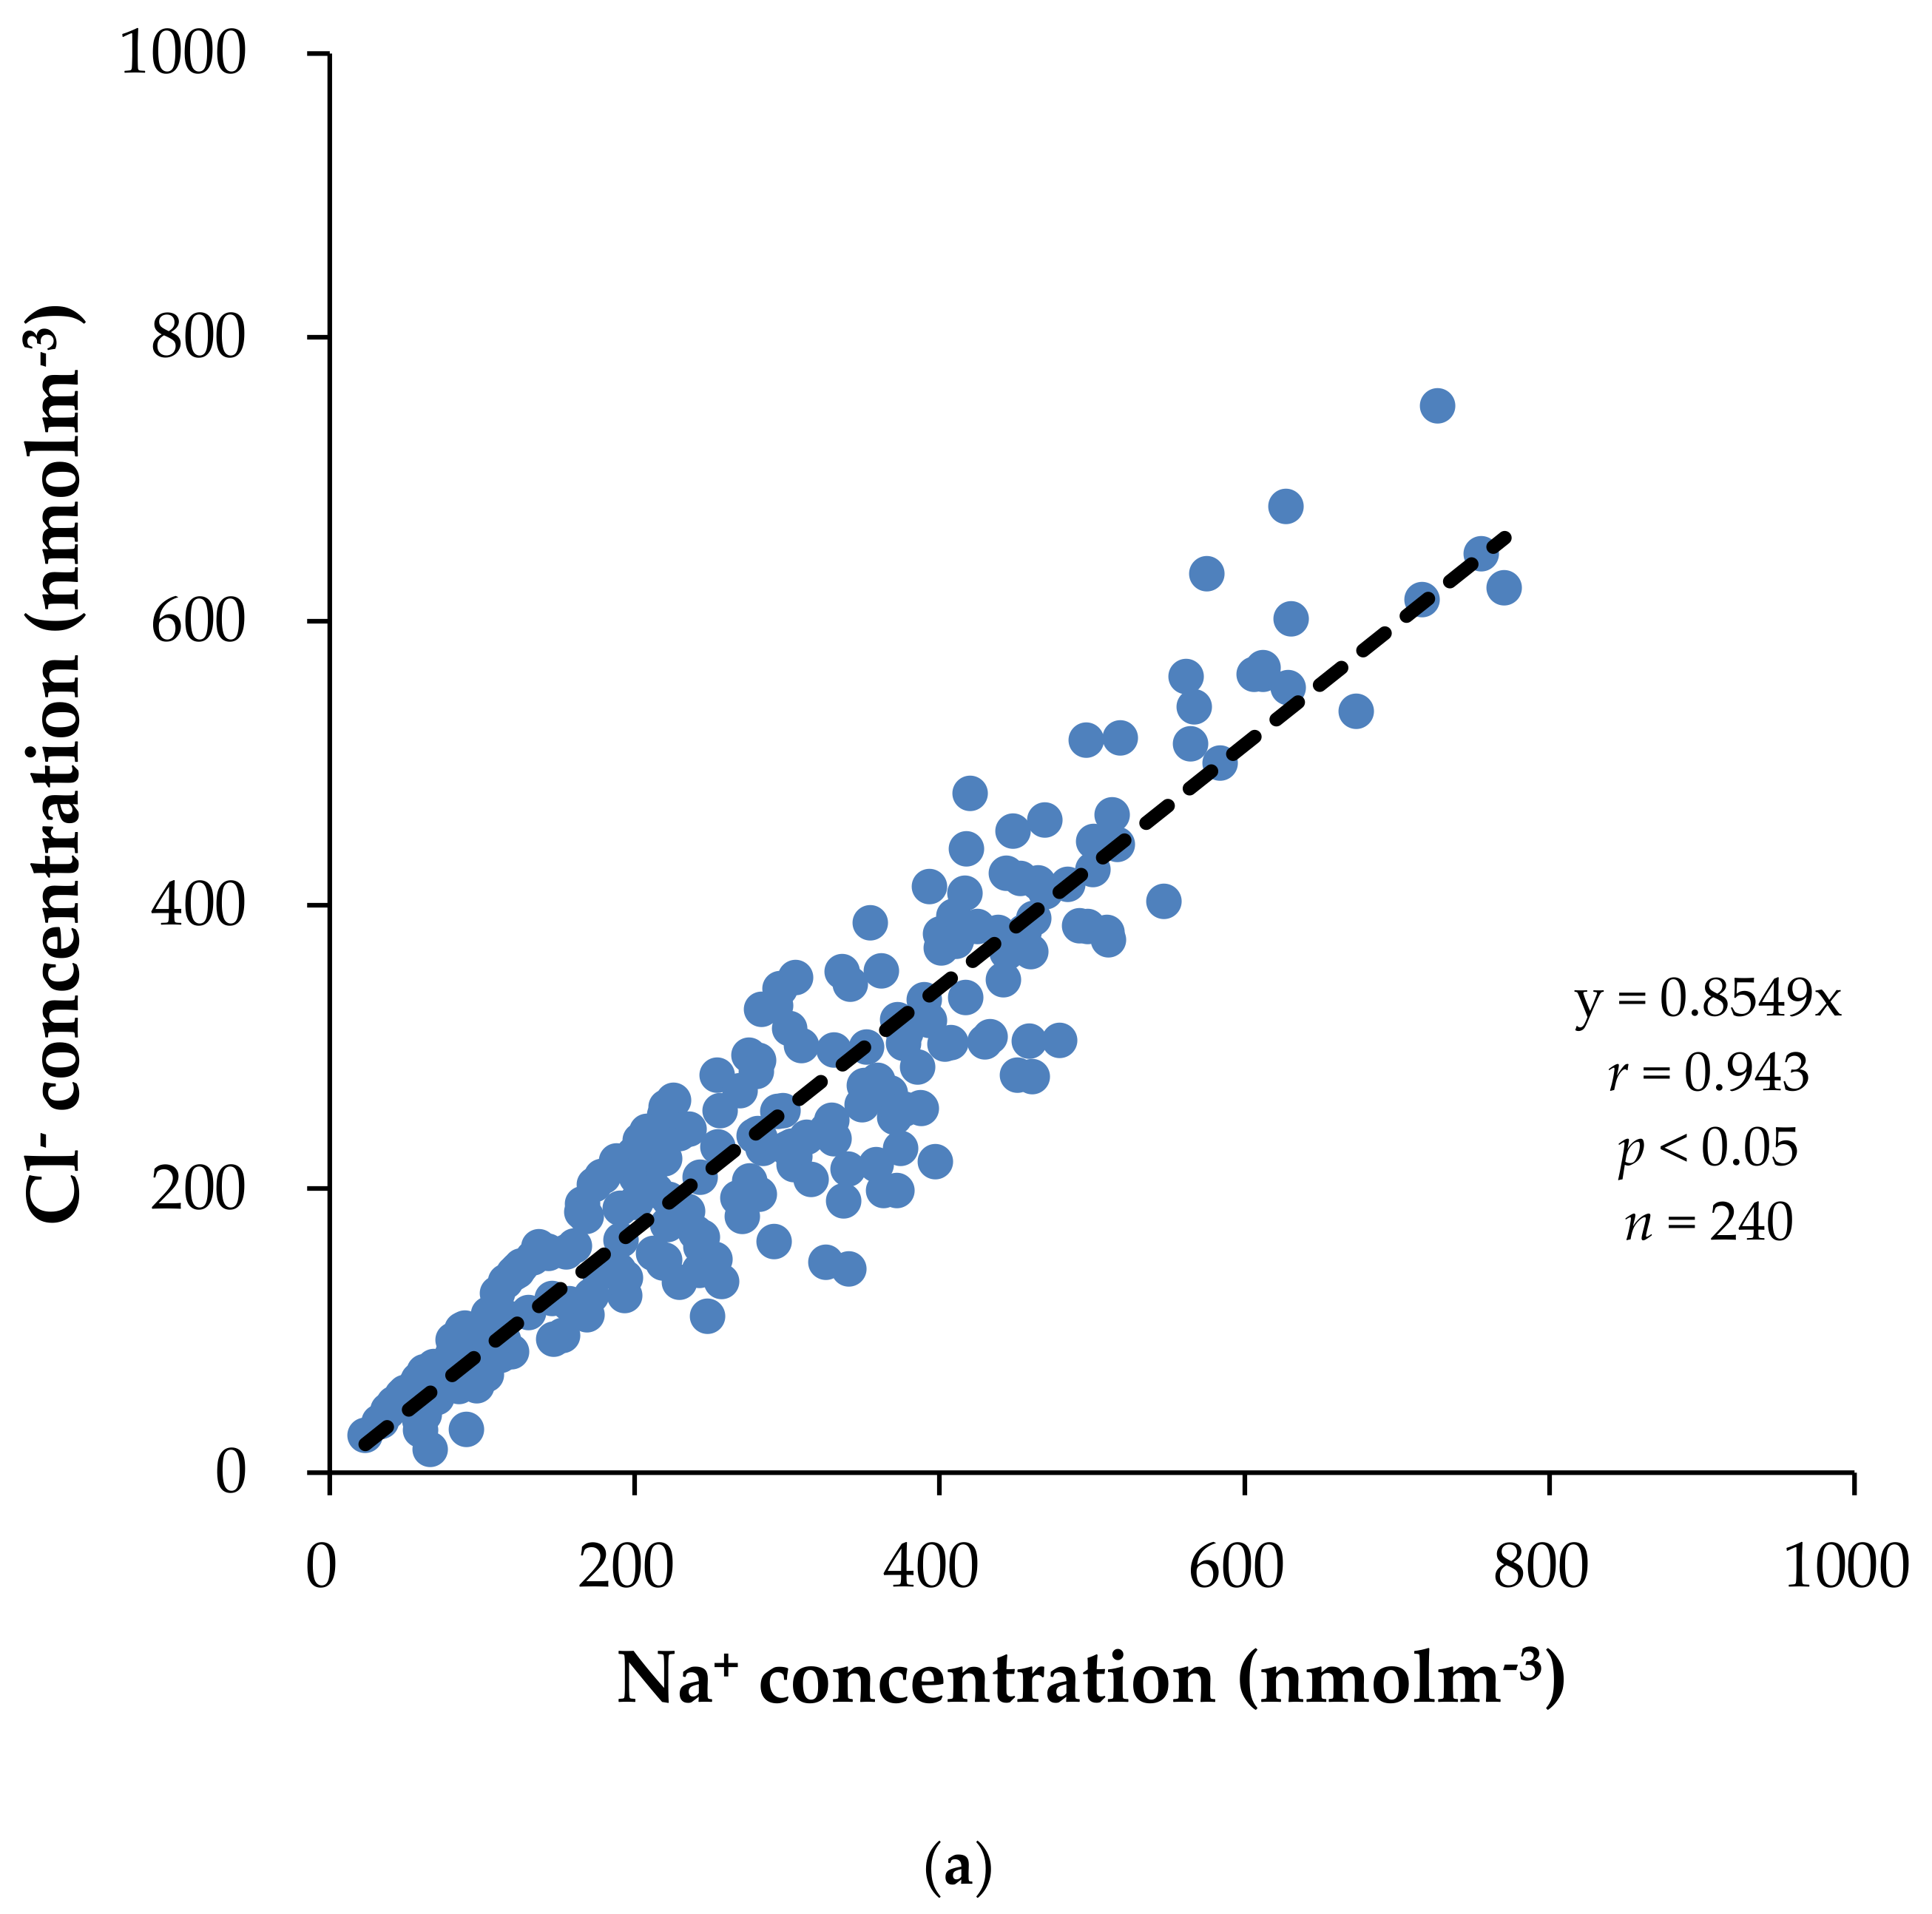
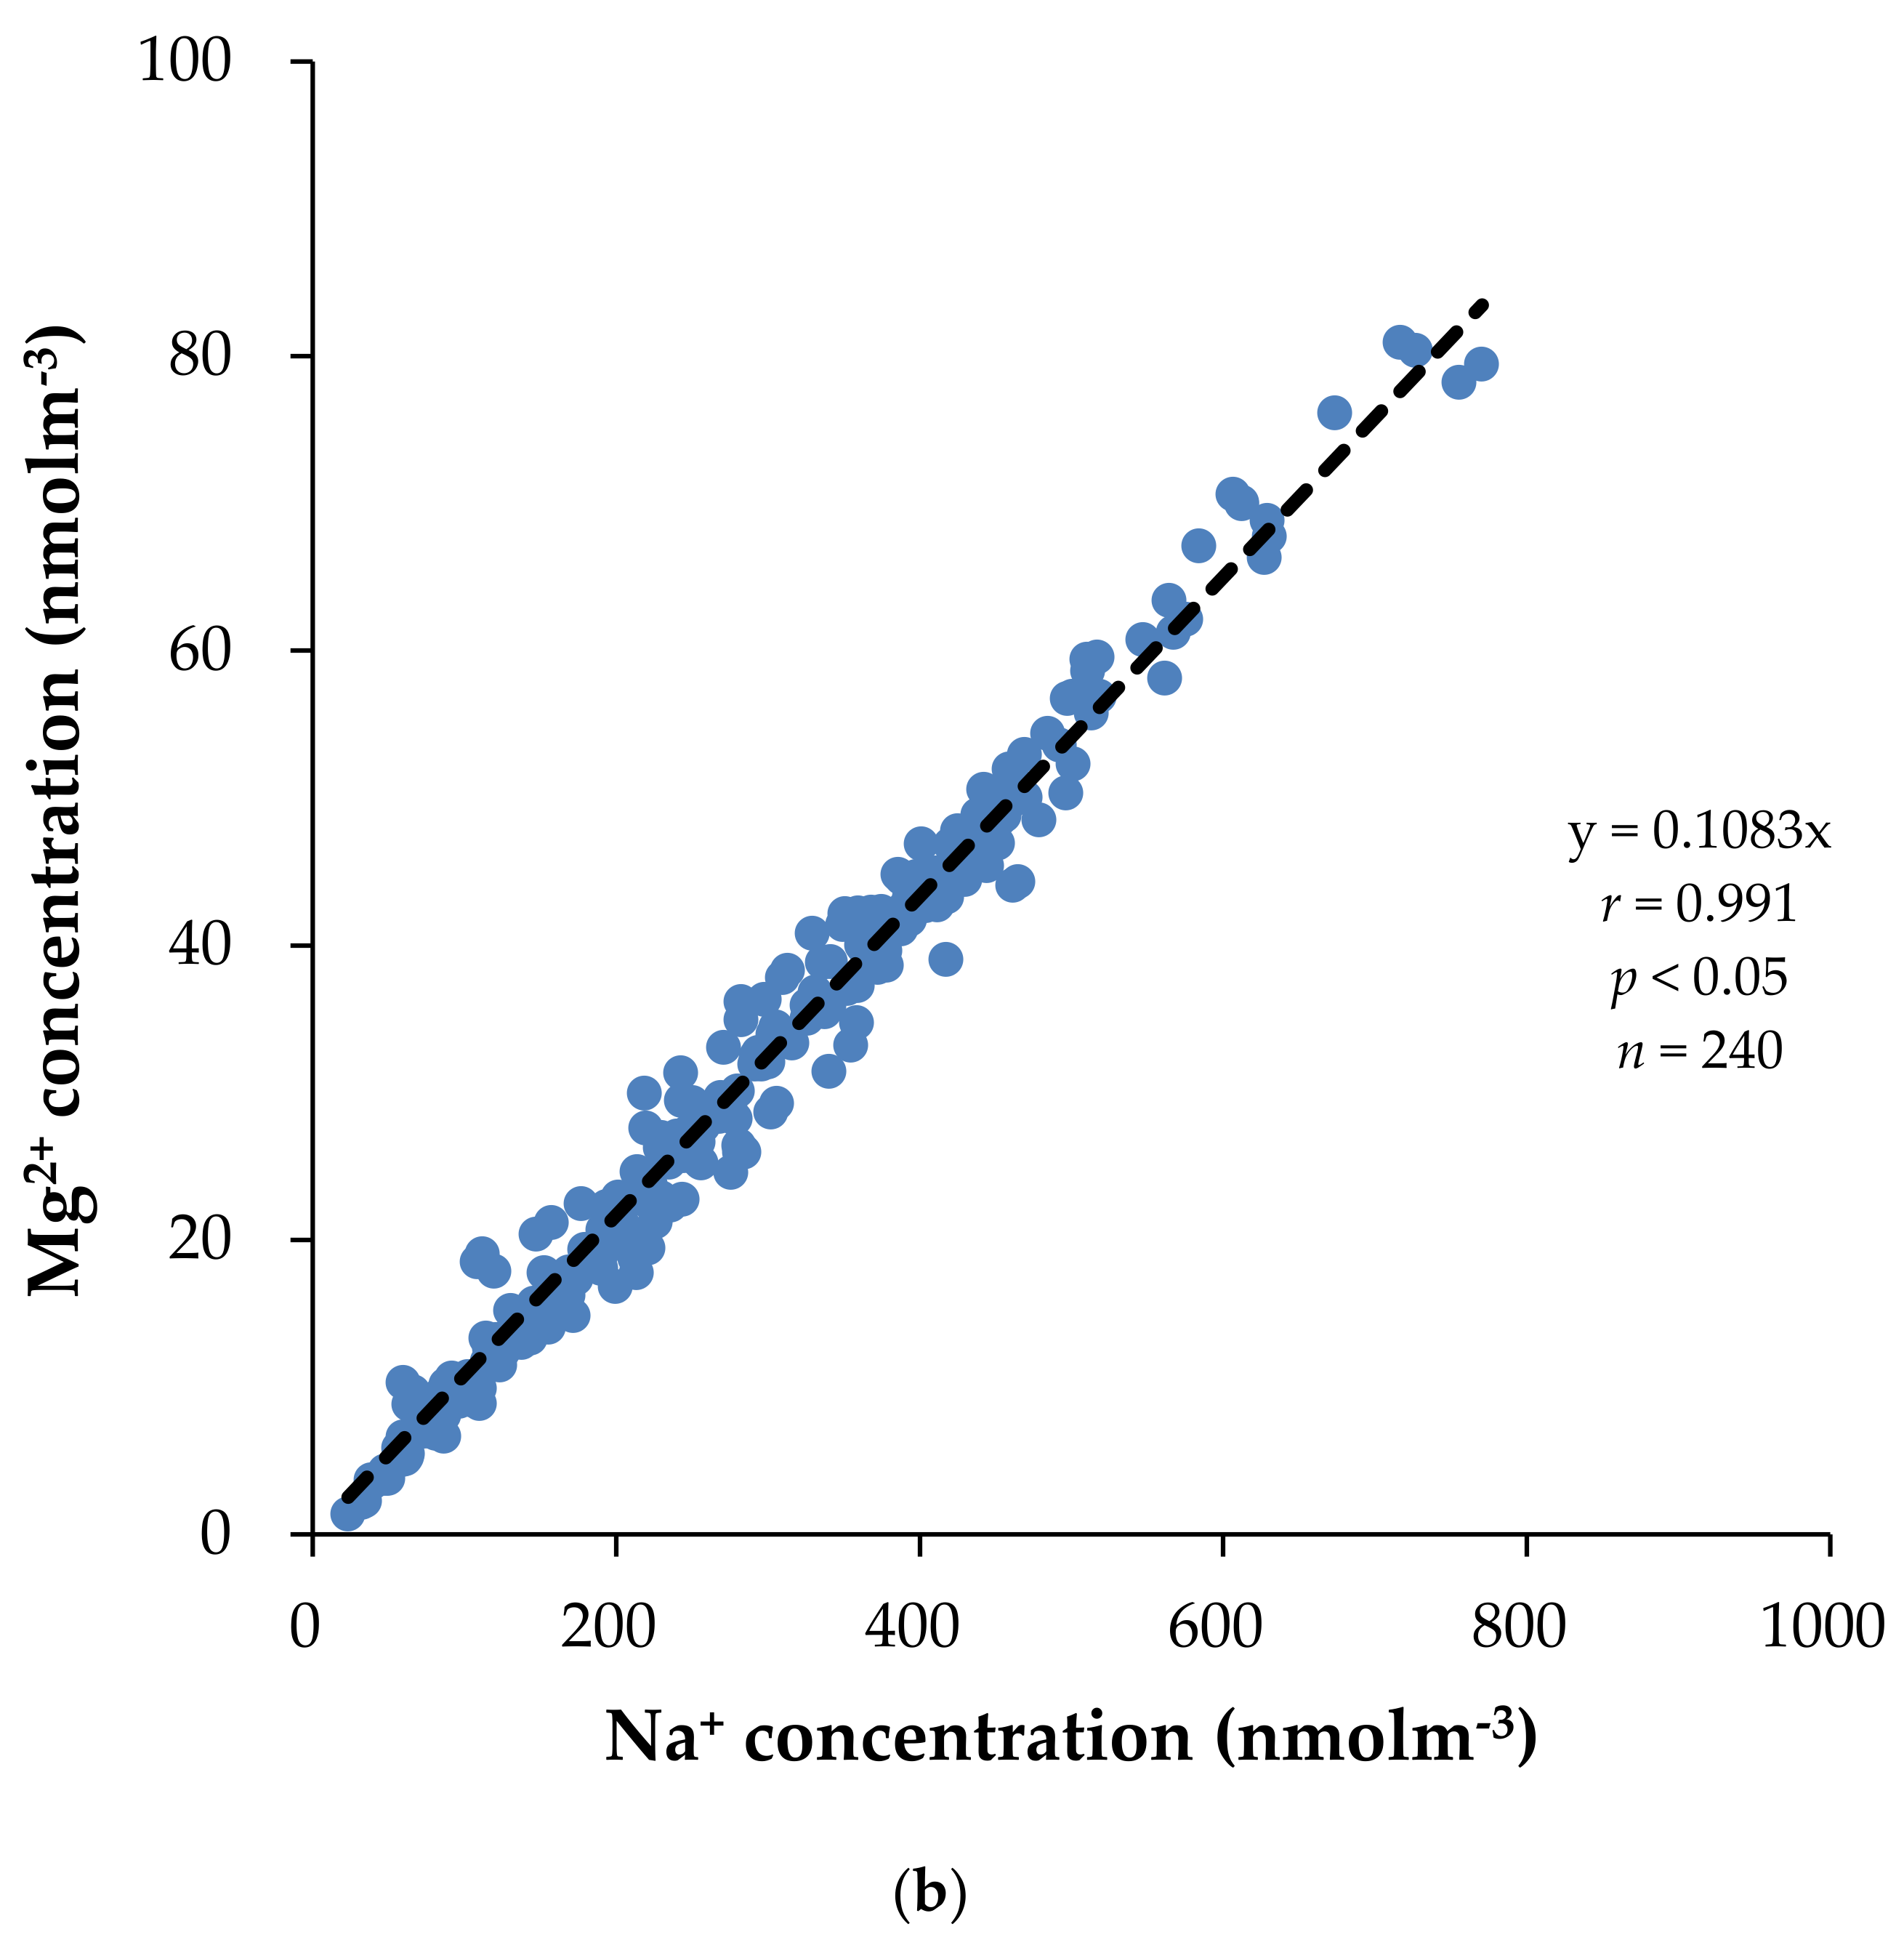
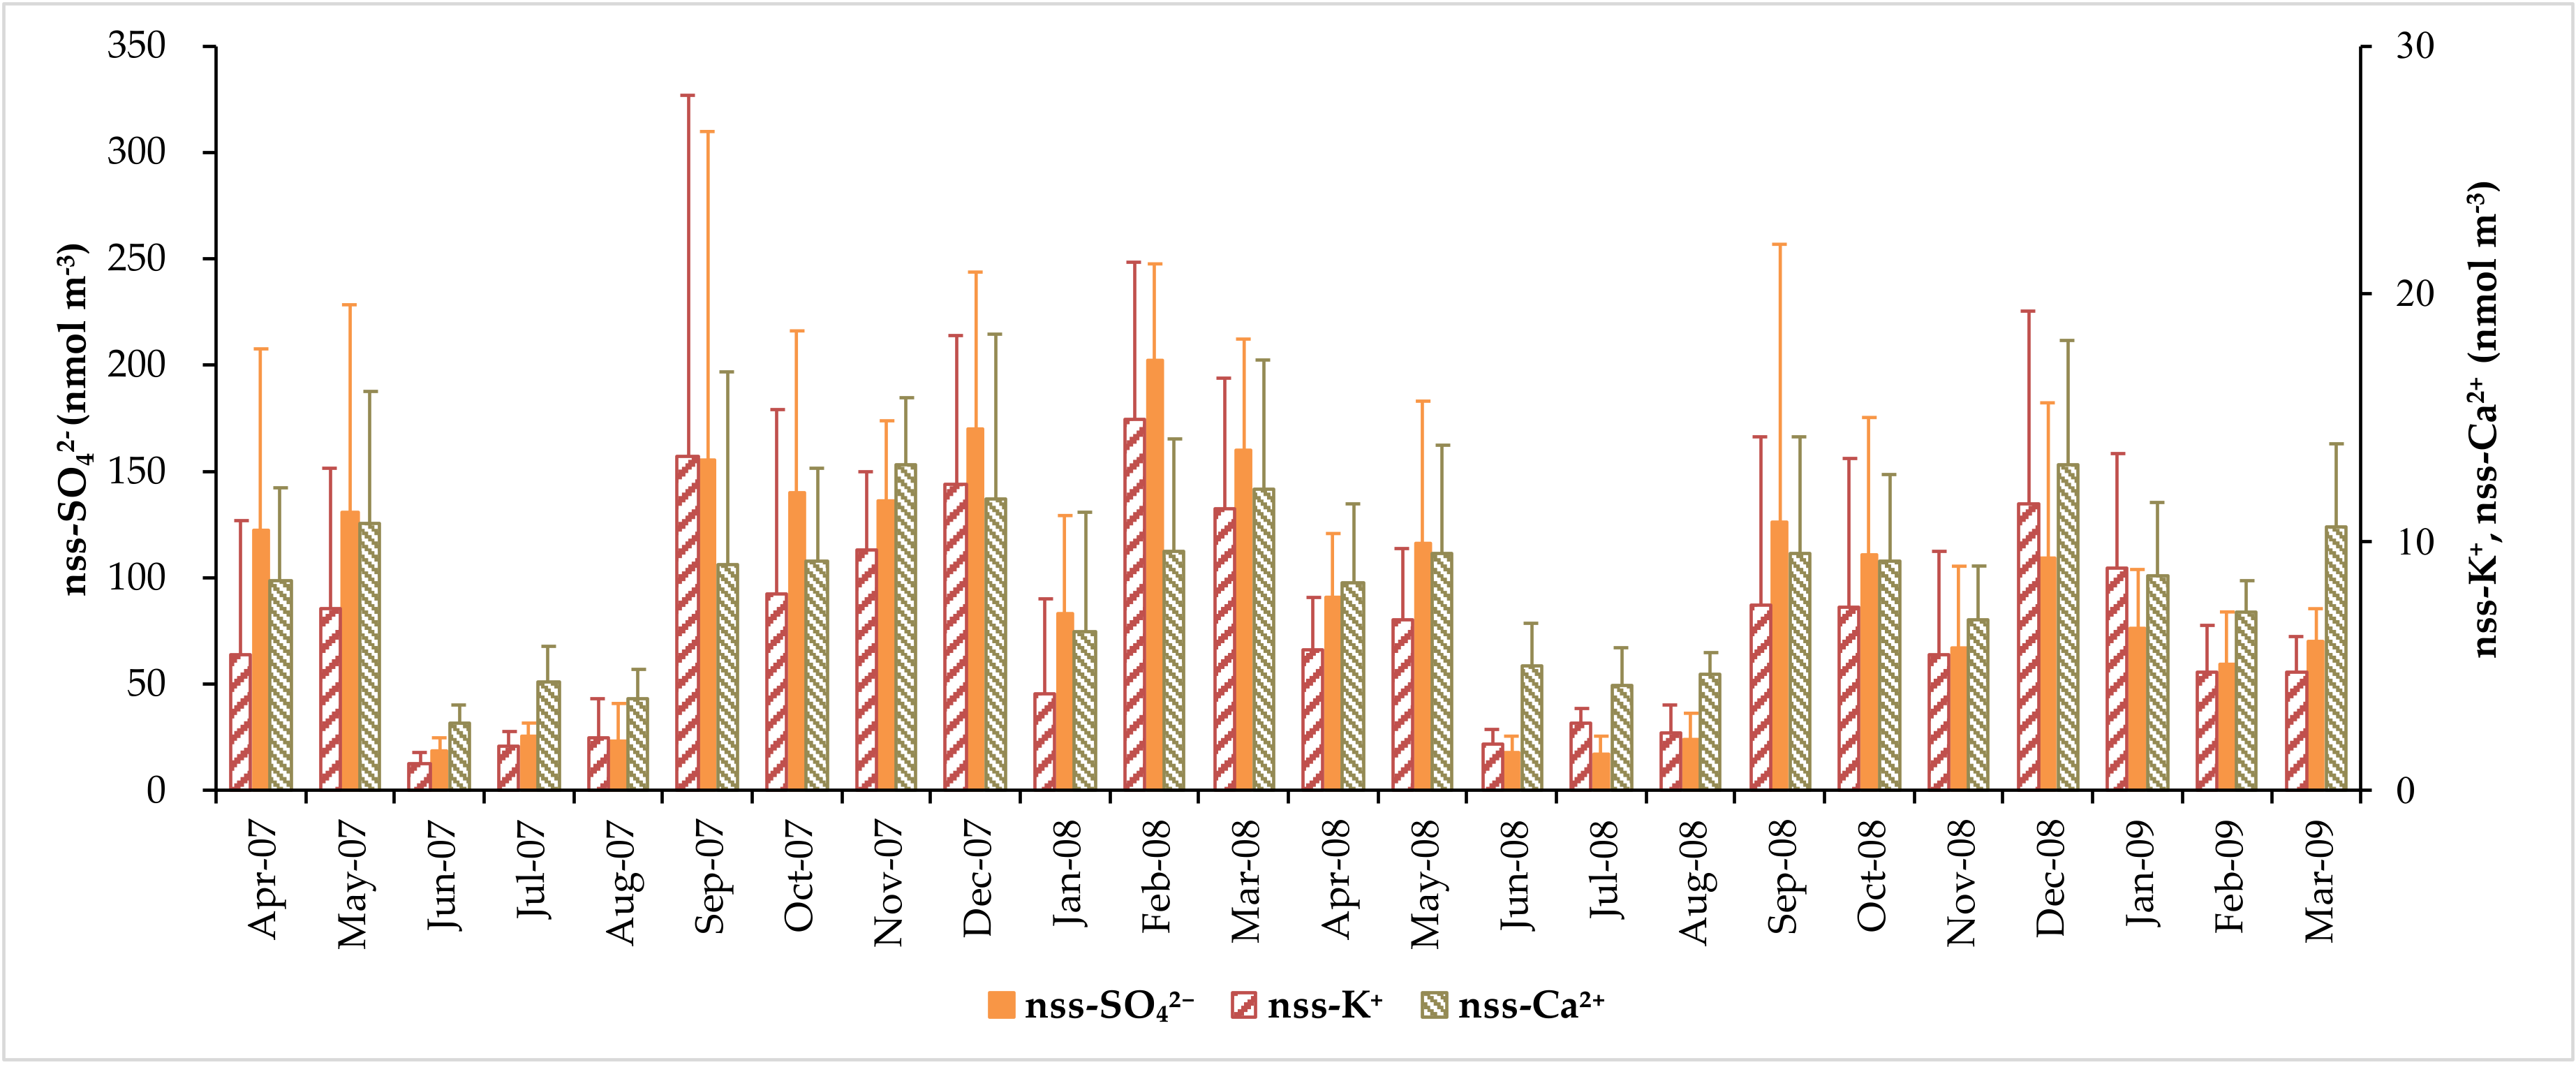
3.2. Concentration of Major Water-Soluble Ions
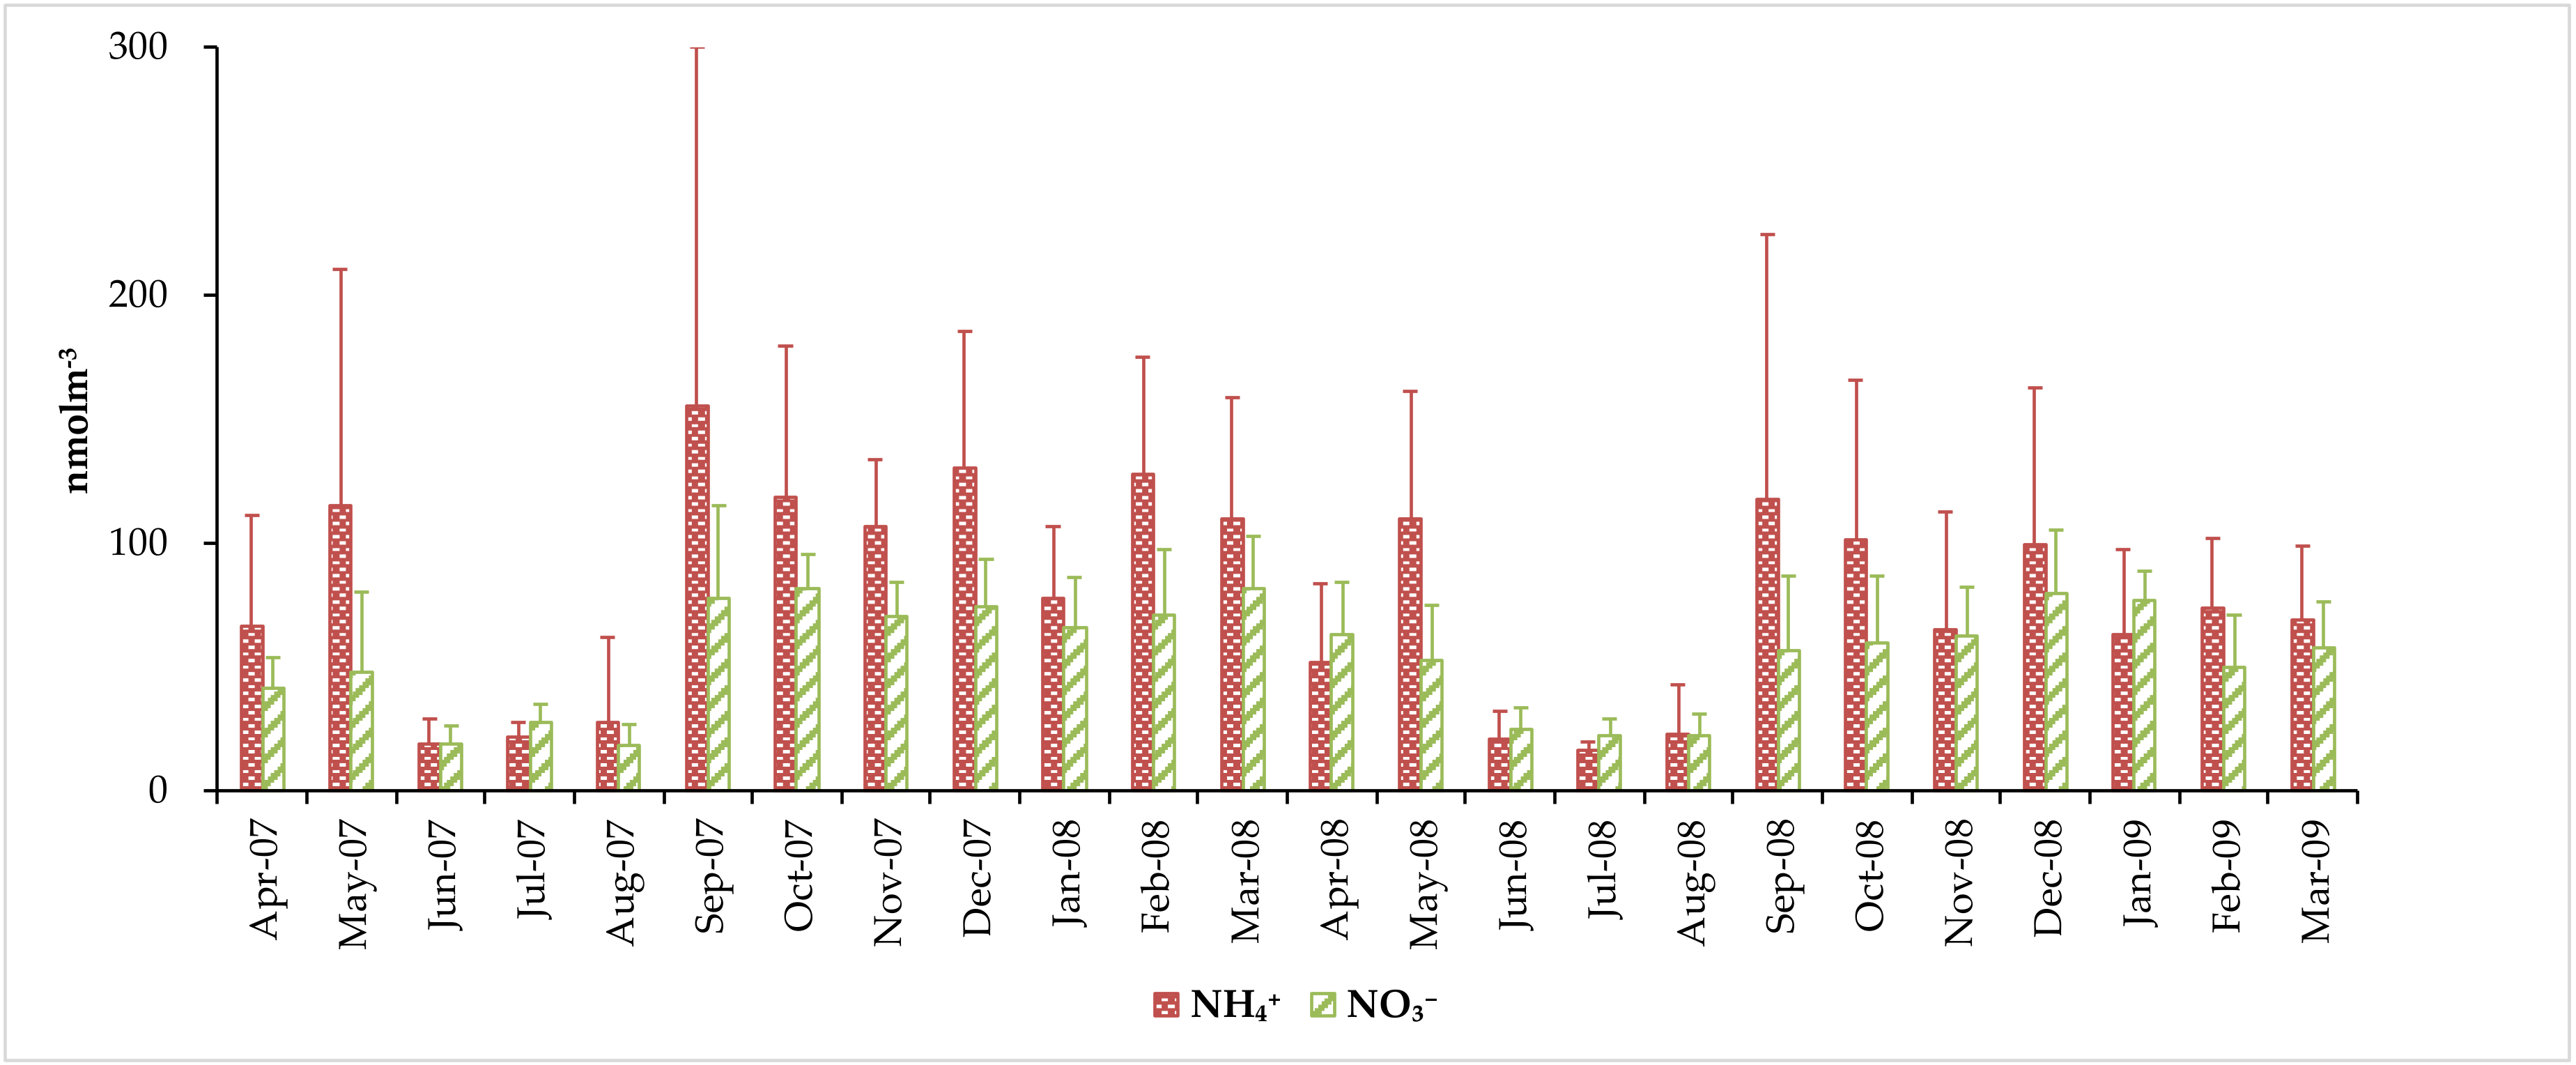
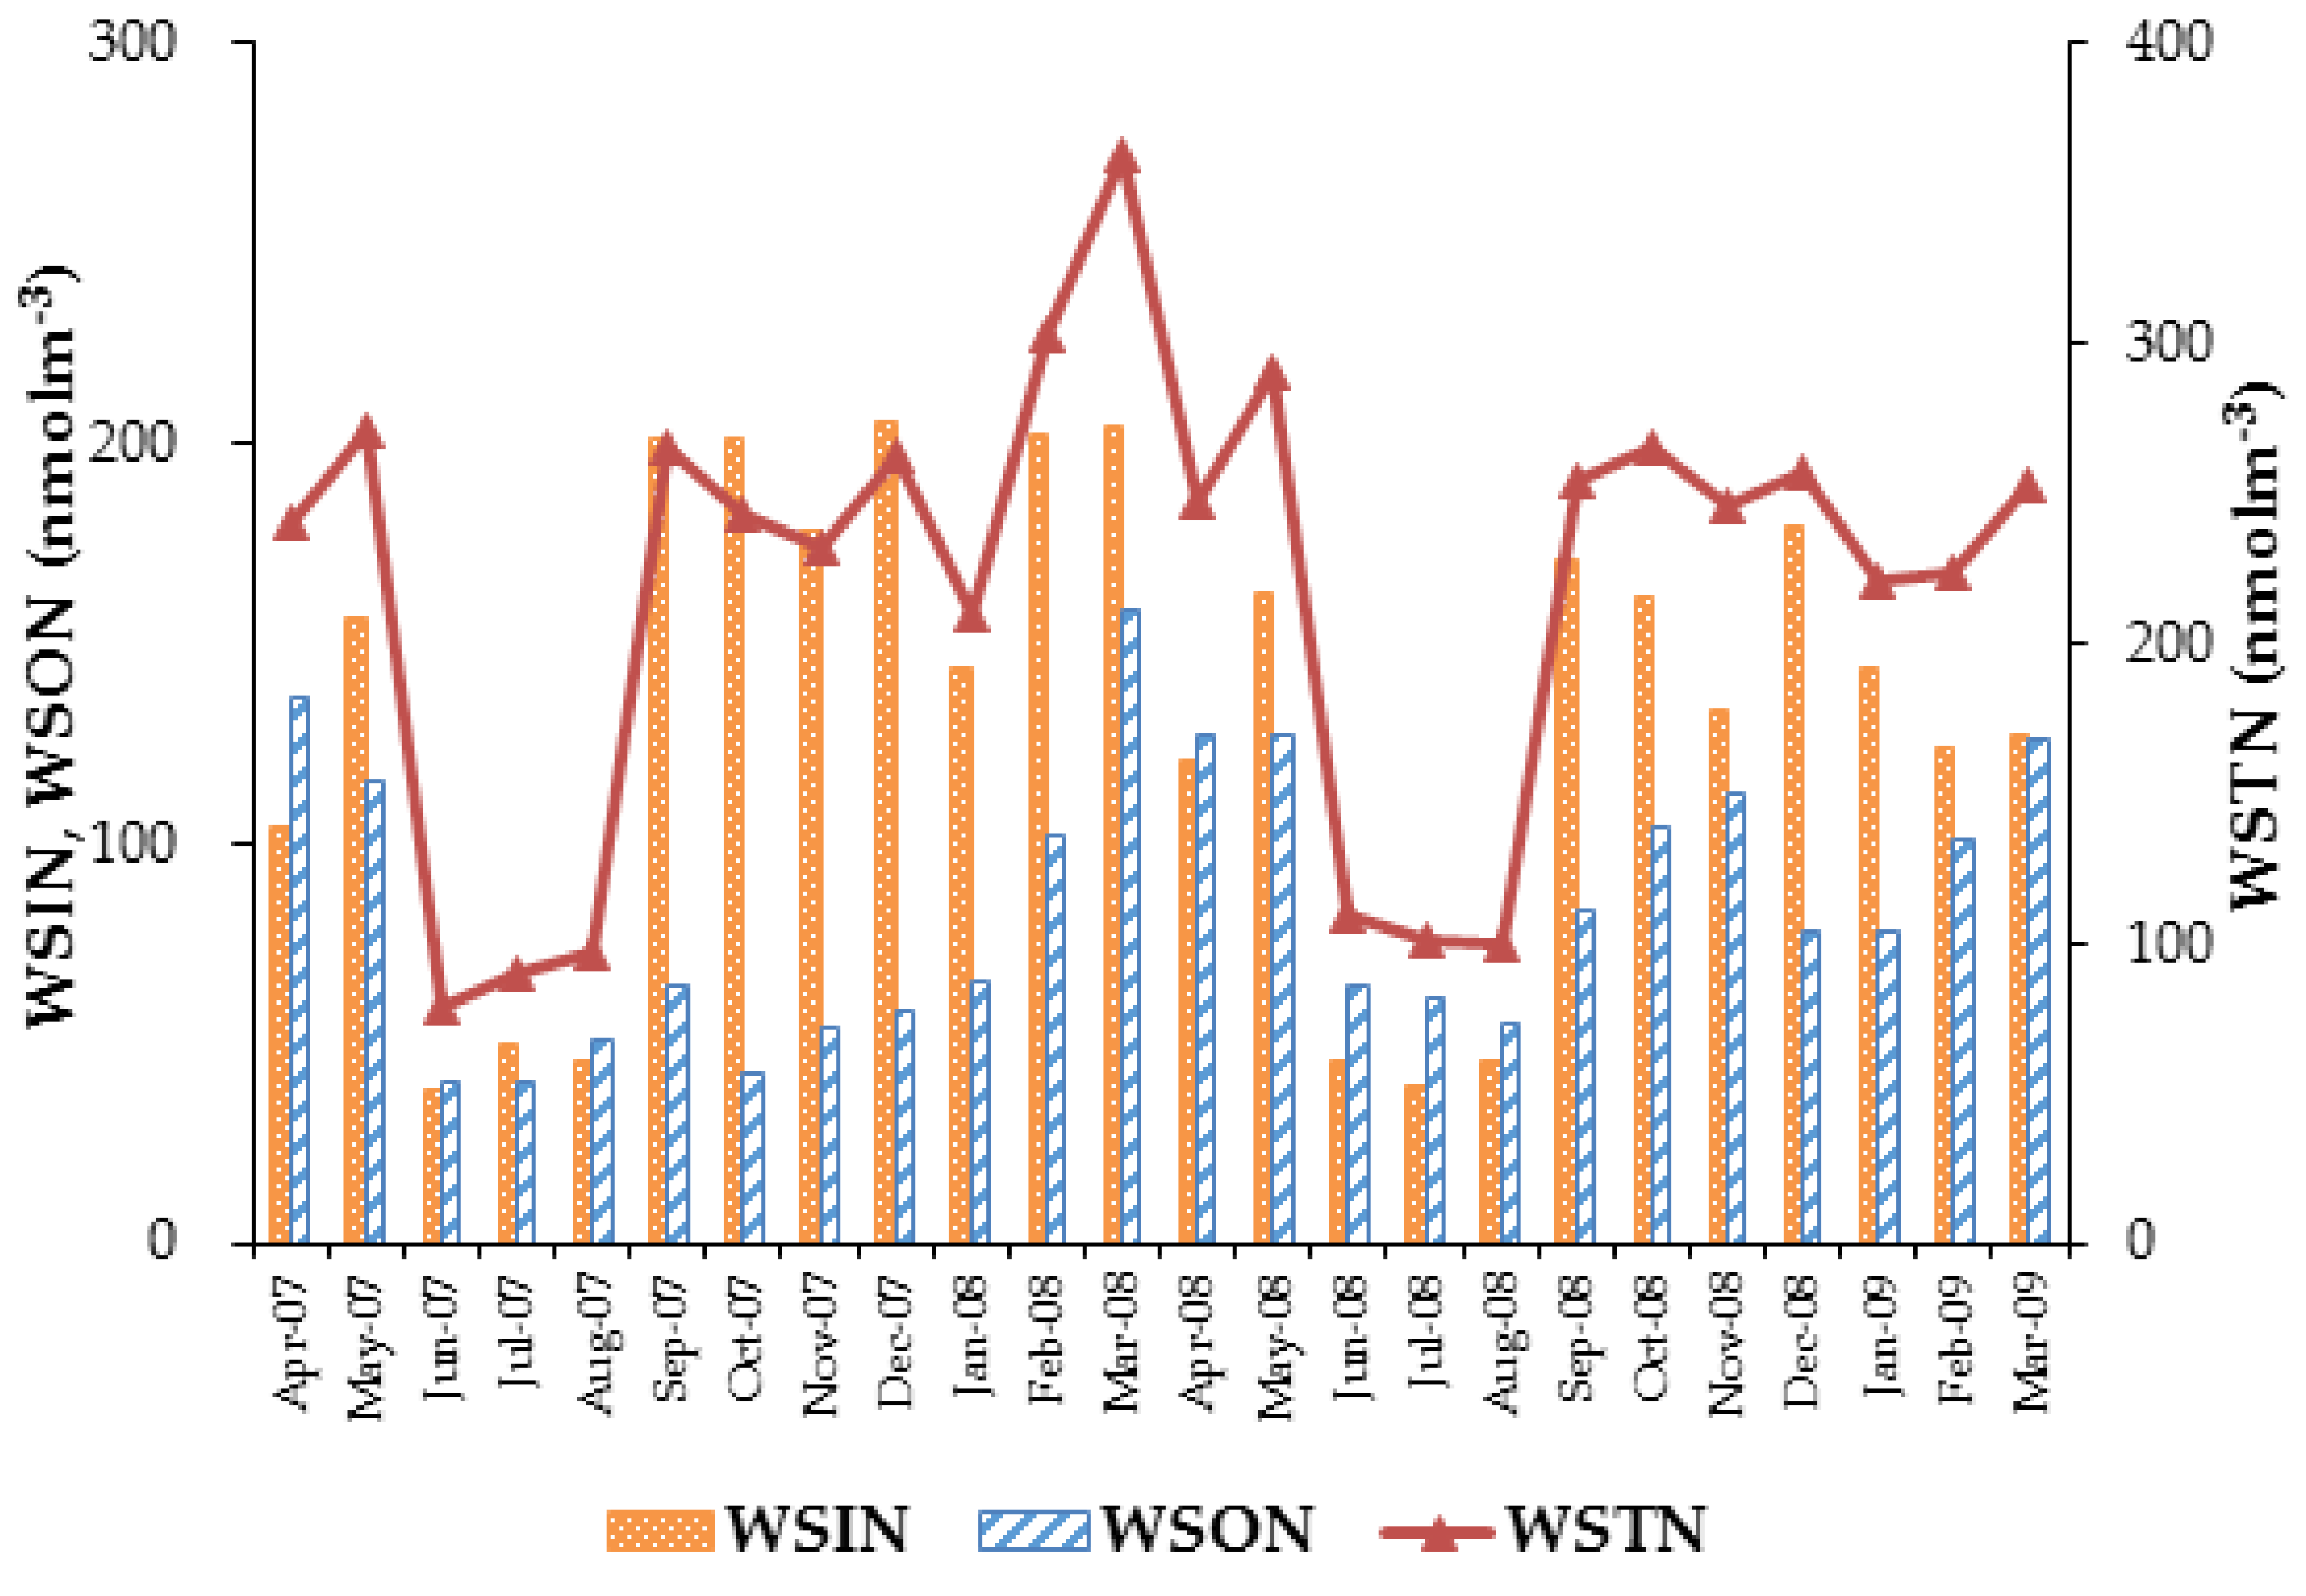
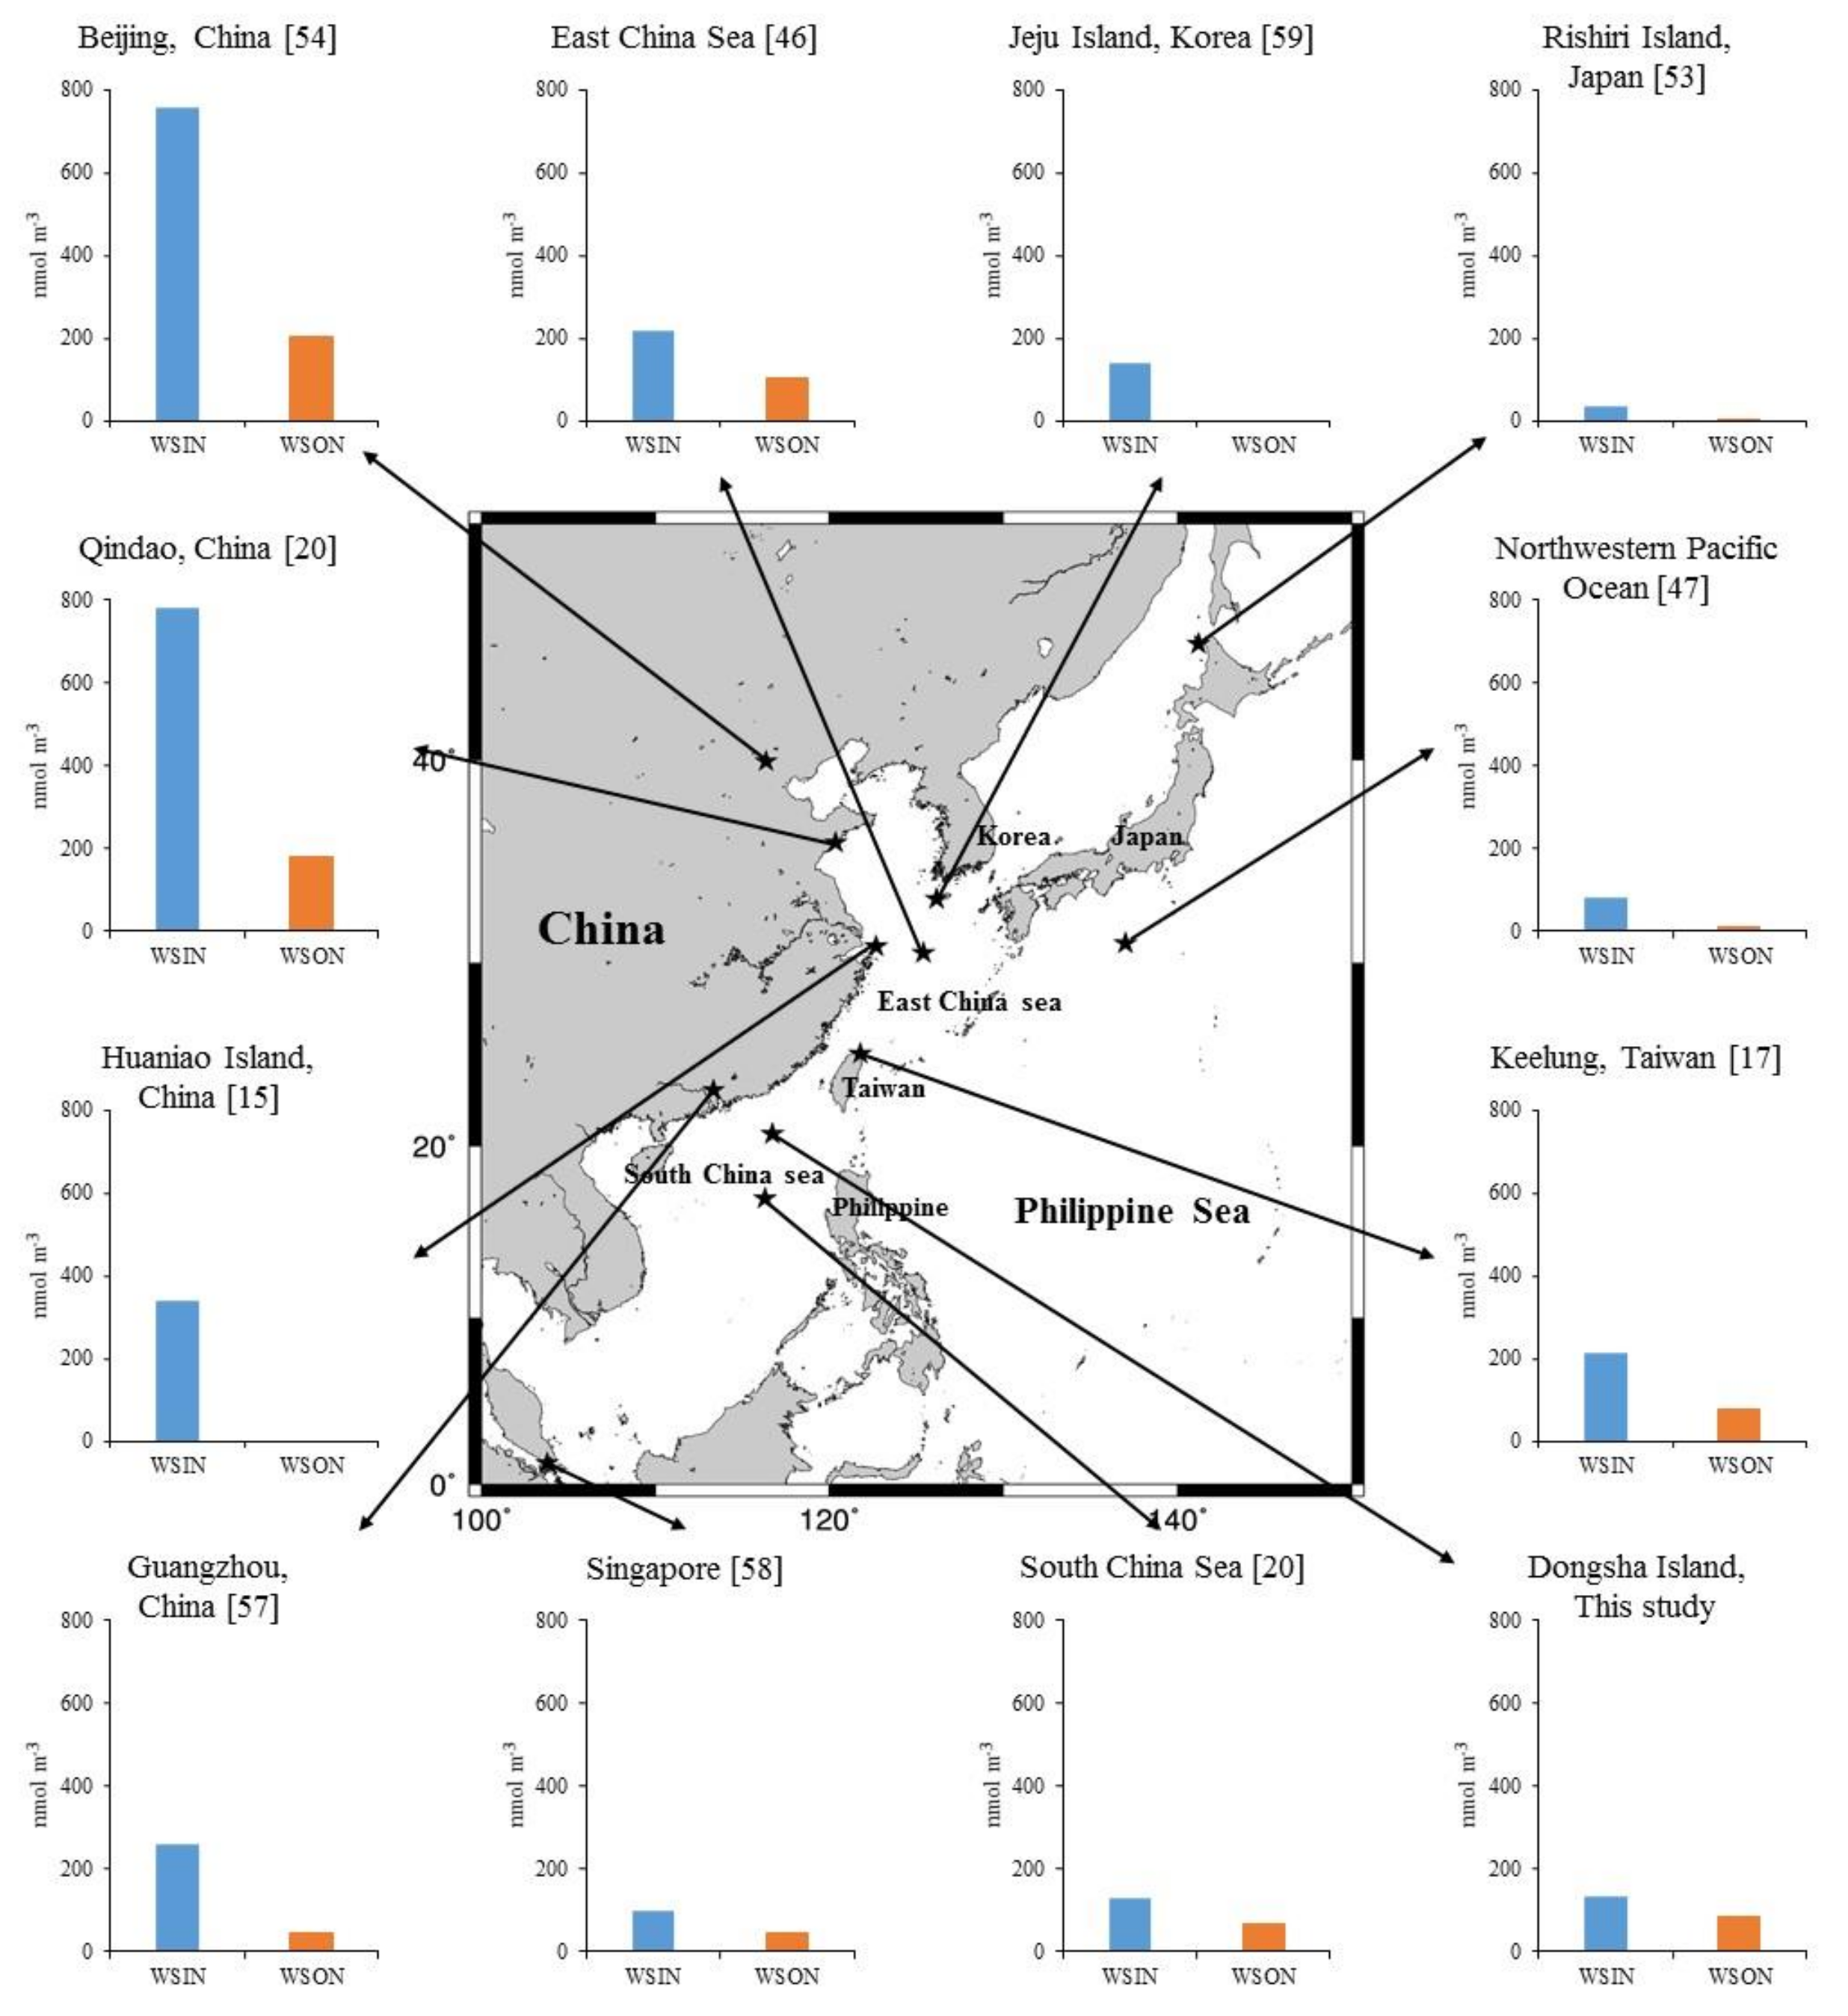
3.3. Concentrations of Water-Soluble Total Nitrogen (WSTN), Water-Soluble Inorganic Nitrogen (WSIN), and Water-Soluble Organic Nitrogen (WSON) Species
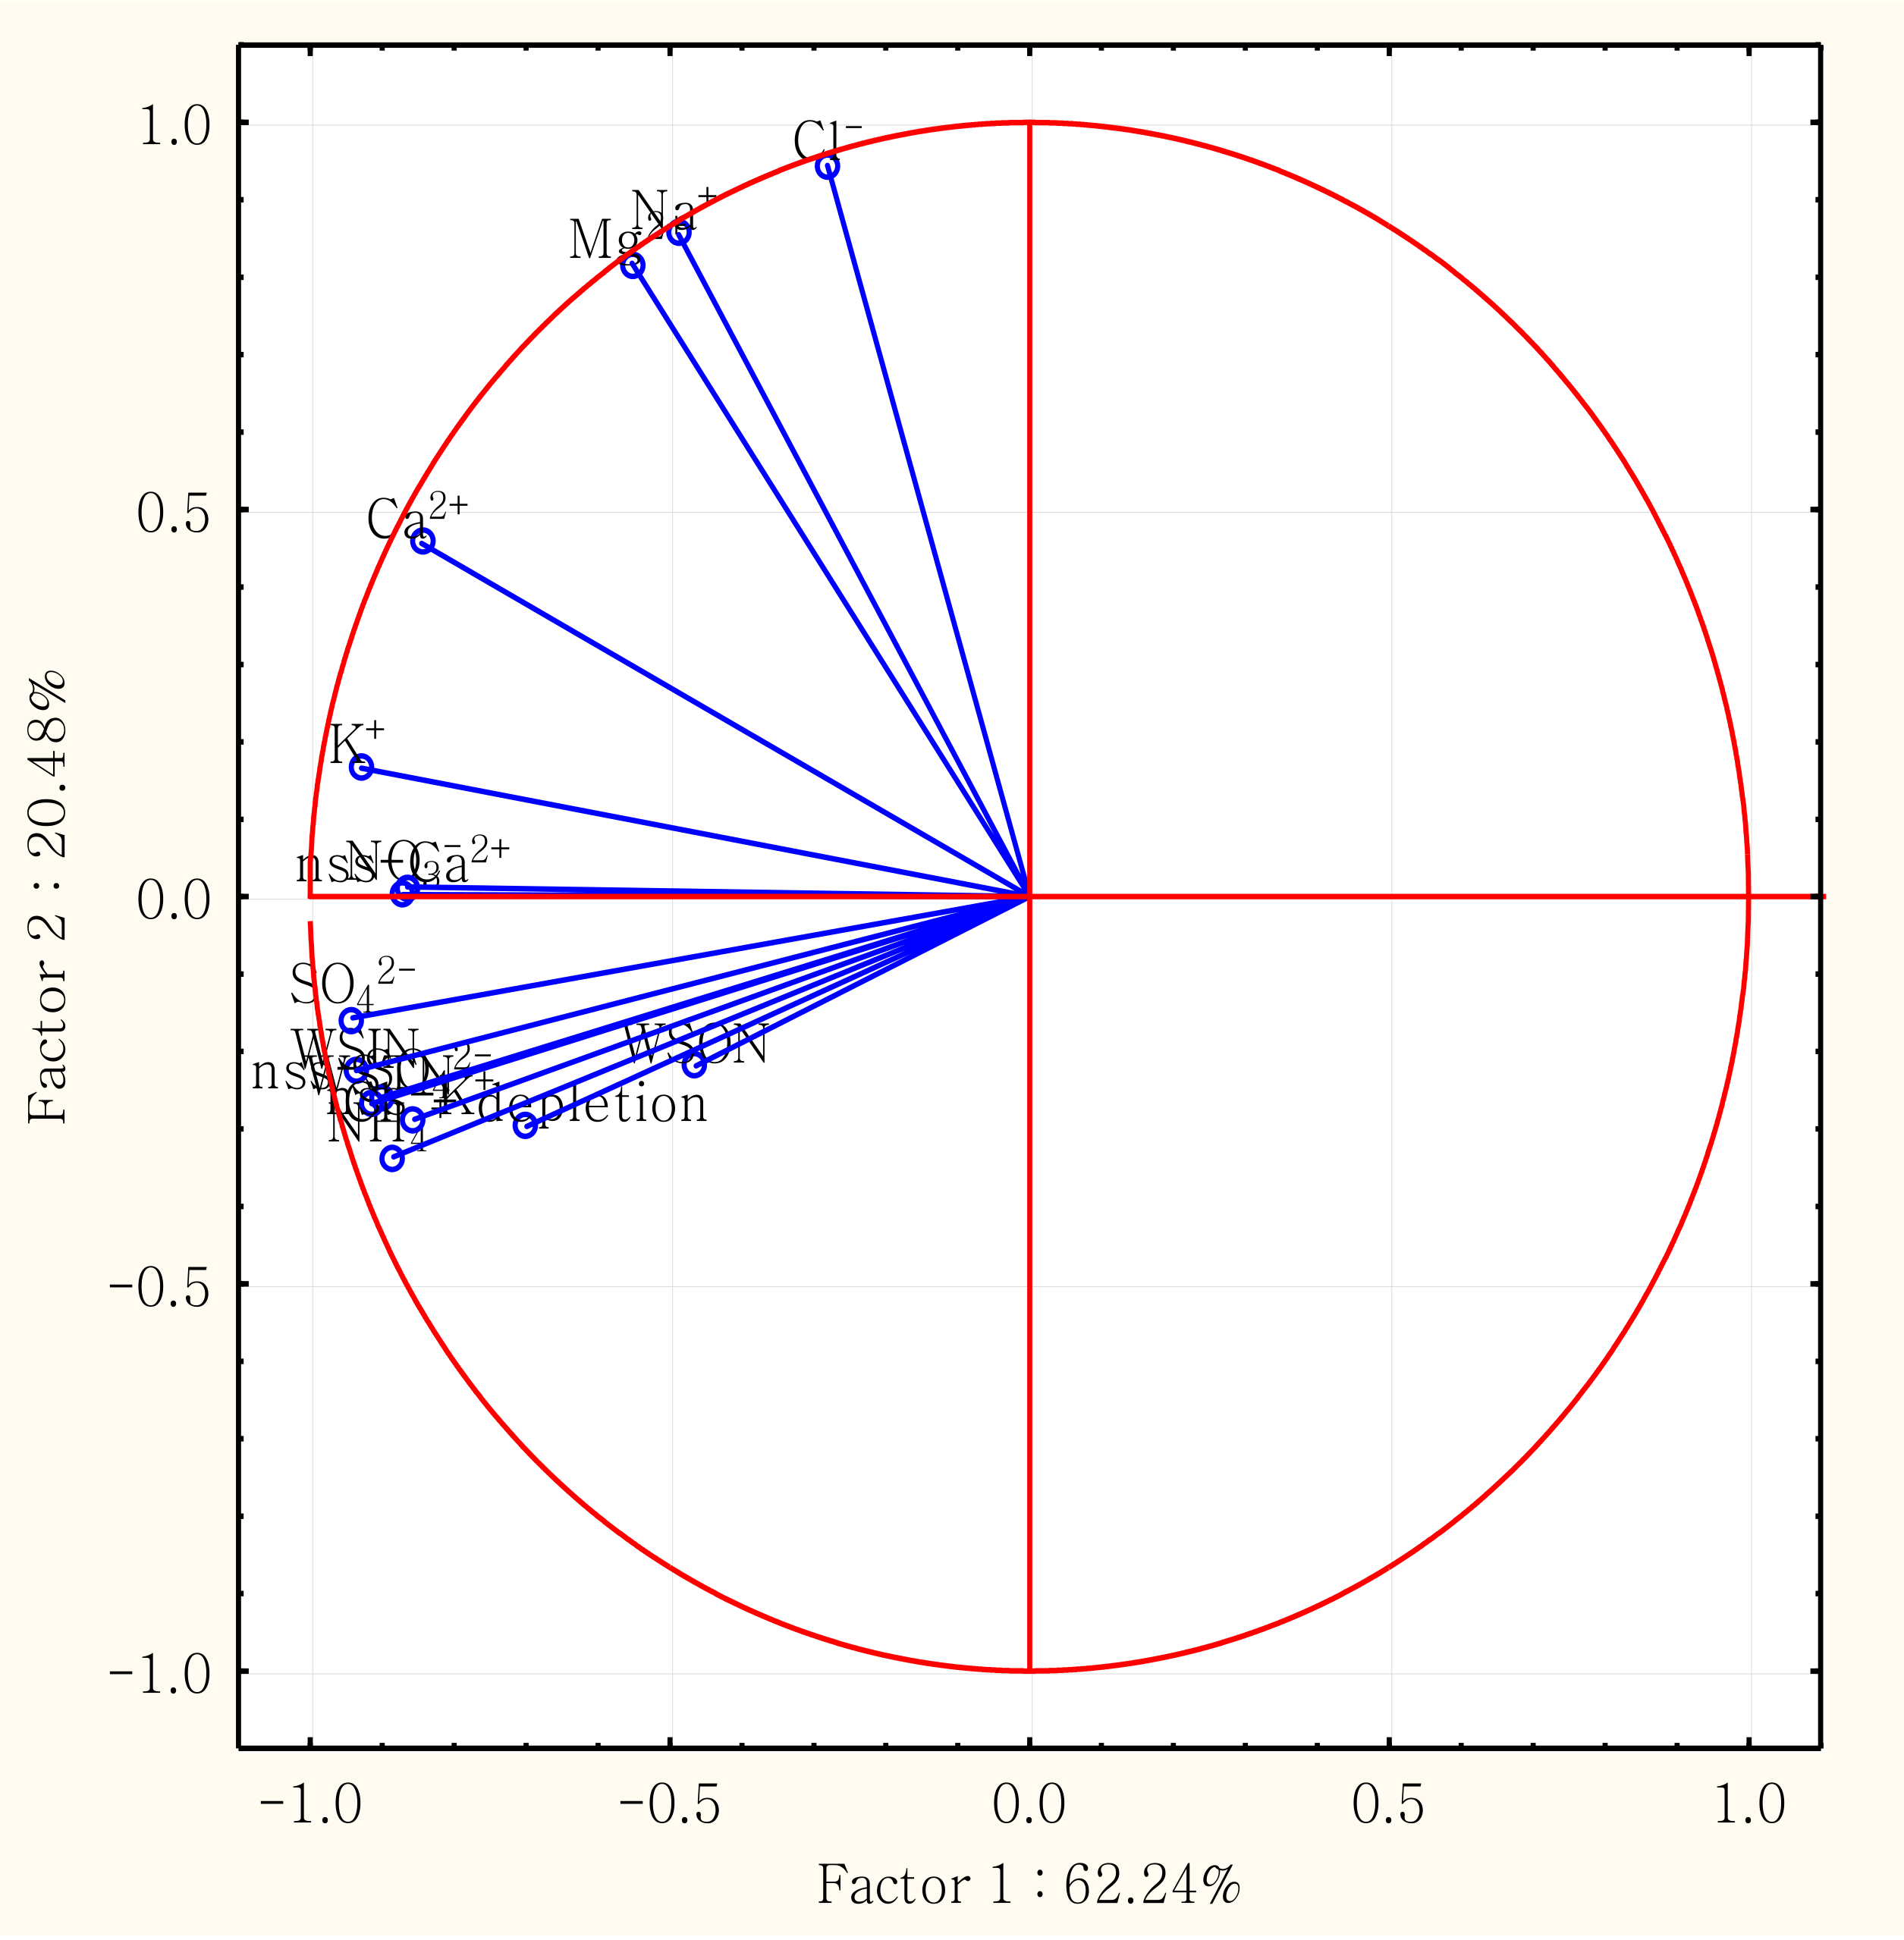
3.4. Correlation Analysis and Principal Component Analysis (PCA)
3.5. Fluxes of Nitrogen Species
3.6. Contribution of Atmospheric N Deposition to New Production in the South China Sea (SCS)
4. Conclusions
Supplementary Materials
Author Contributions
Funding
Acknowledgments
References
- Boreddy, S.K.R; Kawamura, K. A 12-year observation of water-soluble ions in TSP aerosols collected at a remote marine location in the western North Pacific: An outflow region of Asian dust. Atmos. Chem. Phys. 2015, 15, 6437–6453. [Google Scholar] [CrossRef]
- Arakaki, T.; Azechi, S.; Somada, Y.; Ijyu, M.; Nakaema, F.; Hitomi, Y.; Handa, D.; Oshiro, Y.; Miyagi, Y.; Tsuhako, A.; et al. Spatial and temporal variations of chemicals in the TSP aerosols simultaneously collected at three islands in Okinawa, Japan. Atmos. Environ. 2014, 97, 479–485. [Google Scholar] [CrossRef]
- Jickells, T. The role of air-sea exchange in the marine nitrogen cycle. Biogeosciences 2006, 3, 271–280. [Google Scholar] [CrossRef]
- Wang, H.; Wang, X.; Yang, X.; Li, W.; Xue, L.; Wang, T.; Chen, J.; Wang, W. Mixed Chloride Aerosols and their Atmospheric Implications: A Review. Aerosol Air Qual. Res. 2017, 17, 878–887. [Google Scholar] [CrossRef]
- Kawakami, N.; Osada, K.; Nishita, C.; Yabuki, M.; Kobayashi, H.; Hara, K.; Shiobara, M. Factors controlling sea salt modification and dry deposition of nonsea-salt components to the ocean. J. Geophys. Res. [CrossRef]
- Yao, X.; Zhang, L. Chemical processes in sea-salt chloride depletion observed at a Canadian rural coastal site. Atmos. Environ. 2012, 46, 189–194. [Google Scholar] [CrossRef]
- Hsu, S.C.; Liu, S.C.; Kao, S.J.; Jeng, W.L.; Huang, Y.T.; Tseng, C.M.; Tsai, F.; Tu, J.Y; Yang, Y. Water-soluble species in the marine aerosol from the northern South China Sea: High chloride depletion related to air pollution. J. Geophys. Res. 2007, 112. [Google Scholar] [CrossRef]
- Yao, X.; Fang, M; Chan, C.K. The size dependence of chloride depletion in fine and coarse sea-salt particles. Atmos. Environ. 2003, 37, 743–751. [Google Scholar] [CrossRef]
- Galloway, J.N.; Townsend, A.R.; Erisman, J.W.; Bekunda, M.; Cai, Z.; Freney, J.R.; Martinelli, L.A.; Seitzinger, S.P.; Sutton, M.A. Transformation of the Nitrogen Cycle: Recent Trends. Questions, and Potential Solutions. Science 2008, 320, 889–892. [Google Scholar] [CrossRef] [PubMed]
- Fowler, D.; Coyle, M.; Skiba, U.; Sutton, M.A.; Cape, J.N.; Reis, S.; Sheppard, L.J.; Jenkins, A.; Grizzetti, B.; Galloway, J.N.; et al. The global nitrogen cycle in the twenty-first century. Philos. Trans. R. Soc. Lond. B Biol. Sci. 2013, 368, 20130164. [Google Scholar] [CrossRef] [PubMed]
- Gu, B.; Ju, X.; Chang, J.; Ge, Y.; Vitousek, P.M. Integrated reactive nitrogen budgets and future trends in China. Proc. Natl. Acad. Sci. USA 2015, 112, 8792–8797. [Google Scholar] [CrossRef] [PubMed]
- Liu, X.; Zhang, Y.; Han, W.; Tang, A.; Shen, J.; Cui, Z.; Vitousek, P.; Erisman, J.W.; Goulding, K.; Christie, P.; et al. Enhanced nitrogen deposition over China. Nature 2013, 494, 459–462. [Google Scholar] [CrossRef] [PubMed]
- Wu, Y.; Gu, B.; Erisman, J.W.; Reis, S.; Fang, Y.; Lu, X.; Zhang, X. PM2.5 pollution is substantially affected by ammonia emissions in China. Environ. Pollut. 2016, 218, 86–94. [Google Scholar] [CrossRef] [PubMed]
- Li, L.; Kumar, M.; Zhu, C.; Zhong, J.; Francisco, J.S; Zeng, X.C. Near-Barrierless Ammonium Bisulfate Formation via a Loop-Structure Promoted Proton-Transfer Mechanism on the Surface of Water. J. Am. Chem. Soc. 2016, 138, 1816–1819. [Google Scholar] [CrossRef] [PubMed]
- Zhu, L.; Chen, Y.; Guo, L.; Wang, F. Estimate of dry deposition fluxes of nutrients over the East China Sea: The implication of aerosol ammonium to non-sea-salt sulfate ratio to nutrient deposition of coastal oceans. Atmos. Environ. 2013, 69, 131–138. [Google Scholar] [CrossRef]
- Duce, R.A.; LaRoche, J.; Altieri, K.; Arrigo, K.R.; Baker, A.R.; Capone, D.G.; Cornell, S.; Dentener, F.; Galloway, J.; Ganeshram, R.S.; et al. Impacts of atmospheric anthropogenic nitrogen on the open ocean. Science 2008, 320, 893–897. [Google Scholar] [CrossRef] [PubMed]
- Chen, H.Y.; Chen, L.D.; Chiang, Z.Y.; Hung, C.C.; Lin, F.J.; Chou, W.C.; Gong, G.C; Wen, L.S. Size fractionation and molecular composition of water-soluble inorganic and organic nitrogen in aerosols of a coastal environment. J. Geophys. Res. 2010, 115. [Google Scholar] [CrossRef]
- Chen, Y.X.; Chen, H.Y.; Wang, W.; Yeh, J.X.; Chou, W.C.; Gong, G.C.; Tsai, F.J.; Huang, S.J.; Lin, C.T. Dissolved organic nitrogen in wet deposition in a coastal city (Keelung) of the southern East China Sea: Origin. Molecular composition and flux. Atmos. Environ. 2015, 112, 20–31. [Google Scholar] [CrossRef]
- Bronk, D.A.; See, J.H.; Bradley, P.; Killberg, L. DON as a source of bioavailable nitrogen for phytoplankton. Biogeosciences 2007, 4, 283–296. [Google Scholar] [CrossRef]
- Shi, J.; Gao, H.; Qi, J.; Zhang, J.; Yao, X. Sources, compositions, and distributions of water-soluble organic nitrogen in aerosols over the China Sea. J. Geophys. Res. 2010, 115. [Google Scholar] [CrossRef]
- Yang, J.Y.T.; Hsu, S.C.; Dai, M.H.; Hsiao, S.S.Y.; Kao, S.J. Isotopic composition of water-soluble nitrate in bulk atmospheric deposition at Dongsha Island: Sources and implications of external N supply to the northern South China Sea. Biogeosciences 2014, 11, 1833–1846. [Google Scholar] [CrossRef]
- Kim, T.W.; Lee, K.; Duce, R.A.; Liss, P. Impact of atmospheric nitrogen deposition on phytoplankton productivity in the South China Sea. Geophys. Res. Lett. 2014, 41, 3156–3162. [Google Scholar] [CrossRef]
- Grosse, J.; Bombar, D.; Doan, H.N.; Nguyen, L.N.; Voss, M. The Mekong River plume fuels nitrogen fixation and determines phytoplankton species distribution in the South China Sea during low and high discharge season. Limnol. Oceanogr. 2010, 55, 1668–1680. [Google Scholar] [CrossRef]
- Liu, S.M.; Hong, G.H.; Zhang, J.; Ye, X.W.; Jiang, X.L. Nutrient budgets for large Chinese estuaries. Biogeosciences 2009, 6, 2245–2263. [Google Scholar] [CrossRef]
- Kim, T.W.; Lee, K.; Lee, C.K.; Jeong, H.D.; Suh, Y.S.; Lim, W.A.; Kim, K.Y; Jeong, H.J. Interannual nutrient dynamics in Korean coastal waters. Harmful Algae 2013, 30, S15–S27. [Google Scholar] [CrossRef]
- Mace, K.A. Water-soluble organic nitrogen in Amazon Basin aerosols during the dry (biomass burning) and wet seasons. J. Geophys. Res. 2003, 108. [Google Scholar] [CrossRef]
- Pai, S.C.; Tsau, Y.J.; Yang, T.I. pH and buffering capacity problems involved in the determination of ammonia in saline water using the indophenol blue spectrophotometric method. Anal. Chim. Acta 2001, 434, 209–216. [Google Scholar] [CrossRef]
- Pai, S.C.; Yang, C.C. Formation kinetics of the pink azo dye in the determination of nitrite in natural waters. Anal. Chim. Acta 1990, 232, 345–349. [Google Scholar] [CrossRef]
- Pai, S.C; Riley, J.P. Determination of Nitrate in the Presence of Nitrite in Natural Waters by Flow Injection Analysis with a Non-Quantitative On-Line Cadmium Reductor. Int. J. Environ. Anal. Chem. 1994, 57, 263–277. [Google Scholar] [CrossRef]
- Bronk, D.A.; Lomas, M.W.; Glibert, P.M.; Schukert, K.J.; Sanderson, M.P. Total dissolved nitrogen analysis: Comparisons between the persulfate. UV and high temperature oxidation methods. Mar. Chem. 2000, 69, 163–178. [Google Scholar] [CrossRef]
- Chen, H.Y; Chen, L.D. Importance of anthropogenic inputs and continental-derived dust for the distribution and flux of water-soluble nitrogen and phosphorus species in aerosol within the atmosphere over the East China Sea. J. Geophys. Res. 2008, 113. [Google Scholar] [CrossRef]
- Chen, H.Y.; Chen, L.D. Occurrence of water soluble organic nitrogen in aerosols at a coastal area. J. Atmos. Chem. 2010, 65, 49–71. [Google Scholar] [CrossRef]
- Libes, S.M. Introduction to Marine Biogeochemistry, 2nd ed.; Amsterdam Academic Press: Amsterdam, The Netherlands, 2009. [Google Scholar]
- Wang, Y.; Zhuang, G.; Zhang, X.; Huang, K.; Xu, C.; Tang, A.; Chen, J.; An, Z. The ion chemistry. Seasonal cycle, and sources of PM2.5 and TSP aerosol in Shanghai. Atmos. Environ. 2006, 40, 2935–2952. [Google Scholar] [CrossRef]
- Keene, W.C.; Pszenny, A.A.P.; Galloway, J.N; Hawley, M.E. Sea-salt corrections and interpretation of constituent ratios in marine precipitation. J. Geophys. Res. Atmos. 1986, 91, 6647–6658. [Google Scholar] [CrossRef]
- Yeatman, S.G.; Spokes, L.J.; Jickells, T.D. Comparisons of coarse-mode aerosol nitrate and ammonium at two polluted coastal sites. Atmos. Environ. 2001, 35, 1321–1335. [Google Scholar] [CrossRef]
- Lawrence, M.G; Lelieveld, J. Atmospheric pollutant outflow from southern Asia: A review. Atmos. Chem. Phys. 2010, 10, 11017–11096. [Google Scholar] [CrossRef]
- Xiao, H.W.; Xiao, H.Y.; Luo, L.; Shen, C.Y.; Long, A.M.; Chen, L.; Long, Z.H; Li, D.N. Atmospheric aerosol compositions over the South China Sea: Temporal variability and source apportionment. Atmos. Chem. Phys. 2017, 17, 3199–3214. [Google Scholar] [CrossRef]
- Zhang, M.; Chen, J.M.; Wang, T.; Cheng, T.T.; Lin, L.; Bhatia, R.S; Hanvey, M. Chemical characterization of aerosols over the Atlantic Ocean and the Pacific Ocean during two cruises in 2007 and 2008. J. Geophys. Res. 2010, 115. [Google Scholar] [CrossRef]
- Baker, A.R.; Lesworth, T.; Adams, C.; Jickells, T.D; Ganzeveld, L. Estimation of atmospheric nutrient inputs to the Atlantic Ocean from 50° N to 50° S based on large-scale field sampling: Fixed nitrogen and dry deposition of phosphorus. Glob. Biogeochem. Cycles 2010, 24, GB3006. [Google Scholar] [CrossRef]
- Galloway, J.N.; Dentener, F.J.; Capone, D.G.; Boyer, E.W.; Howarth, R.W.; Seitzinger, S.P.; Asner, G.P.; Cleveland, C.C.; Green, P.A.; Holland, E.A.; et al. Nitrogen Cycles: Past. Present, and Future. Biogeochemistry 2004, 70, 153–226. [Google Scholar] [CrossRef]
- Jickells, T.D.; Kelly, S.D.; Baker, A.R.; Biswas, K.; Dennis, P.F.; Spokes, L.J.; Witt, M.; Yeatman, S.G. Isotopic evidence for a marine ammonia source. Geophys. Res. Lett. 2003, 30. [Google Scholar] [CrossRef]
- Zhang, R.; Jing, J.; Tao, J.; Hsu, S.C.; Wang, G.; Cao, J.; Lee, C.S.L.; Zhu, L.; Chen, Z.; Zhao, Y.; et al. Chemical characterization and source apportionment of PM 2.5 in Beijing: Seasonal perspective. Atmos. Chem. Phys. 2013, 13, 7053–7074. [Google Scholar] [CrossRef]
- Aneja, V.P.; Roelle, P.A.; Murray, G.C.; Southerland, J.; Erisman, J.W.; Fowler, D.; Asman, W.A.H; Patni, N. Atmospheric nitrogen compounds II: Emissions, transport, transformation, deposition and assessment. Atmos. Environ. 2001, 35, 1903–1911. [Google Scholar] [CrossRef]
- Pryor, S.C; Sørensen, L.L. Dry deposition of reactive nitrogen to marine environments: Recent advances and remaining uncertainties. Mar. Pollut. Bull. 2002, 44, 1336–1340. [Google Scholar] [CrossRef]
- Luo, L.; Kao, S.J.; Bao, H.; Xiao, H.; Xiao, H.; Yao, X.; Gao, H.; Li, J.; Li, Y. Sources of reactive nitrogen in marine aerosol over the Northwest Pacific Ocean in spring. Atmos. Chem. Phys. Discuss. 2017, 1–30. [Google Scholar] [CrossRef]
- Luo, L.; Yao, X.H.; Gao, H.W.; Hsu, S.C.; Li, J.W; Kao, S.J. Nitrogen speciation in various types of aerosols in spring over the northwestern Pacific Ocean. Atmospheric Chem. Phys. 2016, 16, 325–341. [Google Scholar] [CrossRef]
- Srinivas, B.; Sarin, M.M.; Sarma, V.V.S.S. Atmospheric dry deposition of inorganic and organic nitrogen to the Bay of Bengal: Impact of continental outflow. Mar. Chem. 2011, 127, 170–179. [Google Scholar] [CrossRef]
- Zamora, L.M.; Prospero, J.M; Hansell, D.A. Organic nitrogen in aerosols and precipitation at Barbados and Miami: Implications regarding sources, transport and deposition to the western subtropical North Atlantic. J. Geophys. Res. 2011, 116. [Google Scholar] [CrossRef]
- Nehir, M.; Koçak, M. Atmospheric Water-Soluble Organic Nitrogen (WSON) in the Eastern Mediterranean: Origin and Ramifications Regarding Marine Productivity. Atmos. Chem. Phys. Discuss. [CrossRef]
- Chen, Y.; Mills, S.; Street, J.; Golan, D.; Post, A.; Jacobson, M.; Paytan, A. Estimates of atmospheric dry deposition and associated input of nutrients to Gulf of Aqaba seawater. J. Geophys. Res. 2007, 112. [Google Scholar] [CrossRef]
- Martino, M.; Hamilton, D.; Baker, A.R.; Jickells, T.D.; Bromley, T.; Nojiri, Y.; Quack, B.; Boyd, P.W. Western Pacific atmospheric nutrient deposition fluxes. their impact on surface ocean productivity. Glob. Biogeochem. Cycles 2014, 28, 712–728. [Google Scholar] [CrossRef]
- Matsumoto, K.; Yamamoto, Y.; Nishizawa, K.; Kaneyasu, N.; Irino, T.; Yoshikawa-Inoue, H. Origin of the water-soluble organic nitrogen in the maritime aerosol. Atmos. Environ. 2017, 167, 97–103. [Google Scholar] [CrossRef]
- Zhang, Q.; Duan, F.; He, K.; Ma, Y.; Li, H.; Kimoto, T.; Zheng, A. Organic nitrogen in PM 2.5 in Beijing. Front. Environ. Sci. Eng. 2015, 9, 1004–1014. [Google Scholar] [CrossRef]
- Ho, K.F.; Ho, S.S.H.; Huang, R.J.; Liu, S.X.; Cao, J.J.; Zhang, T.; Chuang, H.C.; Chan, C.S.; Hu, D.; Tian, L. Characteristics of water-soluble organic nitrogen in fine particulate matter in the continental area of China. Atmos. Environ. 2015, 106, 252–261. [Google Scholar] [CrossRef]
- Wu, Y.; Zhang, J.; Liu, S.; Jiang, Y.; Huang, X. Aerosol concentrations and atmospheric dry deposition fluxes of nutrients over Daya Bay. South China Sea. Mar. Pollut. Bull. 2018, 128, 106–114. [Google Scholar] [CrossRef] [PubMed]
- Yu, X.; Yu, Q.; Zhu, M.; Tang, M.; Li, S.; Yang, W.; Zhang, Y.; Deng, W.; Li, G.; Yu, Y.; et al. Water Soluble Organic Nitrogen (WSON) in Ambient Fine Particles Over a Megacity in South China: Spatiotemporal Variations and Source Apportionment. J. Geophys. Res. Atmos. 2017, 122, 13045–13060. [Google Scholar] [CrossRef]
- Karthikeyan, S.; He, J.; Palani, S.; Balasubramanian, R.; Burger, D. Determination of total nitrogen in atmospheric wet and dry deposition samples. Talanta 2009, 77, 979–984. [Google Scholar] [CrossRef] [PubMed]
- Kang, C.H.; Kim, W.H.; Ko, H.J.; Hong, S.B. Asian Dust effects on Total Suspended Particulate (TSP) compositions at Gosan in Jeju Island. Korea. Atmos. Res. 2009, 94, 345–355. [Google Scholar] [CrossRef]
- Jickells, T.; Baker, A.R.; Cape, J.N.; Cornell, S.E; Nemitz, E. The cycling of organic nitrogen through the atmosphere. Philos. Trans. R. Soc. Lond. B Biol. Sci. 2013, 368, 20130115. [Google Scholar] [CrossRef] [PubMed]
- Kanakidou, M.; Duce, R.A.; Prospero, J.M.; Baker, A.R.; Benitez-Nelson, C.; Dentener, F.J.; Hunter, K.A.; Liss, P.S.; Mahowald, N.; Okin, G.S.; et al. Atmospheric fluxes of organic N and P to the global ocean. Glob. Biogeochem. Cycles 2012, 26. [Google Scholar] [CrossRef]
- Hoppel, W.A. Surface source function for sea-salt aerosol and aerosol dry deposition to the ocean surface. J. Geophys. Res. 2002, 107. [Google Scholar] [CrossRef]
- Hsu, C.A.; Lee, C.S.L.; Huh, C.A.; Shaheen, R.; Lin, F.J.; Liu, S.C.; Liang, M.C.; Tao, J. Ammonium deficiency caused by heterogeneous reactions during a super Asian dust episode. J. Geophys. Res. 2014, 119. [Google Scholar] [CrossRef]
- Duce, R.A.; Galloway, J.N.; Liss, P.S. The impacts of atmospheric deposition to the ocean on marine ecosystems and climate. WMO Bull. 2009, 58, 61–66. [Google Scholar]
- Nakamura, T.; Matsumoto, K.; Uematsu, M. Chemical characteristics of aerosols transported from Asia to the East China Sea: An evaluation of anthropogenic combined nitrogen deposition in autumn. Atmos. Environ. 2005. [Google Scholar] [CrossRef]
- Jung, J.; Furutani, H.; Uematsu, M.; Kim, S.; Yoon, S. Atmospheric inorganic nitrogen input via dry. wet, and sea fog deposition to the subarctic western North Pacific Ocean. Atmos. Chem. Phys. 2013, 13, 411–428. [Google Scholar] [CrossRef]
- Lesworth, T.; Baker, A.R; Jickells, T. Aerosol organic nitrogen over the remote Atlantic Ocean. Atmos. Environ. 2010, 44, 1887–1893. [Google Scholar] [CrossRef]
- Srinivas, B.; Sarin, M.M. Atmospheric deposition of N, P and Fe to the Northern Indian Ocean: Implications to C- and N-fixation. Sci. Total Environ. [CrossRef]
- Jung, J.; Furutani, H.; Uematsu, M. Atmospheric inorganic nitrogen in marine aerosol and precipitation and its deposition to the North and South Pacific Oceans. J. Atmos. Chem. 2011, 68, 157–181. [Google Scholar] [CrossRef]
- Wang, X.; Wu, Z.; Shao, M.; Fang, Y.; Zhang, L.; Chen, F.; Chan, P.-w.; Fan, Q.; Wang, Q.; Zhu, S.; et al. Atmospheric nitrogen deposition to forest and estuary environments in the Pearl River Delta region. southern China. Tellus B Chem. Phys. Meteorol. 2013, 65, 20480. [Google Scholar] [CrossRef]
- Shih, Y.Y.; Hung, C.C.; Gong, G.C.; Chung, W.C.; Wang, Y.H.; Lee, I.H.; Chen, K.S; Ho, C.Y. Enhanced Particulate Organic Carbon Export at Eddy Edges in the Oligotrophic Western North Pacific Ocean. PLoS ONE 2015, 10, e0131538. [Google Scholar] [CrossRef] [PubMed]
- Hung, C.C; Gong, G. CPOC/234Th ratios in particles collected in sediment traps in the northern South China Sea. Estuar. Coast. Shelf Sci. 2010, 88, 303–310. [Google Scholar] [CrossRef]
- Yan, G.; Kim, G. Sources and fluxes of organic nitrogen in precipitation over the southern East Sea/Sea of Japan. Atmos. Chem. Phys. 2015, 15, 2761–2774. [Google Scholar] [CrossRef]
- Li, D.; Chou, W.C.; Shih, Y.Y.; Chen, G.Y.; Chang, Y.; Chow, C.H.; Lin, T.Y; Hung, C.C. Elevated particulate organic carbon export flux induced by internal waves in the oligotrophic northern South China Sea. Sci. Rep. 2018, 8, 2042. [Google Scholar] [CrossRef] [PubMed]
- Sandroni, V.; Raimbault, P.; Migon, C.; Raimbault, P.; Migon, C.; Garcia, N.; Gouze, E. Dry atmospheric deposition and diazotrophy as sources of new nitrogen to northwestern Mediterranean oligotrophic surface waters. Deep Sea Res. Part I Oceanogr. Res. Pap. 2007, 54, 1859–1870. [Google Scholar] [CrossRef]


| Recovery (%) | |||
|---|---|---|---|
| This Study | Chen et al. [18] | Bronk et al. [30] | |
| (n = 10) | (n = 8) | (n = 5) | |
| Antipyrine | 68 ± 6 | ||
| EDTA | 99 ± 5 | 92 ± 3 | 94 ± 2 |
| Quinoline | 92 ± 15 | 94 ± 4 | |
| Urea | 102 ± 7 | 94 ± 5 | 92 ± 9 |
| Blank (nmol m−3) | LOD a (nmol m−3) | |
|---|---|---|
| NH4+ | 0.09 ± 0.01 | 0.03 |
| NO2− | 0.005 ± 0.002 | 0.005 |
| NO3− | 0.08 ± 0.03 | 0.08 |
| Na+ | 0.03 ± 0.01 | 0.03 |
| K+ | 0.005 ± 0.002 | 0.005 |
| Mg2+ | 0.010 ± 0.003 | 0.009 |
| Ca2+ | 0.07 ± 0.02 | 0.06 |
| Cl− | 0.31 ± 0.09 | 0.26 |
| SO42− | 0.12 ± 0.04 | 0.12 |
| North (n = 157) | South (n = 75) | Sea (n = 8) | |
|---|---|---|---|
| Spring | 82% | 15% | 3% |
| Summer | 0% | 90% | 10% |
| Autumn | 83% | 17% | 0% |
| Winter | 97% | 3% | 0% |
| Wind Speeds | Na+ | Mg2+ | Cl− | nss-SO42− | nss-K+ | nss-Ca2+ | |
|---|---|---|---|---|---|---|---|
| April 2007 | 5.1 ± 1.3 | 343 ± 102 | 36.0 ± 11.1 | 281 ± 106 | 122 ± 85.4 | 5.45 ± 5.41 | 8.44 ± 3.74 |
| May 2007 | 3.6 ± 0.8 | 211 ± 90.4 | 24.5 ± 11.4 | 181 ± 75.2 | 131 ± 98.0 | 7.31 ± 5.70 | 10.7 ± 5.34 |
| June 2007 | 3.0 ± 0.9 | 123 ± 57.3 | 12.2 ± 6.35 | 136 ± 57.4 | 18.5 ± 6.25 | 1.05 ± 0.47 | 2.70 ± 0.75 |
| July 2007 | 3.3 ± 0.7 | 123 ± 73.2 | 12.2 ± 7.69 | 134 ± 76.3 | 25.0 ± 6.29 | 1.77 ± 0.60 | 4.34 ± 1.49 |
| August 2007 | 3.8 ± 1.7 | 229 ± 193 | 24.5 ± 21.8 | 254 ± 199 | 23.2 ± 17.6 | 2.13 ± 1.55 | 3.68 ± 1.18 |
| September 2007 | 3.6 ± 1.6 | 201 ± 162 | 24.0 ± 18.3 | 170 ± 148 | 155 ± 155 | 13.4 ± 14.6 | 9.12 ± 7.75 |
| October 2007 | 6.3 ± 1.3 | 414 ± 148 | 47.7 ± 16.6 | 356 ± 150 | 140 ± 76.1 | 7.93 ± 7.42 | 9.21 ± 3.78 |
| November 2007 | 8.9 ± 1.4 | 570 ± 173 | 63.4 ± 17.0 | 478 ± 155 | 136 ± 37.1 | 9.69 ± 3.16 | 13.1 ± 2.72 |
| December 2007 | 6.6 ± 1.8 | 344 ± 96.2 | 35.2 ± 12.0 | 235 ± 74.9 | 170 ± 73.4 | 12.3 ± 5.97 | 11.7 ± 6.67 |
| January 2008 | 6.4 ± 2.5 | 381 ± 105 | 36.6 ± 11.8 | 317 ± 113 | 83.2 ± 45.8 | 3.88 ± 3.80 | 6.38 ± 4.82 |
| February 2008 | 7.5 ± 1.1 | 330 ± 101 | 36.2 ± 10.2 | 232 ± 109 | 203 ± 45.1 | 14.9 ± 6.36 | 9.59 ± 4.59 |
| March 2008 | 5.3 ± 1.3 | 295 ± 94.7 | 34.0 ± 8.12 | 201 ± 91.5 | 160 ± 52.1 | 11.3 ± 5.30 | 12.2 ± 5.19 |
| April 2008 | 3.5 ± 1.3 | 205 ± 108 | 21.3 ± 11.9 | 156 ± 78.3 | 90.7 ± 29.7 | 5.66 ± 2.14 | 8.36 ± 3.19 |
| May 2008 | 3.6 ± 2.0 | 220 ± 169 | 24.3 ± 18.6 | 158 ± 116 | 116 ± 66.6 | 6.85 ± 2.92 | 9.56 ± 4.31 |
| June 2008 | 3.5 ± 0.9 | 173 ± 94.2 | 16.2 ± 8.97 | 182 ± 114 | 17.6 ± 7.54 | 1.84 ± 0.60 | 5.00 ± 1.73 |
| July 2008 | 2.9 ± 1.1 | 146 ± 75.2 | 13.9 ± 7.31 | 145 ± 81.7 | 17.3 ± 8.15 | 2.70 ± 0.61 | 4.24 ± 1.50 |
| August 2008 | 2.5 ± 0.9 | 102 ± 65.9 | 9.46 ± 7.22 | 101 ± 76.4 | 23.6 ± 12.3 | 2.34 ± 1.10 | 4.67 ± 0.89 |
| September 2008 | 3.4 ± 1.9 | 149 ± 169 | 15.7 ± 18.4 | 128 ± 187 | 126 ± 130 | 7.45 ± 6.79 | 9.57 ± 4.65 |
| October 2008 | 6.3 ± 2.3 | 288 ± 82.1 | 30.4 ± 10.0 | 242 ± 82.8 | 111 ± 65.1 | 7.38 ± 5.98 | 9.20 ± 3.49 |
| November 2008 | 7.5 ± 1.6 | 393 ± 96.4 | 41.3 ± 11.2 | 345 ± 107 | 66.8 ± 109 | 5.45 ± 4.14 | 6.87 ± 2.18 |
| December 2008 | 7.8 ± 1.6 | 458 ± 104 | 50.1 ± 10.9 | 396 ± 137 | 109 ± 73.0 | 11.5 ± 7.80 | 13.1 ± 4.99 |
| January 2009 | 8.0 ± 2.0 | 393 ± 145 | 42.8 ± 15.5 | 342 ± 134 | 76.1 ± 27.5 | 8.98 ± 4.60 | 8.64 ± 2.96 |
| February 2009 | 5.4 ± 2.6 | 309 ± 151 | 34.4 ± 16.7 | 291 ± 166 | 58.9 ± 25.2 | 4.73 ± 1.91 | 7.19 ± 1.26 |
| March 2009 | 6.7 ± 1.7 | 333 ± 104 | 38.4 ± 11.9 | 306 ± 85.5 | 69.7 ± 15.8 | 4.75 ± 1.46 | 10.6 ± 3.40 |
| Average | 5.2 ± 2.4 | 280 ± 165 | 30.2 ± 18.4 | 240 ± 149 | 93.8 ± 80.6 | 6.70 ± 6.33 | 8.26 ± 4.73 |
| NH4+ | NO3− | WSIN # | WSON # | WSTN # | |
|---|---|---|---|---|---|
| April 2007 | 66.1 ± 45.3 | 41.4 ± 12.2 | 104 ± 54.2 | 137 ± 32.6 | 240 ± 80.7 |
| May 2007 | 115 ± 95.0 | 48.0 ± 32.0 | 156 ± 116 | 115 ± 86.5 | 271 ± 197 |
| June 2007 | 19.1 ± 9.32 | 18.5 ± 7.26 | 38.2 ± 15.2 | 40.7 ± 15.2 | 78.9 ± 25.6 |
| July 2007 | 21.4 ± 5.86 | 27.6 ± 7.18 | 49.4 ± 9.32 | 40.7 ± 22.0 | 90.1 ± 20.0 |
| August 2007 | 27.6 ± 33.9 | 18.1 ± 8.30 | 46.0 ± 40.5 | 50.4 ± 28.1 | 96.4 ± 68.2 |
| September 2007 | 155 ± 145 | 77.7 ± 37.6 | 201 ± 155 | 63.8 ± 18.9 | 265 ± 170 |
| October 2007 | 118 ± 61.5 | 81.6 ± 13.6 | 201 ± 66.7 | 42.1 ± 24.6 | 243 ± 69.0 |
| November 2007 | 107 ± 26.9 | 70.5 ± 13.8 | 178 ± 37.5 | 54.2 ± 22.5 | 232 ± 46.7 |
| December 2007 | 130 ± 55.3 | 74.1 ± 18.8 | 205 ± 69.0 | 57.5 ± 14.4 | 263 ± 78.4 |
| January 2008 | 77.1 ± 29.1 | 65.8 ± 20.3 | 144 ± 43.6 | 65.4 ± 16.4 | 209 ± 50.6 |
| February 2008 | 127 ± 47.7 | 70.9 ± 26.3 | 202 ± 75.6 | 101 ± 32.7 | 303 ± 101 |
| March 2008 | 110 ± 48.9 | 81.4 ± 20.7 | 205 ± 82.2 | 159 ± 34.9 | 363 ± 110 |
| April 2008 | 52.0 ± 31.6 | 62.8 ± 21.2 | 121 ± 46.0 | 126 ± 23.1 | 247 ± 59.3 |
| May 2008 | 110 ± 51.8 | 52.2 ± 22.6 | 162 ± 72.8 | 127 ± 52.3 | 290 ± 109 |
| June 2008 | 20.6 ± 11.4 | 24.6 ± 8.49 | 45.5 ± 17.6 | 63.8 ± 24.8 | 109 ± 36.5 |
| July 2008 | 16.0 ± 3.37 | 22.3 ± 6.44 | 39.0 ± 7.07 | 61.6 ± 23.0 | 101 ± 27.8 |
| August 2008 | 22.8 ± 19.5 | 22.2 ± 8.60 | 45.5 ± 25.0 | 54.7 ± 19.9 | 100 ± 43.2 |
| September 2008 | 117 ± 107 | 56.6 ± 30.1 | 170 ± 117 | 83.2 ± 36.0 | 254 ± 129 |
| October 2008 | 101 ± 64.6 | 59.8 ± 26.6 | 161 ± 89.4 | 104 ± 31.4 | 266 ± 113 |
| November 2008 | 64.8 ± 47.5 | 62.5 ± 19.2 | 133 ± 61.8 | 112 ± 40.0 | 246 ± 91.2 |
| December 2008 | 98.9 ± 63.6 | 79.6 ± 25.4 | 179 ± 84.3 | 77.4 ± 27.4 | 256 ± 101 |
| January 2009 | 62.9 ± 34.2 | 76.8 ± 11.9 | 143 ± 51.7 | 77.4 ± 27.0 | 220 ± 42.7 |
| February 2009 | 73.2 ± 28.3 | 49.5 ± 21.1 | 123 ± 46.2 | 100 ± 28.6 | 224 ± 73.8 |
| March 2009 | 68.6 ± 29.7 | 57.8 ± 18.2 | 127 ± 42.8 | 126 ± 29.7 | 253 ± 50.2 |
| Average | 78.4 ± 67.2 | 54.3 ± 28.7 | 132 ± 87.9 | 85.0 ± 46.1 | 217 ± 115 |
| Sampling Periods | Location | Station Type | WSIN | WSON | WSTN | Reference | ||
|---|---|---|---|---|---|---|---|---|
| nmol m−3 | % | nmol m−3 | % | nmol m−3 | ||||
| May 2007–July 2009 | Miaimi, USA | Coastal city | 51 ± 26 | 96 ± 69 | 2.4 ± 3.1 | 4 ± 6 | 53 ± 26 | [49] |
| August–September 2007 & 2008 | Barbados, Atlantic Ocean | Island | 20 ± 8.8 | 94 ± 57 | 1.3 ± 1.5 | 6 ± 7 | 21 ± 8.9 | [49] |
| March 2014–April 2015 | Erdemli, Turkey | Coastal city | 40 ± 28 | 63 ± 54 | 24 ± 16 | 37 ± 32 | 64 ± 33 | [50] |
| August 2003–September 2005 | Eilat, Israel | Coastal city | 65 ± 24 | 89 ± 47 | 8 ± 5 | 11 ± 8 | 73 ± 28 | [51] |
| March–April 2006 | northern Indian Ocean | Marginal sea | 47 | 81 | 11 | 19 | 58 | [48] |
| May 2007–Oct 2009 | western Pacific Ocean | Open ocean | 11 ± 4.8 | 72 ± 39 | 4.3 ± 1.7 | 28 ± 15 | 15 ± 5.1 | [52] |
| March–April 2014 | northwestern Pacific Ocean | Open ocean | 80 ± 55 | 88 ± 80 | 11 ± 7 | 12 ± 11 | 91 ± 55 | [47] |
| April 2010–November 2012 | Rishiri Island, Japan | Island | 35 ± 11 | 86 ± 37 | 5.5 ± 4.1 | 14 ± 11 | 41 ± 12 | [53] |
| March–April 2006 | Qindao, China | Coastal city | 783 | 81 | 180 | 19 | 963 | [20] |
| January–July 2013 | Beijing, China | Inland city | 758 | 79 | 204 | 21 | 962 | [54] |
| July 2008–August 2009 | Xian, China | Inland city | 377 ± 349 | 56 ± 71 | 300 ± 263 | 44 ± 55 | 677 ± 594 | [55] |
| March–May 2015 | East China Sea | Marginal sea | 219 | 68 | 102 | 32 | 321 | [46] |
| January–December 2006 | Keelung, Taiwan | Coastal city | 213 ± 81 | 74 ± 38 | 76 ± 28 | 26 ± 13 | 289 ± 102 | [17] |
| September 2015–March 2017 | Daya Bay, China | Coastal city | 19 ± 18 | 36 ± 40 | 33 ± 22 | 63 ± 56 | 52 ± 29 | [56] |
| August 2013–May 2014 | Guangzhou, China | Coastal city | 260 ± 180 | 86 ± 81 | 43 ± 32 | 14 ± 11 | 303 ± 196 | [57] |
| April–May 2005 | South China Sea | Marginal sea | 131 | 67 | 65 | 33 | 196 | [20] |
| March–April 2007 | Singapore | Coastal city | 98 ± 35 | 70 ± 35 | 43 ± 27 | 30 ± 22 | 141 ± 50 | [58] |
| April 2007–March 2009 | Dongsha, Taiwan | Island | 132 ± 88 | 63 ± 53 | 79 ± 42 | 37 ± 27 | 211 ± 112 | This study |
| NO3− | NH4+ | WSIN | WSON | WSTN | Na+ | Mg2+ | Cl− | K+ | Ca2+ | SO42− | nss-K+ | nss-Ca2+ | nss-SO42− | Cl− Depletion | Wind Speed | |
|---|---|---|---|---|---|---|---|---|---|---|---|---|---|---|---|---|
| NO3− | 1 | |||||||||||||||
| NH4+ | 0.77 ** | 1 | ||||||||||||||
| WSIN | 0.88 ** | 0.96 ** | 1 | |||||||||||||
| WSON | 0.39 ** | 0.35 ** | 0.41 ** | 1 | ||||||||||||
| WSTN | 0.83 ** | 0.88 ** | 0.93 ** | 0.72 ** | 1 | |||||||||||
| Na+ | 0.42 ** | 0.14 ** | 0.26 ** | 0.07 | 0.23 ** | 1 | ||||||||||
| Mg2+ | 0.47 ** | 0.21 ** | 0.33 ** | 0.11 | 0.30 ** | 0.99 ** | 1 | |||||||||
| Cl− | 0.25 ** | −0.05 | 0.06 | −0.03 | 0.04 | 0.94 ** | 0.92 ** | 1 | ||||||||
| K+ | 0.76 ** | 0.76 ** | 0.81 ** | 0.27 ** | 0.73 ** | 0.59 ** | 0.64 ** | 0.41 ** | 1 | |||||||
| Ca2+ | 0.70 ** | 0.58 ** | 0.67 ** | 0.30 ** | 0.63 ** | 0.77 ** | 0.82 ** | 0.65 ** | 0.85 ** | 1 | ||||||
| SO42− | 0.76 ** | 0.90 ** | 0.90 ** | 0.40 ** | 0.84 ** | 0.34 ** | 0.40 ** | 0.12 | 0.86 ** | 0.70 ** | 1 | |||||
| nss-K+ | 0.69 ** | 0.84 ** | 0.84 ** | 0.29 ** | 0.76 ** | 0.14 ** | 0.21 ** | −0.04 | 0.89 ** | 0.59 ** | 0.85 ** | 1 | ||||
| nss-Ca2+ | 0.71 ** | 0.74 ** | 0.78 ** | 0.39 ** | 0.75 ** | 0.37 ** | 0.44 ** | 0.22 ** | 0.79 ** | 0.87 ** | 0.76 ** | 0.76 ** | 1 | |||
| nss-SO42− | 0.73 ** | 0.91 ** | 0.90 ** | 0.40 ** | 0.85 ** | 0.23 ** | 0.29 ** | 0.01 | 0.81 ** | 0.63 ** | 0.99 ** | 0.86 ** | 0.75 ** | 1 | ||
| Cl− depletion | 0.57 ** | 0.64 ** | 0.66 ** | 0.39 ** | 0.66 ** | 0.17 ** | 0.20 ** | −0.12 | 0.59 ** | 0.42 ** | 0.72 ** | 0.62 ** | 0.49 ** | 0.73 ** | 1 | |
| Wind speed | 0.53 ** | 0.25 ** | 0.39 ** | 0.11 | 0.34 ** | 0.82 ** | 0.82 ** | 0.72 ** | 0.62 ** | 0.71 ** | 0.41 ** | 0.29 ** | 0.41 ** | 0.33 ** | 0.24 ** | 1 |
| Factor 1 | Factor 2 | Factor 3 | |
|---|---|---|---|
| NH4+ | −0.884 | −0.336 | 0.139 |
| NO3− | −0.871 | 0.003 | 0.048 |
| WSIN | −0.936 | −0.224 | −0.047 |
| WSON | −0.464 | −0.218 | 0.840 |
| WSTN | −0.903 | −0.260 | 0.301 |
| Cl− | −0.281 | 0.944 | 0.050 |
| Na+ | −0.488 | 0.855 | 0.044 |
| Mg2+ | −0.553 | 0.818 | 0.049 |
| SO42− | −0.941 | −0.157 | −0.102 |
| K+ | −0.929 | 0.166 | 0.193 |
| Ca2+ | −0.845 | 0.456 | 0.003 |
| nss-SO42− | −0.915 | −0.267 | −0.111 |
| nss-K+ | −0.855 | −0.287 | 0.261 |
| nss-Ca2+ | −0.865 | 0.013 | −0.030 |
| Cl− depletion % | −0.699 | −0.297 | 0.037 |
| Eigenvalue | 9.336 | 3.072 | 0.957 |
| % Total variance | 62.24 | 20.48 | 6.38 |
| Cumulative % | 62.24 | 82.72 | 89.10 |
| Probable source | Combustion, Biomass burning and crustal sources | Marine source | Combined sources |
| WSTN | WSON | WSIN | |
|---|---|---|---|
| April 2007 | 167 ± 36.9 | 118 ± 28.2 | 48.7 ± 16.1 |
| May 2007 | 159 ± 110 | 99.4 ± 74.8 | 59.7 ± 40.4 |
| June 2007 | 56.0 ± 18.3 | 35.2 ± 13.1 | 20.9 ± 8.10 |
| July 2007 | 65.6 ± 14.5 | 35.2 ± 19.0 | 30.4 ± 7.46 |
| August 2007 | 64.7 ± 34.9 | 43.5 ± 24.3 | 21.2 ± 11.0 |
| September 2007 | 149 ± 63.2 | 55.2 ± 16.4 | 94.0 ± 50.4 |
| October 2007 | 131 ± 24.2 | 36.3 ± 21.3 | 94.8 ± 16.5 |
| November 2007 | 129 ± 29.2 | 46.8 ± 19.4 | 82.3 ± 15.9 |
| December 2007 | 138 ± 31.8 | 49.7 ± 12.5 | 88.1 ± 22.8 |
| January 2008 | 131 ± 28.0 | 56.5 ± 14.2 | 74.9 ± 22.5 |
| February 2008 | 172 ± 52.0 | 87.6 ± 28.2 | 84.5 ± 30.8 |
| March 2008 | 231 ± 48.7 | 137 ± 30.2 | 93.9 ± 25.2 |
| April 2008 | 179 ± 36.9 | 109 ± 20.0 | 69.6 ± 24.1 |
| May 2008 | 174 ± 65.3 | 110 ± 45.2 | 63.6 ± 27.6 |
| June 2008 | 82.5 ± 28.7 | 55.1 ± 21.4 | 27.3 ± 9.40 |
| July 2008 | 77.8 ± 24.2 | 53.2 ± 19.9 | 24.5 ± 6.66 |
| August 2008 | 72.2 ± 26.1 | 47.2 ± 17.2 | 25.0 ± 9.80 |
| September 2008 | 141 ± 58.2 | 71.9 ± 31.1 | 68.8 ± 39.1 |
| October 2008 | 161 ± 56.0 | 90.1 ± 27.1 | 70.8 ± 32.7 |
| November 2008 | 168 ± 54.1 | 97.2 ± 34.6 | 70.4 ± 23.6 |
| December 2008 | 158 ± 49.1 | 66.8 ± 23.7 | 91.0 ± 30.7 |
| January 2009 | 152 ± 20.8 | 66.8 ± 23.3 | 85.0 ± 14.7 |
| February 2009 | 144 ± 47.8 | 86.8 ± 24.7 | 57.6 ± 23.7 |
| March 2009 | 174 ± 37.3 | 109 ± 25.7 | 65.9 ± 20.4 |
| Average | 137 ± 62.1 | 73.5 ± 39.9 | 63.0 ± 34.4 |
| Sampling Periods | Location | Station Type | NO3− | NH4+ | WSIN | WSON | WSTN | Reference |
|---|---|---|---|---|---|---|---|---|
| March–April 2014 | North-western Pacific Ocean | Open ocean | 16 ± 20 | 1.7 ± 1.4 | 18 ± 20 | 2.8 ± 2.4 | 21 ± 22 | [47] |
| March–May 2015 | North-western Pacific Ocean | Open ocean | 8.0 | 0.5 | 8.5 | 4.0 | 12.5 | [46] |
| April 2010–March 2011 | Huaniao, China | Island | 37 | 4.35 | 41.35 | [15] | ||
| January–December 2007 | Dinghushan, China | Coastal city | 26 | 52 | 78 | 26 | 104 | [70] |
| November 2006–October 2007 | Hengmen, China | Coastal city | 27 | 39 | 66 | 30 | 96 | [70] |
| September 2015–March 2017 | Daya Bay, China | Coastal city | 8.46 | 0.93 | 9.44 | 16.33 | 25.77 | 56] |
| January–December 2006 | Keelung, Taiwan | Coastal city | 5.6 ± 1.4 | 34 ± 15 | 39 ± 17 | 22 ± 9 | 61 ± 19 | [17] |
| July 2010–March 2011 | Dongsha, Taiwan | Island | 16 ± 14 | 7 ± 5 | 23 ± 15 | [21] | ||
| April 2007–March 2009 | Dongsha, Taiwan | Island | 21 ± 11 | 2.5 ± 2.1 | 23 ± 13 | 27 ± 15 | 50 ± 23 | This study |
| March–April 2007 | Singapore | Coastal city | 18 ± 5.7 | 10 ± 6.4 | 28 ± 8.6 | 16 ± 10 | 54 ± 19 | [58] |
© 2018 by the authors. Licensee MDPI, Basel, Switzerland. This article is an open access article distributed under the terms and conditions of the Creative Commons Attribution (CC BY) license (http://creativecommons.org/licenses/by/4.0/).
Share and Cite
Chen, H.-Y.; Huang, S.-Z. Effects of Atmospheric Dry Deposition on External Nitrogen Supply and New Production in the Northern South China Sea. Atmosphere 2018, 9, 386. https://doi.org/10.3390/atmos9100386
Chen H-Y, Huang S-Z. Effects of Atmospheric Dry Deposition on External Nitrogen Supply and New Production in the Northern South China Sea. Atmosphere. 2018; 9(10):386. https://doi.org/10.3390/atmos9100386
Chicago/Turabian StyleChen, Hung-Yu, and Shih-Zhe Huang. 2018. "Effects of Atmospheric Dry Deposition on External Nitrogen Supply and New Production in the Northern South China Sea" Atmosphere 9, no. 10: 386. https://doi.org/10.3390/atmos9100386
APA StyleChen, H.-Y., & Huang, S.-Z. (2018). Effects of Atmospheric Dry Deposition on External Nitrogen Supply and New Production in the Northern South China Sea. Atmosphere, 9(10), 386. https://doi.org/10.3390/atmos9100386