Article

Phytoplankton and Bacterial Response to Desert Dust Deposition in the Coastal Waters of the Southeastern Mediterranean Sea: A Four-Year In Situ Survey

1
Israel Oceanographic and Limnological Research, National Institute of Oceanography, Haifa 3108000, Israel
2
Institute of Marine Science, University of California, Santa Cruz, CA 95604, USA
*
Author to whom correspondence should be addressed.
Atmosphere 2018, 9(8), 305; https://doi.org/10.3390/atmos9080305
Submission received: 6 June 2018 / Revised: 1 August 2018 / Accepted: 1 August 2018 / Published: 3 August 2018

Abstract

:
Atmospheric dust/aerosol deposition is an important source of external nutrients for the surface of the ocean. This study shows high-resolution observational data gathered in situ over a period of four years on bacterial and phytoplankton abundance and activity during typical background atmospheric conditions and during intense dust storm events in the low-nutrient, low-chlorophyll (LNLC) coastal waters of the southeastern Mediterranean Sea (SEMS). Chlorophyll a (an estimate for phytoplankton biomass) and bacterial abundance show moderate changes in response to dust deposition/events (−10% and +20%, respectively), while primary production, bacterial production, and N2 fixation rates were all significantly and positively affected by deposition (+25 to +40%; p < 0.05). The rapid changes in bacterial and/or phytoplankton rate parameters suggest that the released micro-/macronutrients from atmospheric deposition are tunneled directly in metabolic processes and, to a lesser extent, for biomass accumulation. The predicted expansion of LNLC areas in oceans in the future, and the projected increase in dust emission due to desertification, may affect the production of marine microbial communities in the surface of the ocean, yet only moderately affect their biomass or standing stock. Such alterations may impact carbon sequestration to the deep ocean.

1. Introduction

Desert dust is a source of micro- and macronutrients [1,2,3,4] and airborne microbes [5,6,7,8,9] for ocean surfaces worldwide. The chemical and biological properties of dust differ according to the origin of the dust and atmospheric reactions during transport prior to deposition (UV light, pH, temperature, etc.) [7,8,10,11]. Numerous studies show that dust deposition in seawater can alter bacterial and phytoplankton biomass and activity [12,13,14,15,16,17,18]. Dust is therefore recognized as an important factor that affects the ecology of many aquatic settings, especially low-nutrient, low-chlorophyll (LNLC) environments [19].
The coastal southeastern Mediterranean Sea (SEMS) is an LNLC oligotrophic environment [20,21,22,23]. The water is dominated by small-size microbial populations (e.g., heterotrophic bacteria, cyanobacteria) throughout the year [22,24,25], while diatom blooms are very rare [26,27]. Primary and bacterial production (PP and BP, respectively) as well as N2 fixation rates are usually low in the SEMS [22,27]. Microcosm simulations and local monitoring activities show that external nutrient inputs to SEMS coastal waters can affect bacterial/phytoplankton biomass and/or activity [23,28] and may even trigger a food-web cascade, leading to blooms of a rare cyanobacterial phylotype [27]. These data highlight the susceptibility of the ultra-oligotrophic SEMS coastal waters to external nutrient inputs, including those derived from dust/aerosol deposition.
Being enclosed by land/deserts, the SEMS coastal water receives high amounts of dust/aerosols annually from different origins [2,29,30,31]. Indeed, it has been demonstrated that atmospheric deposition is one of the most important external nutrient sources for the SEMS (i.e., NO3 + NO2, PO4) [31,32,33,34]. Recent microcosm bioassay studies show, for example, that dust added to the surface microlayer (upper 60 µm layer) resulted in up to fivefold and twofold increases in BP and PP, respectively [18,35]. However, such microcosm studies represent conditions during distinct and limited time points and may have some experimental limitations (i.e., bottle effect) [36]. Therefore, in situ measurements that capture natural variability in the net effect of external nutrient inputs and associated changes to the microbial community better represent natural conditions. Here, we compare in situ temporal dynamics of phytoplankton and bacteria during “typical” days (background value of Al in aerosols <2000 ng m−3) and dust deposition events (high Al concentration in aerosols, >2000 ng m−3) in the coastal SEMS between April 2013 and October 2017. The data are used to assess changes in the biomass of autotrophic and heterotrophic microbial communities and their productivity and N2 fixation rates attributed to aerosol deposition events.

2. Material and Methods

Surface water samples (1–2 m) were collected every 2–4 weeks between May 2015 and October 2017 at a monitoring station off the SEMS coast (32.28° N, 34.95° E). We used additional data collected at the same site between April 2013 and April 2015 [22] to complement this record. Samples were collected using the same protocols and procedures as described in [22], resulting in a relatively long (>4 years) record of phytoplankton and bacterial abundance and production rates in the coastal SEMS. In addition, during dust events, samples were taken more frequently, specifically during and 1–3 days after the events. Water samples were collected in transparent acid-clean (HCl, 10%) and bottle-rinsed 4.6 or 10 L Nalgene carboys and brought to the lab immediately for processing for the different analyses described below. Aerosol samples were usually collected weekly (integrated over 68 h) using a high-volume total suspended particles (TSP) sampler (flow rate of 42 m3 h−1) on Whatman 41 filters (high-quality cotton linters; GE Healthcare). TSP samples were also collected during dust storms over <24 h intervals, defined here by samples in which Al concentration reached >2000 ng m−3. This classification is based on previous studies from the Eastern Mediterranean Sea [2,37,38] that show: (1) significantly higher concentrations of Al were associated with air masses originating from desert sources/regions, and (2) the background concentrations of particulate Al in air show maximal values of 1670 ng m−3 (median of 717 ng m−3). Bulk Al concentrations in the TSP (collected during dust storms and typical non-storm days, n = 126) were measured after total digestion with hydrogen fluoride (HF) following the procedure of ASTM (1983) as described in [13]. The concentrations were measured on a Perkin-Elmer 1100B atomic absorption spectrometer [2]. We identified 4 main aerosol sources during the study period based on 3-day back trajectory analyses, arriving at 100, 500, and 1000 m altitude levels, commencing at 10:00 UTC using the NOAA HYSPLIT model (https://ready.arl.noaa.gov/HYSPLIT_traj.php) (Figure 1).
Chlorophyll a (Chl.a): Triplicate seawater samples (300 mL) were filtered through glass fiber filters (GF/F, pore size 0.7 µm, Whatman, Buckinghamshire, UK) and placed overnight in dark glass vials with 90% acetone solution. Chl.a fluorescence was read with a Turner Designs fluorometer (ex. 436 nm, em. 680 nm, San Jose, CA, USA) [39]. The instrument was calibrated using a Chl.a standard (Sigma, Darmstadt, Germany, CAS Number 479-61-8).
Heterotrophic bacterial abundance (BA): Water samples (1 mL) were fixed with pure glutaraldehyde solution (50% initial concentration; Sigma-Aldrich G7651), frozen in liquid nitrogen, and placed at −80 °C. Before analysis, the samples were thawed in a 37 °C water bath and stained with SYTO9 (1:105 vol:vol) for 10 min in the dark. Subsamples (100 µL) were run at 25 µL min−1 using an Attune® Acoustic Focusing Flow Cytometer (Applied Biosystems, Life Technologies, Carlsbad, CA, USA) equipped with 488 and 405 nm lasers. Taxonomic discrimination was based on green fluorescence, side scatter, and forward scatter [40]. Cyanobacterial autofluorescence was removed from the total bacterial counts. Beads of 1 µm size were used as reference for bacterial cells.
Primary production (PP): Triplicate seawater samples (50 mL) were placed in transparent polycarbonate Nalgene bottles and amended with a solution of NaH14CO3 (1 m Ci mL−1; Perkin Elmer, Boston, MA, USA). Additional samples were placed in dark Nalgene bottles as controls. Bottles were incubated for 24 h under ambient natural illumination and temperature. Added activity measurements were carried out immediately after spiking. The incubations were terminated by filtering the spiked seawater through GF/F filters (pore size 0.7 µm, Whatman, Buckinghamshire, UK) at low pressure. Hydrochloride acid (32%, 50 µL) was then added to remove excess 14C-bicarbonate (fuming lasted ~8 h). Scintillation cocktail (Ultima-Gold) was added to each vial (4 mL) and the radioactivity of each sample was measured using a TRI-CARB 2100 TR (Packard, Meriden, CT, USA) liquid scintillation counter [41].
Heterotrophic bacterial production (BP): Triplicate seawater samples (1.7 mL) were spiked with 3H-leucine (123 Ci mmol−1; Perkin Elmer, Boston, MA, USA) and incubated for 4–9 h under dark conditions at ambient temperature. Incubation was terminated by adding 100% trichloroacetic acid, followed by microcentrifugation [42]. Killed samples (trichloroacetic acid was added at the beginning of the incubation) were also carried out in triplicate. After adding 1 mL of scintillation cocktail (Ultima-Gold) to each vial, the samples were counted using a TRI-CARB 2100 TR (Packard, Meriden, CT, USA) liquid scintillation counter. A conversion factor of 3 kg C per mole of leucine incorporated and an isotopic dilution of 2.0 were used to calculate the C incorporated [43].
Dinitrogen (N2) fixation: Rates of N2 fixation were measured at discrete dates using the 15N2-enriched seawater method [44]. 15N2-enriched seawater was prepared as described in [22,45]. Triplicate seawater samples were collected in 4.6 L transparent Nalgene bottles and 225 mL of 15N-enriched seawater was added (5% of the incubation volume) without headspace. The samples were incubated for 24 h under ambient light and temperature. Natural isotope abundance measurements were also carried out. Incubations were terminated by filtering the seawater onto precombusted (450 °C, 4.5 h) GF/F (nominal pore size 0.7 µm) and dried overnight in an oven at 60 °C. The samples were analyzed on a NC2500 elemental analyzer (CE Instruments, Manchester, UK) interfaced to a Finnigan Delta Plus XP isotope ratio mass spectrometer (IRMS, Thermo Fisher Scientific, MT, USA). A standard curve was generated to determine N mass for each sample run. Detection limit for 15N uptake was 0.02 nmol N L−1 d−1.
Statistical analysis: A comparison between the values of Chl.a, BA, BP, PP, and N2 fixation during “dusty” days vs. “typical background” days was performed by student t-test. For regression analysis, the data were first log-transformed. All statistical analyses were performed using XLSTAT 2016 (Microsoft, New-York, USA) with a confidence level of 95%.

3. Results and Discussion

The SEMS is an oligotrophic LNLC marine environment [46,47,48] driven mainly by the general anti-estuarine circulation of the Mediterranean Sea [49]. This results in NO3– and PO43+–poor surface water [50,51,52] and low phytoplankton biomass/activity [47,53,54]. Coastal waters in the SEMS are also considered oligotrophic [21,22,23], except near local point sources that affect downstream waters (i.e., desalination brine, sporadic sewage spills) [27,55,56,57,58]. Previous studies show that phytoplankton at the SEMS coast are mainly N-limited [23] and heterotrophic bacteria and diazotrophs (N2 fixers) are C-limited during the summer [28,59].
Analyses of air mass back trajectories show that dust/aerosol arriving to the SEMS originate from six main sectors [37,60]. During the study period (2013–2017), however, dust/aerosol storm samples (median of 3844 ng Al m−3) originated from four sectors: the Sahara Desert (Figure 1A), Eastern Europe (Figure 1B), Iraq/Syria (Figure 1C), and the Middle East (Figure 1D). It was assessed that during dust events, about 5 µmol PO43+ and 300 µmol NO3 may be released per gram of deposited dust [2]. These nutrient additions can induce a fertilization effect and result in increased bacterial/phytoplankton biomass and activity, as observed in bioassay microcosm experiments using reagent-based nutrient additions [23] and/or dust/aerosol additions [13,18,61].

3.1. In Situ Response of Bacteria and Phytoplankton to Dust Storm Events

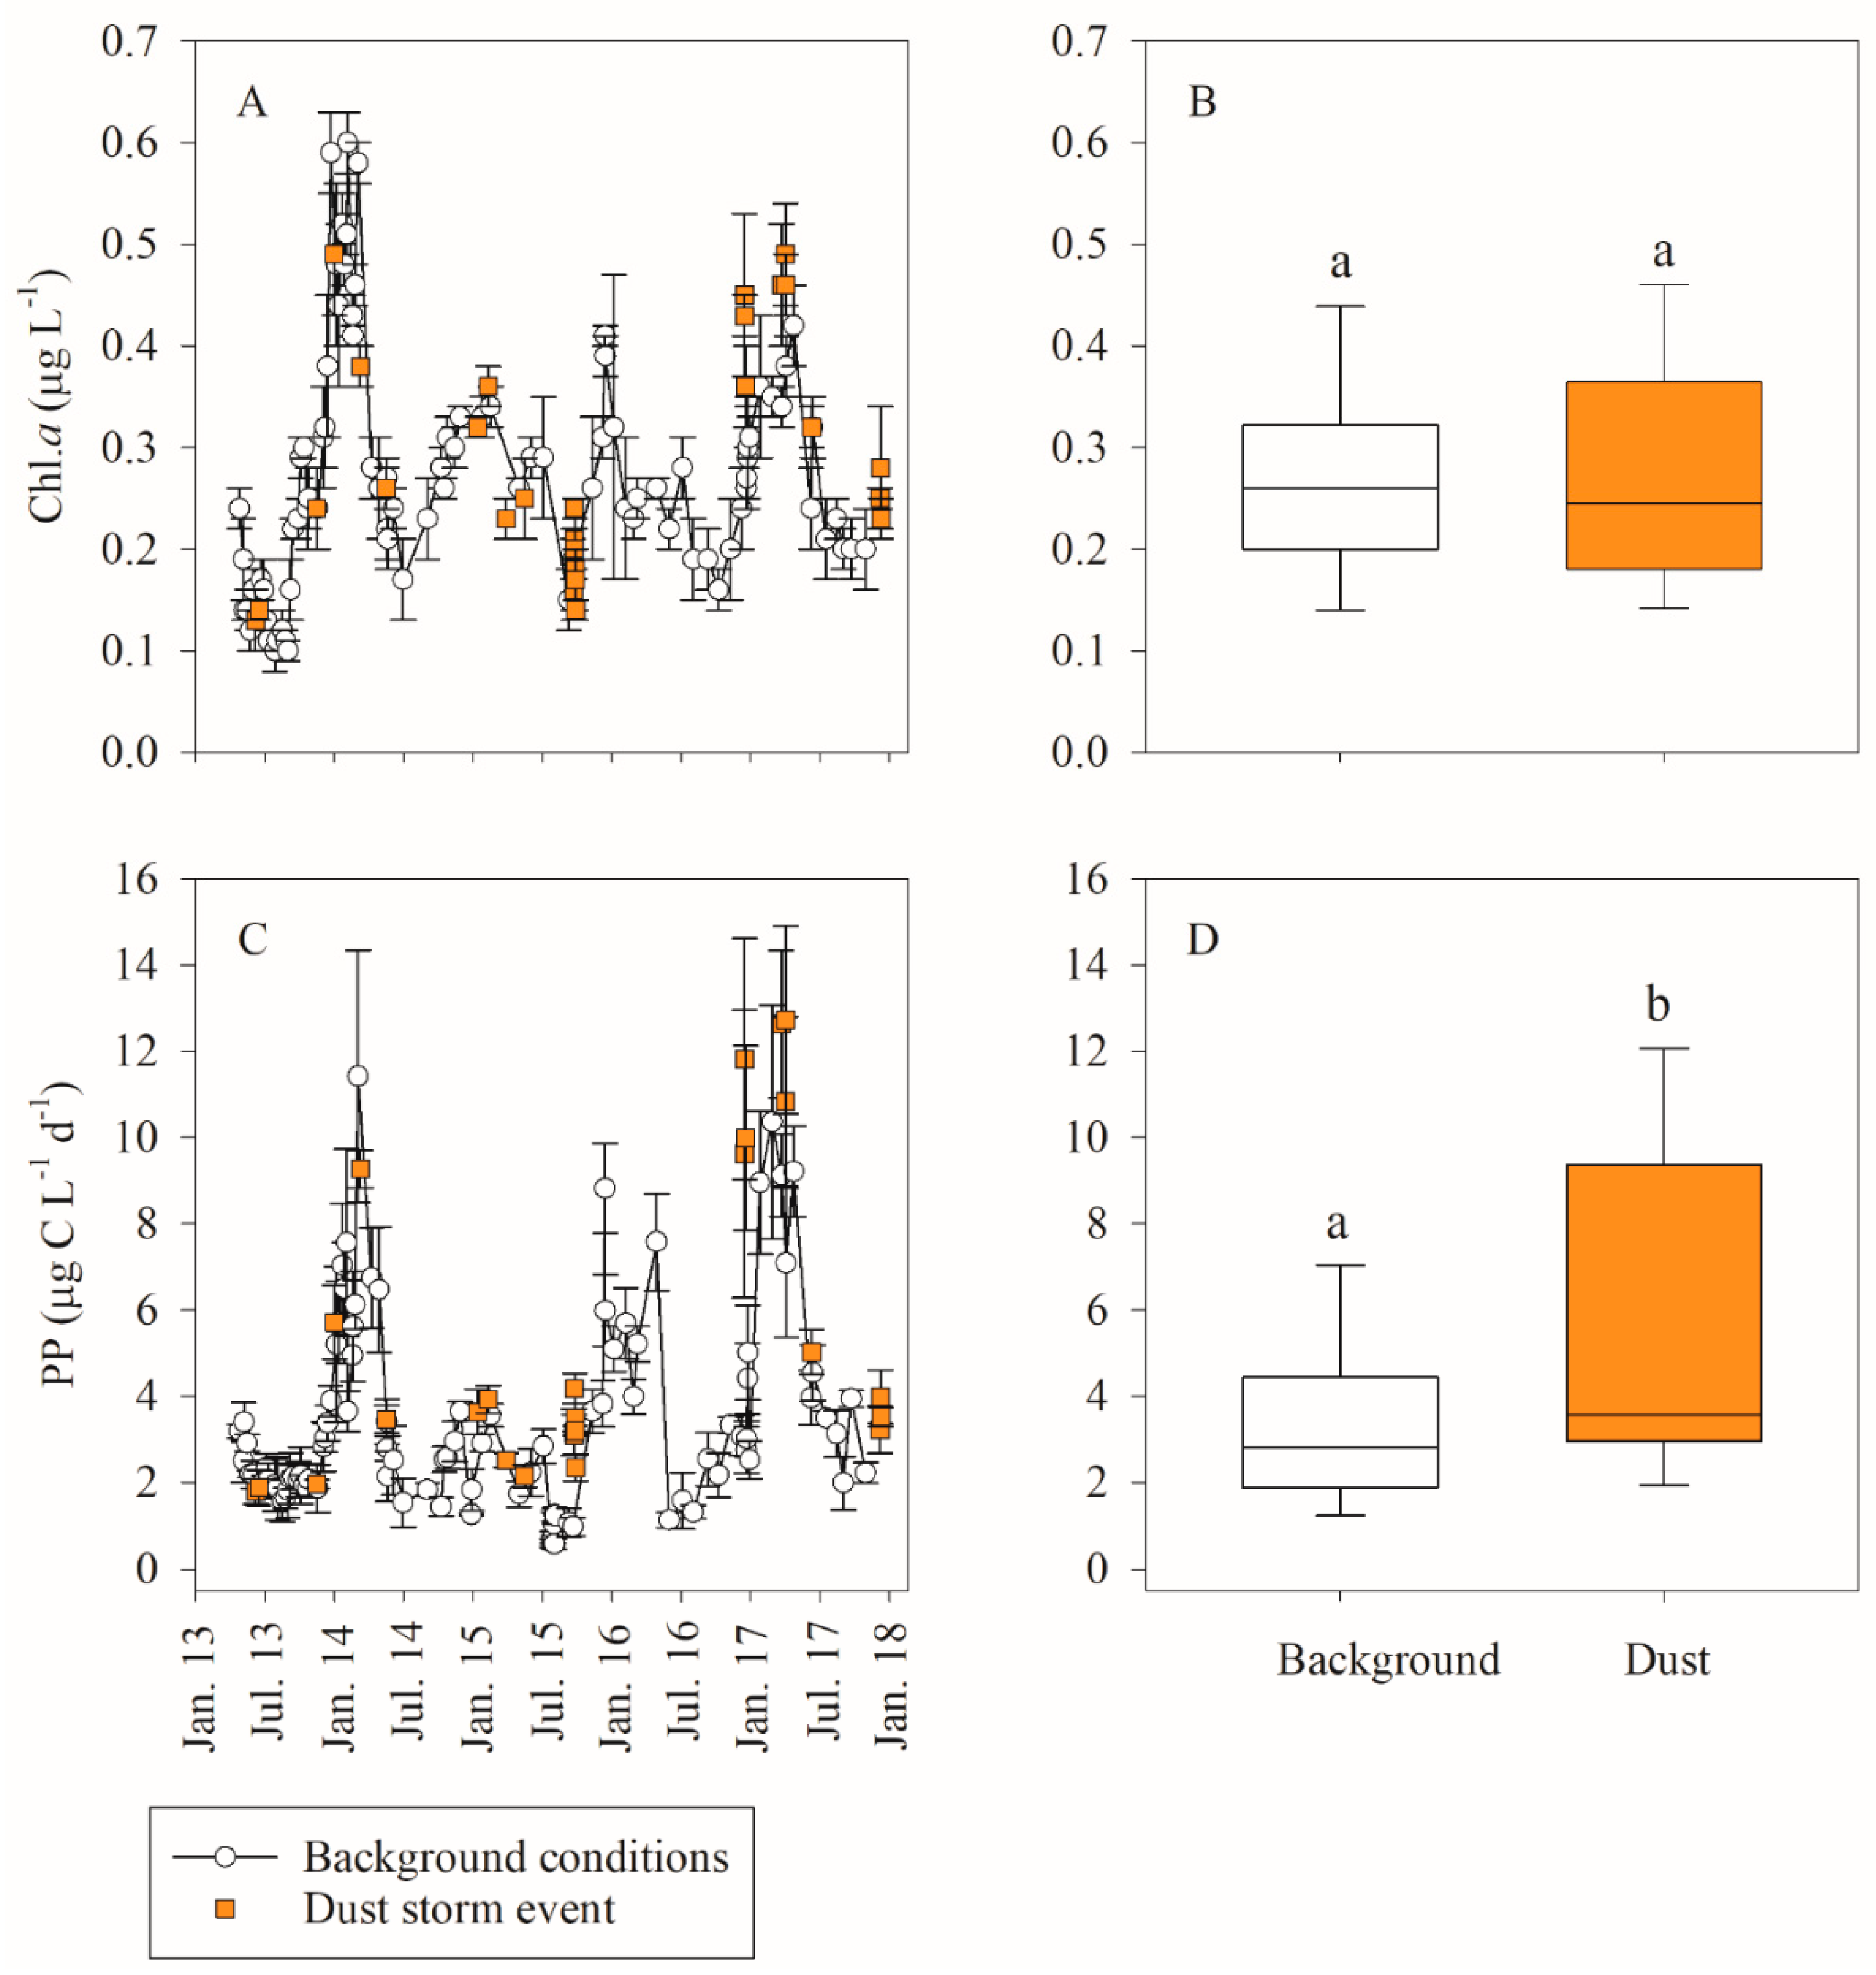
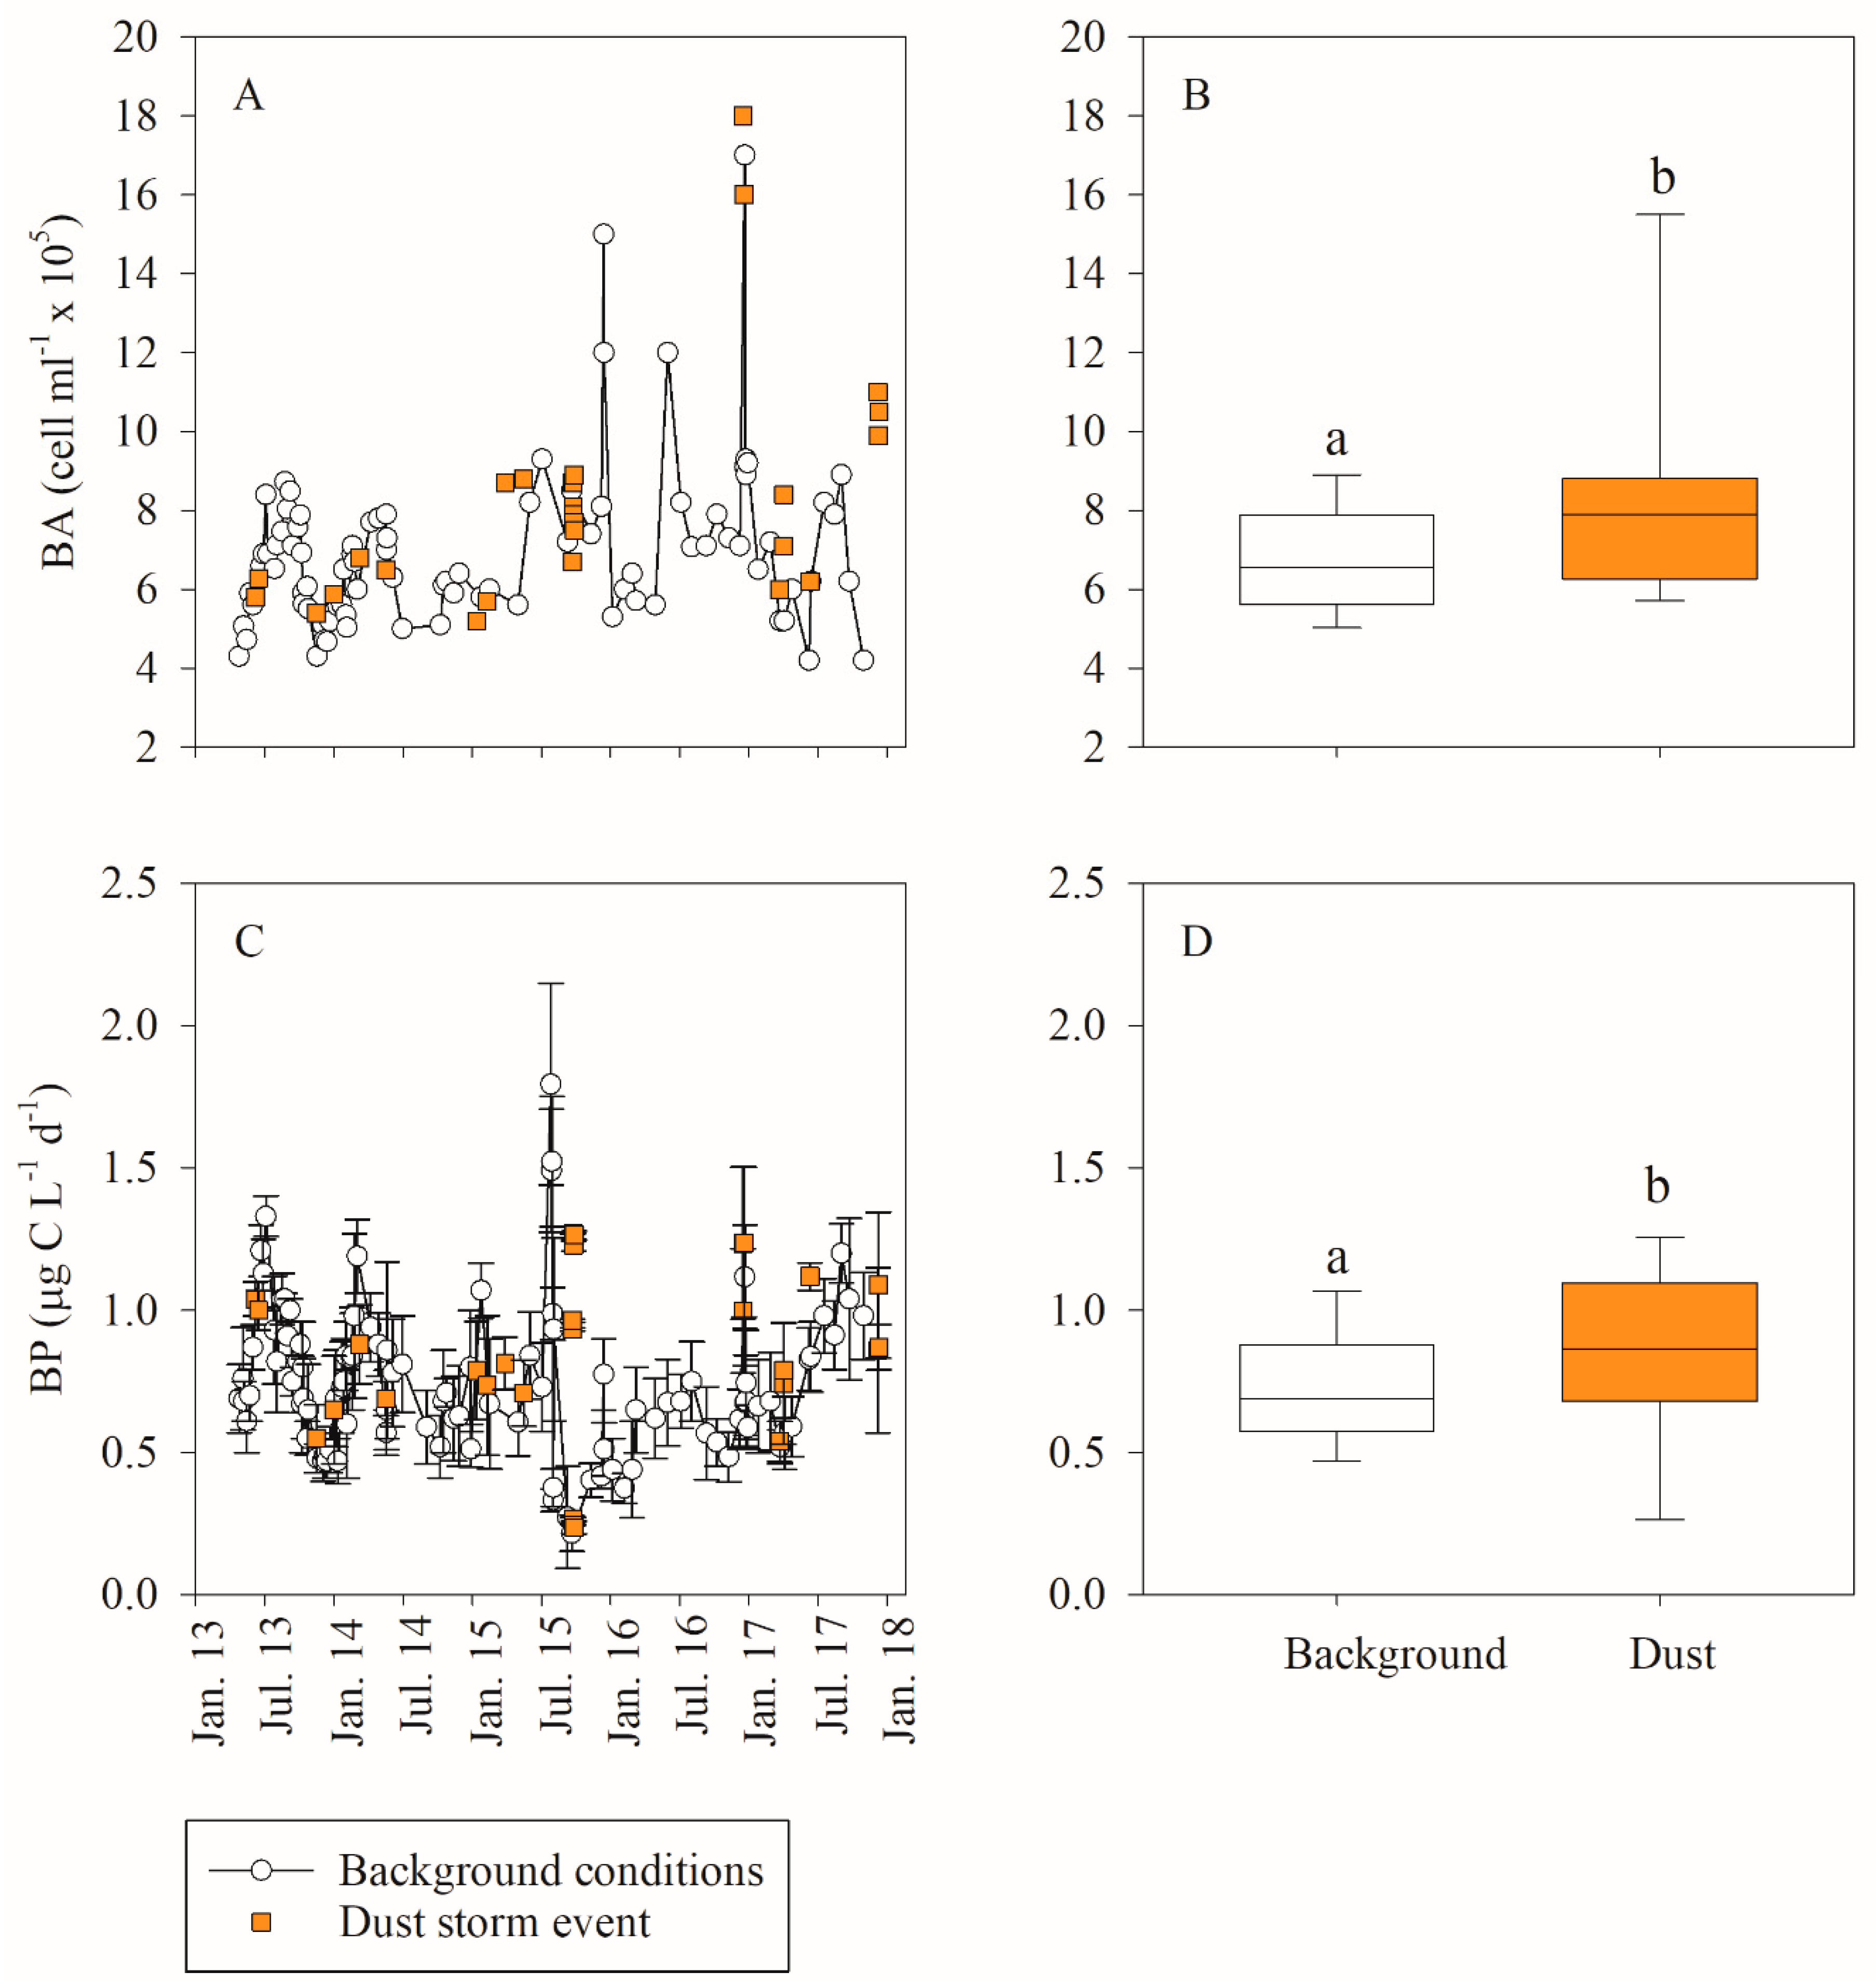
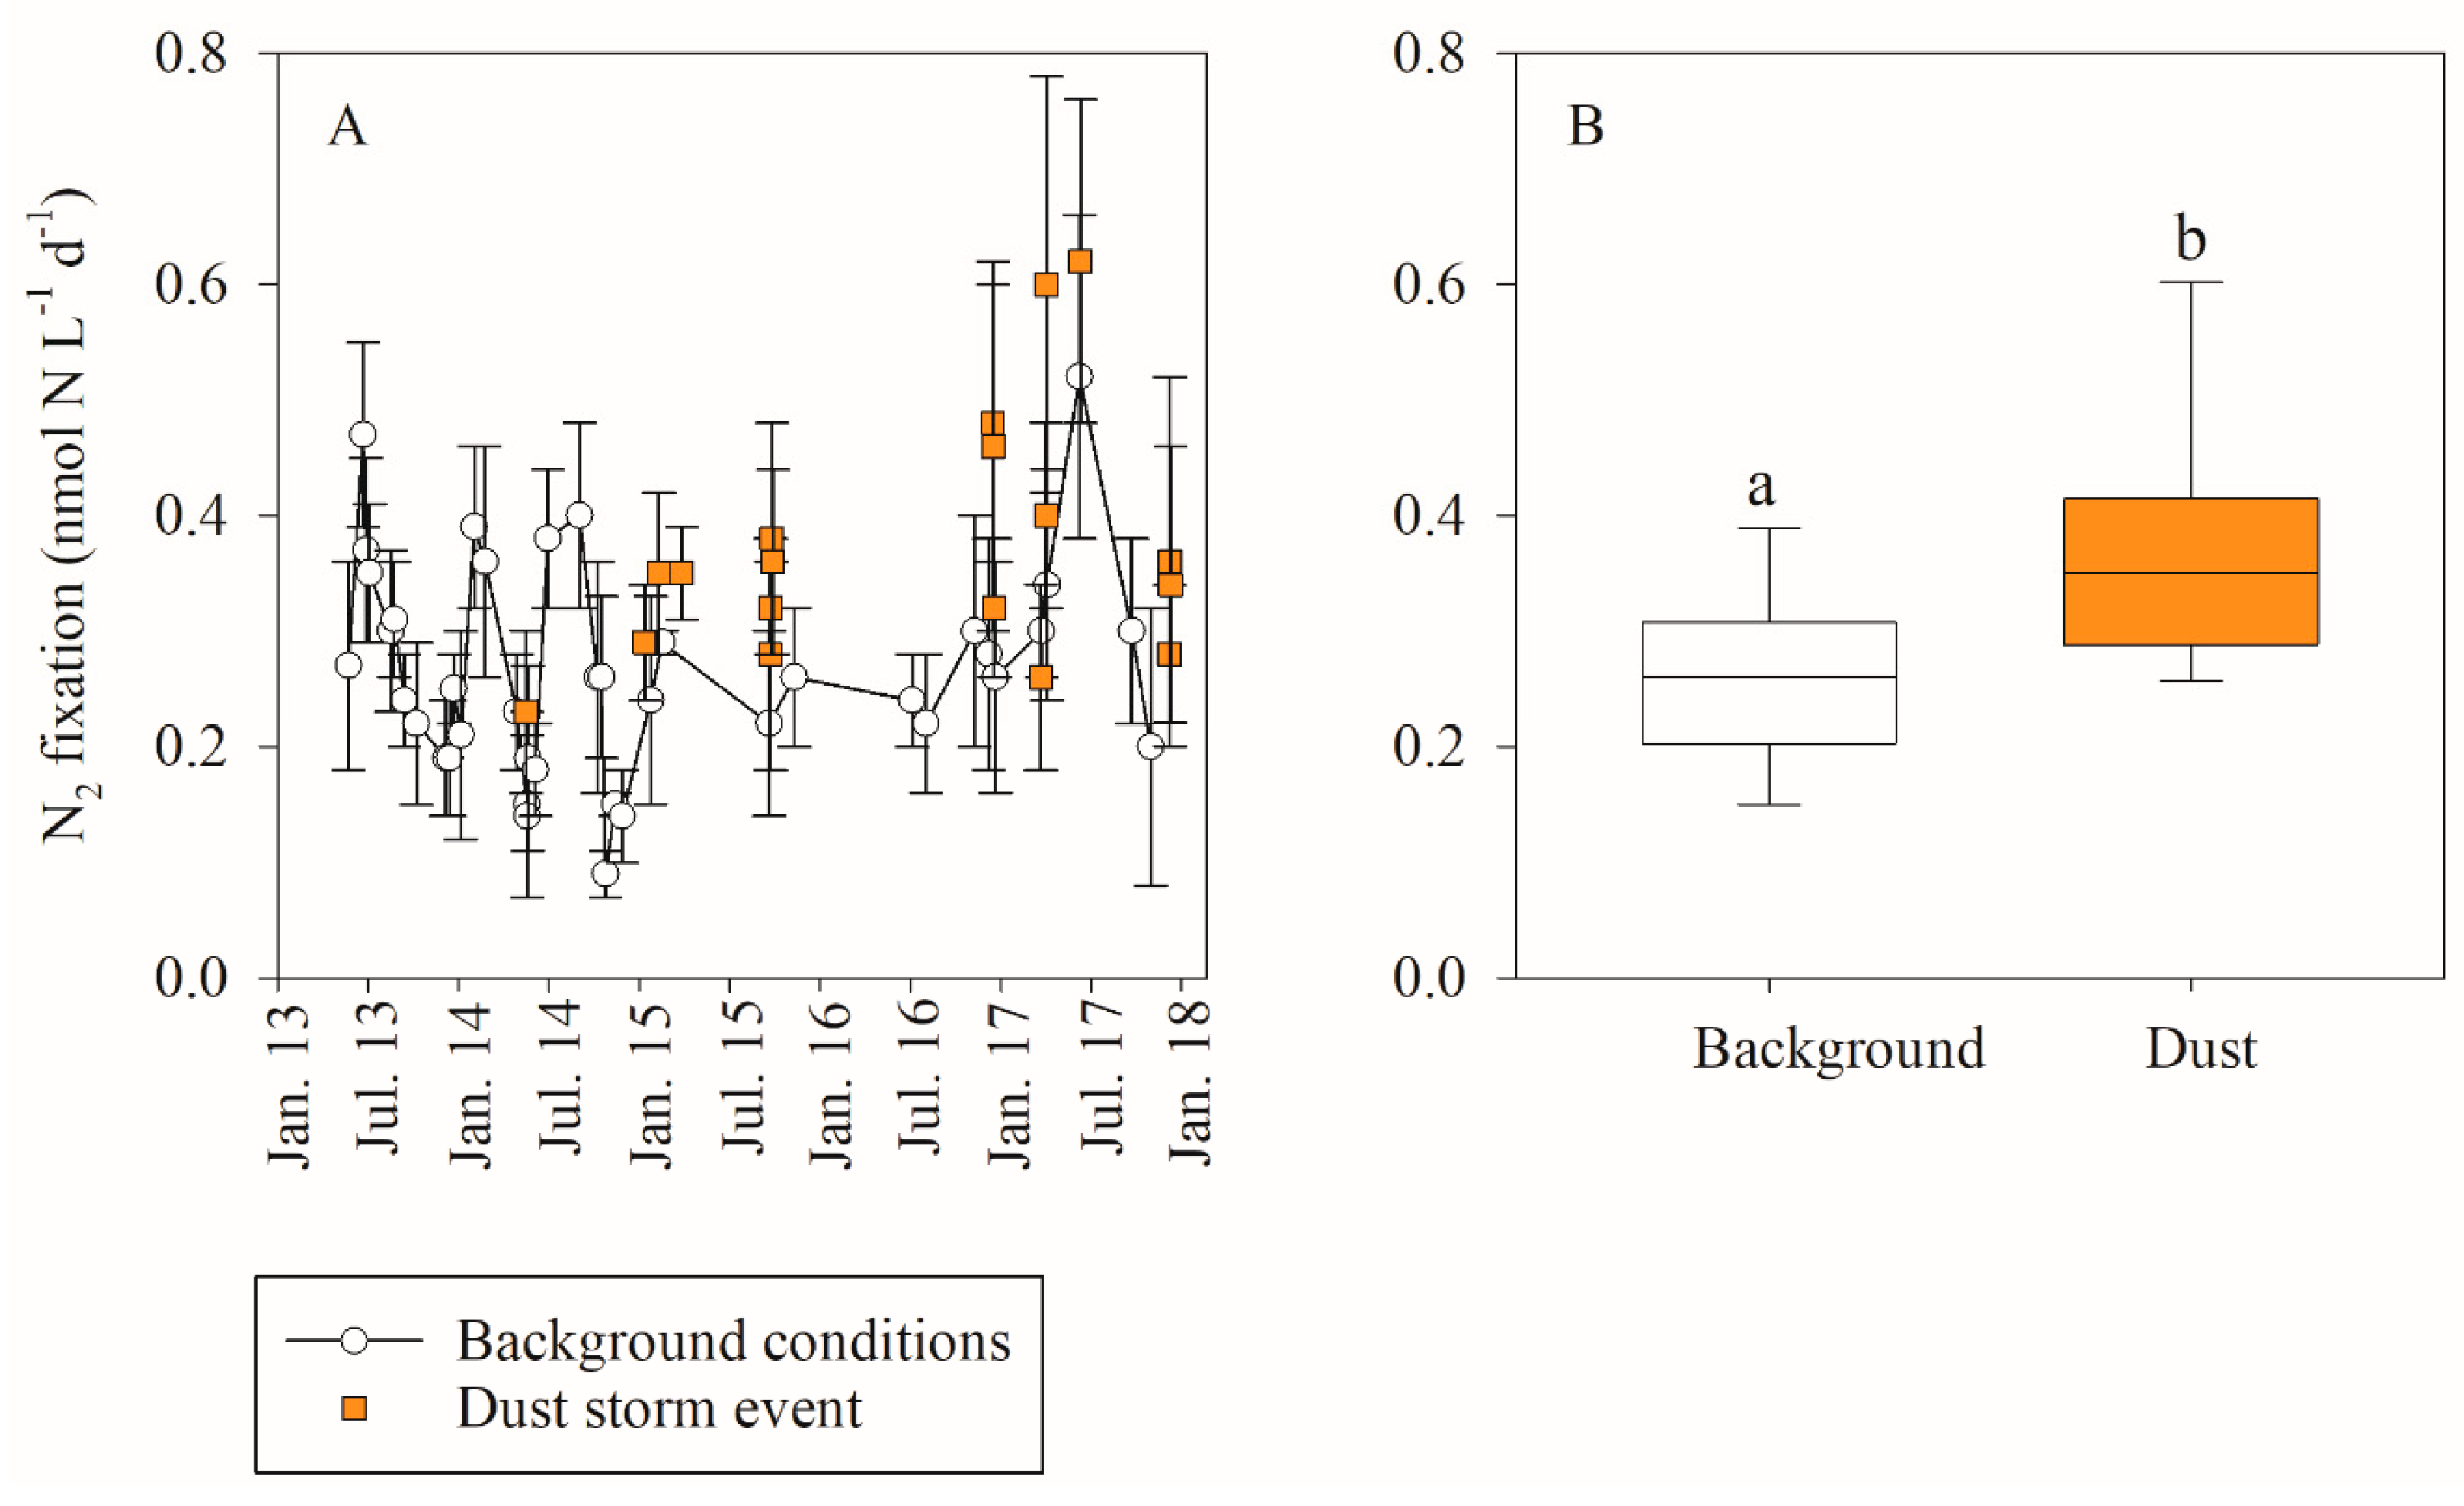
Seasonal fluctuations in phytoplankton and heterotrophic bacterial abundance (Chl.a, BA) and metabolic activity (BP, PP, N2 fixation) in the SEMS are shown in Figure 2, Figure 3 and Figure 4 and Supplementary Tables S1 and S2, and described in detail in Raveh et al. [22]. Briefly, phytoplankton biomass (as Chl.a) ranged between 0.10 and 0.60 µg L−1 (n = 89) and PP ranged between 0.6 and 11.4 µg C L−1 d−1 (n = 89) (Figure 2). Heterotrophic BA ranged from 4.2 × 10⁵ to 1.6 × 10⁶ cells mL−1 (n = 89) and BP rates were 0.2–1.8 µg C L−1 d−1 (n = 89) (Figure 3). Rates of N2 fixation were 0.1–0.5 nmol N L−1 d−1 (n = 40) (Figure 4). These values are in the range of previously published data from the SEMS [22,23,62], as well as from other oligotrophic marine environments [17,63,64,65].
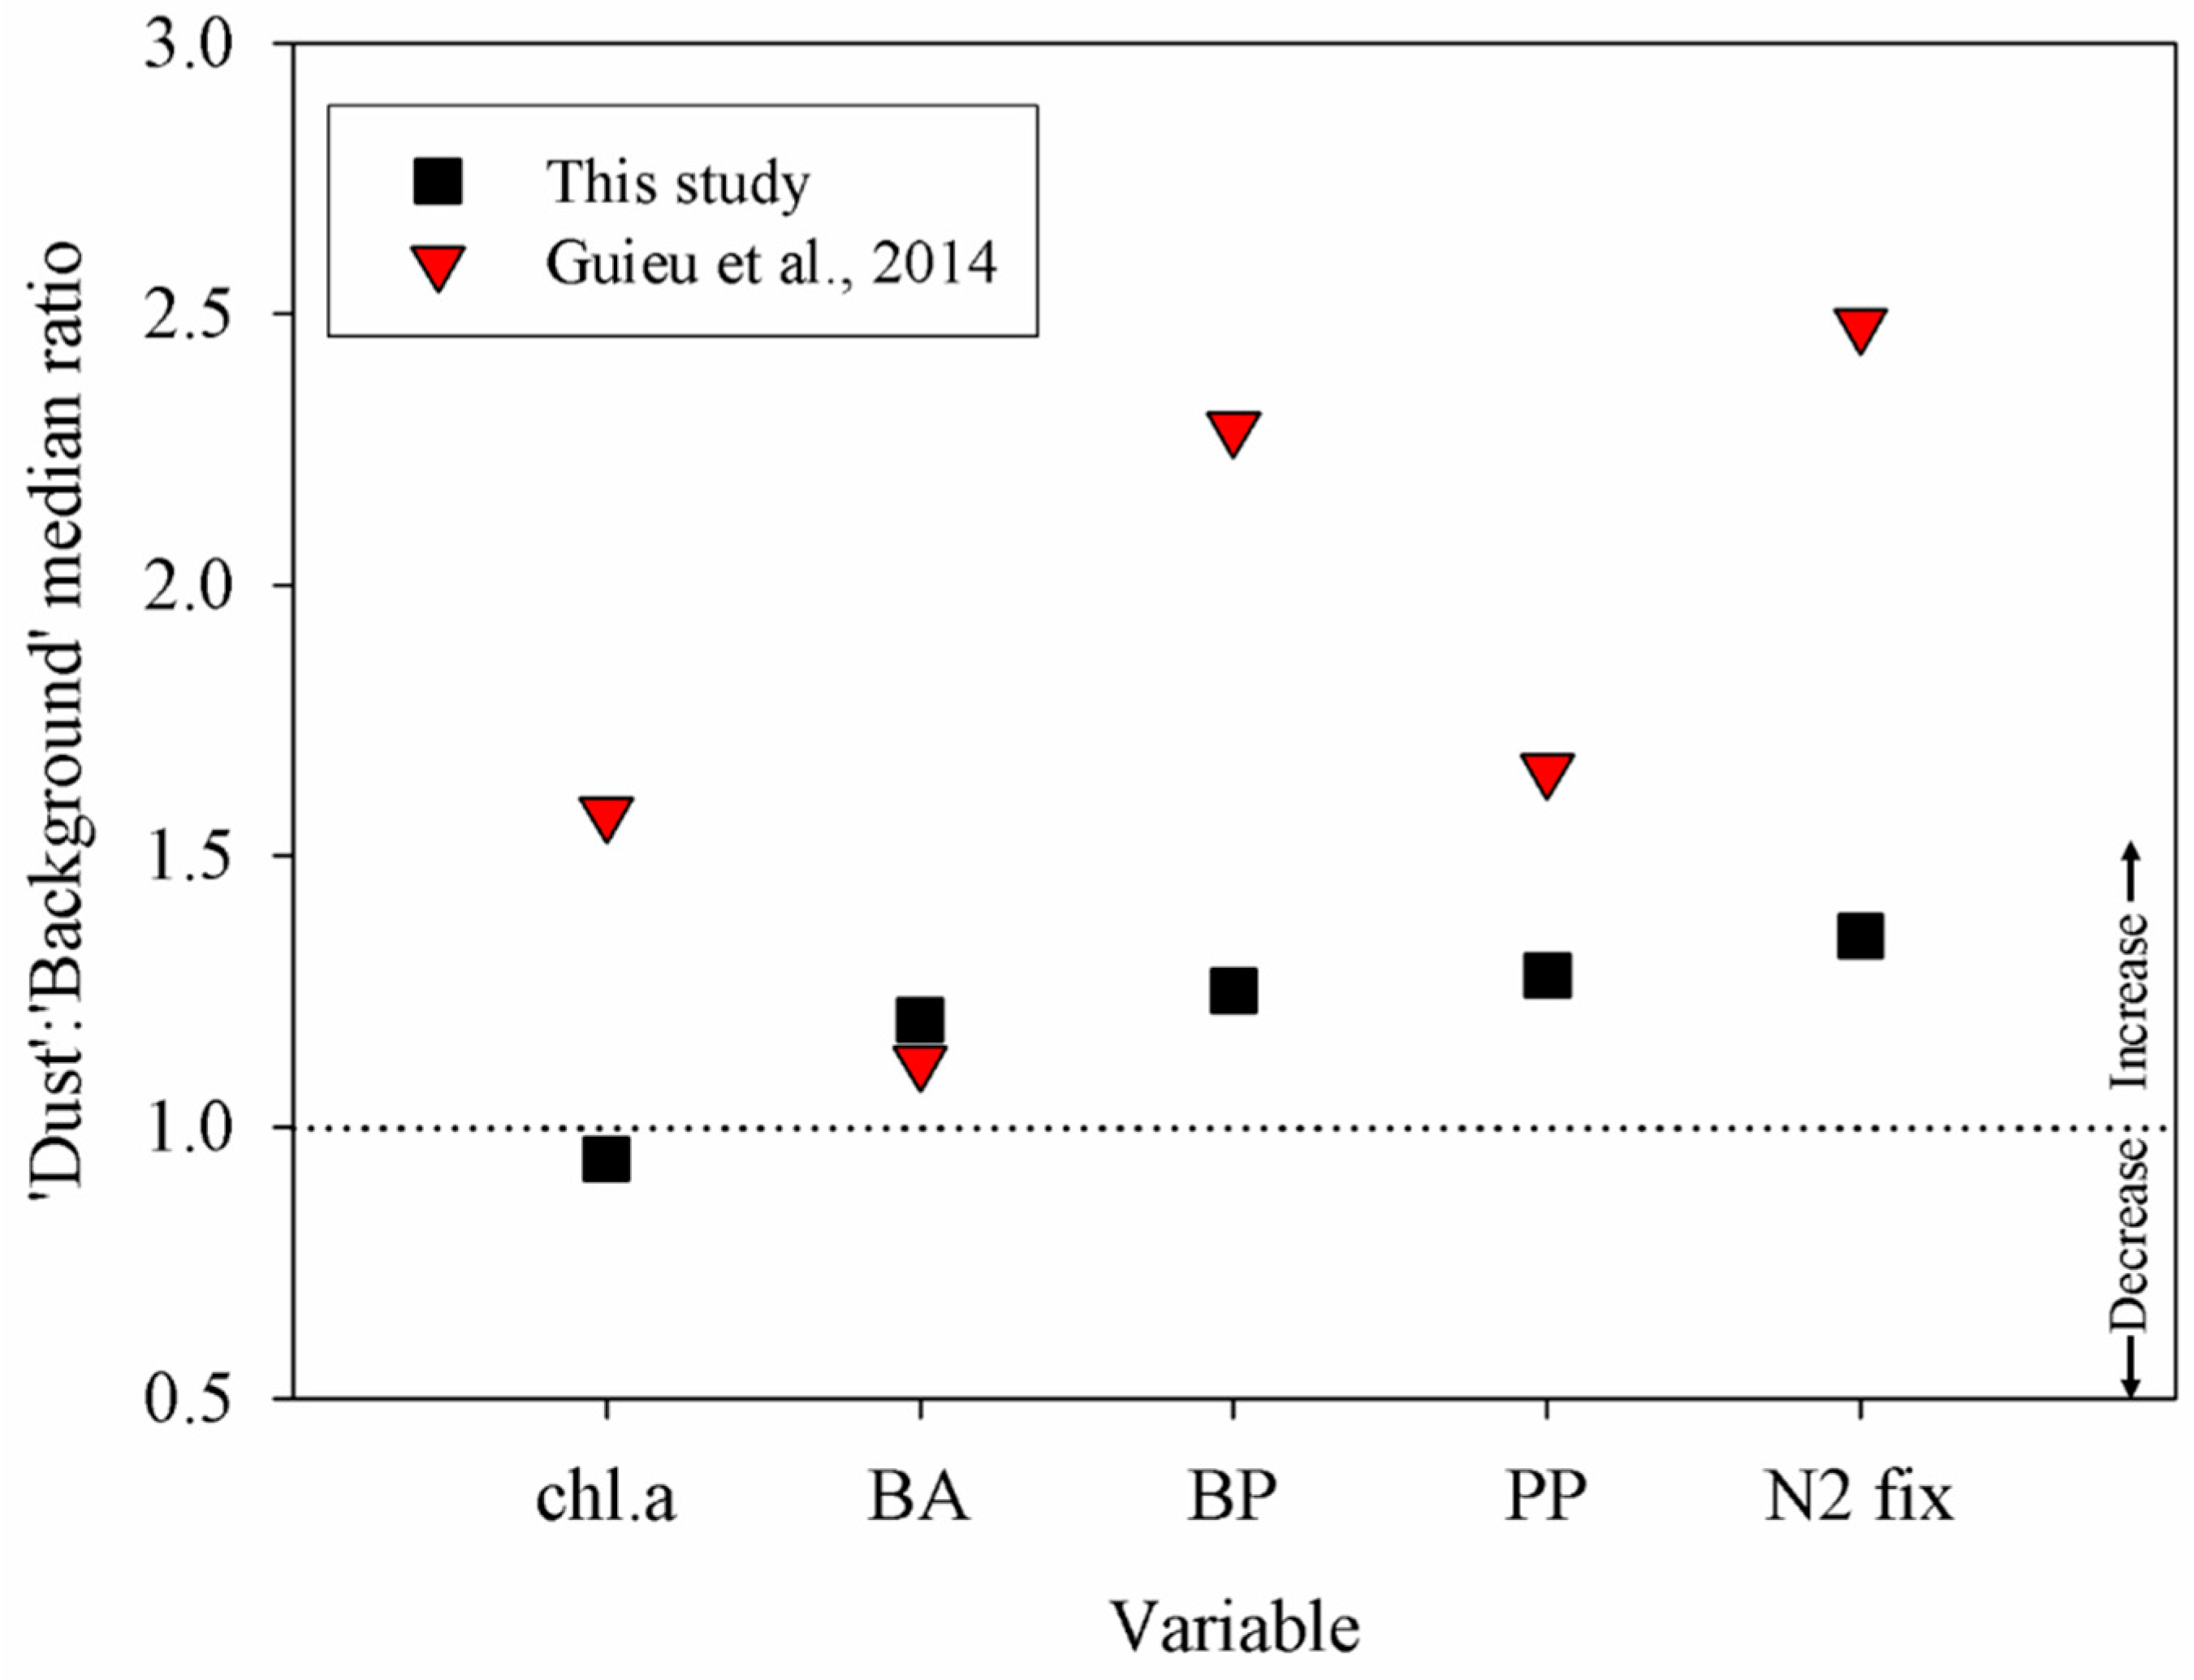
Here we show that dust storm events caused larger changes in metabolic rates (PP, BP, N2 fixation) than in abundance of phytoplankton or heterotrophic bacteria (Figure 2, Figure 3 and Figure 4, Supplementary Tables S1 and S2). Thus, during dust events, in situ Chl.a levels did not differ significantly from the background values (−6% change, p = 0.444) and bacterial abundance increased only moderately (+19%, p = 0.01), while PP (+28%, p = 0.006), BP (+25%, p = 0.048), and N2 fixation (+35%, p = 0.002) were all significantly higher (Figure 5). We therefore suggest that metabolic rate measurements (i.e., PP, BP, and N2 fixation) are more “sensitive” to atmospheric deposition events and related environmental changes in surface water than phytoplankton/bacterial standing stocks. Indeed, several previous studies based on bioassays reported that standing stocks of phytoplankton and bacterial abundance showed much smaller change to dust addition than activity measurements such as PP and BP (e.g., [13]). Similarly, Astrahan et al. [18] reported that dust added to the surface microlayer resulted in a 4- to 7-fold increase in BP, whereas bacterial abundance was only enhanced by 1.5- to 2-fold. We argue that these differences are attributed to the usually low growth rate of marine phytoplankton and heterotrophic bacteria (usually >1 d−1, [66,67]), suggesting that measurements made <24 h post deposition may not be sufficient to detect significant changes in biomass or diversity. On the contrary, alterations in rate measurements are usually much faster and therefore can be detected on short time scales. For example, Guo et al. [68] showed that PP and BP were enhanced within 6–24 h post aerosol addition, whereas the prokaryotic community composition (determined by 16S rRNA gene diversity analysis) remained unchanged in that short time scale.
Our results are consistent with the literature data compilation presented in Guieu et al. [19] and demonstrate that the response of heterotrophic microbes is usually stronger to dust deposition than that of autotrophic-dominated processes. Thus, the changes recorded in the BA, BP, and N2 fixation (which is governed mostly by heterotrophic diazotrophy in our study site, [28]) are usually higher compared to changes in Chl.a or PP (Figure 5). We argue that these differences may be attributed to the overall faster heterotrophic vs. autotrophic metabolism rate (i.e., respiration, bacterial growth efficiency), which may be especially evident in oligotrophic realms [67,69] such as the SEMS. Specifically, similar observations have been reported in other incubation studies from the Mediterranean Sea. For example, Herut et al. [12] showed that dust addition triggered a four-fold stronger response for BP than PP in the eastern Mediterranean Sea. Similarly, Pulido-Villena et al. [70] reported that Saharan dust inputs increased BA significantly, while Chl.a remained overall unchanged. The different responses between autotrophic and heterotrophic microbes may be explained by competition for resources. Heterotrophic bacteria are usually smaller than phytoplankton, therefore they have a higher surface area to volume ratio and may utilize dust-borne nutrients more efficiently [71]. Another possible explanation for the higher impact on heterotrophic-dominated processes is a nutrient “metabolic bypass.” A similar observation was reported during the CYCLOPS campaign [71] showing that addition of PO43+ caused a doubling of BP, while Chl.a significantly decreased. The authors suggested that the added PO43+ was utilized directly by heterotrophic bacteria, bypassing the primary producers [72,73].
The overall changes in the standing stock of heterotrophic bacteria and autotrophic phytoplankton of the SEMS’s coastal waters (−6% to +19%) and in the metabolic rates (+25% to +35%) reported in this study are within the range of values reported in the compilation presented in Guieu et al. [19], although for autotrophic components they were somewhat lower (Figure 5). The range of values reported for the various responses may be attributed to the amount of dust added/deposited (and its corresponding leached nutrients/trace metals), seasonality, the ambient surface microbial populations (cyanobacteria, diatoms, etc.), airborne bacteria [7,35,74,75,76], experimental limitation due to “bottle effect” [36], and the initial trophic state of the receiving waters (Figure 6, and see discussion below).

3.2. Relationship between Degree of Oligotrophy and Magnitude of the Metabolic Response

We suggest that the intensity of the metabolic rate change following dust deposition is a function of the degree of oligotrophy, defined here by the initial (predeposition) concentrations of Chl.a. When ultra-oligotrophic conditions prevailed (usually during summertime, Chl.a < 0.07 µg L−1; Figure 2A and see [77]), stronger increases were recorded in PP (maximum 100%), BP (maximum 256%), and N2 fixation (maximum 101%) (Figure 2, Figure 3 and Figure 4). This observation is strengthened by additional data from other studies across different marine provinces (Figure 6, and see [12,13,16,17,18,35,77,78,79,80,81,82,83]). We argue that the degree of the ecosystem’s oligotrophy can explain the variable responses recorded in metabolic rates following dust/aerosol deposition events worldwide (Figure 6, and reviewed by Guieu et al. [19]). For example, several studies have shown that nutrient release from dust may lead to an increase in phytoplankton biomass and PP [13,84], and thus potentially stimulate C export production [85,86]. Other studies, however, showed that dust addition may have deleterious effects on some cyanobacterial species/phytoplankton biomass [12,15,87,88], or may have an insignificant effect on PP rates and export production [88,89]. Thus, in marine areas where nutrients (i.e., N and P) are available for primary producers, one would expect a weak response to dust deposition. In contrary, when ultra-oligotrophic conditions prevail, leached nutrients from dust/aerosol may constitute a significant portion of the nutrient resource stimulating biological responses.
Another possible explanation for the higher metabolic response in ultra-oligotrophic regimes may be related to the diversity and activity of airborne microbes deposited with the dust/aerosol. Several studies have demonstrated that dust/aerosols contain a wide array of airborne microbes [6,7,8,9,10,90,91], with some remaining viable after deposition in seawater [7,35] or lake water [74,75]. This subject merits further examination in future studies.

4. Conclusions

Atmospheric dust/aerosol concentrations have increased in the last century as a result of land-use changes and desertification [19,92]. Model simulations predict that LNLC marine environments and arid areas will expand [93,94]. Numerous biochemical models suggest that atmospheric deposition can fertilize the surface water with micro-/macronutrients, resulting in a proportional increase in bacterial/phytoplankton biomass and production [3,19]. Our in situ measurements from the coastal SEMS show, however, that this fertilization effect is not straightforward, and that other environmental factors and interactions should be taken into account. Specifically, we show the following: (1) Dust addition affects metabolic rate measurements (PP, BP, and N2 fixation) more than phytoplankton or heterotrophic bacterial abundance/biomass. (2) Heterotrophic bacteria (biomass and activity) show a faster and stronger response to dust deposition than autotrophic-related variables (Chl.a, PP). We conjecture that this can cause a food-web cascade where heterotrophic metabolism will become more significant than autotrophic processes. (3) The more oligotrophic the ecosystem, the more pronounced the recorded production rate.

Supplementary Materials

The following are available online at https://www.mdpi.com/2073-4433/9/8/305/s1, Table S1: Summary of temporal variability in BA, Chl.a, BP, PP, and N2 fixation in coastal water of Tel-Shikmona, Haifa, Israel, April 2013 to September 2017 during typical (no dust) days. Table S2: Summary of temporal variability in BA, Chl.a, BP, PP, and N2 fixation in coastal water of Tel-Shikmona, Haifa, Israel, April 2013 to September 2017 during dusty days.

Author Contributions

Conceptualization: B.H.; and E.R.; Formal Analysis: N.B.; A.P.; B.H.; and E.R., Investigation: B.H.; N.B.; and E.R.; Resources: B.H.; and E.R., Writing-Original Draft Preparation: N.B.; A.P.; B.H.; and E.R.; Writing-Review & Editing: N.B.; A.P.; B.H.; and E.R., Funding Acquisition: A.P.; B.H.; and E.R.

Funding

This research was funded by the Israel Science Foundation grant number 1211/17, and by the NSF-OCE grant number 0850467.

Acknowledgments

We thank Mati Michael for English editing. The authors gratefully acknowledge the NOAA Air Resources Laboratory (ARL) for providing the HYSPLIT transport and dispersion model used in this publication.

Conflicts of Interest

The authors declare that the research was conducted in the absence of any potential conflict of interest.

References

  1. Duce, R.A.; Liss, P.S.; Merrill, J.T.; Atlas, E.L.; Buat-Menard, P.; Hicks, B.B.; Miller, J.M.; Prospero, J.M.; Arimoto, R.; Church, T.M.; et al. The atmospheric input of trace species to the world ocean. Glob. Biogeochem. Cycles 1991, 5, 193–259. [Google Scholar] [CrossRef]
  2. Herut, B.; Collier, R.; Krom, M.D. The role of dust in supplying nitrogen and phosphorus to the Southeast Mediterranean. Limnol. Oceanogr. 2002, 47, 870–878. [Google Scholar] [CrossRef] [Green Version]
  3. Jickells, T.D.; An, Z.S.; Andersen, K.K.; Baker, A.R.; Bergametti, G.; Brooks, N.; Cao, J.J.; Boyd, P.W.; Duce, R.A.; Hunter, K.A.; et al. Global iron connections between desert dust, ocean biogeochemistry, and climate. Science 2005, 308, 67–71. [Google Scholar] [CrossRef] [PubMed]
  4. Mahowald, N.; Jickells, T.D.; Baker, A.R.; Artaxo, P.; Benitez-Nelson, C.R.; Bergametti, G.; Bond, T.C.; Chen, Y.; Cohen, D.D.; Herut, B.; et al. Global distribution of atmospheric phosphorus sources, concentrations and deposition rates, and anthropogenic impacts. Glob. Biogeochem. Cycles 2008, 22, 1–19. [Google Scholar] [CrossRef]
  5. Griffin, D.W. Atmospheric movement of microorganisms in clouds of desert dust and implications for human health. Clin. Microbiol. Rev. 2007, 20, 459–477. [Google Scholar] [CrossRef] [PubMed]
  6. Favet, J.; Lapanje, A.; Giongo, A.; Kennedy, S.; Aung, Y.-Y.; Cattaneo, A.; Davis-Richardson, A.G.; Brown, C.T.; Kort, R.; Brumsack, H.-J.; et al. Microbial hitchhikers on intercontinental dust: Catching a lift in Chad. ISME J. 2013, 7, 850–867. [Google Scholar] [CrossRef] [PubMed]
  7. Rahav, E.; Ovadia, G.; Paytan, A.; Herut, B. Contribution of airborne microbes to bacterial production and N2 fixation in seawater upon aerosol deposition. Geophys. Res. Lett. 2016, 43. [Google Scholar] [CrossRef]
  8. Gat, D.; Mazar, Y.; Cytryn, E.; Rudich, Y. Origin-dependent variations in the atmospheric microbiome community in Eastern Mediterranean dust storms. Environ. Sci. Technol. 2017, 51, 6709–6718. [Google Scholar] [CrossRef] [PubMed]
  9. Mayol, E.; Arrieta, J.M.; Jiménez, M.A.; Martínez-Asensio, A.; Garcias-Bonet, N.; Dachs, J.; González-Gaya, B.; Royer, S.J.; Benítez-Barrios, V.M.; Fraile-Nuez, E.; et al. Long-range transport of airborne microbes over the global Tropical and Subtropical Ocean. Nat. Commun. 2017, 8, 1–8. [Google Scholar] [CrossRef] [PubMed]
  10. Katra, I.; Arotsker, L.; Krasnov, H.; Zaritsky, A.; Kushmaro, A.; Ben-Dov, E. Richness and diversity in dust stormborne biomes at the Southeast Mediterranean. Sci. Rep. 2014, 4, 5265. [Google Scholar] [CrossRef] [PubMed]
  11. Krishnamurthy, A.; Moore, J.K.; Mahowald, N.; Luo, C.; Zender, C.S. Impacts of atmospheric nutrient inputs on marine biogeochemistry. J. Geophys. Res. 2010, 115, G01006. [Google Scholar] [CrossRef]
  12. Herut, B.; Zohary, T.; Krom, M.D.; Mantoura, R.F.C.; Pitta, P.; Psarra, S.; Rassoulzadegan, F.; Tanaka, T.; Frede Thingstad, T. Response of East Mediterranean surface water to Saharan dust: On-board microcosm experiment and field observations. Deep. Res. Part II Top. Stud. Oceanogr. 2005, 52, 3024–3040. [Google Scholar] [CrossRef]
  13. Herut, B.; Rahav, E.; Tsagaraki, T.M.; Giannakourou, A.; Tsiola, A.; Psarra, S.; Lagaria, A.; Papageorgiou, N.; Mihalopoulos, N.; Theodosi, C.N.; et al. The potential impact of Saharan dust and polluted aerosols on microbial populations in the East Mediterranean Sea, an overview of a mesocosm experimental approach. Front. Mar. Sci. 2016, 3. [Google Scholar] [CrossRef]
  14. Guieu, C.; Dulac, F.; Desboeufs, K.; Wagener, T.; Pulido-Villena, E.; Grisoni, J.M.; Louis, F.; Ridame, C.; Blain, S.; Brunet, C.; et al. Large clean mesocosms and simulated dust deposition: A new methodology to investigate responses of marine oligotrophic ecosystems to atmospheric inputs. Biogeosciences 2010, 7, 2765–2784. [Google Scholar] [CrossRef] [Green Version]
  15. Paytan, A.; Mackey, K.R.M.; Chen, Y.; Lima, I.D.; Doney, S.C.; Mahowald, N.; Labiosa, R.; Post, A.F. Toxicity of atmospheric aerosols on marine phytoplankton. Proc. Natl. Acad. Sci. USA 2009, 106, 4601–4605. [Google Scholar] [CrossRef] [PubMed]
  16. Mills, M.M.; Ridame, C.; Davey, M.; La Roche, J.; Geider, R.J. Iron and phosphorus co-limit nitrogen fixation in the eastern tropical North Atlantic. Nature 2004, 429, 292–294. [Google Scholar] [CrossRef] [PubMed] [Green Version]
  17. Marañón, E.; Fernández, A.; Mouriño-Carballido, B.; Martínez-García, S.; Teira, E.; Cermeño, P.; Chouciño, P.; Huete-Ortega, M.; Fernández, E.; Calvo-Díaz, A.; et al. Degree of oligotrophy controls the response of microbial plankton to Saharan dust. Limnol. Oceanogr. 2010, 55, 2339–2352. [Google Scholar] [CrossRef] [Green Version]
  18. Astrahan, P.; Herut, B.; Paytan, A.; Rahav, E. The impact of dry atmospheric deposition on the sea-surface microlayer in the SE Mediterranean Sea: An experimental approach. Front. Mar. Sci. 2016, 3. [Google Scholar] [CrossRef]
  19. Guieu, C.; Aumont, O.; Paytan, A.; Bopp, L.; Law, C.S.; Mahowald, N.; Achterberg, E.P.; Marañón, E.; Salihoglu, B.; Crise, A.; et al. Global biogeochemical cycles deposition to Low Nutrient Low Chlorophyll regions. Glob. Biogeochem. Cycles 2014, 28, 1179–1198. [Google Scholar] [CrossRef]
  20. Berman, T.; Townsend, D.; Elsayed, S. Optical transparency, chlorophyll and primary productivity in the Eastern Mediterranean near the Israeli Coast. Oceanol. Acta 1984, 7, 367–372. [Google Scholar]
  21. Herut, B.; Almogi-Labin, A.; Jannink, N.; Gertman, I. The seasonal dynamics of nutrient and chlorophyll a concentrations on the SE Mediterranean shelf-slope. Oceanol. Acta 2000, 23, 771–782. [Google Scholar] [CrossRef]
  22. Raveh, O.; David, N.; Rilov, G.; Rahav, E. The temporal dynamics of coastal phytoplankton and bacterioplankton in the Eastern Mediterranean Sea. PLoS ONE 2015, 10, 1–23. [Google Scholar] [CrossRef] [PubMed]
  23. Rahav, E.; Raveh, O.; Hazan, O.; Gordon, N.; Kress, N.; Silverman, J.; Herut, B. Impact of nutrient enrichment on productivity of coastal water along the SE Mediterranean shore of Israel−A bioassay approach. Mar. Pollut. Bull. 2018, 127, 559–567. [Google Scholar] [CrossRef] [PubMed]
  24. Azov, Y. Seasonal patterns of phytoplankton productivity and abundance in nearshore oligotrophic waters of the Levant Basin (Mediterranean). J. Plankton Res. 1986, 8, 41–53. [Google Scholar] [CrossRef]
  25. Yacobi, Y.Z.Y.; Zohary, T.; Kress, N.; Hecht, A.; Robarts, R.D.; Waiser, M.; Wood, A.M.; Li, W.K.W. Chlorophyll distribution throughout the Southeastern Mediterranean in relation to the physical structure of the water mass. J. Mar. Syst. 1995, 6, 179–190. [Google Scholar] [CrossRef]
  26. Kimor, B.; Wood, E.J.F. Plankton study in Eastern Mediterranean Sea. Mar. Biol. 1975, 29, 321–333. [Google Scholar] [CrossRef]
  27. Rahav, E.; Bar-Zeev, E. Sewage outburst triggers Trichodesmium bloom and enhance N2 fixation rates. Sci. Rep. 2017, 7, 4367. [Google Scholar] [CrossRef] [PubMed]
  28. Rahav, E.; Giannetto, M.J.; Bar-Zeev, E. Contribution of mono and polysaccharides to heterotrophic N2 fixation at the eastern Mediterranean coastline. Sci. Rep. 2016, 6. [Google Scholar] [CrossRef] [PubMed]
  29. Lawrence, C.R.; Neff, J.C. The contemporary physical and chemical flux of aeolian dust: A synthesis of direct measurements of dust deposition. Chem. Geol. 2009, 267, 46–63. [Google Scholar] [CrossRef]
  30. Ganor, E.; Osetinsky, I.; Stupp, A.; Alpert, P. Increasing trend of African dust over 49 years in the Eastern Mediterranean. J. Geophys. Res. Atmos. 2010, 115, 1–7. [Google Scholar] [CrossRef]
  31. Kocak, M.; Kubilay, N.; Tuğrul, S.; Mihalopoulos, N. Atmospheric nutrient inputs to the northern Levantine basin from a long-term observation: Sources and comparison with riverine inputs. Biogeosciences 2010, 7, 4037–4050. [Google Scholar] [CrossRef] [Green Version]
  32. Herut, B.; Krom, M.D.; Pan, G.; Mortimer, R. Atmospheric input of nitrogen and phosphorus to the Southeast Mediterranean: Sources, fluxes, and possible impact. Limnol. Ocean. 1999, 44, 1683–1692. [Google Scholar] [CrossRef] [Green Version]
  33. Guerzoni, S.; Chester, R.; Dulac, F.; Herut, B.; Loÿe-Pilot, M.-D.; Measures, C.; Migon, C.; Molinaroli, E.; Moulin, C.; Rossini, P.; et al. The role of atmospheric deposition in the biogeochemistry of the Mediterranean Sea. Prog. Oceanogr. 1999, 44, 147–190. [Google Scholar] [CrossRef] [Green Version]
  34. Léon, J.-F.; Augustin, P.; Mallet, M.; Bourrianne, T.; Pont, V.; Dulac, F.; Fourmentin, M.; Lambert, D.; Sauvage, B. Aerosol vertical distribution, optical properties and transport over Corsica (Western Mediterranean). Atmos. Chem. Phys. Discuss. 2015, 15, 9507–9540. [Google Scholar] [CrossRef]
  35. Rahav, E.; Paytan, A.; Chien, C.; Ovadia, G.; Katz, T.; Herut, B. The impact of atmospheric dry deposition associated microbes on the Southeastern Mediterranean Sea surface water following an intense dust storme. Front. Mar. Sci. 2016, 3, 127. [Google Scholar] [CrossRef]
  36. Calvo-Díaz, A.; Díaz-Pérez, L.; Suárez, L.Á.; Morán, X.A.G.; Teira, E.; Marañón, E. Decrease in the autotrophic-to-heterotrophic biomass ratio of picoplankton in oligotrophic marine waters due to bottle enclosure. Appl. Environ. Microbiol. 2011, 77, 5739–5746. [Google Scholar] [CrossRef] [PubMed]
  37. Kocak, M.; Kubilay, N.; Herut, B.; Nimmo, M. Dry atmospheric fluxes of trace metals (Al, Fe, Mn, Pb, Cd, Zn, Cu) over the Levantine Basin: A refined assessment. Atmos. Environ. 2005, 39, 7330–7341. [Google Scholar] [CrossRef]
  38. Herut, B.; Nimmo, M.; Medway, A.; Chester, R.; Krom, M.D. Dry atmospheric inputs of trace metals at the Mediterranean coast of Israel (SE Mediterranean): Sources and fluxes. Atmos. Environ. 2001, 35, 803–813. [Google Scholar] [CrossRef]
  39. Welschmeyer, N.A. Fluorometric analysis of chlorophyll a in the presence of chlorophyll b and pheopigments. Limnol. Oceanogr. 1994, 39, 1985–1992. [Google Scholar] [CrossRef] [Green Version]
  40. Bar-Zeev, E.; Rahav, E. Microbial metabolism of transparent exopolymer particles during the summer months along a eutrophic estuary system. Front. Microbiol. 2015, 6. [Google Scholar] [CrossRef] [PubMed] [Green Version]
  41. Steemann-Nielsen, E. On the determination of the activity for measuring primary production. J. Cons. Int. Explor. Mer. 1952, 18, 117–140. [Google Scholar]
  42. Simon, M.; Alldredge, A.; Azam, F. Bacterial carbon dynamics on marine snow. Mar. Ecol. Prog. Ser. 1990, 65, 205–211. [Google Scholar] [CrossRef]
  43. Simon, M.; Alldredge, A.; Azam, F. Protein-content and protein-synthesis rates of planktonic marine-bacteria. Mar. Ecol. Prog. Ser. 1989, 51, 201–213. [Google Scholar] [CrossRef]
  44. Mohr, W.; Großkopf, T.; Wallace, D.W.R.; Laroche, J. Methodological underestimation of oceanic nitrogen fixation rates. PLoS ONE 2010, 5. [Google Scholar] [CrossRef] [PubMed] [Green Version]
  45. Rahav, E.; Herut, B.; Mulholland, M.R.; Belkin, N.; Elifantz, H.; Berman-Frank, I. Heterotrophic and autotrophic contribution to dinitrogen fixation in the Gulf of Aqaba. Mar. Ecol. Prog. Ser. 2015, 522. [Google Scholar] [CrossRef]
  46. D’Ortenzio, F.; Ribera d’Alcalà, M. On the trophic regimes of the Mediterranean Sea: A satellite analysis. Biogeosciences 2009, 6, 139–148. [Google Scholar] [CrossRef]
  47. Siokou-Frangou, I.; Christaki, U.; Mazzocchi, M.G.; Montresor, M.; Ribera d’Alcalá, M.; Vaqué, D.; Zingone, A. Plankton in the open Mediterranean Sea: A review. Biogeosciences 2010, 7, 1543–1586. [Google Scholar] [CrossRef] [Green Version]
  48. Mella-Flores, D.; Mazard, S.; Humily, F.; Partensky, F.; Mahe, F.; Bariat, L.; Courties, C.; Marie, D.; Ras, J.; Mauriac, R.; et al. Is the distribution of Prochlorococcus and Synechococcus ecotypes in the Mediterranean Sea affected by global warming? Biogeosciences 2011, 8, 2785–2804. [Google Scholar] [CrossRef] [Green Version]
  49. Bergamasco, A.; Malanotte-Rizzoli, P. The circulation of the Mediterranean Sea: A historical review of experimental investigations. Adv. Oceanogr. Limnol. 2010, 1, 11–28. [Google Scholar] [CrossRef]
  50. Kress, N.; Gertman, I.; Herut, B. Temporal evolution of physical and chemical characteristics of the water column in the easternmost Levantine Basin (Eastern Mediterranean Sea) from 2002 to 2010. J. Mar. Syst. 2014, 135, 6–13. [Google Scholar] [CrossRef]
  51. Krom, M.D.; Kress, N.; Berman-Frank, I.; Rahav, E. Past, present and future patterns in the nutrient chemistry of the eastern Mediterranean. In The Mediterranean Sea: Its History and Present Challenges; Goffredo, S., Dubinsky, Z., Eds.; Springer: Dordrecht, The Netherlands, 2014; pp. 49–68. ISBN 978-94-007-6703-4. [Google Scholar]
  52. Ozer, T.; Gertman, I.; Kress, N.; Silverman, J.; Herut, B. Interannual thermohaline (1979–2014) and nutrient (2002–2014) dynamics in the Levantine surface and intermediate water masses, SE Mediterranean Sea. Glob. Planet. Chang. 2017, 151, 60–67. [Google Scholar] [CrossRef]
  53. Rahav, E.; Herut, B.; Levi, A.; Mulholland, M.R.; Berman-Frank, I. Springtime contribution of dinitrogen fixation to primary production across the Mediterranean Sea. Ocean Sci. 2013, 9, 489–498. [Google Scholar] [CrossRef]
  54. Hazan, O.; Silverman, J.; Sisma-Ventura, G.; Ozer, T.; Gertman, I.; Shoham-Frider, E.; Kress, N.; Rahav, E. Mesopelagic prokaryotes alter surface phytoplankton production during simulated deep mixing experiments in Eastern Mediterranean Sea waters. Front. Mar. Sci. 2018, 5. [Google Scholar] [CrossRef]
  55. Herut, B.; Tibor, G.; Yacobi, Y.Z.; Kress, N. Synoptic measurements of chlorophyll-a and suspended particulate matter in a transitional zone from polluted to clean seawater utilizing airborne remote sensing and ground measurements, Haifa Bay (SE Mediterranean). Mar. Pollut. Bull. 1999, 38, 762–772. [Google Scholar] [CrossRef]
  56. Belkin, N.; Rahav, E.; Elifantz, H.; Kress, N.; Berman-Frank, I. Enhanced salinities as a proxy of seawater desalination discharges impact coastal microbial communities of the Eastern Mediterranean Sea. Environ. Microbiol. 2015, 17. [Google Scholar] [CrossRef] [PubMed]
  57. Kress, N.; Galil, B.S. Twenty two years of sewage sludge marine disposal monitoring in the Eastern Mediterranean Sea: Impact on sediment quality and infauna and the response to load reduction. Mar. Pollut. Bull. 2016, 99–111. [Google Scholar] [CrossRef] [PubMed]
  58. Frank, H.; Rahav, E.; Bar-Zeev, E. Short-term effects of SWRO desalination brine on benthic heterotrophic microbial communities. Desalination 2017, 417, 52–59. [Google Scholar] [CrossRef]
  59. Benavides, M.; Bonnet, B.; Hernández, N.; Martínez-Pérez, A.M.; Nieto-Cid, M.; Álvarez-Salgado, X.A.; Baños, I.; Montero, M.F.; Mazuecos, I.P.; Gasol, J.M.; et al. Basin-wide N2 fixation in the deep waters of the Mediterranean Sea. Glob. Biogeochem. Cycles 2016, 30, 952–961. [Google Scholar] [CrossRef]
  60. Koçak, M.; Kubilay, N.; Mihalopoulos, N. Ionic composition of lower tropospheric aerosols at a Northeastern Mediterranean site: Implications regarding sources and long-range transport. Atmos. Environ. 2004, 38, 2067–2077. [Google Scholar] [CrossRef]
  61. Pitta, P.; Kanakidou, M.; Mihalopoulos, N.; Christodoulaki, S.; Dimitriou, P.D.; Frangoulis, C.; Giannakourou, A.; Kagiorgi, M.; Lagaria, A.; Nikolaou, P.; et al. Saharan dust deposition effects on the microbial food web in the Eastern Mediterranean: A study based on a mesocosm experiment. Front. Mar. Sci. 2017, 4, 1–19. [Google Scholar] [CrossRef]
  62. Yogev, T.; Rahav, E.; Bar-Zeev, E.; Man-Aharonovich, D.; Stambler, N.; Kress, N.; Béjà, O.; Mulholland, M.R.; Herut, B.; Berman-Frank, I. Is dinitrogen fixation significant in the Levantine Basin, East Mediterranean Sea? Environ. Microbiol. 2011, 13, 854–871. [Google Scholar] [CrossRef] [PubMed]
  63. Karl, D.M.; Hebel, D.V.; Björkman, K.; Letelier, R.M. The role of dissolved organic matter release in the productivity of the oligotrophic North Pacific Ocean. Limnol. Oceanogr. 1998, 43, 1270–1286. [Google Scholar] [CrossRef] [Green Version]
  64. González, N.; Gattuso, J.P.; Middelburg, J.J. Oxygen production and carbon fixation in oligotrophic coastal bays and the relationship with gross and net primary production. Aquat. Microb. Ecol. 2008, 52, 119–130. [Google Scholar] [CrossRef] [Green Version]
  65. Iluz, D.; Dishon, G.; Capuzzo, E.; Meeder, E.; Astoreca, R.; Montecino, V.; Znachor, P.; Ediger, D.; Marra, J. Short-term variability in primary productivity during a wind-driven diatom bloom in the Gulf of Eilat (Aqaba). Aquat. Microb. Ecol. 2009, 56, 205–215. [Google Scholar] [CrossRef] [Green Version]
  66. Kirchman, D.L. Processes in Microbial Ecology, 1st ed.; Kirchman, D.L., Ed.; Oxford University Press: Oxford, UK, 2012; ISBN 0199586934. [Google Scholar]
  67. Laws, E.A. Evaluation of in situ phytoplankton growth rates: A synthesis of data from varied approaches. Ann. Rev. Mar. Sci. 2013, 5, 247–268. [Google Scholar] [CrossRef] [PubMed]
  68. Guo, C.; Xia, X.; Pitta, P.; Herut, B.; Rahav, E.; Berman-Frank, I.; Giannakourou, A.; Tsiola, A.; Tsagaraki, T.M.; Liu, H. Shifts in microbial community structure and activity in the ultra-oligotrophic Eastern Mediterranean Sea driven by the deposition of Saharan dust and European aerosols. Front. Mar. Sci. 2016, 3. [Google Scholar] [CrossRef]
  69. Del Giorgio, P.; Cole, J.J.; Cimbleris, A. Respiration rates in bacteria exceed phytoplankton production in unproductive aquatic systems. Nature 1997, 385, 148–151. [Google Scholar] [CrossRef]
  70. Pulido-Villena, E.; Wagener, T.; Guieu, C. Bacterial response to dust pulses in the western Mediterranean: Implications for carbon cycling in the oligotropic ocean. Glob. Biogeochem. Cycles 2008, 22, 1–12. [Google Scholar] [CrossRef]
  71. Joint, I.; Henriksen, P.; Fonnes, G.A.; Bourne, D.; Thingstad, T.F.; Riemann, B. Competition for inorganic nutrients between phytoplankton and bacterioplankton in nutrient manipulated mesocosms. Aquat. Microb. Ecol. 2002, 29, 145–159. [Google Scholar] [CrossRef] [Green Version]
  72. Thingstad, T.F.; Krom, M.D.; Mantoura, R.F.C.; Flaten, G.A.F.; Groom, S.; Herut, B.; Kress, N.; Law, C.S.; Pasternak, A.; Pitta, P.; et al. Nature of phosphorus limitation in the ultraoligotrophic Eastern Mediterranean. Science 2005, 309, 1068–1071. [Google Scholar] [CrossRef] [PubMed]
  73. Pitta, P.; Nejstgaard, J.C.; Tsagaraki, T.M.; Zervoudaki, S.; Egge, J.K.; Frangoulis, C.; Lagaria, A.; Magiopoulos, I.; Psarra, S.; Sandaa, R.-A.; et al. Confirming the “rapid phosphorus transfer from microorganisms to mesozooplankton in the Eastern Mediterranean Sea” scenario through a mesocosm experiment. J. Plankton Res. 2016, 38, 502–521. [Google Scholar] [CrossRef]
  74. Peter, H.; Hörtnagl, P.; Reche, I.; Sommaruga, R. Bacterial diversity and composition during rain events with and without Saharan dust influence reaching a high mountain lake in the Alps. Environ. Microbiol. Rep. 2014, 6, 618–624. [Google Scholar] [CrossRef] [PubMed] [Green Version]
  75. Reche, I.; Ortega-Retuerta, E.; Romera, O.; Pulido-Villena, E.; Morales-Baquero, R.; Casamayor, E.O. Effect of Saharan dust inputs on bacterial activity and community composition in Mediterranean lakes and reservoirs. Limnol. Oceanogr. 2009, 54, 869–879. [Google Scholar] [CrossRef] [Green Version]
  76. Rahav, E.; Paytan, A.; Mescioglu, E.; Galletti, Y.; Rosenfeld, S.; Raveh, O.; Santinelli, C.; Ho, T.-Y.; Herut, B. Airborne microbes contribute to N2 fixation in surface water of the Northern Red Sea. Geophys. Res. Lett. 2018, 45, GL077132. [Google Scholar] [CrossRef]
  77. Uitz, J.; Claustre, H.; Gentili, B.; Stramski, D. Phytoplankton class-specific primary production in the world’s oceans: Seasonal and interannual variability from satellite observations. Glob. Biogeochem. Cycles 2010, 24, GB3016. [Google Scholar] [CrossRef]
  78. Law, C.S.; Woodward, E.M.S.; Ellwood, M.J.; Marriner, A.; Bury, S.J.; Safi, K.A. Response of surface nutrient inventories and nitrogen fixation to a tropical cyclone in the Southwest Pacific. Limnol. Oceanogr. 2011, 56, 1372–1385. [Google Scholar] [CrossRef]
  79. Moore, C.M.; Mills, M.M.; Milne, A.; Langlois, R.; Achterberg, E.P.; Lochte, K.; Geider, R.J.; La Roche, J. Iron limits primary productivity during spring bloom development in the Central North Atlantic. Glob. Chang. Biol. 2006, 12, 626–634. [Google Scholar] [CrossRef]
  80. Foster, R.A.; Paytan, A.; Zehr, J.P. Seasonality of N2 fixation and nifH gene diversity in the Gulf of Aqaba (Red Sea). Limnol. Oceanogr. 2009, 54, 219–233. [Google Scholar] [CrossRef]
  81. Ridame, C.; Le Moal, M.; Guieu, C.; Ternon, E.; Biegala, I.C.; L’Helguen, S.; Pujo-Pay, M. Nutrient control of N2 fixation in the oligotrophic Mediterranean Sea and the impact of Saharan dust events. Biogeosciences 2011, 8, 2629–2657. [Google Scholar] [CrossRef]
  82. Ternon, E.; Guieu, C.; Ridame, C.; L’Helguen, S.; Catala, P. Longitudinal variability of the biogeochemical role of Mediterranean aerosols in the Mediterranean Sea. Biogeosciences 2011, 8, 1067–1080. [Google Scholar] [CrossRef] [Green Version]
  83. Ridame, C.; Guieu, C.; L’Helguen, S. Strong stimulation of N2 fixation in oligotrophic Mediterranean Sea: Results from dust addition in large in situ mesocosms. Biogeosciences 2013, 10, 7333–7346. [Google Scholar] [CrossRef]
  84. Bonnet, S.; Guieu, C.; Chiaverini, J.; Ras, J.; Stock, A. Effect of atmospheric nutrients on the autotrophic communities in a low nutrient, low chlorophyll system. Limnol. Oceanogr. 2005, 50, 1810–1819. [Google Scholar] [CrossRef] [Green Version]
  85. Archer, D.E.; Johnson, K. A Model of the iron cycle in the ocean. Glob. Biochem. 2000, 14, 269–279. [Google Scholar] [CrossRef]
  86. Moore, J.K.; Doney, S.C.; Kleypas, J.A.; Glover, D.M.; Fung, I.Y. An intermediate complexity marine ecosystem model for the global domain. Deep Sea Res. Part II Top. Stud. Oceanogr. 2002, 49, 403–462. [Google Scholar] [CrossRef]
  87. Torfstein, A.; Teutsch, N.; Tirosh, O.; Shaked, Y.; Rivlin, T.; Zipori, A.; Stein, M.; Lazar, B.; Erel, Y. Chemical characterization of atmospheric dust from a weekly time series in the north Red Sea between 2006 and 2010. Geochim. Cosmochim. Acta 2017, 211, 373–393. [Google Scholar] [CrossRef]
  88. Hill, P.G.; Zubkov, M.V.; Purdie, D.A. Differential responses of Prochlorococcus and SAR11-dominated bacterioplankton groups to atmospheric dust inputs in the tropical Northeast Atlantic Ocean. FEMS Microbiol. Lett. 2010, 306, 82–89. [Google Scholar] [CrossRef] [PubMed]
  89. Neuer, S.; Torres-Padrón, M.E.; Gelado-Caballero, M.D.; Rueda, M.J.; Hernández-Brito, J.; Davenport, R.; Wefer, G. Dust deposition pulses to the eastern subtropical north Atlantic gyre: Does ocean’s biogeochemistry respond? Glob. Biogeochem. Cycles 2004, 18, 1–10. [Google Scholar] [CrossRef]
  90. Womack, A.M.; Bohannan, B.J.M.; Green, J.L. Biodiversity and biogeography of the atmosphere. Philos. Trans. R. Soc. Lond. B Biol. Sci. 2010, 365, 3645–3653. [Google Scholar] [CrossRef] [PubMed] [Green Version]
  91. Polymenakou, P.N. Atmosphere: A source of pathogenic or beneficial microbes? Atmosphere 2012, 3, 87–102. [Google Scholar] [CrossRef]
  92. Prospero, J.M.; Lamb, P.J. African droughts and dust transport to the Caribbean: Climate change implications. Science 2003, 302, 1024–1027. [Google Scholar] [CrossRef] [PubMed]
  93. Polovina, J.J.; Howell, E.A.; Abecassis, M. Ocean’s least productive waters are expanding. Geophys. Res. Lett. 2008, 35, 2–6. [Google Scholar] [CrossRef]
  94. Steinacher, M.; Joos, F.; Frölicher, T.L.; Bopp, L.; Cadule, P.; Doney, S.C.; Gehlen, M.; Schneider, B.; Segschneider, J. Projected 21st century decrease in marine productivity: A multi-model analysis. Biogeosciences 2010, 7, 979–1005. [Google Scholar] [CrossRef] [Green Version]
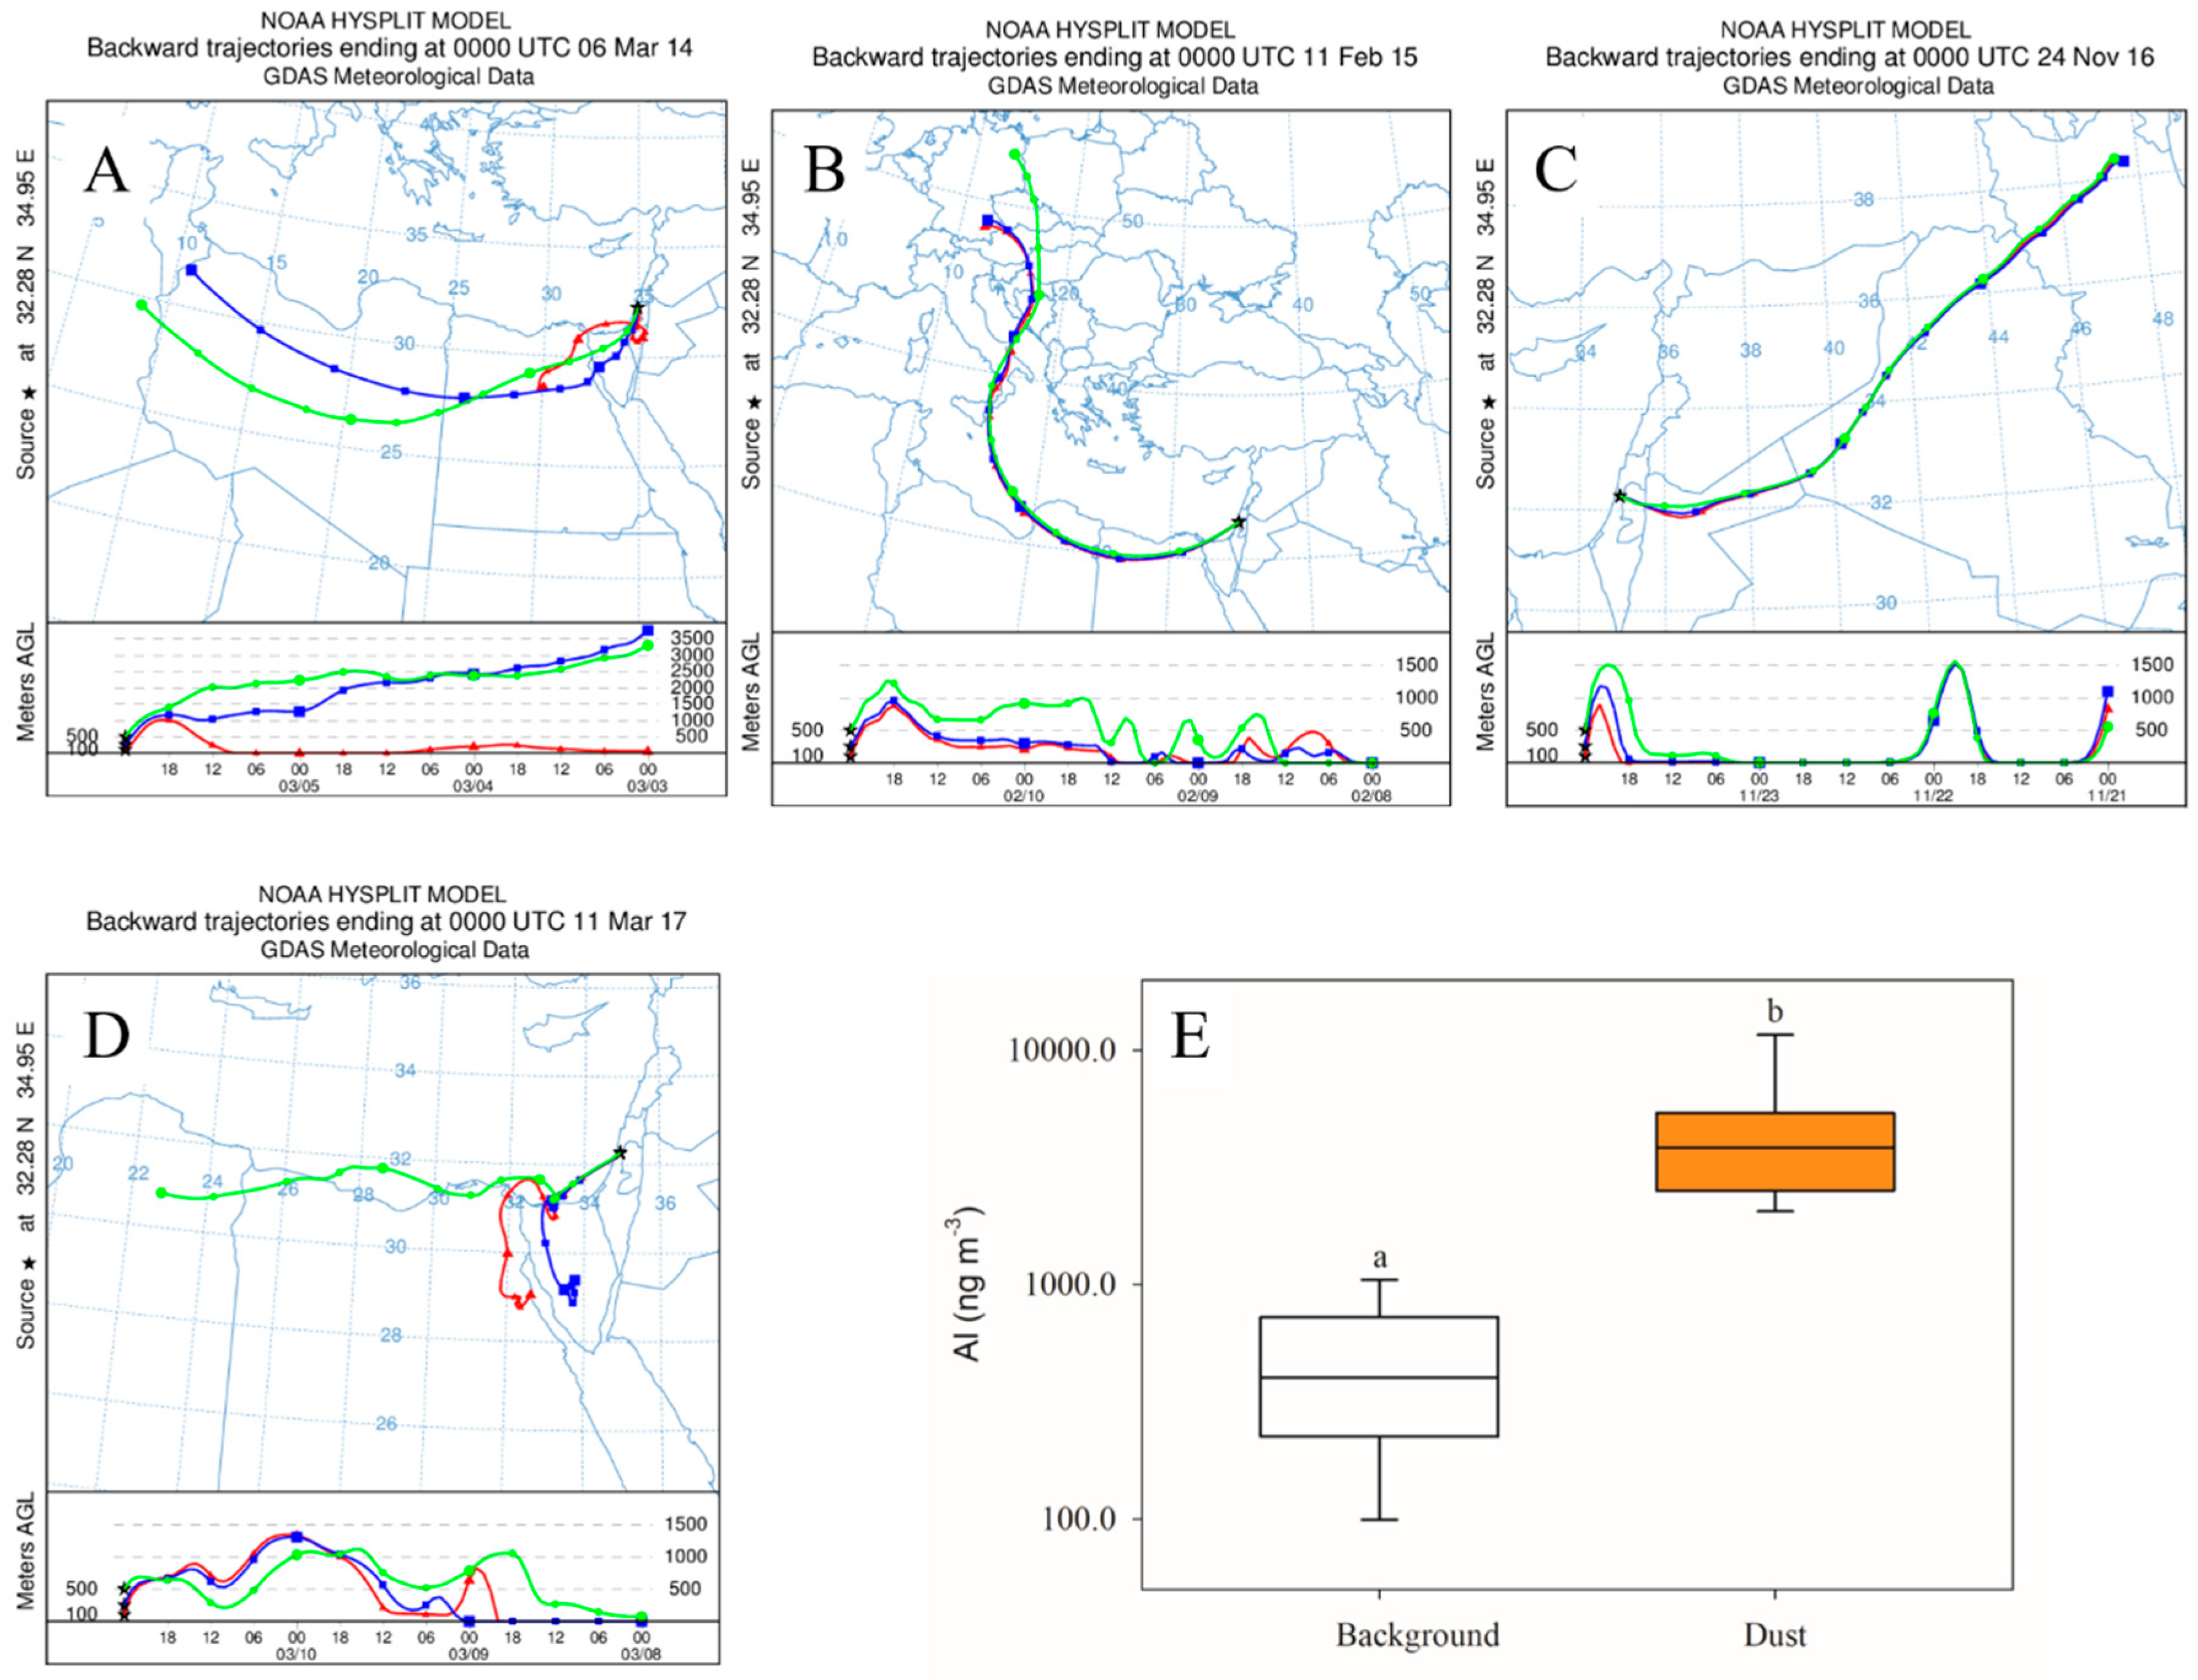
Figure 1. Back-trajectory analyses showing the main dust sources that arrived to the southeastern Mediterranean Sea (SEMS) from 2013 to 2017: (A) Sahara Desert, (B) Eastern Europe, (C) Iraq/Syria, and (D) the Middle East; and (E) Al concentration measured during non-storm “typical” days (white, median Al = 381 ng m−3, n = 89) and during dust storm events (orange, median Al = 3844 ng m−3, n = 29) using a high-volume sampler. Trajectory analyses were done for 100 m (red), 500 m (green), and 1000 m (blue) altitude levels. Box-whisker plots show interquartile range (25th to 75th percentile) of the dataset. Horizontal lines within the boxes represent median value. Letters above box-plots represent significant differences (t-test, p < 0.05) for mean values between background and dust measurements.
Atmosphere 09 00305 g001
Figure 2. Surface (1–2 m) (A,B) Chl.a temporal variability and distribution and (C,D) primary production (PP) variability and distribution, respectively, at the coastal SEMS, 2013–2017. Measurements were taken during “typical” days (white, Supplementary Table S1, n = 89) and dust storms (orange, Supplementary Table S2, n = 29). Box-whisker plots show interquartile range (25th to 75th percentile) of the dataset. Horizontal lines within the boxes represent median value. Letters above the box-plots represent significant differences (t-test, p < 0.05) for mean values between background and dust measurements.
Atmosphere 09 00305 g002
Figure 3. Surface (1–2 m) (A,B) bacterial abundance (BA) temporal variability and distribution and (C,D) bacterial production (BP) variability and distribution, respectively, at the coastal SEMS, 2013–2017. Measurements were taken during “typical” days (white, Supplementary Table S1, n = 89) and during dust storms (orange, Supplementary Table S2, n = 29). Box-whisker plots show interquartile range (25th to 75th percentile) of the dataset. Horizontal lines within the box represent median value. Letters above the box-plots represent significant differences (t-test, p < 0.05) for mean values between background and dust measurements.
Atmosphere 09 00305 g003
Figure 4. Surface (1–2 m) N2 fixation (A) temporal variability and (B) distribution at the coastal SEMS, 2013–2017. Measurements were taken during “typical” days (white, Supplementary Table S1, n = 40) and during dust storms (orange, Supplementary Table S2, n = 18). Box-whisker plots show interquartile range (25th to 75th percentile) of the dataset. Horizontal lines within the boxes represent median value. Letters above the box-plots represent significant differences (t-test, p < 0.05) for mean values between background and dust measurements.
Atmosphere 09 00305 g004
Figure 5. Summary of relative change in different variables (ratio of median value during dust events to median background conditions) in response to desert dust deposition at the coastal SEMS, 2013–2017 (in situ, black squares) and the ratio compiled by Guieu et al. [19] (field and laboratory aerosol addition bioassay and mesocosm experiments, red triangles).
Atmosphere 09 00305 g005
Figure 6. Relationship between Chl.a and % change in (A) PP, (B) BP, and (C) N2 fixation following dust amendment in different oceanic environments. Data were compiled from [12,13,16,17,18,77,78,79,80,81,82,83] and this study.
Atmosphere 09 00305 g006