Article

Effects of Atmospheric Dry Deposition on External Nitrogen Supply and New Production in the Northern South China Sea

1
Department of Marine Environmental Informatics, National Taiwan Ocean University, Keelung 202, Taiwan
2
Center of Excellence for the Oceans, National Taiwan Ocean University, Keelung 202, Taiwan
*
Author to whom correspondence should be addressed.
Atmosphere 2018, 9(10), 386; https://doi.org/10.3390/atmos9100386
Submission received: 27 August 2018 / Revised: 24 September 2018 / Accepted: 1 October 2018 / Published: 3 October 2018

Abstract

:
The South China Sea (SCS) is one of the world’s largest oligotrophic marginal seas. Increases in biomass and primary production in the surface layer of the northern SCS are affected by anthropogenic aerosol use among north Asian peoples. The seasonal variation of dry deposition and its contribution to new production in the ocean are vital to determining the effect that such dry deposition has on the biogeochemical cycle of the SCS. This study collected 240 samples of total suspended particles at Dongsha Island in the northern SCS from April 2007 to March 2009; the major ions and water-soluble nitrogen species in the samples were analyzed. The analysis results indicated that the concentration distributions of major water-soluble ions and nitrogen species in total suspended particles exhibited significant seasonal (source) variation. The north-east monsoon seasons (autumn to spring) brought relatively high concentrations because most air masses during this period arrived from the northern continental region. We found that the concentration of nitrogen species shows a latitude distribution, gradually decreasing from north to south. In addition, this study also discovered that the ratio of organic nitrogen to total dissolved or water-soluble nitrogen also varies in a similar manner, resulting in a concentration of <20% for locations north of 30° N and >30% for those south of 30° N. Aerosols at Dongsha Island mainly comprised sea salt; however, significant chloride depletion was observed during the north-east monsoon season. The molar ratio of NH4+ to non–sea salt (NSS) sulfate (nss-SO42−) was 0.8, indicating that the amount of artificially produced NH4+ in the region was insufficient for reaction with nss-SO42−. Therefore, NH4+ was mainly present in the form of NH4HSO4. The fluxes of water-soluble inorganic nitrogen (WSIN) and water-soluble organic nitrogen (WSON) within the region were 23 ± 13 and 27 ± 15 mmol m−2 y−1, respectively. The new production converted from atmospheric water-soluble nitrogen species in the northern SCS was estimated to be 0.52–0.81 mmol C m−2 d−1. This flux made about 5.6–8.7% (the global average was about 3.5%) contribution to the primary production (9.24 mmol C m−2 d−1) of the SCS surface water. This result indicates that the ocean’s external nitrogen supply, provided by anthropogenic aerosols, is vital for the biogeochemical cycle in Asian marginal seas, particularly the northern SCS.

1. Introduction

Anthropogenic and natural sources of aerosols have a substantial effect on global weather and atmospheric chemistry, and they have a particular influence on the marine ecosystem in the pelagic zone [1]. North-east Asia has experienced rapid development of economic and agricultural activities; the use of vast quantities of fossil fuels and fertilizers has resulted in a significant increase in anthropogenic gas emissions and particulates [2]. In addition, high concentrations of dust and anthropogenic aerosols produced in the springtime in continental Asia are transmitted to the North Pacific region by monsoon systems. Occasionally, these concentrations might even be transmitted to North America on westerly winds, affecting the global radiation balance and atmospheric chemistry as well as the biogeochemical cycle [3].
Generated by the effect of wind on the ocean’s surface, sea salt aerosols are one of the major components of the total aerosol mass near the Earth’s surface. The major ions they contain are similar to those in seawater, with chloride ions contributing to the majority of aerosol mass and concentration [4]. Na+, Mg2+, and Cl in the atmosphere mostly originate from sea spray and are either swiftly deposited on land or returned to the ocean. High concentrations of Na+ and Cl are common in aerosols near the coast. During the deposition process, sea salt aerosols not only react with acidic compounds to form volatile hydrogen chloride gas, which quickly vaporizes, but also absorb non–sea salt (NSS) ions (e.g., NH4+ and nss-SO42−) during atmospheric transmission [5]. This reaction, which leads to a decrease in the Cl concentration in aerosols, is known as chloride depletion and proceeds as follows:
HNO3(g) + NaCl(s) → NaNO3(s) + HCl(g)
H2SO4(g) + 2NaCl(s) → Na2SO4(s) + 2HCl(g)
The level of chloride depletion is calculated as follows [6]:
Cldepletion (%) = (1.17 × [Na+]measured − [Cl]measured)/1.17 × [Na+]measured × 100%
where 1.17 is the molar concentration of Cl and Na+ in seawater and [Na+]measured and [Cl]measured are the concentrations of Cl and Na+ (nmol m−3) in the aerosol, respectively.
Hsu et al. noted that chloride depletion from aerosols occurs at a high level in the South China Sea (SCS), reaching 30% for coarse particle aerosols and up to 85% for fine particle aerosols [7]. The level of chloride depletion from sea salt aerosols often depends on particle size; for example, the degree of chloride depletion in aerosols comprising coarse particles decreases with particle size. However, for fine particles, the degree of chloride depletion is strongly affected by particle size enrichment of SO42−. This phenomenon is also apparent in aerosols situated around coastal areas and in the pelagic zone [8].
The world’s population has increased by 78% since 1970, causing a concurrent increase in energy use and food demand that has raised the level of reactive nitrogen (Nr) by 120% [9]. In 2010, 75% of Nr on land was created through anthropogenic activities (210 Tg N y−1), which was three times higher than that from natural continental sources (63 Tg N y−1). Contributions from natural marine sources (140 Tg N y−1) also play a vital role in the global nitrogen cycle [10]. In 2010, China was the world’s largest source of NH3 emissions (~15 Tg NH3-N y−1), most of which were products of animal husbandry and agricultural fertilizer use [11,12]. Wu et al. stated that NH3 plays an essential role in severe haze events, and that it is also a key factor in the formation of secondary aerosols in urban areas, of which secondary inorganic aerosols, such as ammonium sulfate ((NH4)2SO4) and ammonium nitrate (NH4NO3), are the most representative [13]. Through molecular dynamics simulation, Li et al. revealed that ammonium bisulfate (NH4HSO4), which is formed on the surface of water droplets from NH3 and SO3 hydrates, is the main precursor for the formation of ammonium sulfate [14]. Zhu et al. noted that most NH4+ and SO42− in aerosols are enriched in fine particles. NH4+ first neutralizes with SO42−, which generates (NH4)2SO4 when the molar ratio is >2 and NH4HSO4 when the molar ratio is <2. When the molar ratio is <2, the atmosphere contains relatively low NH4+ content, which cannot completely neutralize with SO42−, thus producing NH4HSO4 [15].
In 1860, the Nr deposition in most sea areas worldwide was <50 mg N m−2 y−1 and was >200 mg N m−2 y−1 in a few areas. At that time, most oceanic deposition originated from natural sources, with anthropogenic sources only affecting a few coastal areas. Following industrialization and the development of intensive farming, Nr deposition was affected by the strong deposition effect of westward winds from areas with high population density, including Asia, India, the United States, Europe, and West Africa in 2000 [16]. Nr deposition in most sea areas had reached 200 mg N m−2 y−1, with some regions even reaching > 700 mg N m−2 y−1. Nr from anthropogenic sources provides approximately one-third of the ocean’s external nitrogen supply, with an annual 3% (~0.3 Pg C y−1) new production in the ocean [17]. Chen et al. noted that the water-soluble total nitrogen (WSTN) from aerosols in the southern East China Sea was 4.86 g C m−3 y−1, contributing to 8.2% of the new production of seawater, where the contribution rate of inorganic to organic nitrogen was 64:36 [17]. These results reveal the vital role that water-soluble nitrogen species in atmospheric aerosols play in the nutrient biogeochemical cycle of marginal seas in East Asia [18]. Inorganic nitrogen is easily utilized by marine organisms, whereas organic nitrogen can only be partially utilized. The bioavailability of organic nitrogen in the atmosphere is mainly determined by the atmosphere’s chemical composition. Most organic nitrogen substances, such as amino acids, urea, and amines, can be processed by marine microorganisms within a short amount of time; however, humic-like substances are too difficult for such organisms to use [19].
The SCS is located between the tropics and subtropics, and it is the largest marginal sea (approximately 3.5 × 10⁶ km2) of the north-western Pacific Ocean [20]. The SCS is surrounded by densely populated regions undergoing rapid economic growth, including China, Taiwan, the Philippines, the Malay Archipelago, and the Indochinese Peninsula. These regions are responsible for emissions of large amounts of anthropogenic aerosols, which are deposited into the SCS through rivers and the atmosphere. In the next few decades, the amount of Nr deposition caused by anthropogenic activities in the SCS is estimated to exceed that in all other marginal seas combined [16]. The SCS is affected by the East Asian monsoon system, with a strong north-east monsoon in the winter and spring, and a south-west monsoon in the summer [21]. Hsu et al. found that dust and large amounts of pollutants transported from deserts and arid regions in northern China were detected in the SCS and coastal areas during the winter monsoon [7]. Compared with adjacent marginal seas (i.e., the East China Sea and Yellow Sea), the marine productivity of the SCS is relatively low, and large amounts of atmospheric nitrogen input have caused the SCS to be more susceptible to the effects of anthropogenic nitrogen deposition. Therefore, the SCS has become a key area for studying the effect of anthropogenic nitrogen deposition on marine productivity.
Based on estimates from satellite data, Kim et al. calculated the input flux of atmospheric Nr (including organic and inorganic nitrogen) in the SCS to be approximately 55 mmol N m−2 y−1 [22], which in turn increased the new production of surface seawater to 50–80 mg C m−2 d−1. This flux contributes to approximately 20% of new surface seawater production in the oligotrophic waters of the SCS, indicating that atmospheric nitrogen deposition is a crucial external source for the SCS area. Calculated accordingly, the total nitrogen flux for the entire SCS can reach approximately 77 Gmol N y−1. The Mekong and Pearl Rivers in this region discharge 20 and 26 Gmol N y−1, respectively, to the SCS [23,24], causing the flux of the rivers to be less than the atmospheric flux. Thus, the nitrogen input of coastal rivers to the ocean may be less than that of the atmosphere [25].
Having established a preliminary scientific understanding of the biogeochemical cycle of nitrogen, research is increasingly focusing on the effect of atmospheric nitrogen deposition in seas across the globe. Currently, knowledge regarding the temporal variation and chemical composition of water-soluble nitrogen species and major ions in the SCS region remains limited. Therefore, this study undertook long-term monitoring of major ions and water-soluble nitrogen species in the dry deposition of atmospheric suspended particles in the northern SCS (i.e., Dongsha Island) to explore their seasonal variation, composition, distribution, and source. In addition, the flux of nitrogen species was estimated for comparison with data regarding nitrogen species in dry deposition in East Asia to determine regional variation. To investigate the impact of atmospheric nitrogen species on the nitrogen cycle in surface seawater, the present study also examined the effect of dry deposition on the biogeochemistry of the northern SCS as well as new production induced by atmospheric nitrogen deposition in the surface seawater of marginal seas in East Asia.

2. Methodology

2.1. Sampling

Dongsha Island is a reef island in the northern SCS (Figure 1), located approximately 400 km away from Taiwan’s main island, 340 km from Hong Kong, and 780 km from Manila in the Philippines. Dongsha Island is west–north-west/east–south-east aligned, with a land area of 1.74 km2. The sampling station, 6 m above ground, was located in the attic of the Dongsha Island weather station (20°42′ N, 116°43′ E). Compiled by the Naval Meteorological and Oceanographic Office, the meteorological data used for this study included temperature, wind speed, wind direction, precipitation, relative humidity, and precipitation days. From April 2007 to March 2009, a high volume collector (GS2313-105; Thermo Fisher Scientific Inc, Franklin, MA, USA) and quartz filter paper (QR-100, 254 × 203 mm2; Advantec Group, Toyo, Japan) were used to collect samples of atmospheric total suspended particle (TSP). A total of 240 sets of samples were collected, with a flow rate of 1.3 m3 min−1, and the collection time for each sample set was approximately 24 h. Each sampled filter paper was wrapped in aluminum foil and stored in a freezer at −24 °C. The filter paper was lyophilized in a freeze dryer for 72 h to remove its moisture. Finally, the filter paper was divided into two equal segments using a cutter and placed in a zipper bag to be sealed and stored in a freezer at −24 °C for subsequent analysis.

2.2. Chemical Analysis

One-half of the filter paper was removed from the freezer and placed in a brown wide-mouth bottle, into which 250 mL of deionized water (>18 MΩ cm−1, RDI-20; Lotuntech, Taipei, Taiwan) was added. The bottle was then shaken using an ultrasonic oscillator for 3 h for extraction [17,26]. Because an excessively high water temperature caused by over-oscillation might affect the chemicals in the bottle, the water was replaced every hour to reduce the temperature. The obtained extract was filtered through a quartz filter paper (0.8 μm, 25 mm; Advantec Group, Toyo, Japan) to acquire clarified liquid for analysis.
An ion chromatography system (ICS-1000; Dionex, Sunnyvale, CA, USA) was used to analyze the major anions (Cl and SO42−) and cations (Na+, K+, Mg2+, and Ca2+). For the anions, AS4A-SC (Dionex, Sunnyvale, CA, USA) was used as the chromatography column, AG4A-SC as the guard column, and a mixed solution of Na2CO3 and NaHCO3 as the eluent. For the cations, CS12A (Dionex, Sunnyvale, CA, USA) was used as the chromatography column, CG12A as the guard column, and methanesulfonic acid as the eluent. The experimental procedure was the same as that detailed in [18].
To determine the water-soluble inorganic nitrogen (WSIN) species concentration, the indophenol blue colorimetric method was employed for NH4+ [27] and the pink azo compound colorimetric method for NO2 [28]. For NO3 analysis, the extract was first passed through a copper-cadmium reduction column, and it was then reduced to nitrite and assessed using the pink azo compound colorimetric method. Finally, the concentration of NO3 was obtained after deducting the NO2 concentration in the sample [29]. Water-soluble total nitrogen (WSTN) was analyzed by adding persulfate oxidizing (PO) agent to the sample, which was then placed in an ultraviolet (UV) chamber for 24 h [30], causing the water-soluble organic nitrogen (WSON) to oxidize with the other nitrogen species to form NO3. Determined through the cadmium-copper reduction method, the concentration of total inorganic nitrogen in the sample indicated the concentration of total nitrogen. Urea, quinolone, and ethylenediaminetetraacetic acid (EDTA) were employed to determine the oxidation efficiency of WSTN, ensuring that the recovery rate was within an acceptable range. The obtained oxidation efficiency result is similar to that acquired by [18], as shown in Table 1.
WSIN contains ammonium, nitrite, and nitrate. In the present study, the concentration of WSTN minus that of WSIN equaled the WSON concentration of a sample. The concentration of nitrogen species (nmol m−3) was calculated as follows:
[WSIN] = [NH4+] + [NO2] + [NO3]
[WSTN] = [WSIN] + [WSON]
The blank test and limit of detection results for anions, cations, ammonium, nitrite, and nitrate are shown in Table 2. All obtained concentrations of aerosol samples were at least three times higher than in the blank measurements.

3. Results and Discussion

3.1. Meteorological Characteristics and Air Masses

The meteorological data of Dongsha Island during the research period were as follows: average temperature = 25.9 ± 3.1 °C; average wind speed = 5.2 ± 2.4 m s−1; average relative humidity = 85% ± 3.6%; and average annual accumulated precipitation = 1700 mm. In this study, March–May was considered spring, June–August was summer, September–November was autumn, and December–February was winter. The temperature began to increase in March, reaching the highest average temperature (28–31 °C) between July and September and the lowest (18–20 °C) between January and February. The precipitation and temperature trends were similar, with a wet season in the summer and dry season in the winter. Regarding variation of wind direction, the north-east monsoon was in effect across winter, spring, and autumn, whereas the south-west monsoon occurred in summer; however, the wind direction was prone to drastic changes from June to August because of typhoons. The wind speed was higher in autumn (3.4–8.9 m s−1) and winter (5.4–8.0 m s−1) than it was in spring (3.5–6.7 m s−1) and summer (2.5–3.8 m s−1).
In addition to collecting meteorological data, this study employed the hybrid single-particle Lagrangian integrated trajectory (HYSPLIT) model established by the US National Oceanic and Atmospheric Administration to illustrate air mass back trajectories (AMBTs) for determining the source of air masses during the sampling period. Such trajectories can be used as an auxiliary tool for estimating the source of suspended particles collected in a region. Because the air masses that affected the sampling point were generated approximately 3 days prior to testing, the reversal time in this study was set to 72 h. Referring to the height parameters set by [31], 100, 500, and 1000 m represented the airflow trajectories for estimating the airflow transmission pathway and air mass sources of the research area at low, medium, and high altitudes, respectively. According to the classification method developed by [32], the sources of airflow trajectories during sampling can be divided into three categories according to regional characteristics:
(1)
Northern sources: air masses originating from inland and north-eastern China that are transported by the north-east monsoon.
(2)
Southern sources: air masses originating from the Indochinese Peninsula and SCS that are transported by the south-west monsoon.
(3)
Marine sources: air masses originating from high-pressure areas over the Pacific Ocean that do not pass over land.
Based on the seasons, the backward trajectories of air masses during the study period were statistically analyzed (Table 3). The majority of air masses (157 samples; 65%) recorded on Dongsha Island originated from northern sources. They often developed from autumn and winter, during the north-east monsoon, into the following spring. The other main source of air masses was southern sources (75 samples; 31%), which principally occurred in summer when the southwest monsoon prevailed. A total of 8 (3%) air masses originated from marine sources, primarily during summer.

3.2. Concentration of Major Water-Soluble Ions

Major ions are also known as the conservative elements in seawater [33], comprising Na+, K+, Mg2+, Ca2+, Cl, and SO42−. The sources of these ions can be divided into natural and anthropogenic: natural sources include ocean–atmosphere exchange, weathering, and forest fires, whereas anthropogenic sources include substances generated from fossil fuel and biomass combustion as well as emissions from factories and vehicles [34]. Analyzing the relative concentration and composition ratio of ions can determine their sources.
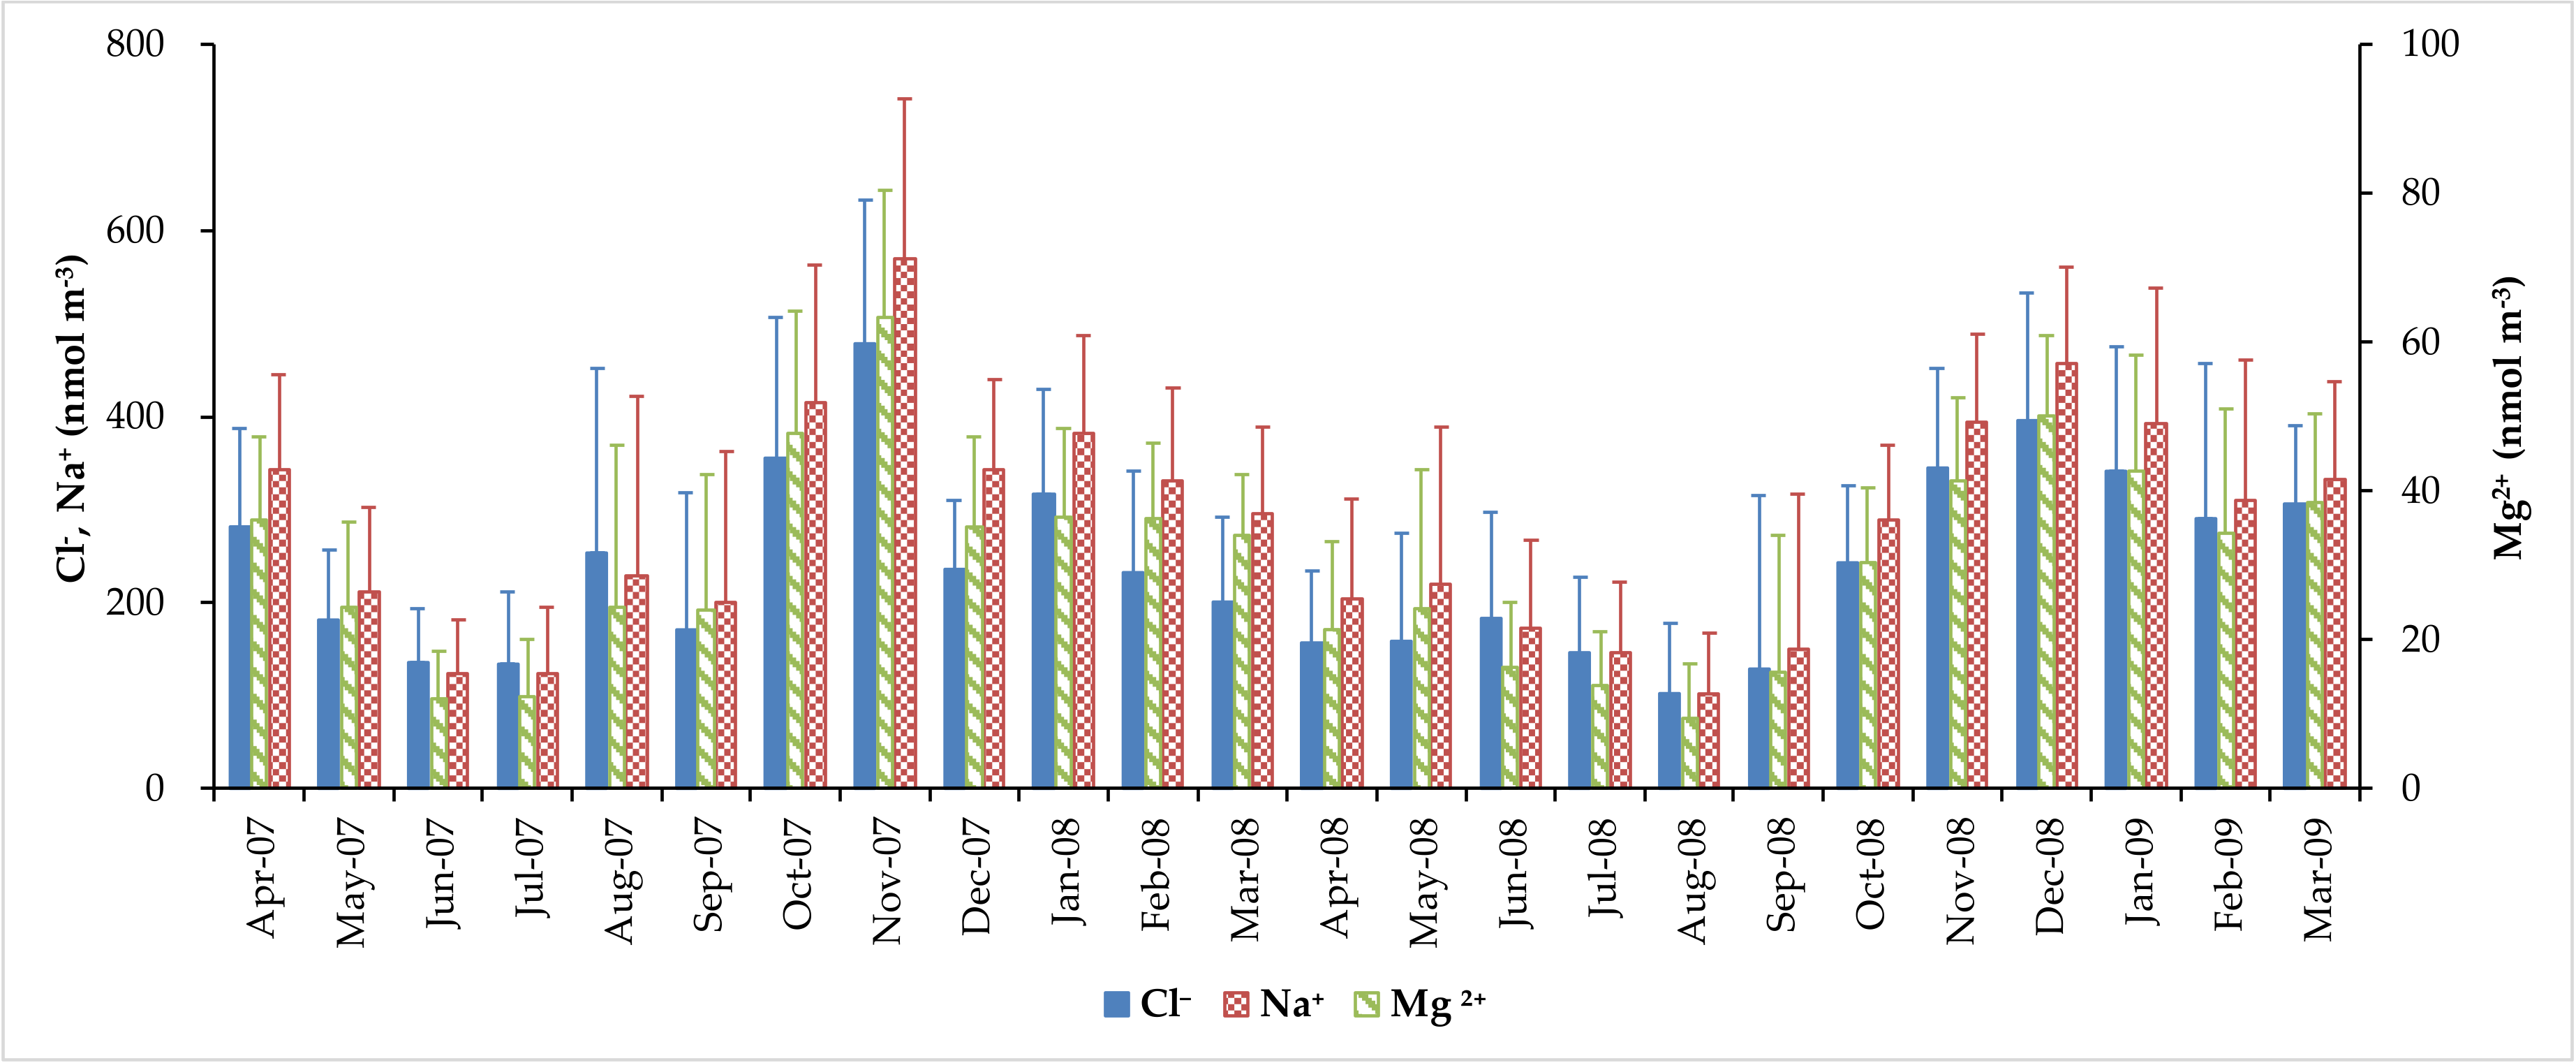
The concentration of sea salt ions during sampling is shown in Table 4 for Na+ (23.4–771 nmol m−3, average of 280 ± 165 nmol m−3); Cl (16.5–751 nmol m−3, average of 240 ± 149 nmol m−3); and Mg2+ (1.40–80.9 nmol m−3, average of 30.2 ± 18.4 nmol m−3). Figure 2 shows that temporal variations in the concentration of sea salt ions were similar. November 2007 (winter) was the month with the highest monthly average concentration of Na+ (570 ± 173 nmol m−3), Cl (478 ± 155 nmol m−3), and Mg2+ (63.4 ± 17.0 nmol m−3). August 2008 (summer) was the month with the lowest monthly average concentrations of Na+ (102 ± 65.9 nmol m−3), Cl (101 ± 76.4 nmol m−3), and Mg2+ (9.46 ± 7.22 nmol m−3). Comparing these findings with the meteorological data reveals that high concentrations of sea salt ions are related to wind speed. This is because the high wind speed of the northeast monsoon creates conditions more conducive to sea spray than the conditions in spring or summer.
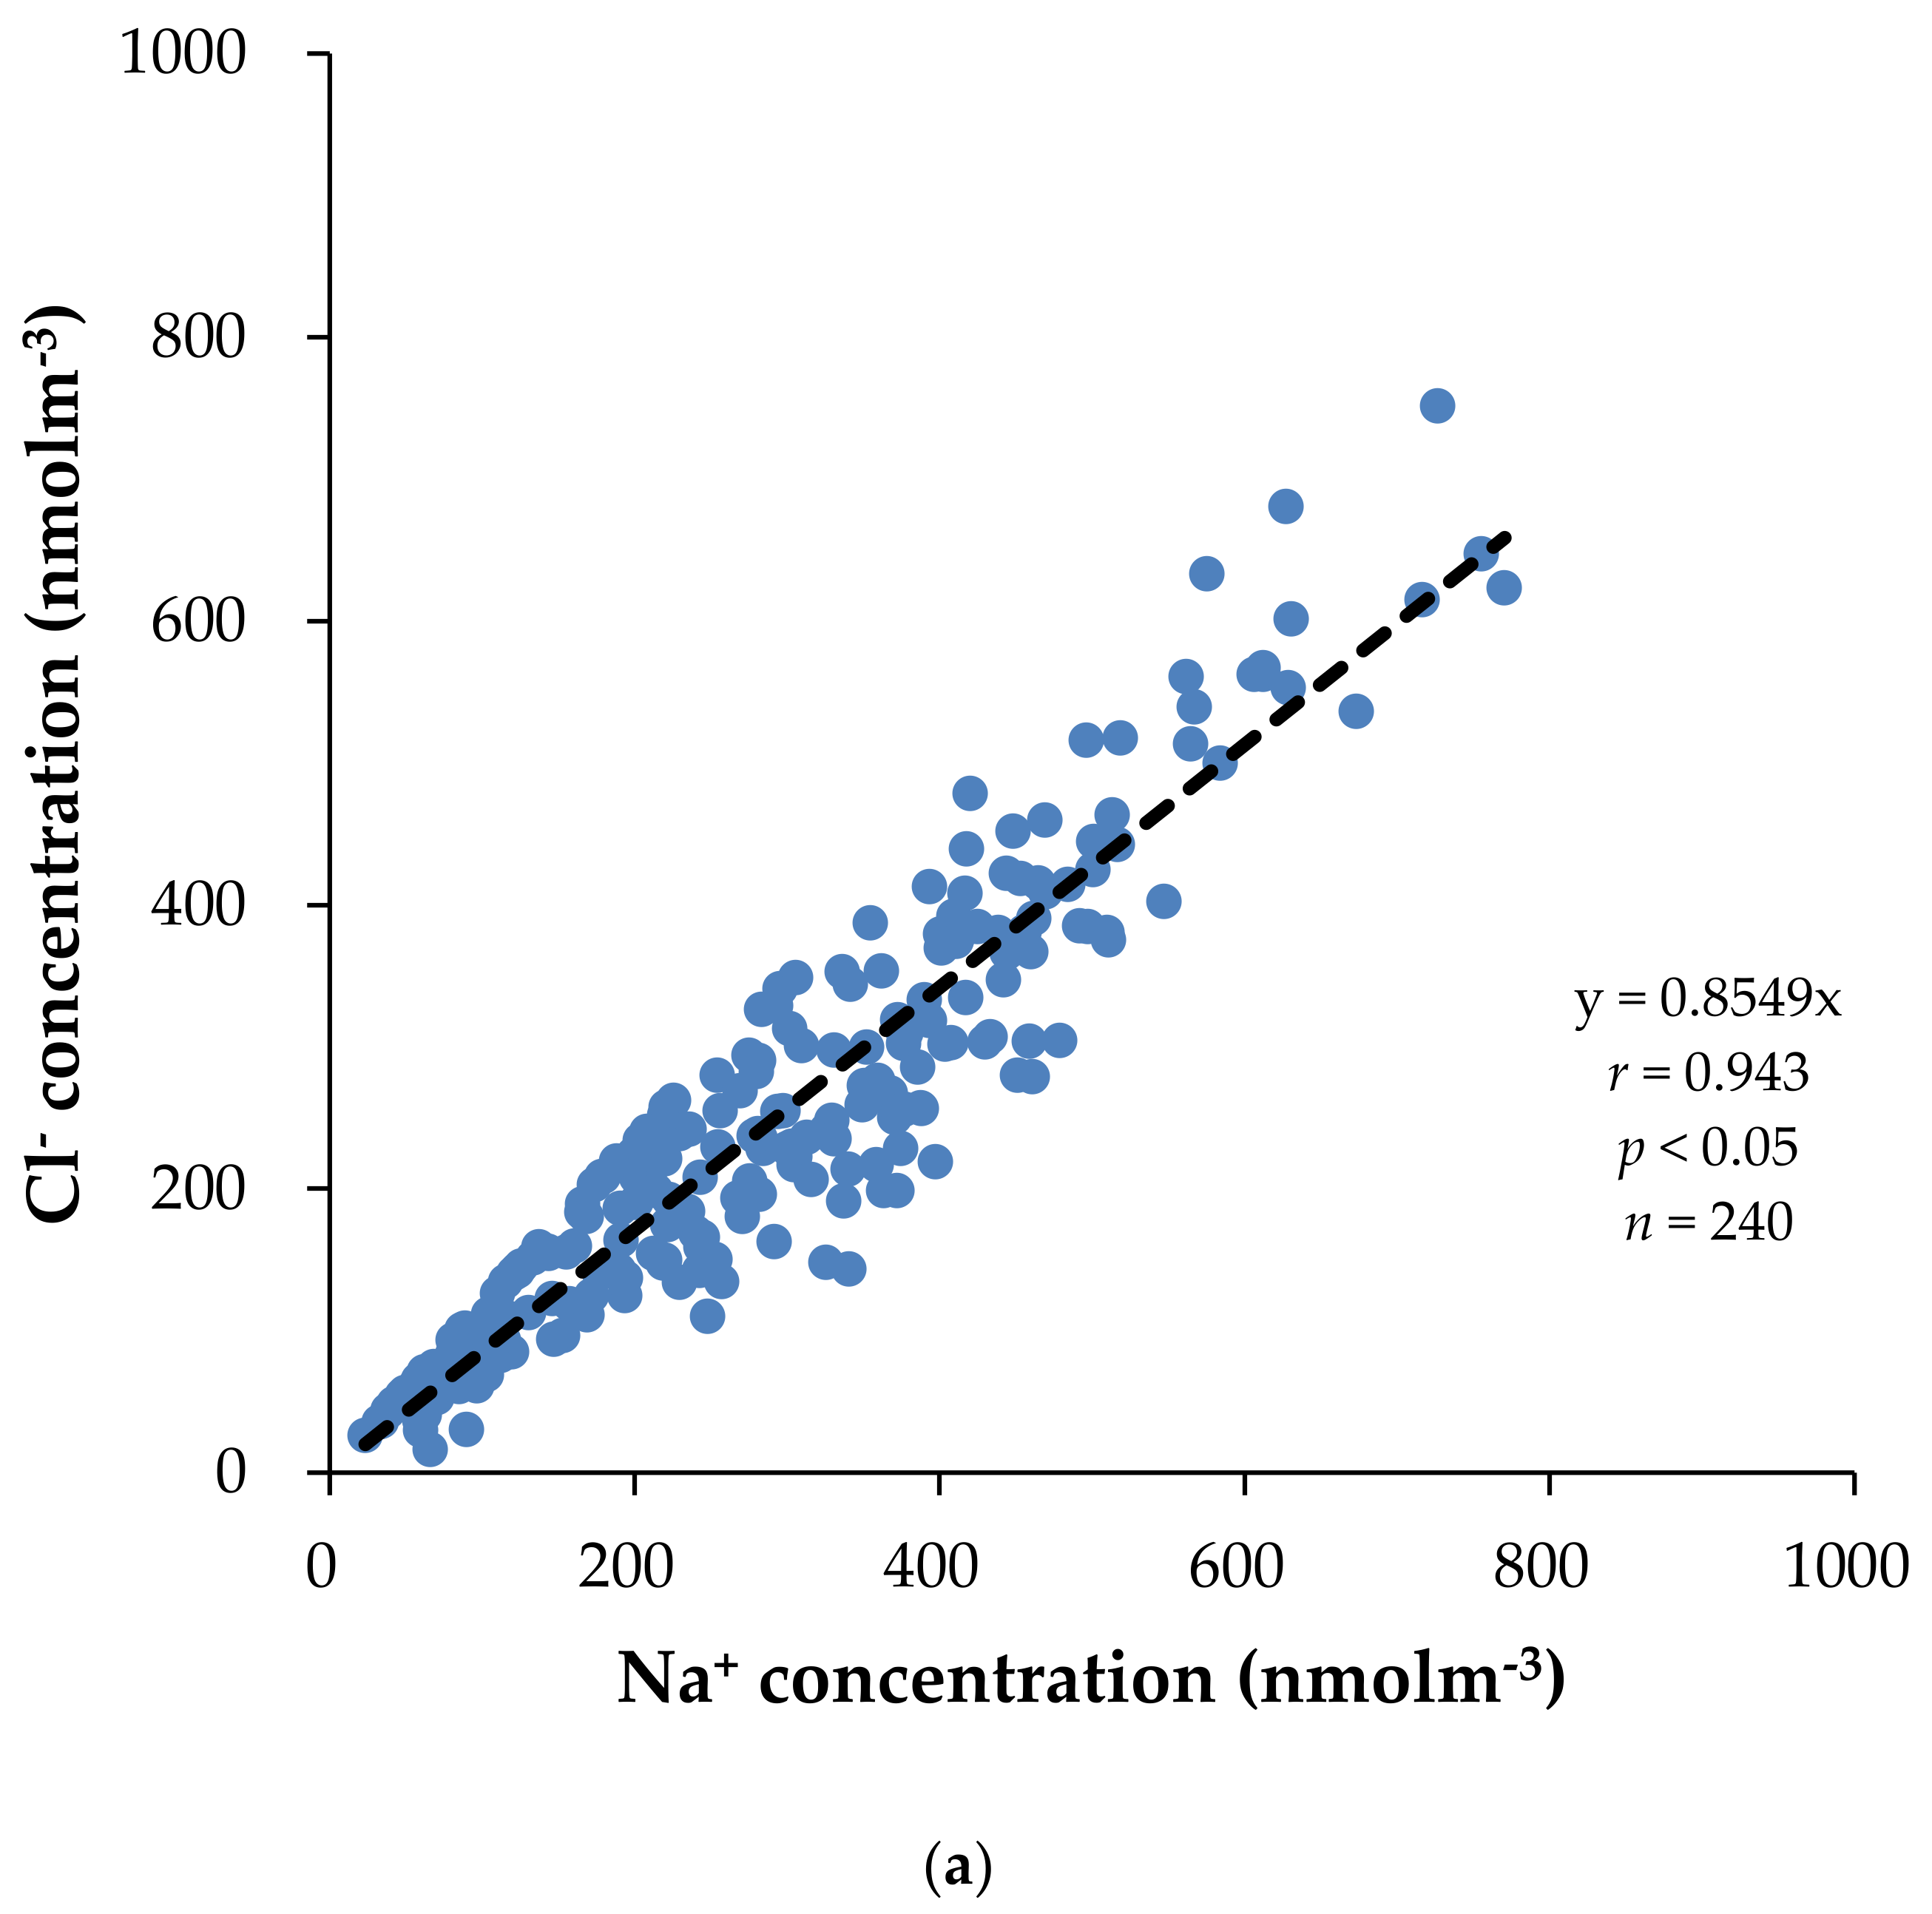
A scatter plot of Na+ versus sea salt ions (i.e., Cl and Mg2+) is presented in Figure 3, showing a molar concentration ratio Cl/Na+ of 0.85 (r = 0.94; p < 0.05). That this ratio is significantly lower than that of Cl/Na+ in seawater (1.17) suggests that chloride depletion occurred [7]. The annual average chlorine depletion during the study period was 25%. February 2008 (winter) exhibited the highest percentage (42%) of chlorine depletion and August 2007 (summer) the lowest percentage (4.2%). Keen et al. noted that Mg2+ is an ideal indicator for marine sources [35]. In this study, the molar concentration ratio Mg2+/Na+ was 0.11 (r = 0.99; p < 0.05), which was consistent with that in seawater. However, the concentration of Mg2+ was lower than that of Na+. Based on the relative concentrations of Na+ and Mg2+, Na+ can still be regarded as the most suitable indicator for sea salt sources [36].
The molar concentration ratios K+/Na+, Ca+2/Na+, and SO42−/Na+ were 0.04, 0.05, and 0.34, respectively, which were higher than those in seawater (0.02, 0.02, and 0.06, respectively). In addition to sea salt sources, these three ions were inferred to have other sources on Dongsha Island. Chen and Chen subtracted the ratio of these three ions in seawater from their concentration and then defined the obtained values as the concentrations of NSS ions (nmol m−3) [31]; this process was referenced for the following formulas:
[nss-K+] = [K+] − 0.02 × [Na+]
[nss-Ca2+] = [Ca2+] − 0.02 × [Na+]
[nss-SO42−] = [SO42−] − 0.06 × [Na+]
where [Na+], [K+], [Ca2+], and [SO42−] are the concentrations of sodium, potassium, calcium, and sulfate ions, respectively, and [nss-K+], [nss-Ca2+], and [nss-SO42−] are the concentrations of NSS potassium, NSS calcium, and NSS sulfate ions, respectively.
In the environment, these NSS ions can be regarded as indicators of different sources: NSS potassium ions (nss-K+) are mainly derived from biomass combustion and agricultural activities; NSS calcium ions (nss-Ca2+) primarily originate from windblown soil, a crustal source; and NSS sulfate ions (nss-SO42−) are mainly generated by anthropogenic activities such as fossil fuel combustion and factory and vehicle emissions [37,38,39].
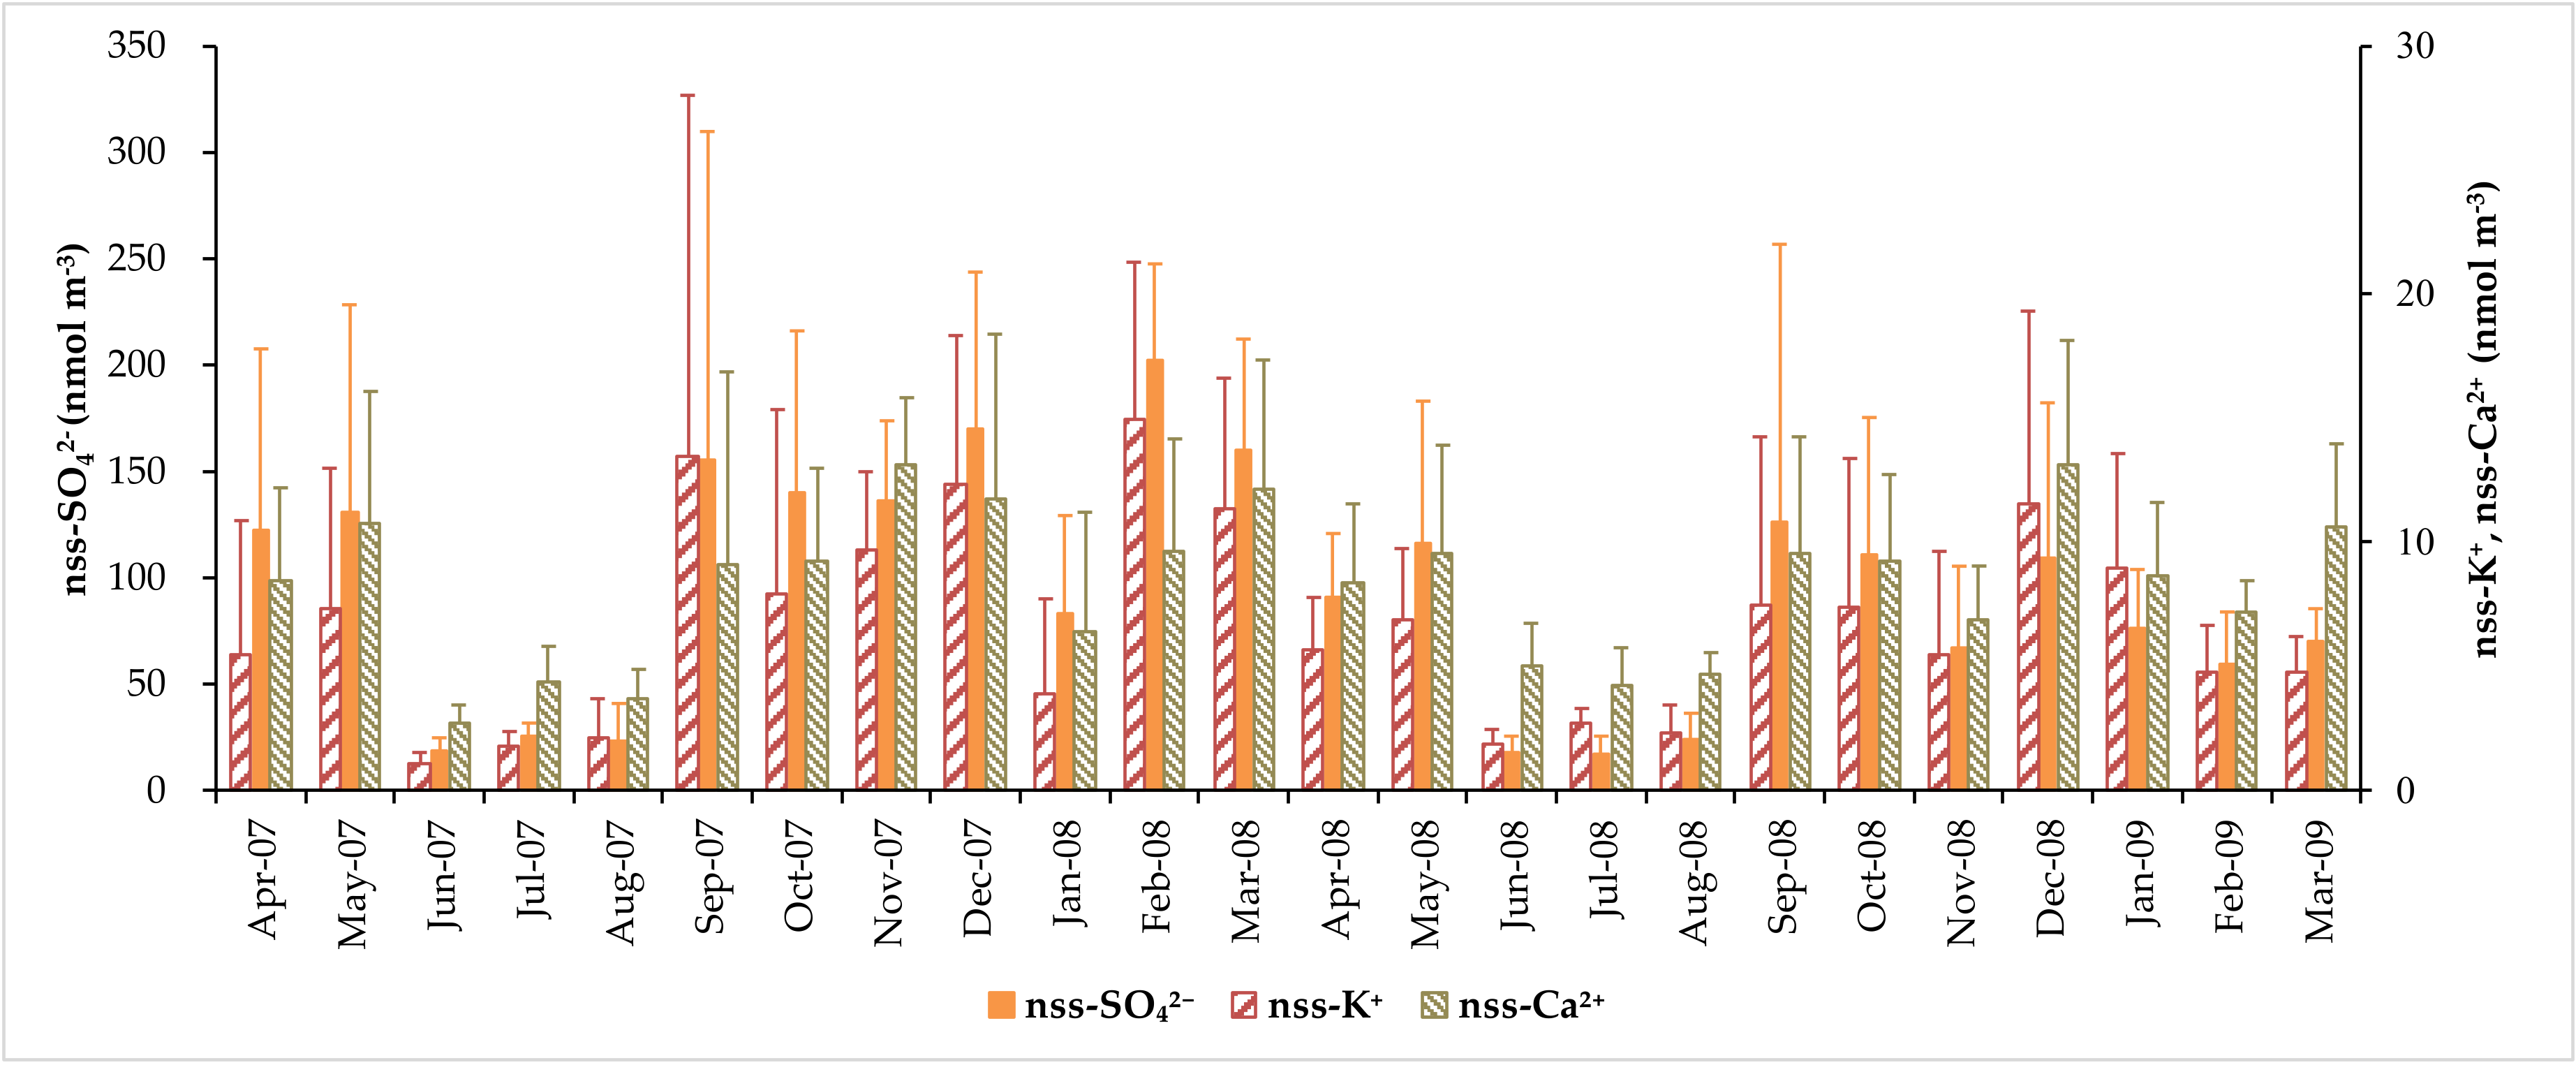
The variation in concentration of NSS ions during the sampling period is detailed in Table 4: nss-K+ (0.04–45.6 nmol m−3; average of 6.70 ± 6.33 nmol m−3); nss-Ca2+ (1.16–25.6 nmol m−3; average of 8.26 ± 4.73 nmol m−3); and nss-SO42− (0.27–437 nmol m−3; an average of 93.8 ± 80.6 nmol m−3). The trend chart of monthly average concentration of NSS ions (Figure 4) shows that the highest monthly concentration of nss-Ca2+ (13.1 ± 4.99 nmol m−3) appeared in December 2008 (winter), and the highest monthly concentrations of nss-K+ (14.9 ± 6.36 nmol m−3) and nss-SO42− (203 ± 45.1 nmol m−3) were in February 2008 (spring). By contrast, the lowest monthly concentrations of nss-K+ (1.05 ± 0.47 nmol m−3) and nss-Ca2+ (2.70 ± 0.75 nmol m−3) appeared in June 2007 (summer), and the lowest monthly average concentration of nss-SO42− (17.3 ± 8.15 nmol m−3) was in July 2008 (summer). The seasonal variation trends of nss-K+ and nss-SO42− were consistent with the degree of chlorine depletion, indicating that the chlorine depletion of atmospheric aerosols on Dongsha Island was related to aerosols generated from biomass and fossil fuel combustion.

3.3. Concentrations of Water-Soluble Total Nitrogen (WSTN), Water-Soluble Inorganic Nitrogen (WSIN), and Water-Soluble Organic Nitrogen (WSON) Species

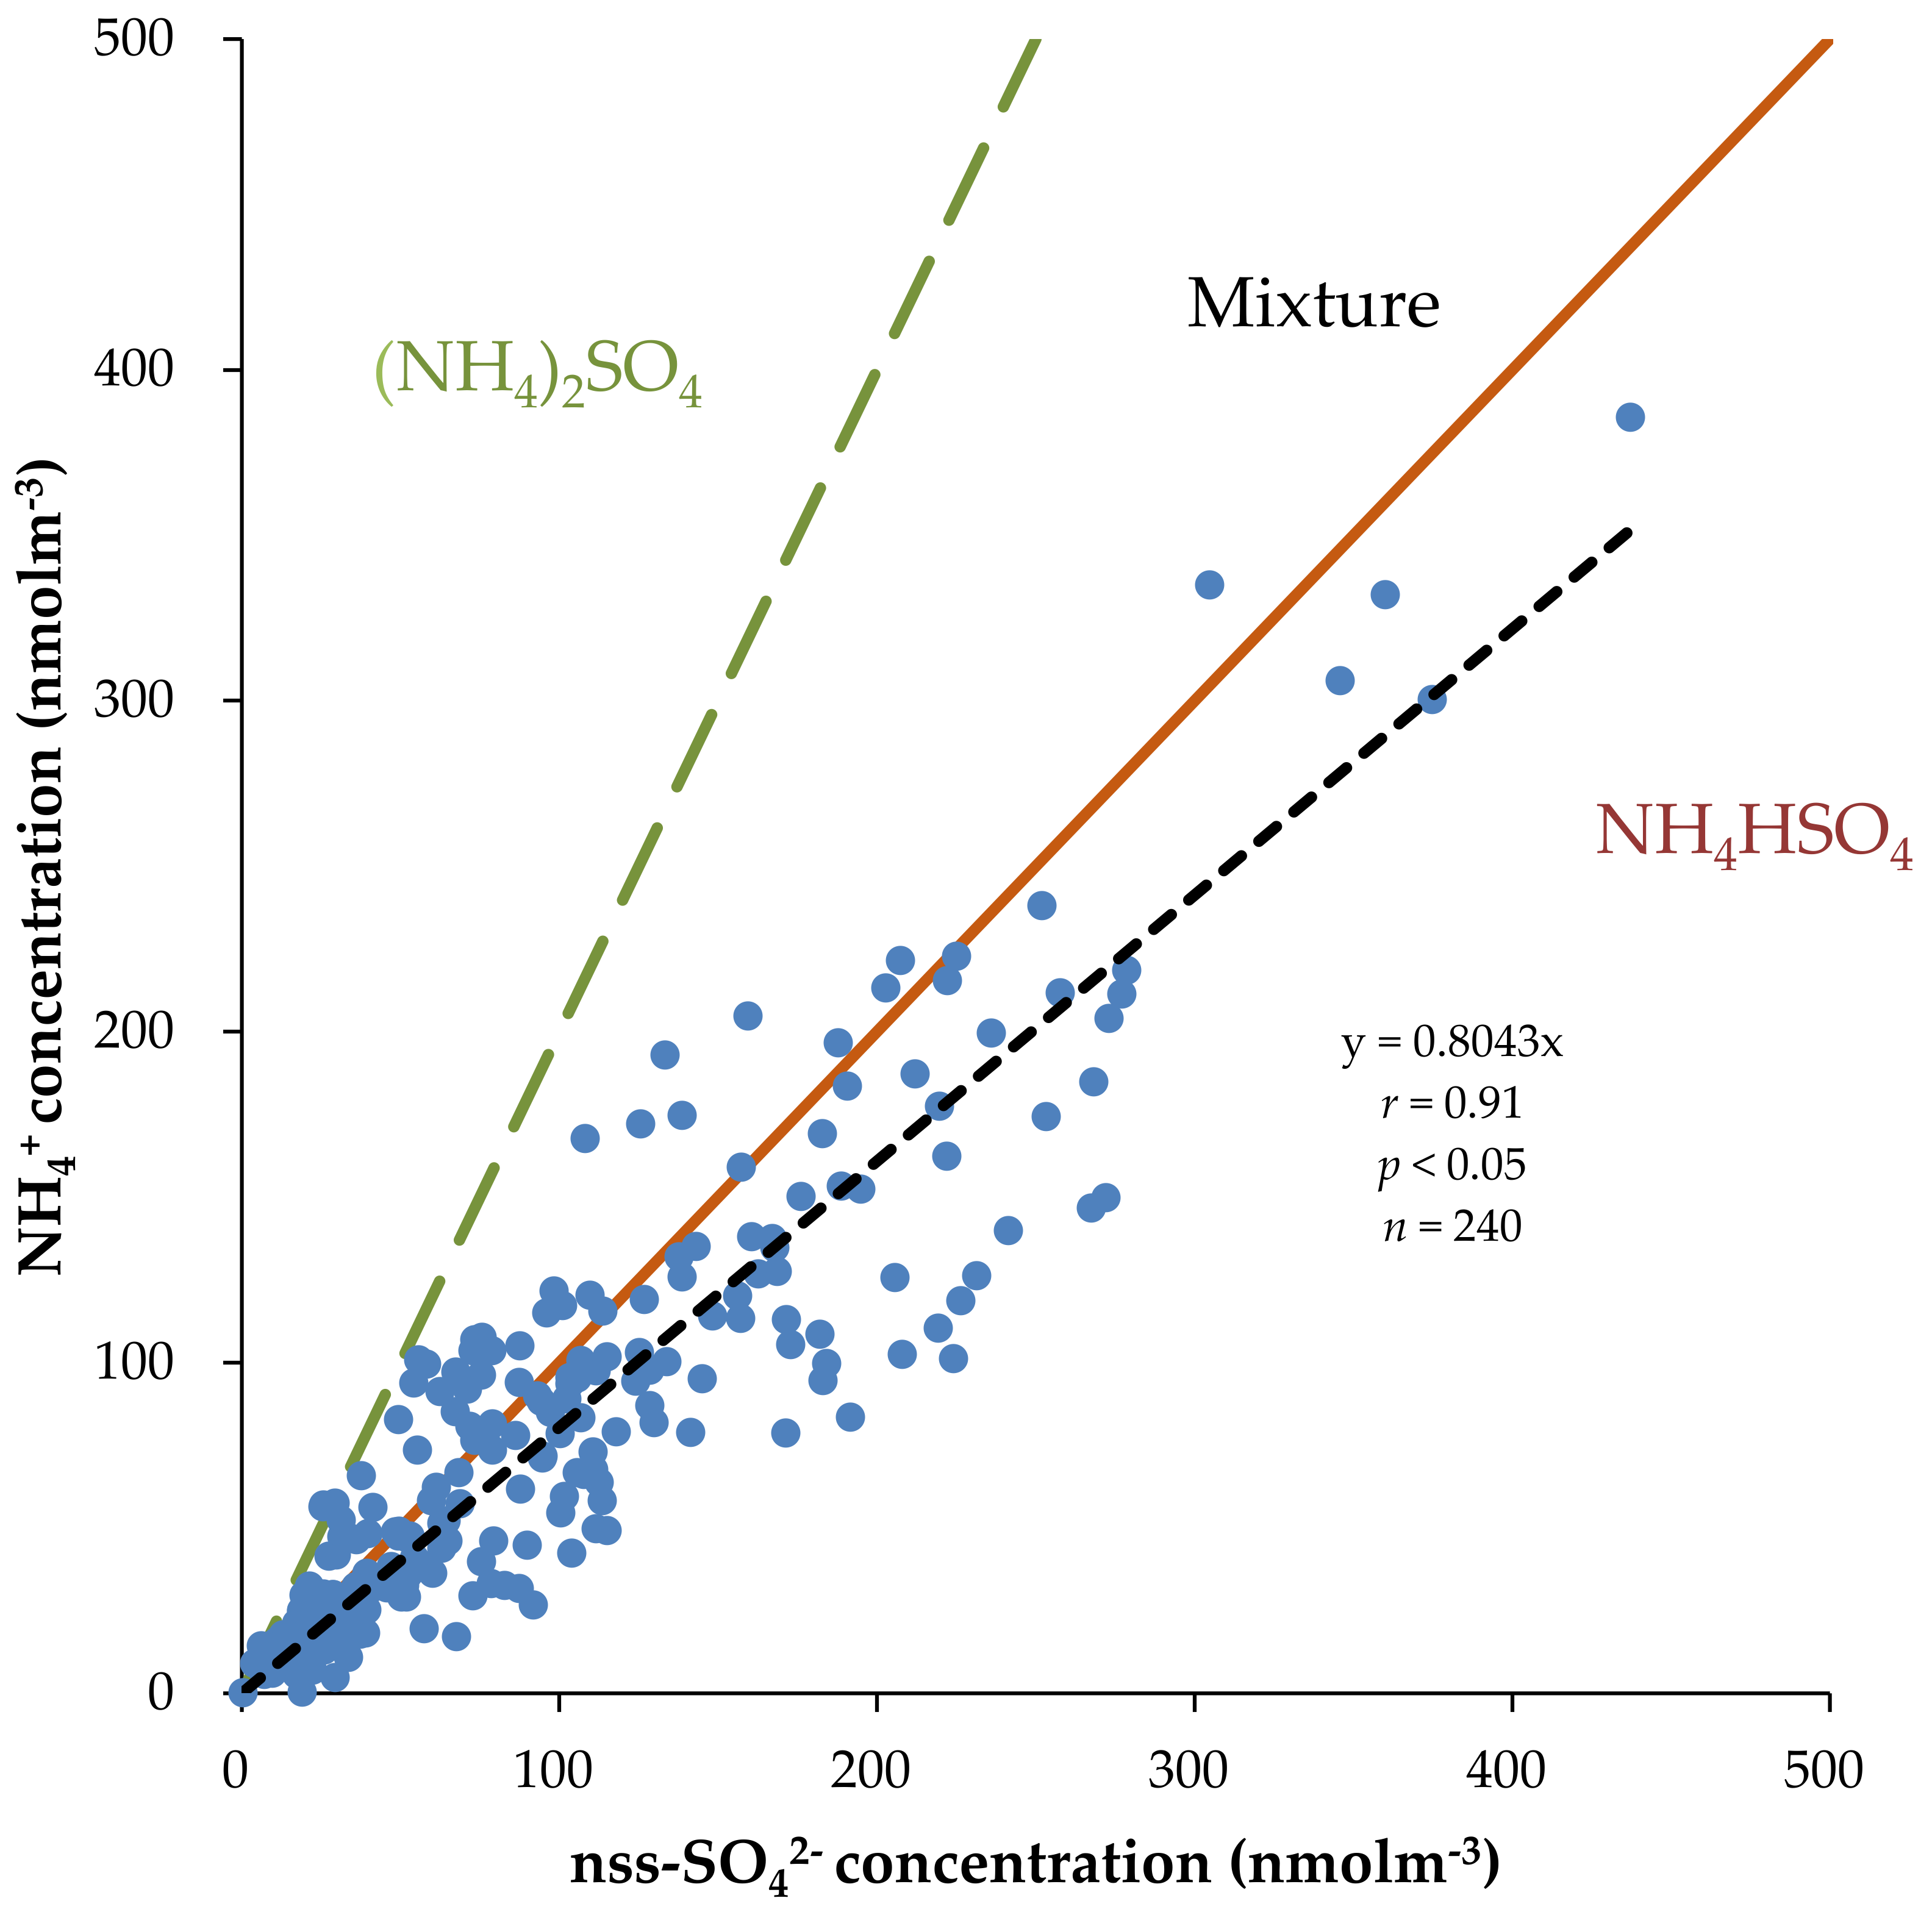
Table 5 indicates that the average concentration of NH4+ was 78.4 ± 67.2 nmol m−3, with the highest monthly average value occurring in September 2007 (155 ± 145 nmol m−3) and the lowest in July 2008 (16.0 ± 3.37 nmol m−3). The highest and lowest monthly concentrations were accompanied by the relatively high and low concentrations of nss-SO42− and nss-K+, respectively, indicating the strength of anthropogenic activities. Mainly used in agricultural activities such as animal husbandry and synthetic fertilizers, NH4+ can easily form secondary aerosols with sulfates and nitrates [40,41,42]. In this study, the molar ratio NH4+/nss-SO42− in the atmosphere of the research area was 0.80 (Figure 5), indicating that NH4+ on Dongsha Island was chiefly in the form NH4HSO4. Similarly, the molar ratio obtained by [7] in the SCS (1.44) was <2, indicating that the anthropogenically derived NH4+ was insufficient for an NSS sulfate reaction. However, the aforementioned results contradict research conducted by [43] in Beijing and [15] on Huaniao Island, locations that have been heavily influenced by anthropogenic activities. The molar ratios NH4+/nss-SO42− in their studies were 2.50–3.54 (Beijing) and 2.3 (Huaniao Island); these areas are dominated by (NH4)2SO4 because the anthropogenically derived NH4+ in these locations is sufficient for the NSS sulfate reaction.
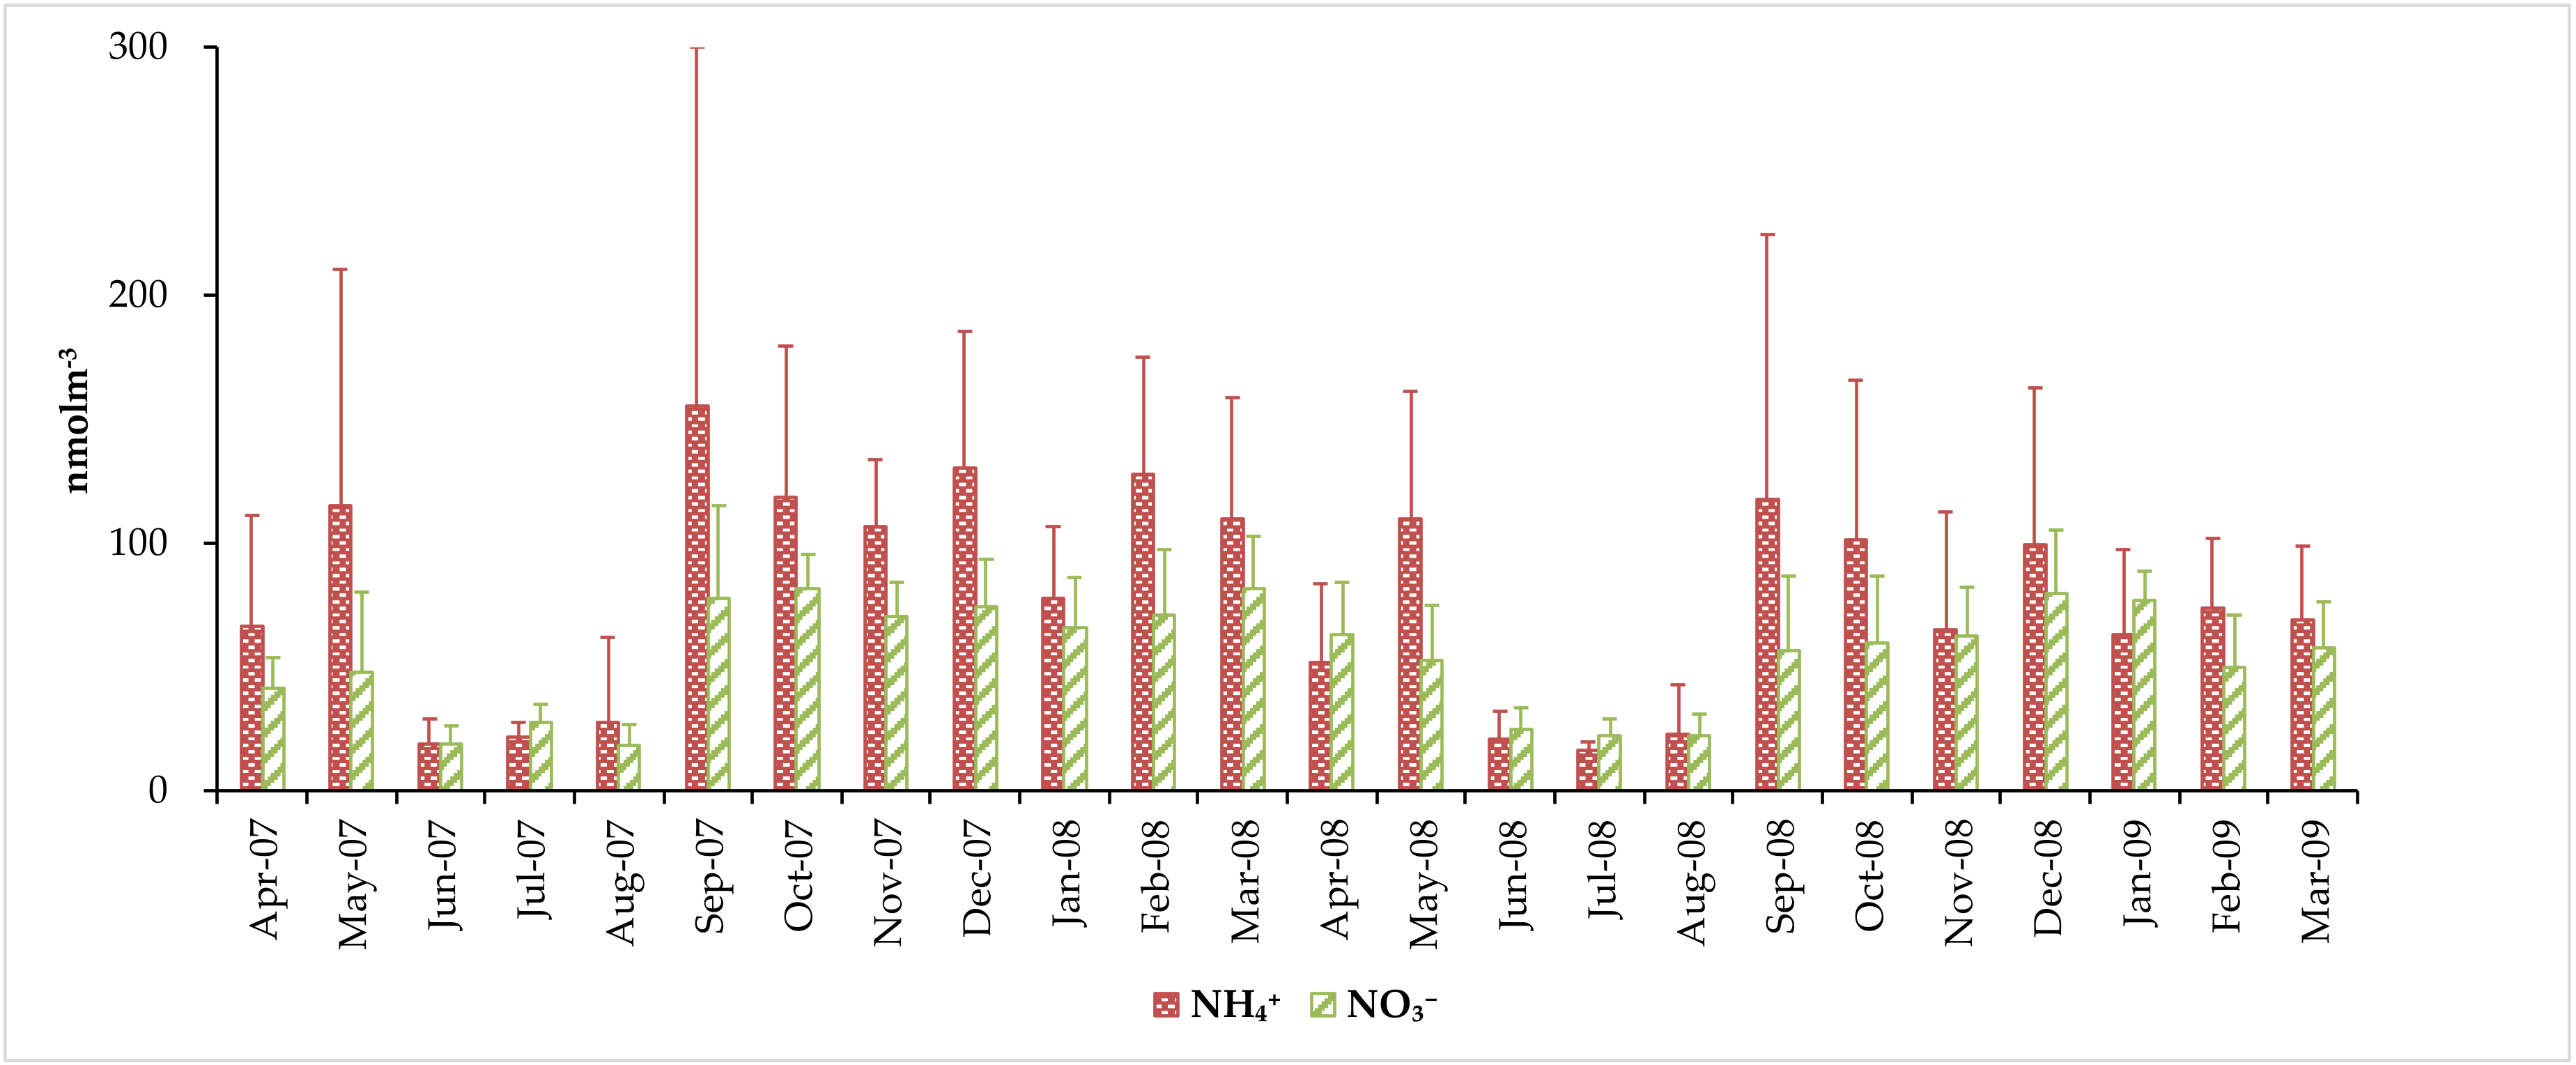
Figure 6 shows that the temporal variation of NO3 concentration (average 53.4 ± 28.7 nmol m−3) in the present study was consistent with that of NH4+, with the highest monthly average value in October 2007 (81.6 ± 13.6 nmol m−3) and lowest in August 2007 (18.1 ± 8.30 nmol m−3). As a nitrogen oxide (NOx) generated from fossil fuel combustion, NO3 can rapidly form through nitric acid reaction in aerosol and become the main source of atmospheric nitrate [44]. Pryor and Sørenson stated that nitric acid significantly contributes to the deposition of total nitrogen because of its high solubility [45]; specifically, the nitrate in marine environments combines with sea salt particles through atmospheric transmission.
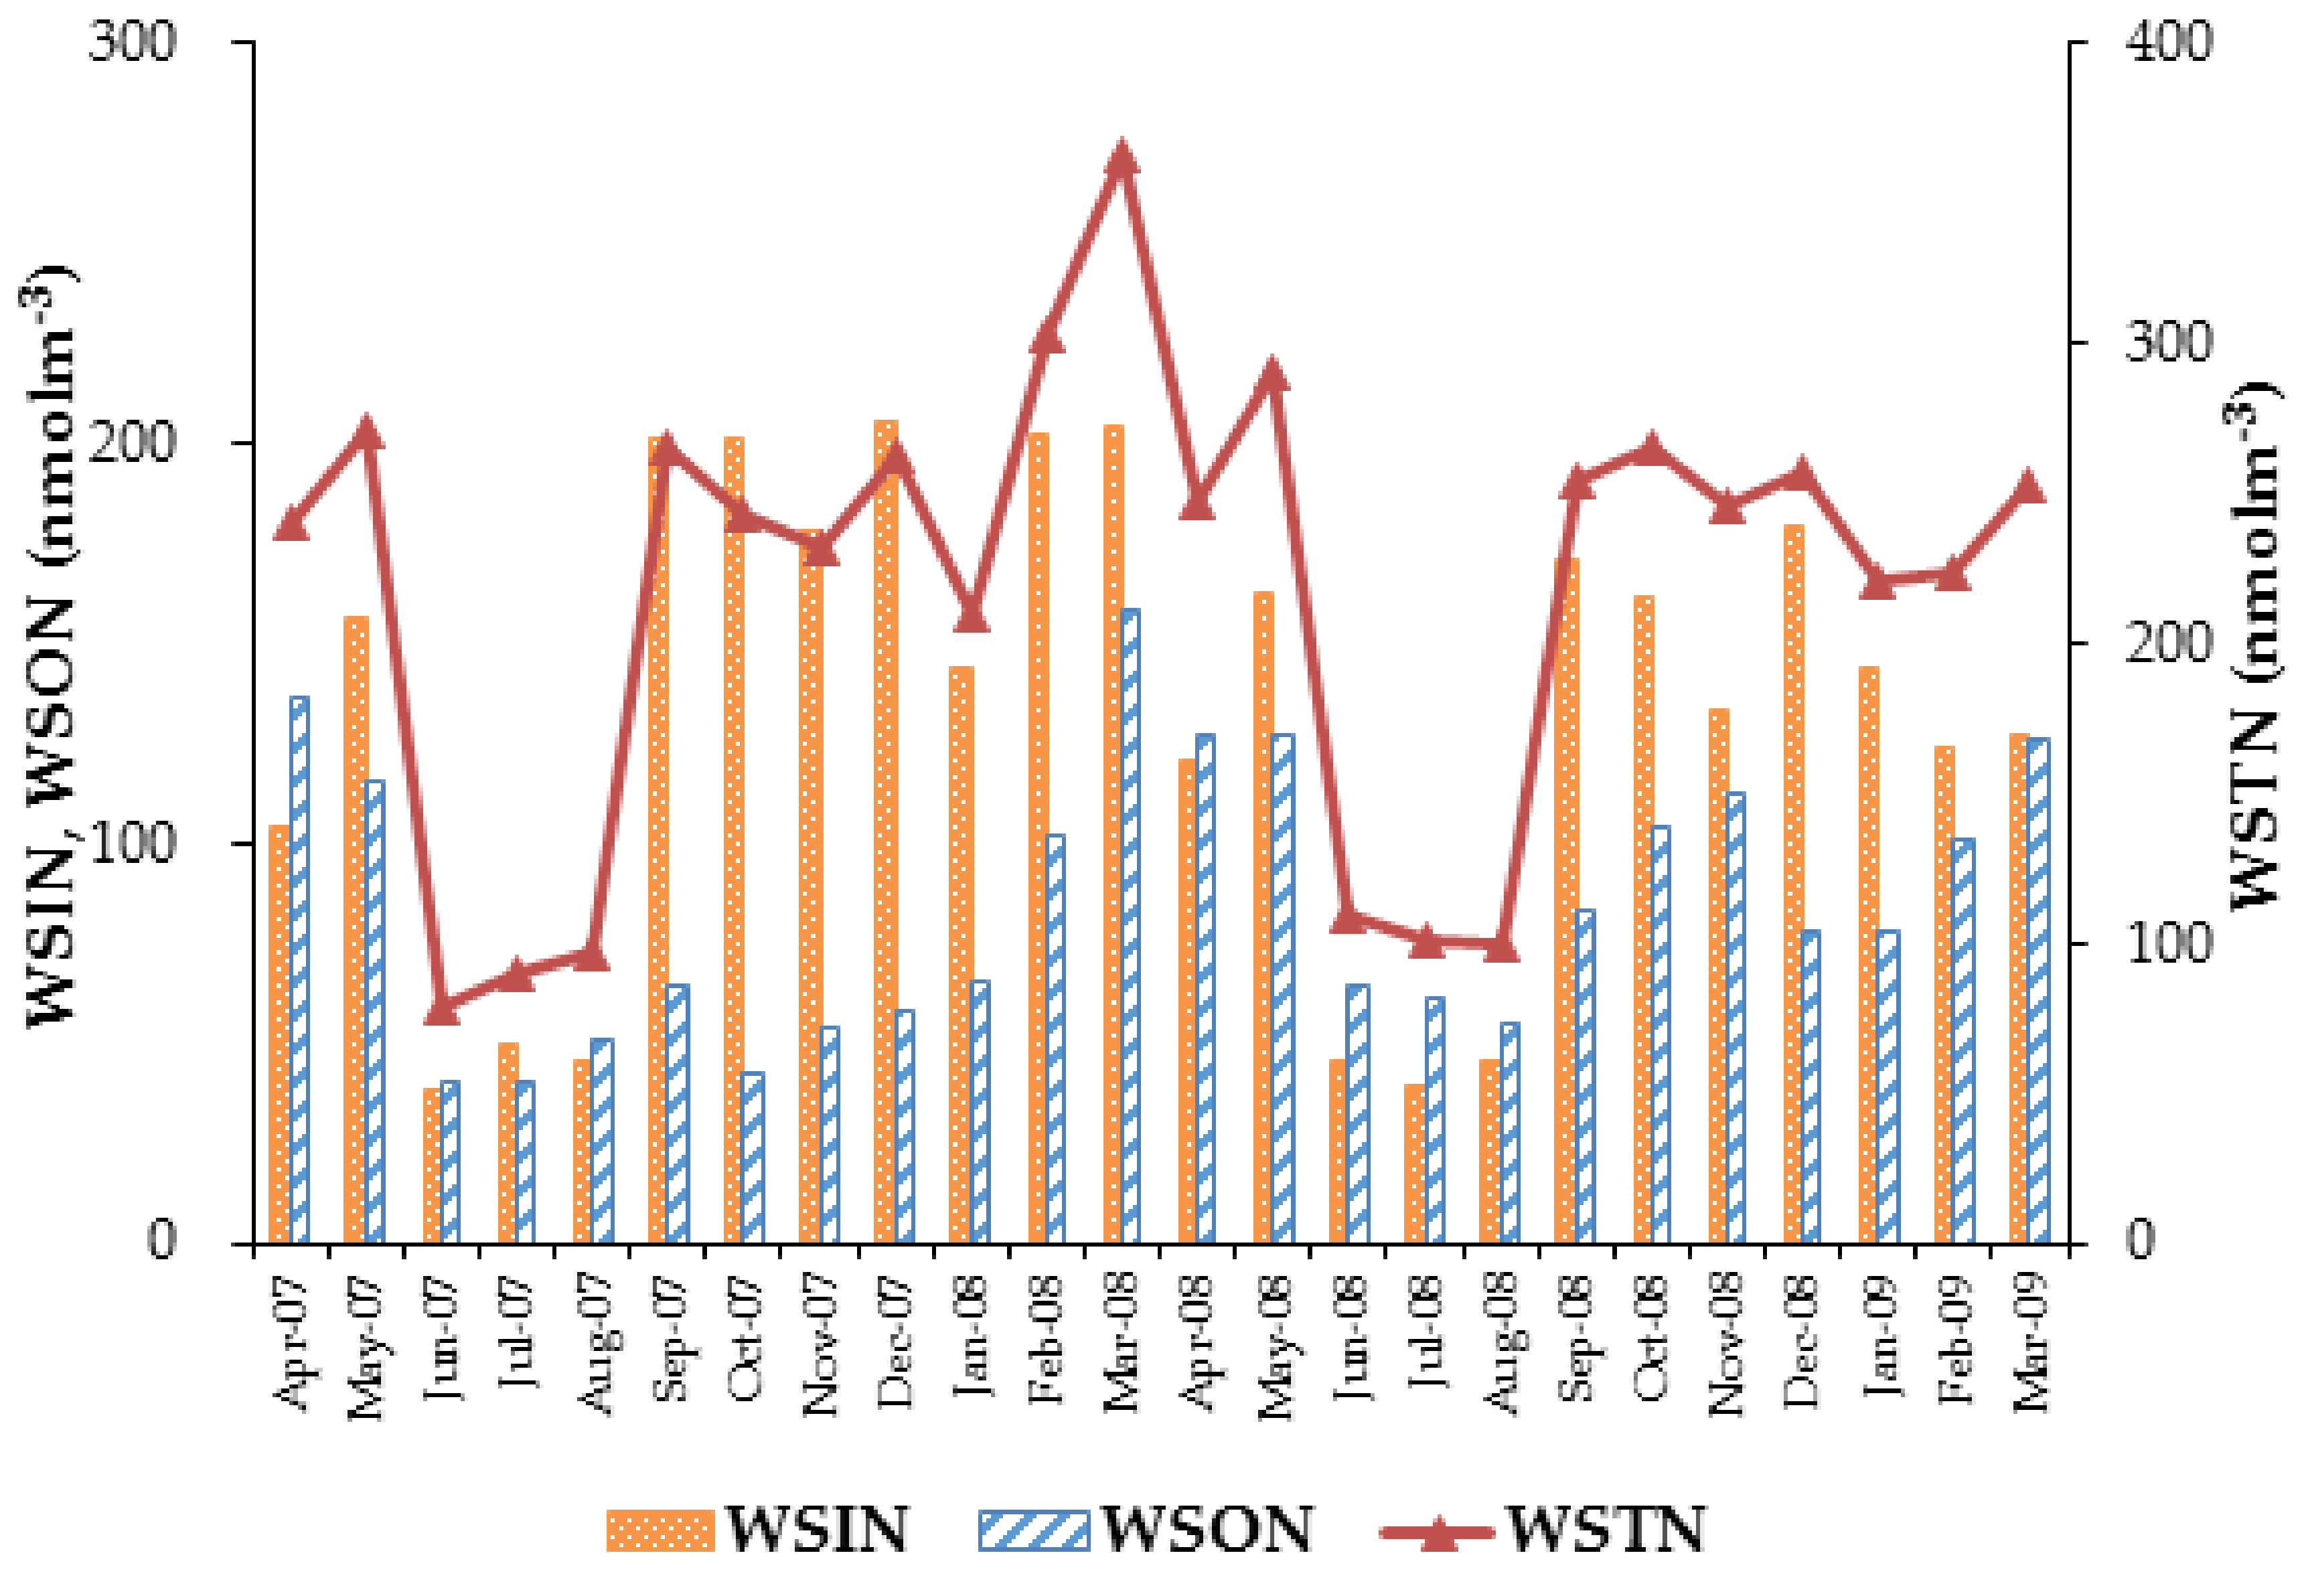
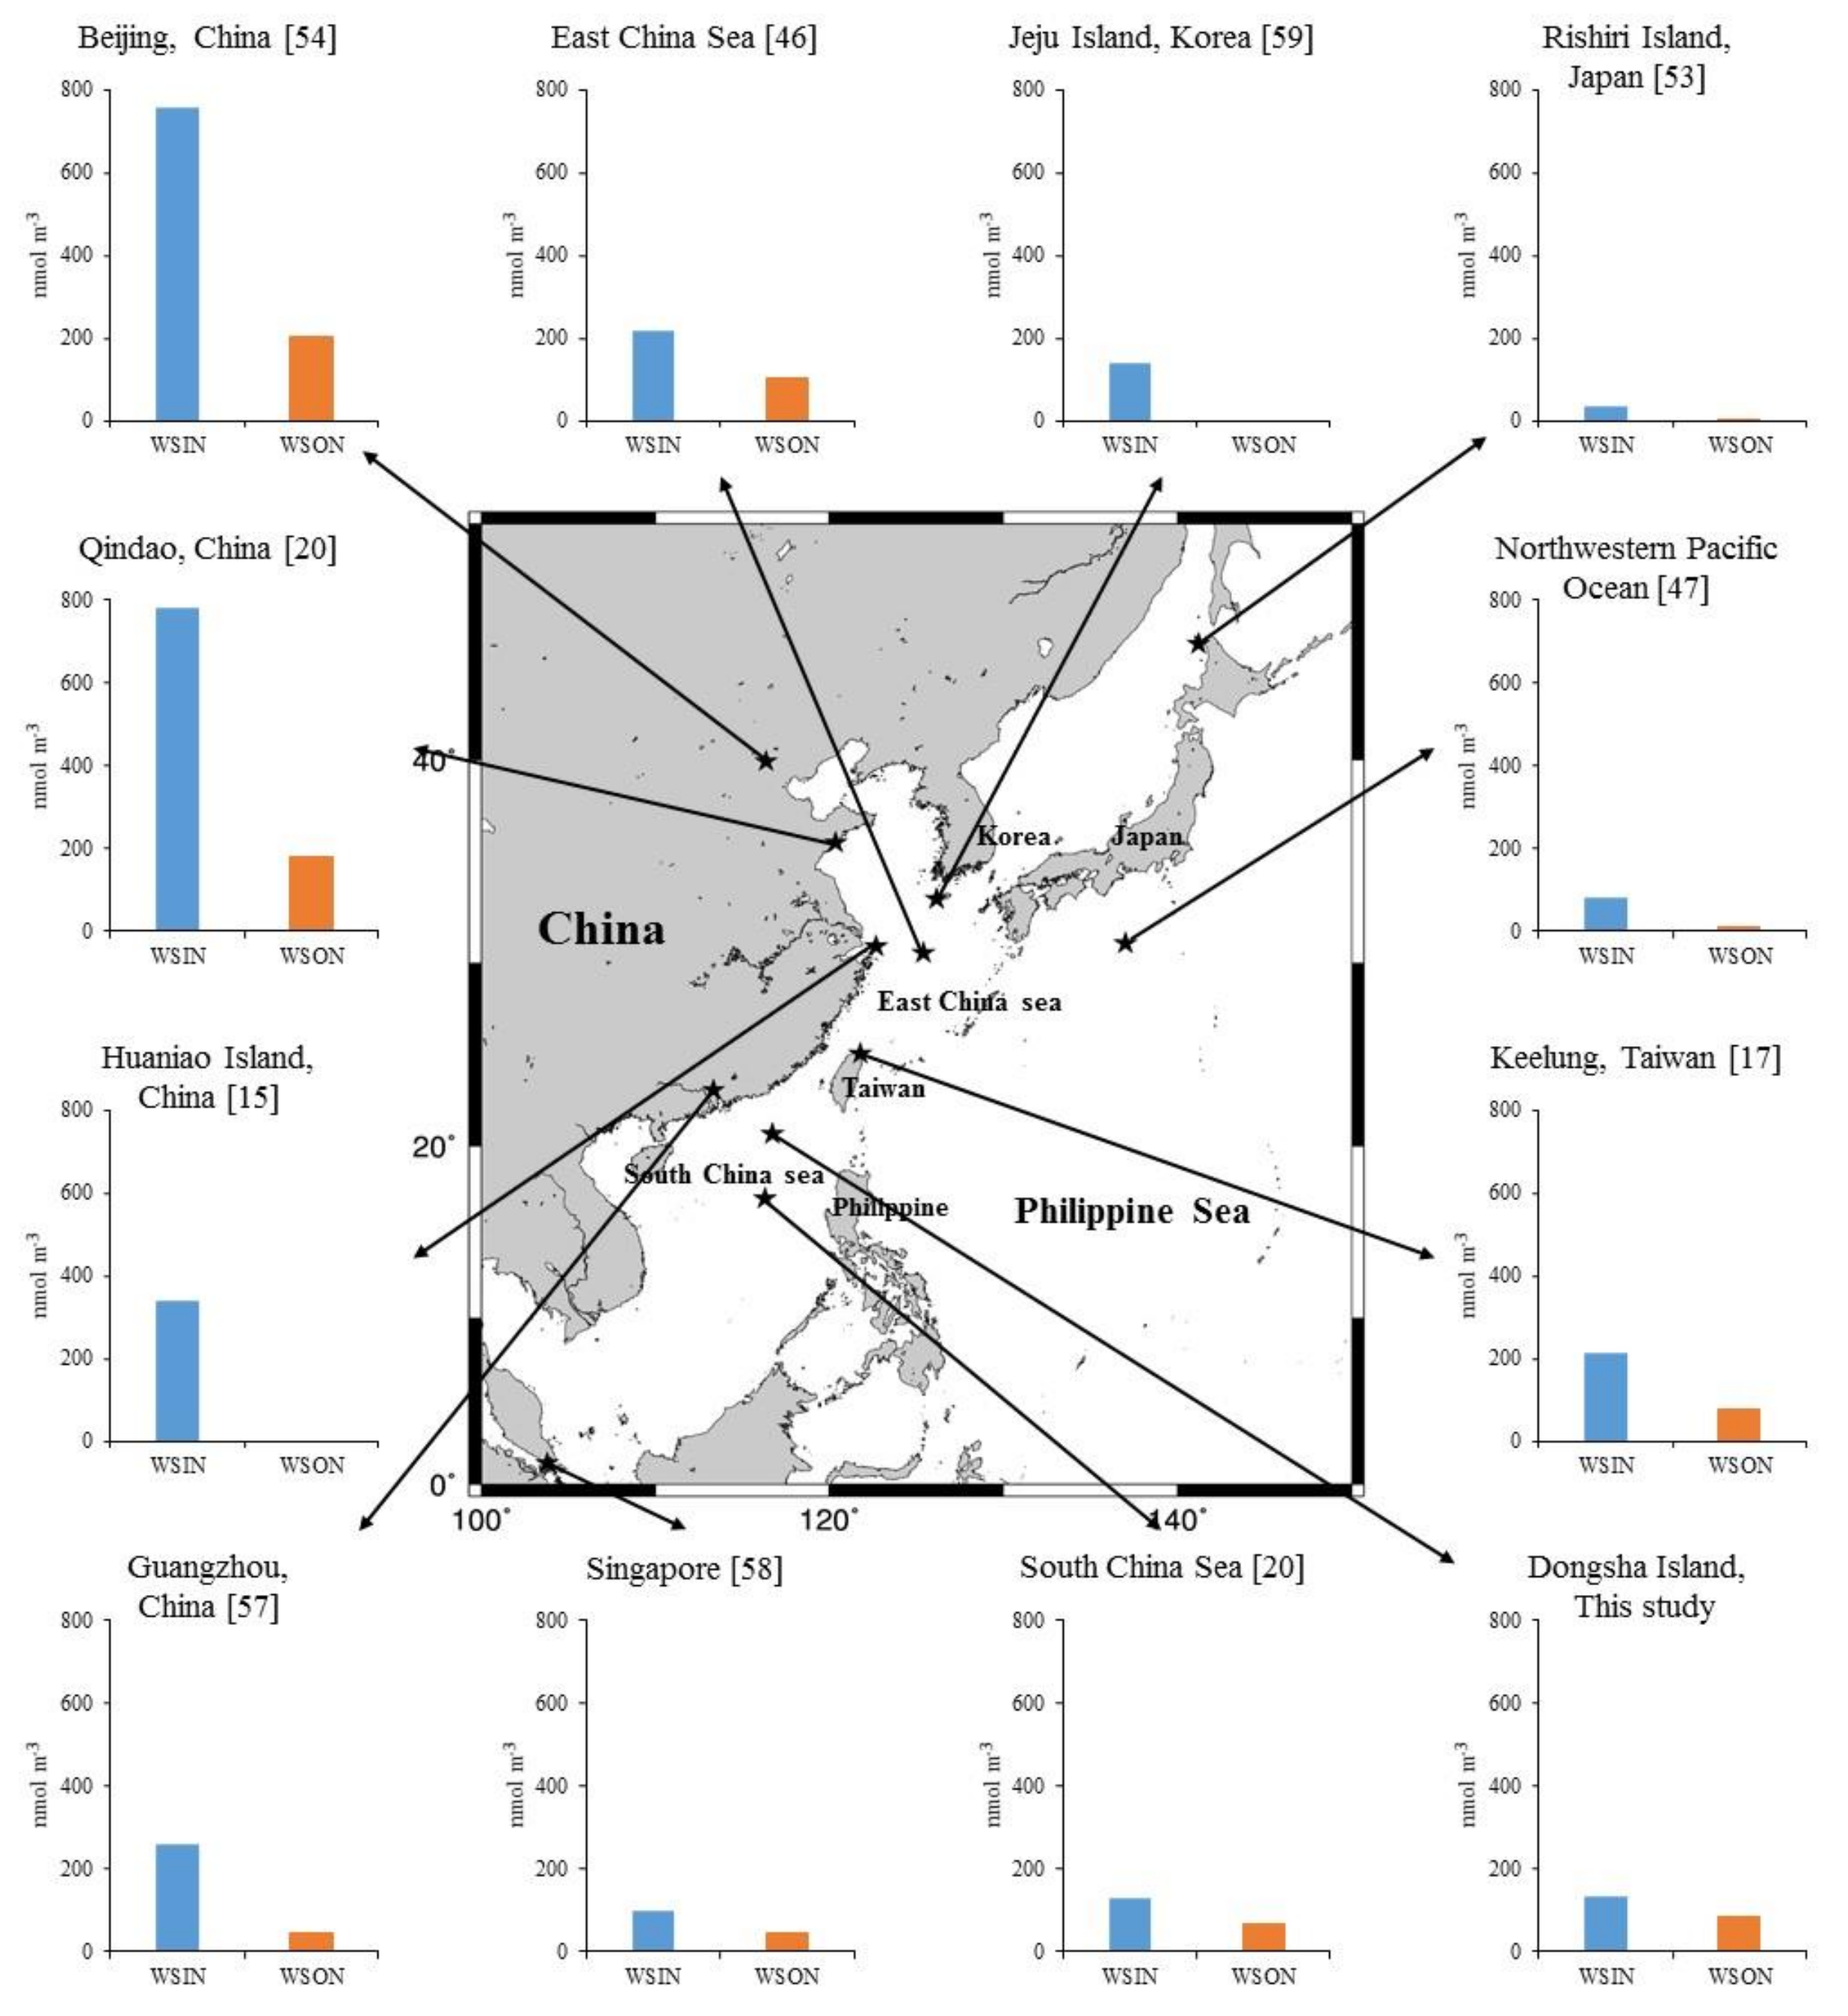
Figure 7 reveals that the seasonal variations of WSIN, WSON, and WSTN exhibited similar trends. The average concentrations of WSIN, WSON, and WSTN were 132 ± 87.9, 85 ± 46, and 217 ± 115 nmol m−3, respectively. The WSIN, WSON, and WSTN mostly originated from northern sources, and the highest monthly average concentration usually occurred in spring or winter. By contrast, the lowest monthly average concentration usually occurred in summer, at which point the WSIN, WSON, and WSTN had southern sources. Recorded concentrations of WSTN collected in the Asian marginal sea area (Table 6; Figure 8) range from approximately 50 to 350 nmol m−3, with the highest value of 321 nmol m−3 [46] collected in the East China Sea, which was mainly affected by the emission of anthropogenically derived Nr species in China. The remaining concentrations are as follows, presented in descending order: 196 nmol m−3 in the SCS [20]; 91 nmol m−3 in the north-west Pacific Ocean [47]; and 58 nmol m−3 in the Bay of Bengal [48].
For locations north of 30° N in Asia, particularly in China, the recorded average WSTN concentrations range from approximately 300 to 1000 nmol m−3: 962 nmol m−3 in Beijing [54], 963 nmol m−3 in Qingdao [20], and 677 ± 594 nmol m−3 in Xi’an [55]. These results indicate that China emits large amounts of Nr from industrial activities. Compared with China, Jeju Island in Korea [59] and Rishiri Island in Japan [53] have relatively low concentrations of WSTN. For locations south of 30° N in Asia, the WSTN concentration ranges from approximately 50 to 300 nmol m−3: 303 ± 196 nmol m−3 in Guangzhou [57]; 289 ± 102 nmol m−3 in Keelung [17]; 211 ± 112 nmol m−3 on Dongsha Island; 141 ± 50 nmol m−3 in Singapore [58]; and 52 ± 29 nmol m−3 in Daya Bay [56].
From the aforementioned results, WSTN concentrations in Asia gradually diminish from north to south, with China exhibiting the highest concentrations, mainly induced by direct or indirect emissions from anthropogenic activities. The majority of locations north of 30° N exhibited an organic nitrogen ratio of <20% (10–20%), except for the East China Sea (32%) [46]. Locations south of 30° N exhibited an organic nitrogen ratio of 14–39%, with the majority of locations having a ratio >30%, except for Guangzhou (14%) [57]. Notably, the worldwide organic to total nitrogen ratio is approximately 26–30% [60,61], which is higher than that in locations north of 30° N. A possible explanation is excessive concentrations of inorganic nitrogen, which caused the ratio of organic nitrogen to decrease; this shows that anthropogenic activities in China contribute considerably to nitrogen deposition in the surrounding marine ecosystem.

3.4. Correlation Analysis and Principal Component Analysis (PCA)

To determine the correlations among species, IBM SPSS Statistics 22 was employed for correlation analysis. Table 7 shows that there was strong correlation among sea salt ions (Na+, Mg2+, and Cl; r = 0.92–0.99), and sea salt ions were also significantly correlated with wind speed (r = 0.72–0.82). Thus, seawater was the main source of sea salt ions. High wind speed causes seawater to form sea salt particles, which further affects the concentration of sea salt ions. The correlation between Ca2+ and sea salt ions was relatively strong (r = 0.65–0.77), and Ca2+ was highly correlated with nss-Ca2+ (r = 0.87) and wind speed (r = 0.71); nss-Ca2+ originates from crustal sources and is especially susceptible to influence by Asian dust in the spring [7]. This result is consistent with that obtained in a study by [31] on aerosols in the southern East China Sea, indicating that terrestrial substances from continental Asia can reach the SCS. K+ was moderately correlated with sea salt ions (r = 0.41–0.64), highly correlated with nss-K+ (r = 0.89), and moderately correlated with wind speed (r = 0.62), which indicates that aerosols within this region are also affected by biomass combustion [38]. SO42− was strongly correlated with nss-SO42− (r = 0.99) and moderately correlated with wind speed (r = 0.41), suggesting that aerosols within this region are affected by fossil fuel combustion. Chlorine depletion was highly correlated with nss-K+ (r = 0.62) and nss-SO42− (r = 0.73), indicating that aerosols within this area are still affected by anthropogenic activities despite the >100 km distance from continental Asia.
WSTN was highly correlated with nitrogen species (r = 0.72–0.93), with r = 0.72 for WSTN and WSON and r = 0.93 for WSTN and WSIN. By contrast, WSON and WSIN were moderately correlated (r = 0.41). WSIN was highly correlated with NO3 (r = 0.88) and NH4+ (r = 0.96). Except for WSON (r = 0.39), chlorine depletion was well correlated with other nitrogen species (r = 0.57–0.66); this disparity may be a result of the complex sources of WSON. In addition, nss-SO42− was positively correlated with nitrogen species (r = 0.40–0.91), exhibiting a moderate correlation with WSON (r = 0.40) and strong correlation with NH4+ (r = 0.91). Because nss-SO42− is an indicator of fossil fuel combustion, this result was presumably affected by the products of anthropogenic activities, which were transported by the north-east monsoon. The correlation coefficient between nss-Ca2+ and nitrogen species ranged from 0.39 to 0.78, with the highest correlation being between nss-Ca2+ and WSIN (r = 0.78); this indicates that WSIN is related to continental substances. The correlations between nss-K+ and nitrogen species were 0.29–0.84, with the highest correlation being between nss-K+ and NH4+ (r = 0.84), suggesting that biomass combustion was a primary source. According to the correlation analysis of nitrogen species and major ions, the sources of WSON might be more complicated than and differ from those of other nitrogen species.
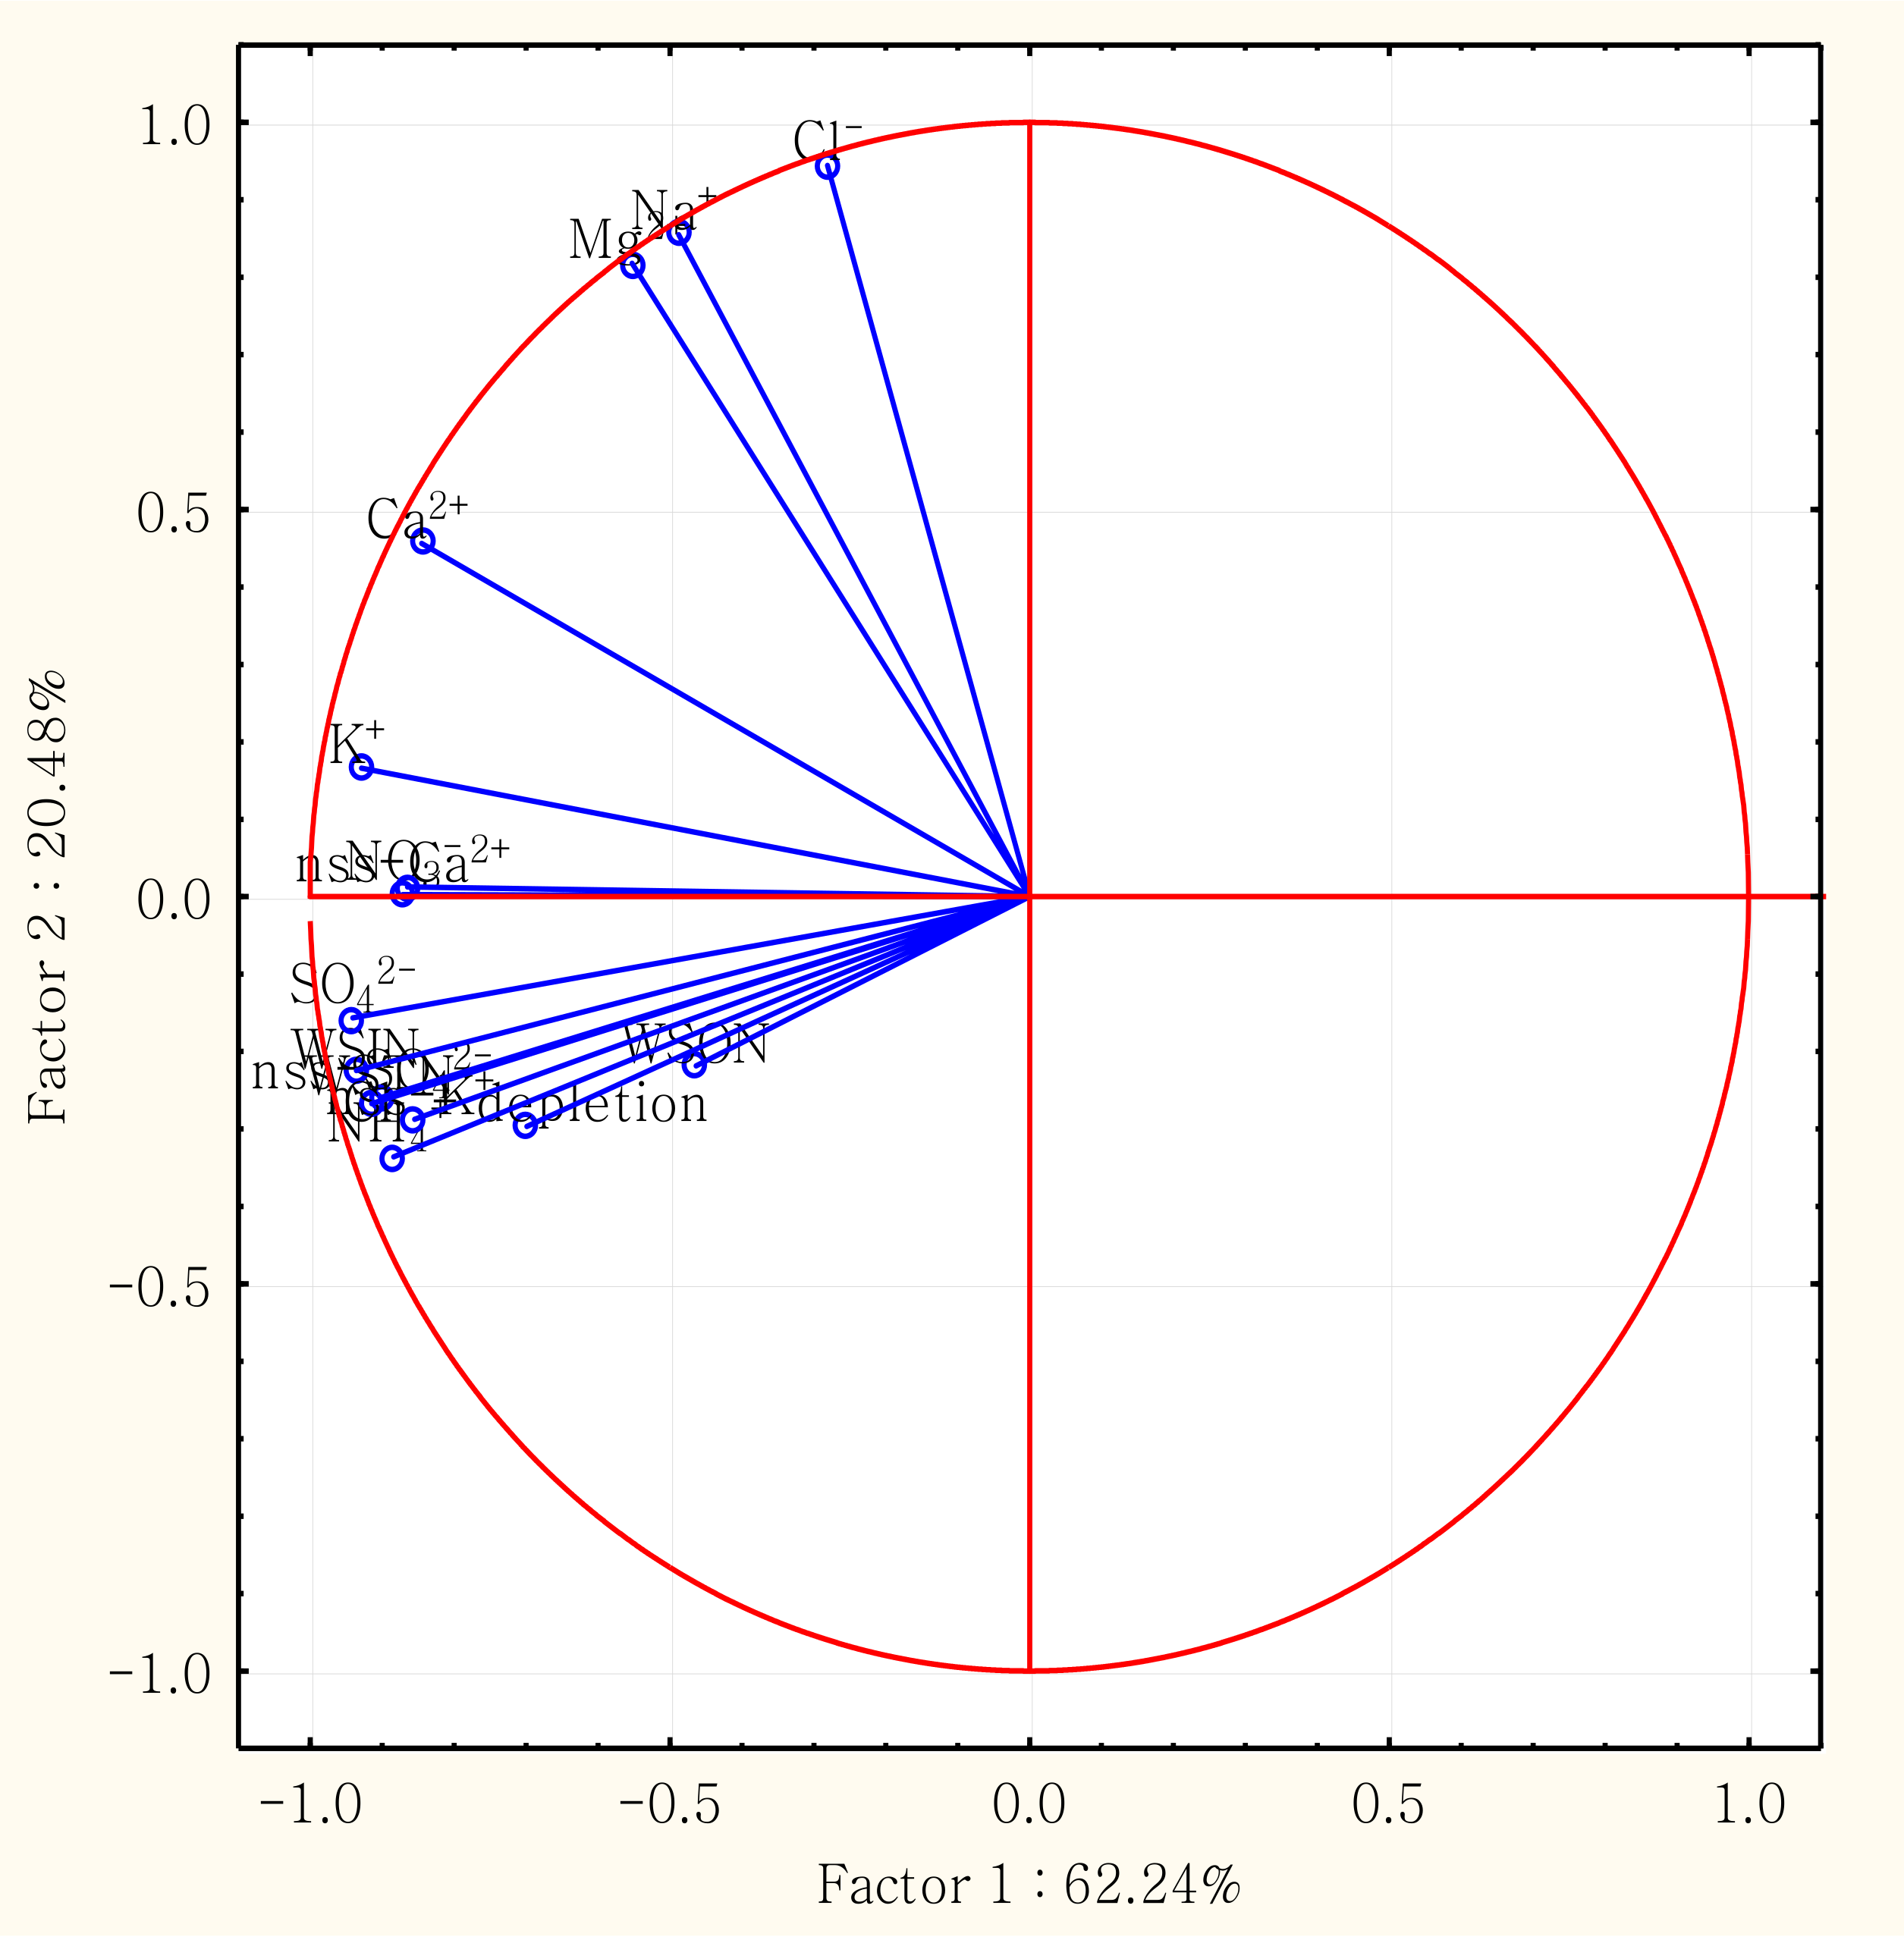
To further understand the source of nitrogen species in aerosols of the region, Statistica version 12 was used to conduct principal component analysis (PCA), the results of which are presented in Table 8. The objective was to distinguish possible sources of TSPs in the northern SCS. Three factors were extracted, and variables with a factor loading >0.8 were considered sufficient to explain the significance of the principal components in this study. The variables in factor 1 consisted of NH4+, NO3, WSIN, SO42−, K+, Ca2+, nss-SO42−, nss-K+, and nss-Ca2+, and the total variance explained was 62.2%. NO3 (−0.87) and nss-SO42− (−0.91) are generally considered products of fossil fuel combustion; nss-K+ (−0.86) is an indicator of biomass combustion; NH4+ (−0.88) originates from fertilizer use and livestock waste [20]; and nss-Ca2+ (−0.87) has crustal sources. Therefore, factor 1 was classified as components of fossil fuel and biomass combustion and crustal sources. The explained variance for factor 2 was 20.5%; the variables contained marine source indicators including the ions Na+ (0.86), Cl (0.94), and Mg2+ (0.82); therefore, factor 2 was classified as marine sources [31]. The partial explained variance for factor 3 was 6.4%, and the only variable was WSON (0.84). The factor loadings for WSON in factors 1 and 2 were −0.46 and −0.22, respectively, indicating that the air mass sources of WSON in aerosols of the SCS were relatively complex [32] and rarely affected by marine or crustal sources. The total explained variance, which was 89.1% (Figure 9), contained factors 1 (continental sources), 2 (marine sources), and 3 (general sources), indicating the complexity of aerosol sources in the SCS. In summary, the results of PCA revealed that continental and anthropogenic aerosols have a considerable effect on the SCS. Understanding the mechanism of WSON formation provides a more comprehensive explanation of the sources and compositions of aerosols.

3.5. Fluxes of Nitrogen Species

To determine the effects of the atmospheric transmission of nitrogen species on the biogeochemistry of the SCS, this study quantified the input of nitrogen species by calculating the dry deposition flux. The formula for flux (F in unit of μmol m−2 d−1) estimation is as follows [47]:
F = Cd × Vd
where Cd denotes the concentration of the water-soluble nitrogen species (mmol m−3) and Vd represents the deposition rate of aerosols (cm s−1).
Hoppel et al. indicated that particle size ranges from 0.1 to 100 μm, and the rate of dry deposition can vary by three orders of magnitude [62]. In general, NH4+ concentrates on particles of size 0.1–1 μm, whereas the majority of NO3 is coarse particles of 1–10 μm [62]. However, any compound or element calculated using a fixed deposition rate may cause underestimation or overestimation of the flux [40]. The samples collected in this study were total suspended particle (TSP), the particle size of which is indistinguishable according to models and experiments with aerosol deposition on ocean surfaces and the size distribution of NO3 and NH4+ in particles [31,62,63,64]. In the present study, the deposition rates of NO3 and NH4+ were taken as 1.2 and 0.1 cm s−1, respectively [65,66]. The flux of WSIN was defined as the sum of the NO3 and NH4+ fluxes.
Lesworth et al. and Srinivas et al. revealed that the particle size distribution of WSON is wide-ranging [67,68]. This is because 1 cm s−1 is similar to the deposition rate of the top layer of the atmospheric boundary layer; thus, obtained WSON flux can represent the top layer of the atmospheric boundary layer [47]. In addition, Chen et al. noted that the ratio of coarse to fine particles (C/F ratio) for WSON is 0.88. The deposition rates of coarse and fine particles (i.e., 2 and 0.1 cm s−1) can be employed to derive the deposition rate (~1 cm s−1) of WSON in TSPs, indicating that this deposition rate is optimal for estimating the dry deposition flux of WSON [32].
During the study period, the average daily flux of WSTN on Dongsha Island (Table 9) was 137 ± 62.1 μmol m−2 d−1, of WSIN was 63.0 ± 34.4 μmol m−2 d−1, and of WSON was 73.5 ± 39.9 μmol m−2 d−1, yielding a ratio of 46:54 as the flux of WSIN to WSON. If the flux was estimated based on its air mass source, WSTN with northern sources reached 167 ± 50.4 μmol m−2 d−1, southern sources reached 79.0 ± 35.5 μmol m−2 d−1, and marine sources reached 73.3 ± 19.1 μmol m−2 d−1. The WSTN flux of the northern air masses was more than two times those of the southern and marine air masses, indicating that the atmospheric WSTN on Dongsha Island originated from terrigenous materials or anthropogenic activities from northern sources, and the flux ratio of northern, southern, and marine sources was approximately 80:18:2.
According to nitrogen flux data obtained globally, the WSIN flux in the pelagic zone is relatively low at 2.6 mmol m−2 y−1 [40] in the Atlantic Ocean; 1.1 mmol m−2 y−1 [69] in the central Pacific Ocean; and 0.8 mmol m−2 y−1 [69] in the southern Pacific Ocean. By contrast, the WSTN flux in marginal areas of the north-western Pacific Ocean can reach up to 21 mmol m−2 y−1 [47]. The fluxes of these oceans were all lower than that of the SCS (50 ± 23 mmol m−2 y−1), which may be because of the effect of the monsoon patterns, which bring large amounts of terrigenous and anthropogenic materials to the SCS.
The WSTN flux in East Asia (Table 10) is relatively high in the Pearl River Delta regions of southern China, such as Dinghu Mountain (104 mmol m−2 y−1) and the Hengmen area (96 mmol m−2 y−1) [70]. Because these locations are inland north of the SCS, they are most directly affected by anthropogenic activities. The WSTN flux in the southern East China Sea was measured at 61 mmol m−2 y−1 [17], whereas that in Singapore, located at the southern end of the SCS, was 54 ± 19 mmol m−2 y−1 [58]. Because these two locations both belong to densely populated areas, they exhibit a higher flux than that recorded in the northern SCS in this study (50 ± 23 mmol m−2 y−1). The decreasing distribution of nitrogen flux in the offshore area in Asia indicates that atmospheric Nr is mainly affected by terrigenous materials and anthropogenic activities.

3.6. Contribution of Atmospheric N Deposition to New Production in the South China Sea (SCS)

Oligotrophic open sea areas constitute the majority of global surface seawater (~75%), accounting for more than 30% of global carbon fixation. These oligotrophic water bodies contribute substantially to the global carbon cycle [71]. The transmission flux of particulate organic carbon acts as a physical and biological pump for carbon dioxide by storing it deep in the ocean; thus, such flux plays a vital role in the transmission of carbon dioxide from the atmosphere to the oceans [72]. The deposition of atmospheric Nr species forms the external nitrogen supply of the SCS. Specifically, the effects of the prevailing north-east monsoon and anthropogenic activities enable atmospheric nitrogen deposition to bring new external production to the marine ecosystem of the SCS.
Yan and Kim used the bioavailability of nitrogen species to estimate the flux of new marine production induced by atmospheric deposition [73], with organic nitrogen accounting for 20%–80% and inorganic nitrogen for 100%. The present study calculated that the Nr species in atmospheric dry deposition can provide seawater with 28.4–44.5 mmol N m−2 y−1 of primary production. A C/N ratio of 6.625 in the Redfield ratio was used for conversion of the new production of the ocean’s external nitrogen supply, which was approximately 0.52–0.81 mmol C m−2 d−1. Li et al. collected deposition particles in sea areas near Dongsha Island using a drifting sediment trap and analyzed the concentration of particulate organic carbon; they calculated the flux to be 9.24 ± 0.89 mmol C m−2 d−1 [74]. Based on this figure, the input of the ocean’s external nitrogen supply contributes 5.6–8.7% of new production to the ocean in the northern SCS. According to examination of the primary air mass source of atmospheric input for the ocean’s external nitrogen supply, new production when air masses were from northern sources was 36.1–54.8 mmol N m−2 y−1 (0.65–0.99 mmol C m−2 d−1), with a contribution of 7.1–10.8%. The new production for southern sources was 13.9–25.1 mmol N m−2 y−1 (0.25–0.46 mmol C m−2 d−1), with a contribution of 2.7–4.9%, and that for marine sources was 12.9–23.3 mmol N m−2 y−1 (0.23–0.42 mmol C m−2 d−1), with a contribution of 2.5–4.6%. The results show that the contribution of northern sources was greater than that of southern and marine sources, with a maximum contribution of approximately 10%. Research in other parts of the world has found that the new production contribution caused by the nitrogen species of atmospheric dry deposition can reach 28% in the north-west Mediterranean [75], 25% in the Bay of Bengal [48], and approximately 8.2% in the southern East China Sea [17].

4. Conclusions

This study estimated the sources of atmospheric nitrogen species and their effects on the nitrogen cycle in the northern SCS. The results indicated that the chemical composition of atmospheric particles in this region is significantly affected by the output from northern continental Asia (mainly in spring and winter). In addition, comparisons between the results of this study and those in the literature indicated that the concentration of water-soluble nitrogen species in East Asia diminishes from north to south, with the highest concentration in northern China. The north and south also exhibited a gap in ratio of organic to total nitrogen; the percentage was <20% for locations north of 30° N and >30% for those south of 30° N. This finding shows that the concentration of organic nitrogen increases from north to south because of the relatively high concentration of inorganic nitrogen in the north. Furthermore, this study determined that the molar ratio NH4+/nss-SO42− is 0.80, demonstrating that NH4+ on Dongsha Island is mainly in the form of NH4HSO4 because anthropogenically derived NH4+ on Dongsha Island does not provide a sufficient amount for nss-SO42− reactions.
Correlation analysis revealed a significant correlation between sea salt ions (Na+, Mg2+, and Cl), and between sea salt ions and wind speed (r = 0.72–0.99), indicating that windblown sea spray is the main source of sea salt ions in the northern SCS. However, the correlation between sea salt ions and nitrogen species was weak (r < 0.50), indicating that marine sources were not the main origin of nitrogen species. The highest correlation coefficient was that between nss-Ca2+ and WSIN (r = 0.78), indicating that the source of WSIN was substances in the continental crust. The correlation between nss-K+ and NH4+ (r = 0.84) was the strongest, indicating that its source was related to biomass combustion. Moderate correlation was observed between nss-SO42− and WSIN (r = 0.73–0.91), implying that its source was fossil fuel combustion. Furthermore, PCA indicated that fossil fuel and biomass combustion and crustal substances were the primary sources of inorganic nitrogen species and NSS ions. In addition, sea salt ions with marine sources accounted for a significant proportion of aerosols in the region. By contrast, the sources of organic nitrogen species were relatively complex.
During the research period, the daily average flux of WSTN in the atmospheric aerosol of the northern SCS was 137 ± 62.1 μmol m−2 d−1, and the flux ratio of WSIN to WSON was approximately 46:54. The atmospheric input of the ocean’s external nitrogen supply to the waters of the region engendered a new production rate of 0.52–0.81 mmol C m−2 d−1 and contributed to 5.6–8.7% of new production in the northern SCS. Northern sources contributed up to 7.1–10.8% of new production, whereas southern and marine sources accounted for 2.7–4.9% and 2.5–4.6%, respectively. This result indicates that the ocean’s external nitrogen supply, provided by anthropogenic aerosols, is vital for the biogeochemical cycle in Asian marginal seas, particularly the northern SCS.

Supplementary Materials

The following are available online at https://www.mdpi.com/2073-4433/9/10/386/s1, Table S1: Daily wind speeds (m/s) and concentrations (nmol m−3) of major ions and non-sea-salt (nss) ions and in TSP samples, and Table S2: Daily concentrations (nmol m−3) of nitrogen species in TSP samples.

Author Contributions

Data curation, S.Z.-H.; Methodology, S.Z.-H.; Writing—original draft, H.-Y.C. and S.Z.-H.; Writing—review and editing, H.-Y.C.

Funding

Ministry of Science and Technology, Taiwan: MOST106-2611-M-019-020

Acknowledgments

The Ministry of Science and Technology of the Republic of China (grant MOST 106-2611-M-019-020) is acknowledged for the financial support. The research was also partly supported by the Center of Excellence for the Oceans, National Taiwan Ocean University. Our special thanks go to Fei-Jan Lin for his help with TSP sampling and to the editor and two anonymous reviewers for their helpful comments and suggestions.

References

  1. Boreddy, S.K.R; Kawamura, K. A 12-year observation of water-soluble ions in TSP aerosols collected at a remote marine location in the western North Pacific: An outflow region of Asian dust. Atmos. Chem. Phys. 2015, 15, 6437–6453. [Google Scholar] [CrossRef]
  2. Arakaki, T.; Azechi, S.; Somada, Y.; Ijyu, M.; Nakaema, F.; Hitomi, Y.; Handa, D.; Oshiro, Y.; Miyagi, Y.; Tsuhako, A.; et al. Spatial and temporal variations of chemicals in the TSP aerosols simultaneously collected at three islands in Okinawa, Japan. Atmos. Environ. 2014, 97, 479–485. [Google Scholar] [CrossRef]
  3. Jickells, T. The role of air-sea exchange in the marine nitrogen cycle. Biogeosciences 2006, 3, 271–280. [Google Scholar] [CrossRef] [Green Version]
  4. Wang, H.; Wang, X.; Yang, X.; Li, W.; Xue, L.; Wang, T.; Chen, J.; Wang, W. Mixed Chloride Aerosols and their Atmospheric Implications: A Review. Aerosol Air Qual. Res. 2017, 17, 878–887. [Google Scholar] [CrossRef] [Green Version]
  5. Kawakami, N.; Osada, K.; Nishita, C.; Yabuki, M.; Kobayashi, H.; Hara, K.; Shiobara, M. Factors controlling sea salt modification and dry deposition of nonsea-salt components to the ocean. J. Geophys. Res. [CrossRef]
  6. Yao, X.; Zhang, L. Chemical processes in sea-salt chloride depletion observed at a Canadian rural coastal site. Atmos. Environ. 2012, 46, 189–194. [Google Scholar] [CrossRef]
  7. Hsu, S.C.; Liu, S.C.; Kao, S.J.; Jeng, W.L.; Huang, Y.T.; Tseng, C.M.; Tsai, F.; Tu, J.Y; Yang, Y. Water-soluble species in the marine aerosol from the northern South China Sea: High chloride depletion related to air pollution. J. Geophys. Res. 2007, 112. [Google Scholar] [CrossRef]
  8. Yao, X.; Fang, M; Chan, C.K. The size dependence of chloride depletion in fine and coarse sea-salt particles. Atmos. Environ. 2003, 37, 743–751. [Google Scholar] [CrossRef]
  9. Galloway, J.N.; Townsend, A.R.; Erisman, J.W.; Bekunda, M.; Cai, Z.; Freney, J.R.; Martinelli, L.A.; Seitzinger, S.P.; Sutton, M.A. Transformation of the Nitrogen Cycle: Recent Trends. Questions, and Potential Solutions. Science 2008, 320, 889–892. [Google Scholar] [CrossRef] [PubMed]
  10. Fowler, D.; Coyle, M.; Skiba, U.; Sutton, M.A.; Cape, J.N.; Reis, S.; Sheppard, L.J.; Jenkins, A.; Grizzetti, B.; Galloway, J.N.; et al. The global nitrogen cycle in the twenty-first century. Philos. Trans. R. Soc. Lond. B Biol. Sci. 2013, 368, 20130164. [Google Scholar] [CrossRef] [PubMed] [Green Version]
  11. Gu, B.; Ju, X.; Chang, J.; Ge, Y.; Vitousek, P.M. Integrated reactive nitrogen budgets and future trends in China. Proc. Natl. Acad. Sci. USA 2015, 112, 8792–8797. [Google Scholar] [CrossRef] [PubMed] [Green Version]
  12. Liu, X.; Zhang, Y.; Han, W.; Tang, A.; Shen, J.; Cui, Z.; Vitousek, P.; Erisman, J.W.; Goulding, K.; Christie, P.; et al. Enhanced nitrogen deposition over China. Nature 2013, 494, 459–462. [Google Scholar] [CrossRef] [PubMed]
  13. Wu, Y.; Gu, B.; Erisman, J.W.; Reis, S.; Fang, Y.; Lu, X.; Zhang, X. PM2.5 pollution is substantially affected by ammonia emissions in China. Environ. Pollut. 2016, 218, 86–94. [Google Scholar] [CrossRef] [PubMed]
  14. Li, L.; Kumar, M.; Zhu, C.; Zhong, J.; Francisco, J.S; Zeng, X.C. Near-Barrierless Ammonium Bisulfate Formation via a Loop-Structure Promoted Proton-Transfer Mechanism on the Surface of Water. J. Am. Chem. Soc. 2016, 138, 1816–1819. [Google Scholar] [CrossRef] [PubMed] [Green Version]
  15. Zhu, L.; Chen, Y.; Guo, L.; Wang, F. Estimate of dry deposition fluxes of nutrients over the East China Sea: The implication of aerosol ammonium to non-sea-salt sulfate ratio to nutrient deposition of coastal oceans. Atmos. Environ. 2013, 69, 131–138. [Google Scholar] [CrossRef]
  16. Duce, R.A.; LaRoche, J.; Altieri, K.; Arrigo, K.R.; Baker, A.R.; Capone, D.G.; Cornell, S.; Dentener, F.; Galloway, J.; Ganeshram, R.S.; et al. Impacts of atmospheric anthropogenic nitrogen on the open ocean. Science 2008, 320, 893–897. [Google Scholar] [CrossRef] [PubMed]
  17. Chen, H.Y.; Chen, L.D.; Chiang, Z.Y.; Hung, C.C.; Lin, F.J.; Chou, W.C.; Gong, G.C; Wen, L.S. Size fractionation and molecular composition of water-soluble inorganic and organic nitrogen in aerosols of a coastal environment. J. Geophys. Res. 2010, 115. [Google Scholar] [CrossRef]
  18. Chen, Y.X.; Chen, H.Y.; Wang, W.; Yeh, J.X.; Chou, W.C.; Gong, G.C.; Tsai, F.J.; Huang, S.J.; Lin, C.T. Dissolved organic nitrogen in wet deposition in a coastal city (Keelung) of the southern East China Sea: Origin. Molecular composition and flux. Atmos. Environ. 2015, 112, 20–31. [Google Scholar] [CrossRef]
  19. Bronk, D.A.; See, J.H.; Bradley, P.; Killberg, L. DON as a source of bioavailable nitrogen for phytoplankton. Biogeosciences 2007, 4, 283–296. [Google Scholar] [CrossRef] [Green Version]
  20. Shi, J.; Gao, H.; Qi, J.; Zhang, J.; Yao, X. Sources, compositions, and distributions of water-soluble organic nitrogen in aerosols over the China Sea. J. Geophys. Res. 2010, 115. [Google Scholar] [CrossRef]
  21. Yang, J.Y.T.; Hsu, S.C.; Dai, M.H.; Hsiao, S.S.Y.; Kao, S.J. Isotopic composition of water-soluble nitrate in bulk atmospheric deposition at Dongsha Island: Sources and implications of external N supply to the northern South China Sea. Biogeosciences 2014, 11, 1833–1846. [Google Scholar] [CrossRef]
  22. Kim, T.W.; Lee, K.; Duce, R.A.; Liss, P. Impact of atmospheric nitrogen deposition on phytoplankton productivity in the South China Sea. Geophys. Res. Lett. 2014, 41, 3156–3162. [Google Scholar] [CrossRef] [Green Version]
  23. Grosse, J.; Bombar, D.; Doan, H.N.; Nguyen, L.N.; Voss, M. The Mekong River plume fuels nitrogen fixation and determines phytoplankton species distribution in the South China Sea during low and high discharge season. Limnol. Oceanogr. 2010, 55, 1668–1680. [Google Scholar] [CrossRef] [Green Version]
  24. Liu, S.M.; Hong, G.H.; Zhang, J.; Ye, X.W.; Jiang, X.L. Nutrient budgets for large Chinese estuaries. Biogeosciences 2009, 6, 2245–2263. [Google Scholar] [CrossRef] [Green Version]
  25. Kim, T.W.; Lee, K.; Lee, C.K.; Jeong, H.D.; Suh, Y.S.; Lim, W.A.; Kim, K.Y; Jeong, H.J. Interannual nutrient dynamics in Korean coastal waters. Harmful Algae 2013, 30, S15–S27. [Google Scholar] [CrossRef]
  26. Mace, K.A. Water-soluble organic nitrogen in Amazon Basin aerosols during the dry (biomass burning) and wet seasons. J. Geophys. Res. 2003, 108. [Google Scholar] [CrossRef]
  27. Pai, S.C.; Tsau, Y.J.; Yang, T.I. pH and buffering capacity problems involved in the determination of ammonia in saline water using the indophenol blue spectrophotometric method. Anal. Chim. Acta 2001, 434, 209–216. [Google Scholar] [CrossRef]
  28. Pai, S.C.; Yang, C.C. Formation kinetics of the pink azo dye in the determination of nitrite in natural waters. Anal. Chim. Acta 1990, 232, 345–349. [Google Scholar] [CrossRef]
  29. Pai, S.C; Riley, J.P. Determination of Nitrate in the Presence of Nitrite in Natural Waters by Flow Injection Analysis with a Non-Quantitative On-Line Cadmium Reductor. Int. J. Environ. Anal. Chem. 1994, 57, 263–277. [Google Scholar] [CrossRef]
  30. Bronk, D.A.; Lomas, M.W.; Glibert, P.M.; Schukert, K.J.; Sanderson, M.P. Total dissolved nitrogen analysis: Comparisons between the persulfate. UV and high temperature oxidation methods. Mar. Chem. 2000, 69, 163–178. [Google Scholar] [CrossRef]
  31. Chen, H.Y; Chen, L.D. Importance of anthropogenic inputs and continental-derived dust for the distribution and flux of water-soluble nitrogen and phosphorus species in aerosol within the atmosphere over the East China Sea. J. Geophys. Res. 2008, 113. [Google Scholar] [CrossRef]
  32. Chen, H.Y.; Chen, L.D. Occurrence of water soluble organic nitrogen in aerosols at a coastal area. J. Atmos. Chem. 2010, 65, 49–71. [Google Scholar] [CrossRef]
  33. Libes, S.M. Introduction to Marine Biogeochemistry, 2nd ed.; Amsterdam Academic Press: Amsterdam, The Netherlands, 2009. [Google Scholar]
  34. Wang, Y.; Zhuang, G.; Zhang, X.; Huang, K.; Xu, C.; Tang, A.; Chen, J.; An, Z. The ion chemistry. Seasonal cycle, and sources of PM2.5 and TSP aerosol in Shanghai. Atmos. Environ. 2006, 40, 2935–2952. [Google Scholar] [CrossRef]
  35. Keene, W.C.; Pszenny, A.A.P.; Galloway, J.N; Hawley, M.E. Sea-salt corrections and interpretation of constituent ratios in marine precipitation. J. Geophys. Res. Atmos. 1986, 91, 6647–6658. [Google Scholar] [CrossRef]
  36. Yeatman, S.G.; Spokes, L.J.; Jickells, T.D. Comparisons of coarse-mode aerosol nitrate and ammonium at two polluted coastal sites. Atmos. Environ. 2001, 35, 1321–1335. [Google Scholar] [CrossRef]
  37. Lawrence, M.G; Lelieveld, J. Atmospheric pollutant outflow from southern Asia: A review. Atmos. Chem. Phys. 2010, 10, 11017–11096. [Google Scholar] [CrossRef]
  38. Xiao, H.W.; Xiao, H.Y.; Luo, L.; Shen, C.Y.; Long, A.M.; Chen, L.; Long, Z.H; Li, D.N. Atmospheric aerosol compositions over the South China Sea: Temporal variability and source apportionment. Atmos. Chem. Phys. 2017, 17, 3199–3214. [Google Scholar] [CrossRef]
  39. Zhang, M.; Chen, J.M.; Wang, T.; Cheng, T.T.; Lin, L.; Bhatia, R.S; Hanvey, M. Chemical characterization of aerosols over the Atlantic Ocean and the Pacific Ocean during two cruises in 2007 and 2008. J. Geophys. Res. 2010, 115. [Google Scholar] [CrossRef]
  40. Baker, A.R.; Lesworth, T.; Adams, C.; Jickells, T.D; Ganzeveld, L. Estimation of atmospheric nutrient inputs to the Atlantic Ocean from 50° N to 50° S based on large-scale field sampling: Fixed nitrogen and dry deposition of phosphorus. Glob. Biogeochem. Cycles 2010, 24, GB3006. [Google Scholar] [CrossRef]
  41. Galloway, J.N.; Dentener, F.J.; Capone, D.G.; Boyer, E.W.; Howarth, R.W.; Seitzinger, S.P.; Asner, G.P.; Cleveland, C.C.; Green, P.A.; Holland, E.A.; et al. Nitrogen Cycles: Past. Present, and Future. Biogeochemistry 2004, 70, 153–226. [Google Scholar] [CrossRef]
  42. Jickells, T.D.; Kelly, S.D.; Baker, A.R.; Biswas, K.; Dennis, P.F.; Spokes, L.J.; Witt, M.; Yeatman, S.G. Isotopic evidence for a marine ammonia source. Geophys. Res. Lett. 2003, 30. [Google Scholar] [CrossRef]
  43. Zhang, R.; Jing, J.; Tao, J.; Hsu, S.C.; Wang, G.; Cao, J.; Lee, C.S.L.; Zhu, L.; Chen, Z.; Zhao, Y.; et al. Chemical characterization and source apportionment of PM 2.5 in Beijing: Seasonal perspective. Atmos. Chem. Phys. 2013, 13, 7053–7074. [Google Scholar] [CrossRef]
  44. Aneja, V.P.; Roelle, P.A.; Murray, G.C.; Southerland, J.; Erisman, J.W.; Fowler, D.; Asman, W.A.H; Patni, N. Atmospheric nitrogen compounds II: Emissions, transport, transformation, deposition and assessment. Atmos. Environ. 2001, 35, 1903–1911. [Google Scholar] [CrossRef]
  45. Pryor, S.C; Sørensen, L.L. Dry deposition of reactive nitrogen to marine environments: Recent advances and remaining uncertainties. Mar. Pollut. Bull. 2002, 44, 1336–1340. [Google Scholar] [CrossRef]
  46. Luo, L.; Kao, S.J.; Bao, H.; Xiao, H.; Xiao, H.; Yao, X.; Gao, H.; Li, J.; Li, Y. Sources of reactive nitrogen in marine aerosol over the Northwest Pacific Ocean in spring. Atmos. Chem. Phys. Discuss. 2017, 1–30. [Google Scholar] [CrossRef] [Green Version]
  47. Luo, L.; Yao, X.H.; Gao, H.W.; Hsu, S.C.; Li, J.W; Kao, S.J. Nitrogen speciation in various types of aerosols in spring over the northwestern Pacific Ocean. Atmospheric Chem. Phys. 2016, 16, 325–341. [Google Scholar] [CrossRef]
  48. Srinivas, B.; Sarin, M.M.; Sarma, V.V.S.S. Atmospheric dry deposition of inorganic and organic nitrogen to the Bay of Bengal: Impact of continental outflow. Mar. Chem. 2011, 127, 170–179. [Google Scholar] [CrossRef]
  49. Zamora, L.M.; Prospero, J.M; Hansell, D.A. Organic nitrogen in aerosols and precipitation at Barbados and Miami: Implications regarding sources, transport and deposition to the western subtropical North Atlantic. J. Geophys. Res. 2011, 116. [Google Scholar] [CrossRef]
  50. Nehir, M.; Koçak, M. Atmospheric Water-Soluble Organic Nitrogen (WSON) in the Eastern Mediterranean: Origin and Ramifications Regarding Marine Productivity. Atmos. Chem. Phys. Discuss. [CrossRef]
  51. Chen, Y.; Mills, S.; Street, J.; Golan, D.; Post, A.; Jacobson, M.; Paytan, A. Estimates of atmospheric dry deposition and associated input of nutrients to Gulf of Aqaba seawater. J. Geophys. Res. 2007, 112. [Google Scholar] [CrossRef]
  52. Martino, M.; Hamilton, D.; Baker, A.R.; Jickells, T.D.; Bromley, T.; Nojiri, Y.; Quack, B.; Boyd, P.W. Western Pacific atmospheric nutrient deposition fluxes. their impact on surface ocean productivity. Glob. Biogeochem. Cycles 2014, 28, 712–728. [Google Scholar] [CrossRef]
  53. Matsumoto, K.; Yamamoto, Y.; Nishizawa, K.; Kaneyasu, N.; Irino, T.; Yoshikawa-Inoue, H. Origin of the water-soluble organic nitrogen in the maritime aerosol. Atmos. Environ. 2017, 167, 97–103. [Google Scholar] [CrossRef]
  54. Zhang, Q.; Duan, F.; He, K.; Ma, Y.; Li, H.; Kimoto, T.; Zheng, A. Organic nitrogen in PM 2.5 in Beijing. Front. Environ. Sci. Eng. 2015, 9, 1004–1014. [Google Scholar] [CrossRef]
  55. Ho, K.F.; Ho, S.S.H.; Huang, R.J.; Liu, S.X.; Cao, J.J.; Zhang, T.; Chuang, H.C.; Chan, C.S.; Hu, D.; Tian, L. Characteristics of water-soluble organic nitrogen in fine particulate matter in the continental area of China. Atmos. Environ. 2015, 106, 252–261. [Google Scholar] [CrossRef]
  56. Wu, Y.; Zhang, J.; Liu, S.; Jiang, Y.; Huang, X. Aerosol concentrations and atmospheric dry deposition fluxes of nutrients over Daya Bay. South China Sea. Mar. Pollut. Bull. 2018, 128, 106–114. [Google Scholar] [CrossRef] [PubMed]
  57. Yu, X.; Yu, Q.; Zhu, M.; Tang, M.; Li, S.; Yang, W.; Zhang, Y.; Deng, W.; Li, G.; Yu, Y.; et al. Water Soluble Organic Nitrogen (WSON) in Ambient Fine Particles Over a Megacity in South China: Spatiotemporal Variations and Source Apportionment. J. Geophys. Res. Atmos. 2017, 122, 13045–13060. [Google Scholar] [CrossRef]
  58. Karthikeyan, S.; He, J.; Palani, S.; Balasubramanian, R.; Burger, D. Determination of total nitrogen in atmospheric wet and dry deposition samples. Talanta 2009, 77, 979–984. [Google Scholar] [CrossRef] [PubMed]
  59. Kang, C.H.; Kim, W.H.; Ko, H.J.; Hong, S.B. Asian Dust effects on Total Suspended Particulate (TSP) compositions at Gosan in Jeju Island. Korea. Atmos. Res. 2009, 94, 345–355. [Google Scholar] [CrossRef]
  60. Jickells, T.; Baker, A.R.; Cape, J.N.; Cornell, S.E; Nemitz, E. The cycling of organic nitrogen through the atmosphere. Philos. Trans. R. Soc. Lond. B Biol. Sci. 2013, 368, 20130115. [Google Scholar] [CrossRef] [PubMed]
  61. Kanakidou, M.; Duce, R.A.; Prospero, J.M.; Baker, A.R.; Benitez-Nelson, C.; Dentener, F.J.; Hunter, K.A.; Liss, P.S.; Mahowald, N.; Okin, G.S.; et al. Atmospheric fluxes of organic N and P to the global ocean. Glob. Biogeochem. Cycles 2012, 26. [Google Scholar] [CrossRef] [Green Version]
  62. Hoppel, W.A. Surface source function for sea-salt aerosol and aerosol dry deposition to the ocean surface. J. Geophys. Res. 2002, 107. [Google Scholar] [CrossRef]
  63. Hsu, C.A.; Lee, C.S.L.; Huh, C.A.; Shaheen, R.; Lin, F.J.; Liu, S.C.; Liang, M.C.; Tao, J. Ammonium deficiency caused by heterogeneous reactions during a super Asian dust episode. J. Geophys. Res. 2014, 119. [Google Scholar] [CrossRef]
  64. Duce, R.A.; Galloway, J.N.; Liss, P.S. The impacts of atmospheric deposition to the ocean on marine ecosystems and climate. WMO Bull. 2009, 58, 61–66. [Google Scholar]
  65. Nakamura, T.; Matsumoto, K.; Uematsu, M. Chemical characteristics of aerosols transported from Asia to the East China Sea: An evaluation of anthropogenic combined nitrogen deposition in autumn. Atmos. Environ. 2005. [Google Scholar] [CrossRef]
  66. Jung, J.; Furutani, H.; Uematsu, M.; Kim, S.; Yoon, S. Atmospheric inorganic nitrogen input via dry. wet, and sea fog deposition to the subarctic western North Pacific Ocean. Atmos. Chem. Phys. 2013, 13, 411–428. [Google Scholar] [CrossRef]
  67. Lesworth, T.; Baker, A.R; Jickells, T. Aerosol organic nitrogen over the remote Atlantic Ocean. Atmos. Environ. 2010, 44, 1887–1893. [Google Scholar] [CrossRef]
  68. Srinivas, B.; Sarin, M.M. Atmospheric deposition of N, P and Fe to the Northern Indian Ocean: Implications to C- and N-fixation. Sci. Total Environ. [CrossRef]
  69. Jung, J.; Furutani, H.; Uematsu, M. Atmospheric inorganic nitrogen in marine aerosol and precipitation and its deposition to the North and South Pacific Oceans. J. Atmos. Chem. 2011, 68, 157–181. [Google Scholar] [CrossRef]
  70. Wang, X.; Wu, Z.; Shao, M.; Fang, Y.; Zhang, L.; Chen, F.; Chan, P.-w.; Fan, Q.; Wang, Q.; Zhu, S.; et al. Atmospheric nitrogen deposition to forest and estuary environments in the Pearl River Delta region. southern China. Tellus B Chem. Phys. Meteorol. 2013, 65, 20480. [Google Scholar] [CrossRef]
  71. Shih, Y.Y.; Hung, C.C.; Gong, G.C.; Chung, W.C.; Wang, Y.H.; Lee, I.H.; Chen, K.S; Ho, C.Y. Enhanced Particulate Organic Carbon Export at Eddy Edges in the Oligotrophic Western North Pacific Ocean. PLoS ONE 2015, 10, e0131538. [Google Scholar] [CrossRef] [PubMed]
  72. Hung, C.C; Gong, G. CPOC/234Th ratios in particles collected in sediment traps in the northern South China Sea. Estuar. Coast. Shelf Sci. 2010, 88, 303–310. [Google Scholar] [CrossRef]
  73. Yan, G.; Kim, G. Sources and fluxes of organic nitrogen in precipitation over the southern East Sea/Sea of Japan. Atmos. Chem. Phys. 2015, 15, 2761–2774. [Google Scholar] [CrossRef] [Green Version]
  74. Li, D.; Chou, W.C.; Shih, Y.Y.; Chen, G.Y.; Chang, Y.; Chow, C.H.; Lin, T.Y; Hung, C.C. Elevated particulate organic carbon export flux induced by internal waves in the oligotrophic northern South China Sea. Sci. Rep. 2018, 8, 2042. [Google Scholar] [CrossRef] [PubMed]
  75. Sandroni, V.; Raimbault, P.; Migon, C.; Raimbault, P.; Migon, C.; Garcia, N.; Gouze, E. Dry atmospheric deposition and diazotrophy as sources of new nitrogen to northwestern Mediterranean oligotrophic surface waters. Deep Sea Res. Part I Oceanogr. Res. Pap. 2007, 54, 1859–1870. [Google Scholar] [CrossRef]
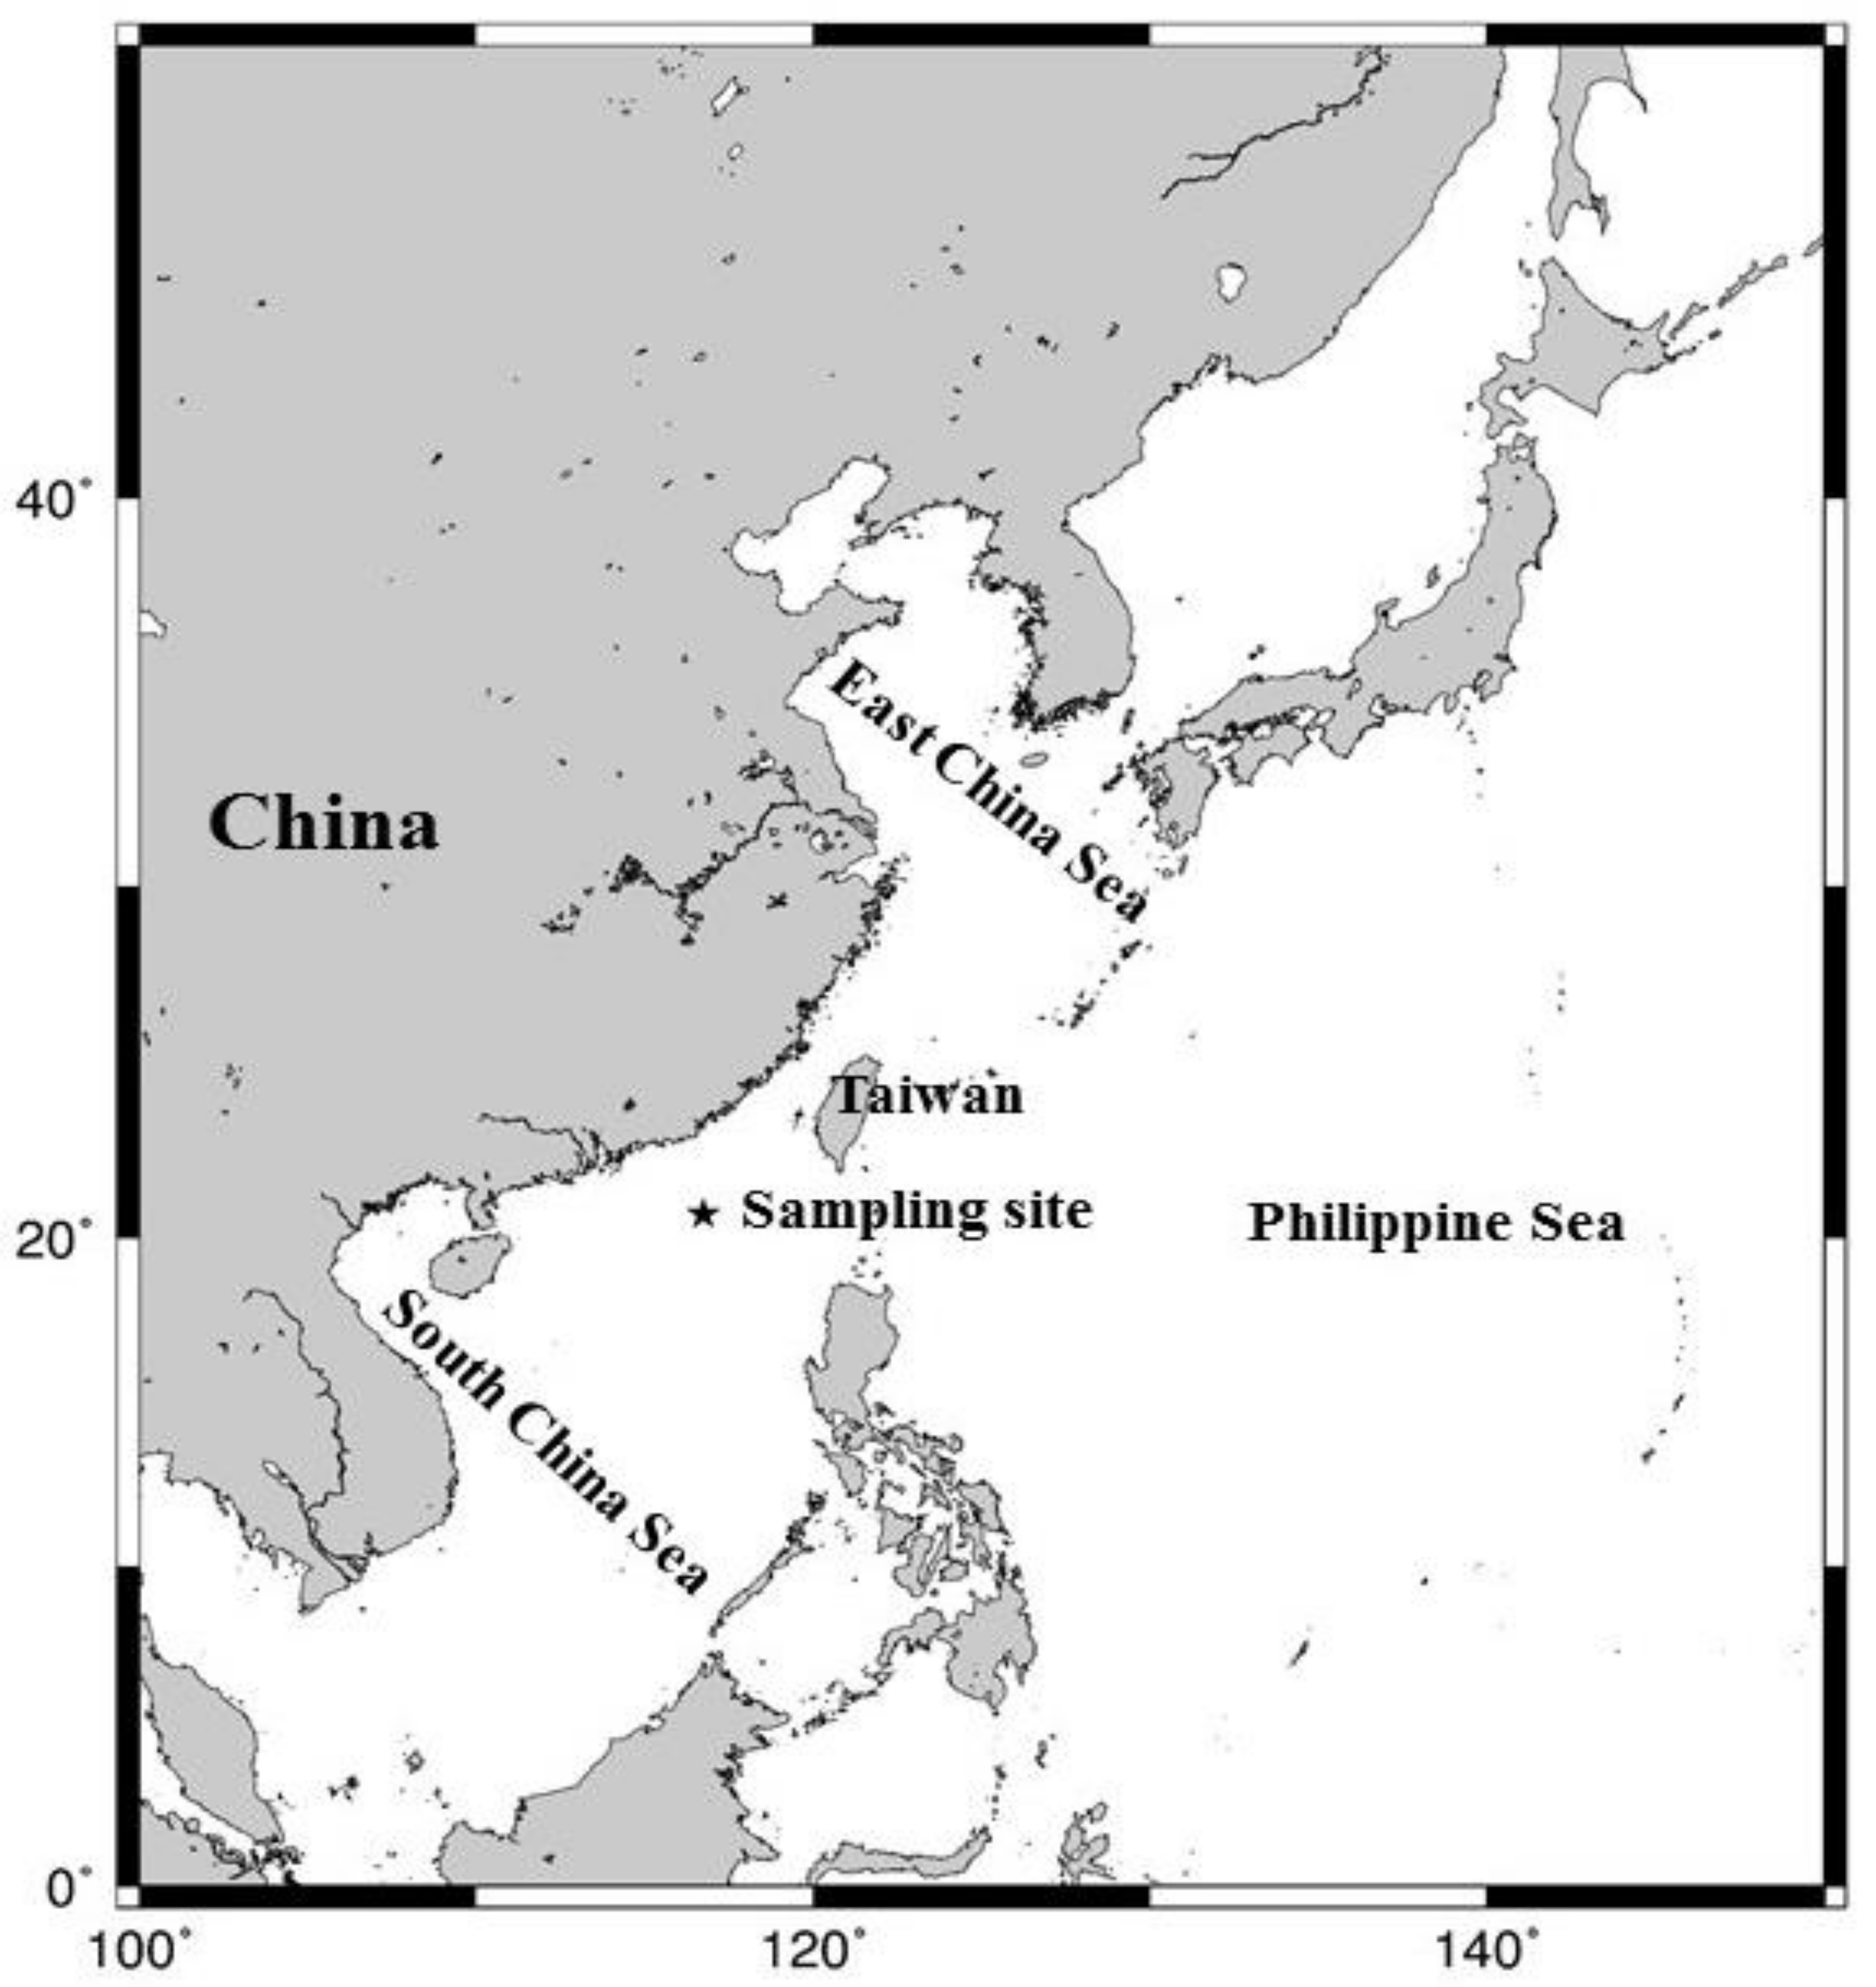
Figure 1. The location of the sampling site.
Atmosphere 09 00386 g001
Figure 2. Variations in the monthly average concentrations of sea-salt ions.
Atmosphere 09 00386 g002
Figure 3. Linear regression diagrams of (a) Cl and (b) Mg2+ vs. Na+.
Atmosphere 09 00386 g003aAtmosphere 09 00386 g003b
Figure 4. Variations in the monthly average concentrations of non-sea-salt ions.
Atmosphere 09 00386 g004
Figure 5. Concentrations of NH4+ versus nss-SO42− in aerosols; the solid line represents equi-concentration line for NH4+ and nss-SO42−.
Atmosphere 09 00386 g005
Figure 6. Variations in the monthly average concentrations of NH4+ and NO3.
Atmosphere 09 00386 g006
Figure 7. Variations in the monthly average concentrations of WSIN, WSON and WSTN.
Atmosphere 09 00386 g007
Figure 8. Comparison of WSIN and WSON in aerosols between Dongsha Island and around East Asia.
Atmosphere 09 00386 g008
Figure 9. Projection of the variables on the factor plane 1 × 2 of the principal component analysis (PCA).
Atmosphere 09 00386 g009
Table 1. Recovery of organic nitrogen species using ultraviolet (UV) + persulfate oxidizing (PO) methods.
Recovery (%)
This Study Chen et al. [18]Bronk et al. [30]
(n = 10)(n = 8)(n = 5)
Antipyrine 68 ± 6
EDTA99 ± 592 ± 394 ± 2
Quinoline92 ± 1594 ± 4
Urea102 ± 794 ± 592 ± 9
Table 2. Blank values and limit of detection (LOD) for water-soluble nutrients and ions.
Blank (nmol m−3)LOD a (nmol m−3)
NH4+0.09 ± 0.010.03
NO20.005 ± 0.0020.005
NO30.08 ± 0.030.08
Na+0.03 ± 0.010.03
K+0.005 ± 0.0020.005
Mg2+0.010 ± 0.0030.009
Ca2+0.07 ± 0.020.06
Cl0.31 ± 0.090.26
SO42−0.12 ± 0.040.12
a Calculated using 3σ of the blank.
Table 3. Seasonal statistics of air mass back trajectories (AMBTs).
North (n = 157)South (n = 75)Sea (n = 8)
Spring82%15%3%
Summer0%90%10%
Autumn83%17%0%
Winter97%3%0%
Table 4. Monthly average wind speeds (m/s) and concentrations (nmol m−3) of major ions and non-sea-salt (NSS) ions in total suspended particle (TSP) samples *.
Wind SpeedsNa+Mg2+Clnss-SO42−nss-K+nss-Ca2+
April 20075.1 ± 1.3343 ± 10236.0 ± 11.1281 ± 106122 ± 85.45.45 ± 5.418.44 ± 3.74
May 20073.6 ± 0.8211 ± 90.424.5 ± 11.4181 ± 75.2131 ± 98.07.31 ± 5.7010.7 ± 5.34
June 20073.0 ± 0.9123 ± 57.312.2 ± 6.35136 ± 57.418.5 ± 6.251.05 ± 0.472.70 ± 0.75
July 20073.3 ± 0.7123 ± 73.212.2 ± 7.69134 ± 76.325.0 ± 6.291.77 ± 0.604.34 ± 1.49
August 20073.8 ± 1.7229 ± 19324.5 ± 21.8254 ± 19923.2 ± 17.62.13 ± 1.553.68 ± 1.18
September 20073.6 ± 1.6201 ± 16224.0 ± 18.3170 ± 148155 ± 15513.4 ± 14.69.12 ± 7.75
October 20076.3 ± 1.3414 ± 14847.7 ± 16.6356 ± 150140 ± 76.17.93 ± 7.429.21 ± 3.78
November 20078.9 ± 1.4570 ± 17363.4 ± 17.0478 ± 155136 ± 37.19.69 ± 3.1613.1 ± 2.72
December 20076.6 ± 1.8344 ± 96.235.2 ± 12.0235 ± 74.9170 ± 73.412.3 ± 5.9711.7 ± 6.67
January 20086.4 ± 2.5381 ± 10536.6 ± 11.8317 ± 11383.2 ± 45.83.88 ± 3.806.38 ± 4.82
February 20087.5 ± 1.1330 ± 10136.2 ± 10.2232 ± 109203 ± 45.114.9 ± 6.369.59 ± 4.59
March 20085.3 ± 1.3295 ± 94.734.0 ± 8.12201 ± 91.5160 ± 52.111.3 ± 5.3012.2 ± 5.19
April 20083.5 ± 1.3205 ± 10821.3 ± 11.9156 ± 78.390.7 ± 29.75.66 ± 2.148.36 ± 3.19
May 20083.6 ± 2.0220 ± 16924.3 ± 18.6158 ± 116116 ± 66.66.85 ± 2.929.56 ± 4.31
June 20083.5 ± 0.9173 ± 94.216.2 ± 8.97182 ± 11417.6 ± 7.541.84 ± 0.605.00 ± 1.73
July 20082.9 ± 1.1146 ± 75.213.9 ± 7.31145 ± 81.717.3 ± 8.152.70 ± 0.614.24 ± 1.50
August 20082.5 ± 0.9102 ± 65.99.46 ± 7.22101 ± 76.423.6 ± 12.32.34 ± 1.104.67 ± 0.89
September 20083.4 ± 1.9149 ± 16915.7 ± 18.4128 ± 187126 ± 1307.45 ± 6.799.57 ± 4.65
October 20086.3 ± 2.3288 ± 82.130.4 ± 10.0242 ± 82.8111 ± 65.17.38 ± 5.989.20 ± 3.49
November 20087.5 ± 1.6393 ± 96.441.3 ± 11.2345 ± 10766.8 ± 1095.45 ± 4.146.87 ± 2.18
December 20087.8 ± 1.6458 ± 10450.1 ± 10.9396 ± 137109 ± 73.011.5 ± 7.8013.1 ± 4.99
January 20098.0 ± 2.0393 ± 14542.8 ± 15.5342 ± 13476.1 ± 27.58.98 ± 4.608.64 ± 2.96
February 20095.4 ± 2.6309 ± 15134.4 ± 16.7291 ± 16658.9 ± 25.24.73 ± 1.917.19 ± 1.26
March 20096.7 ± 1.7333 ± 10438.4 ± 11.9306 ± 85.569.7 ± 15.84.75 ± 1.4610.6 ± 3.40
Average5.2 ± 2.4280 ± 16530.2 ± 18.4240 ± 14993.8 ± 80.66.70 ± 6.338.26 ± 4.73
* The daily wind speeds and concentrations of major ions and non-sea-salt (nss) ions can be found in Supplementary 1.
Table 5. Monthly average concentrations (nmol m−3) of the nitrogen species in TSP samples *.
NH4+NO3WSIN #WSON #WSTN #
April 200766.1 ± 45.341.4 ± 12.2104 ± 54.2137 ± 32.6240 ± 80.7
May 2007115 ± 95.048.0 ± 32.0156 ± 116115 ± 86.5271 ± 197
June 200719.1 ± 9.3218.5 ± 7.2638.2 ± 15.240.7 ± 15.278.9 ± 25.6
July 200721.4 ± 5.8627.6 ± 7.1849.4 ± 9.3240.7 ± 22.090.1 ± 20.0
August 200727.6 ± 33.918.1 ± 8.3046.0 ± 40.550.4 ± 28.196.4 ± 68.2
September 2007155 ± 14577.7 ± 37.6201 ± 15563.8 ± 18.9265 ± 170
October 2007118 ± 61.581.6 ± 13.6201 ± 66.742.1 ± 24.6243 ± 69.0
November 2007107 ± 26.970.5 ± 13.8178 ± 37.554.2 ± 22.5232 ± 46.7
December 2007130 ± 55.374.1 ± 18.8205 ± 69.057.5 ± 14.4263 ± 78.4
January 200877.1 ± 29.165.8 ± 20.3144 ± 43.665.4 ± 16.4209 ± 50.6
February 2008127 ± 47.770.9 ± 26.3202 ± 75.6101 ± 32.7303 ± 101
March 2008110 ± 48.981.4 ± 20.7205 ± 82.2159 ± 34.9363 ± 110
April 200852.0 ± 31.662.8 ± 21.2121 ± 46.0126 ± 23.1247 ± 59.3
May 2008110 ± 51.852.2 ± 22.6162 ± 72.8127 ± 52.3290 ± 109
June 200820.6 ± 11.424.6 ± 8.4945.5 ± 17.663.8 ± 24.8109 ± 36.5
July 200816.0 ± 3.3722.3 ± 6.4439.0 ± 7.0761.6 ± 23.0101 ± 27.8
August 200822.8 ± 19.522.2 ± 8.6045.5 ± 25.054.7 ± 19.9100 ± 43.2
September 2008117 ± 10756.6 ± 30.1170 ± 11783.2 ± 36.0254 ± 129
October 2008101 ± 64.659.8 ± 26.6161 ± 89.4104 ± 31.4266 ± 113
November 200864.8 ± 47.562.5 ± 19.2133 ± 61.8112 ± 40.0246 ± 91.2
December 200898.9 ± 63.679.6 ± 25.4179 ± 84.377.4 ± 27.4256 ± 101
January 200962.9 ± 34.276.8 ± 11.9143 ± 51.777.4 ± 27.0220 ± 42.7
February 200973.2 ± 28.349.5 ± 21.1123 ± 46.2100 ± 28.6224 ± 73.8
March 200968.6 ± 29.757.8 ± 18.2127 ± 42.8126 ± 29.7253 ± 50.2
Average78.4 ± 67.254.3 ± 28.7132 ± 87.985.0 ± 46.1217 ± 115
# WSIN, WSON and WSTN represent water-soluble inorganic nitrogen, organic nitrogen (WSON) and total nitrogen (WSTN), respectively. * The daily concentrations of the nitrogen species can be found in Supplementary 2.
Table 6. Nitrogen species concentration in atmospheric suspended particle from different sites around the world.
Sampling PeriodsLocationStation TypeWSINWSONWSTNReference
nmol m−3%nmol m−3%nmol m−3
May 2007–July 2009Miaimi, USACoastal city51 ± 2696 ± 692.4 ± 3.14 ± 653 ± 26[49]
August–September 2007 & 2008Barbados, Atlantic OceanIsland20 ± 8.894 ± 571.3 ± 1.56 ± 721 ± 8.9[49]
March 2014–April 2015Erdemli, TurkeyCoastal city40 ± 2863 ± 5424 ± 1637 ± 3264 ± 33[50]
August 2003–September 2005Eilat, IsraelCoastal city65 ± 2489 ± 478 ± 511 ± 873 ± 28[51]
March–April 2006northern Indian OceanMarginal sea4781111958[48]
May 2007–Oct 2009western Pacific OceanOpen ocean11 ± 4.8 72 ± 394.3 ± 1.728 ± 1515 ± 5.1[52]
March–April 2014northwestern Pacific OceanOpen ocean80 ± 5588 ± 8011 ± 712 ± 1191 ± 55[47]
April 2010–November 2012Rishiri Island, JapanIsland35 ± 1186 ± 375.5 ± 4.114 ± 1141 ± 12[53]
March–April 2006Qindao, ChinaCoastal city7838118019963[20]
January–July 2013Beijing, ChinaInland city7587920421962[54]
July 2008–August 2009Xian, ChinaInland city377 ± 34956 ± 71300 ± 26344 ± 55677 ± 594[55]
March–May 2015East China SeaMarginal sea2196810232321[46]
January–December 2006Keelung, TaiwanCoastal city213 ± 8174 ± 3876 ± 2826 ± 13289 ± 102[17]
September 2015–March 2017Daya Bay, ChinaCoastal city19 ± 1836 ± 4033 ± 2263 ± 5652 ± 29[56]
August 2013–May 2014Guangzhou, ChinaCoastal city260 ± 18086 ± 8143 ± 3214 ± 11303 ± 196[57]
April–May 2005South China SeaMarginal sea131676533196[20]
March–April 2007SingaporeCoastal city98 ± 3570 ± 3543 ± 2730 ± 22141 ± 50[58]
April 2007–March 2009Dongsha, TaiwanIsland132 ± 8863 ± 5379 ± 4237 ± 27211 ± 112This study
Table 7. Correlation matrix of the species in TSP samples.
NO3NH4+WSINWSONWSTNNa+Mg2+ClK+Ca2+SO42−nss-K+nss-Ca2+nss-SO42−Cl DepletionWind Speed
NO31
NH4+0.77 **1
WSIN0.88 **0.96 **1
WSON0.39 **0.35 **0.41 **1
WSTN0.83 **0.88 **0.93 **0.72 **1
Na+0.42 **0.14 **0.26 **0.07 0.23 **1
Mg2+0.47 **0.21 **0.33 **0.11 0.30 **0.99 **1
Cl0.25 **−0.05 0.06 −0.030.04 0.94 **0.92 **1
K+0.76 **0.76 **0.81 **0.27 **0.73 **0.59 **0.64 **0.41 **1
Ca2+0.70 **0.58 **0.67 **0.30 **0.63 **0.77 **0.82 **0.65 **0.85 **1
SO42−0.76 **0.90 **0.90 **0.40 **0.84 **0.34 **0.40 **0.12 0.86 **0.70 **1
nss-K+0.69 **0.84 **0.84 **0.29 **0.76 **0.14 **0.21 **−0.04 0.89 **0.59 **0.85 **1
nss-Ca2+0.71 **0.74 **0.78 **0.39 **0.75 **0.37 **0.44 **0.22 **0.79 **0.87 **0.76 **0.76 **1
nss-SO42−0.73 **0.91 **0.90 **0.40 **0.85 **0.23 **0.29 **0.01 0.81 **0.63 **0.99 **0.86 **0.75 **1
Cl depletion0.57 **0.64 **0.66 **0.39 **0.66 **0.17 **0.20 **−0.12 0.59 **0.42 **0.72 **0.62 **0.49 **0.73 **1
Wind speed0.53 **0.25 **0.39 **0.11 0.34 **0.82 **0.82 **0.72 **0.62 **0.71 **0.41 **0.29 **0.41 **0.33 **0.24 **1
** Correlation is significant at the 0.01 level (2-tailed); * Correlation is significant at the 0.05 level (2-tailed).
Table 8. Varimax-rotated factor matrix and corresponding probable sources of the northern South China Sea aerosols.
Factor 1Factor 2Factor 3
NH4+−0.884−0.3360.139
NO3−0.8710.0030.048
WSIN−0.936−0.224−0.047
WSON−0.464−0.2180.840
WSTN−0.903−0.2600.301
Cl−0.2810.9440.050
Na+−0.4880.8550.044
Mg2+−0.5530.8180.049
SO42−−0.941−0.157−0.102
K+−0.9290.1660.193
Ca2+−0.8450.4560.003
nss-SO42−−0.915−0.267−0.111
nss-K+−0.855−0.2870.261
nss-Ca2+−0.8650.013−0.030
Cl depletion %−0.699−0.2970.037
Eigenvalue9.3363.0720.957
% Total variance62.2420.486.38
Cumulative %62.2482.7289.10
Probable sourceCombustion, Biomass burning and crustal sourcesMarine sourceCombined sources
Table 9. Daily average fluxes (μmol m−2 day−1) of the nitrogen species in TSP samples.
WSTNWSONWSIN
April 2007167 ± 36.9118 ± 28.248.7 ± 16.1
May 2007159 ± 11099.4 ± 74.859.7 ± 40.4
June 200756.0 ± 18.335.2 ± 13.120.9 ± 8.10
July 200765.6 ± 14.535.2 ± 19.030.4 ± 7.46
August 200764.7 ± 34.943.5 ± 24.321.2 ± 11.0
September 2007149 ± 63.255.2 ± 16.494.0 ± 50.4
October 2007131 ± 24.236.3 ± 21.394.8 ± 16.5
November 2007129 ± 29.246.8 ± 19.482.3 ± 15.9
December 2007138 ± 31.849.7 ± 12.588.1 ± 22.8
January 2008131 ± 28.056.5 ± 14.274.9 ± 22.5
February 2008172 ± 52.087.6 ± 28.284.5 ± 30.8
March 2008231 ± 48.7137 ± 30.293.9 ± 25.2
April 2008179 ± 36.9109 ± 20.069.6 ± 24.1
May 2008174 ± 65.3110 ± 45.263.6 ± 27.6
June 200882.5 ± 28.755.1 ± 21.427.3 ± 9.40
July 200877.8 ± 24.253.2 ± 19.924.5 ± 6.66
August 200872.2 ± 26.147.2 ± 17.225.0 ± 9.80
September 2008141 ± 58.271.9 ± 31.168.8 ± 39.1
October 2008161 ± 56.090.1 ± 27.170.8 ± 32.7
November 2008168 ± 54.197.2 ± 34.670.4 ± 23.6
December 2008158 ± 49.166.8 ± 23.791.0 ± 30.7
January 2009152 ± 20.866.8 ± 23.385.0 ± 14.7
February 2009144 ± 47.886.8 ± 24.757.6 ± 23.7
March 2009174 ± 37.3109 ± 25.765.9 ± 20.4
Average137 ± 62.173.5 ± 39.963.0 ± 34.4
Table 10. Nitrogen species fluxes (mmol m−2 yr−1) in dry deposition from different site around the East Asia.
Sampling PeriodsLocationStation TypeNO3NH4+WSINWSONWSTNReference
March–April 2014North-western Pacific OceanOpen ocean16 ± 201.7 ± 1.418 ± 202.8 ± 2.421 ± 22[47]
March–May 2015North-western Pacific OceanOpen ocean8.00.58.54.012.5[46]
April 2010–March 2011Huaniao, ChinaIsland374.3541.35 [15]
January–December 2007Dinghushan, ChinaCoastal city26527826104[70]
November 2006–October 2007Hengmen, ChinaCoastal city2739663096[70]
September 2015–March 2017Daya Bay, ChinaCoastal city8.460.939.4416.3325.7756]
January–December 2006Keelung, TaiwanCoastal city5.6 ± 1.434 ± 1539 ± 1722 ± 961 ± 19[17]
July 2010–March 2011Dongsha, TaiwanIsland16 ± 147 ± 523 ± 15 [21]
April 2007–March 2009Dongsha, TaiwanIsland21 ± 112.5 ± 2.123 ± 1327 ± 1550 ± 23This study
March–April 2007SingaporeCoastal city18 ± 5.710 ± 6.428 ± 8.616 ± 1054 ± 19[58]