Article

Large-Scale Modeling of Absorbing Aerosols and Their Semi-Direct Effects

Leibniz Institute for Tropospheric Research, 04318 Leipzig, Germany
*
Author to whom correspondence should be addressed.
Atmosphere 2018, 9(10), 380; https://doi.org/10.3390/atmos9100380
Submission received: 19 July 2018 / Revised: 22 September 2018 / Accepted: 24 September 2018 / Published: 28 September 2018
(This article belongs to the Special Issue Radiative Transfer in the Earth Atmosphere)

Abstract

:
Radiative effects of absorbing black carbon and mineral dust aerosols are estimated from global aerosol climate model simulations with fixed sea surface temperatures as a boundary condition. Semi-direct effects are approximated as the residual between the total direct radiative effect and the instantaneous direct radiative effect of the simulated absorbing aerosol species. No distinction is made for aerosols from natural and anthropogenic sources. Results for global average are highly uncertain due to high model variability, but consistent with previous estimates. The global average results for black carbon aerosol semi-direct effects are small due to cancellation of regionally positive or negative effects, and may be positive or negative overall, depending on the model setup. The presence of mineral dust aerosol above dark surfaces and below a layer containing black carbon aerosol may enhance the reflectivity and act to enhance the positive radiative effect of black carbon aerosol. When mineral dust is absent the semi-direct effect at the top-of-atmosphere of black carbon aerosol from both anthropogenic and natural sources is −0.03 Wm−2, while averaging to +0.09 Wm−2 if dust is included.

1. Introduction

Atmospheric aerosol particles impact the atmospheric radiation budget in various ways. The direct radiative effect by aerosol particles is the change in the Earth’s radiation budget by scattering and absorption of incoming solar radiation. Coarse aerosol particles such as mineral dust can also absorb and re-emit outgoing longwave radiation. Aerosol radiative forcing is understood as the radiative effect of anthropogenic aerosols considering present-day distributions in comparison to pre-industrial conditions, when human impact on the aerosol load was considered negligible. In contrast, the aerosol radiative effect is due to aerosol species from both anthropogenic and natural sources. Heald et al. [1] pointed out that the both natural and anthropogenic aerosol species are relevant to fully understand interactions of aerosol and climate. Effective radiative forcing of aerosols consists of both the instantaneous forcing by aerosols and the rapid adjustment of the atmosphere to forcing including the impacts of heating rate changes from aerosol absorption on boundary layer stability or cloud cover. Such adjustment is also named the “semi-direct” effect, which is the radiative effect of changes in cloud cover due to aerosol-induced atmospheric heating rate changes. In contrast, indirect aerosol forcing is the effect of aerosol particles acting as cloud condensation or ice nuclei on cloud optical properties or lifetimes, which are, thus, indirectly impacting on the radiation balance. The 5th Assessment Report by the Intergovernmental Panel for Climate Change [2] specifies the global average direct radiative forcing by all anthropogenic aerosol types (including secondary sulfate, soot and organic particles from anthropogenic sources) as −0.35 Wm−2 (estimates ranging from −0.85 Wm−2 to +0.15 Wm−2) and the indirect radiative forcing as −0.45 Wm−2 (estimates ranging from −1.2 Wm−2 to 0.0 Wm−2). In addition to uncertainties in the global distribution of the different aerosol species [3], a main uncertainty in estimates of direct aerosol forcing is the uncertain contribution of absorbing soot or black carbon (BC) particles to the aerosol load, which are strongly absorbing in the solar spectral range and contribute a positive atmospheric direct radiative forcing. In contrast, secondarily formed aerosol particles (ammonium sulfate, ammonium nitrate, SOA), have a reflective effect. In the industrialized regions of North America, Europe, and Asia, BC is primarily emitted by the combustion of fossil fuels or biomass [4]. Sources are mainly industrial emissions, traffic, house fires, and vegetation fires, including burning of crop residues on arable land [5]. While anthropogenic soot aerosol from fossil fuel burning usually remains within the boundary layer, BC from vegetation fires can be released into the atmosphere at emission several kilometers high and, thus, like mineral dust aerosol, is subject to the long-distance transport in the free troposphere [6,7]. Estimates of BC direct radiative forcing are as high as +0.7 Wm−2 in the global annual average for BC from anthropogenic sources, and the direct radiative effect can be a high as +0.9 Wm−2 for all BC aerosol from both natural and anthropogenic sources [4].
Another partly absorbing aerosol is mineral dust, which originates from mostly natural sources, although part of the dust emissions may stem from anthropogenically influenced surfaces [8]. Mineral dust produced by strong wind events is a main component of the aerosol mixture in desert regions. Dust emission occurs mainly in the dust belt from the Sahara on the Arabian Peninsula and the desert areas in Central Asia and China. Other source regions are located in Australia, Patagonia and North America [9]. Mineral dust particles are slightly absorbing in the solar part of the spectrum depending on their mineral composition, in particular their content of the iron oxides hematite and goethite. Estimates of dust single-scattering albedos at 550 nm summarized by Highwood and Ryder [10] range from 0.8 to 0.98. Due to their particle size distribution with the majority of the particle mass being contributed by particles larger than 1 μm, mineral dust particles also absorb and emit longwave radiation in the terrestrial spectral range [11].
In addition to the direct forcing, aerosols impact on the radiation budget by the so-called semi-direct effect or rapid adjustment of the atmosphere to the instantaneous direct radiative effect by aerosols, without considering the effects of surface temperature changes. This additional radiative forcing is mainly caused by the impact of the change in atmospheric heating rates by absorbing aerosols on cloud cover, e.g., due to changes in boundary layer stability or convection. This does not include the indirect aerosol effects on cloud properties by microphysical aerosol-cloud interactions. Semi-direct aerosol effects are complex. In addition to surface albedo, their magnitude and sign depend on both the distribution of absorbing aerosols and clouds, in particular on their relative vertical position. Effects can range from reduction of vertical mixing within the boundary layer as consequence of boundary layer stabilization [12], to shifts of the inter-tropical convergence zone due to the large-scale asymmetric distribution of absorbing aerosol and strengthening the southeast Asian monsoon circulation (e.g., [13]).
Due to the partly opposing effects of absorbing aerosols on cloud cover and thus on temperature changes, the semi-direct effect is difficult to quantify on a global scale. Aerosol models embedded in atmospheric global or regional models that consider radiative aerosol effects can be used to estimate magnitudes of such semi-direct aerosol effects. The different effects of the semi-direct effect of soot aerosol have been summarized by Koch and Del Genio [14].
The semi-direct effect depends on the aerosol distribution, the single scattering albedo (SSA), the presence of clouds, the surface albedo and the vertical distribution of the aerosol. Hansen et al. [15] explained the influence of the absorbing aerosol on clouds as reduction and dissolution of clouds as consequence of temperature increase. Using a simplified general circulation model, they estimated that this effect increases the critical SSA below which tropospheric aerosols are warming rather than cooling globally from 0.89 to 0.91. In contrast, for Asia, Huang et al. [16] found in a model study an increase in low cloud cover over oceans and some land regions, i.e., a negative semi-direct effect. For the less absorbing mineral dust aerosol, Perlwitz and Miller [17] also found in a global model study that cloud coverage increases in regions with high dust concentrations. The authors explain this effect by the fact that the warming of the dust layer increases the moisture convergence, which in turn leads to an increase in cloud coverage.
For stratocumulus clouds, an overlying absorbent aerosol layer may increase temperature inversion by heating the aerosol containing air layer, causing an increase in cloud cover. The aerosol effect near the ground can increase the convection and thus also increase the cloud coverage. Estimates of the radiative forcing due to the semi-direct effect range from −0.4 to +0.1 Wm−2, while local values of −9.5 to +11 Wm−2 can occur [14]. The estimated semi-direct effects of absorbing aerosols is thus lower than the direct effect of anthropogenic aerosols, which is estimated at a range of −0.85 to +0.15 Wm−2 [2].
The ability of large-scale models to realistically describe the semi-direct effects or rapid adjustments of the atmosphere including changes in cloud properties is limited by their ability to accurately represent aerosol distributions as well as cloud processes. In addition to global models focusing mainly on the effects of aerosols on the radiation budget, regional models using reanalyzed wind fields to reproduce meteorological conditions have been used to more describe aerosol patterns and their effects with more detail compared to climate models. Studying the impacts of aerosol absorption on radiation in Central Europe with the regional model system COSMO-MUSCAT [18], Meier et al. [19] find that the aerosol-induced increase in heating rates causes a reduction in cloud cover in this domain. This cloud cover change means a positive semi-direct effect, with a regional average of about 2 Wm−2 for summer conditions. A different study with this model system for the field experiment in January and February 2008 investigating dust and smoke in the Sahara and Sahel, as well as their transport to the tropical Atlantic for the SAMUM-2 field experiment [20], found a strengthening of the Hadley circulation due to radiative forcing by dust and biomass burning smoke [21].
Ghan et al. [22] and Bauer and Menon [23] estimated the global semi-direct aerosol effects by decomposing radiative forcing estimates from global climate models into direct, indirect and semi-direct forcings for anthropogenic aerosols. In these studies the semi-direct effects were estimated as residuals from total effective aerosol forcing and instantaneous direct forcing computations. Bauer and Menon [23] found a global average negative semi-direct forcing of −0.1 Wm−2 comparing present-day and preindustrial forcing with the GISS Model E [24]. Ghan et al. [22] found the net semi-direct forcing of all anthropogenic aerosol types to be in the order of only 10% of the total aerosol forcing for different setups of the Community Atmosphere Model CAM5.1. The sign of this forcing could be positive or negative depending on the aerosol representation in the model. In their study the number of modes used to describe the aerosol distribution and the efficiency aerosol ageing influenced the results of the semi-direct forcing. In particular the ageing of BC aerosols influences the atmospheric lifetimes of these particles and thus impacts the atmospheric absorption. Those results highlight the large uncertainties and potential model dependencies in describing the semi-direct effect.
While those studies show only small global annual average aerosol semi-forcing values compared to estimated direct and indirect aerosol forcings, the overall effect is uncertain and may be model-dependent due to uncertainties in simulated aerosol and cloud distributions and model sensitivities. In addition, the average effect is small due to the cancellation of regionally positive and negative effects of absorbing aerosol on cloud cover and thus top-of-atmosphere radiative flux differences. However, for specific regions the magnitudes of semi-direct aerosol effects may be considerable.
Here we investigate the semi-direct effects (or rapid adjustments) of the absorbing aerosol types BC and mineral dust within the global aerosol-climate model ECHAM6-HAM2 (version echam6.3-ham2.3). The general circulation model ECHAM6 distinguishes between clouds generated from moist convection and stratiform clouds that occur as function of relative humidity [25]. The semi-direct effect for an aerosol scenario is computed as residual between the radiative effect (without taking into account changes in indirect aerosol effects) and the instantaneous direct aerosol forcing, as in previous studies. Here we consider the total effects without separating the aerosol distribution into anthropogenic and natural components. In the following we use the term direct radiative effect (DRE) referring to the effect of all aerosol. Thus, the possible maximum effect of absorbing aerosol heating in the atmosphere is evaluated.

2. Methods

2.1. Model Description

The model simulations were carried out with the ECHAM6-HAM2 global aerosol-climate model (version echam6.3-ham2.3) [26]. ECHAM6 is the atmospheric general circulation model developed by the Max Planck Institute for Meteorology (MPIM) in Hamburg, Germany [25]. The dynamical core uses the spectral transform method, while tracer transport is realized with a semi-Lagrangian transport algorithm [27]. Subgrid-scale stratiform clouds are represented using the scheme of Sundqvist et al. [28] that diagnostically calculates the cloud fraction as a function of the relative humidity in the given grid cell if a threshold value is exceeded. Cloud liquid water and ice mixing ratios are computed prognostically according to Lohmann and Roeckner [29].
Radiative transfer in ECHAM6 is computed using the radiation transfer broadband model RRTMG (Rapid Radiative Transfer Model for GCMs) [30], using 16 and 14 bands for the shortwave and longwave parts of the spectrum, respectively. Atmospheric radiative transfer is computed based on compounds present in the atmosphere and their related optical properties. Optical properties of clouds are calculated for each band of the RRTMG scheme using Mie theory and the concentration of liquid water and ice condensates.
The aerosol module HAM (Hamburg Aerosol Model) predicts the evolution of an aerosol ensemble considering the species sulfate, black carbon (BC), organic carbon, sea salt, and mineral dust. The aerosol size spectrum is described by seven log-normal modes: Nucleation mode, soluble (mixed) and insoluble Aitken, accumulation and coarse modes. The aerosol components are assumed to be internally mixed such that individual particles can consist of different species. To be considered soluble, at least one species within a particle must be soluble. Through condensation of soluble substances insoluble particles can become mixed (soluble). The aerosol distribution in each mode is described by the aerosol number, the median radius, and the standard deviation, which is set to 1.59 for the nucleation, Aitken, and accumulation modes and to 2 for the coarse modes. The median radius of each mode is calculated from the aerosol number and mass, which are transported as tracers within the respective mode. If interactions between aerosol particles and cloud droplets are considered explicitly with ECHAM6-HAM2, the cloud droplet activation is computed prognostically according to Lohmann et al. [31] and Abdul-Razzak and Ghan [32].
Anthropogenic emissions of particles and gaseous aerosol precursors in the model are specified for individual sectors. Here the Atmospheric Chemistry and Climate Model Intercomparison Project (ACCMIP) emission dataset [5] is used. It is based on horizontally gridded decadal monthly mean anthropogenic emissions for the years 1850 to 2000 combined from regional and global inventories. SO2, BC, and OC emissions from the relevant anthropogenic sectors including agricultural waste burning, aircraft, domestic, energy, industry, ships, transport, and waste are taken into account. In addition the ACCMIP dataset contains biomass burning emission fields including historical emissions. 75% of the smoke from biomass fires are injected evenly distributed vertically into the planetary boundary layer 17% in the first level and 8% in the second level above the boundary layer [33]. Emissions from biomass burning can be alternatively be prescribed from the Global Fire Assimilation System (GFAS) [34] for BC, OC, and SO2. GFAS fire emissions are assimilated from fire radiative power from MODIS satellite observations, with combustion rates computed using conversion factors for specific land covers. In order to optimally match observed aerosol optical thickness Kaiser et al. [34] recommend to scale the particulate emissions from the GFAS emission files by the factor 3.4.
Mineral dust emissions are computed on-line utilizing modeled 10 m surface wind speeds [35,36]. Source areas are prescribed as regions with less than 10% vegetation cover, which is derived from the fraction of satellite retrievals of absorbed photosynthetic active radiation. Surface roughness is set to 0.001 cm in dust source areas. Simulated vertical dust fluxes are attributed to the insoluble coarse and accumulation modes in the model. For Saharan dust sources an additional source mask based on the infrared dust index from the SEVIRI instrument on the geostationary Meteosat Second Generation satellite is implemented [37,38]. Dust emission fluxes were computed utilizing the scheme of [39], which computes the dust emission fluxes depending on surface conditions, like vegetation cover and soil moisture, and surface wind friction velocities for each potential dust source location. The dust flux emissions are grouped into the insoluble accumulation and coarse modes of the HAM aerosol scheme. The accumulation mode contains particles in the size rage 0.1 to 1 μm, and the coarse mode particles larger than 1 μm, with standard deviations of 1.6 and 2.0, respectively. Super-coarse dust particles are neglected [40].
Finally, sea salt emissions are parameterized according to Long et al. [41] with a dependence on sea surface temperatures according to Sofiev et al. [42].
The aerosol dynamic processes in HAM include nucleation of sulfuric acid-water droplets, coagulation, condensation of sulfuric acid and aerosol water uptake [43,44]. Condensation of sulfuric acid can occur on all particles. Coagulation is considered for the nucleation, Aitken and soluble accumulation modes. A mono-layer coating of sulfate causes moving an insoluble particle to a mixed (soluble) mode.
Climatological aerosol optical properties are used in radiative transfer computations in ECHAM6 as standard [45], while those properties are dynamically computed when using the prognostic aerosol module in ECHAM6-HAM2. The effective refractive index of each aerosol mode is computed from volume-weighted averages of the refractive indices and Mie-scattering size parameters of the individual components assuming internal mixing [46,47]. At 550 nm wavelength the complex refractive indices for BC is 1.8 + 0.71i [48], and 1.52 + 1.1 10−3i for dust aerosol [45]. Extinction cross sections, single scattering albedos (SSA) and asymmetry parameters for each aerosol mode are provided via a look-up table and then re-mapped onto the bands of the ECHAM radiative transfer model. Absorption optical depths (AAOD) are then computed from aerosol optical depth (AOD) as AAOD = AOD × (1 − SSA).

2.2. Model Setup

The radiative effects of absorbing aerosols were evaluated with eight model experiments, summarized in Table 1. All model simulations were carried out at a spectral resolution of T63 (corresponding to a horizontal grid size of approximately 1.9 degree, or 210 km at the Equator) and 47 vertical layers. For all cases except GFAS biomass burning emissions from the ACCMIP dataset are used. As this results in comparably low BC concentrations [49], a sensitivity study using GFAS fire emissions multiplied with the scaling factor 3.4 is included (GFAS) resulting in higher BC loads.
The initial model aerosol concentration is zero. Each model simulation was carried out for eight model years, whereby the first three modeled months were disregarded for the further analysis of the results. Sea surface temperatures were considered fixed at climatological values of the average for years 1979–2008. From all model years climatological averages of monthly means and variabilities were constructed for the considered model variables. These include the net solar and thermal radiation (here only analyzed for the top of the atmosphere (TOA)), the accumulated solar and thermal (all-sky and clear-sky) radiation flux anomalies at TOA, atmospheric hearing rates, and the vertically integrated cloud cover.
We calculate the direct radiative and semi-direct radiative effects and radiative forcing by aerosol as in Ghan et al. [22]. The radiative fluxes at the top of the atmosphere (Fnet) are diagnosed as net solar Fnet,s and thermal fluxes (Fnet,t), including effects of scattering and absorption by clouds and aerosol particles. As is Ghan et al. [22] the radiative forcing for the thermal part of the spectrum was only considered for cloudy conditions to exclude effects that originate from changes in land surface temperatures. Thus, in this study the net radiative fluxes were computed as:
Fnet = Fnet,s + Fnet,tFnet,t,clear.
Fnet,t,clear includes only cloud-free conditions, but includes aerosol forcing (which is small for thermal wavelengths). The direct radiative effect DRE of an aerosol compound is then computed as difference between the radiative fluxes for the model simulation including the regarded aerosol species and the simulation not including this aerosol type:
DREaerosol = Fnet, aerosolFnet,no_aerosol
The instantaneous direct radiative forcing IDR by the different aerosol species is computed by double calls to the radiation routine to diagnose the radiative forcing without influencing the atmospheric conditions driven by this forcing, but include the solar and thermal net fluxes at the top of the atmosphere. Again, the TOA aerosol direct forcing IDRaerosol is computed as difference between the radiation fluxes F0 at the top of the atmosphere of the model simulation including and simulation results excluding this aerosol type. The double radiation call was performed in the runs that simulate the aerosol effects. For this direct radiative forcing atmospheric heating rate changes in a model grid cell due to absorbing aerosol were calculated as:
ΔT(z)/Δt = (cρρ)−1F(ztop) − ΔF(zbottom))/(ztopzbottom)
where cp and ρ are heat capacity and density of air in the grid cell, respectively, and ztop and zbottom denote the height of the top and bottom of the model grid cell.
The semi-direct effect SDEaerosol is then calculated as residual of the direct radiative effect and the radiative forcing as:
SDEaerosol = DREaerosolIDRaerosol
In addition to the radiative effects, differences in column averaged cloud cover CLC were analyzed as this factor is mostly responsible for the semi-direct aerosol effects.

3. Results

3.1. Absorbing Aerosol Distribution

The focus of this work is on the simulated effects of the absorbing aerosol species BC and mineral dust. In the standard version, dust emissions computed for the average of the eight model years are 1530 Mt/yr, the global average dust burden is 16 Mt. Dust atmospheric lifetime is 3.9 days in the eight-year average. For BC the emissions are 8 Mt/yr in the BASE case, global average BC burden is 0.14 Mt, and BC atmospheric lifetime is 4.4 days. For the GFAS case the BC emission is 12 Mt/yr and the global burden is 0.25 Mt, which is 1.8 times higher than for the BASE case. Global average optical thickness at 550 nm is 0.089 overall, of which 0.026 is due to dust aerosol. BC average optical thickness is 0.0005, and average AAOD is 0.0027. For the ‘high BC’ GFAS case the global average AOD is 0.13, 0.0014 due to BC; AAOD is 0.0060 for this case. In comparison, Myhre et al. [3] specifies AOD 0.028, and BC AOD of 0.0015 for multi-model median values of anthropogenic aerosols.
Dust and black carbon aerosols contribute to the absorption optical depth of the global aerosol distribution that is a measure of the absorption part of the aerosol extinction. Aerosol absorption leads to increases in atmospheric heating rates, which in turn causes changes in atmospheric stability and cloud cover. The seasonal distribution of the simulated AAOD at 550 nm (eight-year average) is compared to OMI AAOD retrievals at 500 nm (averaged for the years 2004–2010) in Figure 1. Observations of absorption aerosol optical thickness are obtained from the Ozone Monitoring Instrument (OMI) onboard the EOS-Aura satellite platform, which is part of the NASA A-Train satellite constellation [50]. The daily data product is available since 2004 for 355 nm, 388 nm and 500 nm at 1° × 1° resolution (dataset name: OMAERUVd, version 003, doi:10.5067/Aura/OMI/DATA3003). This product has e.g., been used to evaluate MERRA aerosol reanalysis fields [51].
Both BC and mineral dust aerosol contribute to AAOD, which is reflected in the regional distributions of model results and observations. The aerosol absorption efficiency is considerably higher for BC than for dust aerosol. However, dust optical thicknesses are overall higher, exceeding the BC AOD by a factor 50 in the global average in the model results. Maximum values above 1.0 in the monthly mean dust AOD are also high compared to BC optical thickness values, for which maximum values always remain below 0.03 in the monthly mean. Maximum monthly mean AAOD values of 0.1 are reached in January in the model. The maximum seasonal AAODs in the northern hemisphere spring and summer seasons reflect the well-known seasonal maximum values in dust optical thickness in North Africa and in NH spring in Asia, in both model results and satellite data. The aerosol distribution in North Africa is characterized in particular by the natural mineral dust, which contributes more than 80% to the aerosol-optical thickness in the Sahara region. Although dust particles in the solar wavelength range absorb much less solar radiation than soot particles due to their optical properties, their high optical thickness, and extensive geographical coverage indicate that the influence of mineral dust on atmospheric heating rates cannot be neglected. There is also an overall agreement in the AAOD originating from biomass smoke the dry seasons in South America in NH summer (with values up to 0.025 in the model and 0.035 in the observations), and Sahel in NH winter, where AAOD values reach 0.05 in the model and 0.06 in the observations. Overall, model absorption underestimates the satellite product for the BASE case. For this case. East Asia, US and Europe are strongly affected by anthropogenic aerosol emissions. In Central Europe and US anthropogenic aerosol emissions were reduced in recent decades by air pollution control measures [52]. AAOD in East Asia is higher in the model compared to the observations in summer and fall months. In the annual mean, AAOD values reach 0.02 in the observations and in the model.
The annual means of the OMI and model AAOD distributions are shown in Figure 2. Model results are compared for the BASE and GFAS cases. In the annual mean, AAOD values reach regional values as high as 0.02 in observations and in the BASE case model. In the GFAS case the AAOD reaches annual mean values above 0.05 in the biomass burning region in Central Africa. Overall the model agrees with the regional distribution of the absorbing aerosol optical thickness compared to the OMI data, but has lower values for AAOD compared to the OMI observations for the BASE case, and higher values for the GFAS case. It should be noted that the model results are available at T63 resolution which is lower than the resolution of the OMI AAOD dataset at 1° × 1° resolution. Some subgridscale variability of the aerosol distribution may not be captured by the model, which may lead to an underestimate of simulated maximum AAOD. This discrepancy may be an indication that the aerosol absorption in the model is too low in the BASE case. This possible underestimation implies that the results for aerosol radiative effects can also be considered a lower limit for the effects simulated with this model setup. The GFAS case shows regionally higher AAOD values compared to the OMI retrievals and thus this ‘high BC’ case is used as an upper limit for BC forcing.

3.2. Radiative Effects

3.2.1. Impacts on Atmospheric Heating Rates

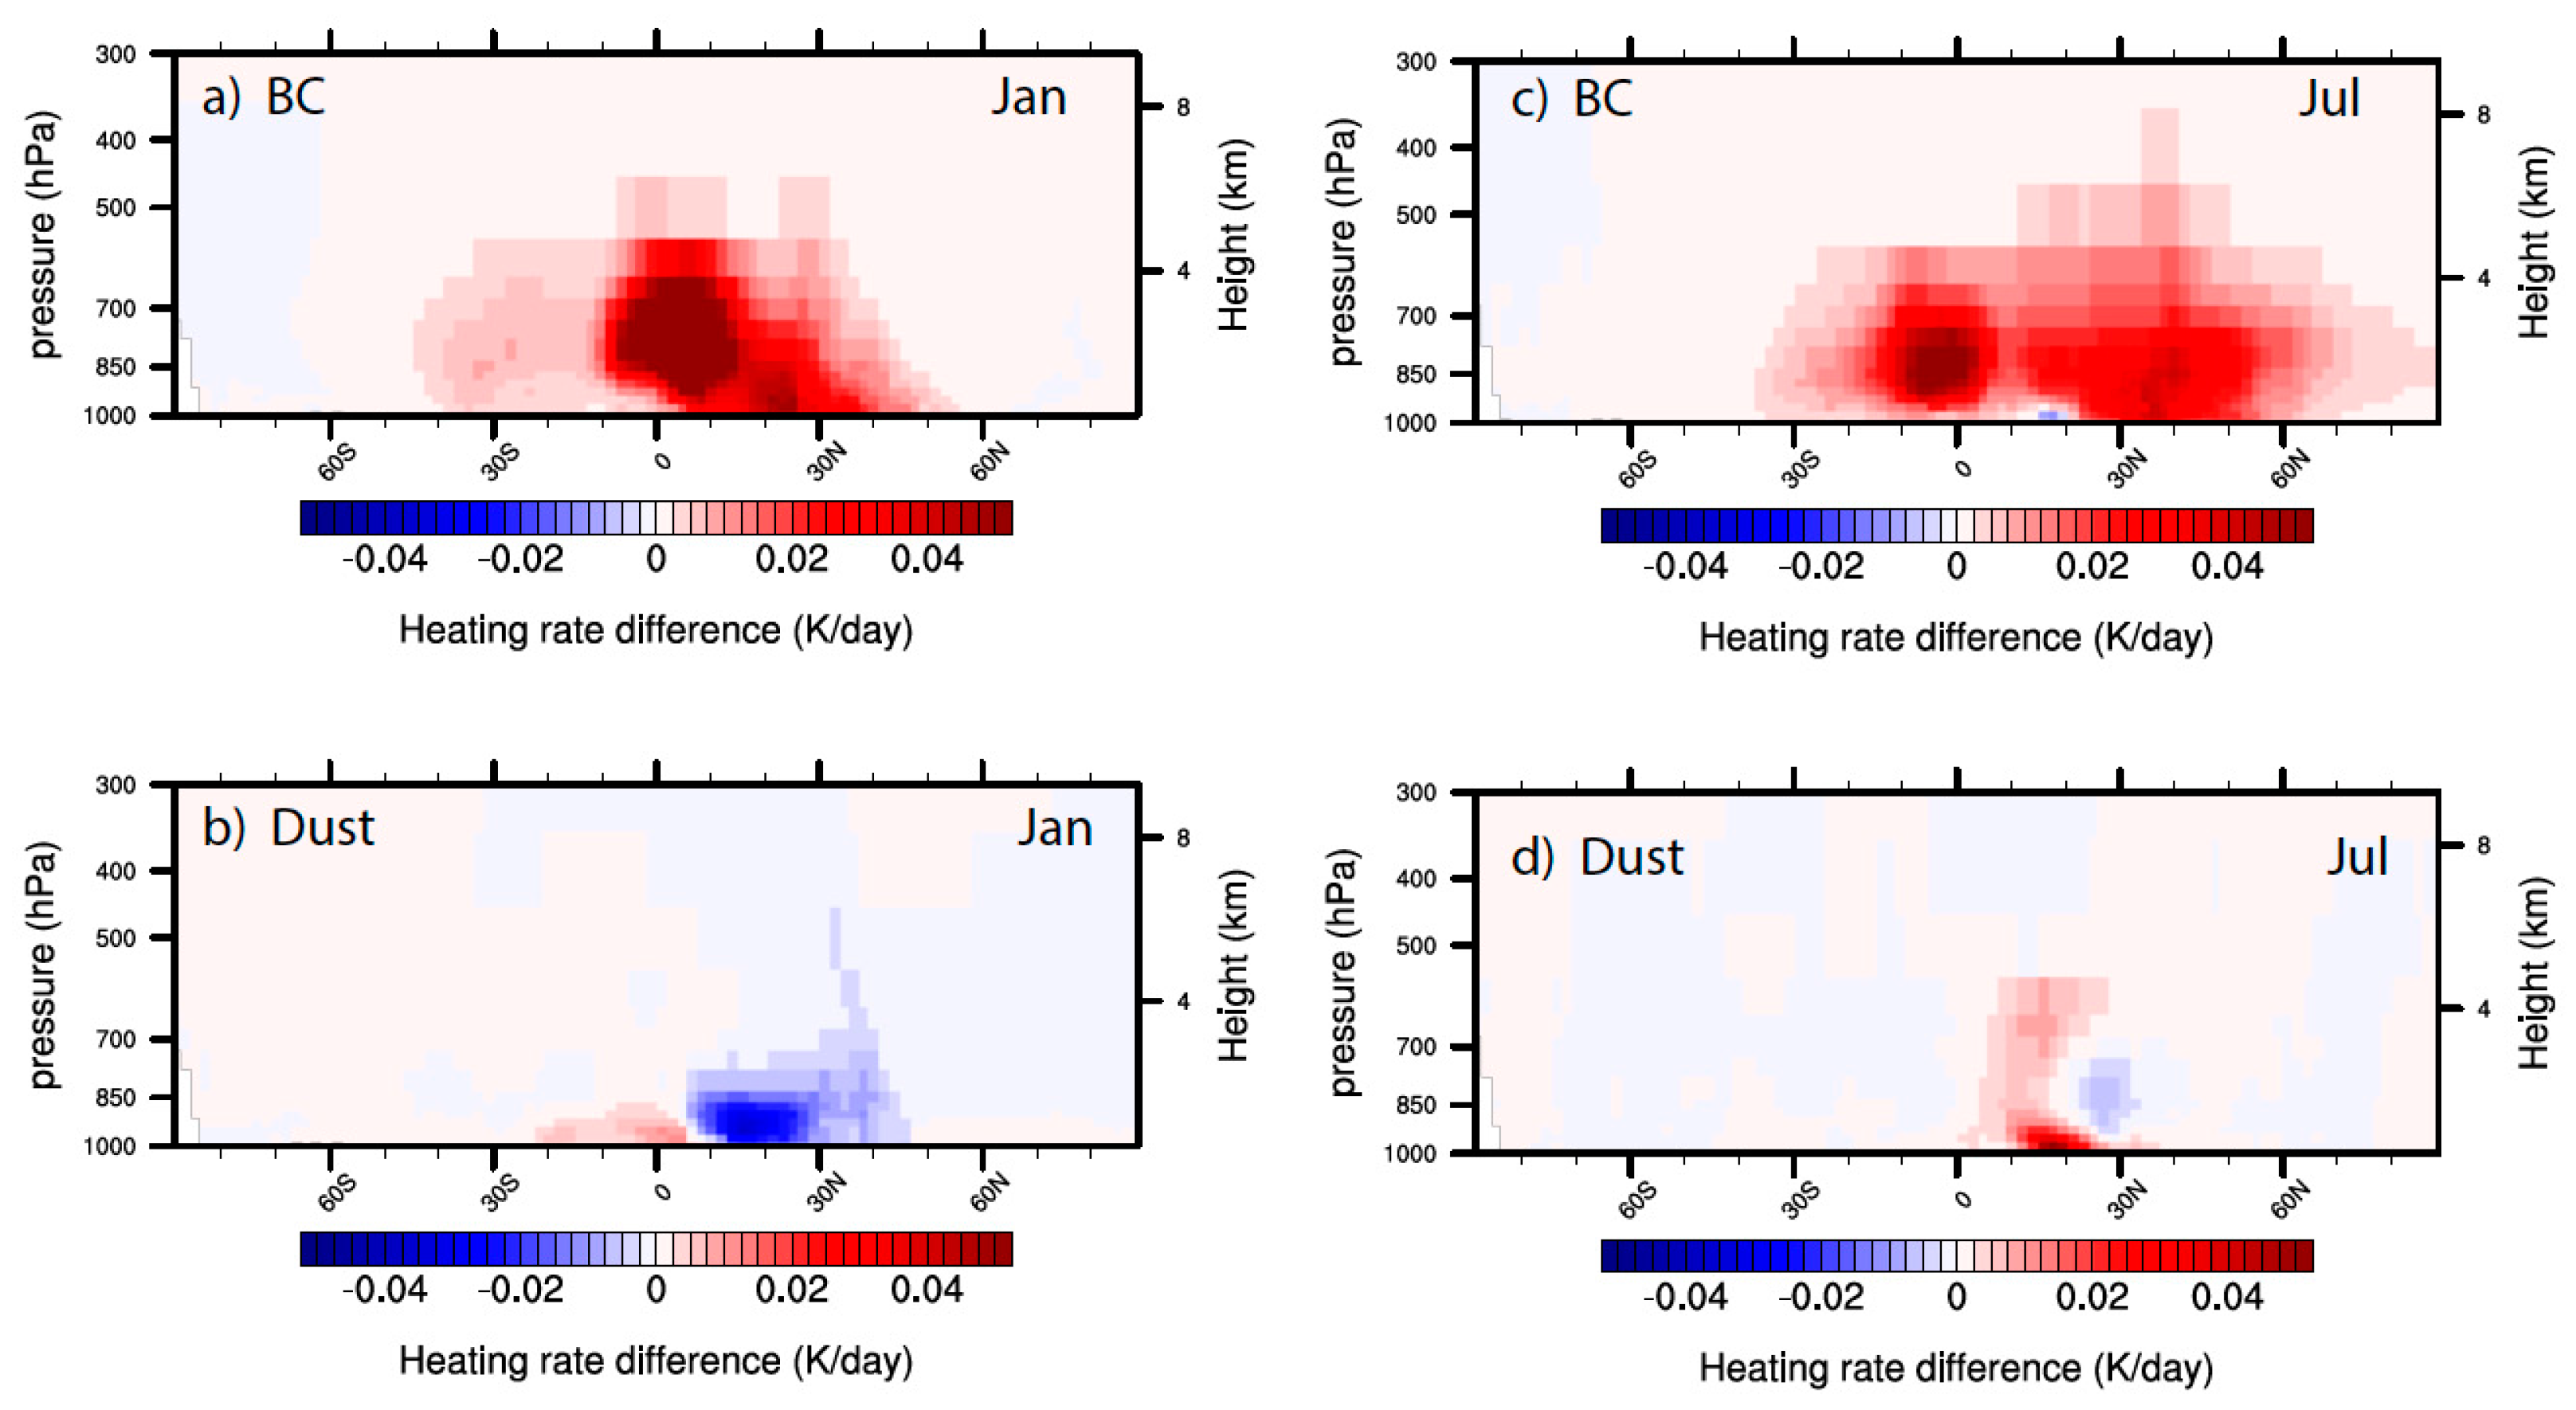
The impact of aerosol absorption on atmospheric dynamics and cloud cover is a consequence of changes in atmospheric heating rates (HR) by the presence of aerosols. Heating rate differences due to the presence of an absorbing aerosols are computed as differences between the heating rates of the model, including all aerosol species and the results of a simulation not including this aerosol type. The instantaneous heating rate changes were computed by double calls to the radiation routine to diagnose the heating rates without influencing the atmospheric conditions driven by the aerosol forcing, as done for diagnosing the instantaneous radiative forcing. Figure 3 shows the vertical distributions of instantaneous heating rate changes from dust and BC aerosol. The results are computed as differences of the simulated heating rates from experiments BASE and noDust and noBC, respectively.
Shown are zonal means for the individual months of July and January, representing winter and summer conditions. For July conditions the HR maxima for BC occur near the Equator and can reach values of 0.1 K/day in the zonal mean. Local maximum heating rate changes due to black carbon heating reach values up to 1.3 K/day, which is lower compared to, e.g., the locally evaluated HR of 7–8 K/day by Wendisch et al. [12] for conditions in the Pearl River delta in China. This may be a consequence of the coarse model resolution, which may cause a stronger mixing and, thus, stronger dilution of boundary layer pollution in the model compared to the observation. BC heating rates near the equator are enhanced by biomass burning aerosols, and in mid-latitudes by aerosols from industrial emissions. BC is mixed to heights above 5 km into the free troposphere in the northern mid-latitudes due to large injection heights for biomass burning smoke. HR changes due to mineral dust are of comparable magnitude in the zonal mean near the ground, reaching zonal mean values of 0.06 K/day due to absorption by dust over the Sahara. In summer the heating rate changes due to the presence of dust impact latitudes from 20–30° N to heights up to 500 hPa, which reflects the dust transport into and within the Saharan Air Layer (SAL). Monthly maximum HR changes were as high as 1.3 K/day for dust aerosol. This agrees quite well with the early study by Carlson and Benjamin [53], who estimate a heating rate change by dust of 1 K/day for the SAL over the Atlantic. Some negative values of about 0.01 K/day in the zonal mean occurred here as well in the sinking branch of the Hadley circulation at 30° N. This cooling is due to the thermal forcing effect as dust due to its particle size is both absorbing and emitting longwave radiation in the thermal infrared part of the spectrum.
The same is the case for January conditions, where the effect of BC reaches 500 hPa near the equator in the biomass burning-influenced region, but remains at much lower altitudes in the northern mid-latitudes. BC from industrial emissions in winter conditions does not frequently reach the free troposphere. For dust the atmospheric cooling is more pronounced in January than in July, reaching a minimum of −0.02 K/day over the Saharan region. Considering only solar radiation, heating rates are positive overall for dust and BC aerosol forgings. Solar heating by dust reaches up to 1.1 K/day in January. Overall, due to partial cancellation of both heating and cooling effects by dust aerosols the overall radiative effects are not as obvious compared to the overall increasing in atmospheric HR due to the presence of BC aerosol. Overall the heating by BC aerosol exceeds the heating by dust, however, dust effects may still be considerable regionally.

3.2.2. Top of Atmosphere Radiative Effects

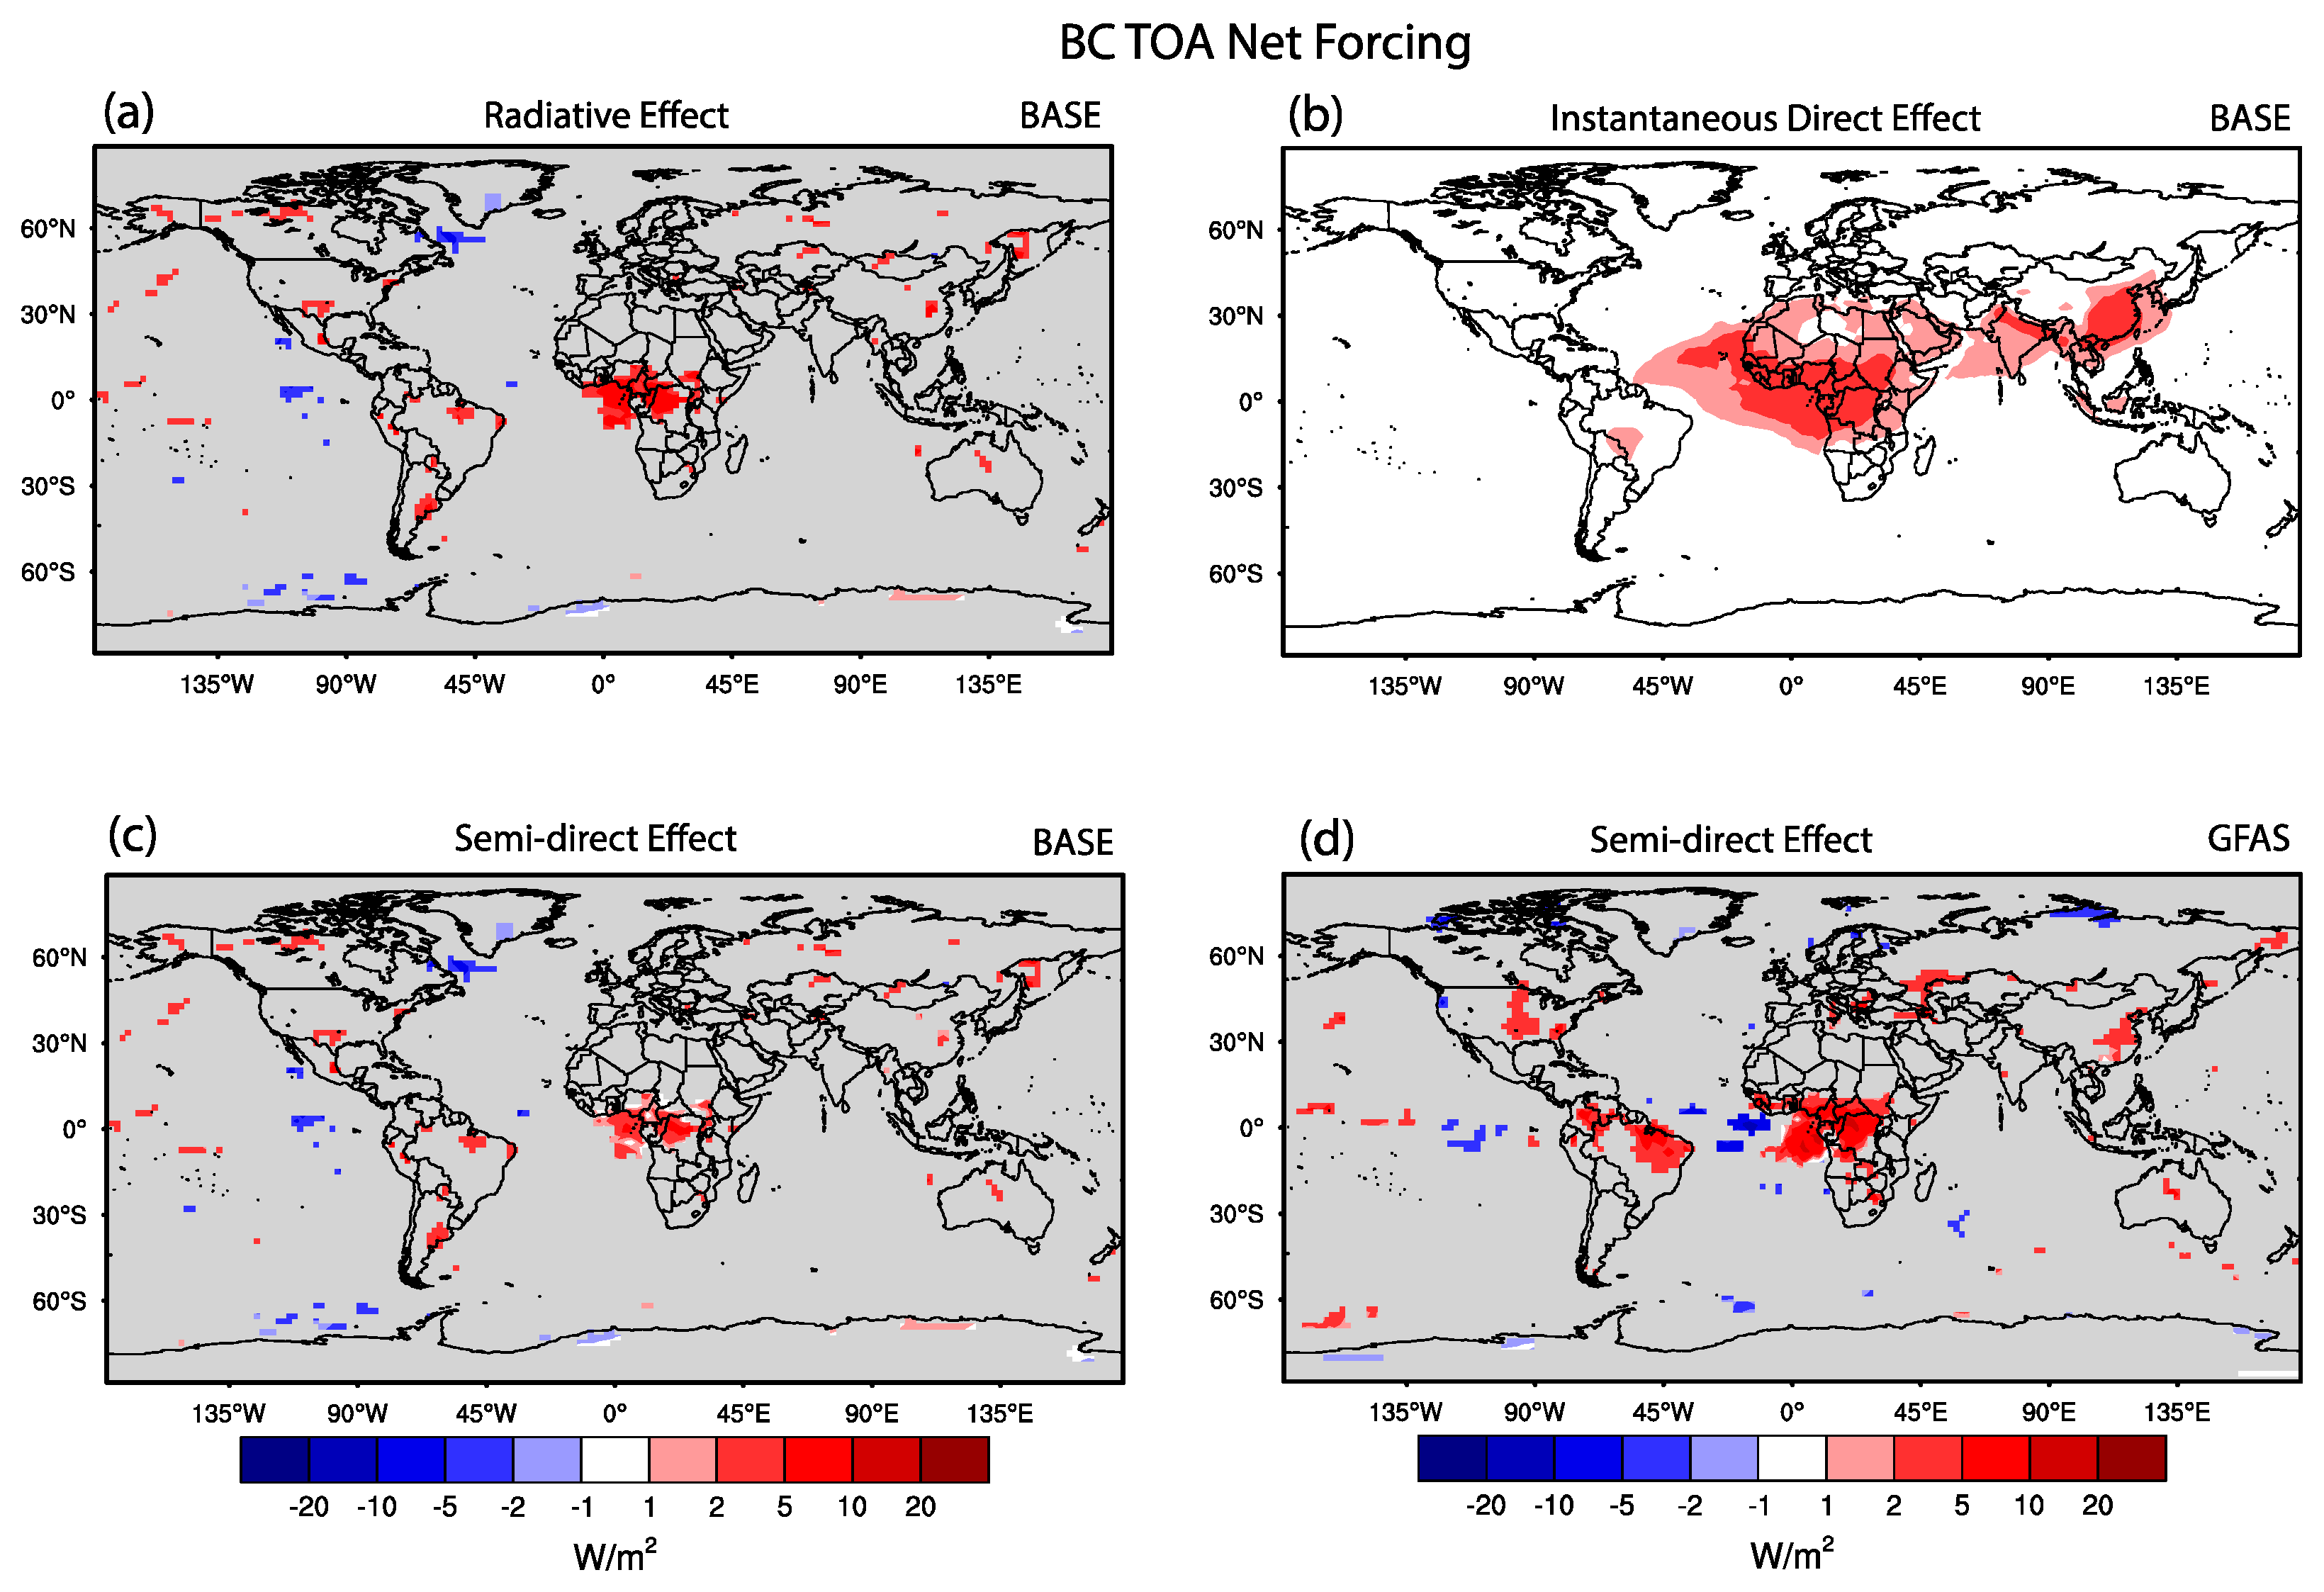
The aerosol radiative effect is computed as the difference of net of incoming and outgoing radiative fluxes (shortwave and longwave) at the top of the atmosphere. The forcing due to a specific aerosol type was computed as the difference between radiation fluxes of the simulation containing all aerosol and the simulation excluding the specific aerosol type. Figure 4 and Table 2 summarize the eight-year annual average differences for the direct radiative effect (DRE), instantaneous direct radiative effect (IDR) and the residual semi-direct effect (SDE) for the differences between the experiments BASE and noBC to evaluate the effect of BC absorption on the radiation budget. Only grid cells where Student’s t statistics indicate a confidence level above 95% are shown for DRE and SDE.
The direct forcing by BC aerosol is positive overall, which is due to the aerosol absorption in the solar spectrum. In the global annual mean the DRE is +0.51 Wm−2 and the IDR is +0.42 Wm−2, which is close to the value in IPCC [2] for BC direct radiative forcing for BC from fossil fuel and biofuel burning, which is 0.40 Wm−2 with minimum and maximum estimates ranging from 0.05 Wm−2 to 0.80 Wm−2. Since on one hand here we consider all BC sources including non-anthropogenic wildfires, but on the other hand the AAOD from the model may be underestimated as indicated by the comparisons with the OMI AAODs, this estimate appears to be at least within the range of uncertainties from earlier studies.
The semi-direct effect computed as residual between the DRE and the IDR shown in Figure 4c has overall positive values. In the global average, the SDE forcing is +0.09 Wm−2, with a standard deviation of 0.47 Wm−2 computed as standard deviation from the annual averages of the individual model years (Table 2). The positive forcing is mainly due to solar wavelengths (+0.19 Wm−2 in the global mean), while the average radiative effect at the thermal infrared is negative (−0.1 Wm−2). For the ‘high BC’ sensitivity case GFAS the semi-direct effect is much higher, with 0.26 Wm−2 in the global mean. This high value is mostly controlled by positive forcing in the tropical regions of Africa and South America (Figure 4d) where high biomass burning emissions contribute to aerosol absorption. The overall BC SDE forcing is usually estimated to be negative in the global annual mean (e.g., [2]), in this model study this is not the case even for the total aerosol effect SDE is positive in the global annual average where SDE (all aerosol) = (+0.08 ± 0.47) Wm−2. This is within the range of earlier studies that evaluate the semi-direct effect for anthropogenic aerosols., which are summarized in Koch and Del Genio [14] to be between −0.4 and +0.1 Wm−2. Bauer and Menon [23] find −0.1 Wm−2 as globally averaged semi-direct aerosol effect, and Ghan et al. [22] derive global averaged net semi-direct effects of −0.09 or +0.081 Wm−2 for aerosol represented by seven or three modes in the model, respectively.
The regional distribution of the positive effect is evident in the biomass burning regions in the Sahel and South American regions, but also over parts of the Sahara desert for the solar part of the spectrum (not shown). This overall positive SDE agrees with an overall reduction of cloud cover. It is however comparably small and highly variable, with (−0.25 ± 0.24)% cloud cover change for the global mean in the BASE case. Again, the global average values of the effect of the absorbing aerosol are due to averaging of both positive and negative values for cloud cover differences.
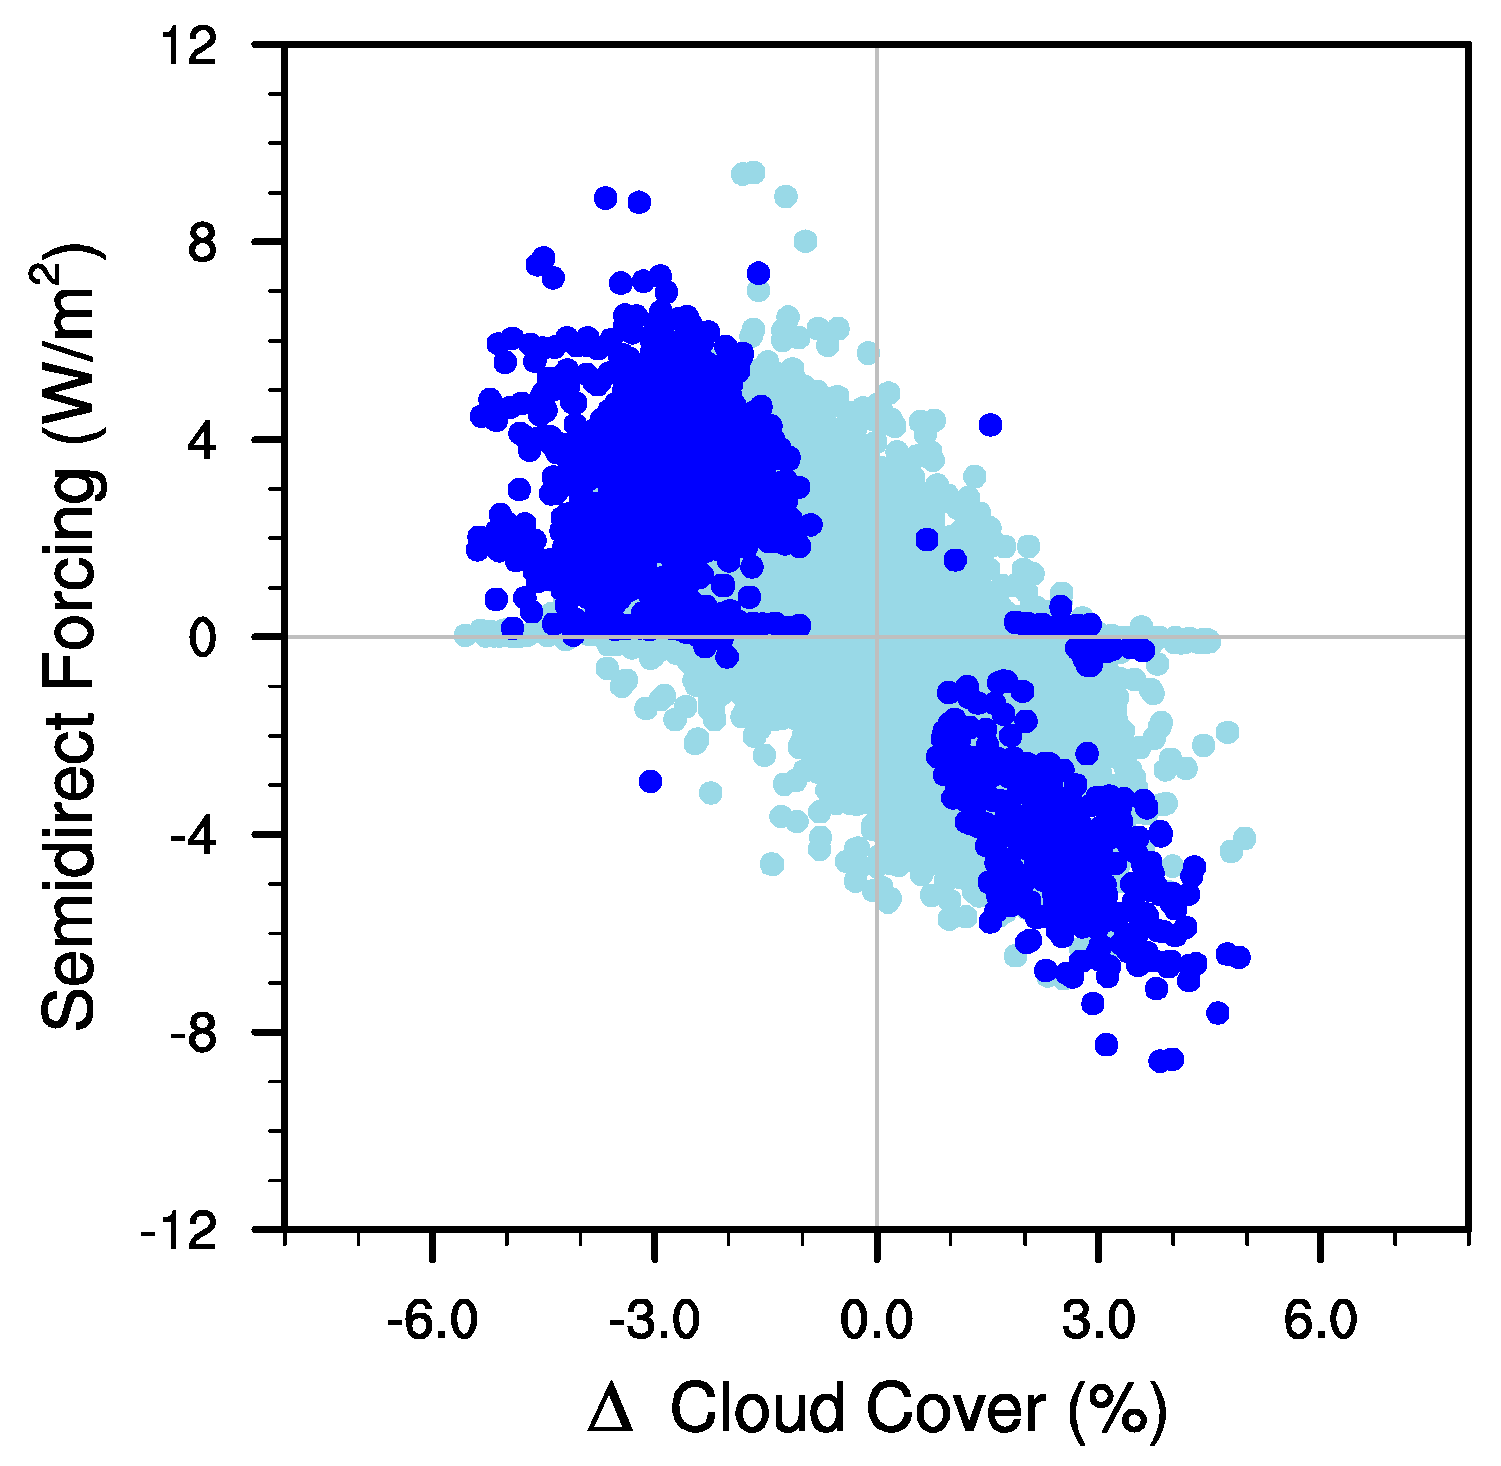
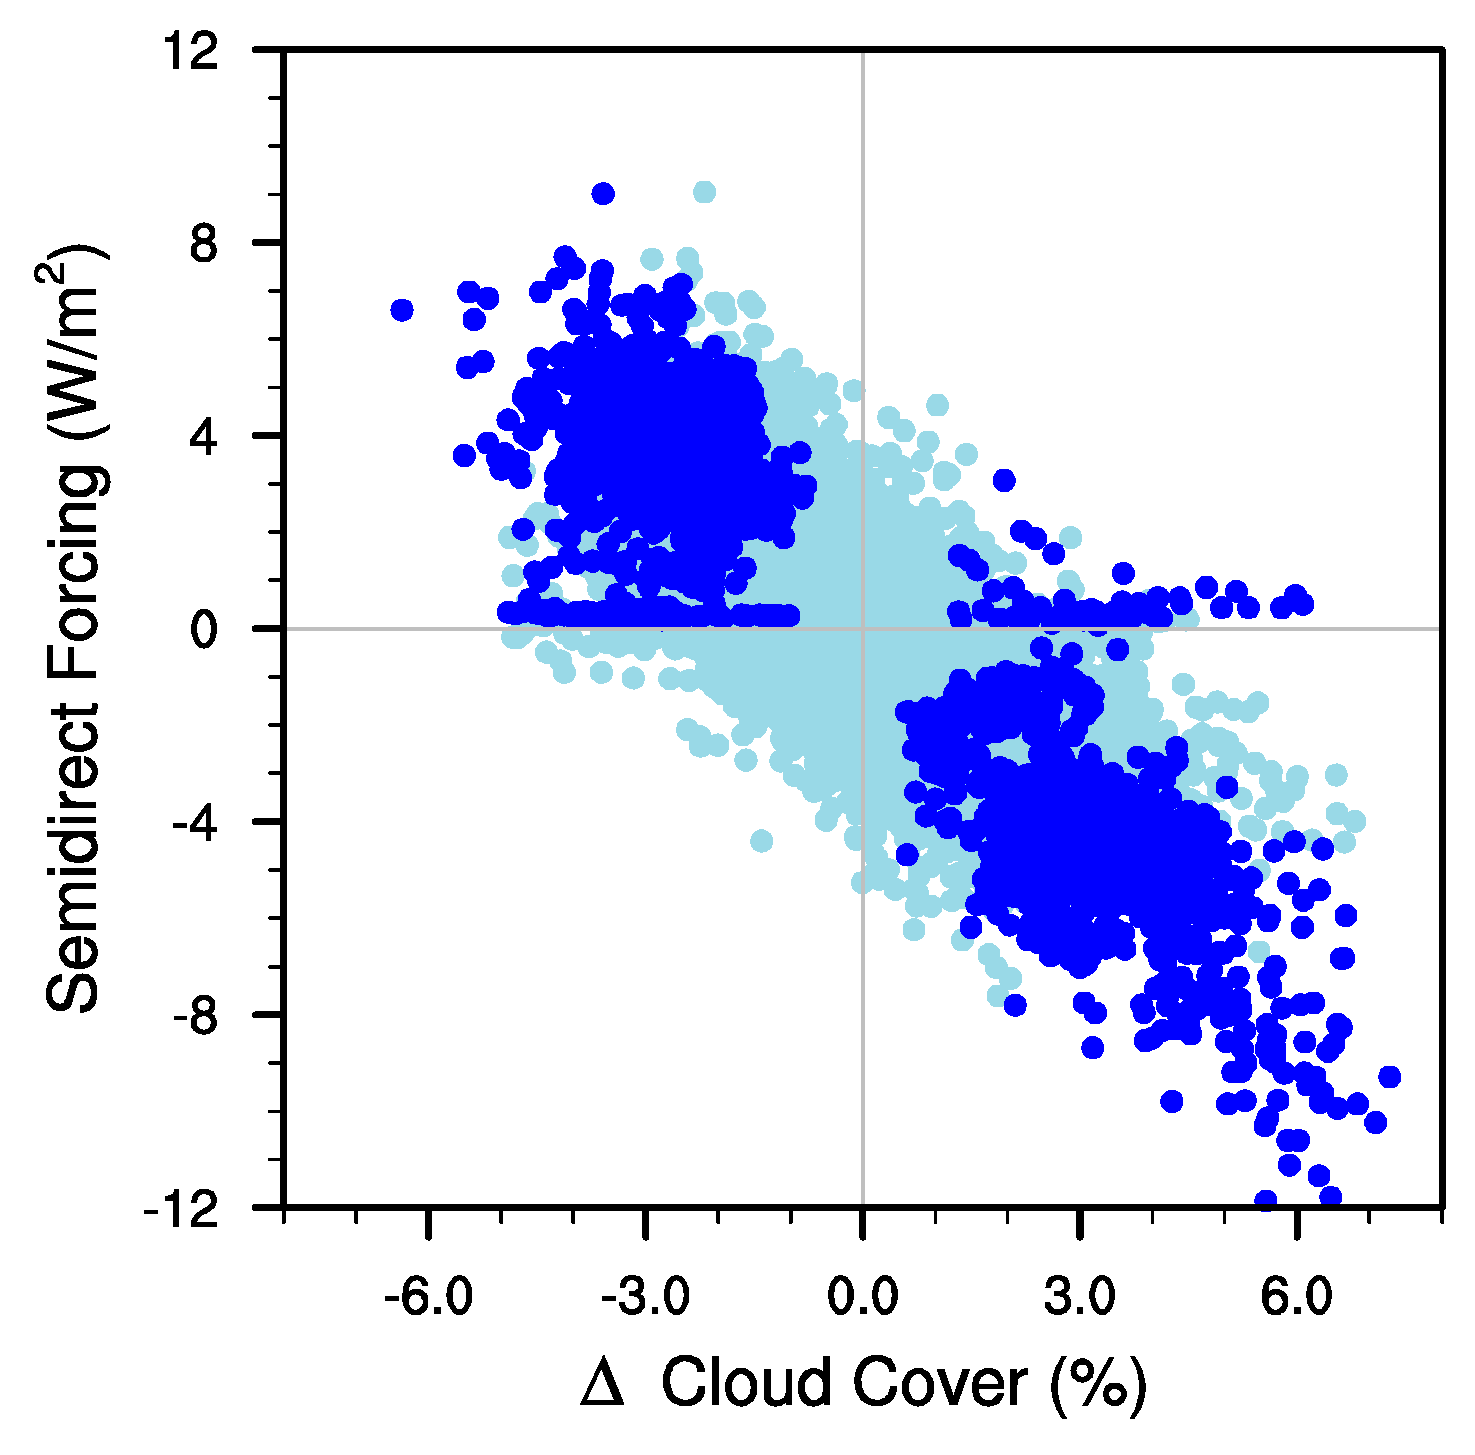
The SDE is the consequence of changes in cloud cover due to changes in atmospheric heating rates by aerosol absorption. This relationship is evident in the scatter plot shown in Figure 5, where the solar part of the SRE of BC is shown in dependence of the cloud cover differences between the model experiments BASE and noBC. Decreasing cloud cover is related to a positive radiative forcing due decreased backscatter of incoming solar radiation. The linear regression coefficient between the changes in SDE to cloud cover is (−1.1 Wm−2)/(% cloud cover) (r2 = 0.69).
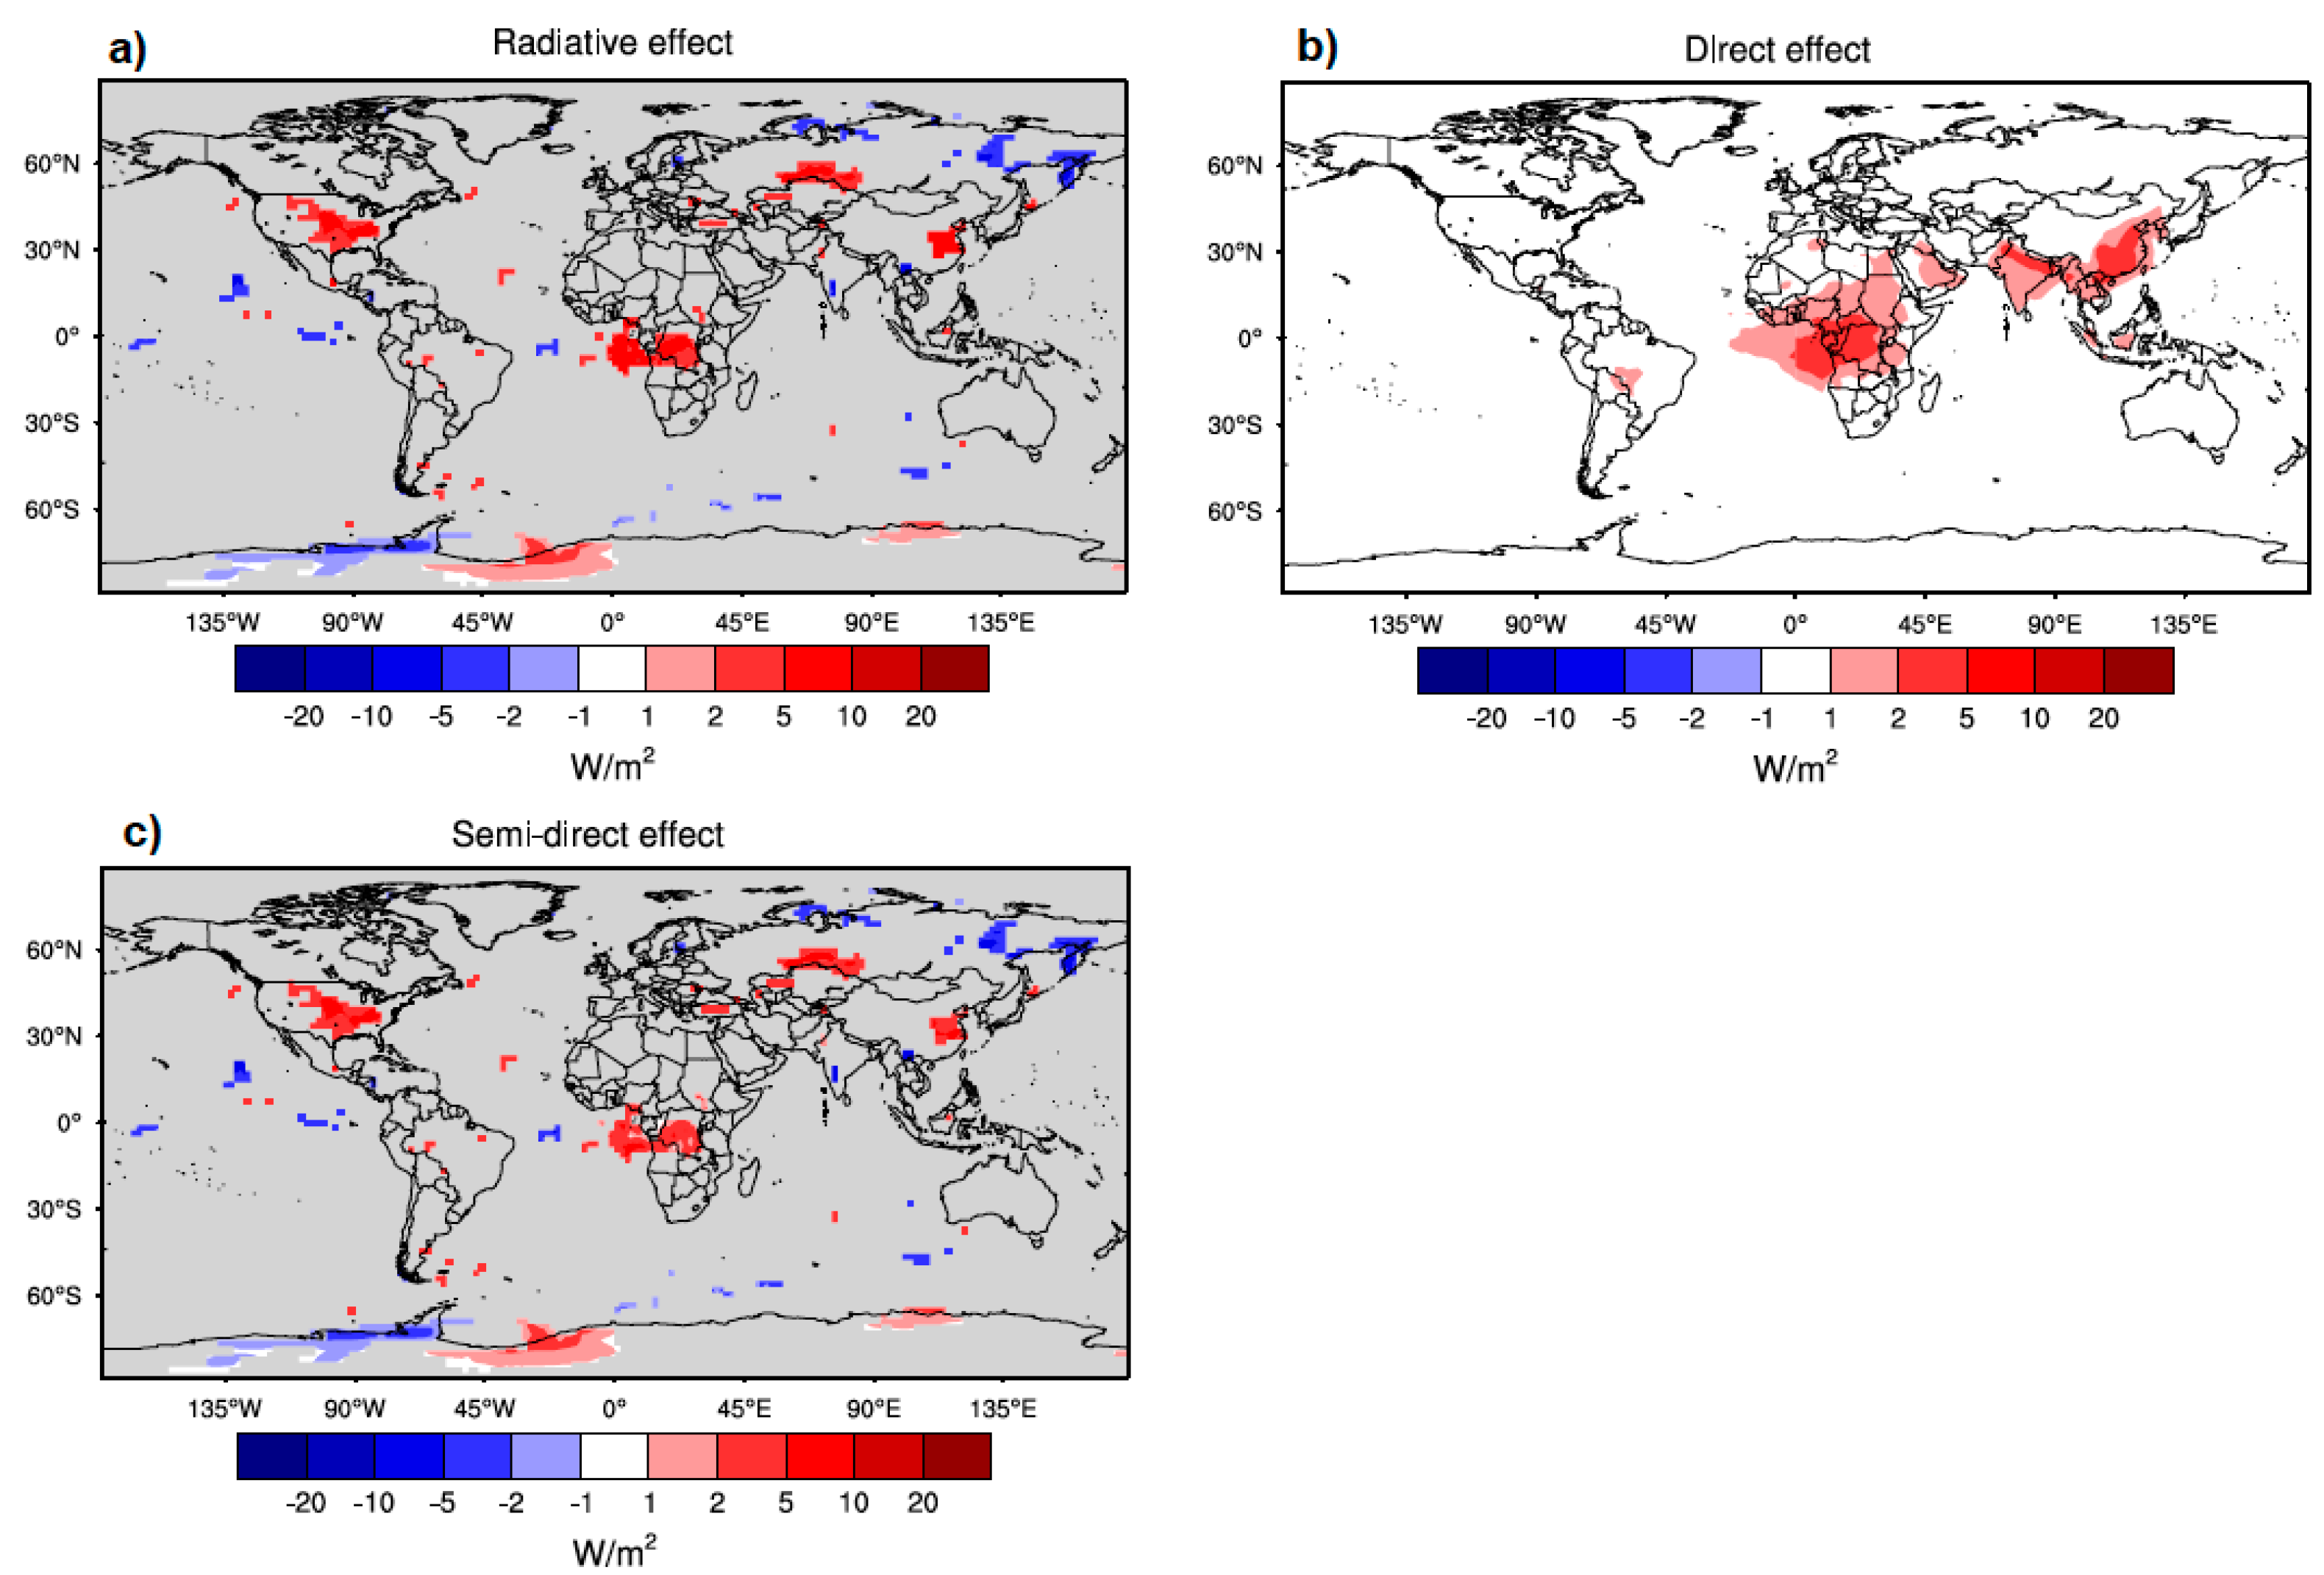
The instantaneous direct radiative effect is positive (Figure 4b), with high positive values evident over the Sahara and North Atlantic. While over the Sahara the positive BC forcing is possibly due to the high surface albedo, the positive forcing of the BC over the Atlantic downwind of the Sahara is partly due to the reflectivity of underlying mineral dust aerosol. Due to the BC radiative effect the dust emission itself is slightly decreased from 1590 Mt/year to 1530 Mt/year when BC forcing is included. Thus BC forcing reduces dust emissions (and in consequence dust load and AOD, decreasing the negative dust radiative effect at TOA) by about 4%. This change is too small to explain the positive TOA BC forcing over the tropical North Atlantic. Instead, the comparably highly reflecting dust aerosol caused an additional positive radiative effect compared to the case when dust aerosol is excluded. Excluding dust aerosol from the model (simulation noDUST and noABS, which are similar to BASE and noBC, but excluding mineral dust) leads to a lower radiative effect of BC, which is evident in the difference between experiments noDust and noAbs (Figure 6, Table 2). Here, the effect of BC is considered that would occur if all mineral dust was removed from the atmosphere. Positive BC forcing is reduced to from +0.51 Wm−2 to +0.24 Wm−2 for DRE and from +0.42 Wm−2 to +0.27 Wm−2 for IDR, and the SDE is actually negative in the global average with −0.03 Wm−2. The resulting patterns (Figure 6c) indicate a higher positive forcing in US, Central Asia and Central Africa, where both BC and dust are present in BASE experiment. The direct radiative effect of BC above the comparably bright dust layer leads to additional positive forcing, similar to BC located above clouds. This effect is particularly relevant for dust from biomass burning in the northern hemisphere winter months. Biomass smoke layers located above dust layers were e.g., as observed during the SAMUM2 field experiment for winter conditions downwind of the Sahara/Sahel region over the Atlantic [6]. Similarly, the relation between cloud cover and SDE (Figure 7) from the effect of BC is actually slightly stronger without the effect of the dust aerosol, with a regression coefficient of −1.2 Wm−2/(% cloud cover) (r2 = 0.79) for the relationship of differences in SDE and cloud cover for the simulations noDUST and noABS.
To isolate the effect of the aerosol-cloud interaction, the activation of cloud droplets by prognostic aerosol was not included in the model experiments. However, in reality the semi-direct effects and indirect effects of aerosol particles on clouds can be expected to interact with each other. An additional pair of model simulations including the indirect aerosol-cloud effect (BASEind, noBCind) have a radiative effect at TOA of +0.46 Wm−2, with IDR of +0.41 Wm. The residual cloud effect due to the semi-direct and indirect effect is again small: SDE = 0.05 ± 0.49) Wm−2. Overall, semi-direct and indirect aerosol-cloud effects are presumably interacting and difficult to separate. Here, the values for the different components of BC forcing including the indirect aerosol-cloud effect are slightly smaller but still similar to the BASE case where the indirect effect is not considered.
The standard deviations given in Table 2 are the consequence of the internal model variability. It can be considered as a lower limit for model errors. In addition, uncertainties in the atmospheric distribution of absorbing aerosol particles and their optical properties may cause uncertainties in the radiative aerosol radiative forcing and the atmospheric response. The response of the cloud cover and thus the semi-direct effect may depend on the parameterization of cloud formation in the model, a certain model dependence of the resolution can be expected.

3.3. Regional Effects

Global model studies of the DRE and SDE show the range of forcings and responses between different models is large, and in particular the effect of the absorbing aerosol is difficult to assess since it also depends on the ability of the model to simulate cloud processes in a realistic way [2,3]. Additionally, the coarse model resolution may be problematic when considering aerosol transport and cloud interaction processes. Regional model studies that have higher spatiotemporal resolution and realistic meteorology are on the other hand limited to individual events and thus it is difficult to obtain general conclusions from such simulations.
As example for earlier model studies and to test if some agreement can be found in the global model results we compare the results by ECHAM-HAM with earlier results by Meier et al. [19] and Heinold et al. [21] who had utilized the COSMO-MUSCAT regional aerosol-transport model with radiatively interactive aerosol. Here we test if similarities in the results of the two models, the regional model COSMO-MUSCAT and the global aerosol-climate model ECHAM6-HAM2 (that not only differ in their parameterizations of aerosol processes, but also operate on very different spatial and temporal scales) obtain at least qualitatively similar results for the responses to the absorbing aerosols.
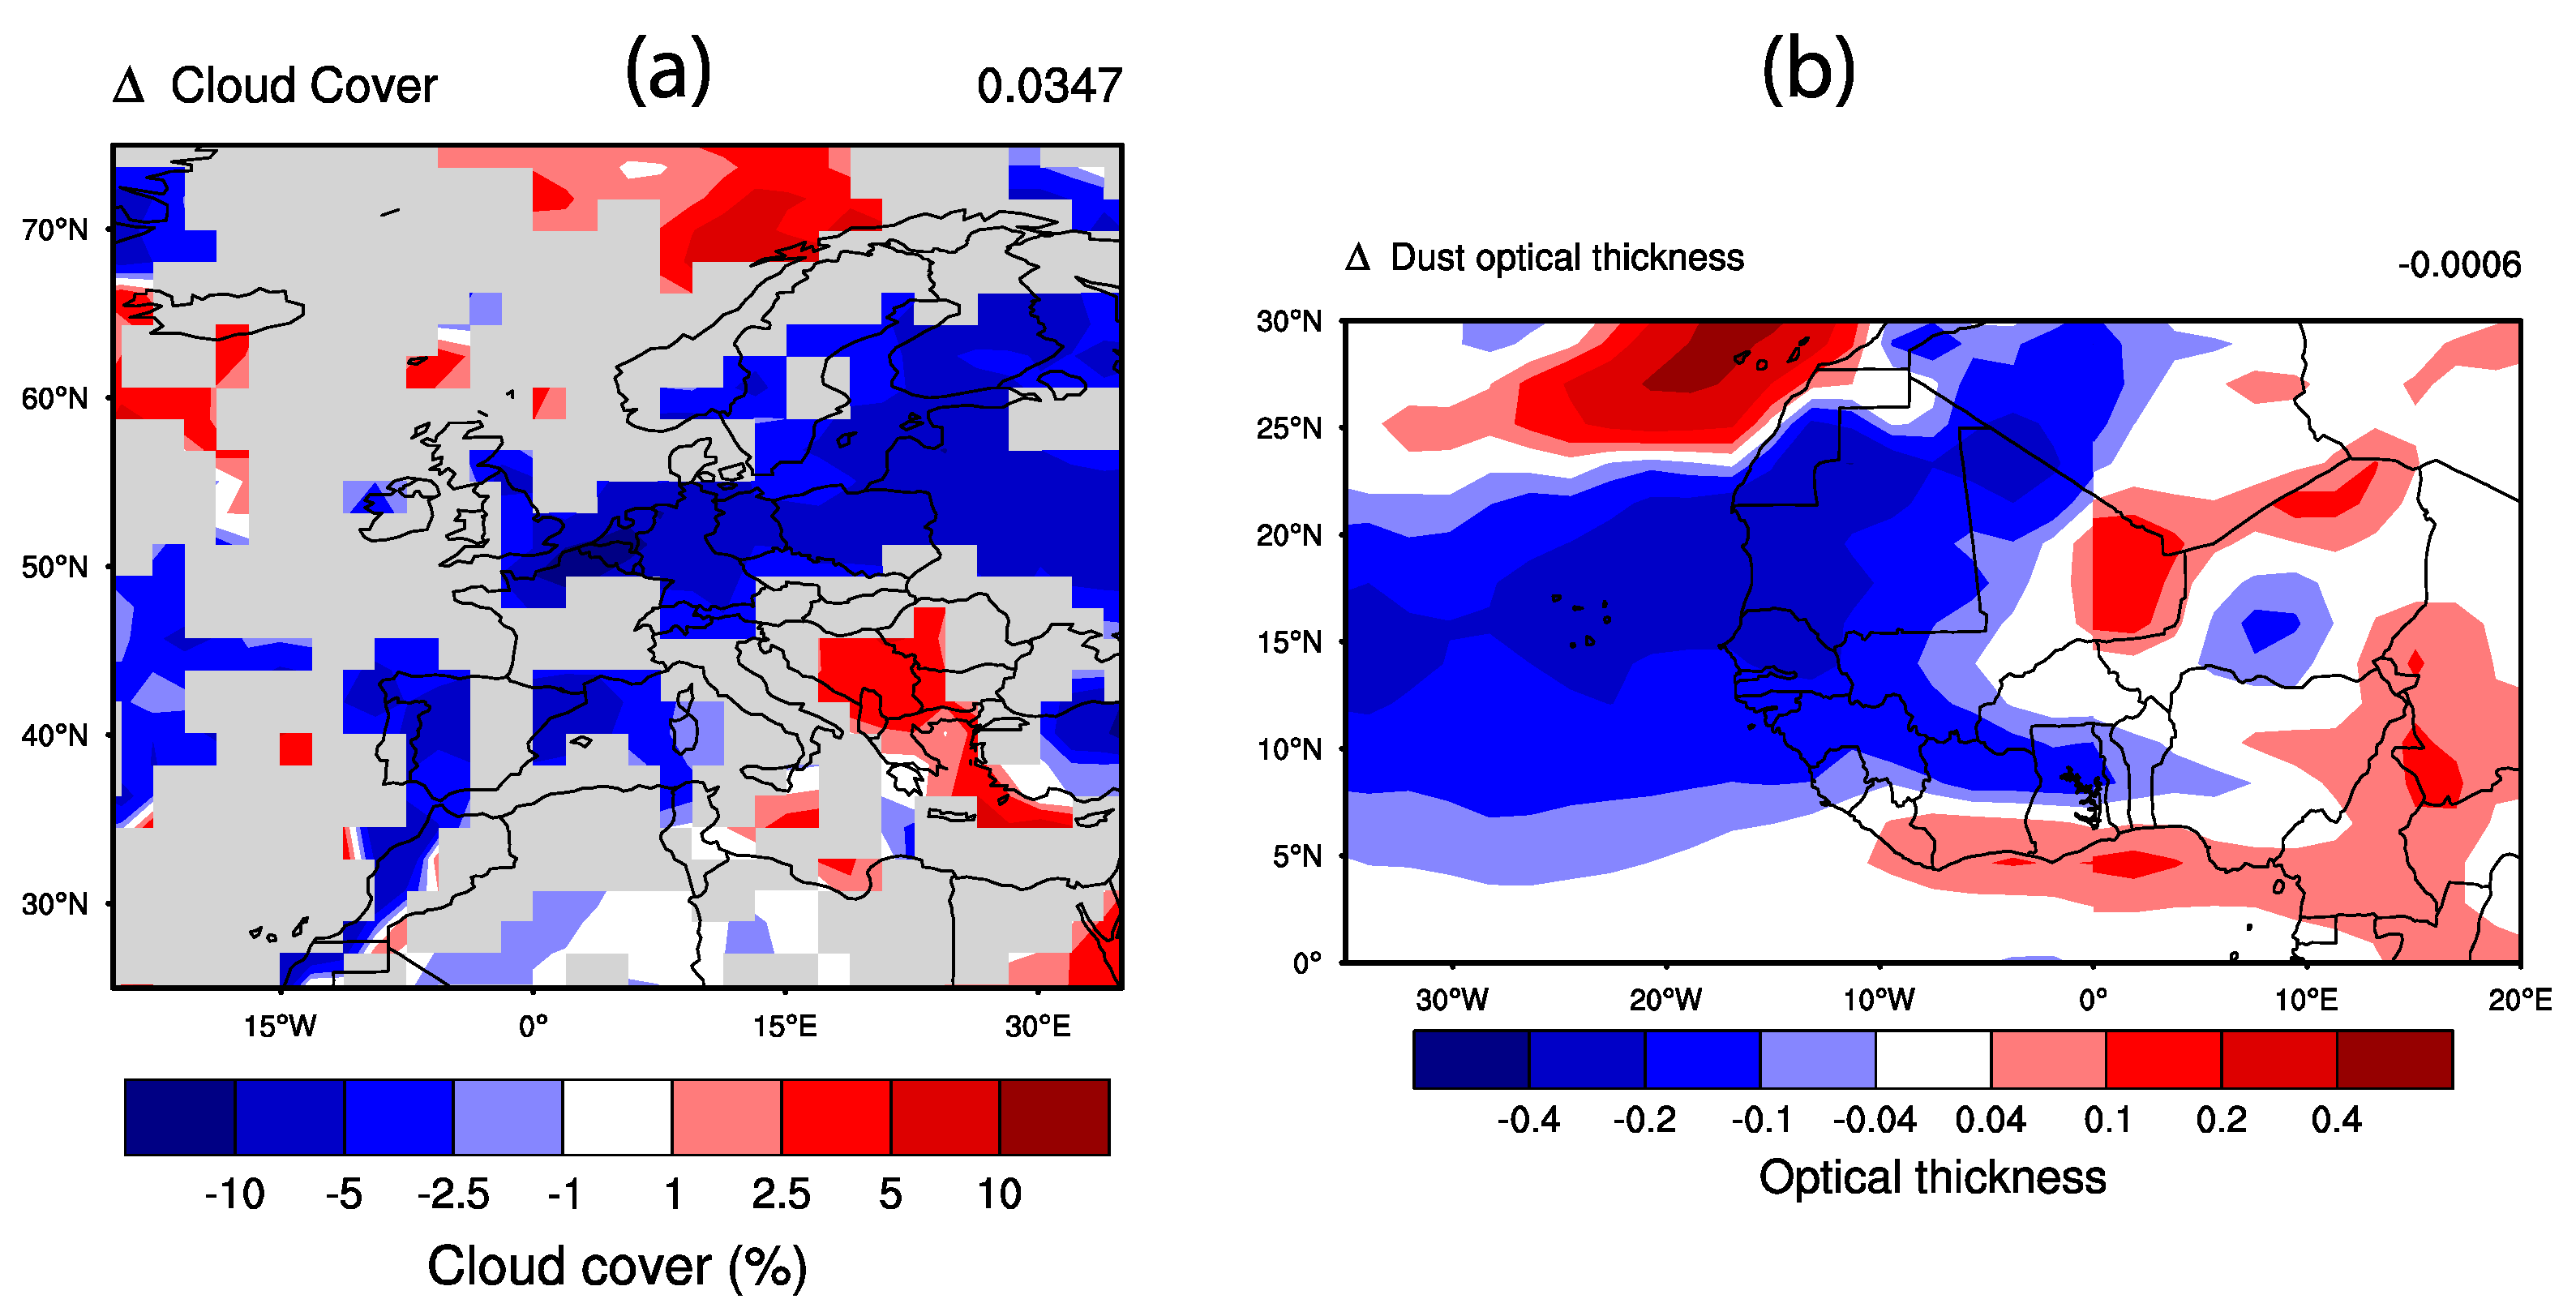
Meier et al. [19] investigated the role of anthropogenic absorbing aerosol in Europe for a period in July 2006, for which the aerosol distribution had been thoroughly tested. A positive semi-direct effect (+2.4 Wm−2) and reduction in cloud cover (1%) were simulated for the average of the area average due to absorbing aerosol. Locally, SDE as high as +6 Wm−2 and cloud reduction up to 4% was simulated with the regional model. The difference for the eight-year July average for the BASE and noBC simulations from the global model simulations are compared to the regional results. Overall in the European region the cloud cover in the month of July is reduced in central Europe (Figure 8a), with reductions between 5 and 10%. This is similar to the regional model result in the study by Meier et al. [19], even though the model setups were very different the specific meteorological conditions for 2006 that were simulated with the regional model are compared to a multi-year average in the global model.
A second example for a regional study of the radiative feedback of aerosol absorption on atmospheric dynamics is the study including the radiative dust and biomass burning smoke during the SAMUM2 experiment in 2008. Heinold et al. [21] simulated the atmospheric adjustment due to the dust and biomass smoke forcing in the Sahel and tropical Atlantic for the conditions during the field study with the COSMO-MUSCAT regional model. They found that in particular the absorption by biomass smoke led to an enhancement of the Hadley circulation and convergence along the Guinea coast. Dust export was reduced from the Sahara off the coast to the tropical Atlantic but enhanced over the Sahel and dust transport enhanced equator-wards. Differences in the dust AOD for the ECHAM6-HAM2 simulations BASE and noBC (Figure 8b) show similar qualitative changes in dust AOD resulting from the radiative effect of BC, with a reduction in Saharan dust and increase in dust from the Sahel region in the climatological mean for the month February. The dust AOD is increased by about 0.05 in the Sahel and the decreased in the Saharan desert by 0.2. These resulting changes are which is actually close to the results that Heinold et al. [21] simulated with the regional model.
While for these examples a qualitative agreement is achieved between the atmospheric response to the radiative effect of the absorbing aerosol, robust results would require improved model statistics by longer simulations or further experiments with a regional model.

4. Conclusions

Global semi-direct effects of BC aerosol from fossil fuel and biomass burning were simulated as residuals of the total direct radiative effect and the instantaneous direct forcing using the ECHAM6-HAM2 global aerosol climate model. While the resulting semi-direct effect as consequence of changes in cloud cover was overall positive, the SDE only about 20% compared to the IDR. The results fall within the range of earlier results on the overall semi-direct effects of anthropogenic aerosols, while here we focused on absorbing aerosols from both anthropogenic and natural sources.
The global average values of the effect of the absorbing aerosol are small due to averaging of both positive and negative values for radiative effects. The most robust regional feature for the semi-direct effect of absorbing aerosol is the positive effect evident in the biomass burning regions in the Sahel and central Africa where positive forcing of more than 5 Wm−2 occurs. This positive SDE is related to a reduction of cloud cover. Elsewhere, the semi-direct aerosol effect may be regionally positive or negative, and varies for different model setups.
The presence of dust impacts on the positive aerosol effects where BC from biomass smoke is transported above mineral dust-containing air layers. In effect, the reflective dust leads to an albedo increase of otherwise dark ocean surfaces and thus an enhancement of the positive radiative effect in regions downwind of major dust sources. This is for example the case in the tropical Atlantic region, where both biomass smoke and Saharan dust plumes are transported off the African continent in the northern hemisphere winter months. In this model study about 40% of the positive BC global annual mean IDR can be attributed to the presence of dust aerosol. Since as known from paleoclimate records dust loads may considerably change in different climates, possible future increases or decreases in dust export from desert regions due to changes in vegetation cover or dust-producing wind system may have considerable impacts on TOA forcing by absorbing BC aerosol.
The results on the semi-direct aerosol effects may be dependent on the model resolution. Not only cloud cover, but also dust aerosol that is sensitive to surface winds, may change at higher model resolutions. In particular it cannot be excluded that the response to heating rate changes of cloud coverage is dependent on model resolution. The repetition of the model experiments with resolution of T106 or higher is beyond the scope of this study, but should be addressed in future work. As a substitute for such high-resolved global model investigations the results of individual earlier regional studies using a spatial resolution of 28 km show surprising agreement in specific features presented such as the positive semi-direct aerosol effect in Europe in the summer months.
Overall there is cancellation of positive and negative effects resulting from different responses of cloud cover in different regimes. Additionally, the model variability is high, which makes the results uncertain. An improvement of the significance of the results would be desirable by making longer simulations to reduce those uncertainties.
The global model simulations were performed with fixed sea surface temperatures as boundary condition. To understand the response of the full climate system to the heating rate changes by the absorbing aerosols, simulations with a fully coupled aerosol-climate Earth system model should be performed that includes consideration of sea surface temperature changes. Still, the results provide insights into the rapid adjustment of atmospheric conditions to absorbing aerosol forcing.

Author Contributions

Conceptualization: I.T. and B.H.; formal analysis: I.T.; investigation: I.T.; methodology: I.T.; software: B.H.; visualization: I.T. and B.H.; writing—original draft: I.T.

Funding

This research received no external funding.

Acknowledgments

The authors are grateful for computing resources granted at DKRZ. The ECHAM-HAMMOZ model is developed by a consortium composed of ETH Zurich, Max Planck Institut für Meteorologie, Forschungszentrum Jülich, University of Oxford, the Finnish Meteorological Institute and the Leibniz Institute for Tropospheric Research, and managed by the Center for Climate Systems Modeling (C2SM) at ETH Zurich.

Conflicts of Interest

The authors declare no conflict of interest.

References

  1. Heald, C.L.; Ridley, D.A.; Kroll, J.H.; Barrett, S.R.H.; Cady-Pereira, K.E.; Alvarado, M.J.; Holmes, C.D. Contrasting the direct radiative effect and direct radiative forcing of aerosols. Atmos. Chem. Phys. 2014, 14, 5513–5527. [Google Scholar] [CrossRef] [Green Version]
  2. Intergovernmental Panel on Climate Change (IPCC). Climate Change 2013: The Physical Science Basis. Contribution of Working Group I to the Fifth Assessment Report of the Intergovernmental Panel on Climate Change; Cambridge University Press: Cambridge, UK; New York, NY, USA, 2013; p. 1535. [Google Scholar]
  3. Myhre, G.; Samset, B.H.; Schulz, M.; Balkanski, Y.; Bauer, S.; Berntsen, T.K.; Bian, H.; Bellouin, N.; Chin, M.; Diehl, T.; et al. Radiative forcing of the direct aerosol effect from aerocom phase ii simulations. Atmos. Chem. Phys. 2013, 13, 1853–1877. [Google Scholar] [CrossRef]
  4. Bond, T.C.; Doherty, S.J.; Fahey, D.W.; Forster, P.M.; Berntsen, T.; De Angelo, B.J.; Flanner, M.G.; Ghan, S.; Kärcher, B.; Koch, D.; et al. Bounding the role of black carbon in the climate system: A scientific assessment. J. Geophys. Res. Atmos. 2013, 118, 5380–5552. [Google Scholar] [CrossRef] [Green Version]
  5. Lamarque, J.F.; Bond, T.C.; Eyring, V.; Granier, C.; Heil, A.; Klimont, Z.; Lee, D.; Liousse, C.; Mieville, A.; Owen, B.; et al. Historical (1850–2000) gridded anthropogenic and biomass burning emissions of reactive gases and aerosols: Methodology and application. Atmos. Chem. Phys. 2010, 10, 7017–7039. [Google Scholar] [CrossRef] [Green Version]
  6. Tesche, M.; Ansmann, A.; Müller, D.; Althausen, D.; Engelmann, R.; Freudenthaler, V.; Groß, S. Vertically resolved separation of dust and smoke over cape verde using multiwavelength raman and polarization lidars during saharan mineral dust experiment 2008. J. Geophys. Res. Atmos. 2009, 114. [Google Scholar] [CrossRef]
  7. Huang, J.; Guo, J.; Wang, F.; Liu, Z.; Jeong, M.J.; Yu, H.; Zhang, Z. Calipso inferred most probable heights of global dust and smoke layers. J. Geophys. Res. Atmos. 2015, 120, 5085–5100. [Google Scholar] [CrossRef]
  8. Ginoux, P.; Prospero, J.M.; Gill, T.E.; Hsu, N.C.; Zhao, M. Global-scale attribution of anthropogenic and natural dust sources and their emission rates based on modis deep blue aerosol products. Rev. Geophys. 2012, 50. [Google Scholar] [CrossRef]
  9. Kippertz, P.; Stuut, J.B.W. Introduction to ‘mineral dust—A key player in the earth system’. In Mineral Dust: A Key Player in the Earth System Dordrecht; Knippertz, P., Ed.; Springer Science + Business Media: Berlin, Germany, 2014; pp. 1–14. [Google Scholar]
  10. Highwood, E.J.; Ryder, C.L. Radiative effects of dust. In Mineral Dust: A Key Player in the Earth System; Knippertz, P., Stuut, J.-B.W., Eds.; Springer: Dordrecht, The Netherlands, 2014; pp. 267–286. [Google Scholar]
  11. Lacis, A.A.; Mishchenko, M.I. Climate forcing, climate sensitivity, and climate response: A radiative modeling perspective on atmospheric aerosols. In Aerosol Forcing of Climate: Report of the Dahlem Workshop on Aerosol Forcing of Climate; Charlson, R.J., Heintzenberg, J., Eds.; John Wiley Sons: Chichester, UK; New York, NY, USA, 1994. [Google Scholar]
  12. Wendisch, M.; Hellmuth, O.; Ansmann, A.; Heintzenberg, J.; Engelmann, R.; Althausen, D.; Eichler, H.; Müller, D.; Hu, M.; Zhang, Y.; et al. Radiative and dynamic effects of absorbing aerosol particles over the Pearl River Delta, China. Atmos. Environ. 2008, 42, 6405–6416. [Google Scholar] [CrossRef]
  13. Ming, Y.; Ramaswamy, V. Nonlinear climate and hydrological responses to aerosol effects. J. Clim. 2009, 22, 1329–1339. [Google Scholar] [CrossRef]
  14. Koch, D.; Del Genio, A.D. Black carbon semi-direct effects on cloud cover: Review and synthesis. Atmos. Chem. Phys. 2010, 10, 7685–7696. [Google Scholar] [CrossRef] [Green Version]
  15. Hansen, J.E.; Sato, M.; Ruedy, R. Radiative forcing and climate response. J. Geophys. Res. Atmos. 1997, 102, 6831–6864. [Google Scholar] [CrossRef] [Green Version]
  16. Huang, J.; Wang, T.; Wang, W.; Li, Z.; Yan, H. Climate effects of dust aerosols over east asian arid and semiarid regions. J. Geophys. Res. Atmos. 2014, 119, 11398–11416. [Google Scholar] [CrossRef]
  17. Perlwitz, J.; Miller, R.L. Cloud cover increase with increasing aerosol absorptivity: A counterexample to the conventional semidirect aerosol effect. J. Geophys. Res. Atmos. 2010, 115. [Google Scholar] [CrossRef] [Green Version]
  18. Wolke, R.; Schröder, W.; Schrödner, R.; Renner, E. Influence of grid resolution and meteorological forcing on simulated european air quality: A sensitivity study with the modeling system cosmo-muscat. Atmos. Environ. 2012, 53, 110–130. [Google Scholar] [CrossRef]
  19. Meier, J.; Tegen, I.; Heinold, B.; Wolke, R. Direct and semi-direct radiative effects of absorbing aerosols in Europe: Results from a regional model. Geophys. Res. Lett. 2012, 39. [Google Scholar] [CrossRef] [Green Version]
  20. Ansmann, A.; Petzold, A.; Kandler, K.; Tegen, I.N.A.; Wendisch, M.; Müller, D.; Weinzierl, B.; Müller, T.; Heintzenberg, J. Saharan mineral dust experiments samum–1 and samum–2: What have we learned? Tellus B 2011, 63, 403–429. [Google Scholar] [CrossRef] [Green Version]
  21. Heinold, B.; Tegen, I.; Bauer, S.; Wendisch, M. Regional modelling of saharan dust and biomass-burning smoke. Tellus B 2011, 63, 800–813. [Google Scholar] [CrossRef]
  22. Ghan, S.J.; Liu, X.; Easter, R.C.; Zaveri, R.; Rasch, P.J.; Yoon, J.-H.; Eaton, B. Toward a minimal representation of aerosols in climate models: Comparative decomposition of aerosol direct, semidirect, and indirect radiative forcing. J. Clim. 2012, 25, 6461–6476. [Google Scholar] [CrossRef]
  23. Bauer, S.E.; Menon, S. Aerosol direct, indirect, semidirect, and surface albedo effects from sector contributions based on the IPCC AR5 emissions for preindustrial and present-day conditions. J. Geophys. Res. Atmos. 2012, 117. [Google Scholar] [CrossRef] [Green Version]
  24. Schmidt, G.A.; Ruedy, R.; Hansen, J.E.; Aleinov, I.; Bell, N.; Bauer, M.; Bauer, S.; Cairns, B.; Canuto, V.; Cheng, Y.; et al. Present-day atmospheric simulations using giss modele: Comparison to in situ, satellite, and reanalysis data. J. Clim. 2006, 19, 153–192. [Google Scholar] [CrossRef]
  25. Stevens, B.; Giorgetta, M.; Esch, M.; Mauritsen, T.; Crueger, T.; Rast, S.; Salzmann, M.; Schmidt, H.; Bader, J.; Block, K.; et al. Atmospheric component of the mpi-m earth system model: Echam6. J. Adv. Model. Earth Syst. 2013, 5, 146–172. [Google Scholar] [CrossRef]
  26. Schultz, M.G.; Stadtler, S.; Schröder, S.; Taraborrelli, D.; Franco, B.; Krefting, J.; Henrot, A.; Ferrachat, S.; Lohmann, U.; Neubauer, D.; et al. The chemistry-climate model echam6.3-ham2.3-moz1.0. Geosci. Model Dev. 2018, 11, 1695–1723. [Google Scholar] [CrossRef]
  27. Lin, S.-J.; Rood, R.B. Multidimensional flux-form semi-lagrangian transport schemes. Mon. Weather Rev. 1996, 124, 2046–2070. [Google Scholar] [CrossRef]
  28. Sundqvist, H.; Berge, E.; Kristjánsson, J.E. Condensation and cloud parameterization studies with a mesoscale numerical weather prediction model. Mon. Weather Rev. 1989, 117, 1641–1657. [Google Scholar] [CrossRef]
  29. Lohmann, U.; Roeckner, E. Design and performance of a new cloud microphysics scheme developed for the echam general circulation model. Clim. Dyn. 1996, 12, 557–572. [Google Scholar] [CrossRef]
  30. Iacono, M.J.; Delamere, J.; Mlawer, E.J.; Shephard, M.W.; Clough, S.A.; Collins, W.D. Radiative forcing by long-lived greenhouse gases: Calculations with the aer radiative transfer models. J. Geophys. Res. Atmos. 2008, 113. [Google Scholar] [CrossRef]
  31. Lohmann, U.; Salzen, K.; McFarlane, N.; Leighton, H.G.; Feichter, J. Tropospheric sulfur cycle in the canadian general circulation model. J. Geophys. Res. Atmos. 1999, 104, 26833–26858. [Google Scholar] [CrossRef]
  32. Abdul-Razzak, H.; Ghan, S.J. A parameterization of aerosol activation: 2. Multiple aerosol types. J. Geophys. Res. Atmos. 2000, 105, 6837–6844. [Google Scholar] [CrossRef] [Green Version]
  33. Val Martin, M.; Logan, J.A.; Kahn, R.A.; Leung, F.Y.; Nelson, D.L.; Diner, D.J. Smoke injection heights from fires in North America: Analysis of 5 years of satellite observations. Atmos. Chem. Phys. 2010, 10, 1491–1510. [Google Scholar] [CrossRef]
  34. Kaiser, J.W.; Heil, A.; Andreae, M.O.; Benedetti, A.; Chubarova, N.; Jones, L.; Morcrette, J.J.; Razinger, M.; Schultz, M.G.; Suttie, M.; et al. Biomass burning emissions estimated with a global fire assimilation system based on observed fire radiative power. Biogeosciences 2012, 9, 527–554. [Google Scholar] [CrossRef] [Green Version]
  35. Tegen, I.; Harrison, S.P.; Kohfeld, K.; Prentice, I.C.; Coe, M.; Heimann, M. Impact of vegetation and preferential source areas on global dust aerosol: Results from a model study. J. Geophys. Res. Atmos. 2002, 107, AAC 14-1–AAC 14-27. [Google Scholar] [CrossRef]
  36. Cheng, T.; Peng, Y.; Feichter, J.; Tegen, I. An improvement on the dust emission scheme in the global aerosol-climate model echam5-ham. Atmos. Chem. Phys. 2008, 8, 1105–1117. [Google Scholar] [CrossRef]
  37. Schepanski, K.; Tegen, I.; Macke, A. Comparison of satellite based observations of saharan dust source areas. Remote Sen. Environ. 2012, 123, 90–97. [Google Scholar] [CrossRef]
  38. Heinold, B.; Tegen, I.; Schepanski, K.; Banks, J.R. New developments in the representation of saharan dust sources in the aerosol-climate model echam6-ham2. Geosci. Model Dev. 2016, 9, 765–777. [Google Scholar] [CrossRef]
  39. Marticorena, B.; Bergametti, G. Modeling the atmospheric dust cycle: 1. Design of a soil-derived dust emission scheme. J. Geophys. Res. Atmos. 1995, 100, 16415–16430. [Google Scholar] [CrossRef]
  40. Stier, P.; Feichter, J.; Kinne, S.; Kloster, S.; Vignati, E.; Wilson, J.; Ganzeveld, L.; Tegen, I.; Werner, M.; Balkanski, Y.; et al. The aerosol-climate model echam5-ham. Atmos. Chem. Phys. 2005, 5, 1125–1156. [Google Scholar] [CrossRef]
  41. Long, M.S.; Keene, W.C.; Kieber, D.J.; Erickson, D.J.; Maring, H. A sea-state based source function for size- and composition-resolved marine aerosol production. Atmos. Chem. Phys. 2011, 11, 1203–1216. [Google Scholar] [CrossRef]
  42. Sofiev, M.; Soares, J.; Prank, M.; de Leeuw, G.; Kukkonen, J. A regional-to-global model of emission and transport of sea salt particles in the atmosphere. J. Geophys. Res. Atmos. 2011, 116. [Google Scholar] [CrossRef] [Green Version]
  43. Vignati, E.; Wilson, J.; Stier, P. M7: An efficient size-resolved aerosol microphysics module for large-scale aerosol transport models. J. Geophys. Res. Atmos. 2004, 109. [Google Scholar] [CrossRef] [Green Version]
  44. Kazil, J.; Stier, P.; Zhang, K.; Quaas, J.; Kinne, S.; O’Donnell, D.; Rast, S.; Esch, M.; Ferrachat, S.; Lohmann, U.; et al. Aerosol nucleation and its role for clouds and earth’s radiative forcing in the aerosol-climate model echam5-ham. Atmos. Chem. Phys. 2010, 10, 10733–10752. [Google Scholar] [CrossRef]
  45. Kinne, S.; Lohmann, U.; Feichter, J.; Schulz, M.; Timmreck, C.; Ghan, S.; Easter, R.; Chin, M.; Ginoux, P.; Takemura, T.; et al. Monthly averages of aerosol properties: A global comparison among models, satellite data, and aeronet ground data. J. Geophys. Res. Atmos. 2003, 108. [Google Scholar] [CrossRef]
  46. Zhang, K.; O’Donnell, D.; Kazil, J.; Stier, P.; Kinne, S.; Lohmann, U.; Ferrachat, S.; Croft, B.; Quaas, J.; Wan, H.; et al. The global aerosol-climate model echam-ham, version 2: Sensitivity to improvements in process representations. Atmos. Chem. Phys. 2012, 12, 8911–8949. [Google Scholar] [CrossRef]
  47. Stier, P.; Seinfeld, J.H.; Kinne, S.; Boucher, O. Aerosol absorption and radiative forcing. Atmos. Chem. Phys. 2007, 7, 5237–5261. [Google Scholar] [CrossRef]
  48. Bond, T.C.; Bergstrom, R.W. Light absorption by carbonaceous particles: An investigative review. Aerosol Sci. Technol. 2006, 40, 27–67. [Google Scholar] [CrossRef]
  49. Tegen, I.; Neubauer, D.; Ferrachat, S.; Siegenthaler-Le Drian, C.; Bey, I.; Schutgens, N.; Stier, P.; Watson-Parris, D.; Stanelle, T.; Schmidt, H.; et al. The aerosol-climate model echam6.3-ham2.3: Aerosol evaluation. Geosci. Model Dev. Discuss. 2018. submitted. [Google Scholar]
  50. Torres, O.; Tanskanen, A.; Veihelmann, B.; Ahn, C.; Braak, R.; Bhartia Pawan, K.; Veefkind, P.; Levelt, P. Aerosols and surface uv products from ozone monitoring instrument observations: An overview. J. Geophys. Res. Atmos. 2007, 112. [Google Scholar] [CrossRef]
  51. Buchard, V.; da Silva, A.M.; Colarco, P.R.; Darmenov, A.; Randles, C.A.; Govindaraju, R.; Torres, O.; Campbell, J.; Spurr, R. Using the omi aerosol index and absorption aerosol optical depth to evaluate the nasa merra aerosol reanalysis. Atmos. Chem. Phys. 2015, 15, 5743–5760. [Google Scholar] [CrossRef]
  52. Bellouin, N.; Quaas, J.; Morcrette, J.J.; Boucher, O. Estimates of aerosol radiative forcing from the macc re-analysis. Atmos. Chem. Phys. 2013, 13, 2045–2062. [Google Scholar] [CrossRef] [Green Version]
  53. Carlson, T.N.; Benjamin, S.G. Radiative heating rates for Saharan dust. J. Atmos. Sci. 1980, 37, 193–213. [Google Scholar] [CrossRef]
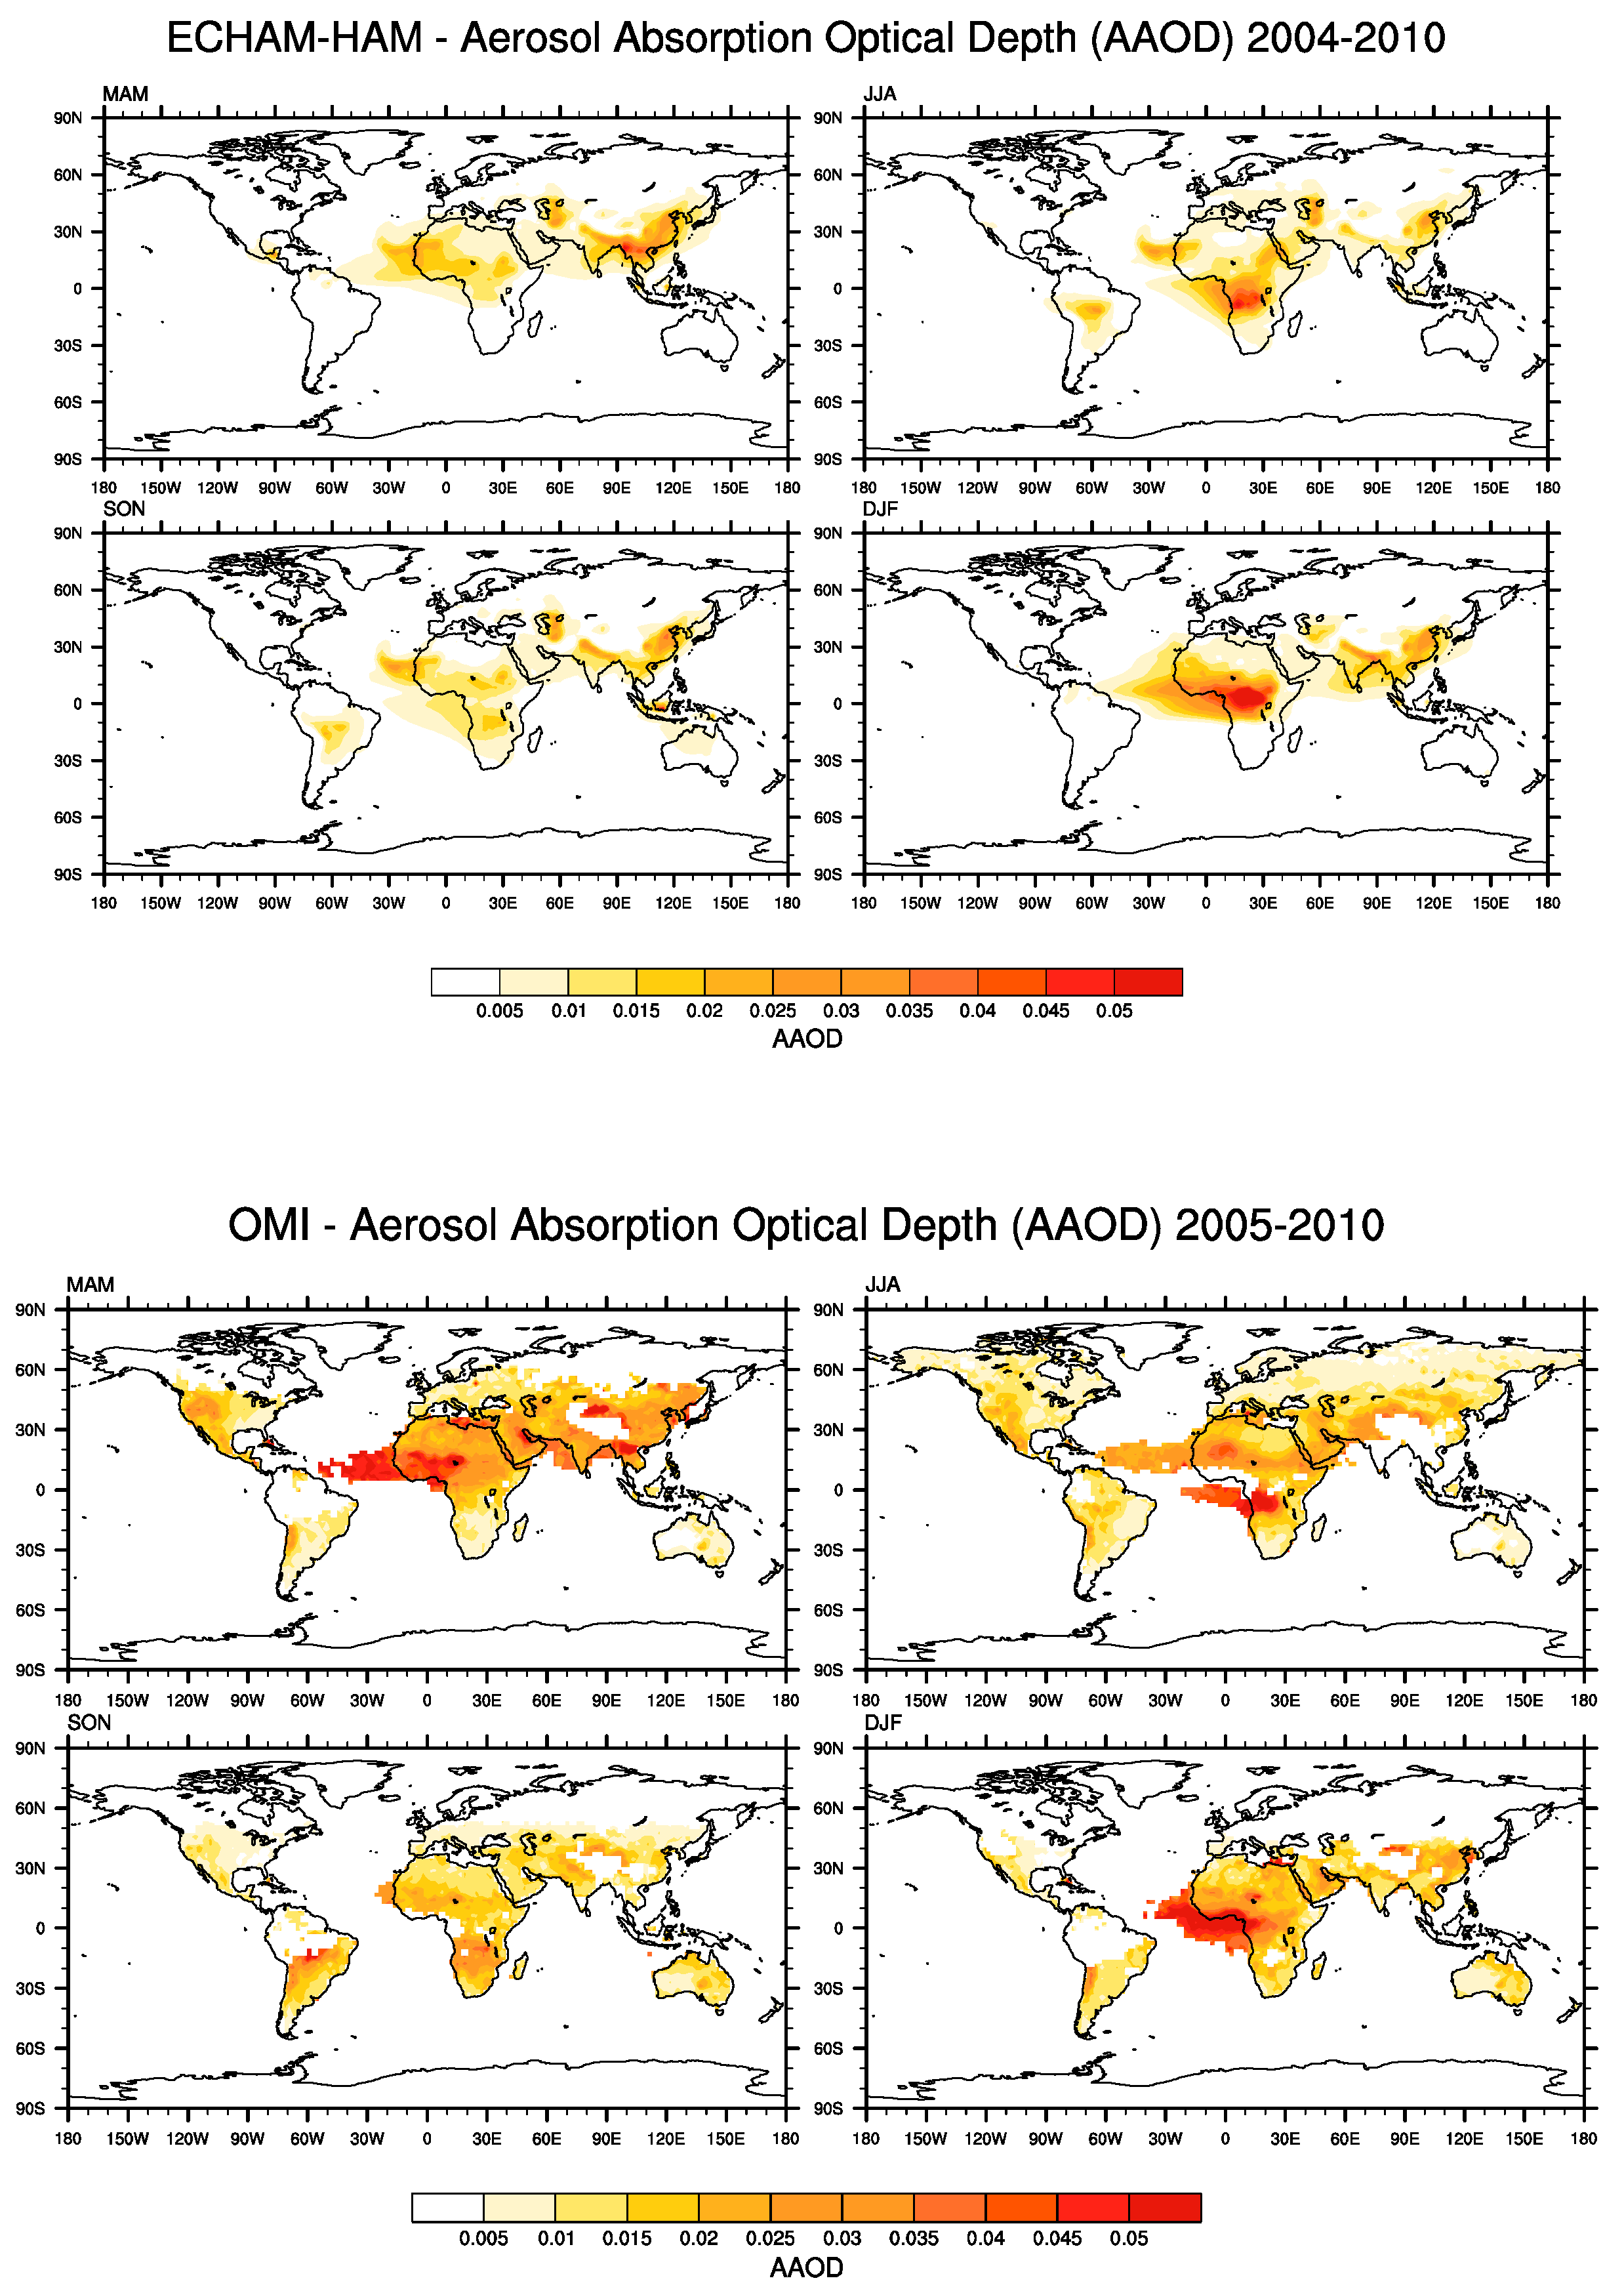
Figure 1. (Top four panels) Seasonal average of the absorbing aerosol optical depth (AAOD) distribution at 550 nm from the 8-year average BASE simulation. (Bottom four panels) Seasonal average of the absorbing aerosol optical depth distribution from the OMI AAOD satellite product at 500 nm, averaged for 2004 to 2010.
Atmosphere 09 00380 g001
Figure 2. Annual average of the absorbing aerosol optical depth (AAOD) distribution. (Top panel) OMI AAOD satellite product at 500 nm, averaged for 2004 to 2010. (Middle panel) Eight-year annual average BASE simulation results for AAOD at 550 nm. (Bottom panel) Eight-year annual average GFAS simulation results for AAOD at 550 nm.
Atmosphere 09 00380 g002
Figure 3. Zonal average instantaneous heating differences due to simulated BC (a,c) and dust aerosol (b,d), for January (a,b) and July (c,d). The results are computed as differences of the simulated heating rates from experiments BASE and noDust and noBC, respectively.
Atmosphere 09 00380 g003
Figure 4. (a) Direct radiative effect (DRE) of BC aerosol calculated from TOA radiative fluxes as difference of experiments BASE-noBC; (b) instantaneous radiative effect (IDR) calculated as (a) but excluding changes in cloud cover by BC forcing via double call to the radiation scheme in the model, and (c) semi-direct effect (SDE) at the top of atmosphere in Wm−2 calculated as DRE-IDR. (d): as (c), for the GFAS simulation. Grey areas indicate regions where the results are not statistically significant at 95% level.
Atmosphere 09 00380 g004
Figure 5. Scatterplot of model results of annual averaged BC TOA SDE in relation to cloud cover changes for the differences of the simulations BASE and noBC. Results from model grid cells that are statistically significant at 95% levels are plotted in dark blue, results from grid cells with results with statistical significance below 95% are plotted in light blue.
Atmosphere 09 00380 g005
Figure 6. (a) Direct radiative effect (DRE) of BC aerosol calculated from TOA radiative fluxes as difference of experiments noDUST–noABS; (b) instantaneous radiative effect (IDR) calculated as (a) but excluding changes in cloud cover by BC forcing via double call to the radiation scheme in the model, and (c) semi-direct effect (SDE) at the top of atmosphere in Wm−2 calculated as DRE-IDR. (d): as (c), for the GFAS simulation. Grey areas indicate regions where the results are not statistically significant at 95% level.
Atmosphere 09 00380 g006
Figure 7. Scatterplot of model results of annual averaged BC TOA SDE in relation to cloud cover changes for the differences of the simulations noDUST and noABS. Results from model grid cells that are statistically significant at 95% levels are plotted in dark blue, results from grid cells with results with statistical significance below 95% are plotted in light blue.
Atmosphere 09 00380 g007
Figure 8. (a) Simulated 8-year averaged differences in cloud cover in the European region in July resulting from the BC radiative effect; and (b) differences in dust optical thicknesses in eight-year average February conditions. Both results are based on the differences of results for BASE and noBC.
Atmosphere 09 00380 g008
Table 1. List of model experiments, summarizing the included aerosol species and information whether aerosol-radiation and aerosol-cloud activation is computed prognostically using the simulated aerosol distributions. In the experiment GFAS the aerosol emissions from fires are computed using the GFAS dataset [34], all other cases are simulated with ACCMIP emissions.
ExperimentAerosol TypesAerosol-Radiation InteractionAerosol-Cloud Interaction
BASEAllyesno
GFASAllyesno
noBCno BCyesno
noABSno BC, no dustyesno
noDustNo dustyesno
BASEind allyesyes
noBCindno BCyesyes
NoAerallnono
Table 2. Results of the global annual average top-of-atmosphere direct radiative effect (DRE), instantaneous direct radiative effect (IDR) and semi-direct radiative effect (SDE) computed from pairs of model simulations (see Table 1). Additionally, results for solar (SW) and thermal (LW) parts of the spectrum are provided, as well as total cloud cover changes. All model grid cells are considered for the averages.
SimulationDREIDRSDE (Net)SDE (SW)SDE (LW)Cloud Cover
Wm−2Wm−2Wm−2Wm−2Wm−2%
BASE−noAER−1.13 (0.45)−1.22 (0.05)0.08 (0.45)0.08 (0.57)0.01 (0.47)−0.01 (0.40)
BASE−noBC0.51 (0.47)0.42 (0.06)0.09 (0.47)0.19 (0.58)−0.10 (0.49)−0.25 (0.41)
GFAS-noBC0.62 (0.46)0.36 (0.04)0.26 ((0.47)0.43 (0.58)-0.16 (0.50)-0.27 (0.10)
noDUST−noABS0.24 (0.46)0.27 (0.01)−0.03 (0.46)−0.03 (0.57)0.00 (0.50)−0.08 (0.41)
BASEind−noBCind0.46 (0.47)0.41 (0.04)−0.05 (0.47)−0.16 (0.58)−0.12 (0.49)−0.12 (0.32)
Numbers in brackets are standard deviations based on results for individual model years.