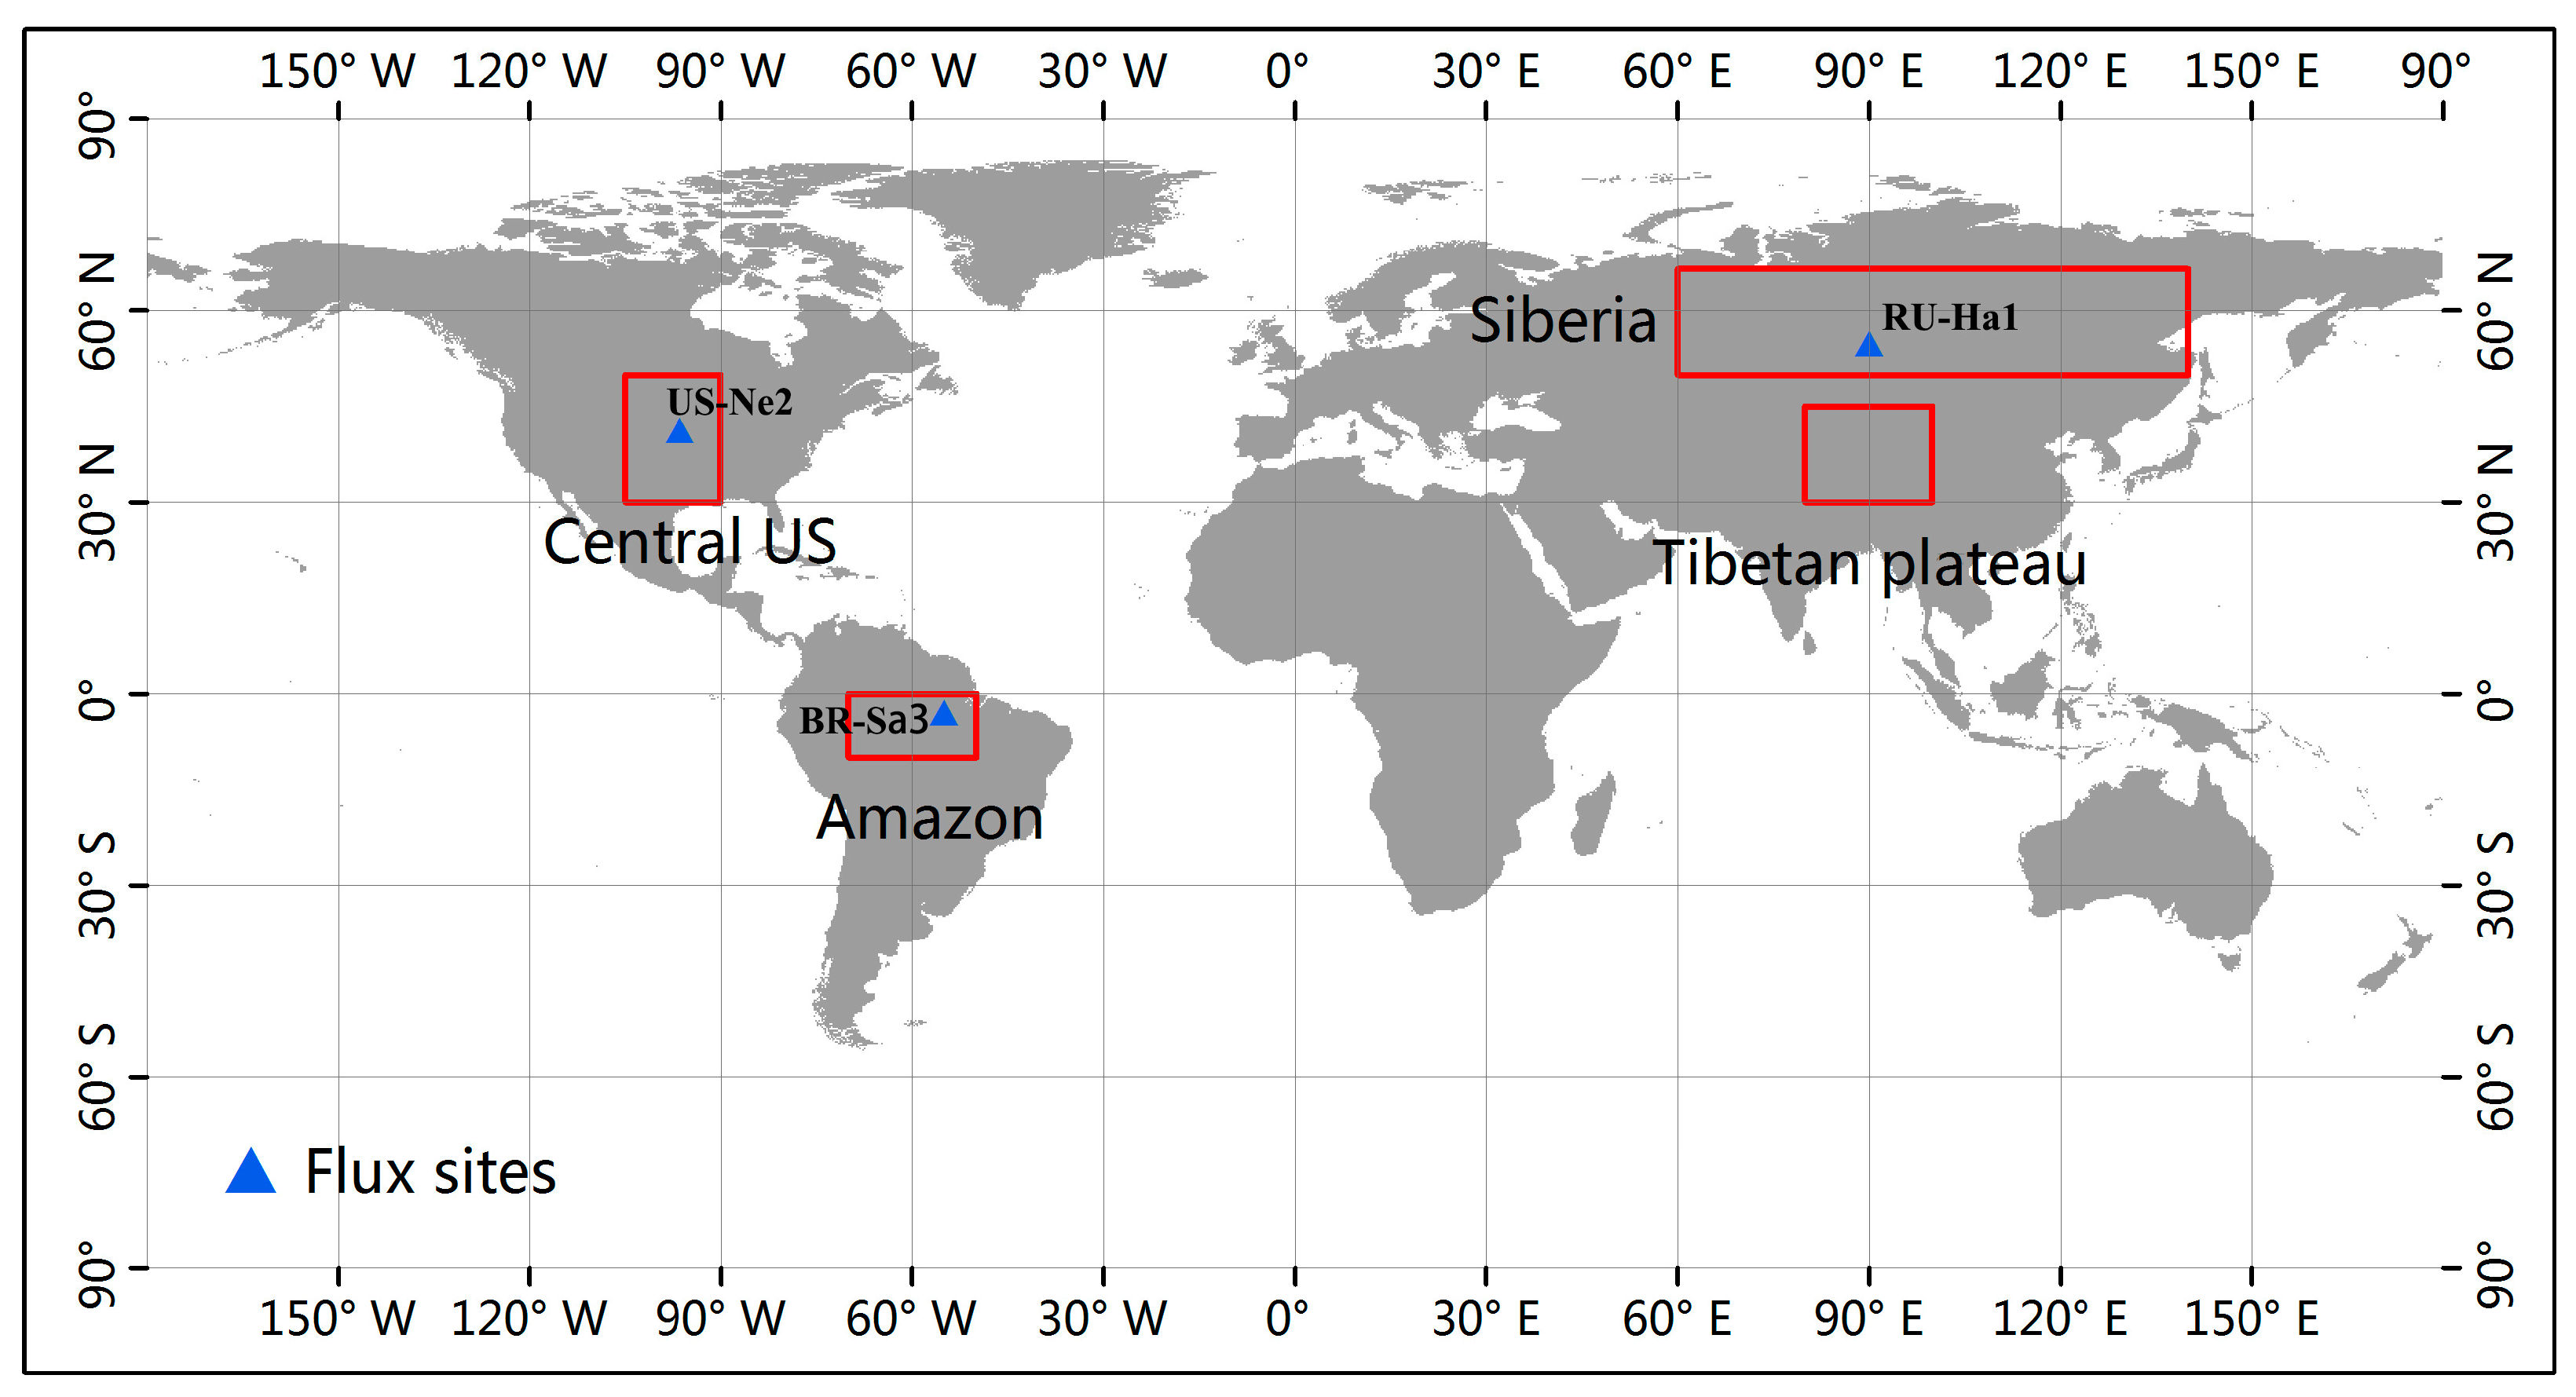
Figure 1.
Locations of the four focus regions (Amazon, Central US, Siberia and Tibetan Plateau) and three flux sites (BR-Sa3, RU-Ha1 and US-Ne2).
Figure 1.
Locations of the four focus regions (Amazon, Central US, Siberia and Tibetan Plateau) and three flux sites (BR-Sa3, RU-Ha1 and US-Ne2).
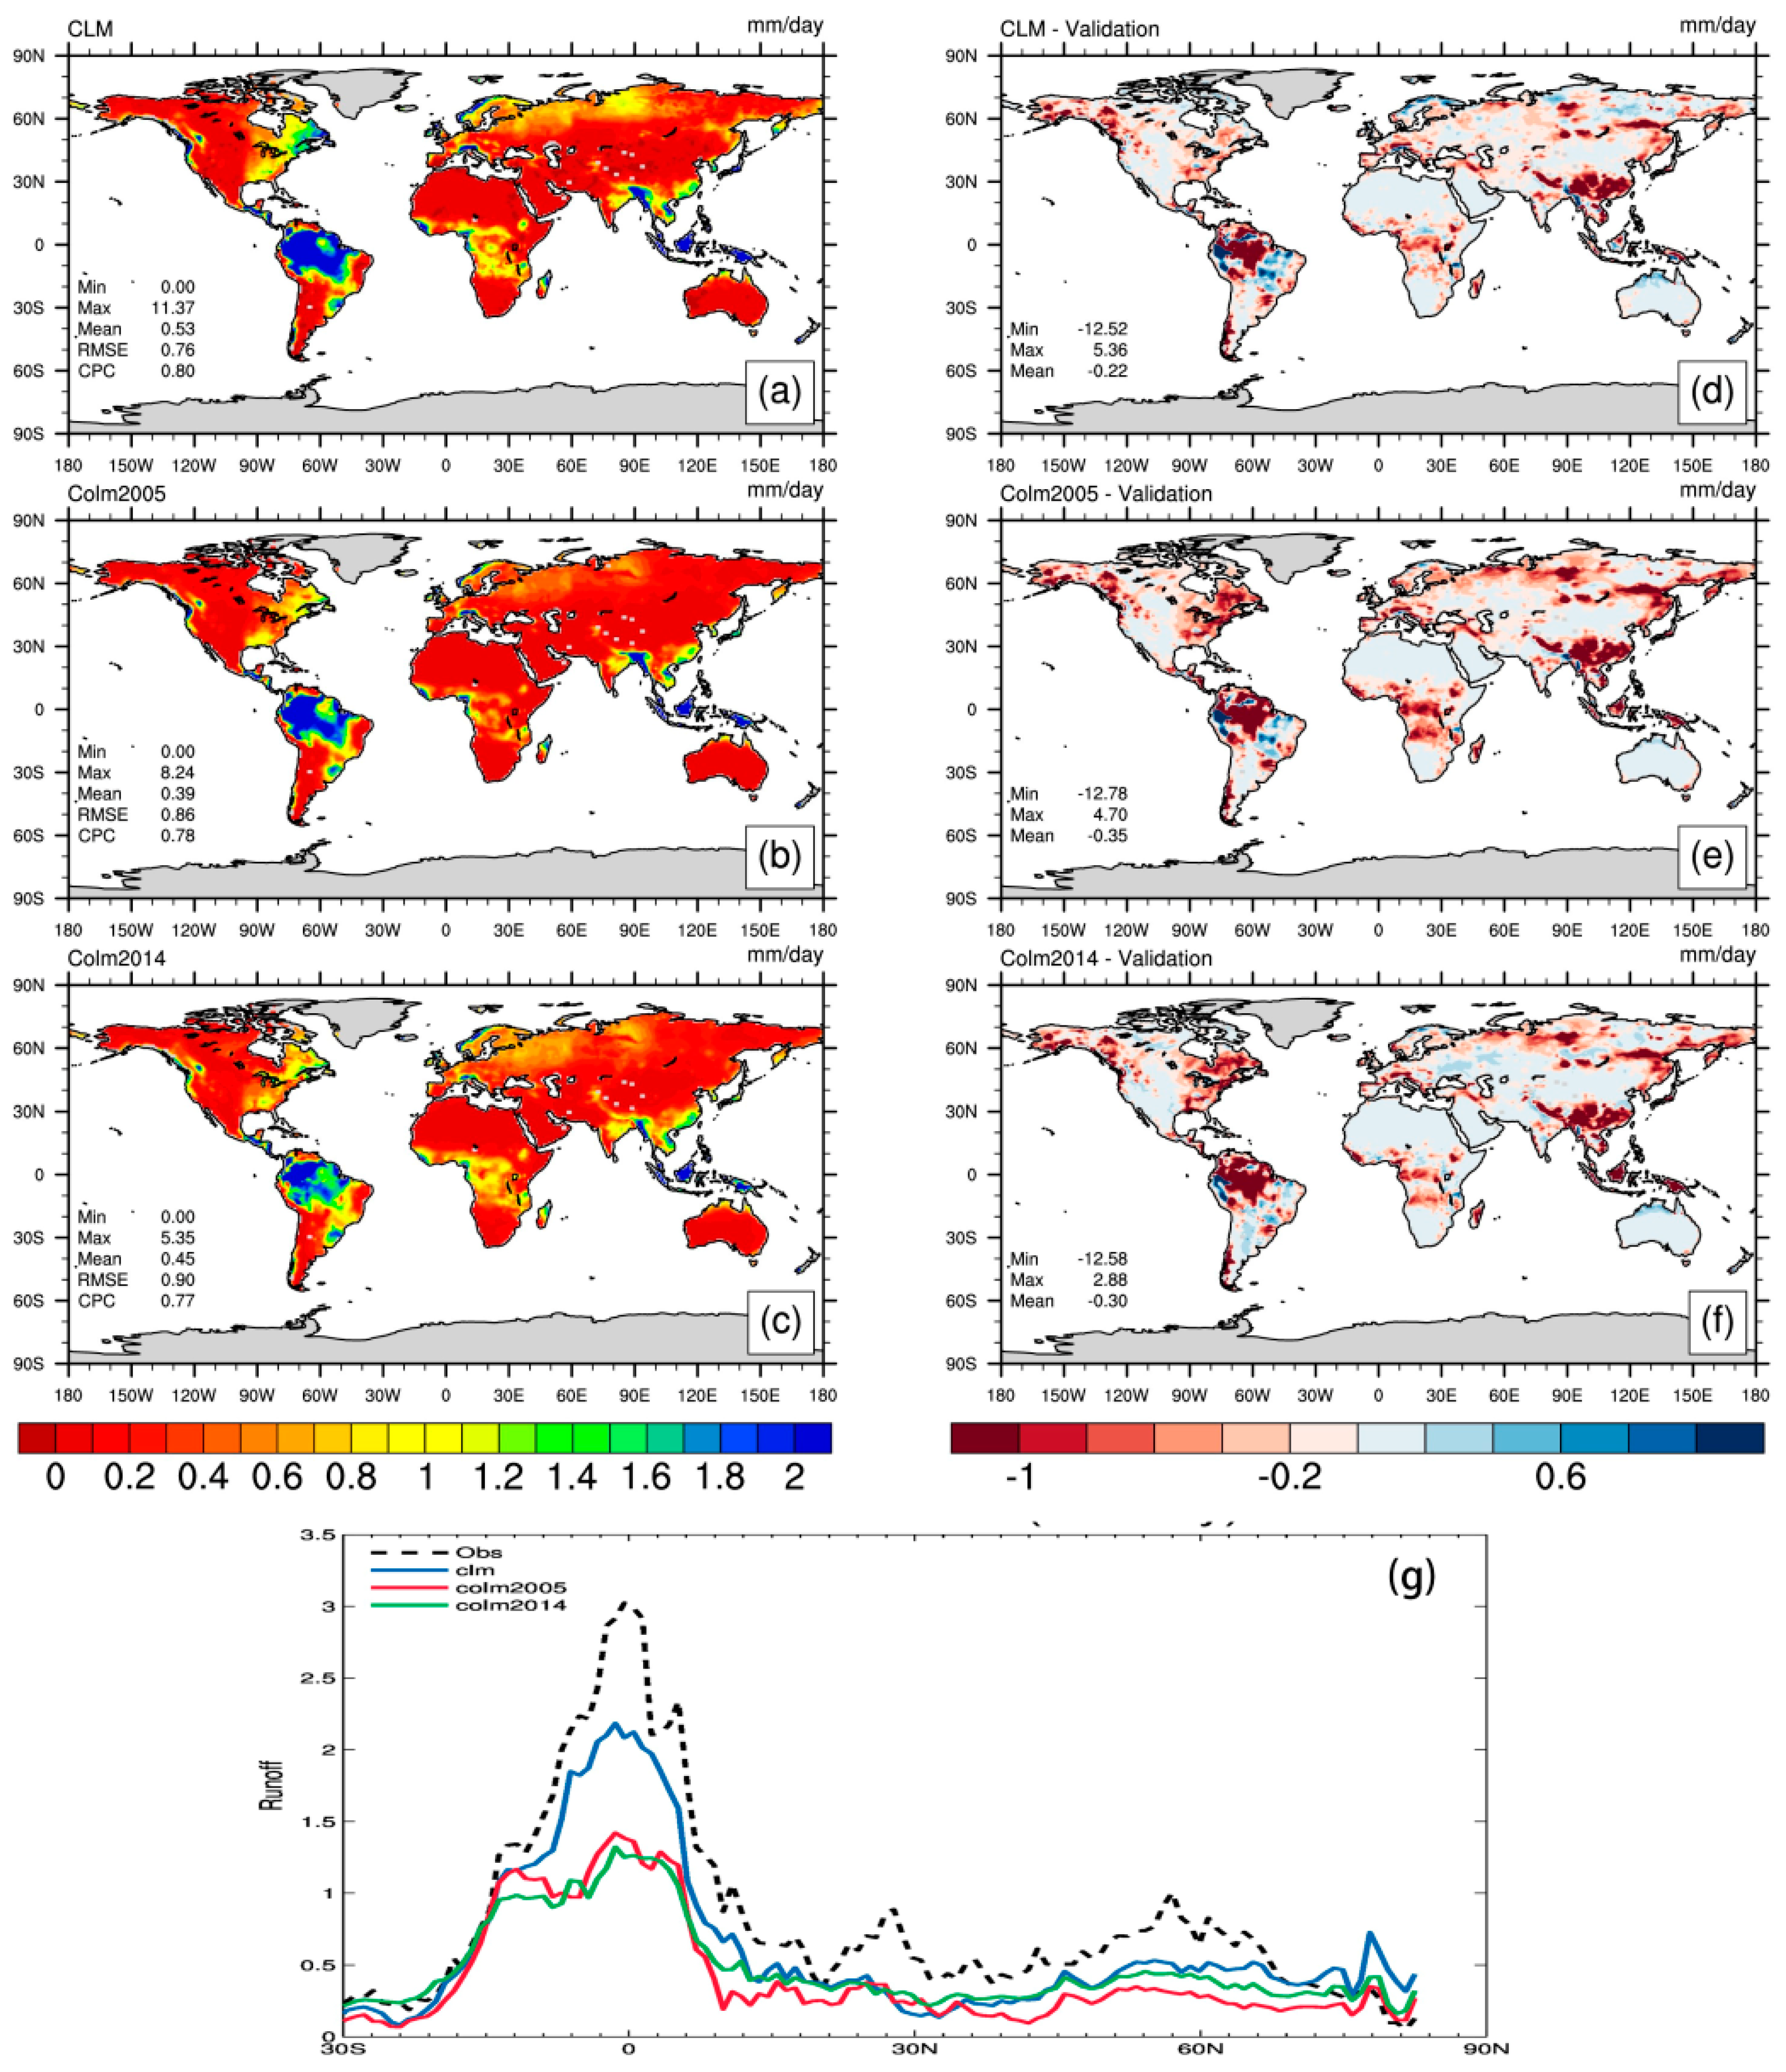
Figure 2.
Annual mean spatial distributions of total runoff simulated by (a) CLM4.5; (b) CoLM2005; and (c) CoLM2014; Along with spatial distributions of biases relative to the validation standard for (d) CLM4.5; (e) CoLM2005; and (f) CoLM2014; Panel (g) shows zonal mean total runoff from validation observations (black dashed line) and the CLM4.5 (blue), CoLM2005 (red), and CoLM2014 (green) simulations. (Units: mm day−1).
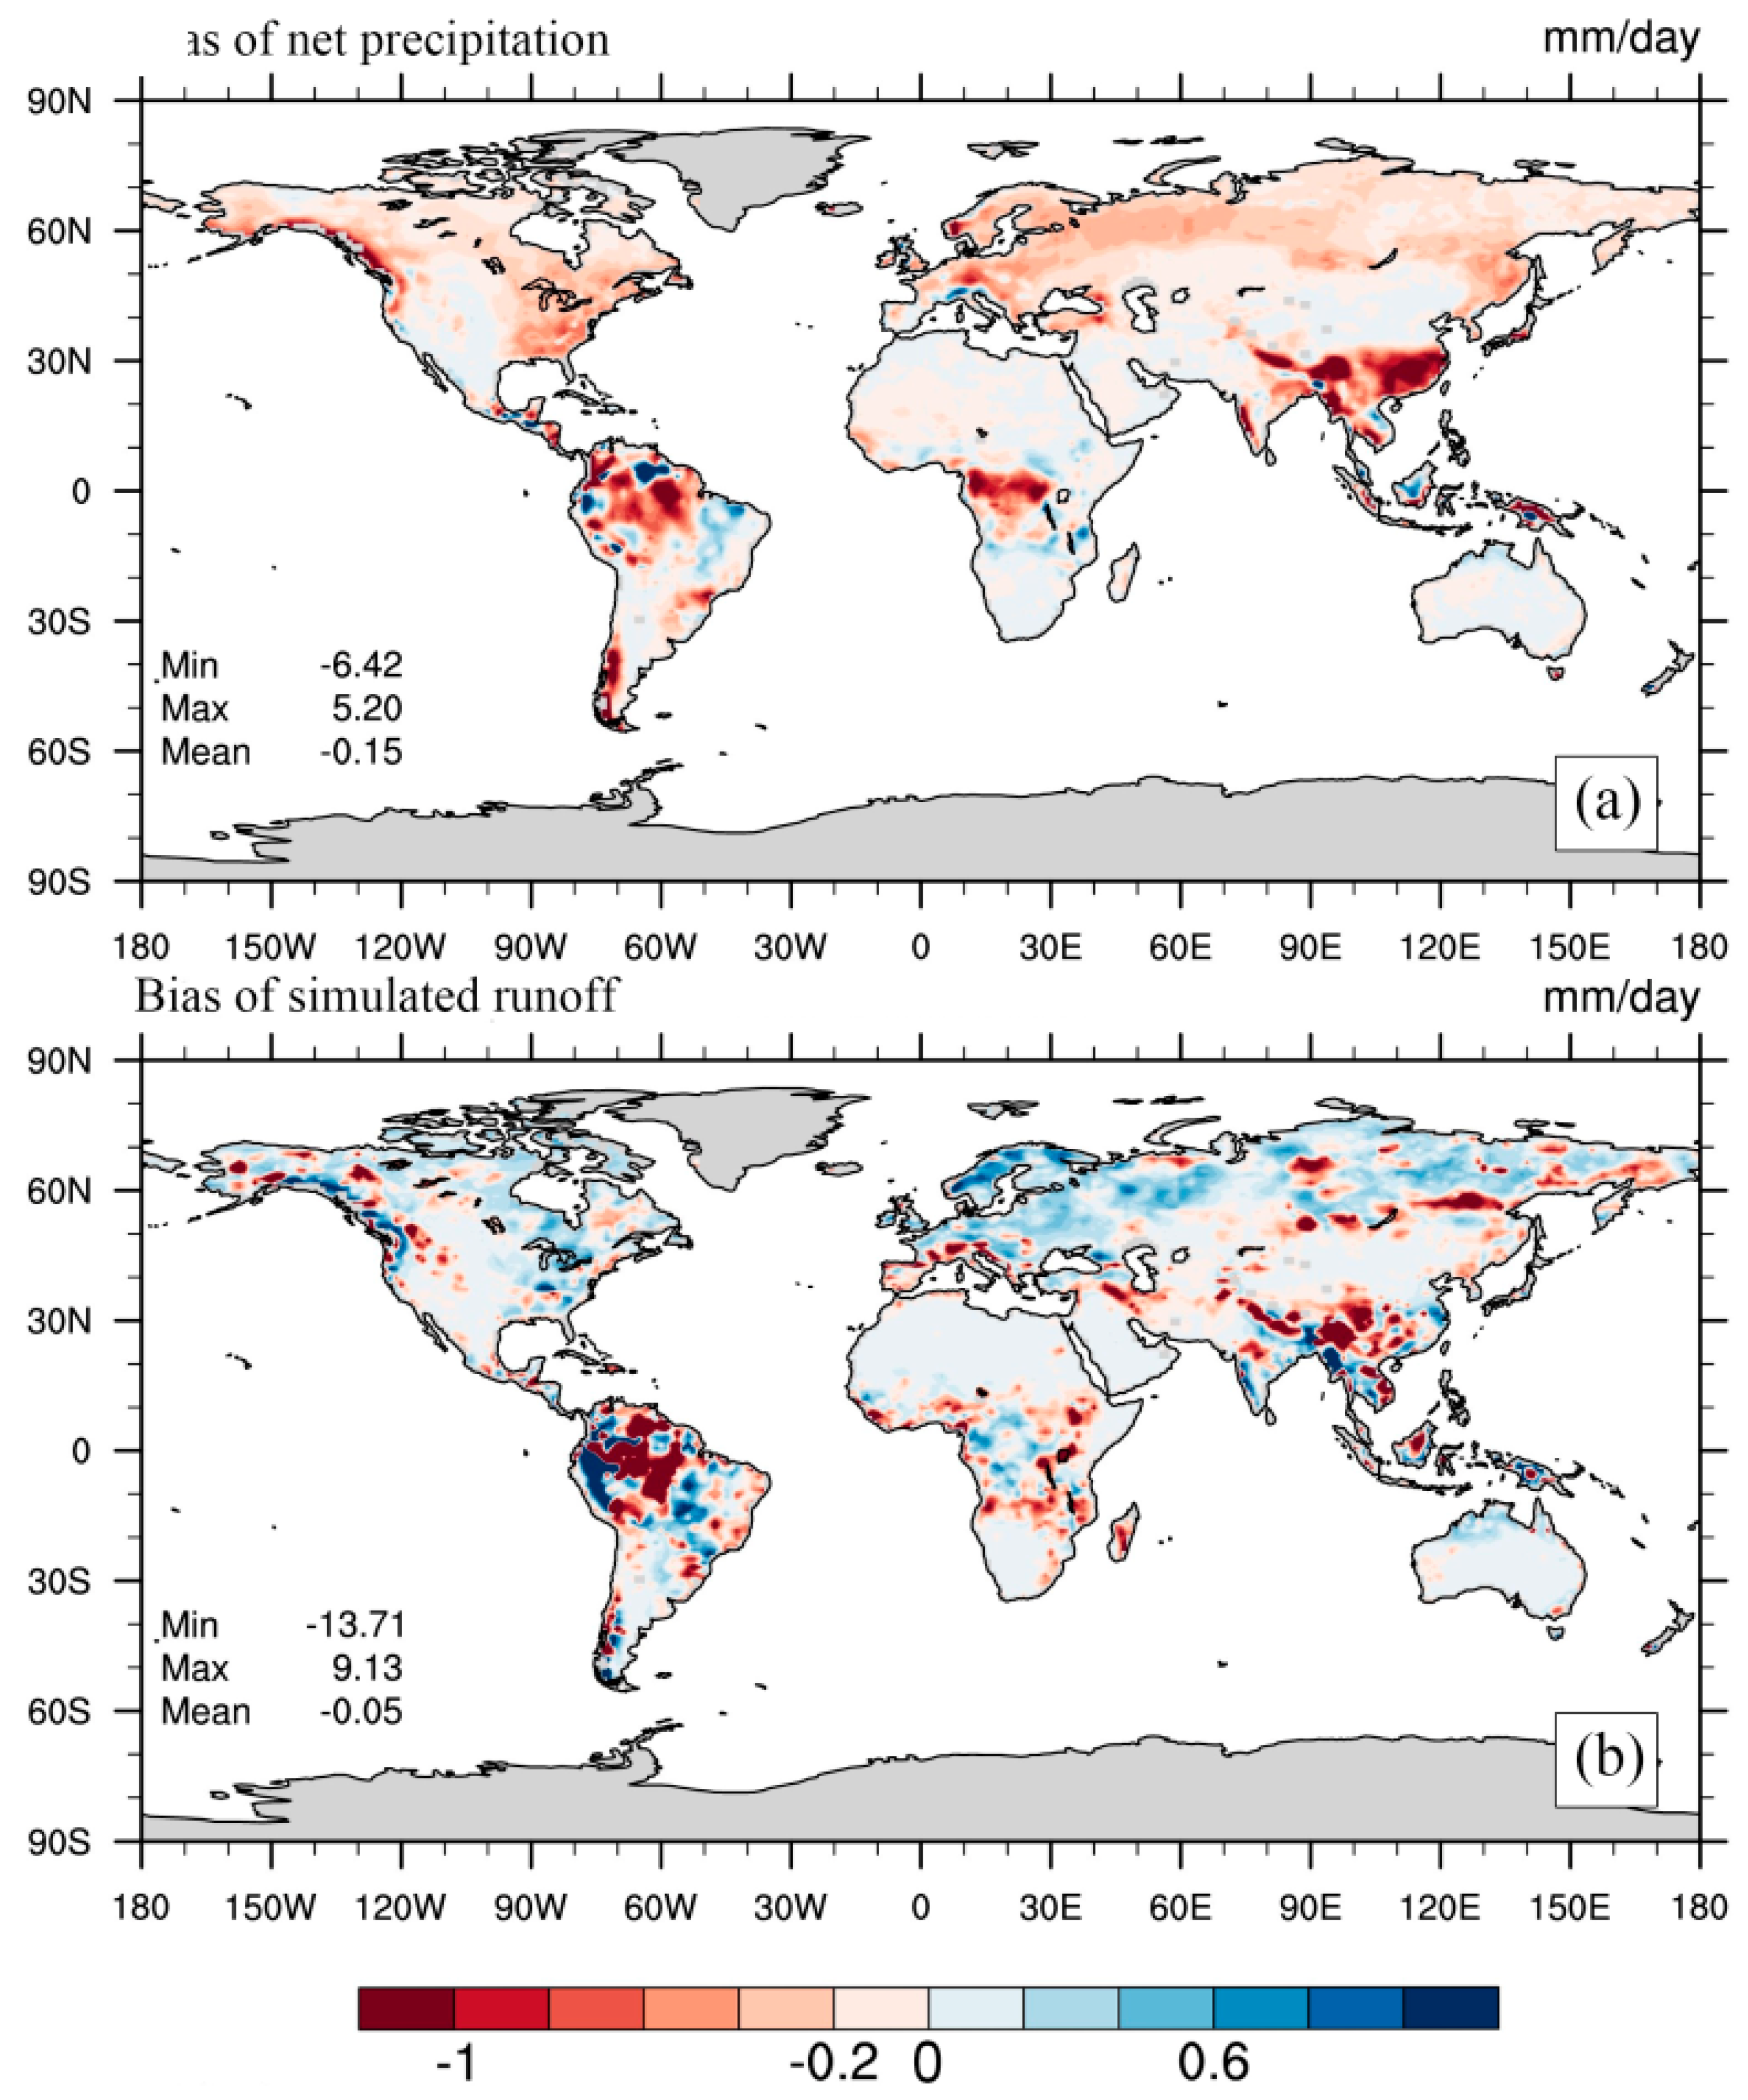
Figure 3.
Annual mean (a) net precipitation forcing based on Climate Research Unit–National Centers for Environmental Prediction (CRUNCEP) minus that based on the QIAN data set (mm day−1) and (b) simulated runoff in CLM4.5 driven by QIAN data minus Global Composite Runoff Data Set (GRDC) total runoff (mm day−1).
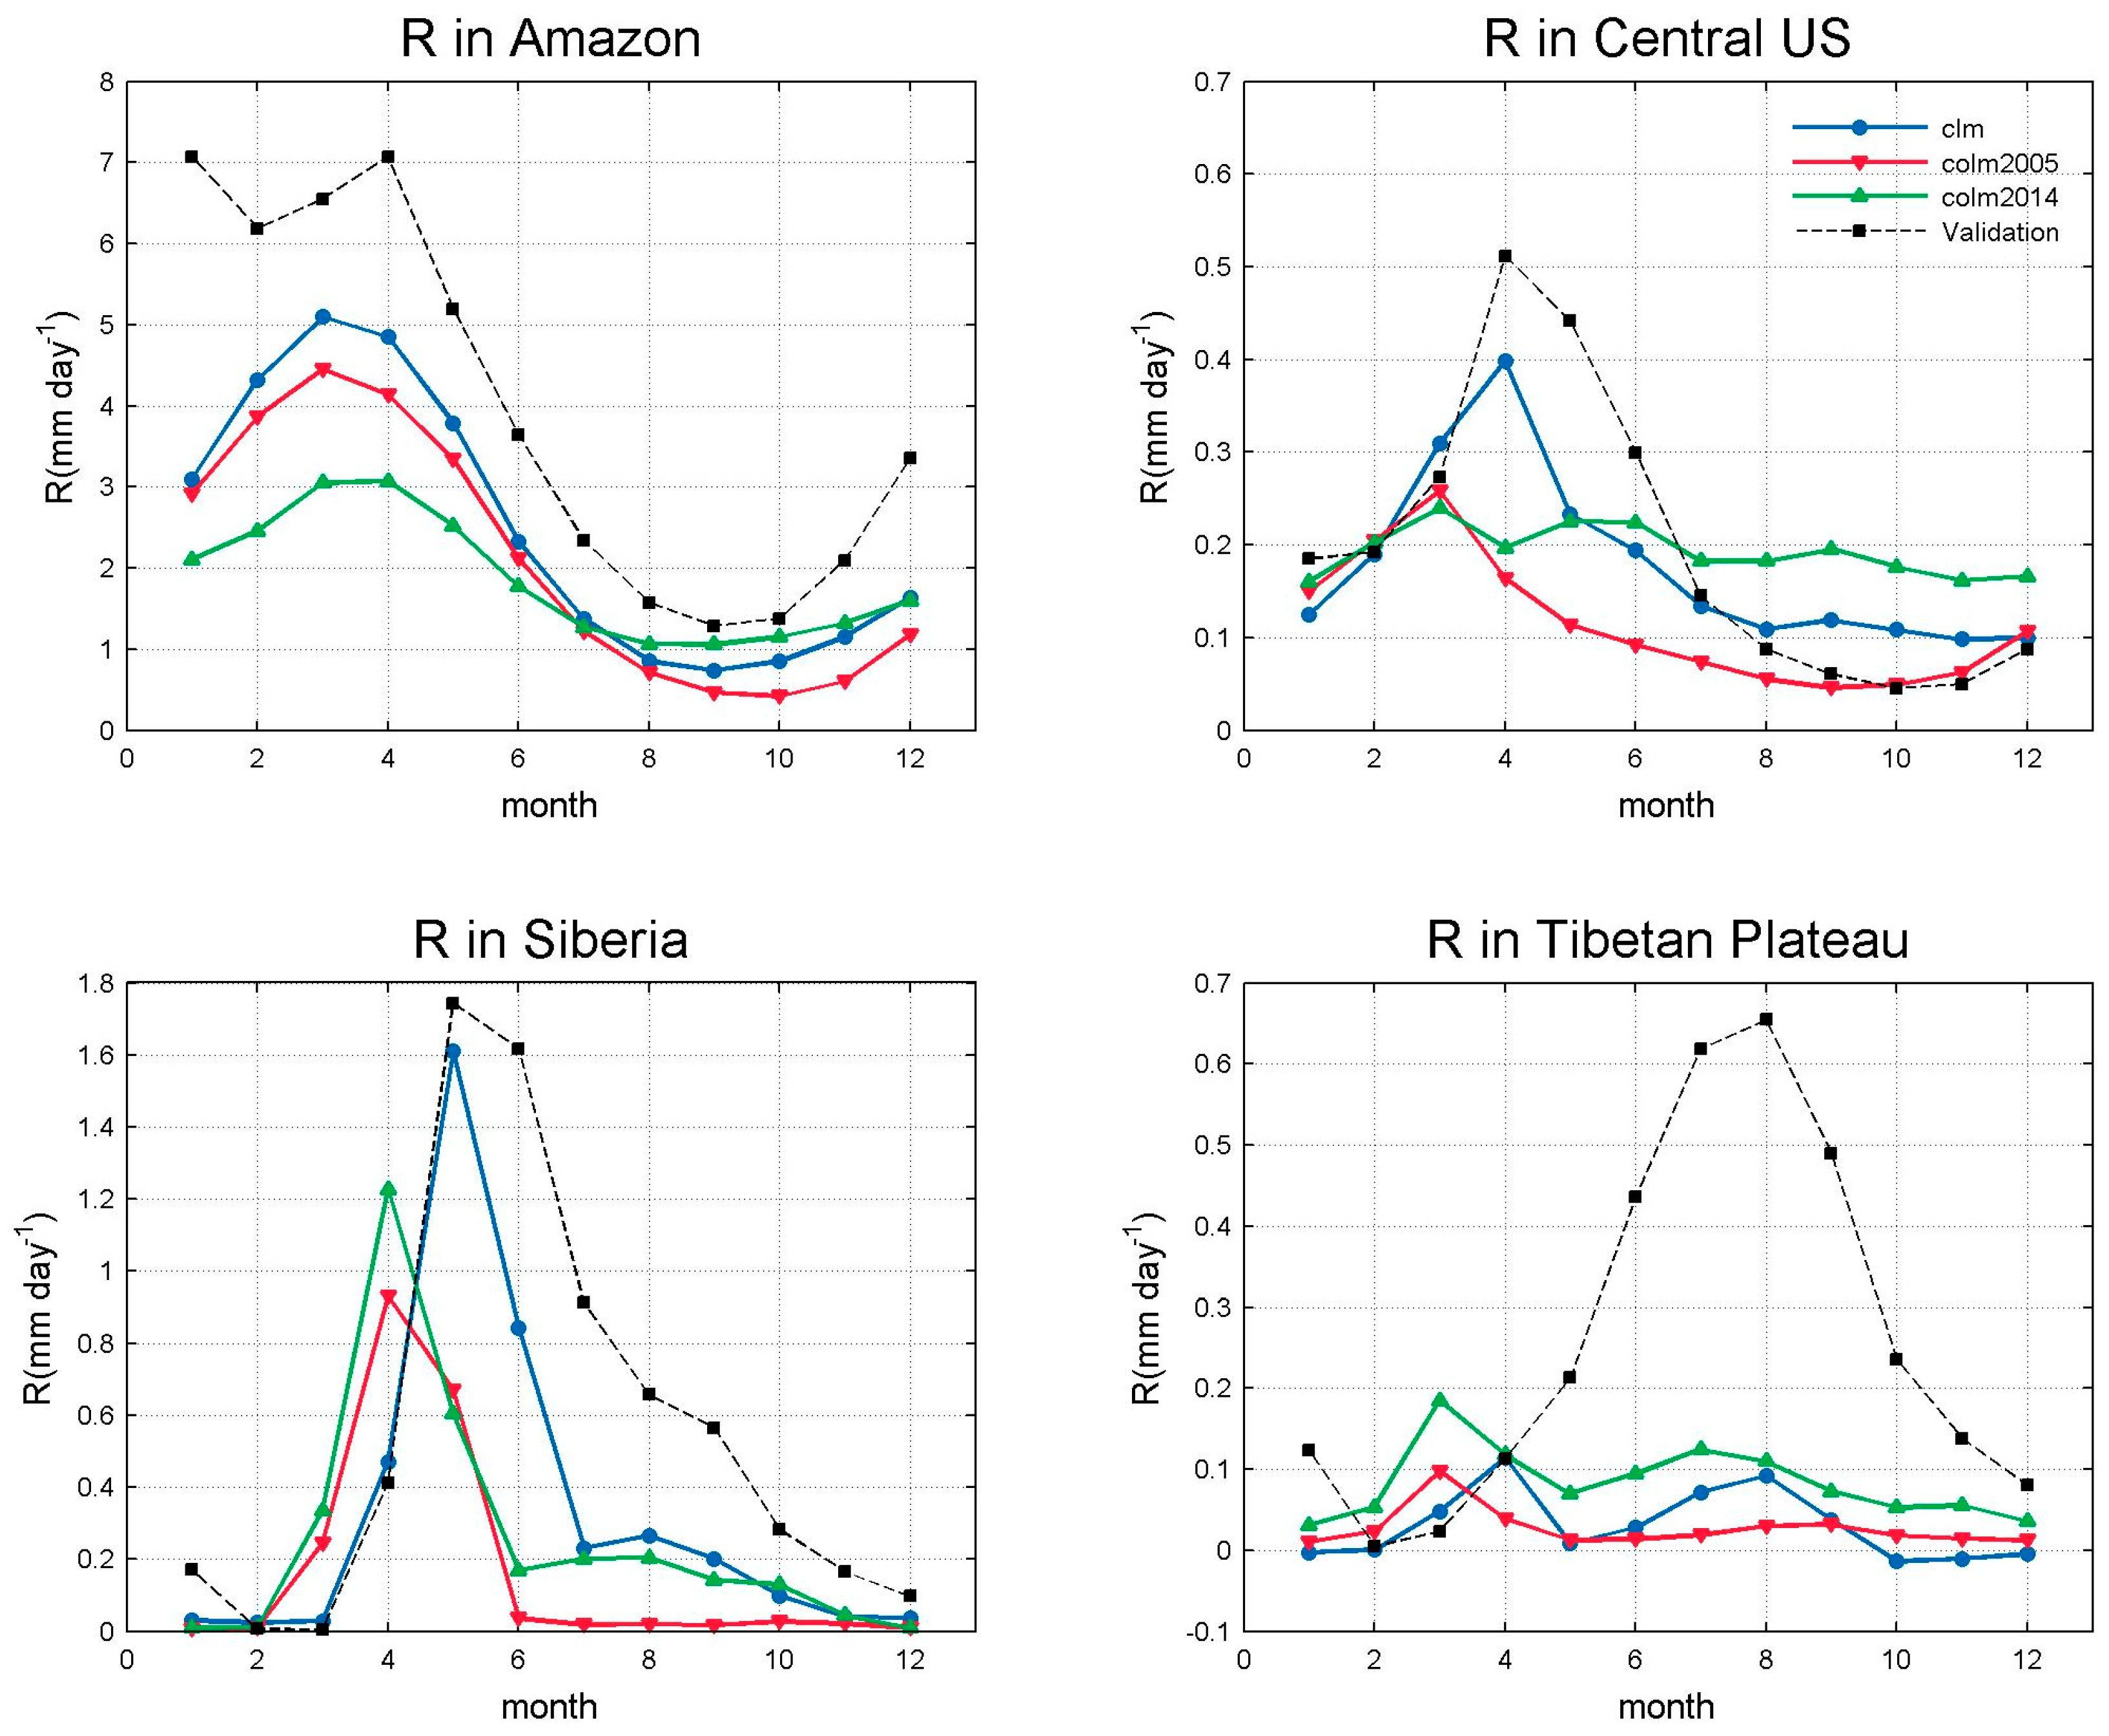
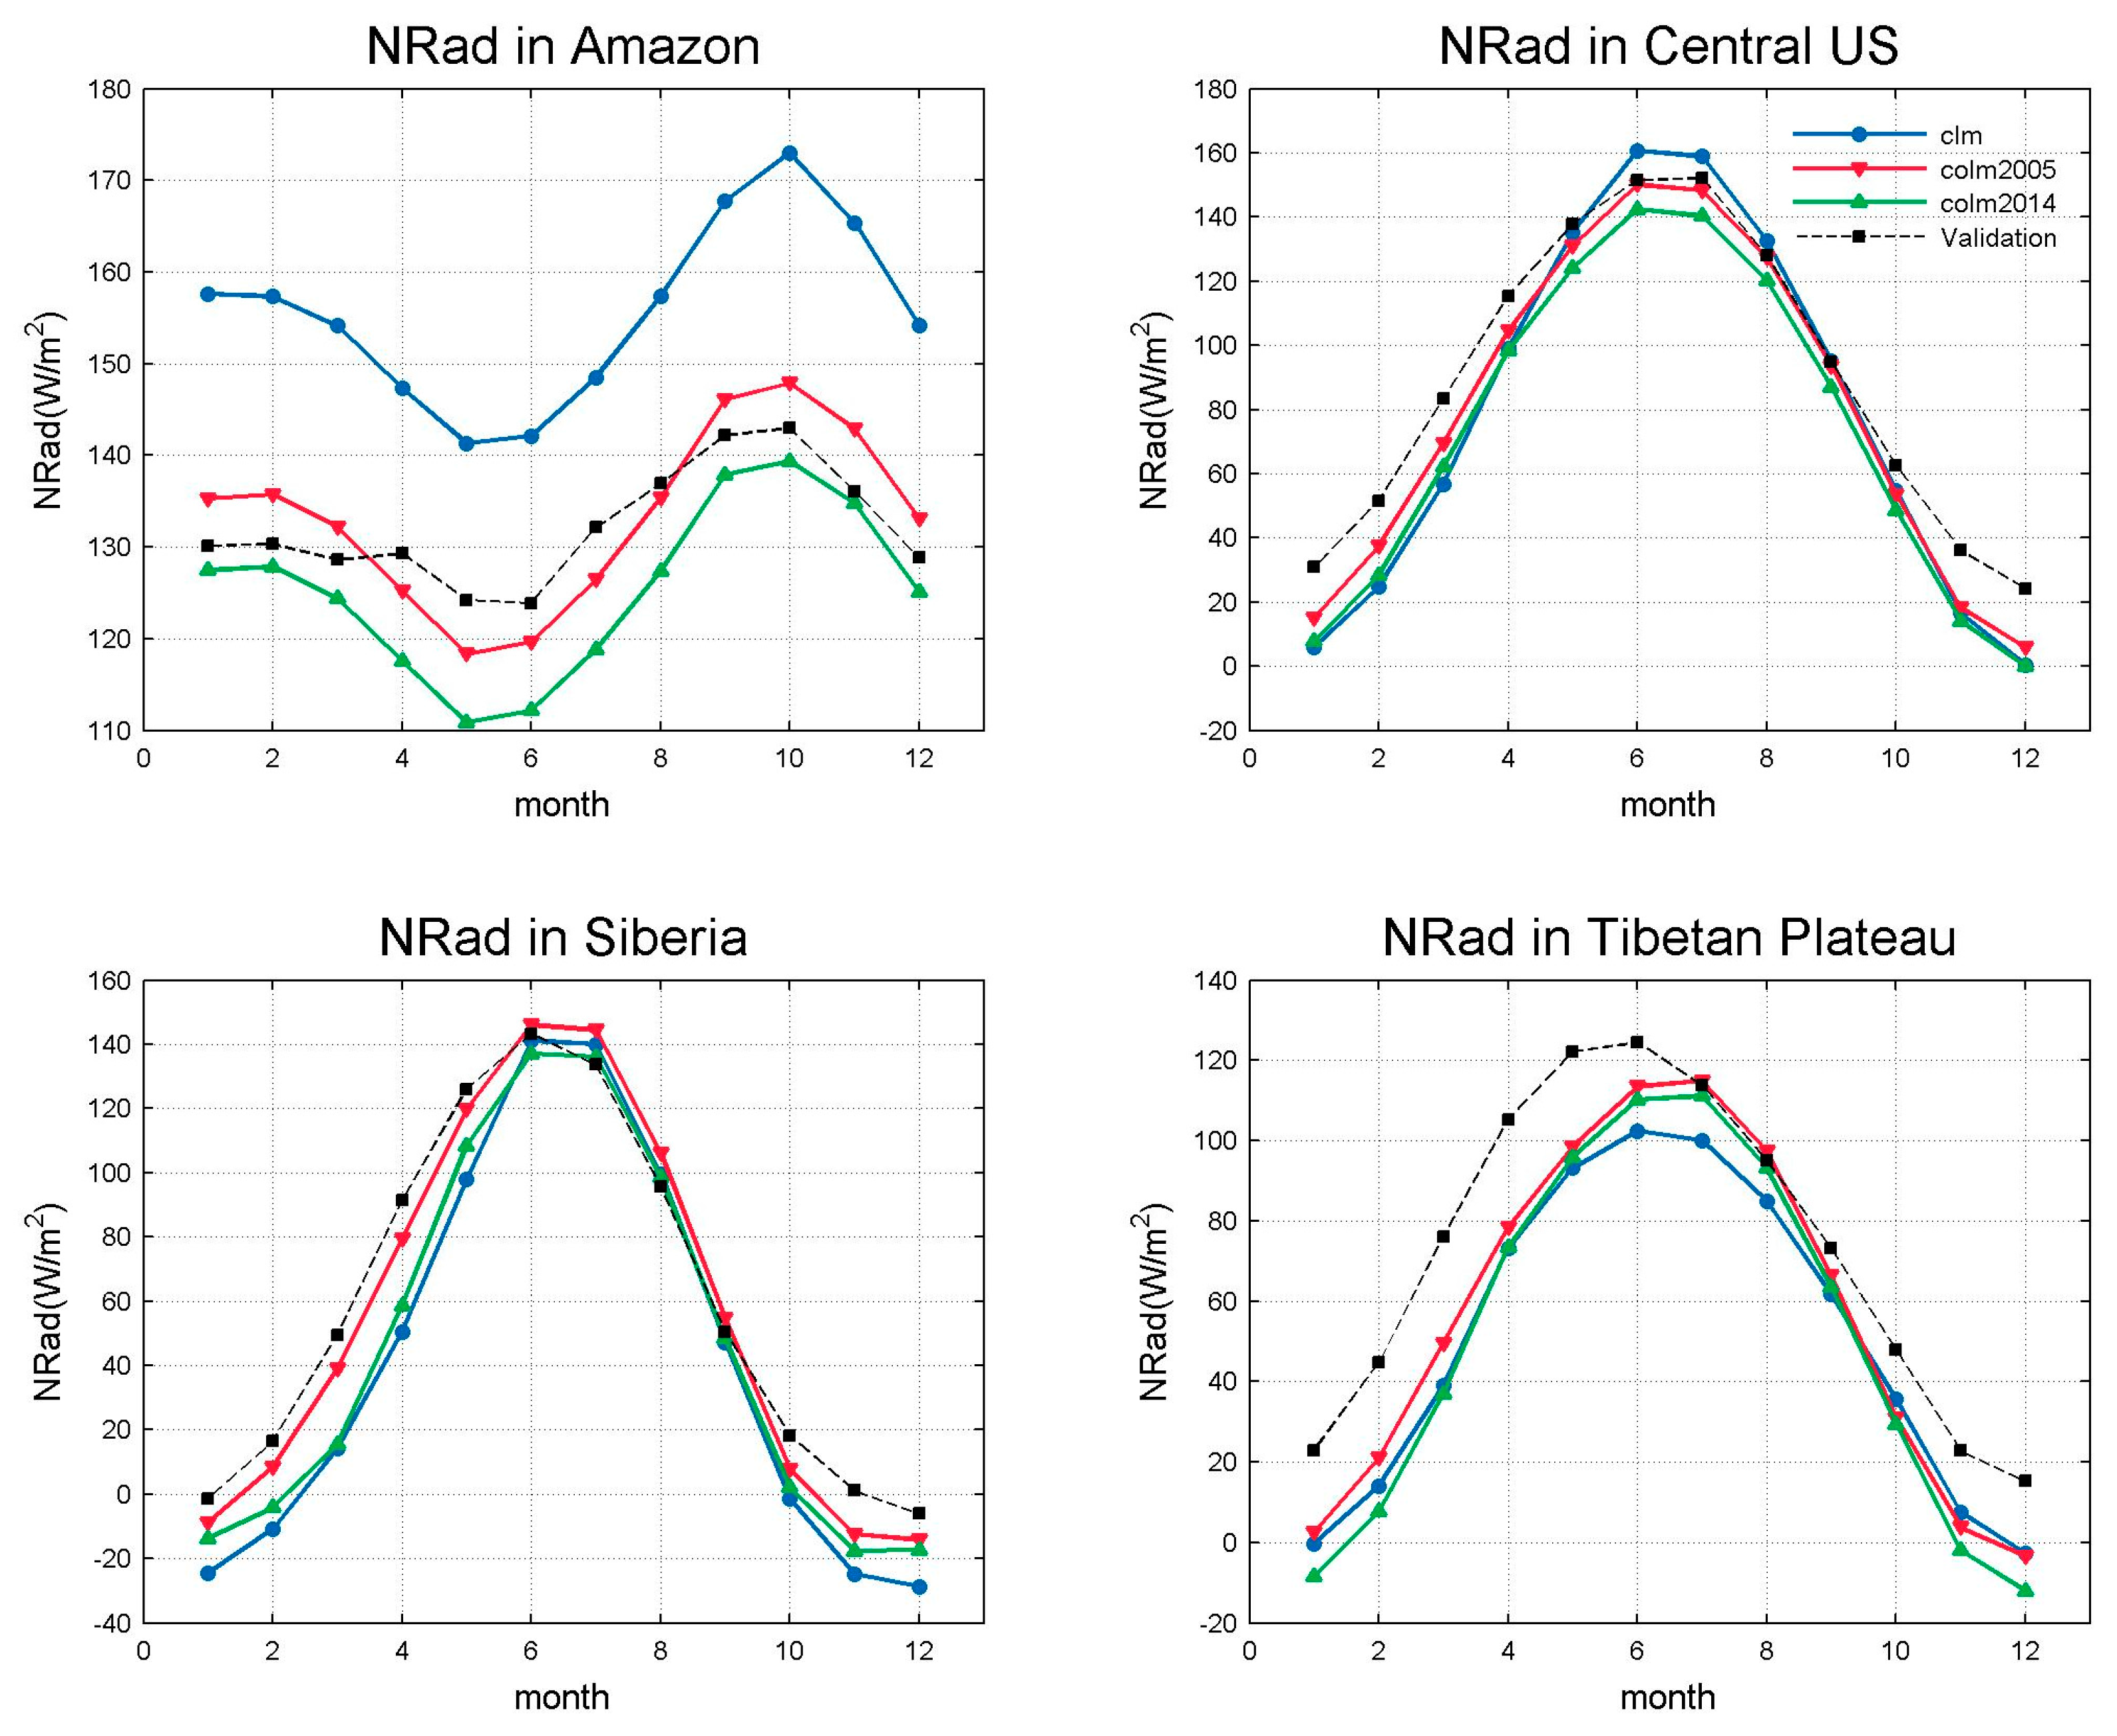
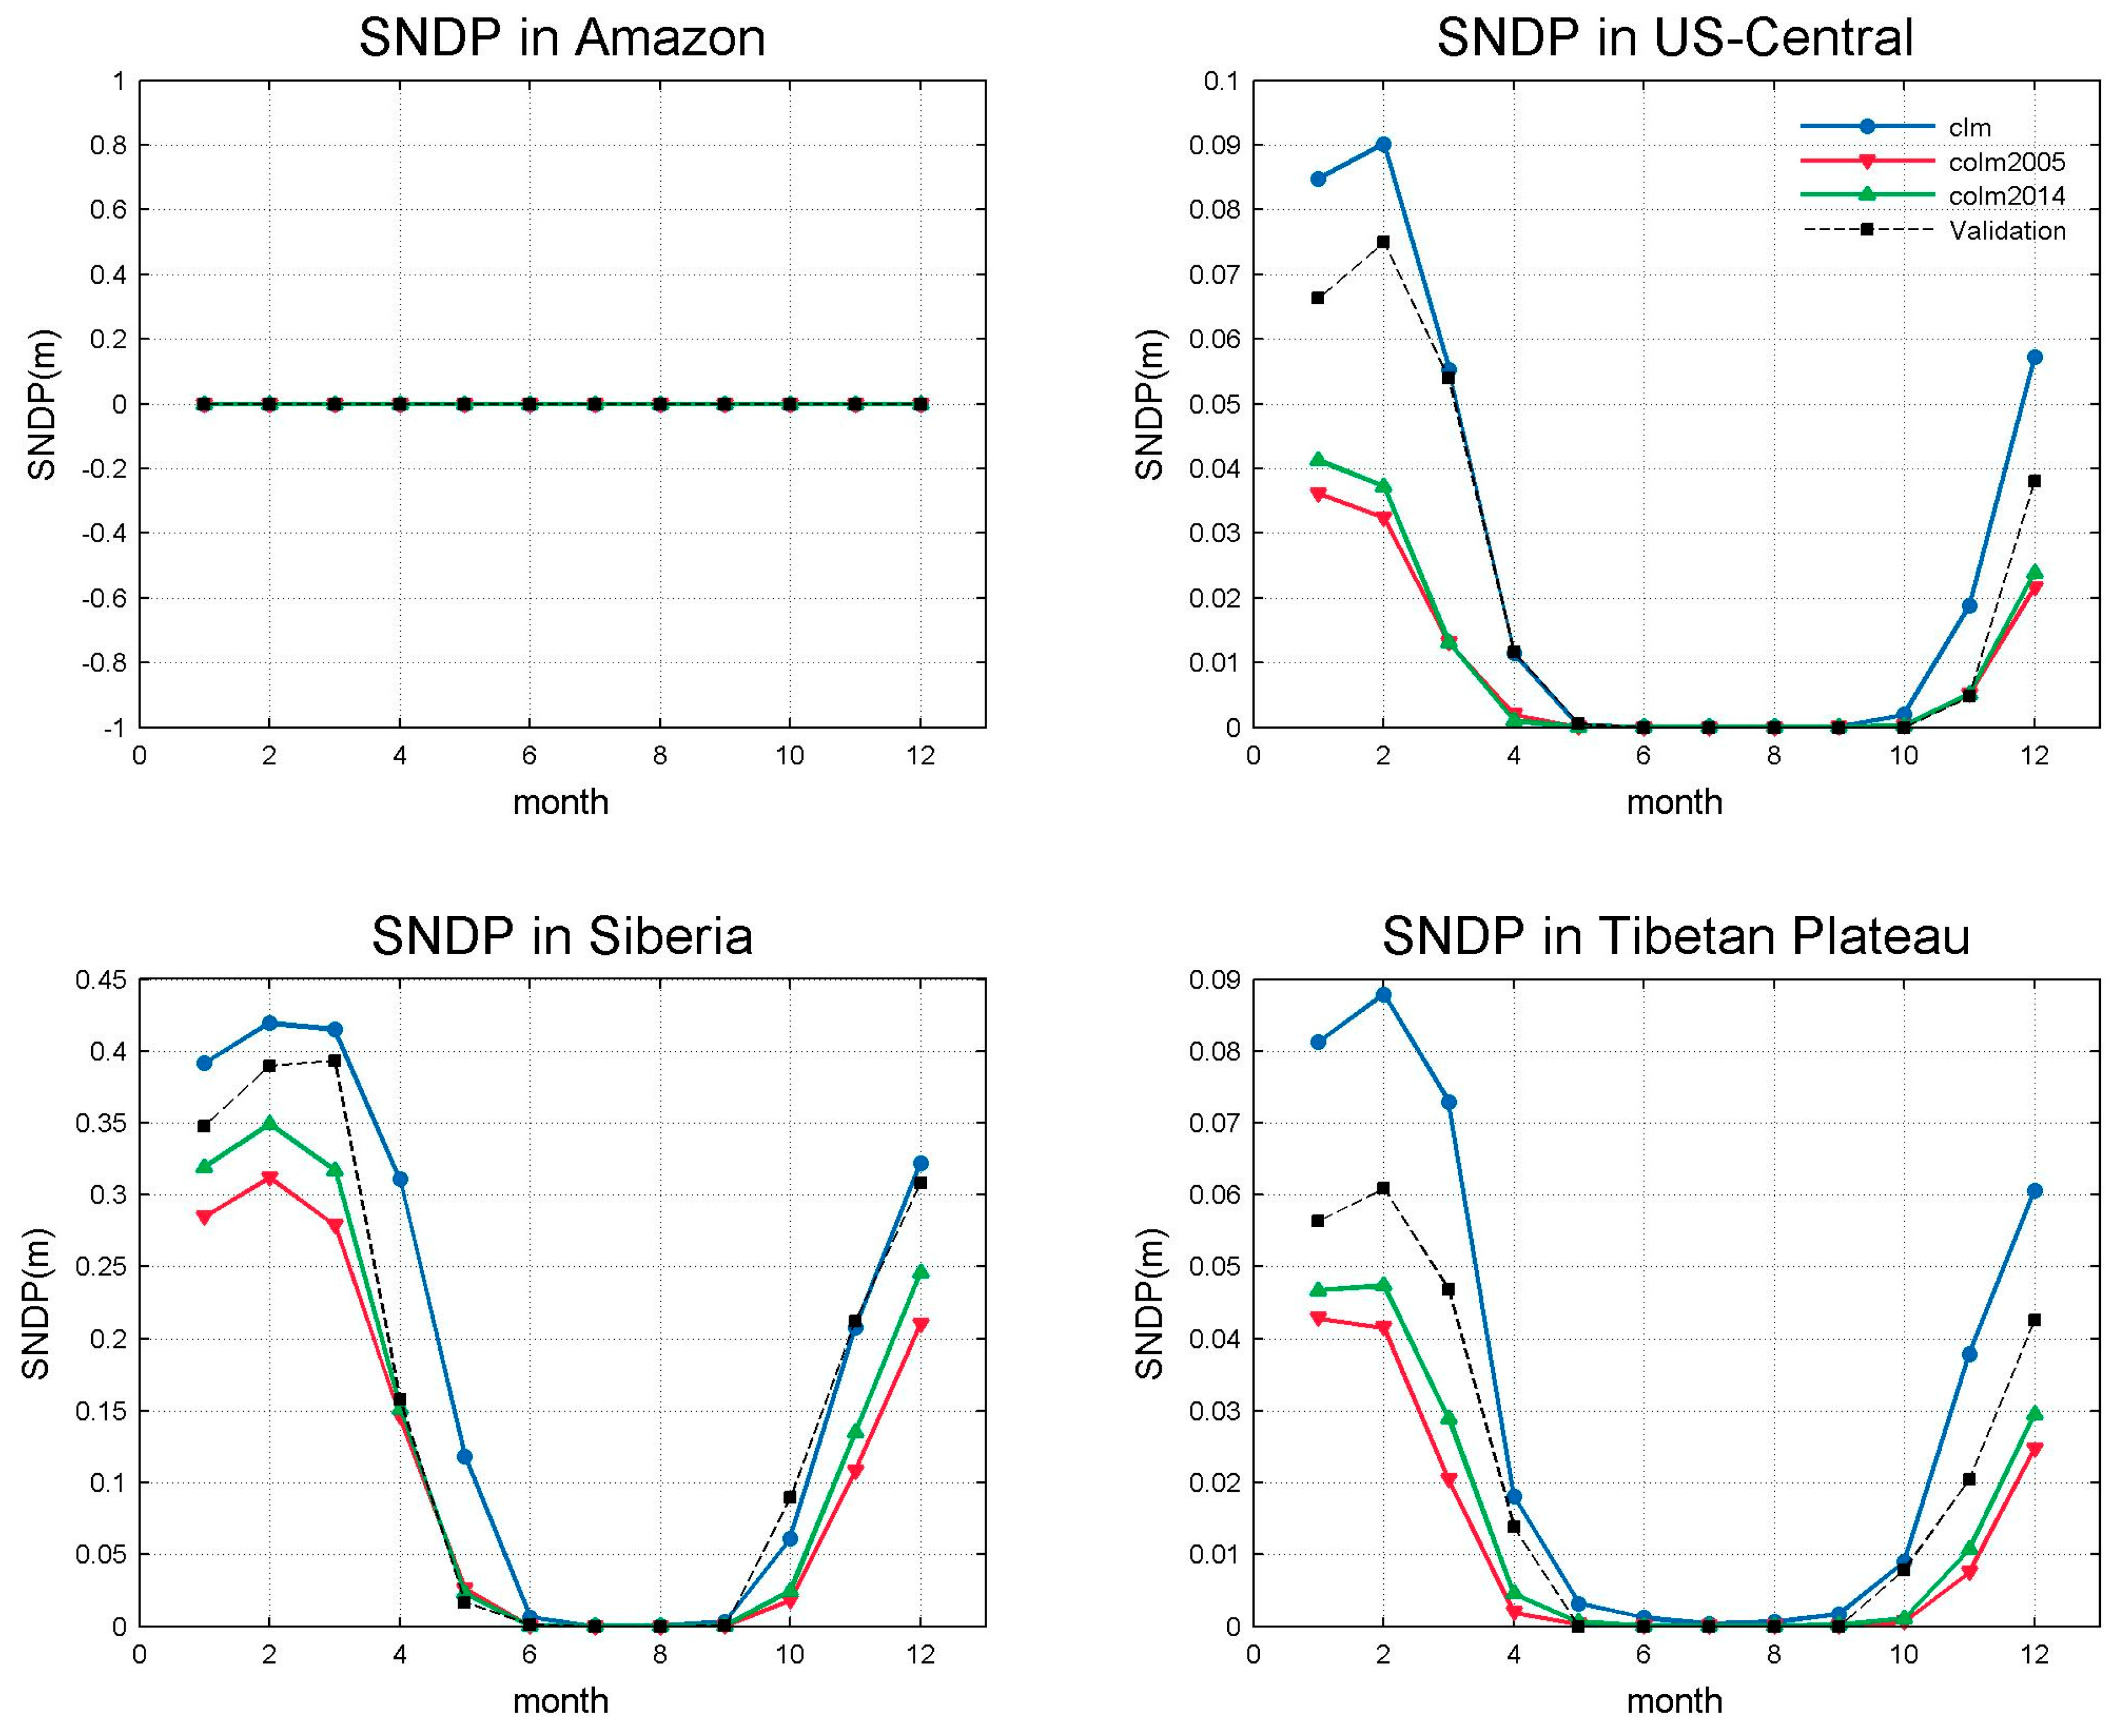
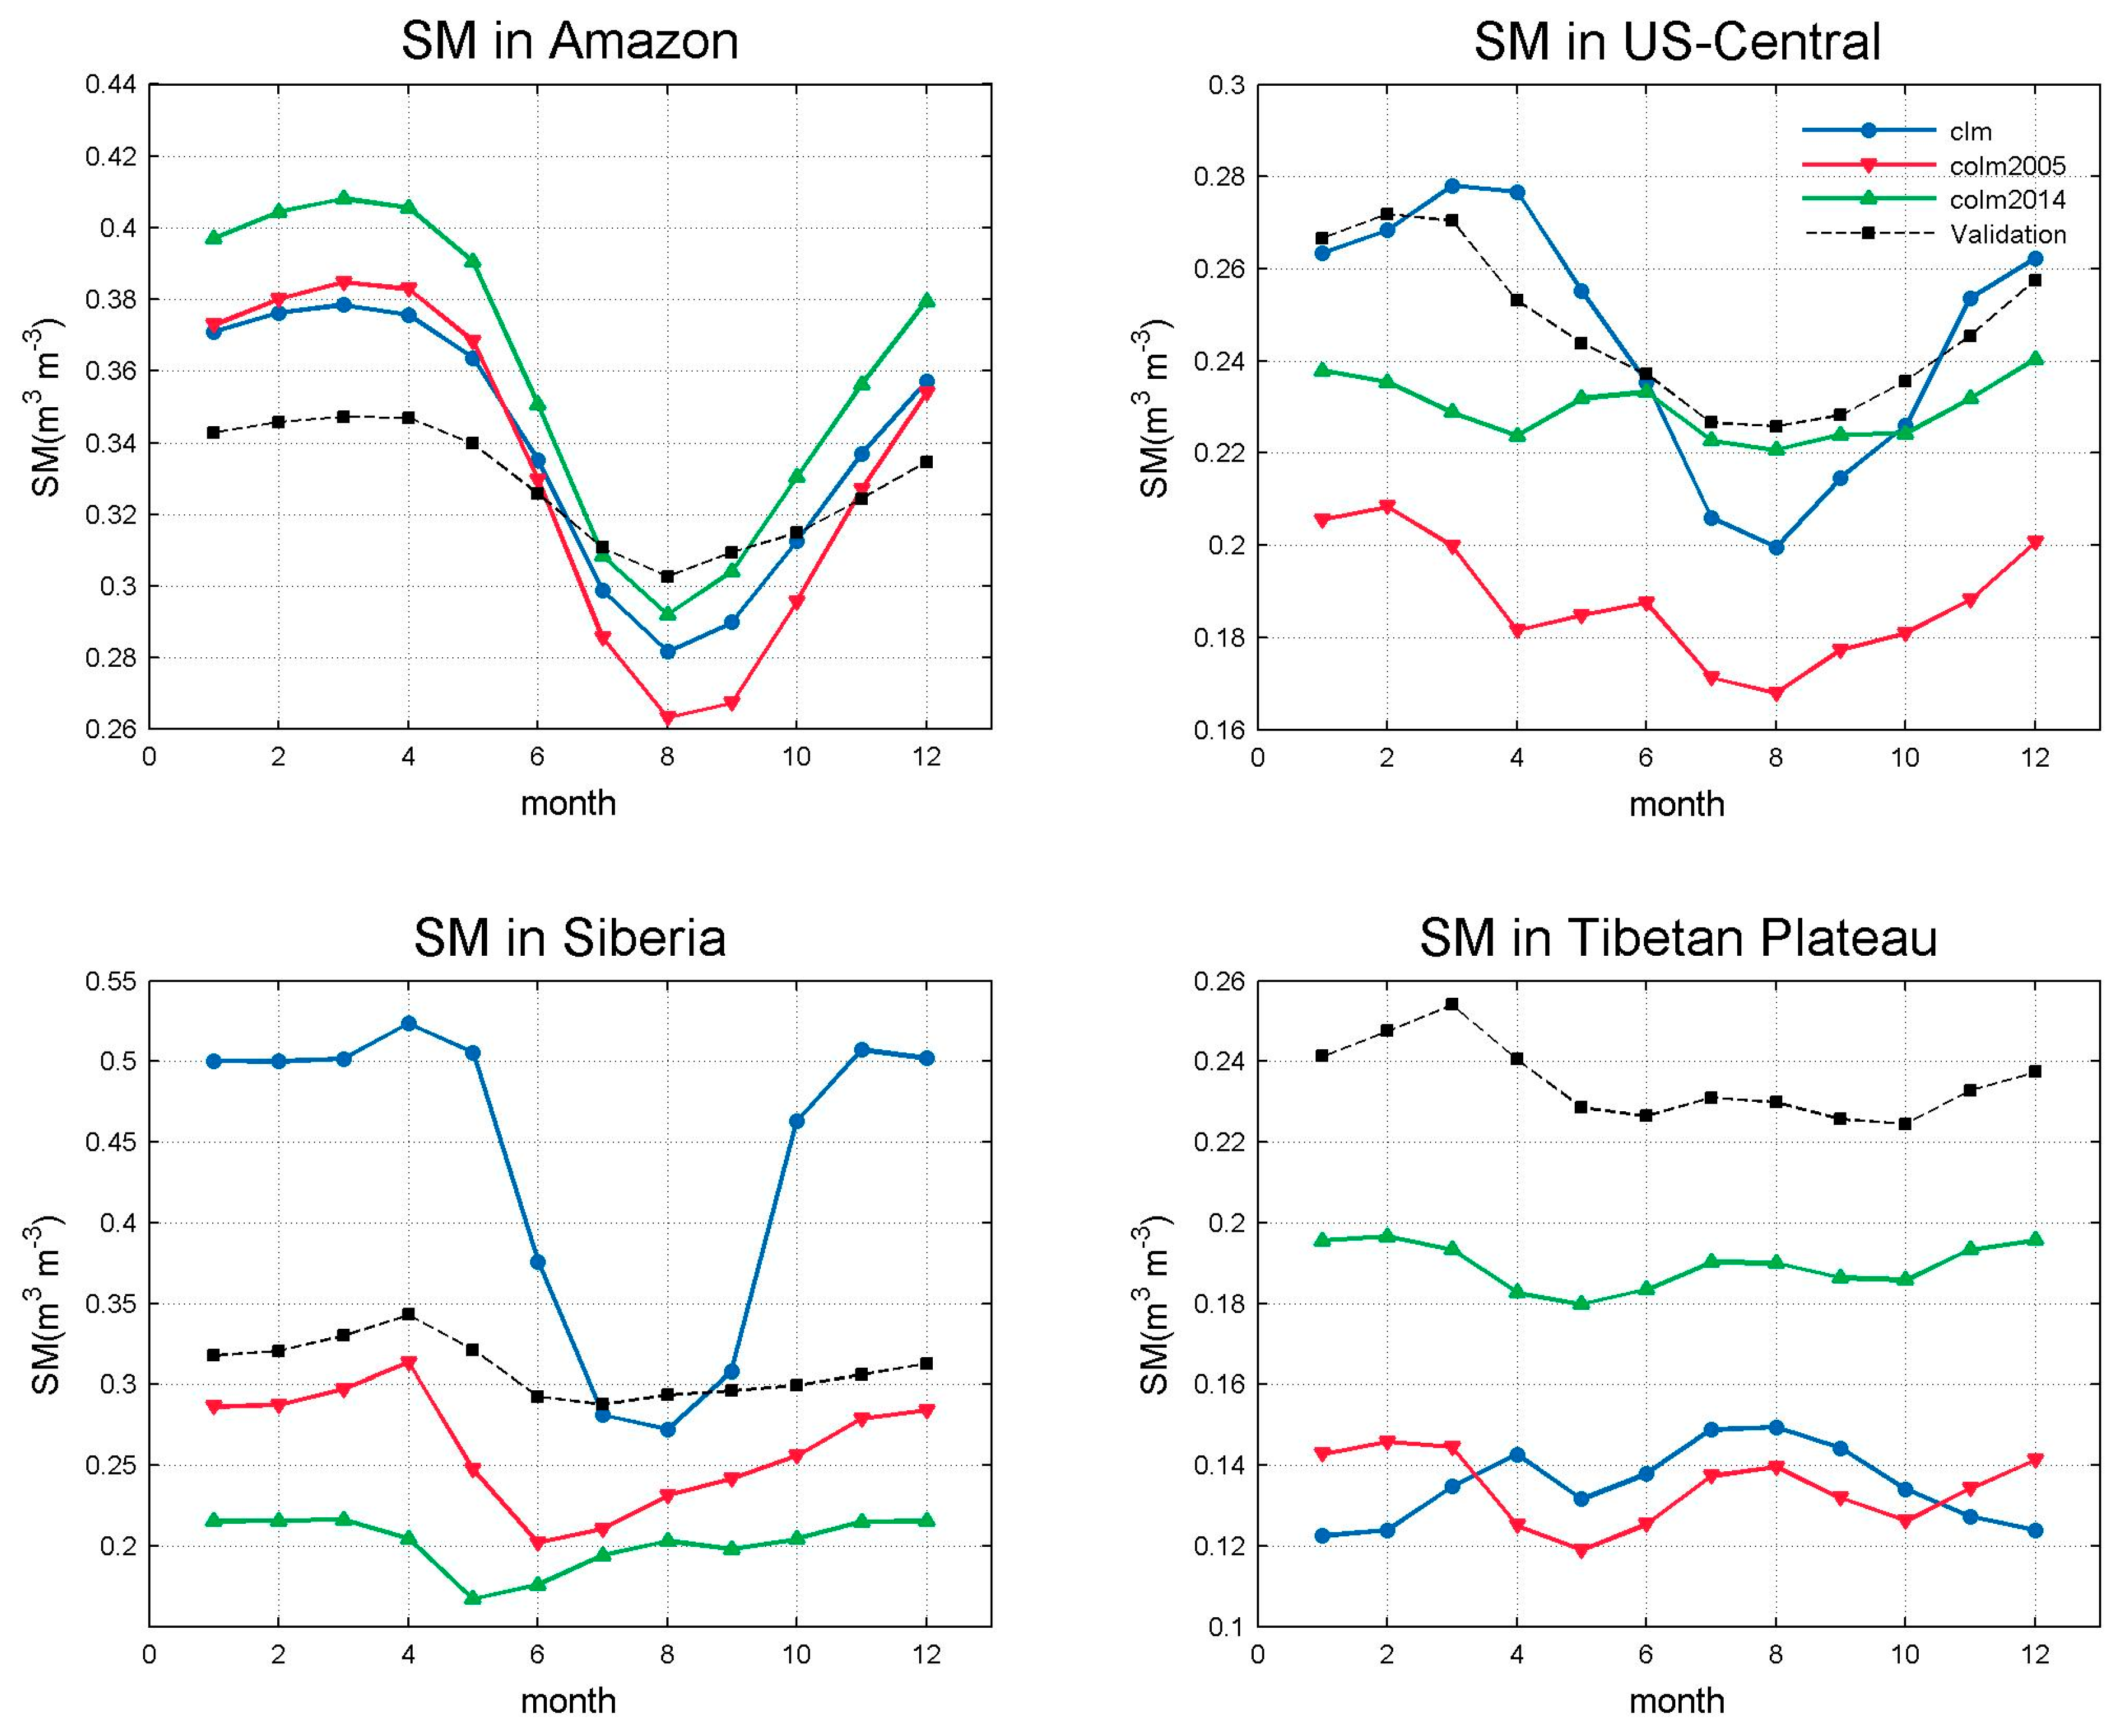
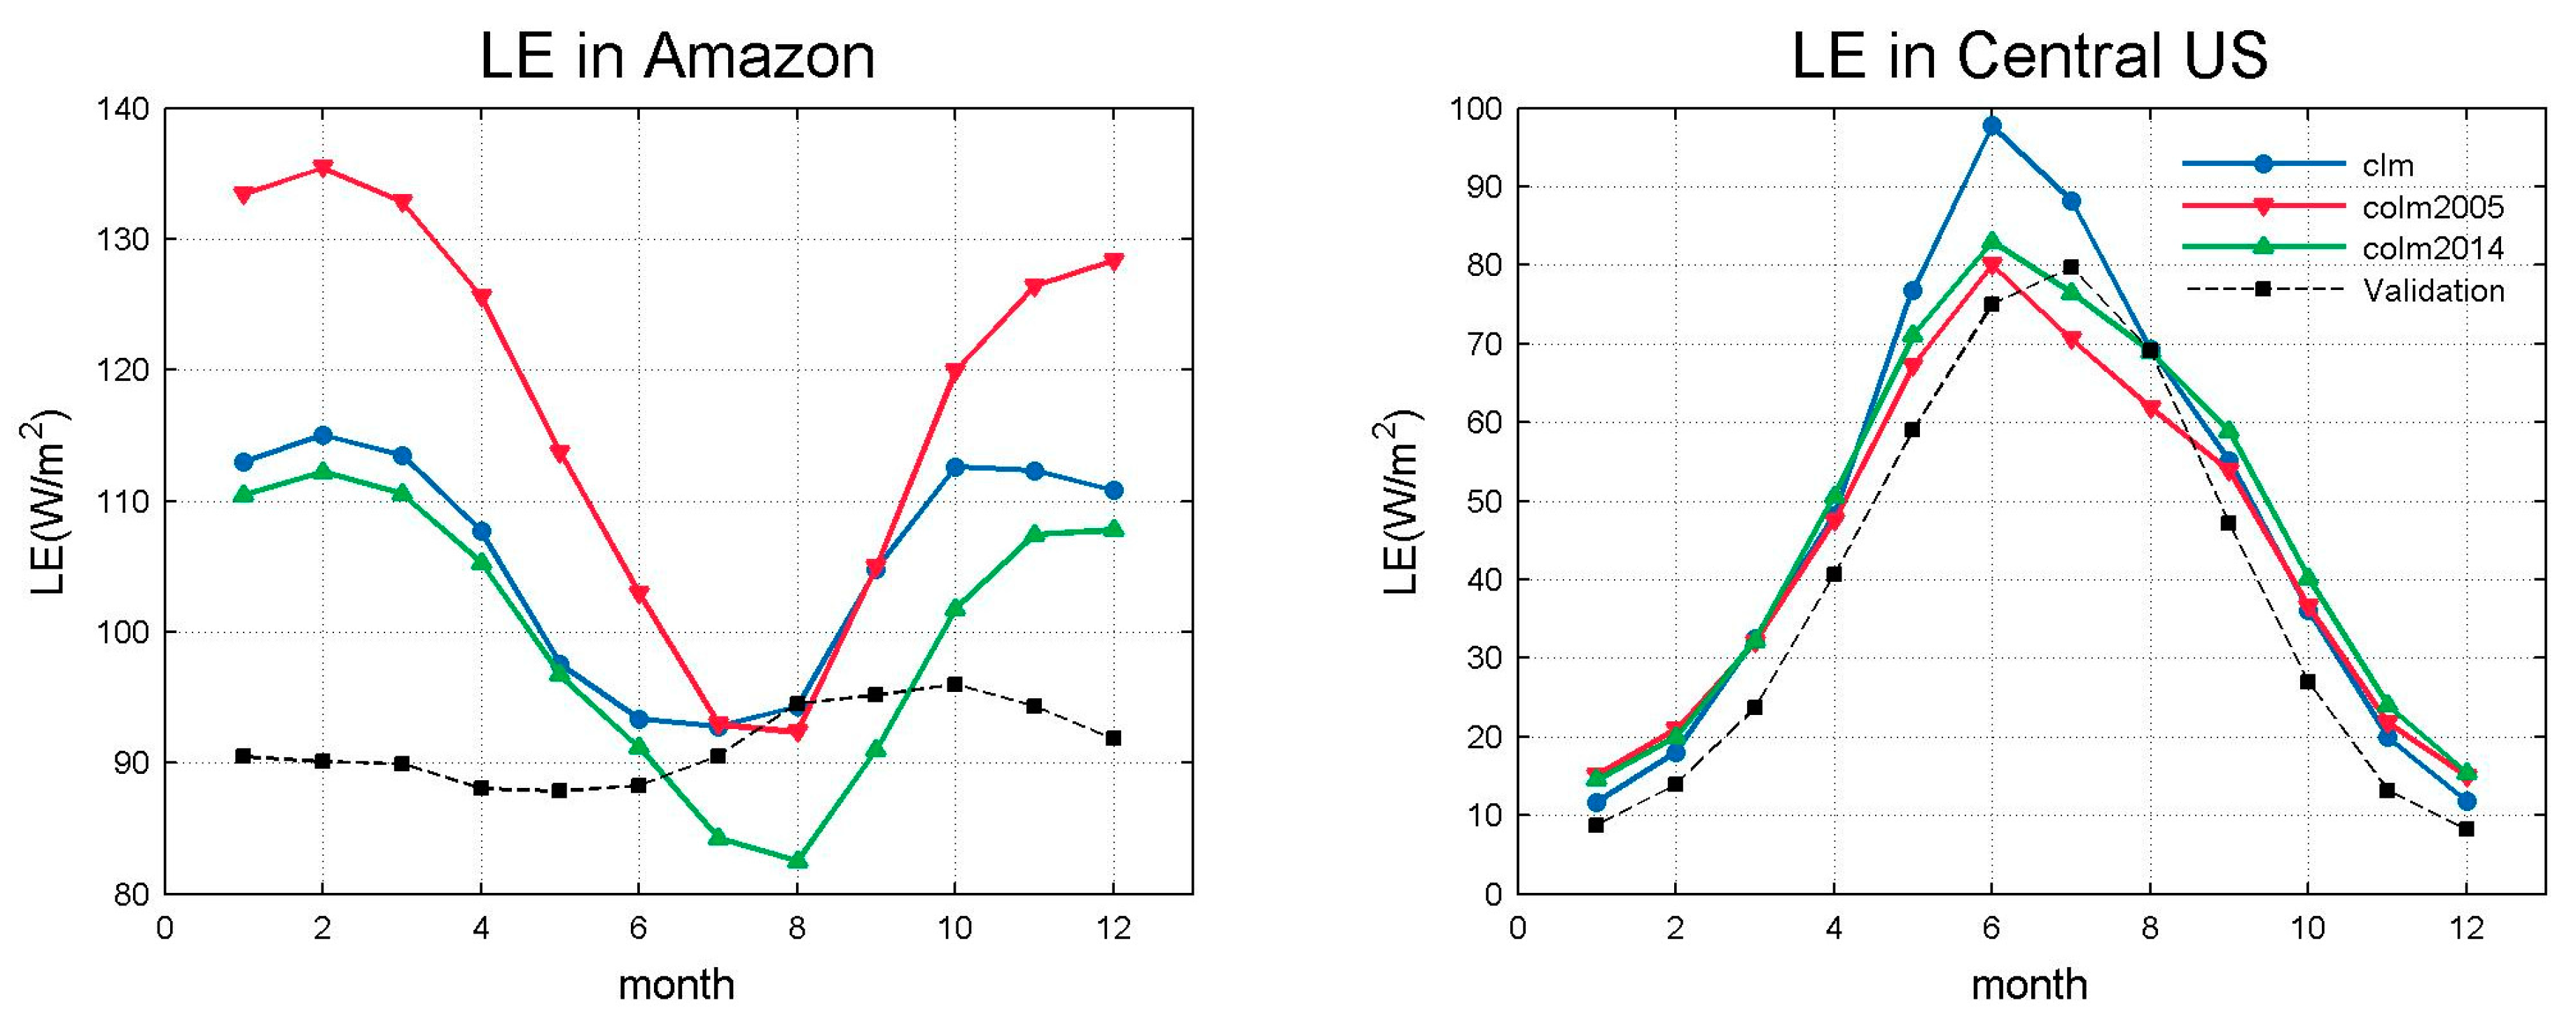
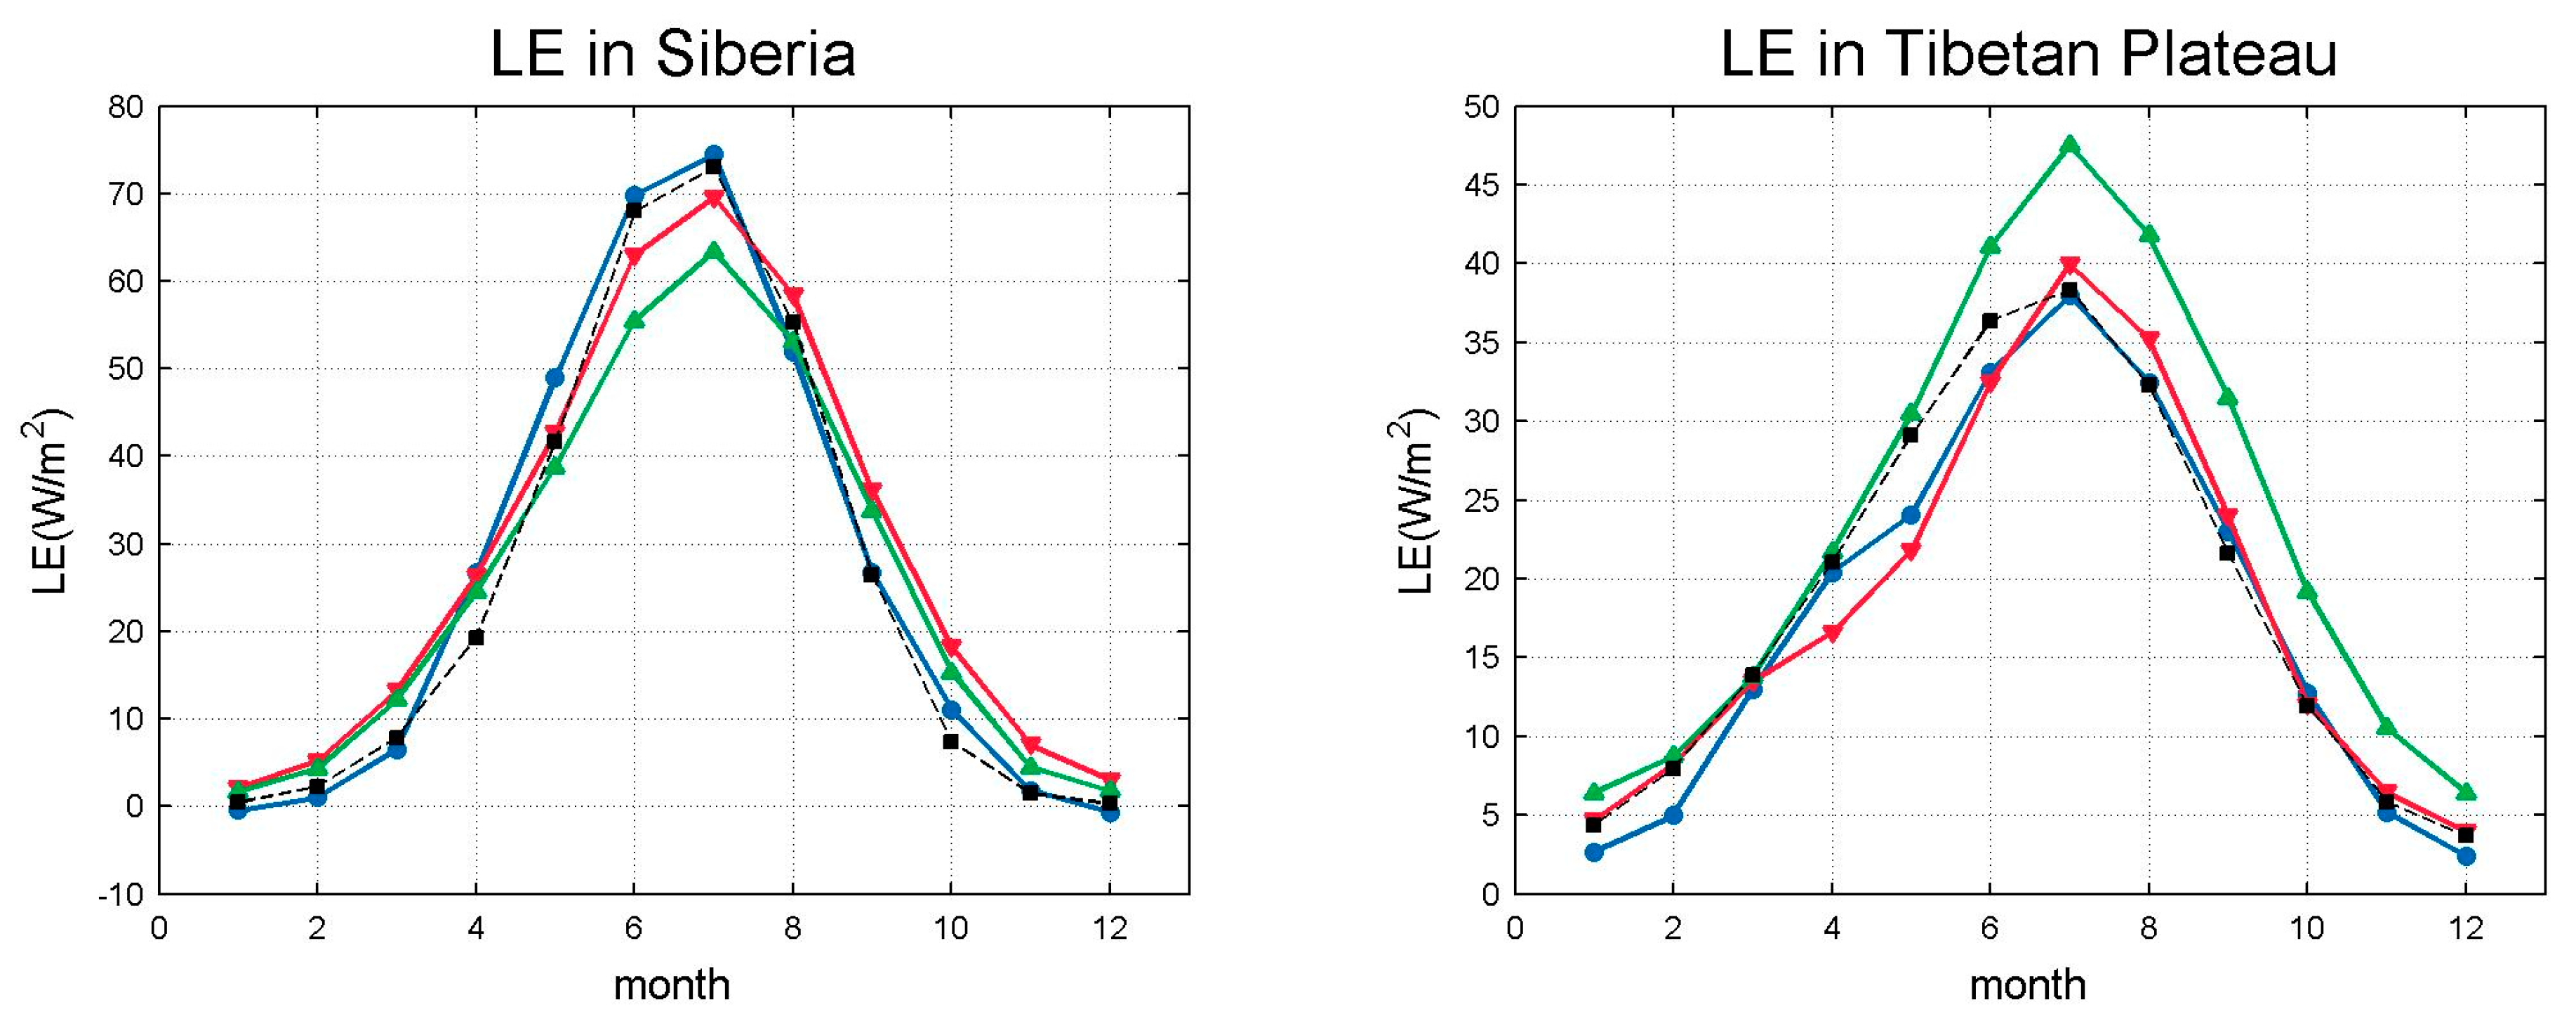
Figure 4.
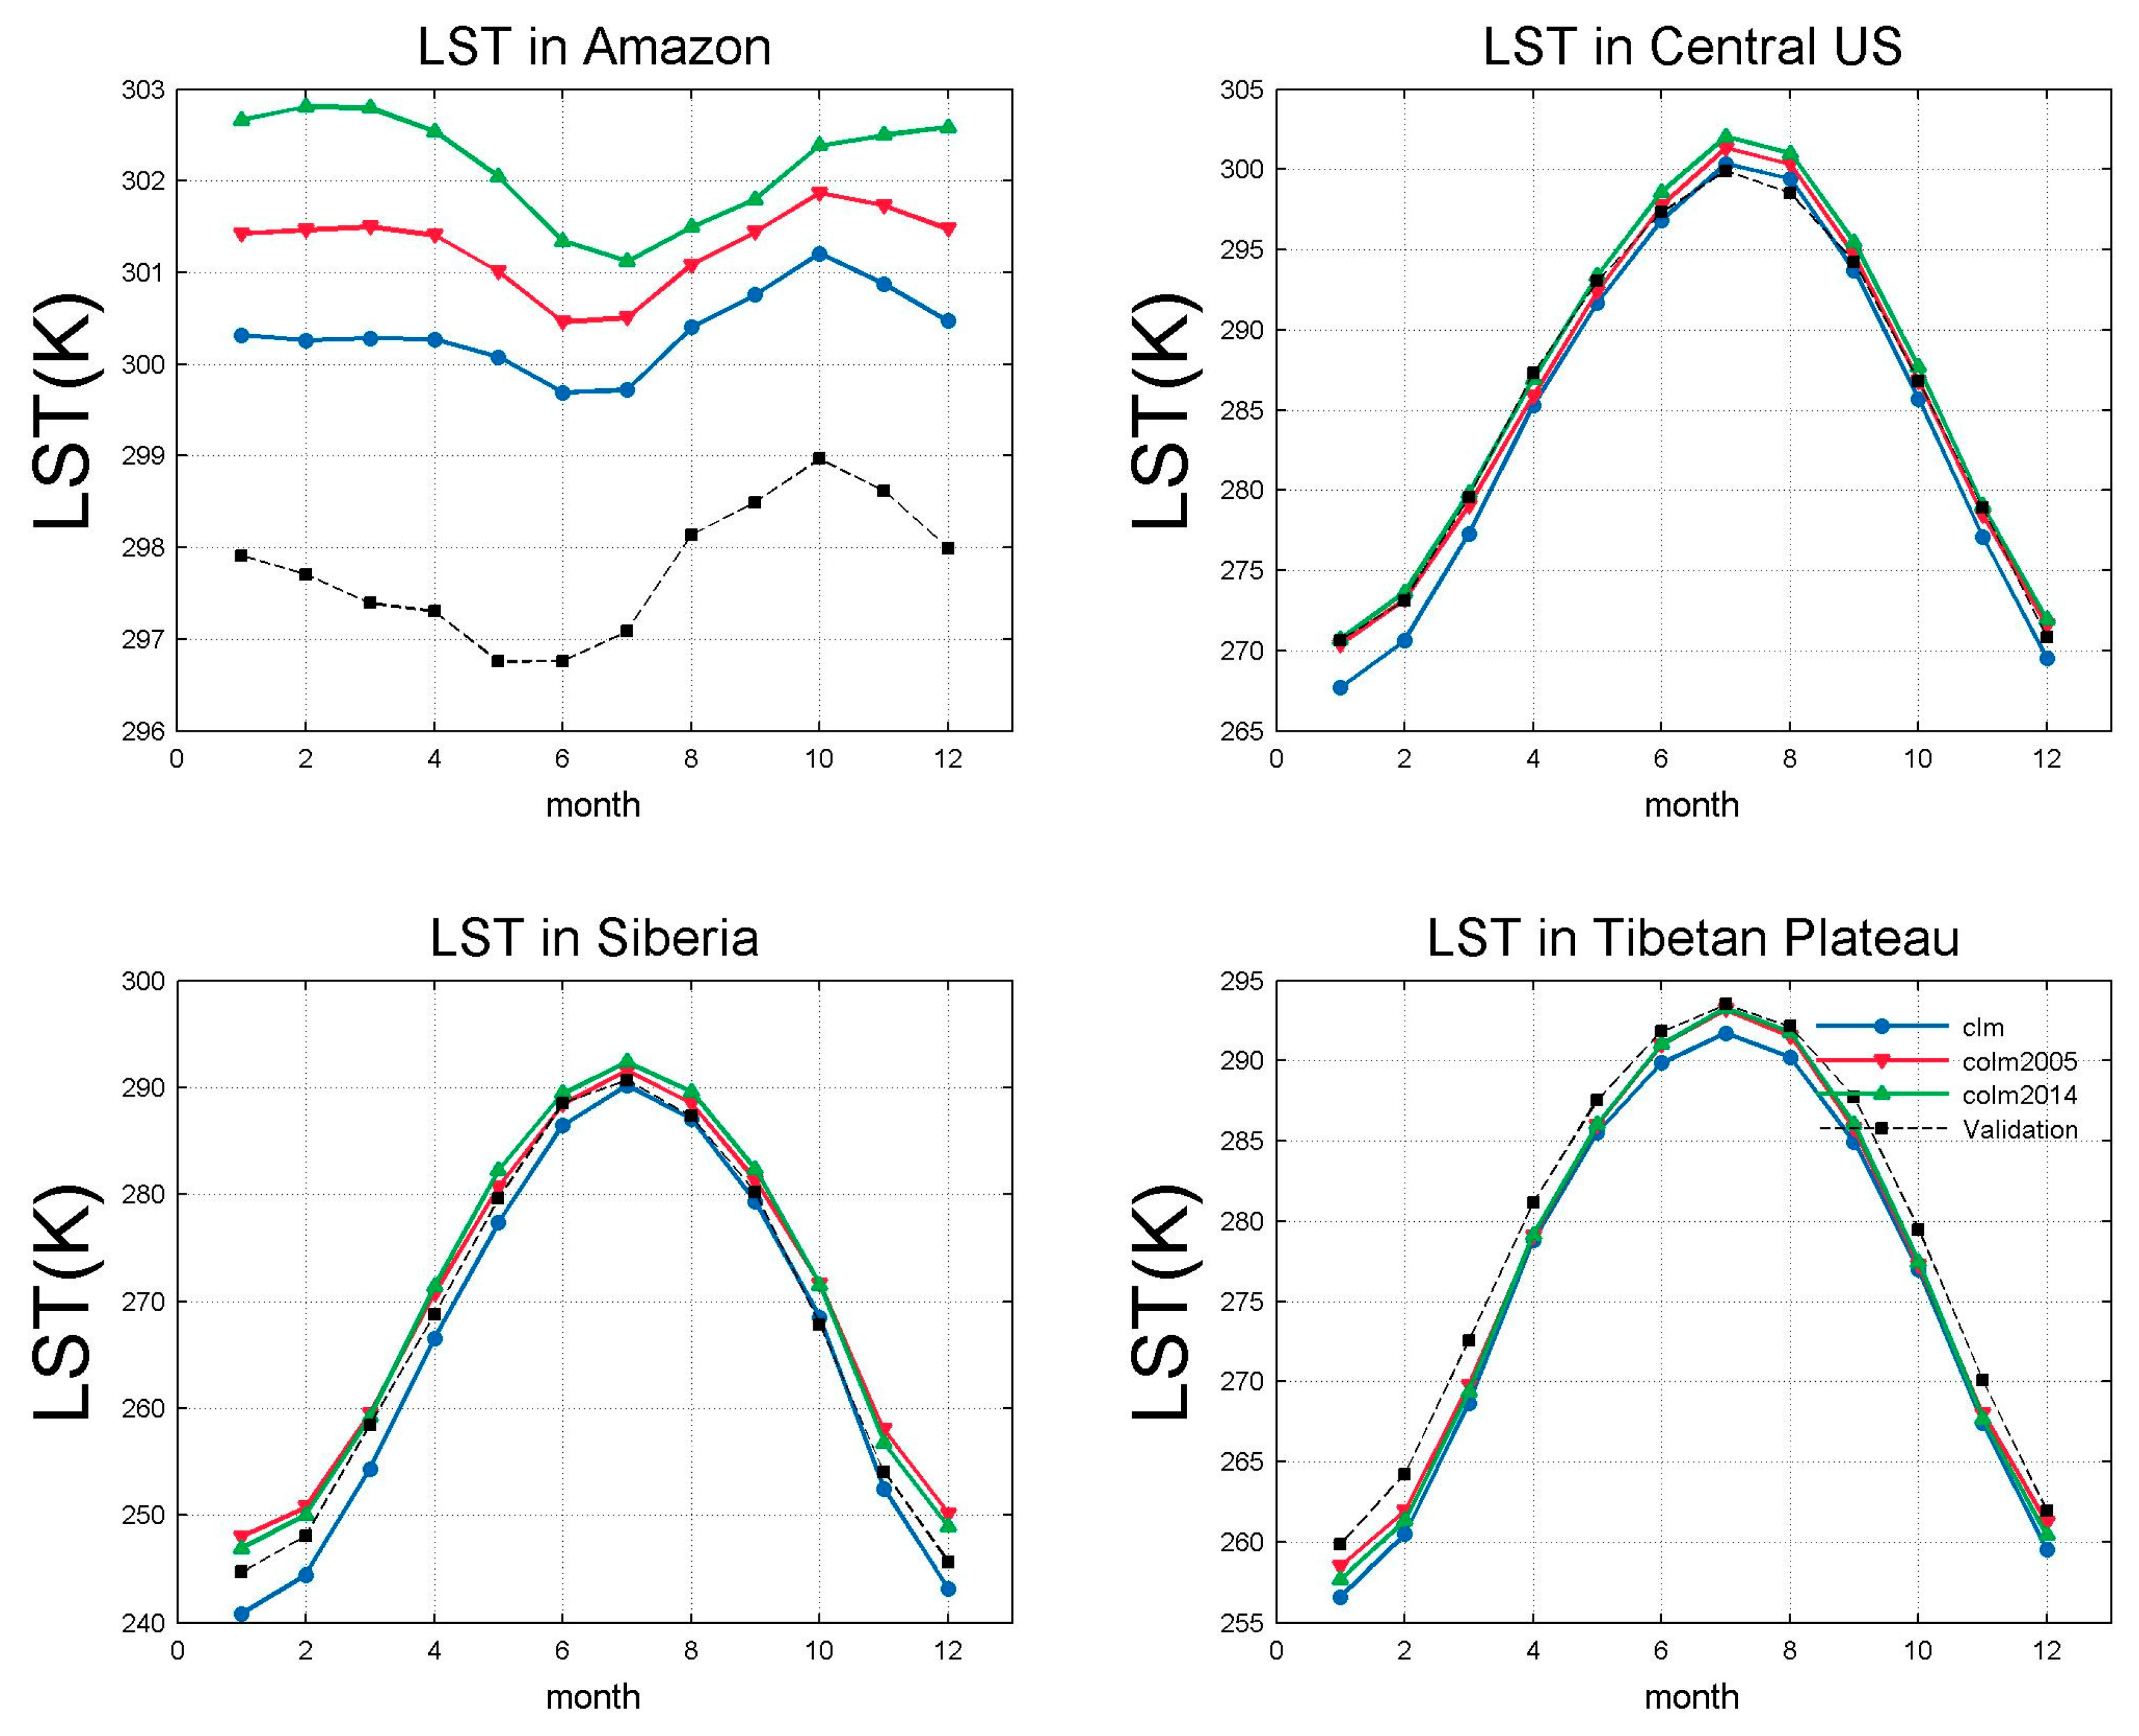
Annual cycles of simulated (colored lines) and observed (black dashed lines) runoff for the Amazon (10° S–0°, 70°–50° W), Central US (30°–50° N, 105°–90° W), Siberia (50°–66.5° N, 60°–140° E), and Tibetan Plateau (30°–50° N, 80°–100° E) regions (Units: mm day−1).
Figure 4.
Annual cycles of simulated (colored lines) and observed (black dashed lines) runoff for the Amazon (10° S–0°, 70°–50° W), Central US (30°–50° N, 105°–90° W), Siberia (50°–66.5° N, 60°–140° E), and Tibetan Plateau (30°–50° N, 80°–100° E) regions (Units: mm day−1).
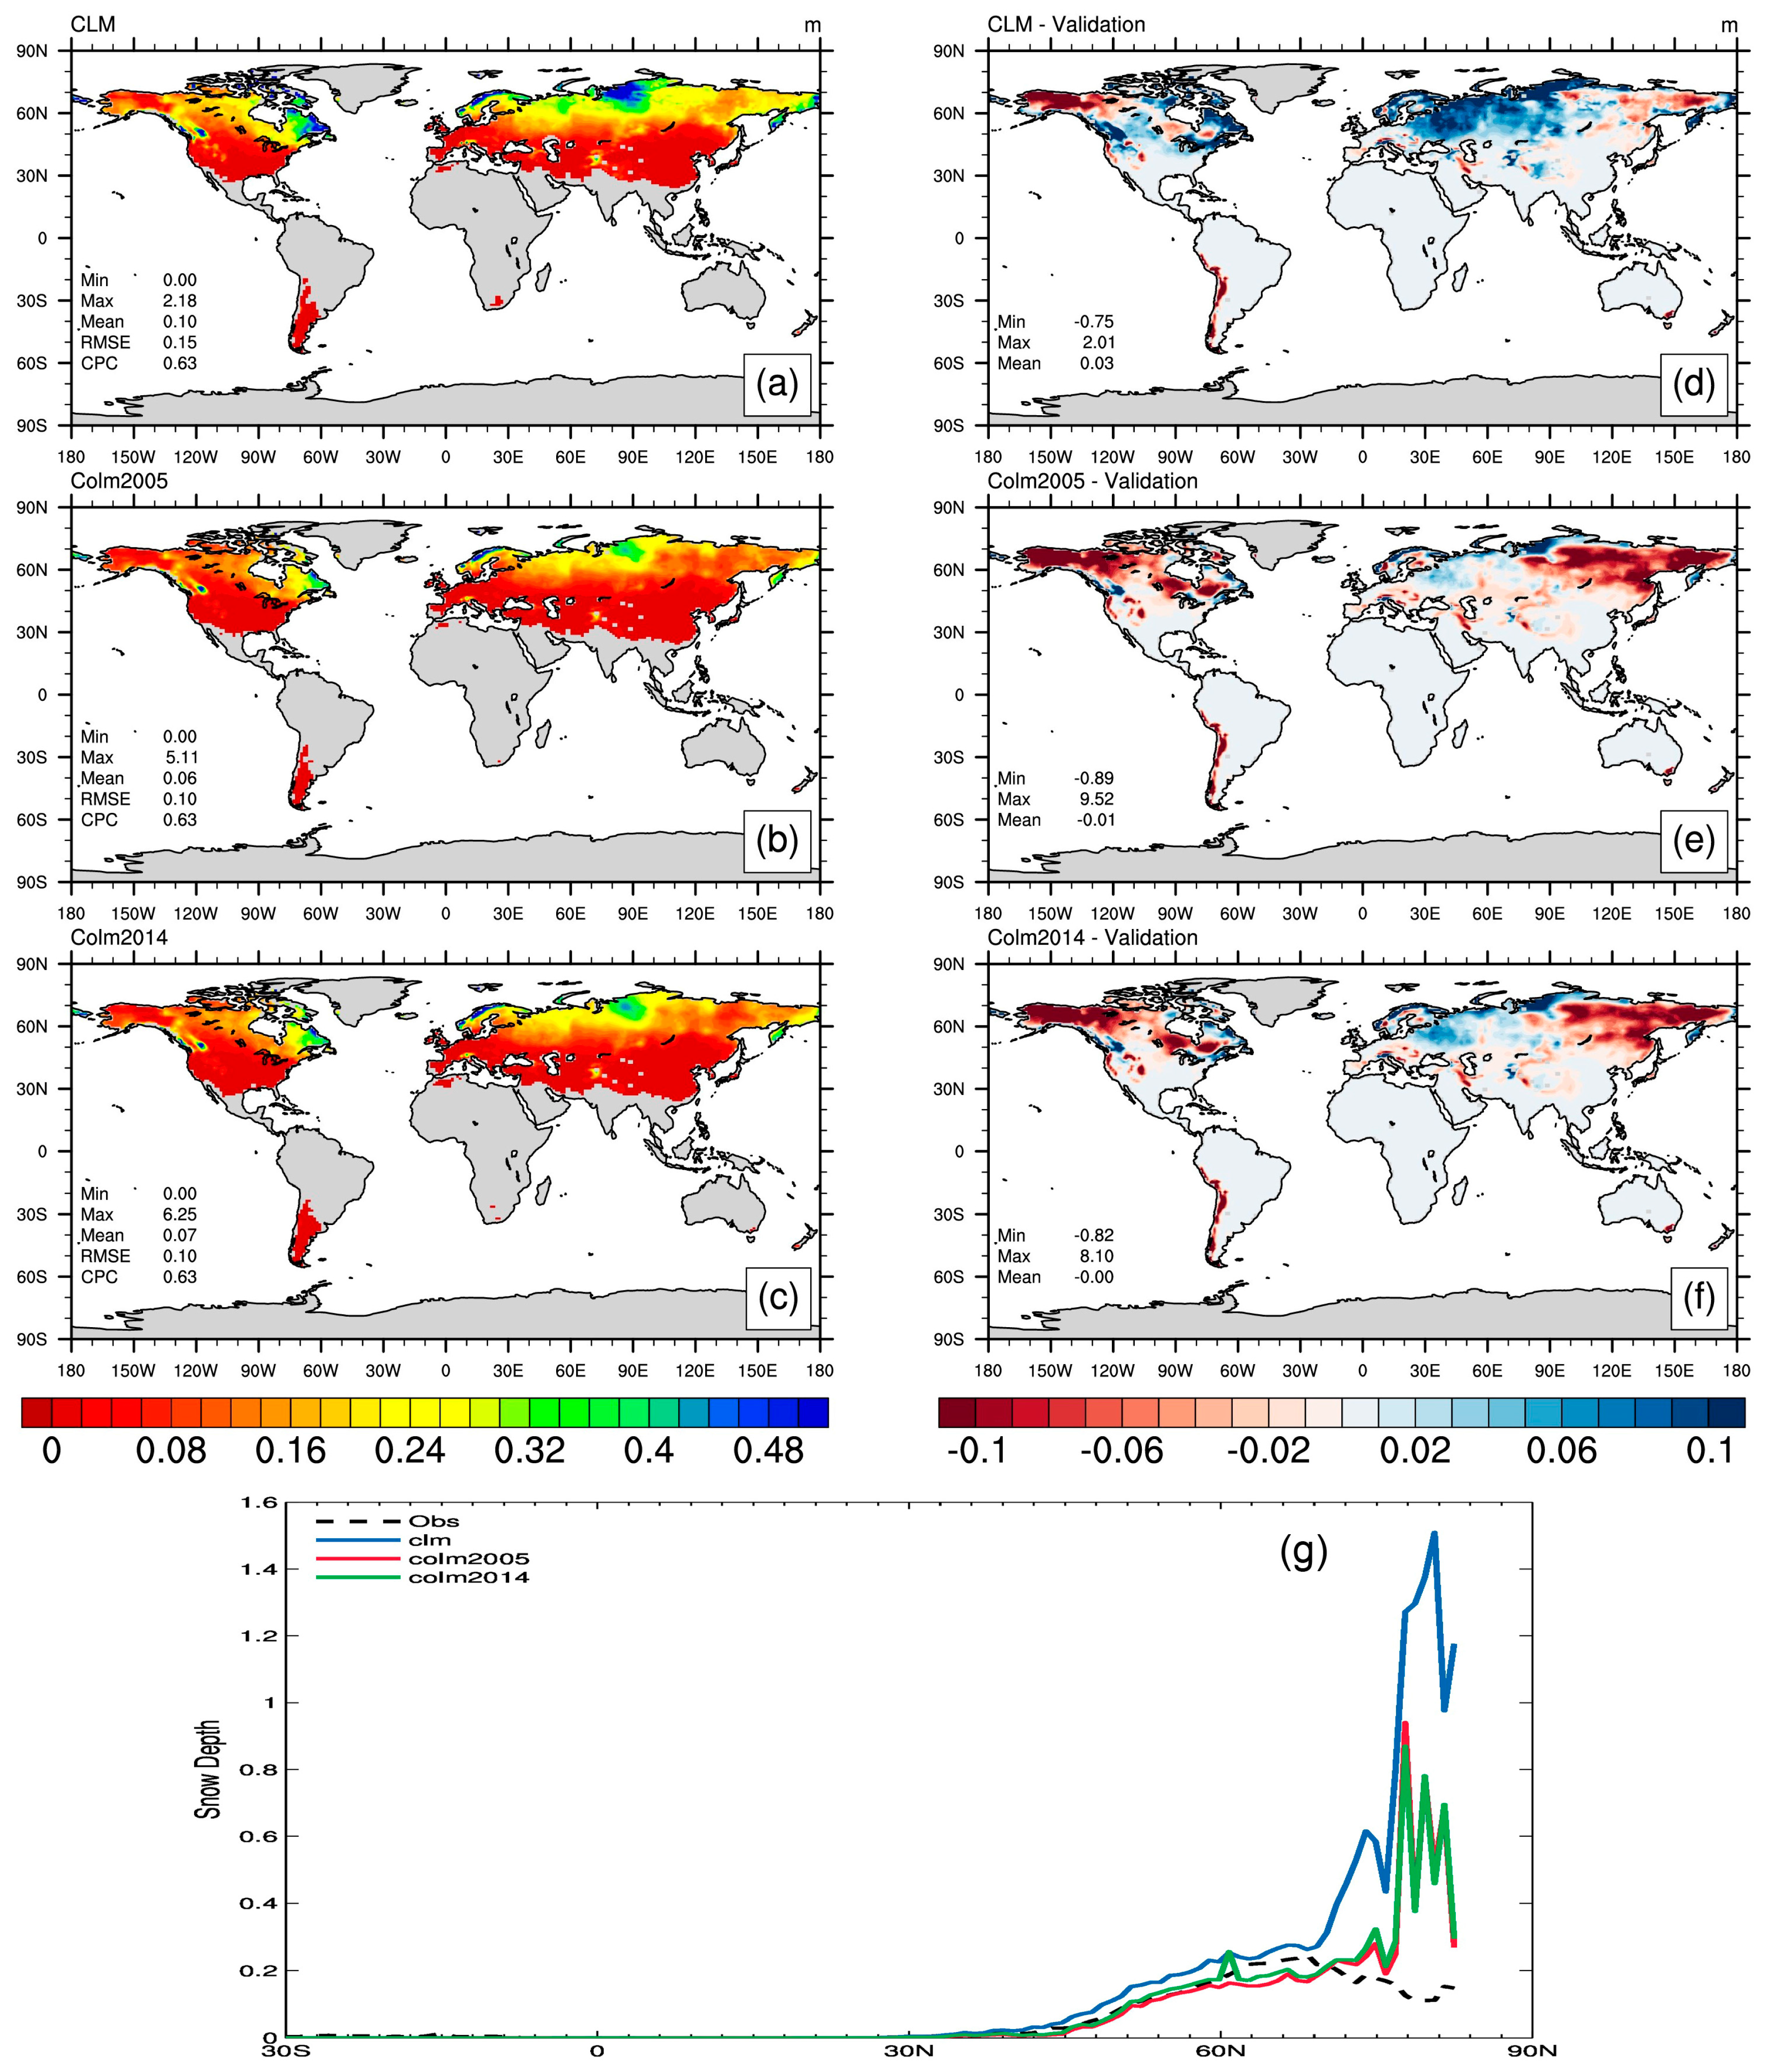
Figure 5.
Annual mean spatial distributions of snow depth simulated by (a) CLM4.5; (b) CoLM2005; and (c) CoLM2014; Along with spatial distributions of biases relative to the validation standard for (d) CLM4.5; (e) CoLM2005; and (f) CoLM2014; Panel (g) shows zonal mean snow depth from validation observations (black dashed line) and the CLM4.5 (blue), CoLM2005 (red), and CoLM2014 (green) simulations (Units: m).
Figure 6.
Same as
Figure 3, but for snow depth (Units: m).
Figure 6.
Same as
Figure 3, but for snow depth (Units: m).
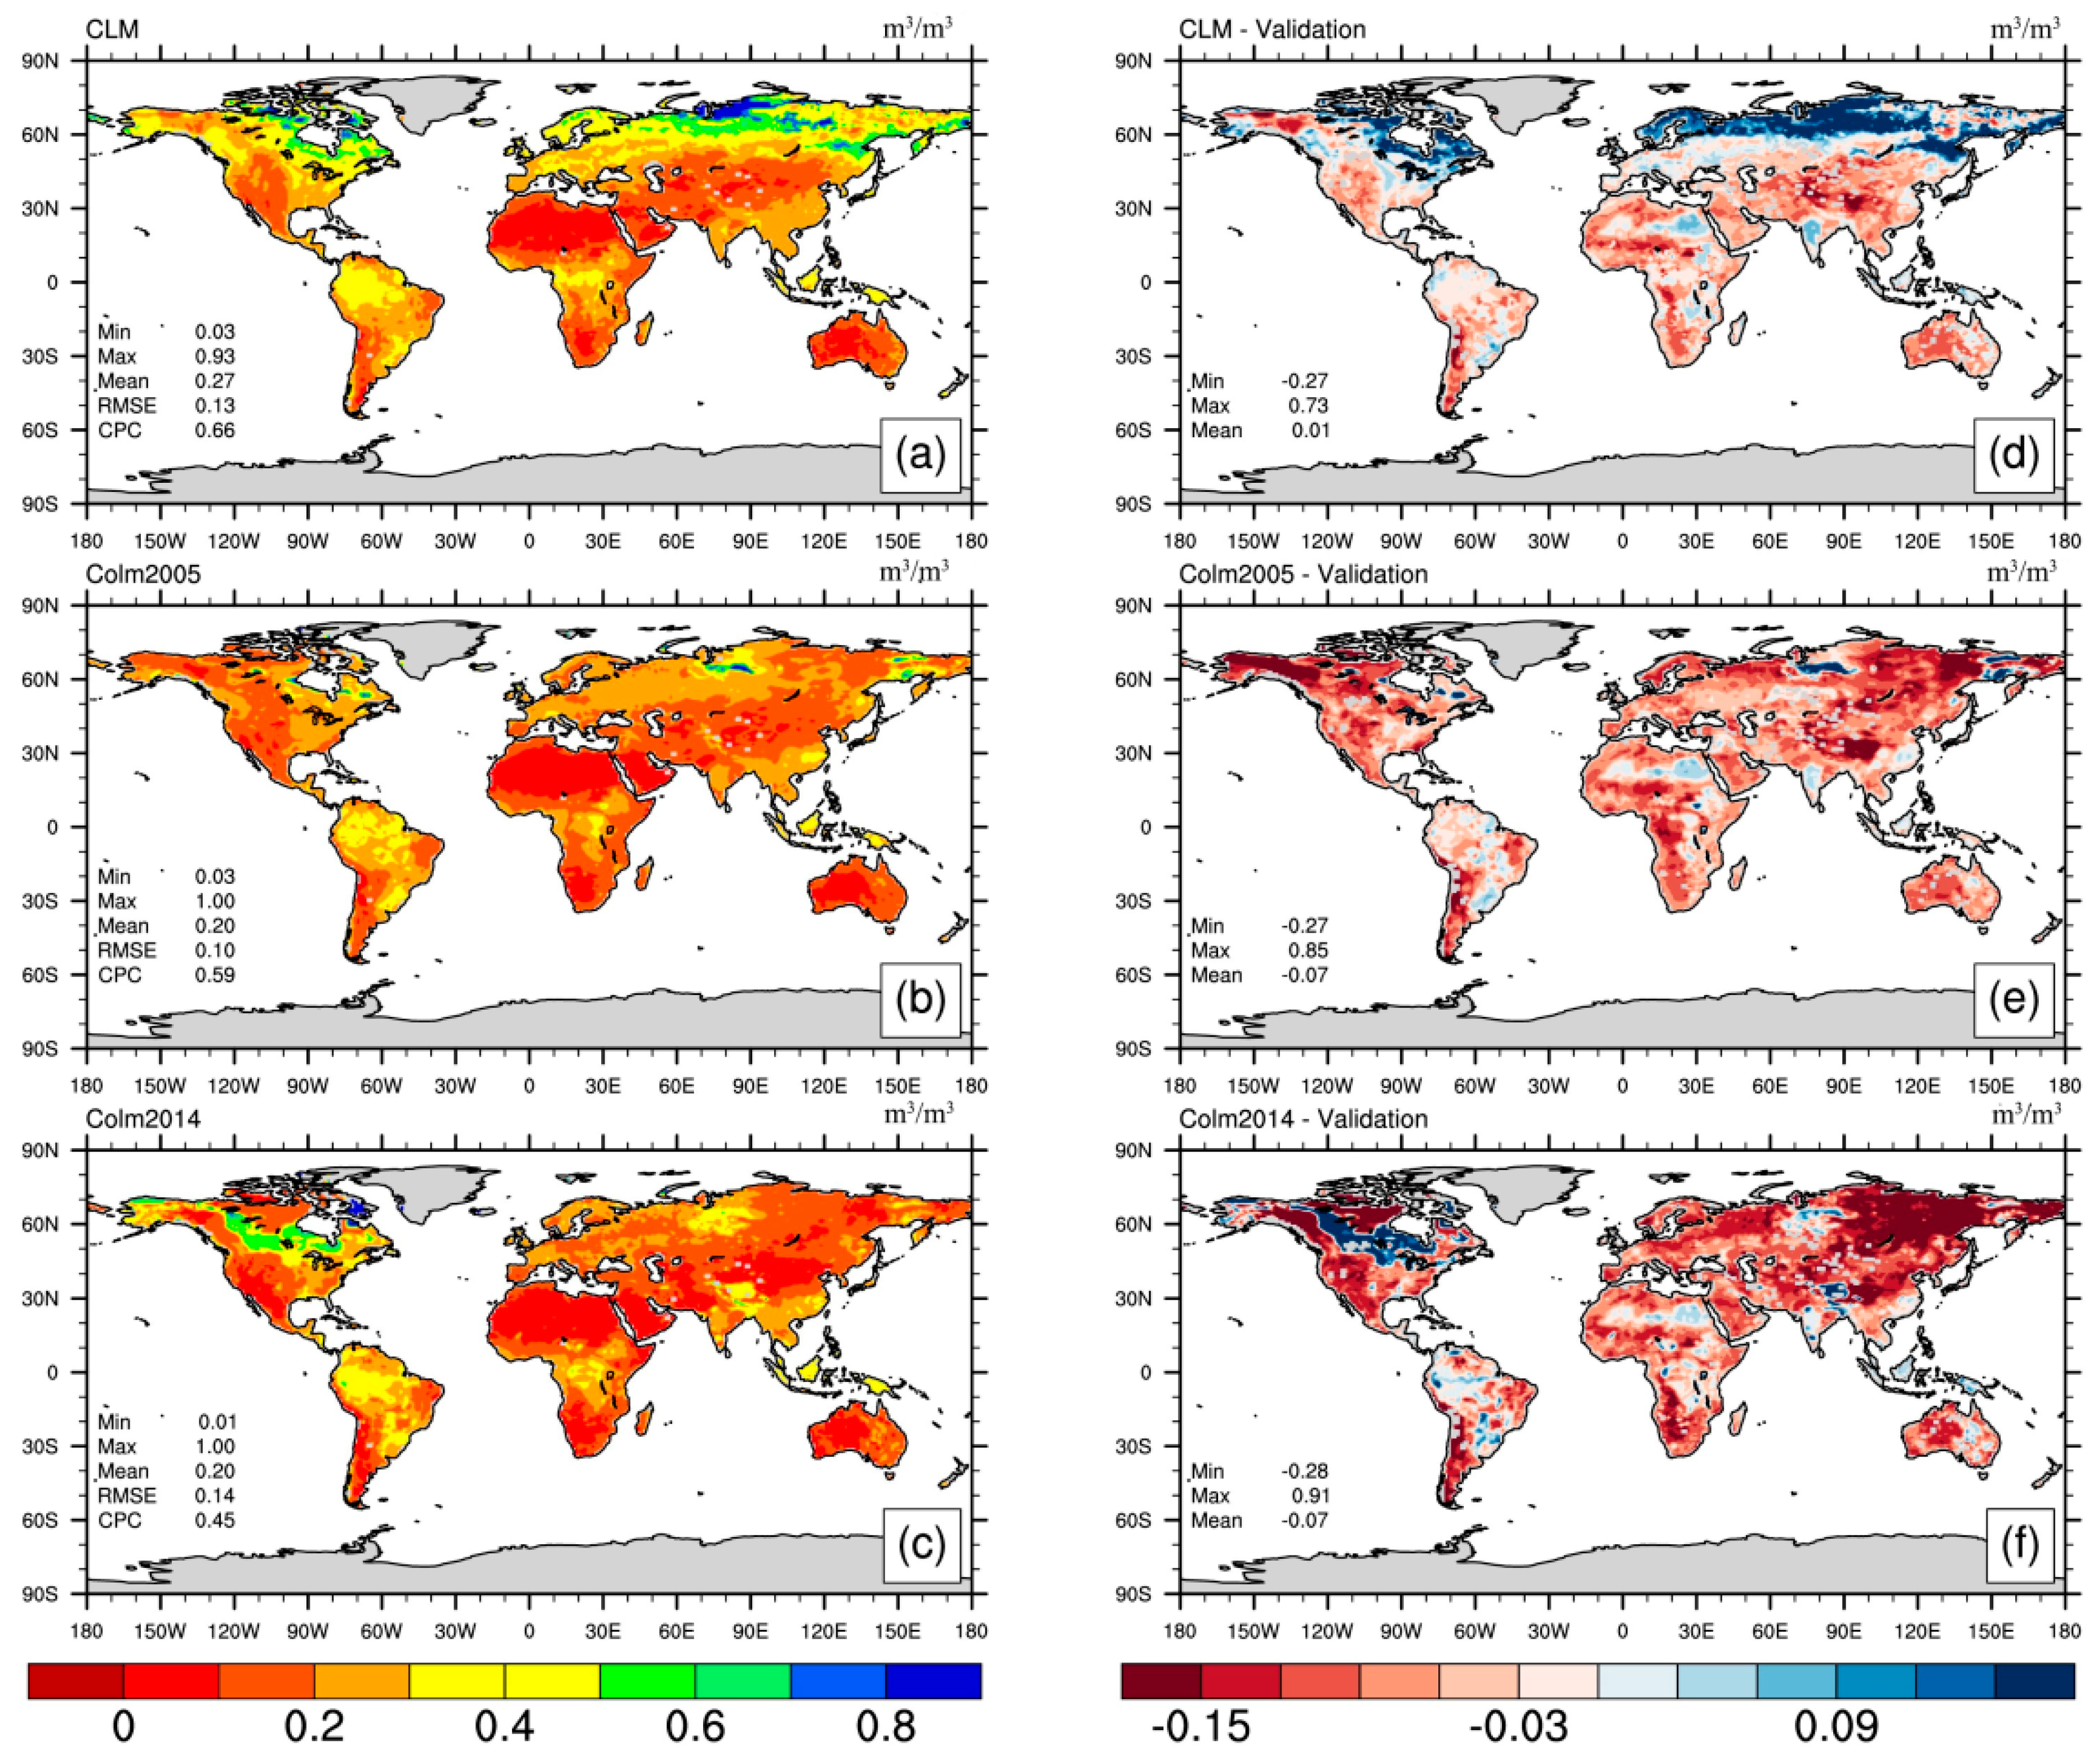
Figure 7.
Annual mean spatial distributions of surface soil moisture simulated by (a) CLM4.5; (b) CoLM2005; and (c) CoLM2014; Along with spatial distributions of biases relative to the validation standard for (d) CLM4.5; (e) CoLM2005; and (f) CoLM2014 (Units: m3 m−3).
Figure 7.
Annual mean spatial distributions of surface soil moisture simulated by (a) CLM4.5; (b) CoLM2005; and (c) CoLM2014; Along with spatial distributions of biases relative to the validation standard for (d) CLM4.5; (e) CoLM2005; and (f) CoLM2014 (Units: m3 m−3).
Figure 8.
Same as
Figure 3, but for surface soil moisture (Units: m
3 m
−3).
Figure 8.
Same as
Figure 3, but for surface soil moisture (Units: m
3 m
−3).
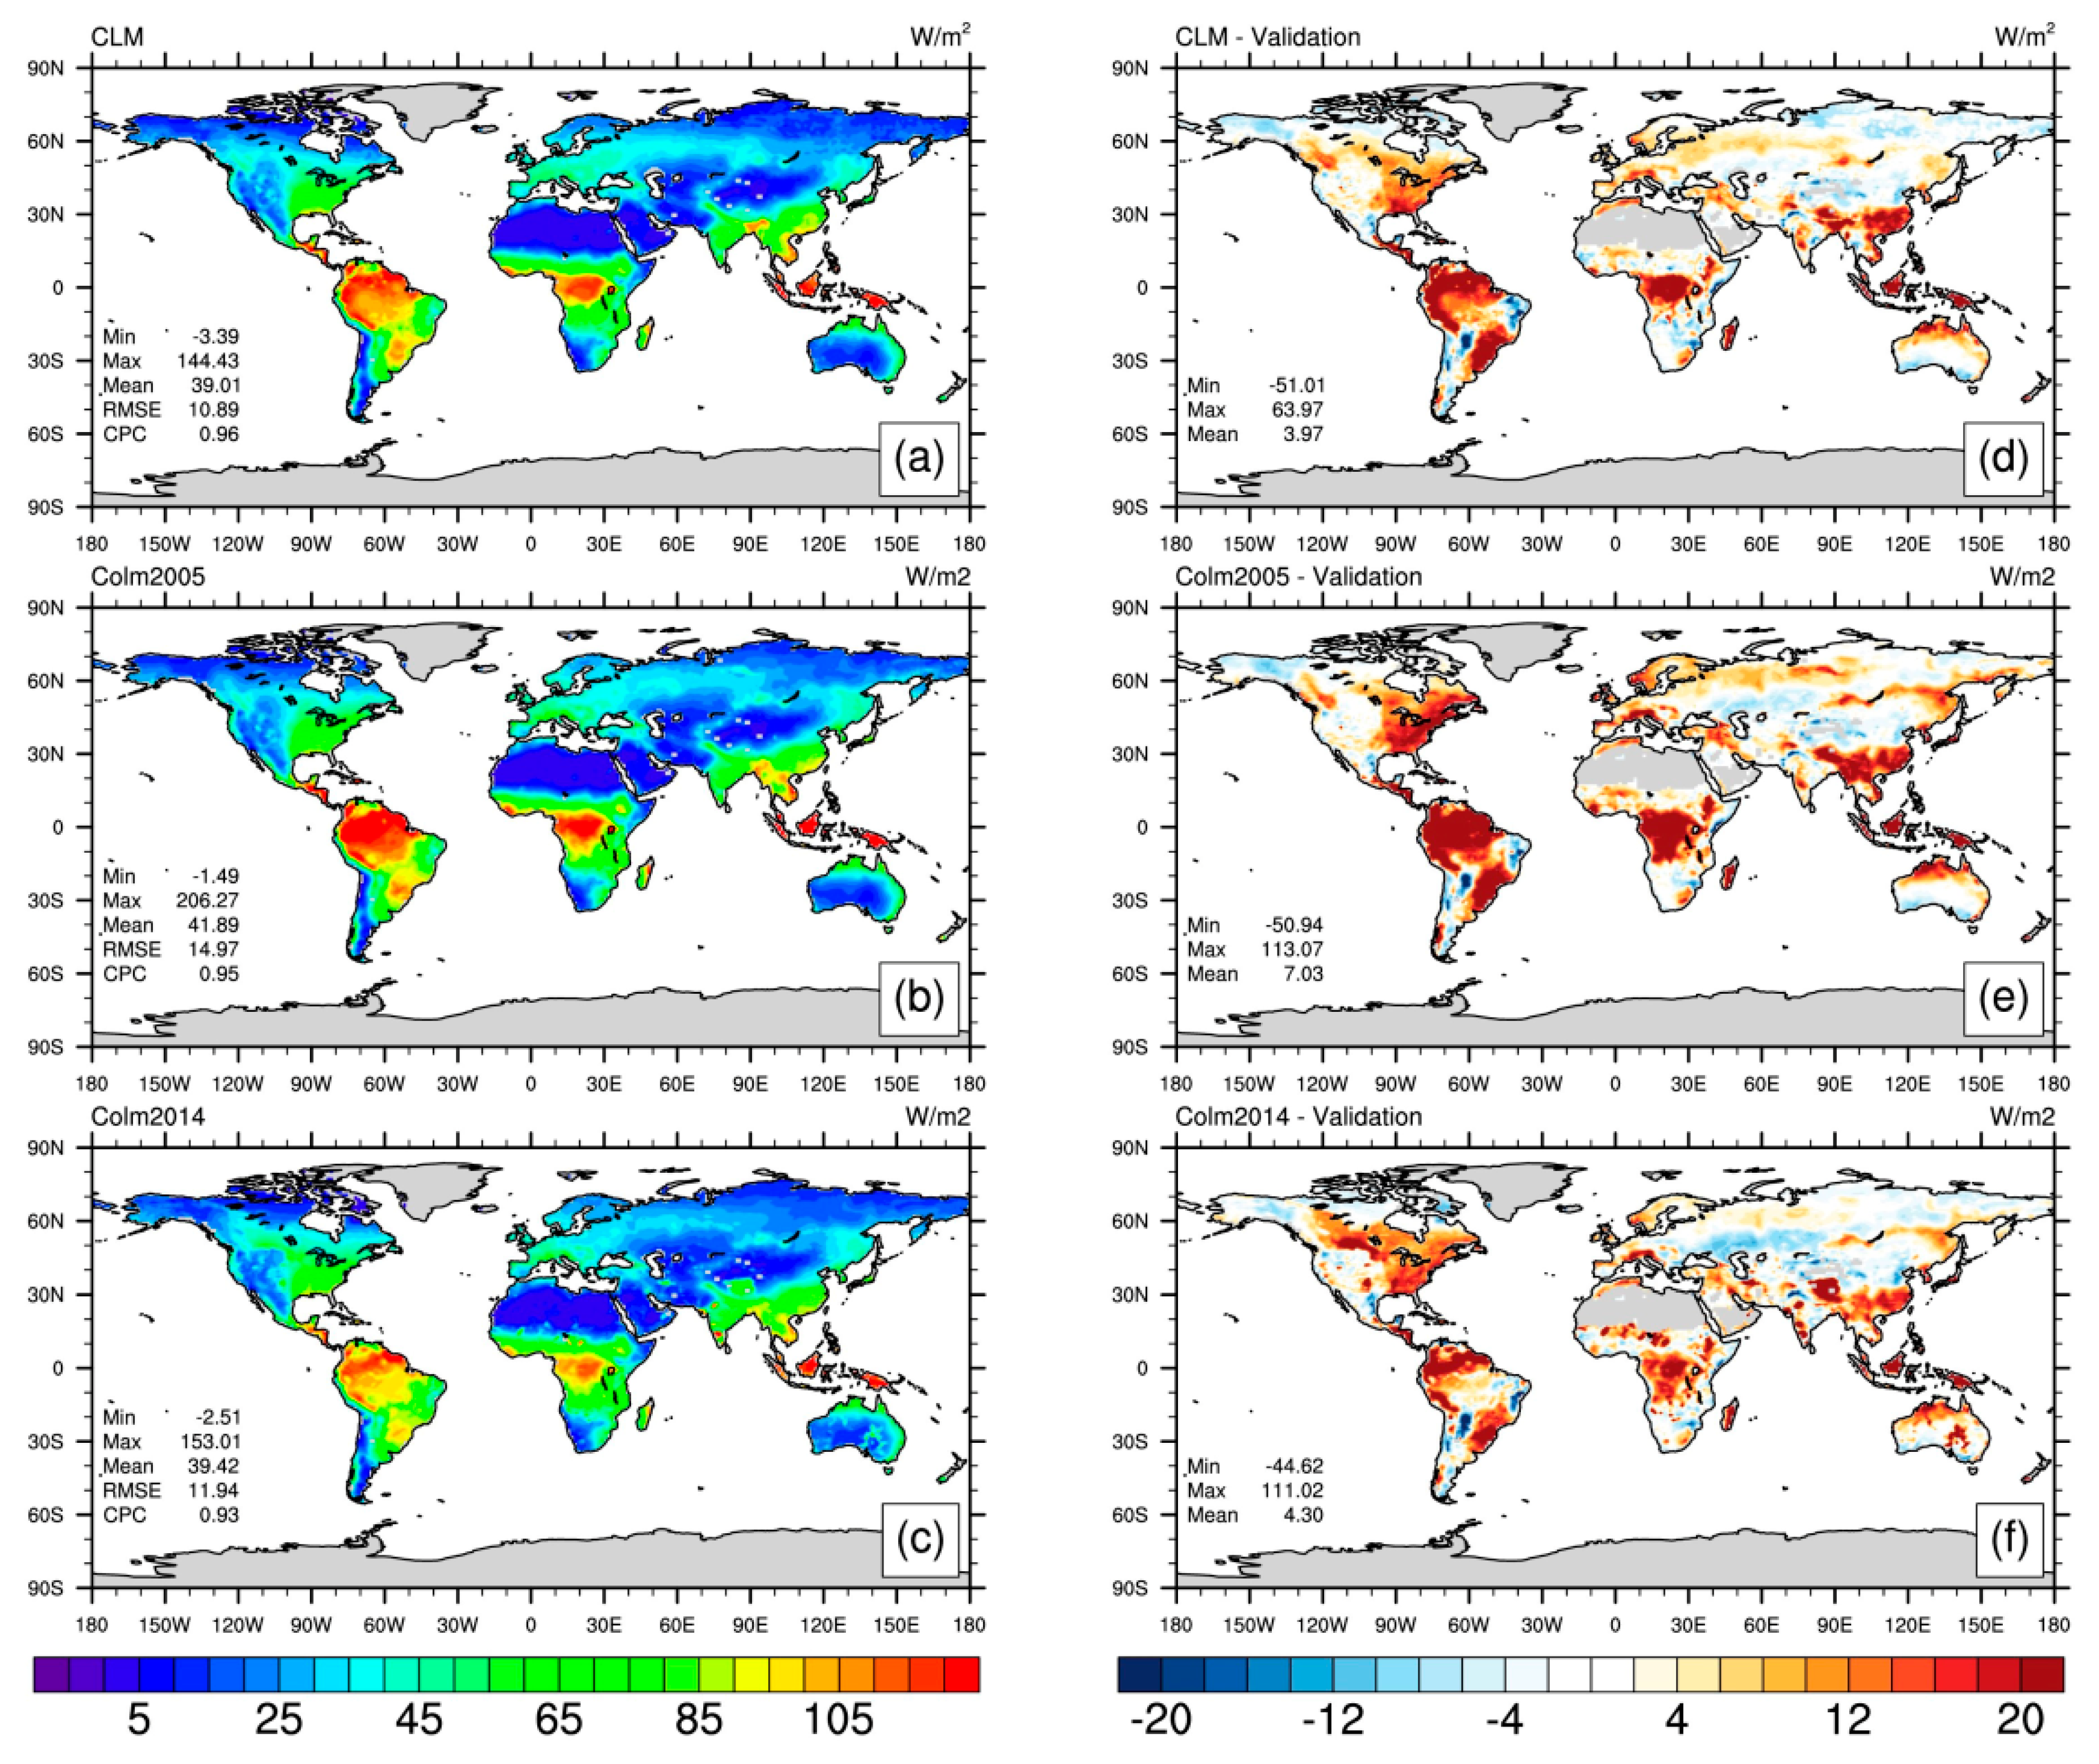
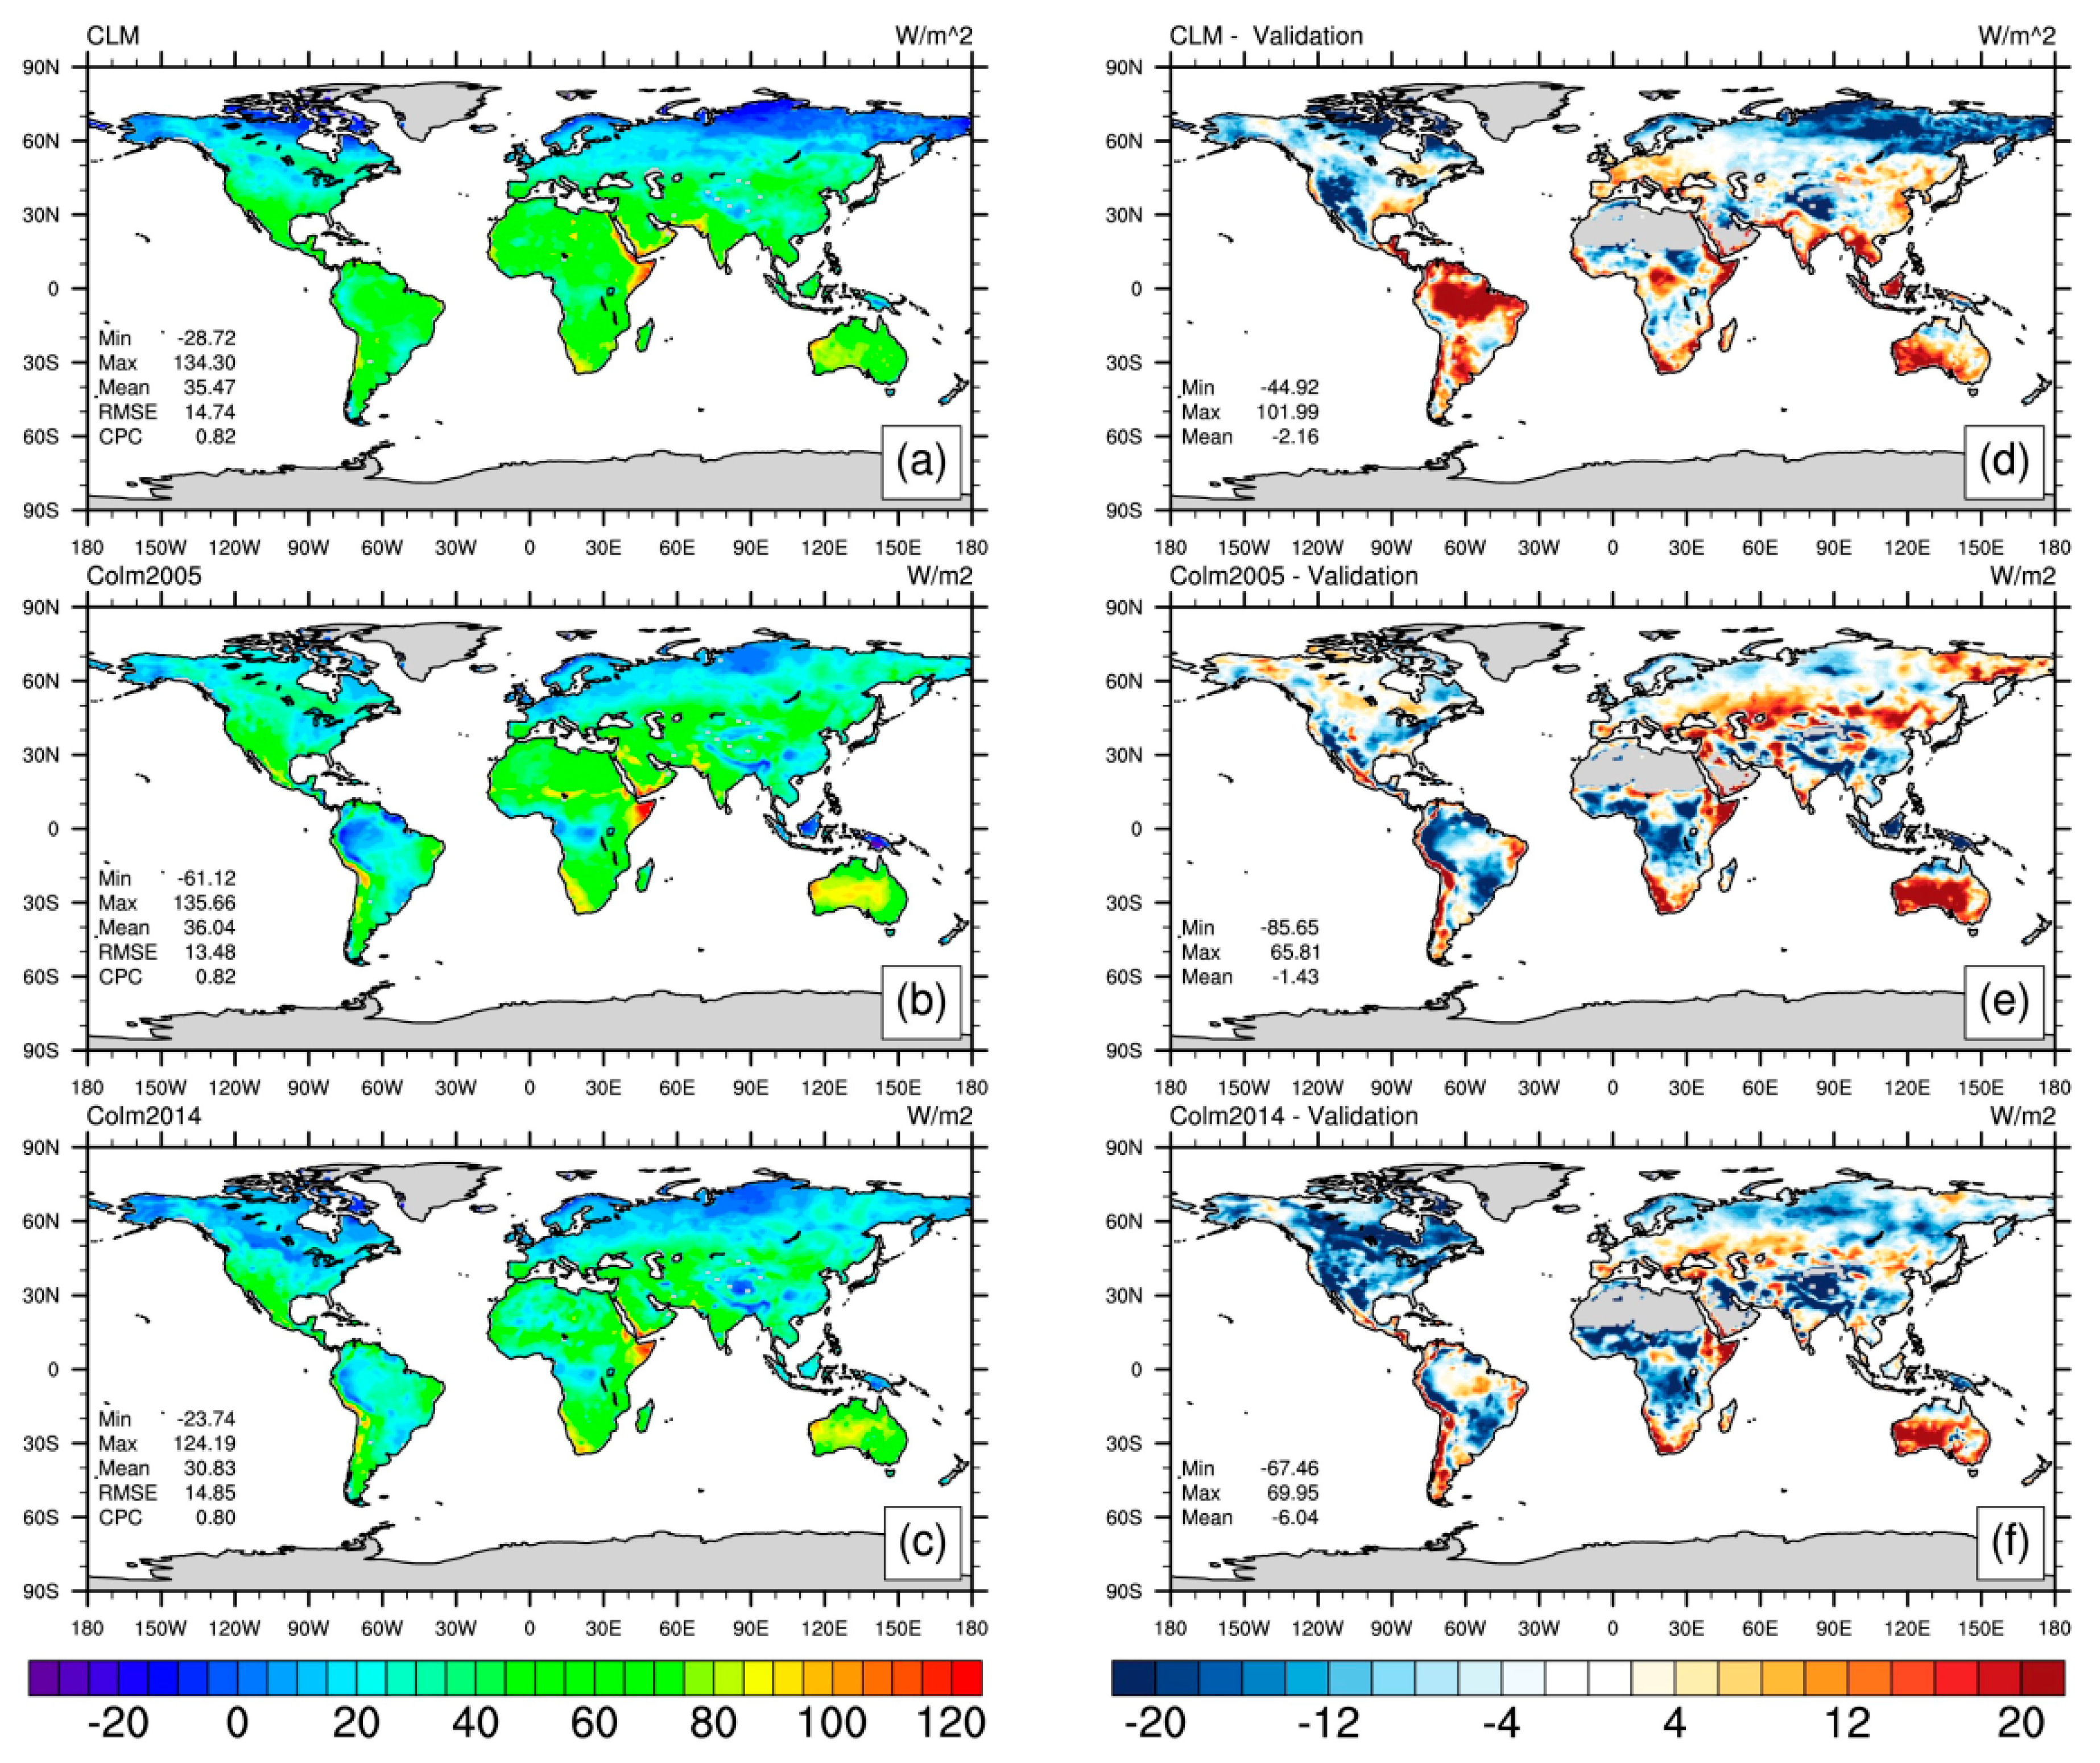
Figure 9.
Annual mean spatial distributions of latent heat flux simulated by (a) CLM4.5; (b) CoLM2005; and (c) CoLM2014; Along with spatial distributions of biases relative to the validation standard for (d) CLM4.5; (e) CoLM2005; and (f) CoLM2014 (Units: W m−2).
Figure 9.
Annual mean spatial distributions of latent heat flux simulated by (a) CLM4.5; (b) CoLM2005; and (c) CoLM2014; Along with spatial distributions of biases relative to the validation standard for (d) CLM4.5; (e) CoLM2005; and (f) CoLM2014 (Units: W m−2).
Figure 10.
Same as
Figure 3, but for latent heat flux (Units: W m
−2).
Figure 10.
Same as
Figure 3, but for latent heat flux (Units: W m
−2).
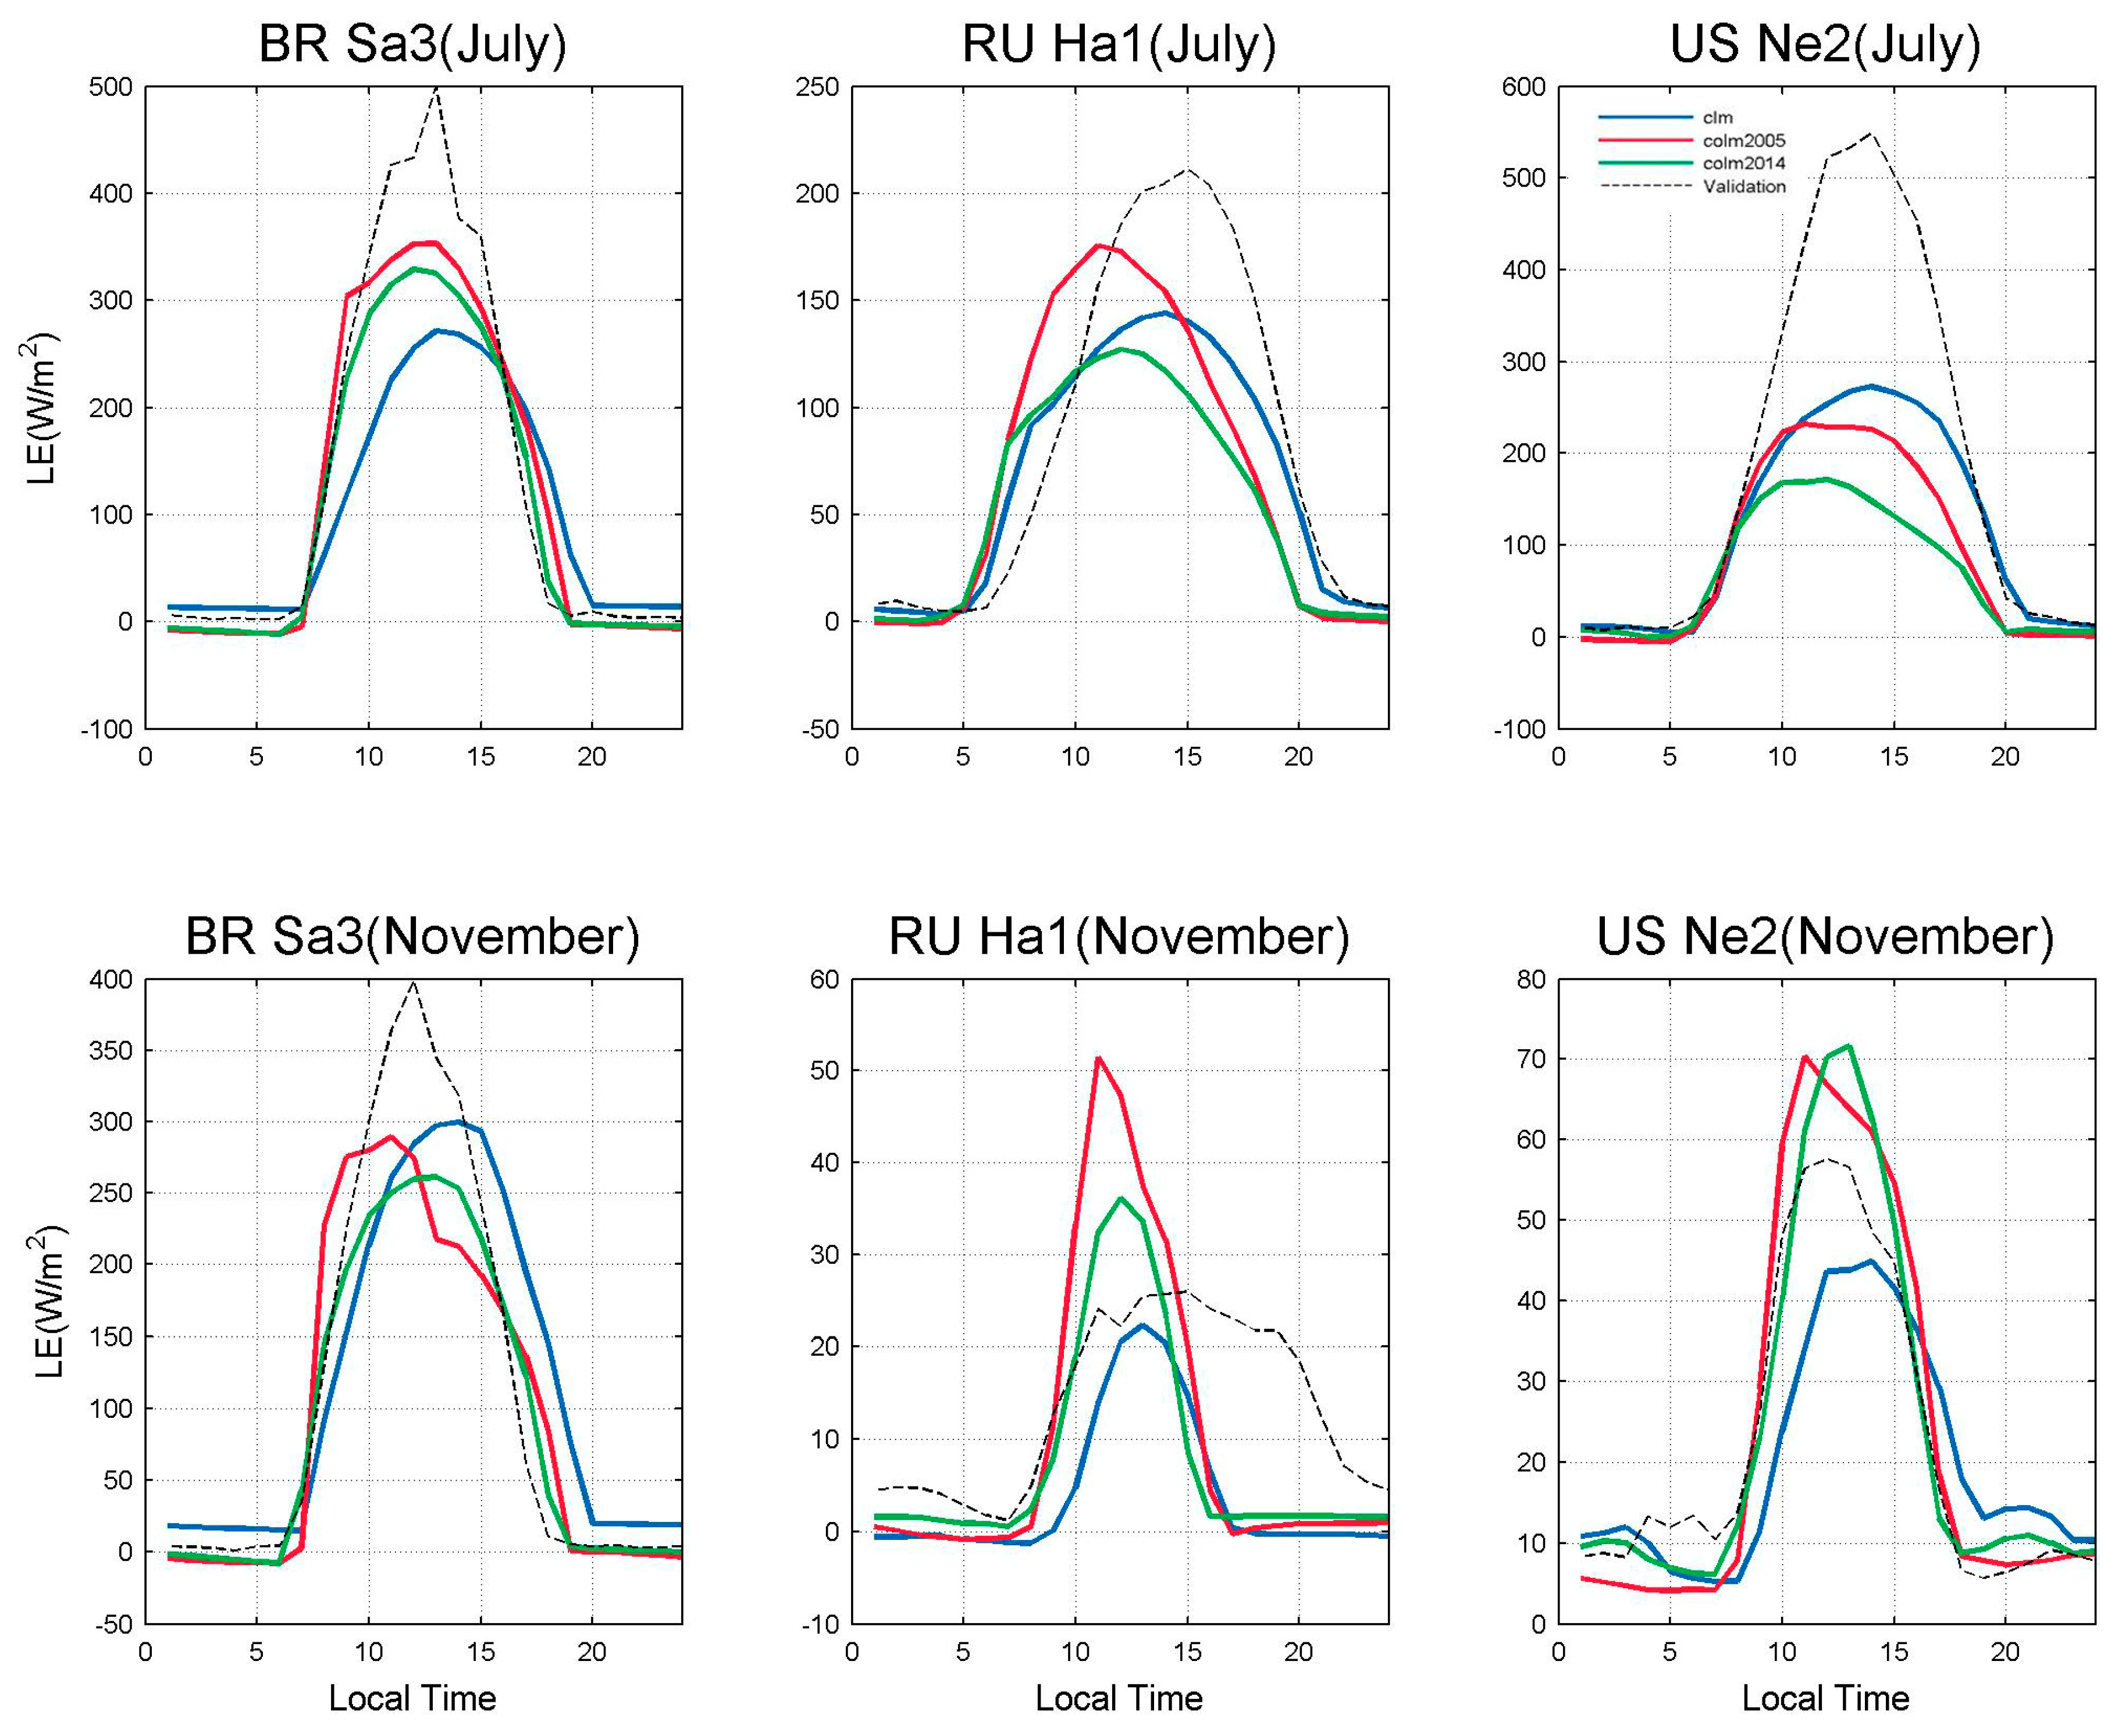
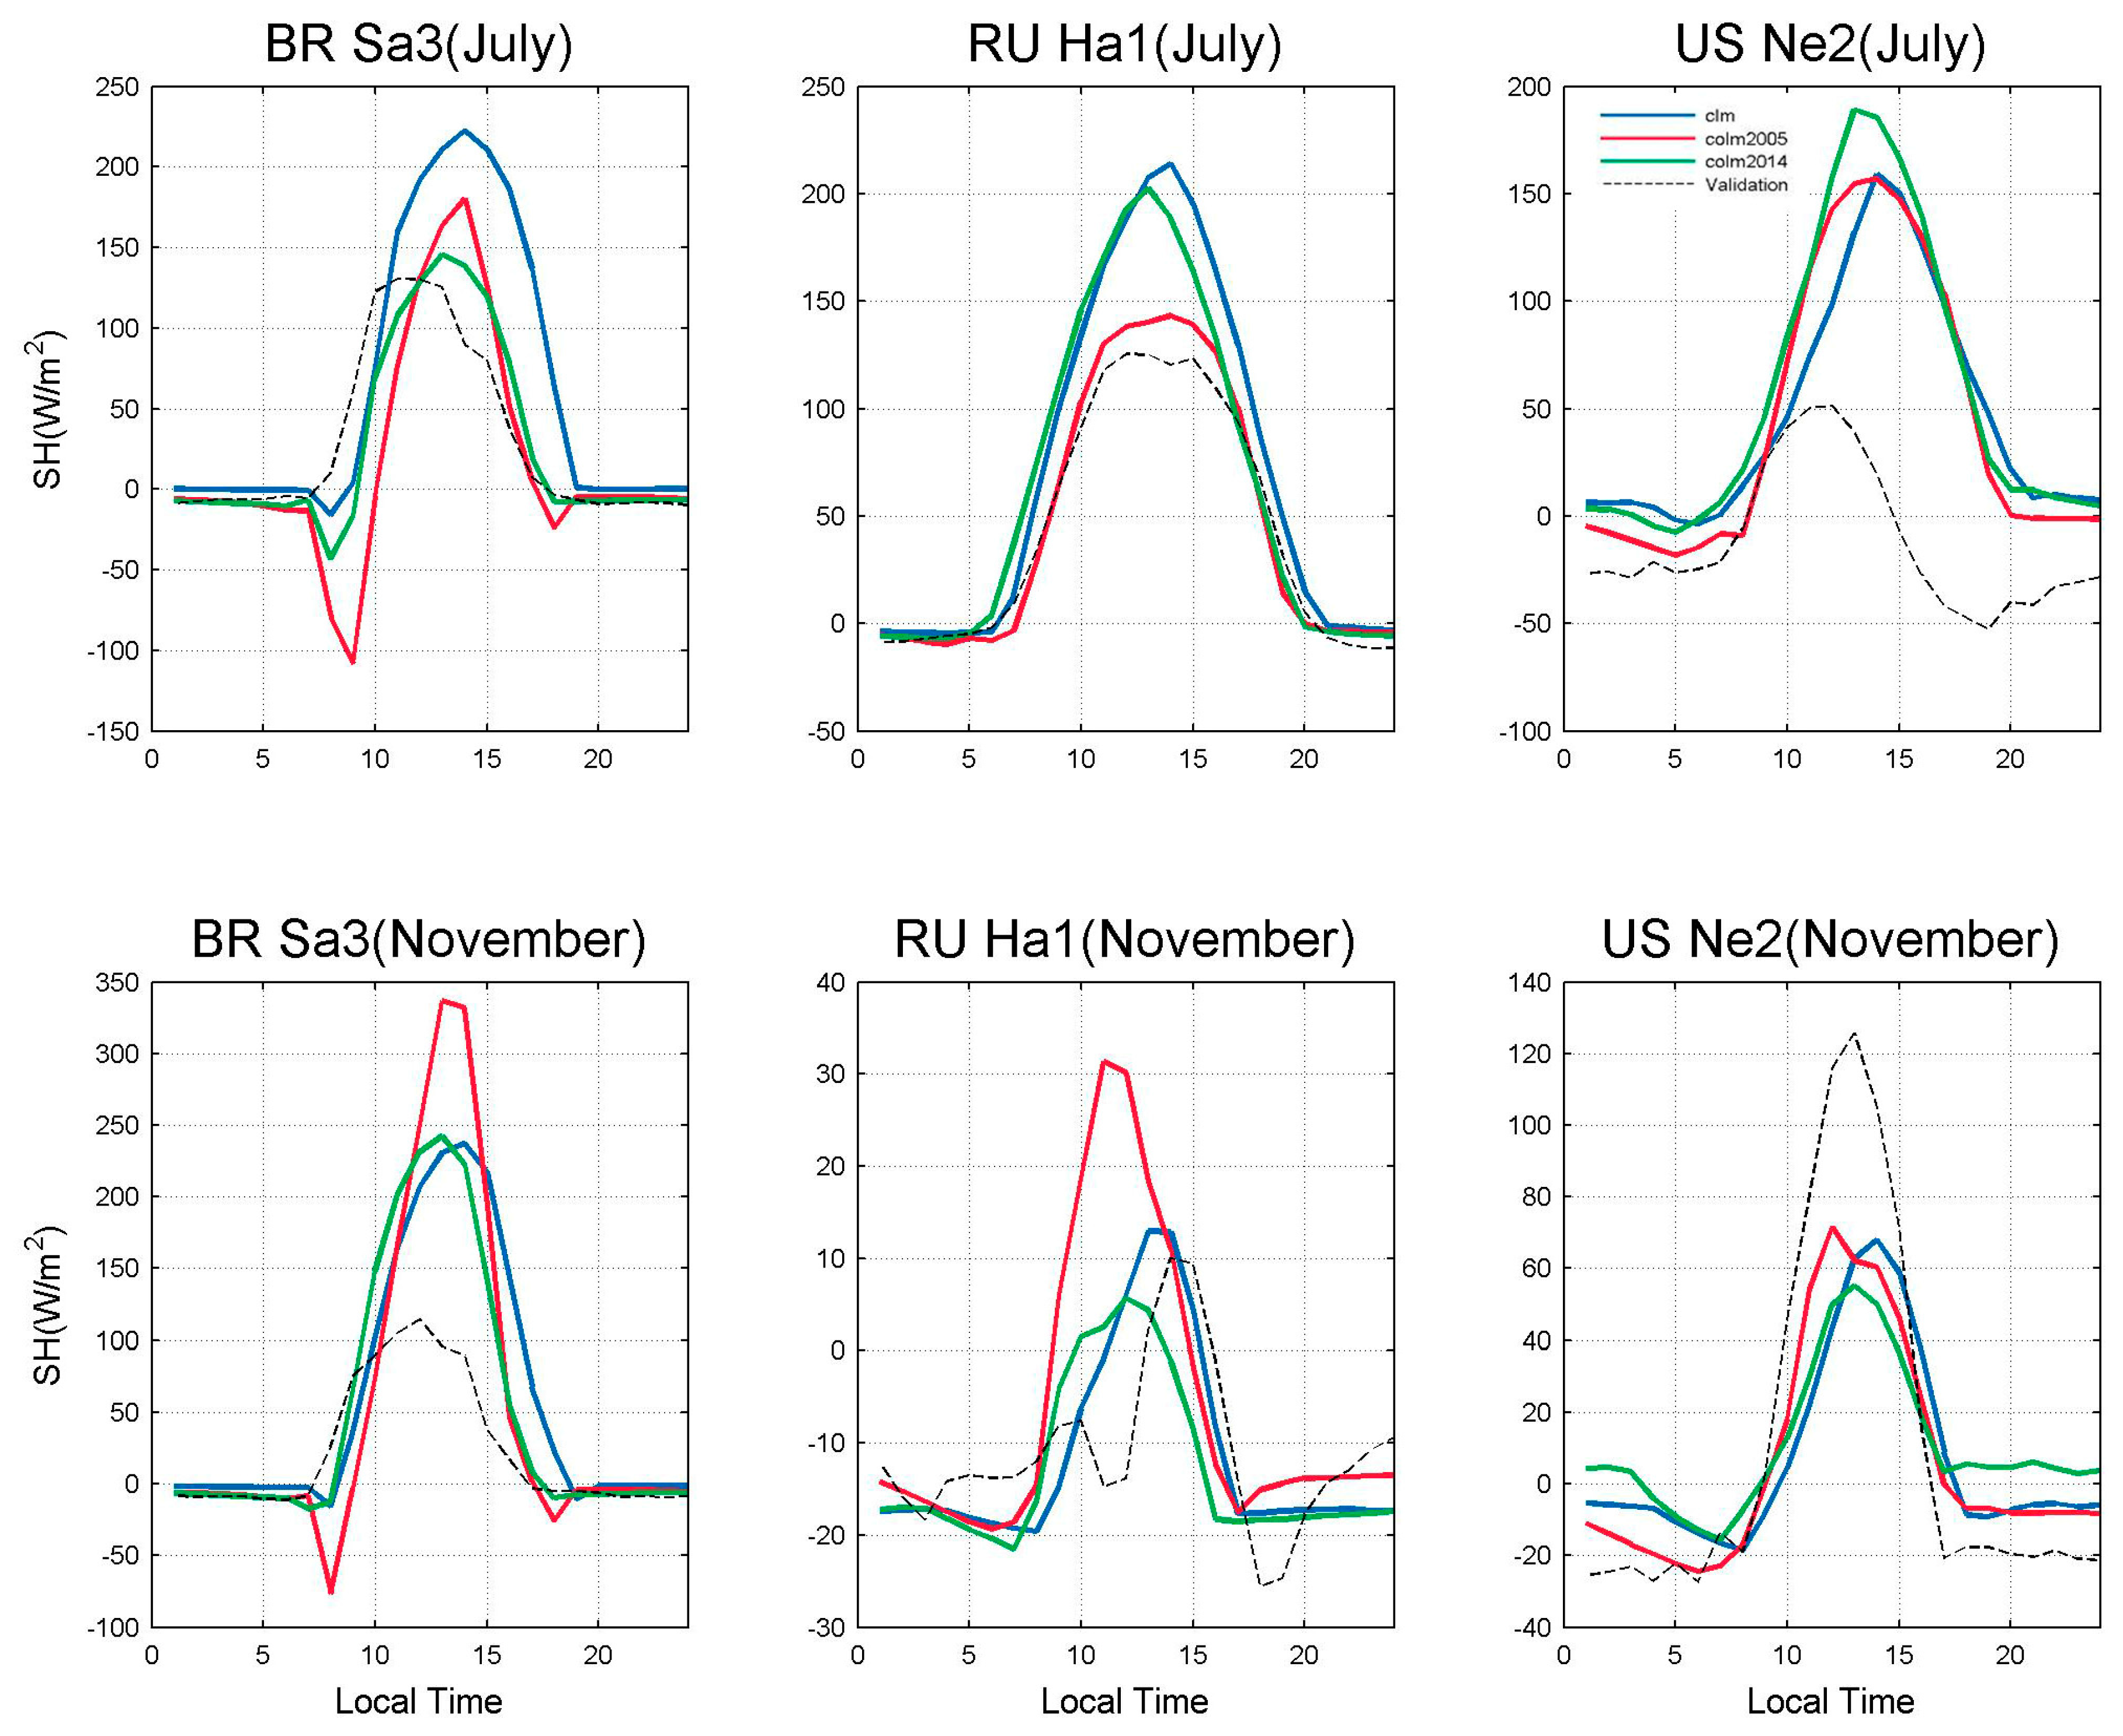
Figure 11.
Monthly mean diurnal cycles of latent heat flux at three sites (BR-Sa3, RU-Ha1, and US-Ne2) during two months (July and November 2003) (Units: W m−2).
Figure 11.
Monthly mean diurnal cycles of latent heat flux at three sites (BR-Sa3, RU-Ha1, and US-Ne2) during two months (July and November 2003) (Units: W m−2).
Figure 12.
Annual mean spatial distributions of sensible heat flux simulated by (a) CLM4.5; (b) CoLM2005; and (c) CoLM2014; Along with spatial distributions of biases relative to the validation standard for (d) CLM4.5; (e) CoLM2005; and (f) CoLM2014 (Units: W m−2).
Figure 12.
Annual mean spatial distributions of sensible heat flux simulated by (a) CLM4.5; (b) CoLM2005; and (c) CoLM2014; Along with spatial distributions of biases relative to the validation standard for (d) CLM4.5; (e) CoLM2005; and (f) CoLM2014 (Units: W m−2).
Figure 13.
Same as
Figure 3, but for sensible heat flux (Units: W m
−2).
Figure 13.
Same as
Figure 3, but for sensible heat flux (Units: W m
−2).
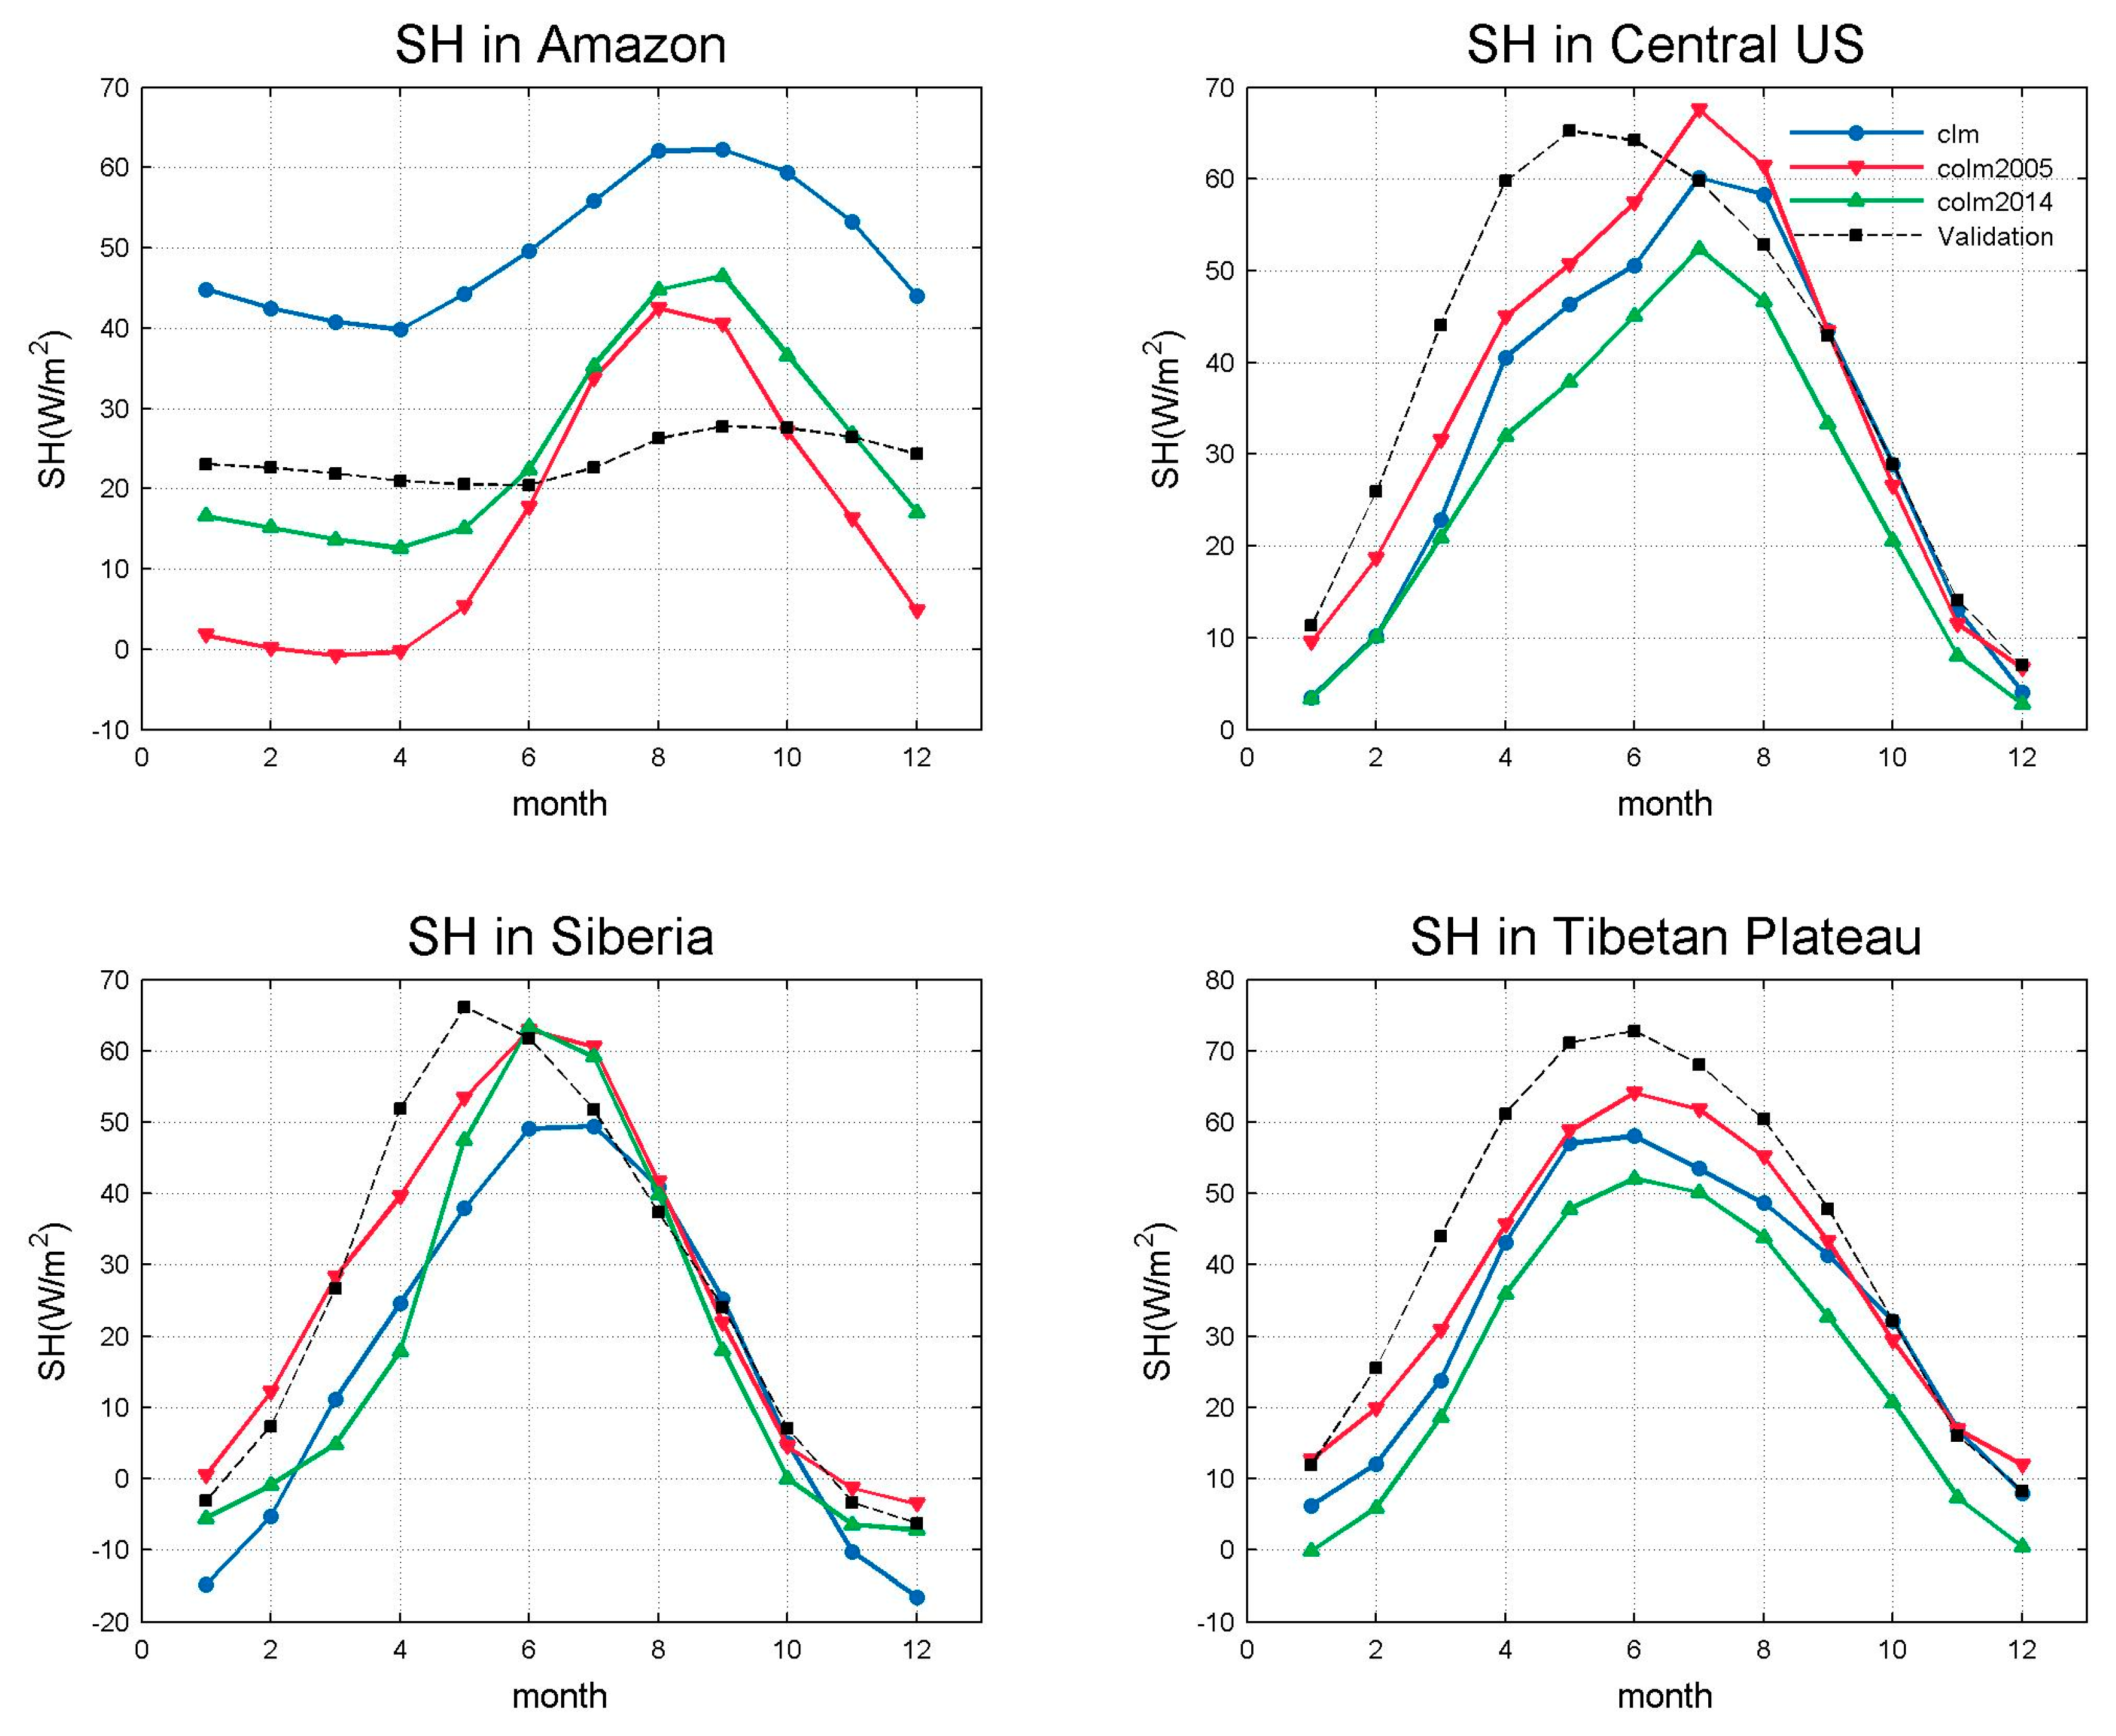
Figure 14.
Same as
Figure 11, but for sensible heat flux (Units: W m
−2).
Figure 14.
Same as
Figure 11, but for sensible heat flux (Units: W m
−2).
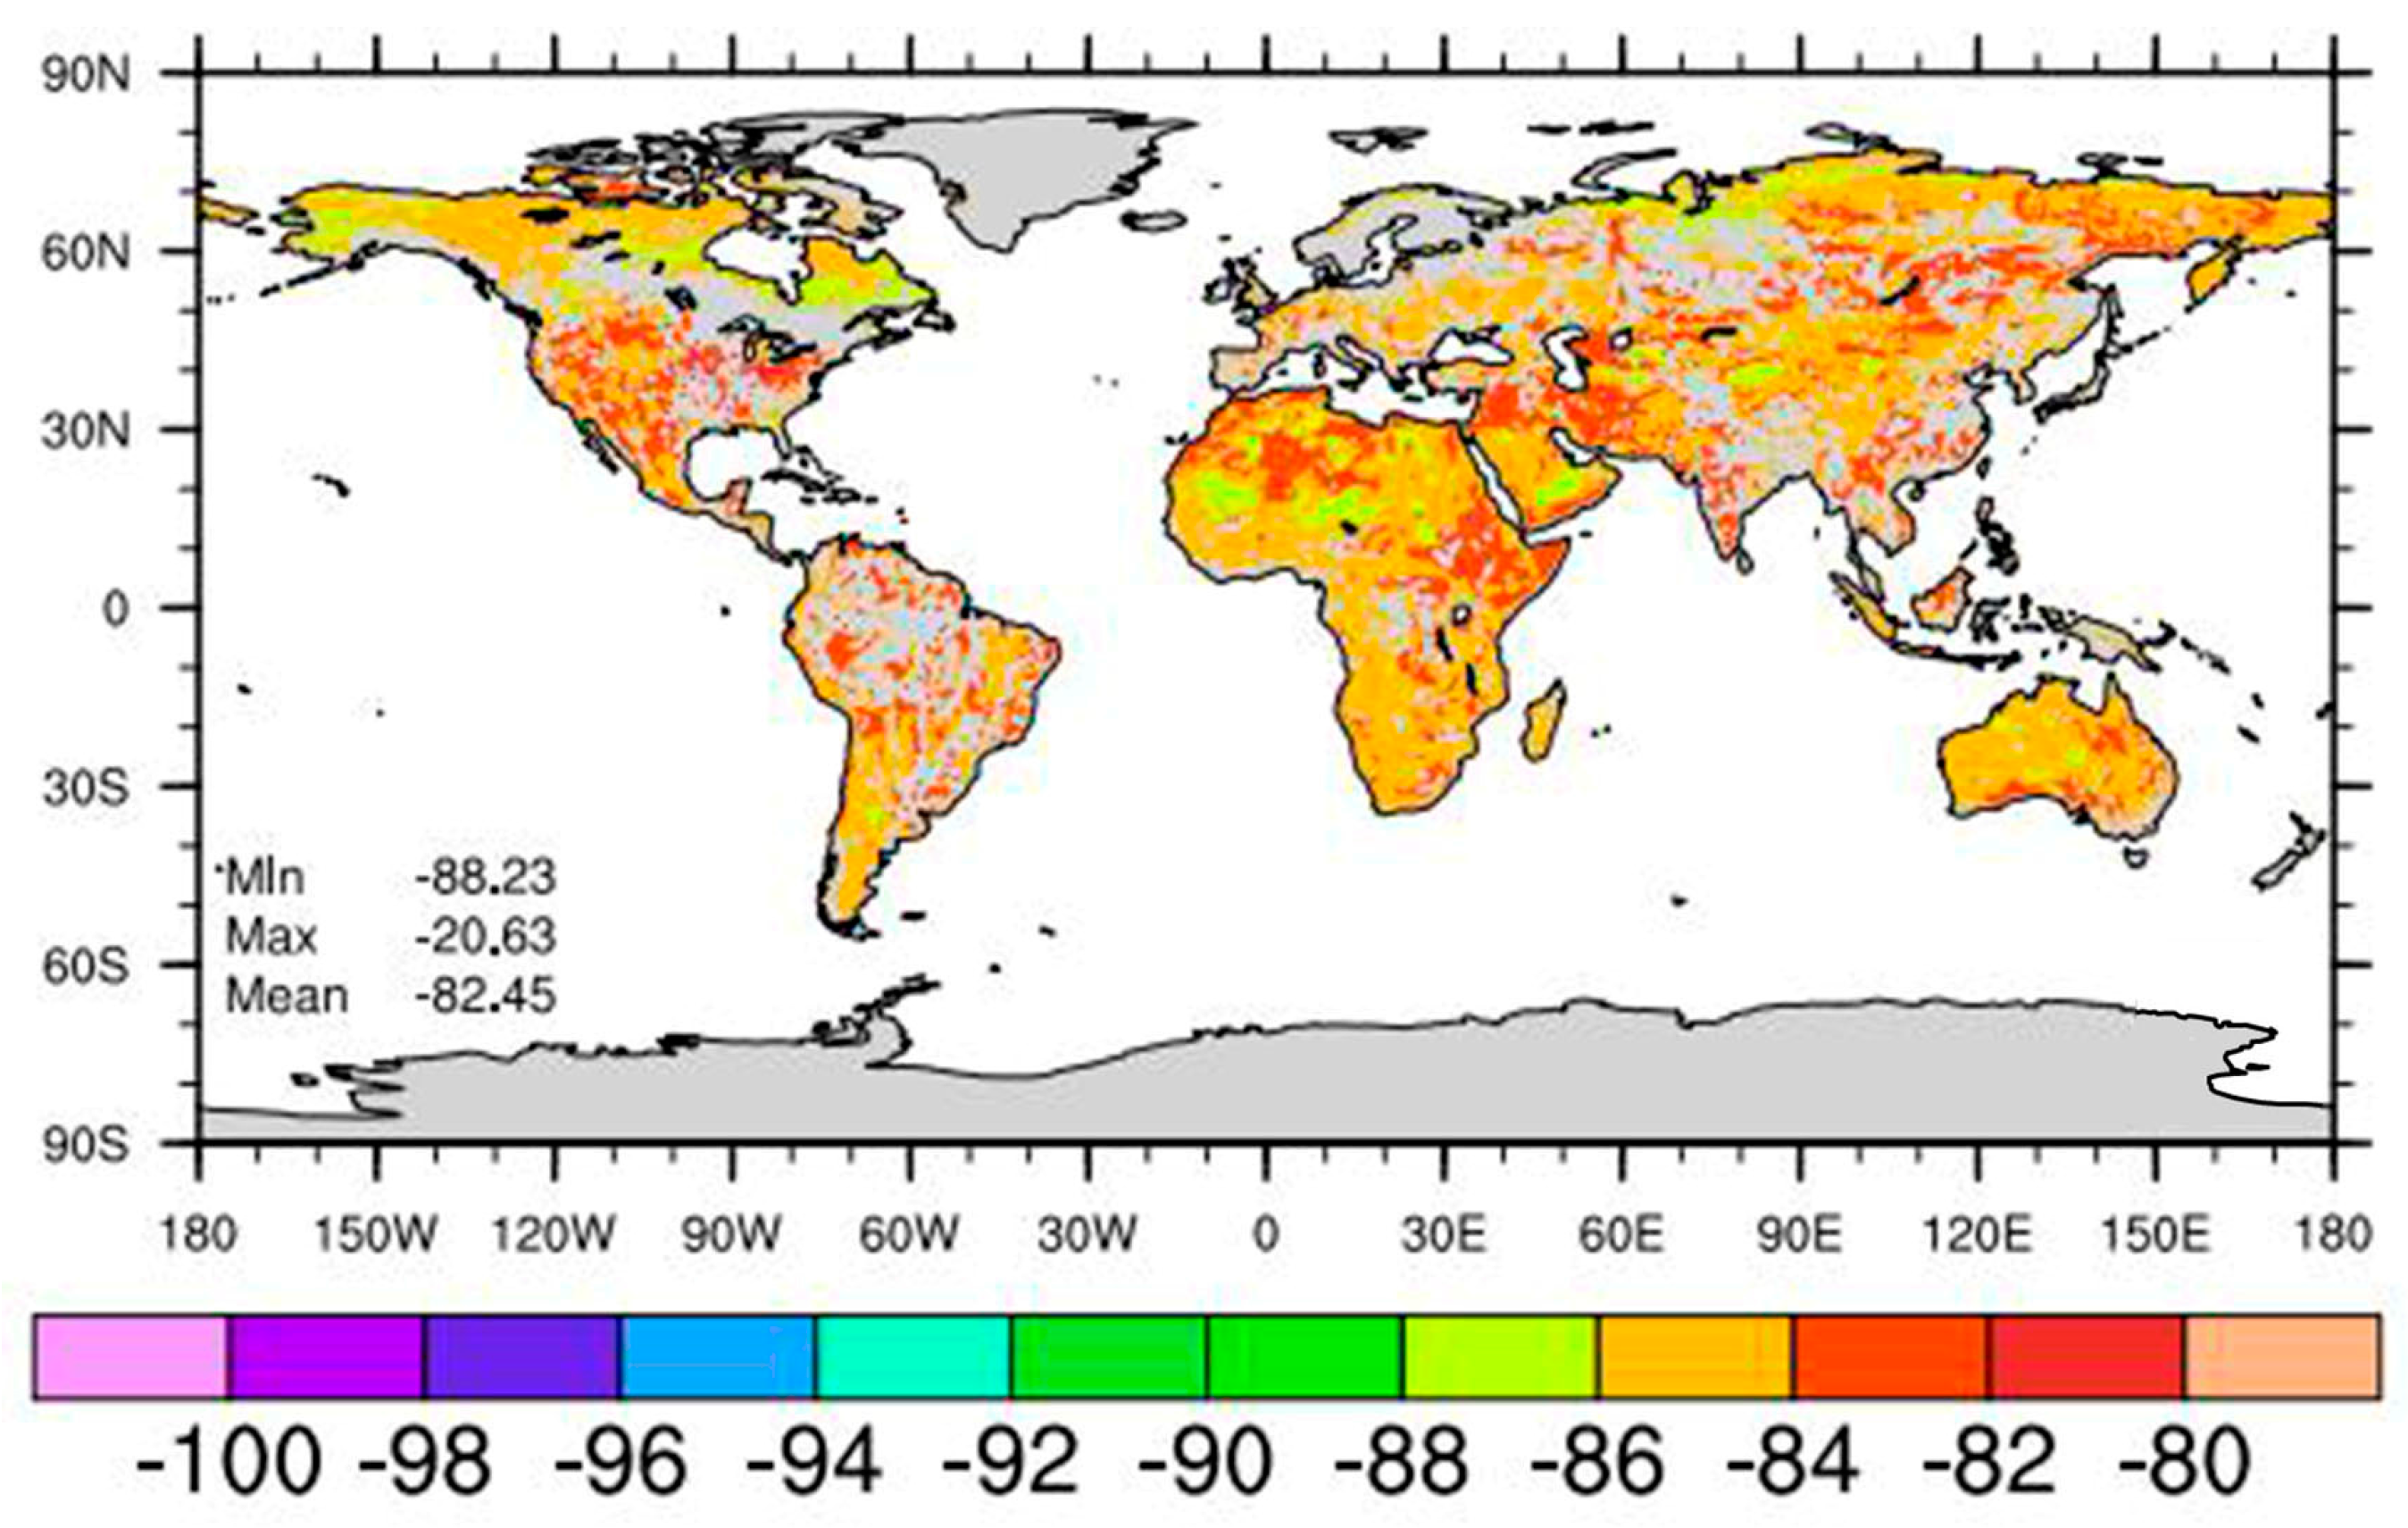
Figure 15.
Relative differences (CoLM2014–CoLM2005)/CoLM2005 in dry soil thermal conductivity averaged across ten model soil layers (unit: %).
Figure 15.
Relative differences (CoLM2014–CoLM2005)/CoLM2005 in dry soil thermal conductivity averaged across ten model soil layers (unit: %).
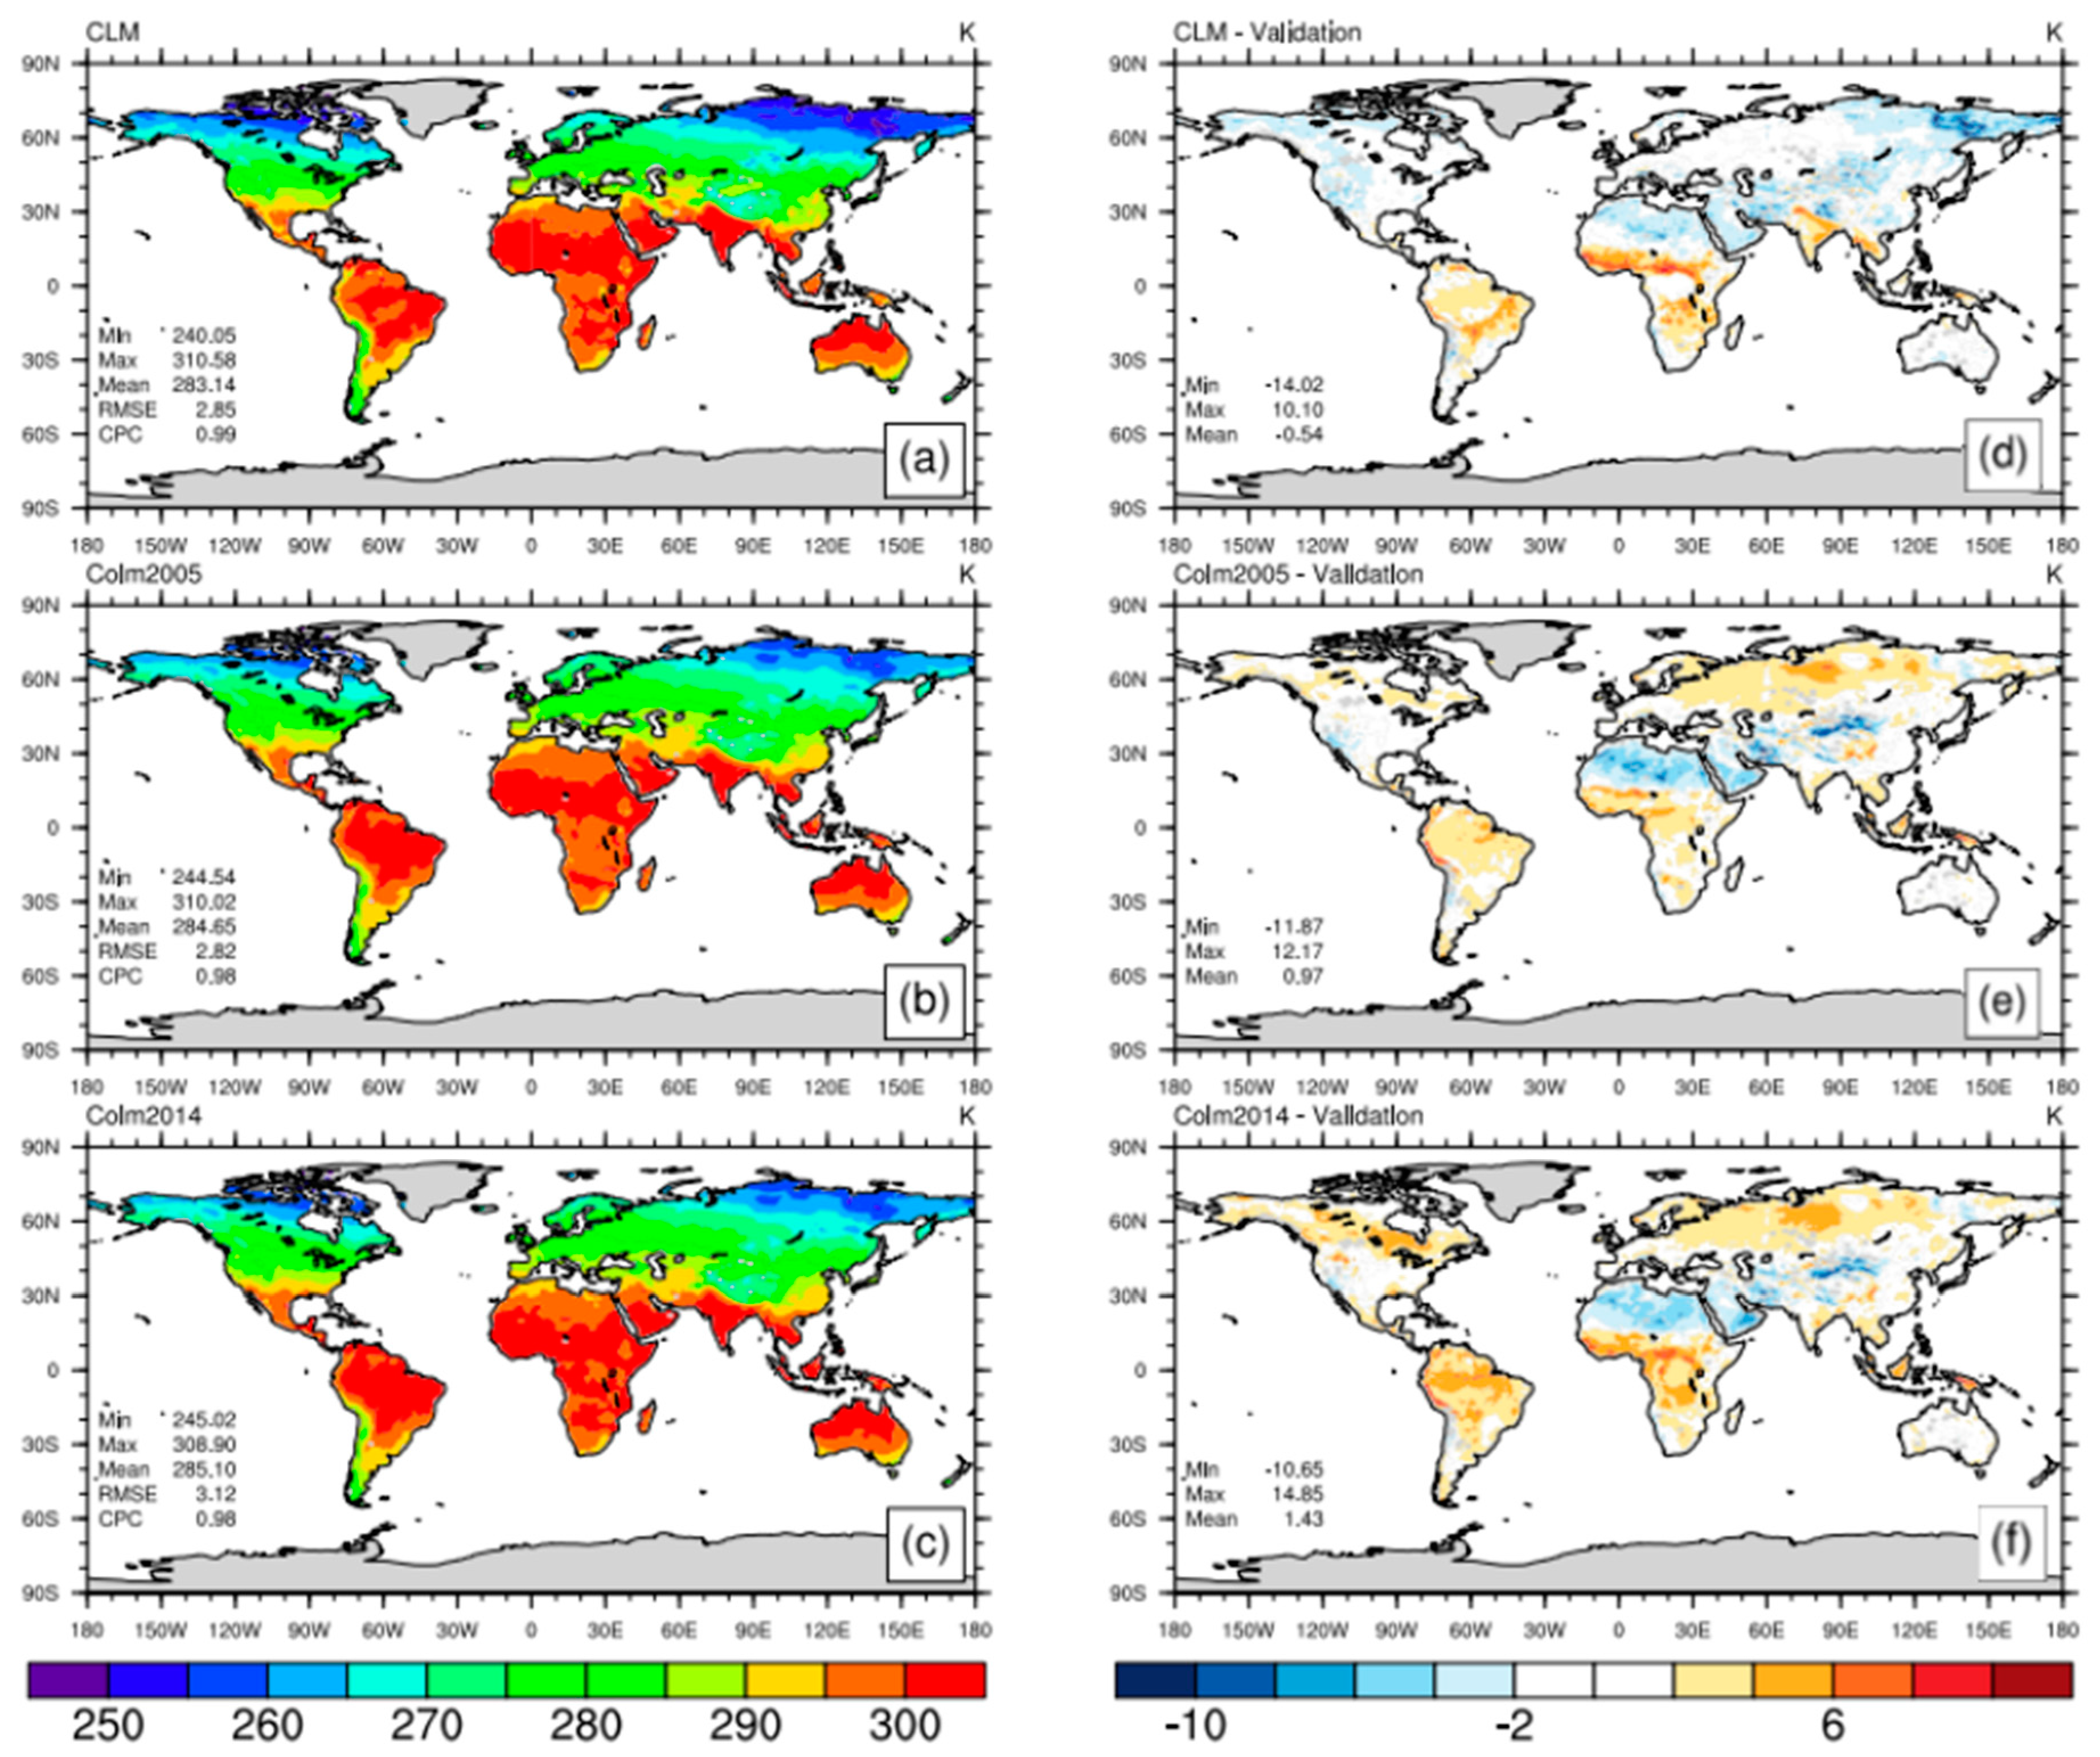
Figure 16.
Annual mean spatial distributions of land surface temperature simulated by (a) CLM4.5; (b) CoLM2005; and (c) CoLM2014; Along with spatial distributions of biases relative to the validation standard for (d) CLM4.5; (e) CoLM2005; and (f) CoLM2014 (Units: K).
Figure 16.
Annual mean spatial distributions of land surface temperature simulated by (a) CLM4.5; (b) CoLM2005; and (c) CoLM2014; Along with spatial distributions of biases relative to the validation standard for (d) CLM4.5; (e) CoLM2005; and (f) CoLM2014 (Units: K).
Figure 17.
Same as
Figure 3, but for land surface temperature (Units: K).
Figure 17.
Same as
Figure 3, but for land surface temperature (Units: K).
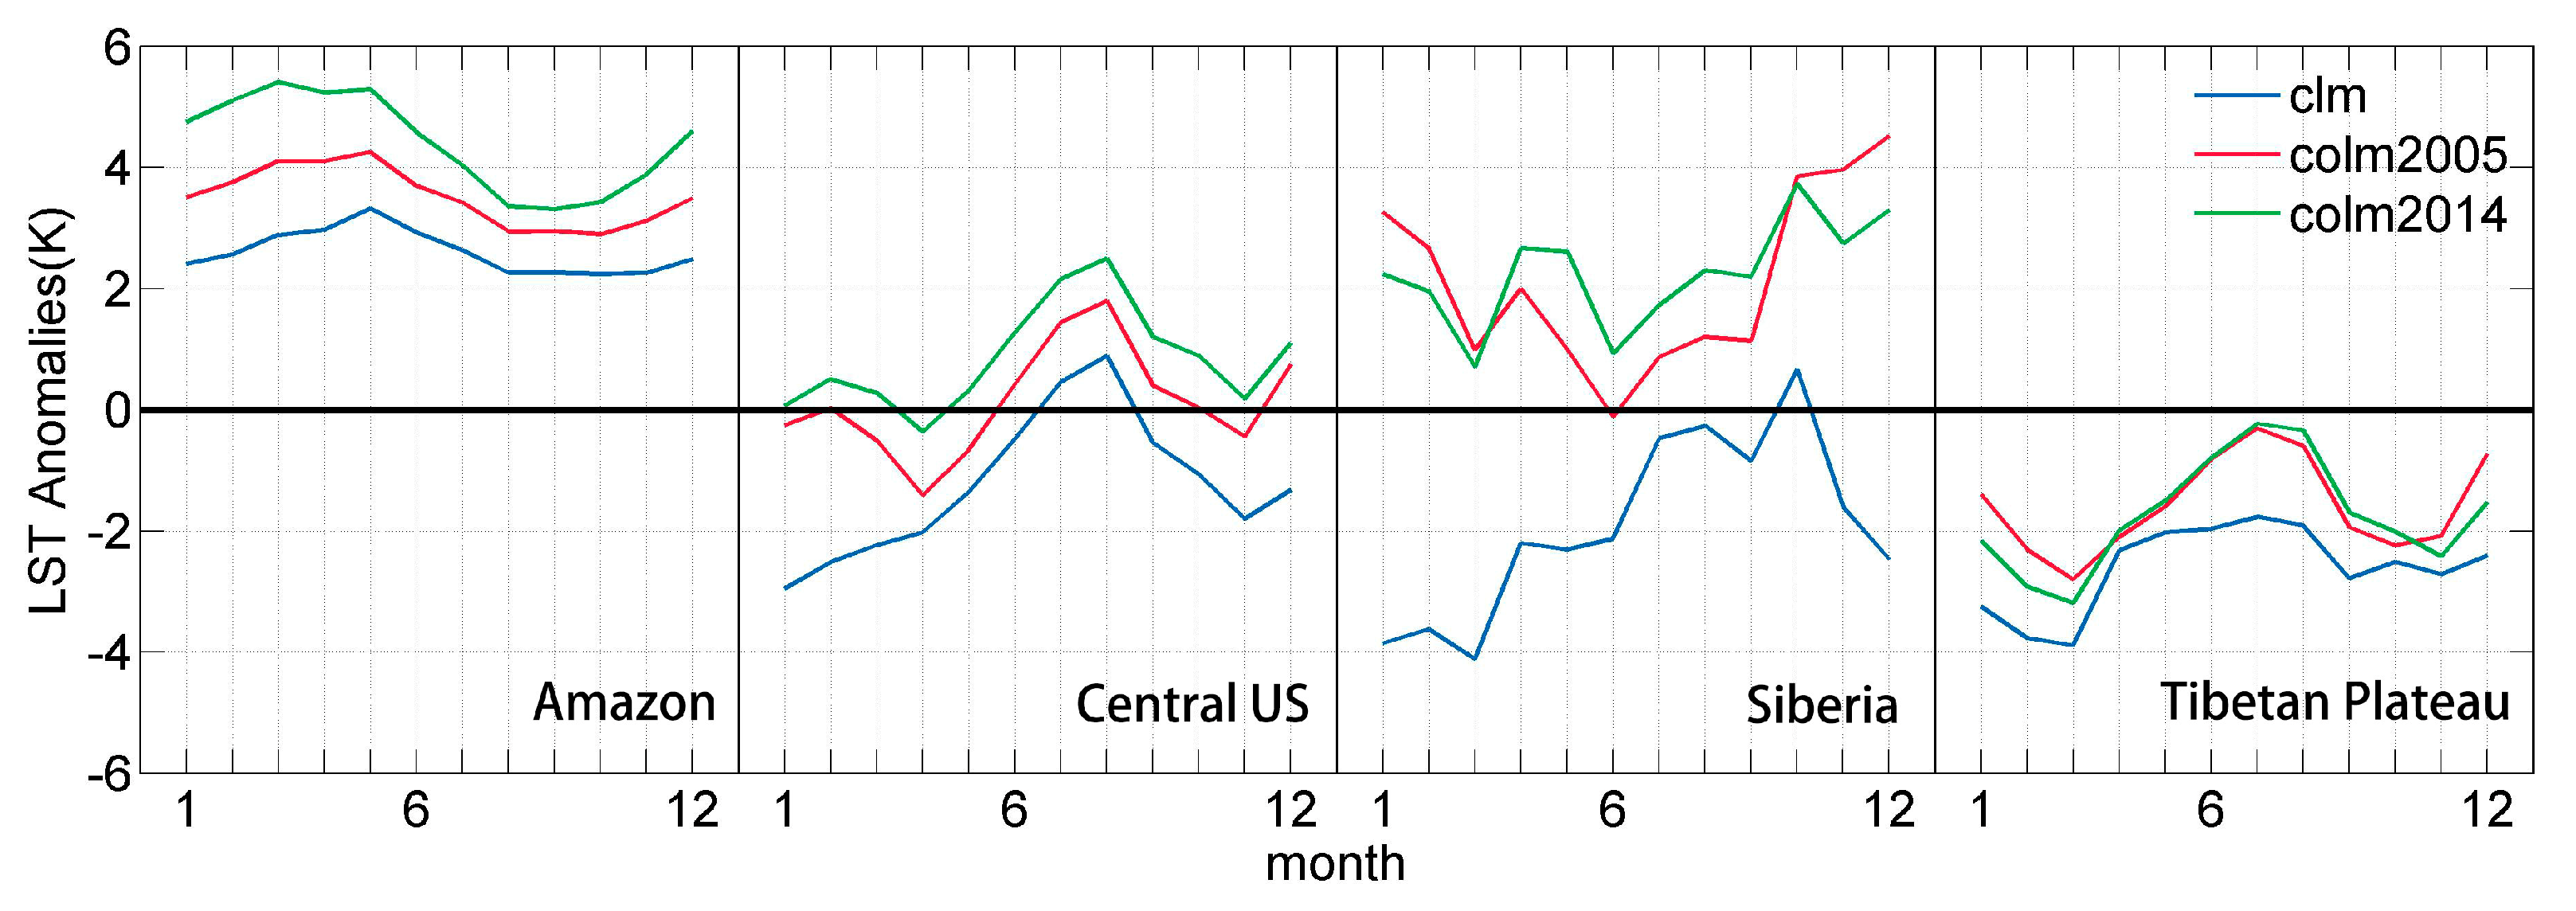
Figure 18.
Anomalies of simulated LST from MODIS product (Simulation—MODIS) for four focus regions (Units: K).
Figure 18.
Anomalies of simulated LST from MODIS product (Simulation—MODIS) for four focus regions (Units: K).
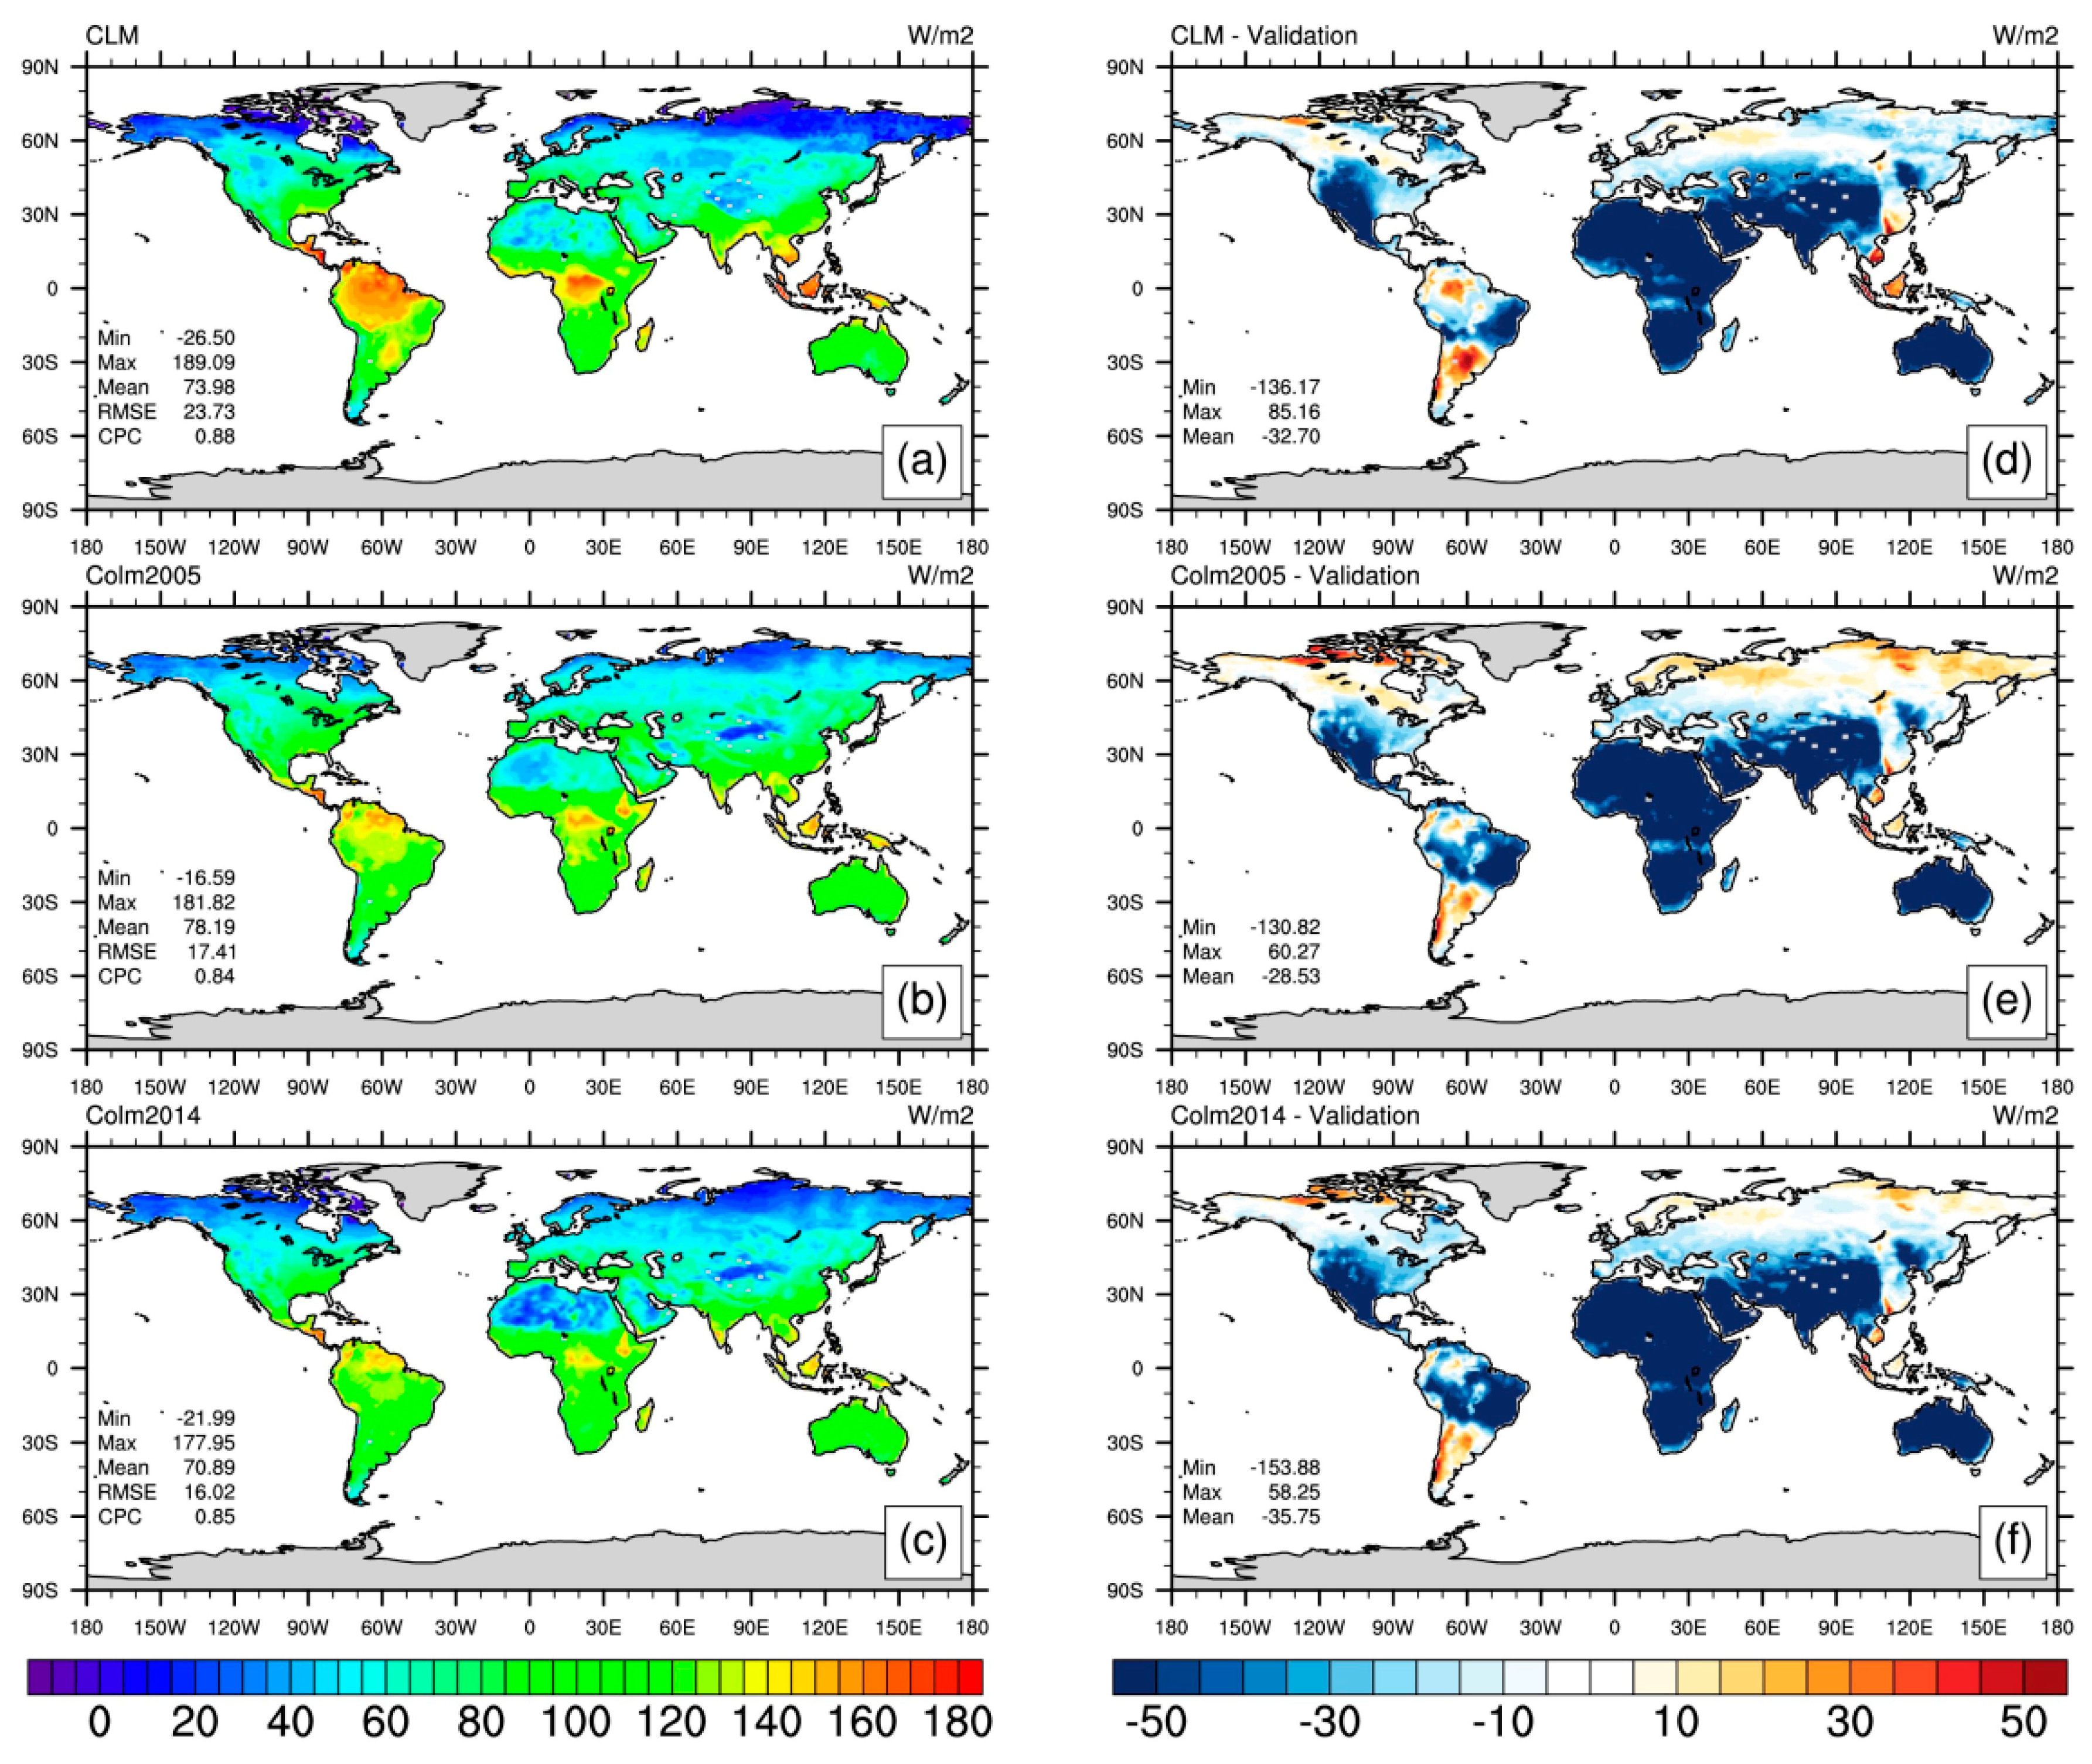
Figure 19.
Annual mean spatial distributions of net radiation simulated by (a) CLM4.5; (b) CoLM2005; and (c) CoLM2014; Along with spatial distributions of biases relative to the validation standard for (d) CLM4.5; (e) CoLM2005; and (f) CoLM2014 (Units: W m−2).
Figure 19.
Annual mean spatial distributions of net radiation simulated by (a) CLM4.5; (b) CoLM2005; and (c) CoLM2014; Along with spatial distributions of biases relative to the validation standard for (d) CLM4.5; (e) CoLM2005; and (f) CoLM2014 (Units: W m−2).
Figure 20.
Same as
Figure 3, but for net radiation (Units: W m
−2).
Figure 20.
Same as
Figure 3, but for net radiation (Units: W m
−2).
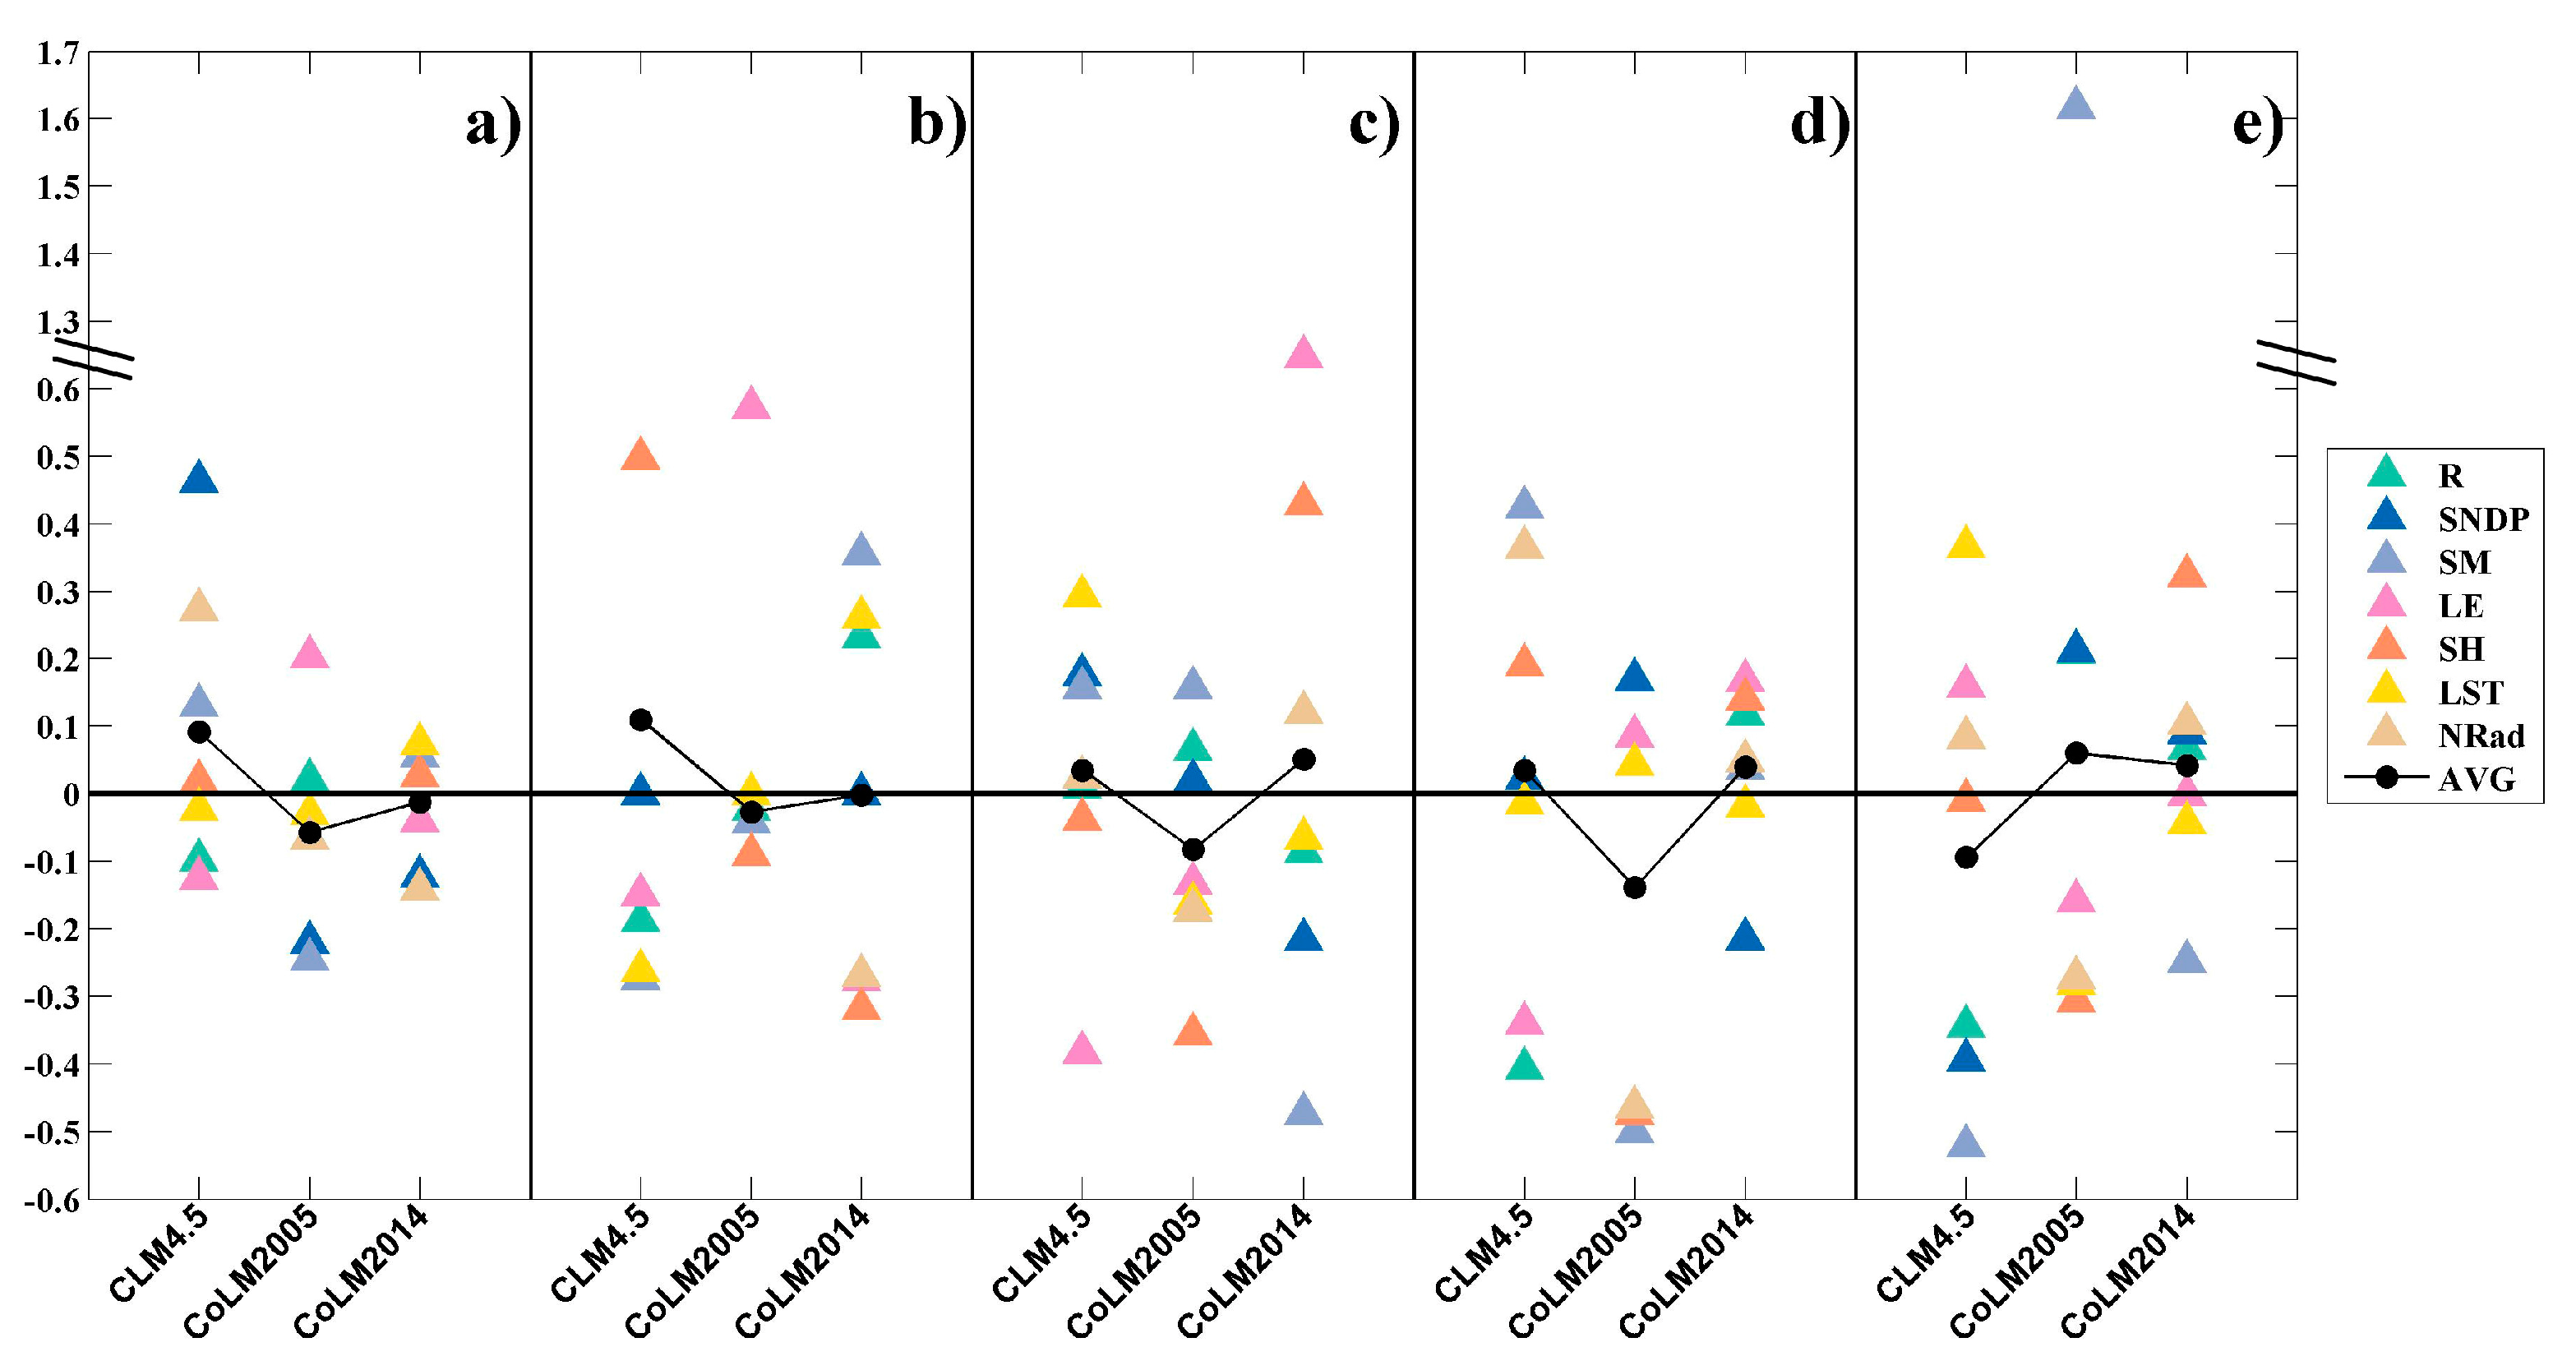
Figure 21.
Relative errors for (a) annual mean global mean fields and regional seasonal cycles in the (b) Amazon; (c) Tibetan Plateau; (d) Siberia; and (e) Central US focus domains. Black solid circles show total MCPI in each region. Colored triangles show relative errors for each of the variables that contribute to the total MCPI. Negative values indicate better than average agreement with the corresponding validation standard.
Table 1.
Validation Data Sets.
Table 1.
Validation Data Sets.
| Variable | Description | Validation |
|---|
| R | Total runoff (mm day−1) | GRDC |
| SNDP | Snow depth (m) | USAF/ETAC |
| SM | Surface soil moisture (m3 m−3) | ERA-Interim |
| LE | Latent heat (W m−2) | MTE |
| SH | Sensible heat (W m−2) | MTE |
| LST | Land surface temperature (K) | MODIS |
| NRad | Net radiation (W m−2) | SRB |
Table 2.
Statistical summary of simulated runoff annual cycles.
Table 2.
Statistical summary of simulated runoff annual cycles.
| Models | Amazon | Central US |
| BIAS (mm day−1) | NASH | RMSE (mm day−1) | BIAS (mm day−1) | NASH | RMSE (mm day−1) |
| CLM4.5 | −1.471 | 0.388 | 1.729 | −0.022 | 0.687 | 0.083 |
| CoLM2005 | −1.860 | 0.114 | 2.081 | −0.084 | −0.055 | 0.153 |
| CoLM2014 | −2.107 | −0.408 | 2.623 | −0.005 | 0.180 | 0.135 |
| Models | Siberia | Tibetan Plateau |
| BIAS (mm day−1) | NASH | RMSE (mm day−1) | BIAS (mm day−1) | NASH | RMSE (mm day−1) |
| CLM4.5 | −0.229 | 0.629 | 0.347 | −0.230 | −0.959 | 0.308 |
| CoLM2005 | −0.385 | −0.443 | 0.684 | −0.234 | −1.189 | 0.325 |
| CoLM2014 | −0.295 | −0.320 | 0.654 | −0.177 | 0.325 | 0.279 |
Table 3.
Statistical summary of simulated snow depth annual cycles.
Table 3.
Statistical summary of simulated snow depth annual cycles.
| Models | Amazon | Central US |
| BIAS (m) | NASH | RMSE (m) | BIAS (m) | NASH | RMSE (m) |
| CLM4.5 | - | - | - | 0.006 | 0.877 | 0.010 |
| CoLM2005 | - | - | - | −0.012 | 0.489 | 0.020 |
| CoLM2014 | - | - | - | −0.011 | 0.567 | 0.018 |
| Models | Siberia | Tibetan Plateau |
| BIAS (m) | NASH | RMSE (m) | BIAS (m) | NASH | RMSE (m) |
| CLM4.5 | 0.028 | 0.870 | 0.056 | 0.011 | 0.578 | 0.015 |
| CoLM2005 | −0.044 | 0.834 | 0.064 | −0.010 | 0.699 | 0.013 |
| CoLM2014 | −0.030 | 0.924 | 0.043 | −0.007 | 0.846 | 0.010 |
Table 4.
Statistical summary of simulated soil moisture annual cycles.
Table 4.
Statistical summary of simulated soil moisture annual cycles.
| Models | Amazon | Central US |
| BIAS (m3 m−3) | NASH | RMSE (m3 m−3) | BIAS (m3 m−3) | NASH | RMSE (m3 m−3) |
| CLM4.5 | 0.011 | −0.990 | 0.022 | −0.002 | 0.287 | 0.014 |
| CoLM2005 | 0.005 | −2.531 | 0.029 | −0.059 | −12.439 | 0.059 |
| CoLM2014 | 0.032 | −5.896 | 0.041 | −0.017 | −0.765 | 0.022 |
| Models | Siberia | Tibetan Plateau |
| BIAS (m3 m−3) | NASH | RMSE (m3 m−3) | BIAS (m3 m−3) | NASH | RMSE (m3 m−3) |
| CLM4.5 | 0.127 | −84.953 | 0.151 | −0.100 | −127.433 | 0.101 |
| CoLM2005 | −0.048 | −9.731 | 0.053 | −0.101 | −126.902 | 0.101 |
| CoLM2014 | −0.108 | −44.562 | 0.110 | −0.046 | −25.765 | 0.046 |
Table 5.
Statistical summary of simulated latent heat flux annual cycles.
Table 5.
Statistical summary of simulated latent heat flux annual cycles.
| Models | Amazon | Central US |
| BIAS (W m−2) | NASH | RMSE (W m−2) | BIAS (W m−2) | NASH | RMSE (W m−2) |
| CLM4.5 | 14.20 | −33.790 | 16.43 | 8.35 | 0.839 | 10.29 |
| CoLM2005 | 25.96 | −117.771 | 30.36 | 4.73 | 0.913 | 7.57 |
| CoLM2014 | 8.66 | −24.272 | 14.00 | 7.51 | 0.880 | 8.87 |
| Models | Siberia | Tibetan Plateau |
| BIAS (W m−2) | NASH | RMSE (W m−2) | BIAS (W m−2) | NASH | RMSE (W m−2) |
| CLM4.5 | 1.20 | 0.983 | 3.44 | −1.20 | 0.970 | 2.12 |
| CoLM2005 | 3.43 | 0.953 | 5.66 | −0.64 | 0.940 | 2.98 |
| CoLM2014 | 0.44 | 0.946 | 6.09 | 4.39 | 0.785 | 5.66 |
Table 6.
Statistical summary of simulated sensible heat flux annual cycles.
Table 6.
Statistical summary of simulated sensible heat flux annual cycles.
| Models | Amazon | Central US |
| BIAS (W m−2) | NASH | RMSE (W m−2) | BIAS (W m−2) | NASH | RMSE (W m−2) |
| CLM4.5 | 26.17 | −108.327 | 26.90 | −7.82 | 0.665 | 11.94 |
| CoLM2005 | −7.99 | −39.387 | 16.35 | −3.86 | 0.835 | 8.36 |
| CoLM2014 | 1.52 | −14.889 | 12.26 | −13.58 | 0.402 | 15.94 |
| Models | Siberia | Tibetan Plateau |
| BIAS (W m−2) | NASH | RMSE (W m−2) | BIAS (W m−2) | NASH | RMSE (W m−2) |
| CLM4.5 | −10.41 | 0.691 | 14.18 | −9.89 | 0.720 | 12.11 |
| CoLM2005 | −0.08 | 0.940 | 6.27 | −5.77 | 0.874 | 8.11 |
| CoLM2014 | −7.55 | 0.716 | 13.58 | −17.00 | 0.383 | 17.98 |
Table 7.
Statistical summary of simulated land surface temperature annual cycles.
Table 7.
Statistical summary of simulated land surface temperature annual cycles.
| Models | Amazon | Central US |
| BIAS (K) | NASH | RMSE (K) | BIAS (K) | NASH | RMSE (K) |
| CLM4.5 | 2.60 | −13.366 | 2.62 | −1.25 | 0.975 | 1.67 |
| CoLM2005 | 3.52 | −25.307 | 3.55 | 0.13 | 0.993 | 0.88 |
| CoLM2014 | 4.41 | −40.872 | 4.48 | 0.84 | 0.987 | 1.17 |
| Models | Siberia | Tibetan Plateau |
| BIAS (K) | NASH | RMSE (K) | BIAS (K) | NASH | RMSE (K) |
| CLM4.5 | −1.93 | 0.979 | 2.41 | −2.61 | 0.948 | 2.70 |
| CoLM2005 | 2.11 | 0.976 | 2.55 | −1.58 | 0.978 | 1.75 |
| CoLM2014 | 2.26 | 0.979 | 2.40 | −1.73 | 0.973 | 1.95 |
Table 8.
Statistical summary of simulated net surface radiation annual cycles.
Table 8.
Statistical summary of simulated net surface radiation annual cycles.
| Models | Amazon | Central US |
| BIAS (W m−2) | NASH | RMSE (W m−2) | BIAS (W m−2) | NASH | RMSE (W m−2) |
| CLM4.5 | 23.37 | −15.033 | 23.85 | −10.62 | 0.861 | 17.03 |
| CoLM2005 | 1.04 | 0.350 | 4.40 | −9.50 | 0.937 | 11.44 |
| CoLM2014 | −6.81 | −0.867 | 8.14 | −16.24 | 0.856 | 17.35 |
| Models | Siberia | Tibetan Plateau |
| BIAS (W m−2) | NASH | RMSE (W m−2) | BIAS (W m−2) | NASH | RMSE (W m−2) |
| CLM4.5 | −18.18 | 0.808 | 23.48 | −21.25 | 0.649 | 22.99 |
| CoLM2005 | −4.05 | 0.970 | 9.22 | −15.87 | 0.770 | 18.57 |
| CoLM2014 | −13.87 | 0.887 | 18.04 | −22.05 | 0.580 | 25.14 |


 ,
, 


