Article

Half a Degree Matters: Mean Climate and Climate Extremes Responses to 1.5 °C and 2 °C Global Warming Levels in Türkiye

by
Mustafa Tufan Turp
1,2,*,
Nazan An
1,2,
Elmas Merve Samancı
1,2,
Zekican Demiralay
1,2,3,
Dalya Nur Çatalçekiç
1,2 and
Mehmet Levent Kurnaz
1,4
1
Center for Climate Change and Policy Studies, Boğaziçi University, Istanbul 34342, Türkiye
2
Computational Science and Engineering, Boğaziçi University, Istanbul 34342, Türkiye
3
Meteorological Institute, Ludwig-Maximilians University, 80539 Munich, Germany
4
Physics, Faculty of Arts and Sciences, Boğaziçi University, Istanbul 34342, Türkiye
*
Author to whom correspondence should be addressed.
Atmosphere 2026, 17(9), 873; https://doi.org/10.3390/atmos17090873
Submission received: 13 July 2026 / Revised: 27 August 2026 / Accepted: 30 August 2026 / Published: 7 September 2026
(This article belongs to the Section Climatology)

Abstract

The Paris Agreement aims to limit global warming to well below 2 °C while pursuing efforts to restrict it to 1.5 °C, as exceeding these thresholds may intensify climate-related risks. Understanding climate responses to an additional half-degree of warming remains critical for adaptation planning. Accordingly, the implications of an additional 0.5 °C warming from 1.5 °C to 2 °C over Türkiye were evaluated using 10 km resolution RegCM4.4 simulations driven by the MPI-ESM-MR and HadGEM2-ES models. Temperature- and precipitation-related indicators were analyzed, including mean temperature (Tmean), tropical nights (TN), discomfort index (DI), total precipitation (TP), the simple daily intensity index (SDII), extreme precipitation days (R90P), dry periods lasting at least five consecutive days (CDD5), and consecutive dry days (CDD). The results indicate that the additional 0.5 °C warming does not affect all climate indicators equally, with the strongest responses observed in temperature-related indicators. Temperature-related indicators, particularly TN and DI, show clear and consistent increases, indicating strong sensitivity to additional warming. By contrast, precipitation-related indicators display more heterogeneous and model-dependent responses, with RCM-HG generally projecting increases in precipitation and intensity, while RCM-MPI suggests decreases in certain regions and seasons. The signal-to-noise ratio (SNR) analysis further indicates greater robustness of annual temperature-related changes, whereas inter-model sign agreement varies among indices and seasons, with complete agreement for Tmean. The findings provide a scientific basis for regionally tailored adaptation planning in Türkiye and highlight the potential for reducing climate risks by limiting warming to lower levels.

1. Introduction

By the end of the first quarter of the 21st century, global temperatures have broken records repeatedly over the past four decades. Facing an unprecedented temperature rise in the past 50 years, our world has warmed by about 1 °C compared to the pre-industrial era [1]. In addition, global precipitation has been increasing rapidly since the middle of the last century [1]. Current projection studies indicate that warming may reach 1.5 °C at best in the near future (2021–2040) and may reach 4.5 °C by the end of the century in the worst-case scenarios [1]. Notably, as highlighted by Foster and Rahmstorf [2], if the warming trend observed over the past decade persists, the 1.5 °C warming threshold is projected to be surpassed before 2030. Consistently, Hansen et al. [3] argue that, under the current geopolitical trajectory of greenhouse gas emissions, global warming is likely to surpass 1.5 °C during the 2020s and could approach 2 °C before mid-century. Against this backdrop, the Paris Agreement, adopted in 2015, aims to limit global temperatures to below 2 °C and, if possible, to 1.5 °C [4]. However, the effects of either situation on the ecosystems are likely to be severe. It is estimated that rapid ecosystem loss will begin when the global warming threshold level (GWTL) exceeds 1.5 °C (GWTL 1.5 °C), and if it exceeds the 2 °C global threshold (GWTL 2 °C), mass extinctions may occur [5,6]. Coral reefs are likely to decrease by 70–90% at GWTL 1.5 °C and by 90% at GWTL 2 °C [7,8].
An increase in global warming from GWTL 1.5 °C to GWTL 2 °C could substantially increase the occurrence of extreme heatwaves worldwide, potentially doubling their frequency [9]. Moreover, this additional half degree of warming could roughly triple the proportion of the global population regularly exposed to severe heatwaves [9]. Furthermore, cumulative exposure to extreme heat stress under wet-bulb globe temperature conditions exceeding 35 °C could increase by approximately fourfold in a 2 °C world compared with the 1.5 °C warming level [10]. The probability of temperature extremes that occur on average every 20 years globally is also projected to increase from 130 to 340%, which means 2.6 times higher when the GWTL reaches from 1.5 °C to 2 °C [11]. In addition, it is expected that approximately 15% of terrestrial areas globally may encounter severe heat stress at levels that will harm human health in an additional increase of 0.5 °C [12].
Although the increase from 1.5 °C to 2 °C may appear modest at the global scale, its impacts may be disproportionately amplified across natural and socio-economic systems [13,14,15,16,17,18,19]. Moreover, the magnitude of projected warming is spatially heterogeneous, and the intensity of temperature changes may vary considerably among regions. The Mediterranean Basin, for instance, exhibits pronounced regional amplification, with warming exceeding the global mean under both GWTL of 1.5 °C and 2 °C [20,21,22,23], whereas ocean-dominated regions such as the Equatorial Pacific Ocean show more moderate warming, remaining closer to the global mean [21]. In addition, internal climate variability and large-scale circulation patterns may lead to regional departures from the global warming signal, occasionally masking or enhancing temperature trends over limited periods.
Indeed, previous studies indicate that the impacts associated with an additional 0.5 °C increase between GWTL 1.5 °C and 2 °C may result in substantial regional differences in extreme climate events and related climate characteristics. Regional projections indicate that in Central Asia, the effects of drought are predicted to be up to three times stronger at an increase of 2 °C, compared to an increase of 1.5 °C [24]. Mean temperature (Tmean) in Central Asia is also expected to be above the global levels, particularly in the northern parts of the region [24]. Comparable temperature-related changes have also been projected for China, where warming is expected to exceed 2°C, with stronger increases in high-altitude regions than in low-altitude regions [25]. Heatwaves in China, which are expected to increase 1.8 times in frequency and 1.5 times in duration in a global temperature increase of 1.5 °C, will occur 2.5 times more frequently and for 2 times longer with an increase of 2 °C [26]. Similar changes have also been projected in the Southern Hemisphere. In Australia, a record temperature extreme event known as the “angry summer” during 2012–2013 is expected to become more frequent under GWTL 2 °C compared with GWTL 1.5 °C, with the probability of extreme summer temperatures increasing by approximately 26% [27]. Changes in hotspot classifications have also been projected in parts of North America, where Central North America and Eastern North America, which are not considered hotspots at GWTL 1.5 °C, are projected to emerge as hotspots at GWTL 2 °C [28]. When the GWTL rises from 1.5 °C to 2 °C, the increase in Tmean may be above 2 °C in most of the African continent except the coasts of the Indian Ocean [29]. Extreme warm events, such as those observed in 2010 and 2015, particularly in North Africa, are expected to become more frequent under GWTL 1.5 °C and particularly 2 °C [30]. In Africa, the probability of temperature extremes at 1.5 °C is 10% less than at 2 °C. In North Africa, the rate at 1.5 °C is 20% lower than it is at 2 °C [30]. It is shown that among the Coordinated Regional Climate Downscaling Experiment (CORDEX) regions, Africa is warming faster than other regions [29]. In the southern parts of Central Africa, a minor increase in the consecutive dry days (CDD) is predicted with the increase of 2 °C in spring, compared to 1.5 °C [16]. With the doubling of the GWTL (from 1.5 °C to 3 °C) in Central Africa, an increase in the heat index and discomfort index (DI), particularly in March-August, and a significant increase in the frequency of the days described as “emergency” are predicted [31].
Europe will experience higher warming than the global average [13]. Due to the increasing temperatures, a fall in the number of frost days by half, an increase in the number of tropical nights (TN) by 60%, particularly on the Mediterranean coasts, and an increase in minimum and maximum temperatures more than the global temperature change are predicted in most parts of Europe [13,14,32]. With warming below 3 °C, precipitation will increase in the winter season in Central and Northern Europe and decrease in the summer season in Spain, France, and Türkiye [13]. As an unusual situation, with a GWTL 0.5 °C increase, it is expected that the number of frost days in Germany and Poland in North-Central Europe will decrease by more than 50%, and accordingly, positive effects on ecosystem services, especially in agriculture, are expected [13]. In the Iberian Peninsula, the number of hot days is expected to increase from 11 days to 15.8 days on average due to the GWTL difference of 0.5 °C [18]. In addition, an increase in the frequency of extreme heat and heavy wet days and in total precipitation (TP) is expected in Europe [14]. While a decrease in TP is expected in some areas in the Iberian Peninsula [32,33] it is expected to increase more in the Scandinavian Peninsula than the rest of Europe [32]. Considering the extreme temperatures in the Mediterranean and West Asia regions, where Türkiye is located, maximum temperature values are projected to increase under GWTL 1.5 °C, while higher increases are expected under GWTL 2 °C [28]. Depending on the heat stress as a result of the half-degree increase, it is predicted that the duration of the fire season will be prolonged and the fires will become more frequent in the Mediterranean Basin [12]. If the temperature increase is limited to 1.5 °C instead of 2 °C, the risk of forest fires caused by heat stress will decrease by 50% in Canada, Russia, Türkiye, and India [12].
The Mediterranean Basin is characterized as one of the most prominent global climate change hotspots due to projected temperature and precipitation changes [23,34], particularly in the southeastern Mediterranean [35]. A 0.5 °C increase in GWTL over the region including Türkiye is projected to lead to higher drought risk [15]. Tmean increases of 1.8 °C and 1.9 °C are expected in the Mediterranean under GWTL 1.5 °C and 2 °C, respectively [21]. The number of CDD is likely to increase from 7% to 11% in the Mediterranean Basin at a GWTL difference of 0.5 °C [17]. At a GWTL difference of 0.5 °C, there will be an increase in the daily heatwave magnitude index in the Mediterranean and Southeastern Anatolia Regions, the total number of extreme events in the western, Central Anatolia, and particularly the southern regions, and the peak maximum temperature of yearly events in the Marmara, Central Anatolia, Eastern Anatolia, Southeastern Anatolia, and Southern regions in Türkiye [19]. However, the projections indicate that precipitation under the RCP4.5 and RCP8.5 scenarios will decrease in almost all of Türkiye for the 2021–2050 period [36]. In addition to the increase in temperature and decrease in precipitation, there will also be a reduction in the amount of water carried by rivers during the summer season due to the decline in both permanent and seasonal snow cover. This situation may have a devastating effect on the agricultural sector in the region [36], leading to reduced crop yields, increased irrigation demands, and potential food security issues for the local population. Projections indicate that the marine ecosystem in the entire Mediterranean region will also be adversely affected as a result of changes in temperature, water circulation, stratification, and water acidity [37]. The risk is much higher for the Mediterranean region, as mean temperatures have already increased by 1.5 °C in the region since the pre-industrial period, and regional warming is expected to reach 2 °C within two decades unless the reduction strategies of effective greenhouse gas concentration are implemented [23].
In this context, limiting global warming to 2 °C, and preferably to 1.5 °C, is widely recognized as a key target for mitigating the adverse impacts of climate change. Understanding how an additional half degree of warming may affect natural and human systems is therefore critical, particularly at regional scales where climate impacts and adaptation needs are most directly experienced. This challenge is particularly relevant for Türkiye, which lies within the Mediterranean Basin—one of the most prominent global climate change hotspots [38]—and hosts a large and densely distributed population. Moreover, Türkiye plays an important role in climate-sensitive sectors such as agriculture and tourism, while its geographical location places it at a crossroads of regional population mobility and potential climate-related migration. Although previous studies have investigated projected climate changes over Türkiye using scenario-based approaches and broader regional assessments, the potential regional implications of a half-degree difference between GWTL 1.5 °C and 2 °C remain insufficiently explored. Therefore, this study identifies model-specific periods corresponding to GWTL 1.5 °C and 2 °C and uses 10-km dynamically downscaled regional climate projections to examine the additional changes associated with warming from 1.5 °C to 2 °C over Türkiye. The analysis considers mean climate conditions together with a set of temperature-, relative humidity-, and precipitation-related extremes, allowing the regional response to the additional half degree of warming to be evaluated in greater spatial detail.

2. Materials and Methods

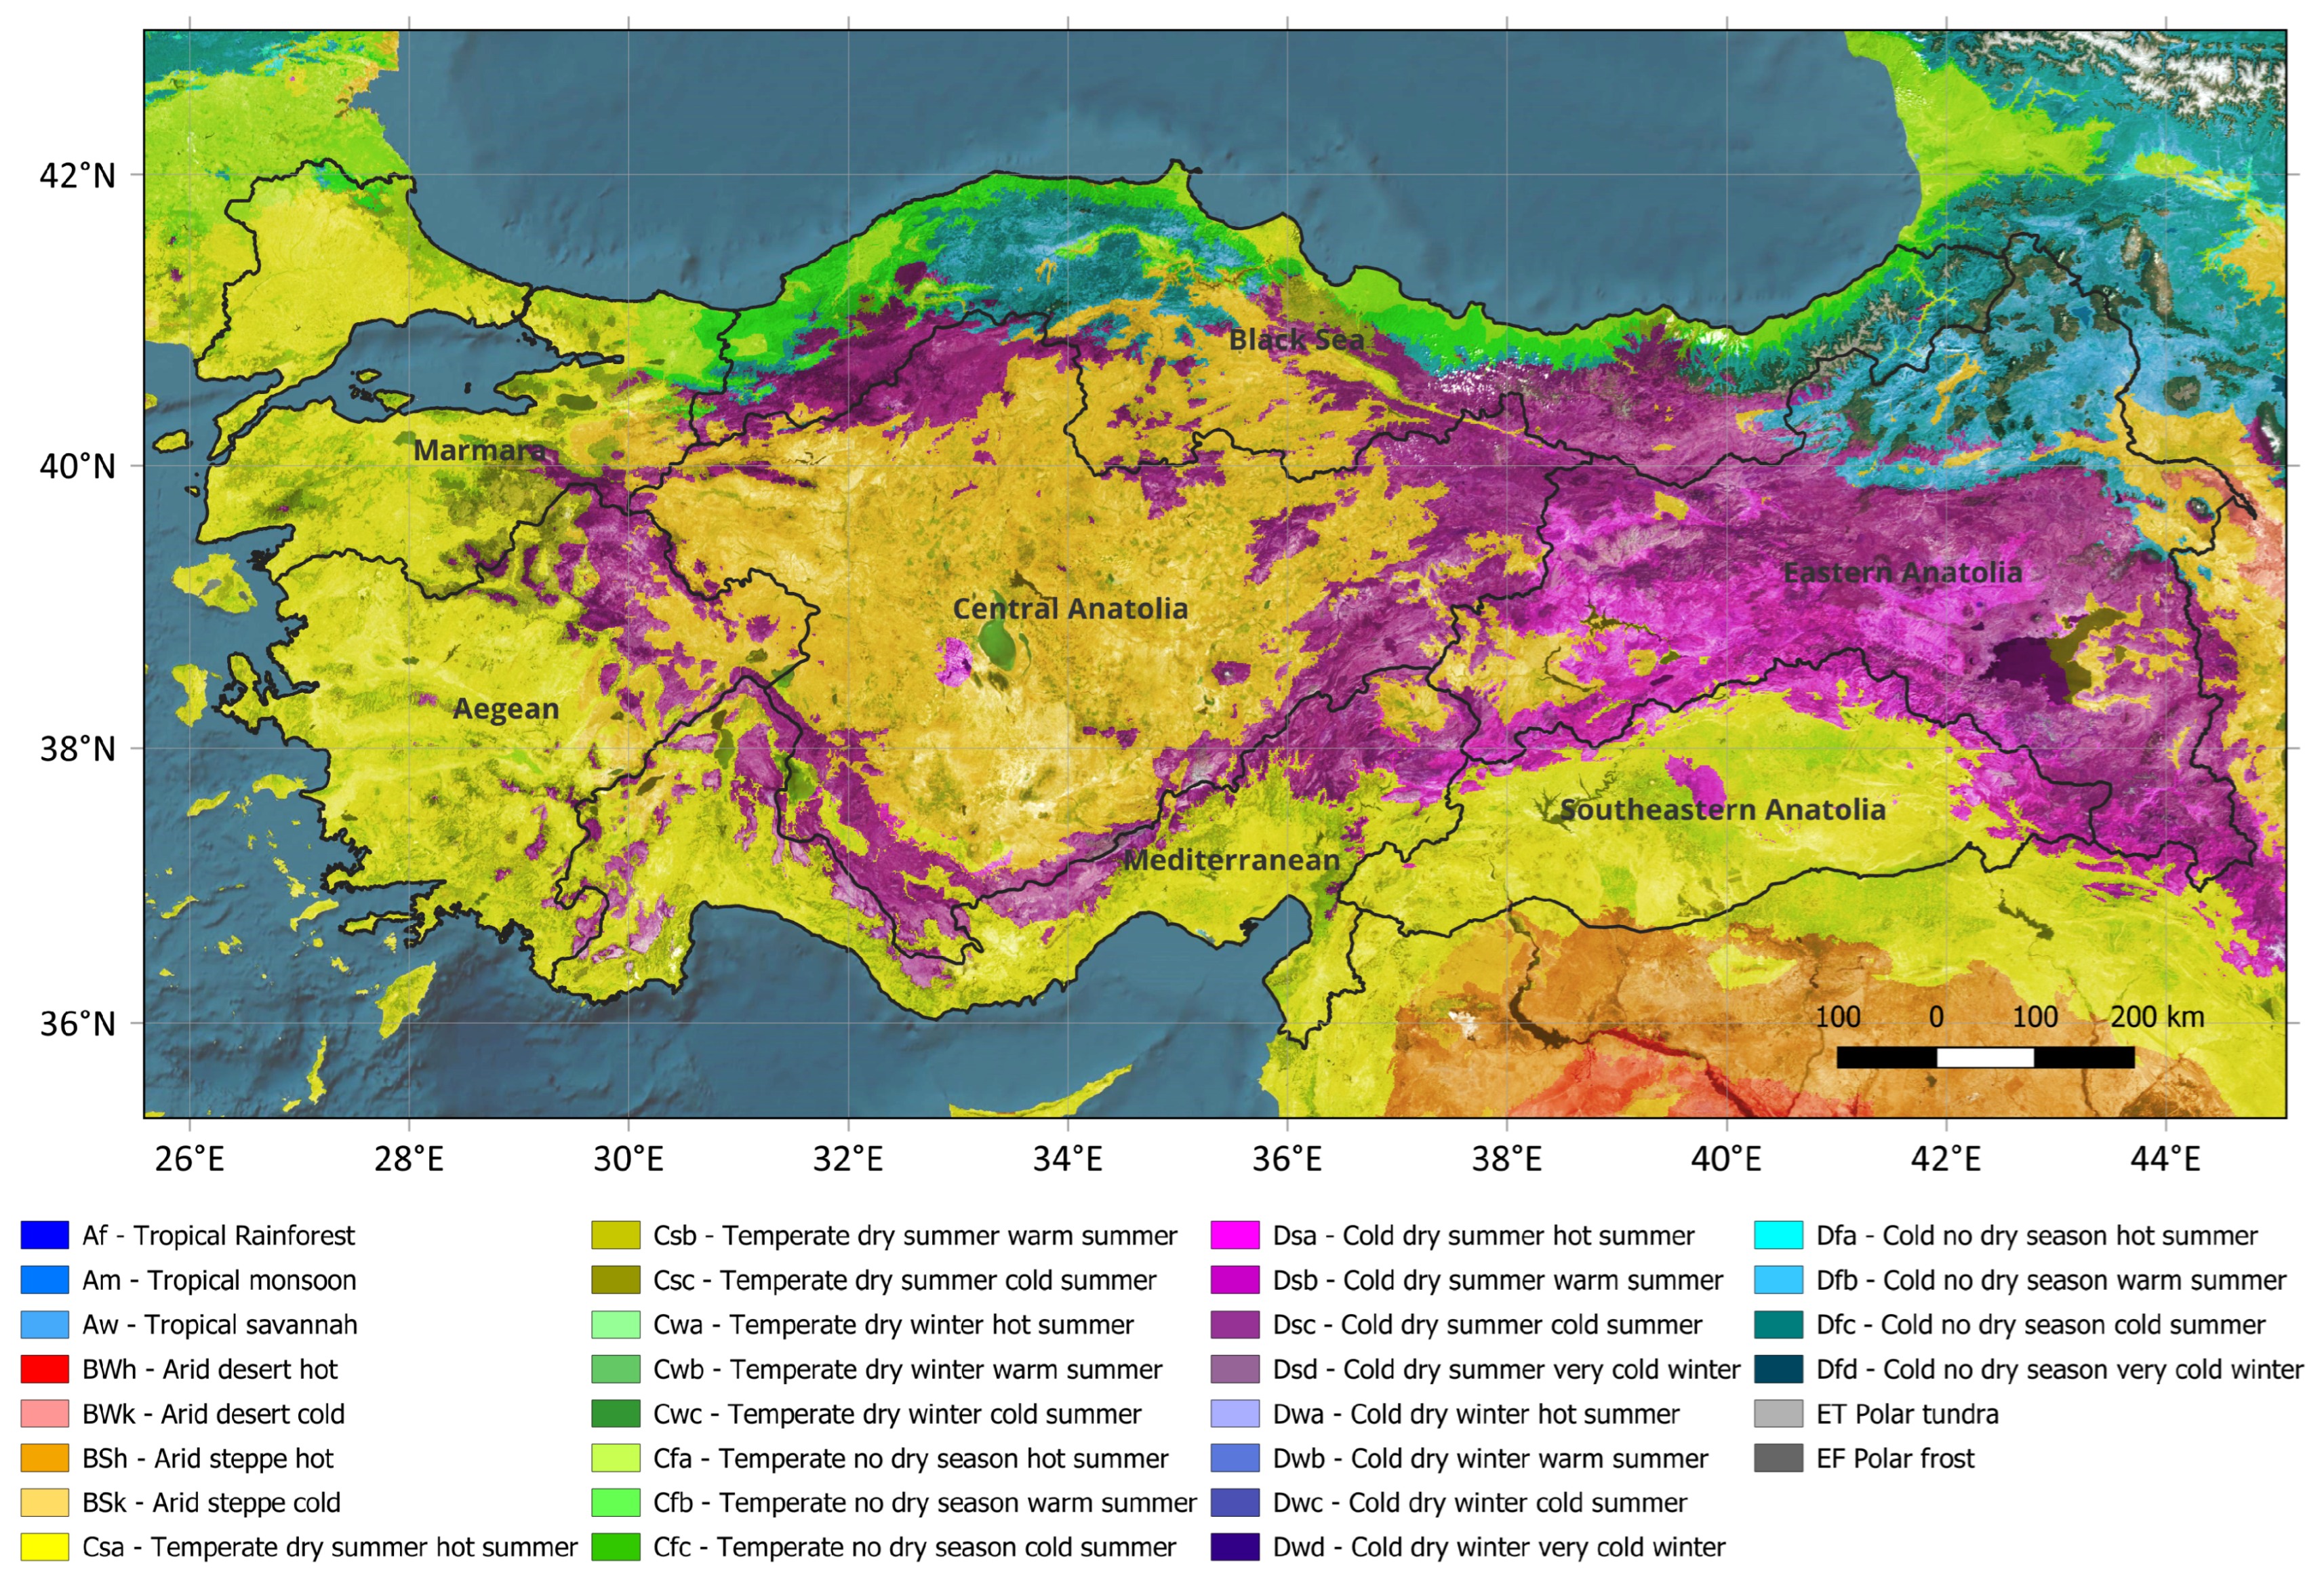
Türkiye is located in the Middle East and North Africa (MENA) region under the CORDEX initiative. It is located between 36° and 42° north latitudes and 26° and 45° east longitudes (Figure 1). The elevation in the east is much higher than in the west. Particularly in the Eastern Anatolia Region, the average elevation is above 2000 m.
The majority of Türkiye is characterized by an arid/semi-arid climate; however, because of its vast geographical area, the country exhibits diverse climate types, including Mediterranean, humid temperate, and continental climates. In the Köppen-Geiger climate classification [39], western, southern, southeastern Türkiye, and the southern part of northwestern Anatolia are characterized by a Mediterranean climate (Figure 1). The central-northern part of the Central Anatolia Region has a dry, humid continental climate in the summer. The Black Sea Region, on the other hand, is classified as having a humid subtropical climate without a dry season [40]. As mentioned, Türkiye has various climate types, indicating that the subregional and local impacts of climate change may be distinct at different global warming thresholds.
In the first stage of the study, the analysis period was defined based on the periods corresponding to the expected GWTLs of 1.5 °C and 2 °C, which were derived from two global climate model (GCM) projections. In other words, analyses were conducted at predefined GWTLs instead of fixed future periods to maintain consistency between model simulations. Fixed time horizons can introduce additional uncertainty, as differences in model climate sensitivity may lead to variations in both the timing and magnitude of projected warming. Focusing on specific warming thresholds helps to limit this effect and provides a more reliable basis for assessing regional climate patterns [41]. To this end, global temperature averages for the pre-industrial period of 1861–1890 were calculated using MPI-ESM-MR developed by the Max Planck Institute for Meteorology in Germany and HadGEM2-ES developed by the Met Office Hadley Centre in United Kingdom [42]. In both models, a 30-year moving average was calculated for the future period, and the first 30-year periods that exceeded the 1.5 °C and 2 °C temperature increase thresholds compared to the reference period were determined. It was found that the first 30-year period crossing the 1.5 °C threshold is 2006–2035 for MPI-ESM-MR and 2009–2038 for HadGEM2-ES.
On the other hand, the periods exceeding the 2 °C threshold are 2024–2053 for MPI-ESM-MR and 2022–2051 for HadGEM2-ES. These periods are also compatible with other studies in the literature [32]. Then, these GCMs were dynamically downscaled to 10 km horizontal resolution using the RegCM4.4 hydrostatic regional climate model developed by the Abdus Salam International Centre for Theoretical Physics (ICTP) in Italy under the RCP8.5 scenario [43]. In order to make climate comparisons over high-resolution Türkiye data, temperature differences between the 1971–2000 period and the 1861–1890 period were examined using GCM outputs, and an increase of 0.65 °C and 0.18 °C was observed over Türkiye under the MPI-ESM-MR and HadGEM2-ES climate models, respectively. By adding this difference to the high-resolution 1971–2000 data, the change in Türkiye was projected at GWTL 1.5 °C and 2 °C. The RCP8.5 scenario [44] was adopted to determine the periods associated with these warming levels, as both thresholds are reached within the available simulation periods of the two driving GCMs. Under a more moderate forcing pathway, such as RCP4.5, later and model-dependent threshold crossing could place the corresponding GWTL periods outside the temporal coverage of the regional simulations, particularly for the 2 °C level. RCP8.5 was therefore used here to retain simulations driven by both GCMs in the 1.5–2 °C comparison rather than as an assumption of the most likely future emission pathway. Regional mean temperature and precipitation responses at a given GWTL have also been shown to have relatively limited sensitivity to the emission pathway, although some scenario dependence remains [45]. In this study, which aims to compare the climate extremes experienced in GWTL 1.5 °C and 2 °C, 1971–2000 reference period data was used for both temperature threshold periods in percentile calculations. Temperature and precipitation indices (Table 1) were calculated by obtaining temperature, precipitation, and relative humidity data with a 3-h temporal resolution from RegCM4.4 outputs. For the precipitation-based indices, the 3-hourly precipitation rates (mm/s) were first converted to accumulated precipitation amounts (mm) by multiplying each rate by the 3-h interval duration (10,800 s). Daily precipitation totals were then obtained by summing the eight 3-hourly accumulated values for each day. The analyses included T m e a n and TP as indicators of mean climate conditions; TN and DI as temperature extreme indices; and simple daily intensity index (SDII), extreme precipitation days (R90P), dry periods lasting at least five consecutive days (CDD5), and CDD precipitation extreme indices.
Each of the selected indices was chosen to represent a specific aspect of temperature or precipitation change. Depending on the GWTL, the change in T m e a n for Türkiye was examined, and seasonal trend differences were determined. The change in the number of TN, which is defined as the days when the daily minimum air temperature is above 20 °C [46] causing discomfort for people, was also evaluated. To further assess thermal discomfort conditions, the DI [47], one of the earliest and most widely used indices for assessing human thermal discomfort under varying climate conditions, was employed. It integrates ambient temperature and relative humidity (RH) to estimate discomfort levels at a given time and location and is commonly applied due to its simplicity and practicality [48,49]. Since thermal discomfort becomes widespread when the DI approaches about 27 °C [47,48], DI values of 27 °C and above were considered as the threshold for thermal discomfort in the study. The DI was calculated using the formulation proposed by Thom [47]:
D I = 0.4 ( T d + T w ) + 4.8
where T d is the dry-bulb temperature (°C) and T w is the wet-bulb temperature (°C).
As T w was not directly available from the RegCM4.4 outputs used in the analysis, it was calculated using the empirical approximation proposed by Stull [50], with T d expressed in °C and RH in %:
T w = T d arctan 0.151977 ( R H % + 8.313659 ) 1 / 2 + arctan ( T d + R H % ) arctan ( R H % 1.676331 ) + 0.00391838 ( R H % ) 3 / 2 × arctan ( 0.023101 R H % ) 4.686035
In order to examine the change in the general trend of precipitation, the percentage differences of the annual TP were calculated. SDII, which is defined as the amount of precipitation per wet day during the year, was used to compare the changes in average precipitation intensity [29,51]. To investigate the change in excessive precipitation, the number of days with precipitation exceeding the 90th percentile threshold was evaluated in the reference period [24]. Finally, due to the adverse effects of prolonged dry periods on water resources and agriculture, changes in the number of periods with precipitation below 1 mm for at least five consecutive days and the annual maximum number of consecutive dry days were compared [52,53,54]. Each continuous dry period was counted as a single event, without overlapping counts within the same period.
The spatial robustness of the projected changes between GWTL 1.5 °C and 2 °C was evaluated at each grid cell using a signal-to-noise ratio (SNR) [55]. The assessment was conducted separately for the changes at GWTL 1.5 °C and 2 °C relative to the 1971–2000 reference period and for the additional change between the two warming levels. For each GWTL, the signal was defined as the difference between the corresponding 30-year mean ( X ¯ G W T L ) and the reference-period mean ( X ¯ r e f ) :
S N R G W T L = X ¯ G W T L X ¯ r e f σ r e f , G W T L { 1.5 , 2.0 }
The robustness of the additional change from GWTL 1.5 °C to 2 °C was calculated as follows:
S N R 2.0 1.5 = X ¯ 2.0 X ¯ 1.5 σ r e f
In both calculations, the noise term σ r e f was represented by the temporal standard deviation of the detrended reference-period series. Annual values were used for the annual indicators, whereas the corresponding seasonal series were used for seasonal T m e a n and TP. The linear trend was removed from the reference period series before calculating the standard deviation to minimize the contribution of long-term trends to the estimate of interannual variability. Grid cells with | S N R | 1 were considered to show a robust response, indicating that the magnitude of the projected signal was equal to or greater than one standard deviation of the reference-period interannual variability [56].
In addition, inter-model agreement was assessed at each grid cell based on the sign of the projected changes, with agreement defined as occurring when RCM-MPI and RCM-HG indicated changes in the same direction. This assessment was performed separately for the changes at GWTL 1.5 °C and 2 °C relative to the reference period and for the difference between the two warming levels.

3. Results

Projected changes in fundamental climate variables (i.e., mean temperature and precipitation) and selected climate extreme indices over Türkiye were analyzed using high-resolution regional climate simulations driven by the MPI-ESM-MR (RCM-MPI) and HadGEM2-ES (RCM-HG) models under the RCP8.5 scenario. The results are first presented for each GWTL (i.e., 1.5 °C and 2 °C), followed by an assessment of the differences between these two warming conditions.

3.1. Projected Changes in Climate Means and Extremes Under GWTL 1.5 °C and 2 °C

3.1.1. Changes in Mean Temperature and Temperature Extremes

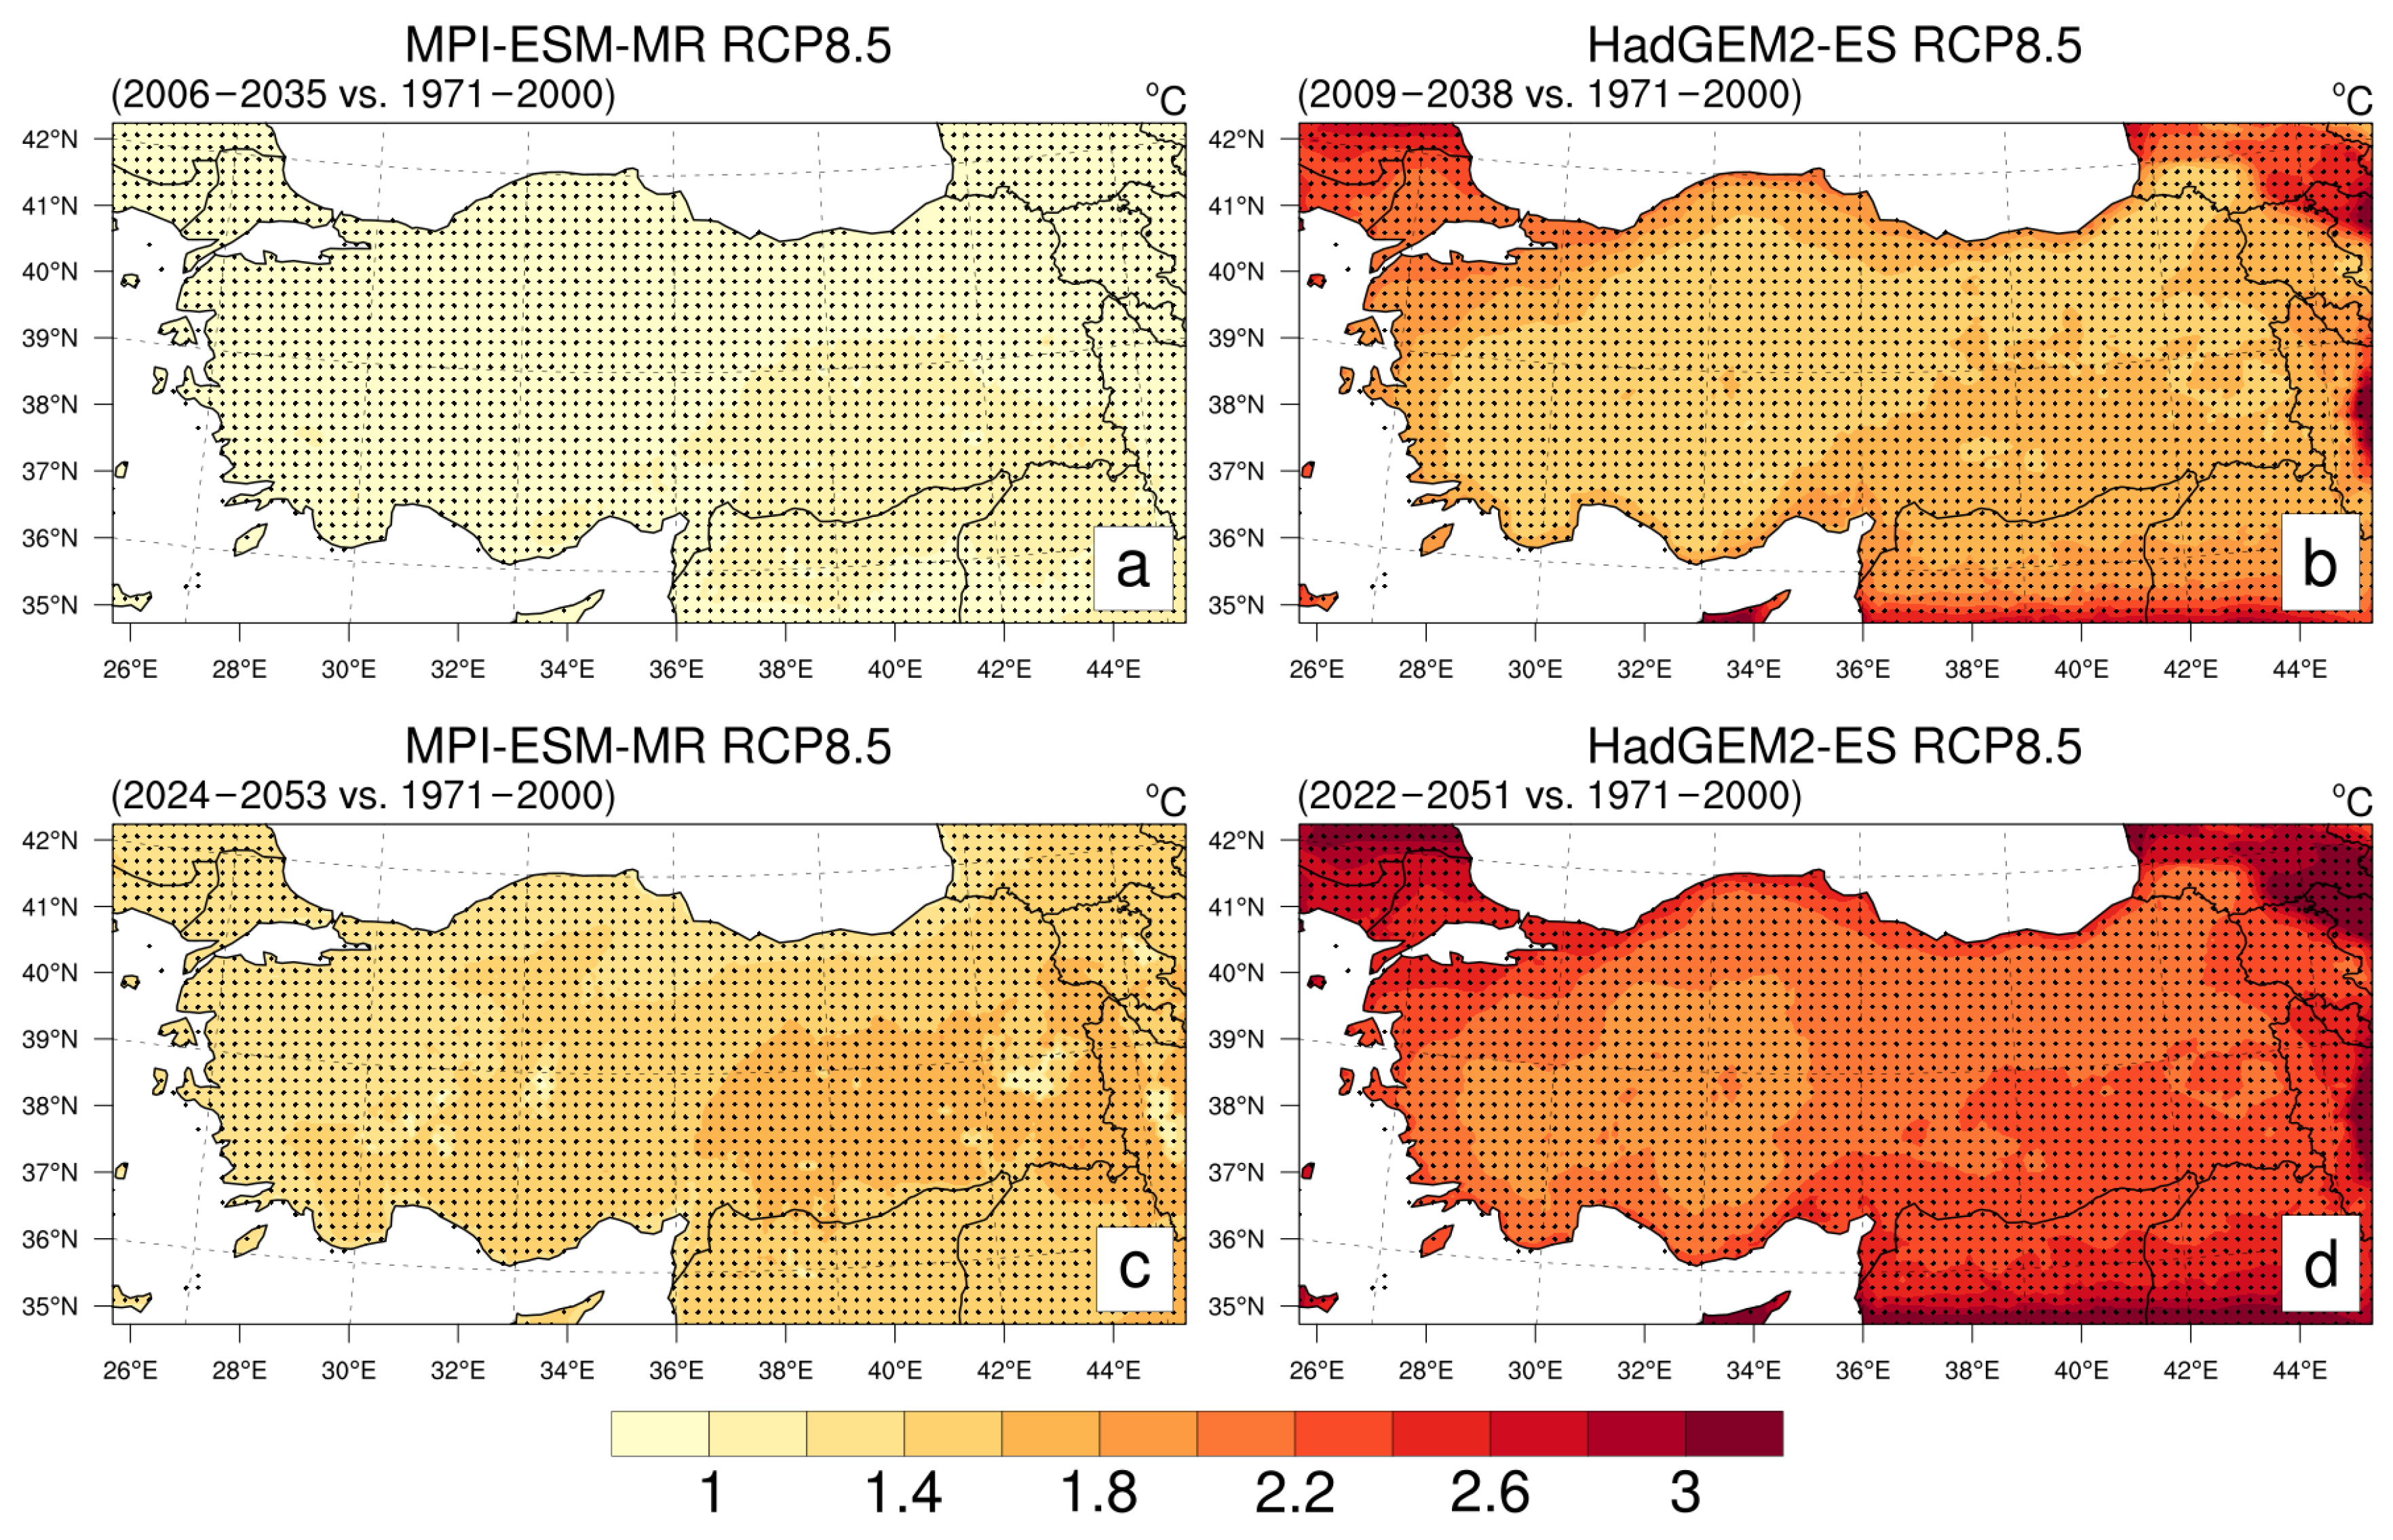
At GWTL 1.5 °C, both models show positive annual T m e a n changes across Türkiye, although the spatial patterns differ considerably (Figure 2a,b). In the RCM-MPI simulations, temperature increases are relatively homogeneous, with slightly higher values observed over eastern and southeastern regions, while western and coastal areas remain comparatively lower. In contrast, the RCM-HG simulations display a stronger and more spatially extensive warming pattern across the country. Higher temperatures are particularly evident in southern, southeastern, and eastern Türkiye, while RCM-HG generally produces warmer conditions than RCM-MPI across most regions. When averaged over Türkiye, RCM-MPI produces a mean increase of 0.91 °C, whereas RCM-HG reaches 1.63 °C, reflecting substantially higher warming levels in the RCM-HG simulations. The warming signal is robust over nearly the entire country in RCM-MPI and the entire country in RCM-HG. The two simulations also show 100% agreement in the direction of change, with positive changes projected throughout Türkiye.
At GWTL 2 °C, both models indicate a further increase in annual T m e a n together with a strengthening of the existing spatial patterns (Figure 2c,d). In the RCM-MPI simulations, warming remains relatively smooth and more evenly distributed, although higher values become more apparent over eastern and southeastern Türkiye. The RCM-HG simulations continue to produce stronger regional contrasts, with extensive areas exceeding 2 °C, particularly across southern and low-elevation regions. Across the country, average warming rises to 1.46 °C in RCM-MPI and 2.15 °C in RCM-HG. All land grid cells meet the | S N R | 1 criterion in both simulations, and both models consistently indicate warming at every location.
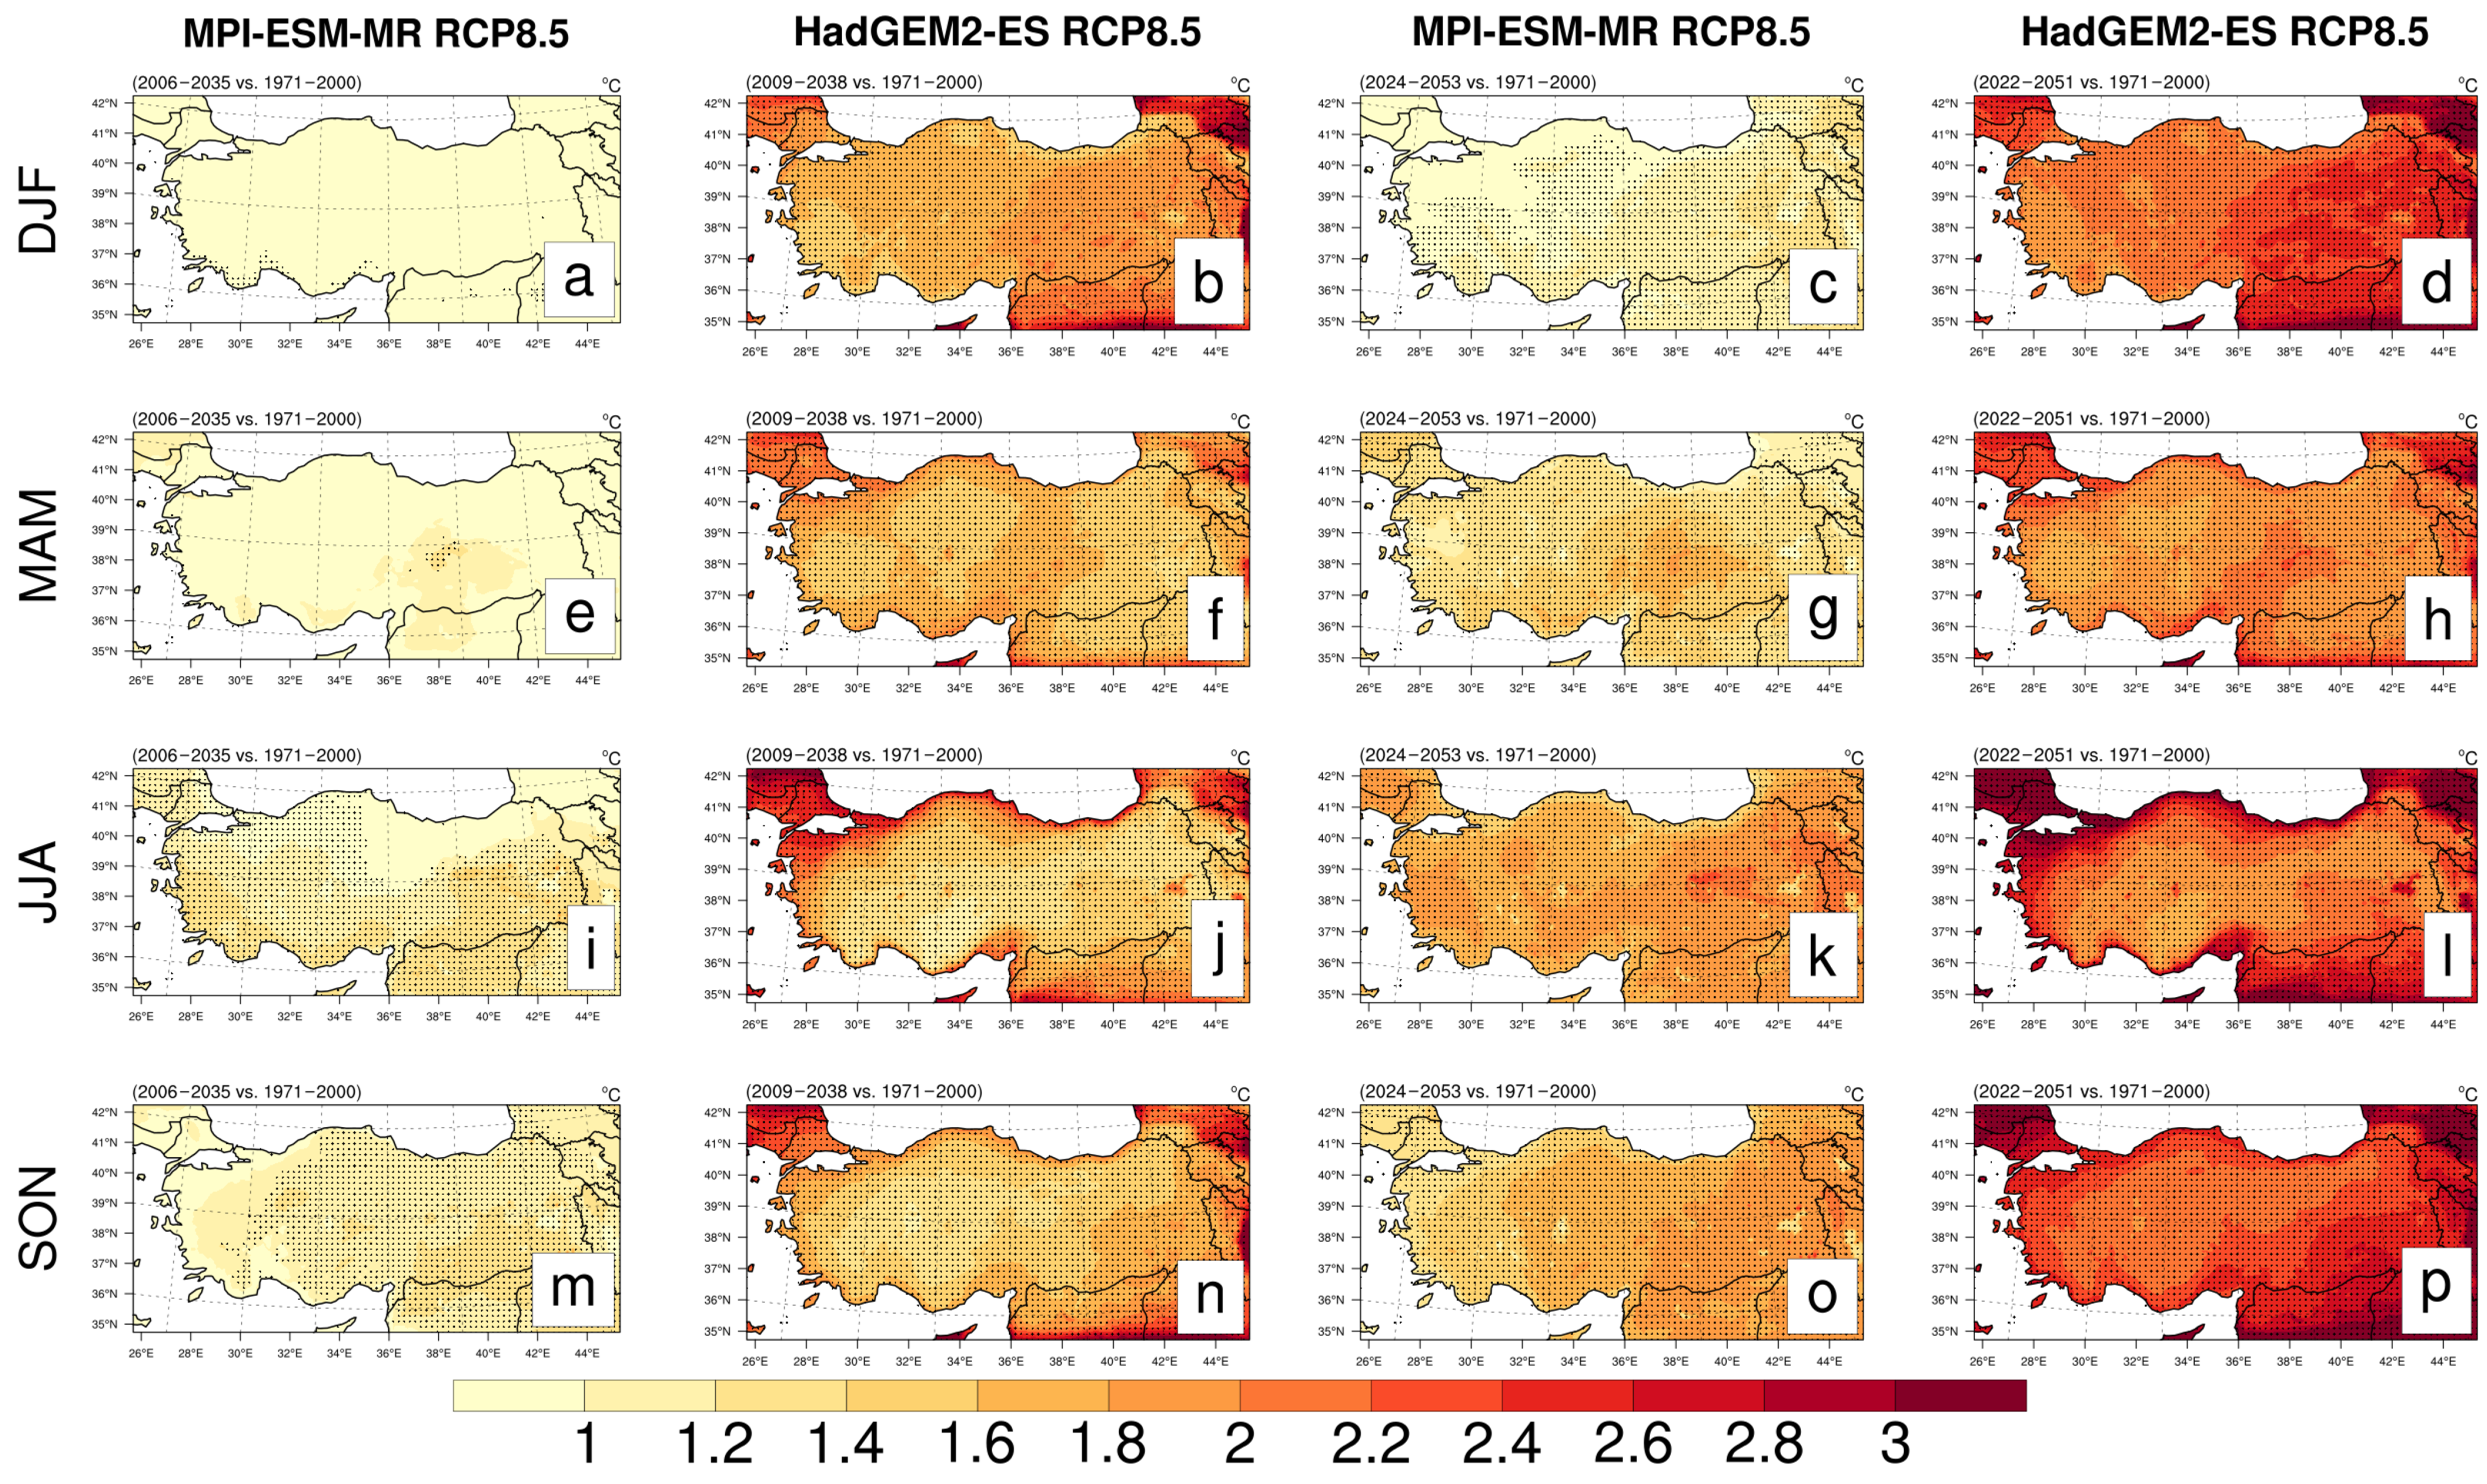
A progressive warming signal is evident in the seasonal T m e a n projections over Türkiye, with clear differences between models and warming levels (Figure 3). In the RCM-MPI simulations, seasonal changes at GWTL 1.5 °C remain relatively moderate, with values of 0.6 °C in winter (December–February, DJF), 0.87 °C in spring (March–May, MAM), 1.06 °C in summer (June–August, JJA), and 1.11 °C in autumn (September–November, SON). The spatial distribution indicates that warming is already more pronounced during the warm season, particularly in southern and inland regions. In the RCM-HG simulations, higher temperature levels are observed from the outset. At GWTL 1.5 °C, seasonal changes already reach 1.75 °C in winter, 1.64 °C in spring, 1.58 °C in summer, and 1.55 °C in autumn. These values indicate that warming over Türkiye exceeds the nominal global level in all seasons. The spatial pattern is also more intense, particularly across southeastern and coastal regions. The robustness assessment reveals marked seasonal and model-dependent contrasts. In RCM-MPI, warming emerges from background variability only over limited areas during winter and spring. Its spatial extent increases substantially in summer, while robust warming prevails over most of the country except western Türkiye in autumn. RCM-HG, on the other hand, exhibits robust changes over the whole country in all four seasons. Despite these contrasts, inter-model sign agreement reaches 100% in each season.
At GWTL 2 °C, higher seasonal T m e a n values are observed in both models (Figure 3). As warming reaches GWTL 2 °C, the RCM-MPI results show a consistent increase for all seasons. Seasonal values rise to 1.01 °C in winter, 1.38 °C in spring, 1.8 °C in summer, and 1.65 °C in autumn. The increase is most notable in summer and autumn, making these seasons the warmest in the RCM-MPI projections under GWTL 2 °C. With GWTL 2 °C, the RCM-HG model produces a further increase, with seasonal means rising to 2.18 °C in winter and summer, 1.95 °C in spring, and 2.3 °C in autumn. The magnitude of warming becomes particularly substantial in winter, summer, and autumn, where values exceed 2 °C across large parts of the country. Robust changes in RCM-MPI encompass almost all of Türkiye in spring and autumn and the whole country in summer, although non-robust areas remain mainly in northwestern Türkiye during winter. The larger temperature anomalies at GWTL 2 °C increase the signal relative to reference-period variability, leading to wider robust coverage. RCM-HG continues to show robust warming in every season, without any non-robust areas. Agreement on the sign of change remains 100% for all four seasons.
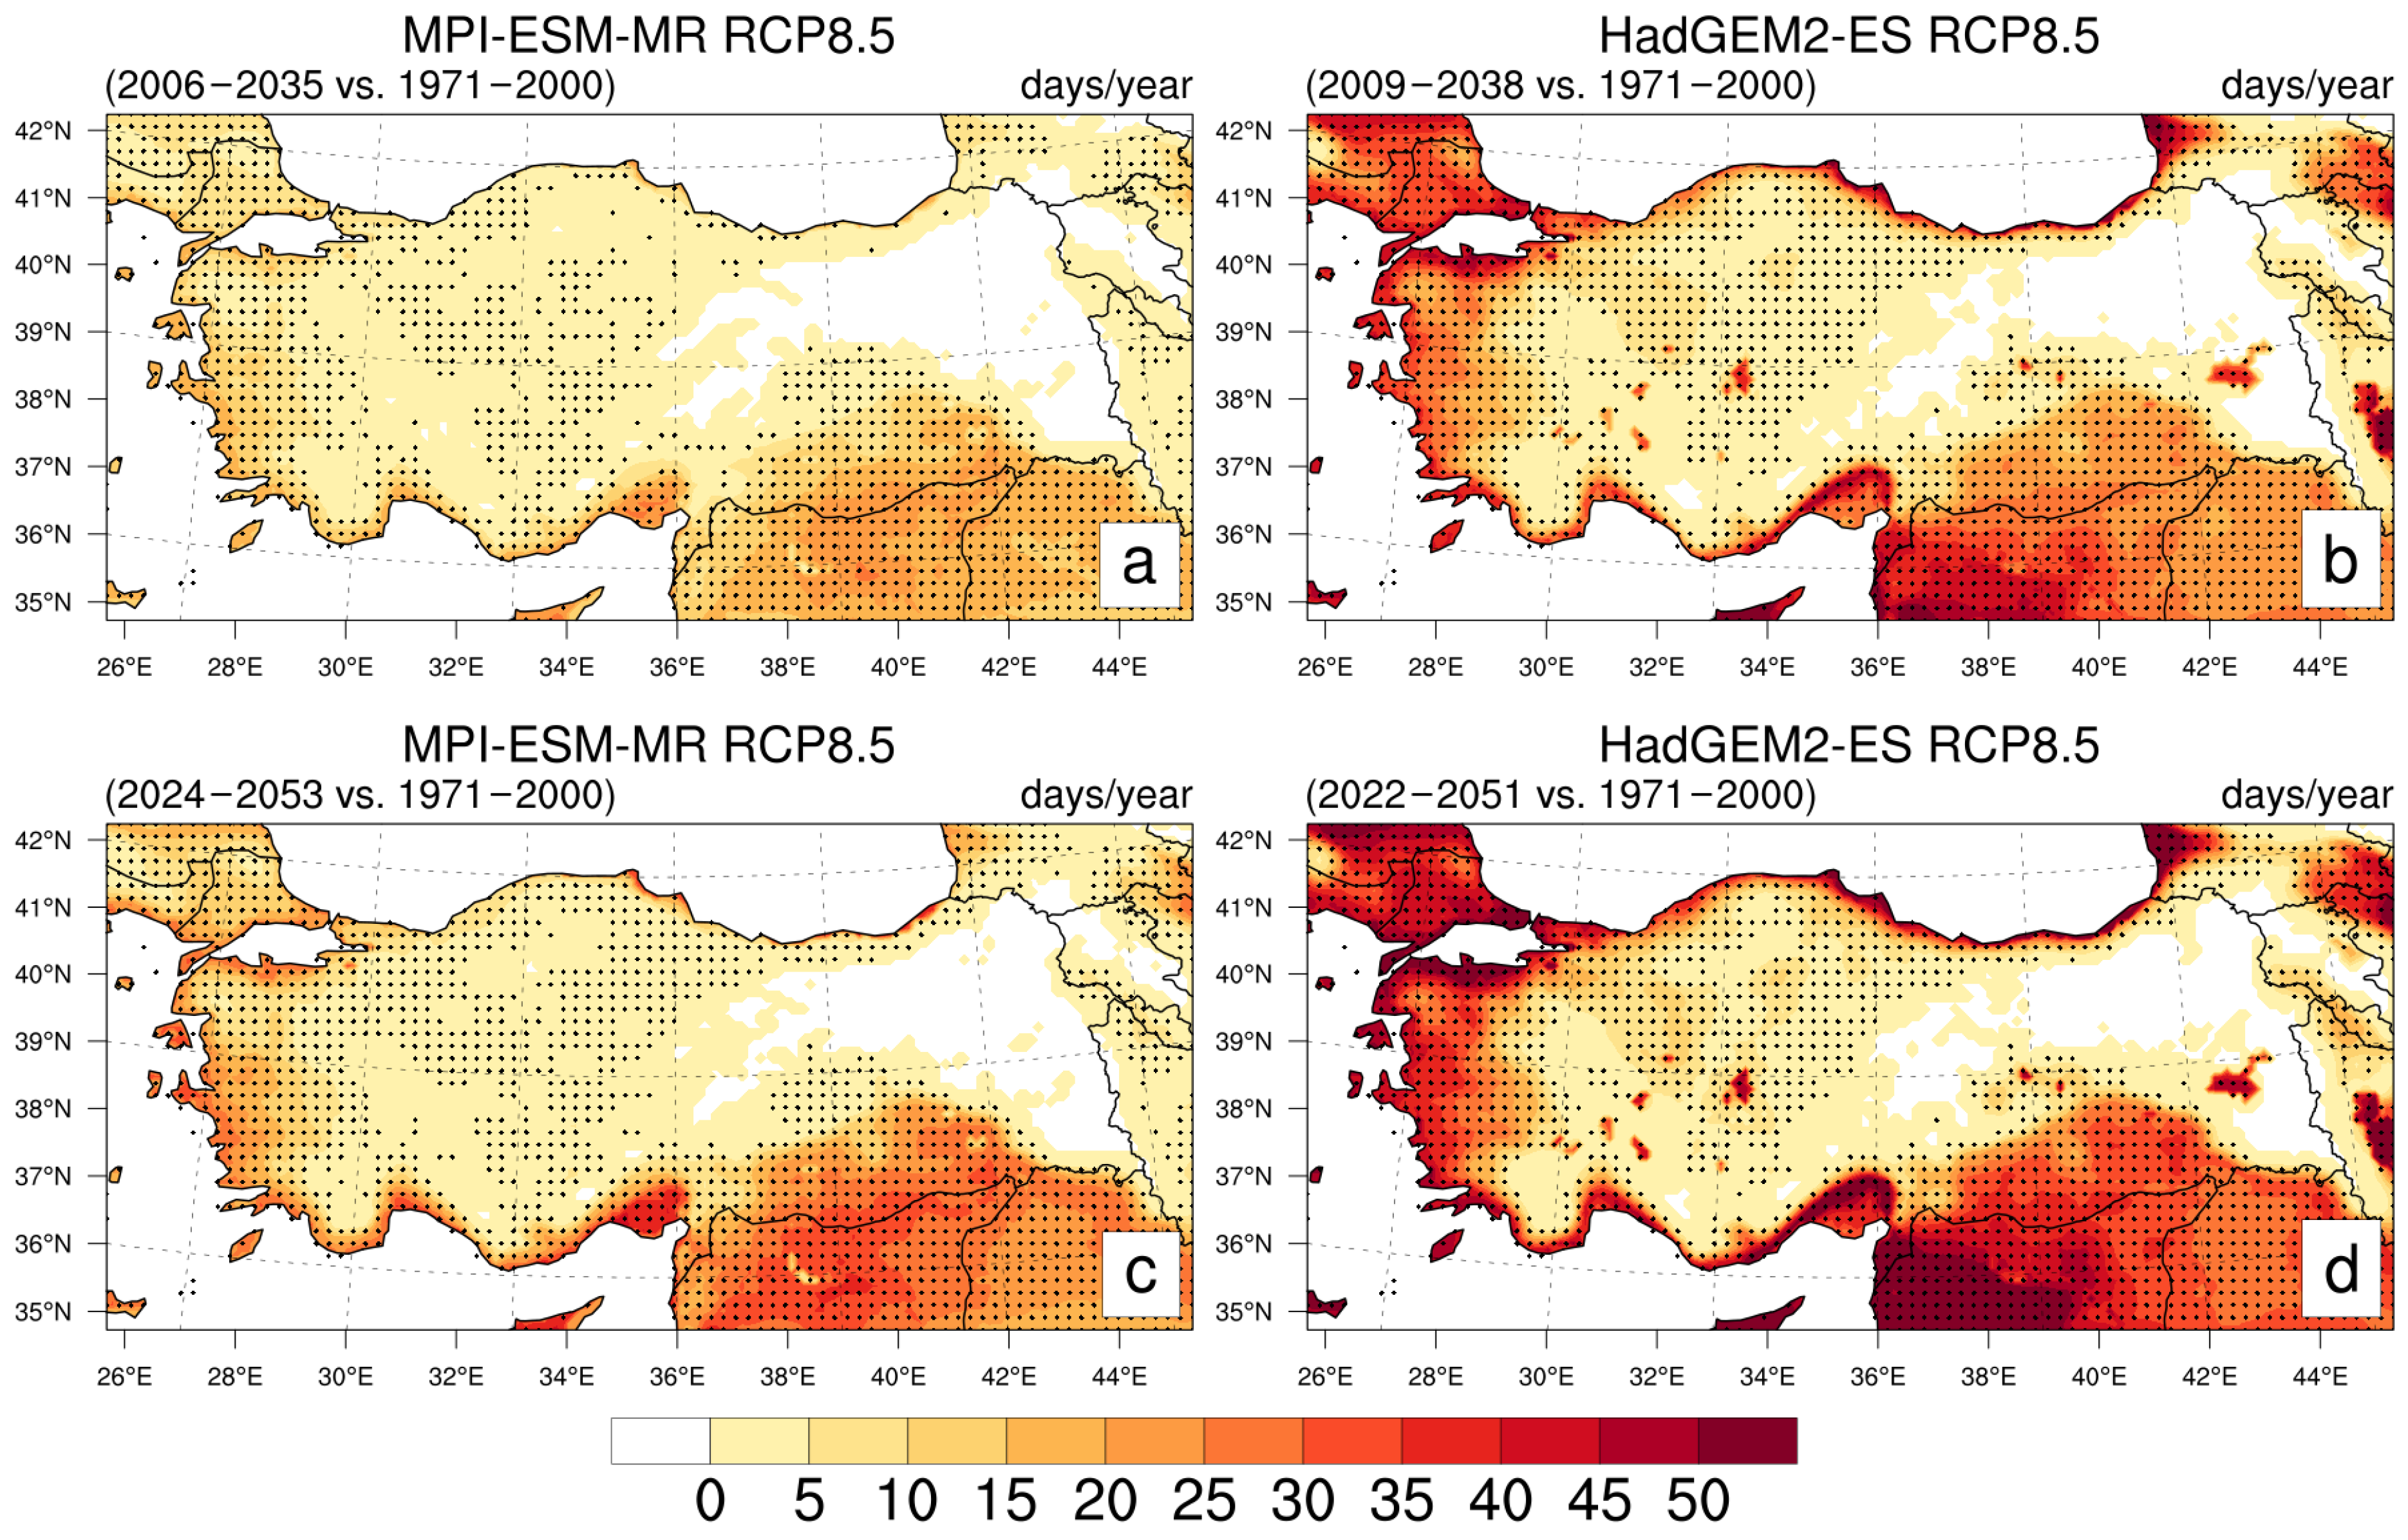
At GWTL 1.5 °C, both models indicate an increase in TN across Türkiye, although important regional differences are apparent (Figure 4a,b). In the RCM-MPI simulations, relatively moderate increases are observed, with higher frequencies appearing mainly along coastal zones and southeastern Türkiye, while interior and elevated regions remain comparatively lower. In contrast, the RCM-HG simulations produce markedly larger increases in TN over much broader areas of the country. Southern, western, and low-elevation regions display particularly strong increases, indicating a wider spatial extent of nighttime warming conditions. Mean changes in TN reach 3.54 days/year in RCM-MPI and 9.64 days/year in RCM-HG, highlighting the substantially warmer nighttime conditions represented in the RCM-HG simulations. Robust TN increases are found over most of Türkiye in RCM-MPI and nearly the whole country in RCM-HG. Areas without robust response occur mainly in interior and elevated regions, where changes are small or negligible. The two simulations show the same direction of change in approximately 77% of the domain.
At GWTL 2 °C, both simulations show a further expansion of tropical night conditions together with stronger spatial continuity (Figure 4c,d). In the RCM-MPI results, the increase becomes more evident over coastal and southeastern regions, while central and eastern interior areas continue to exhibit relatively lower frequencies. The RCM-HG simulations maintain considerably higher TN values across most of Türkiye, with widespread high frequencies extending throughout southern and western regions. Mean changes in TN increase to 6.44 days/year in RCM-MPI and 13.35 days/year in RCM-HG, with RCM-HG continuing to produce substantially higher frequencies. Consistent with these differences, the spatial extent of high TN frequencies is substantially greater in RCM-HG than in RCM-MPI. With additional warming, robust TN changes extend over almost the whole country in both simulations, leaving only limited areas where change remains negligible. The proportion of Türkiye showing the same direction of change in RCM-MPI and RCM-HG also increases to approximately 80%.
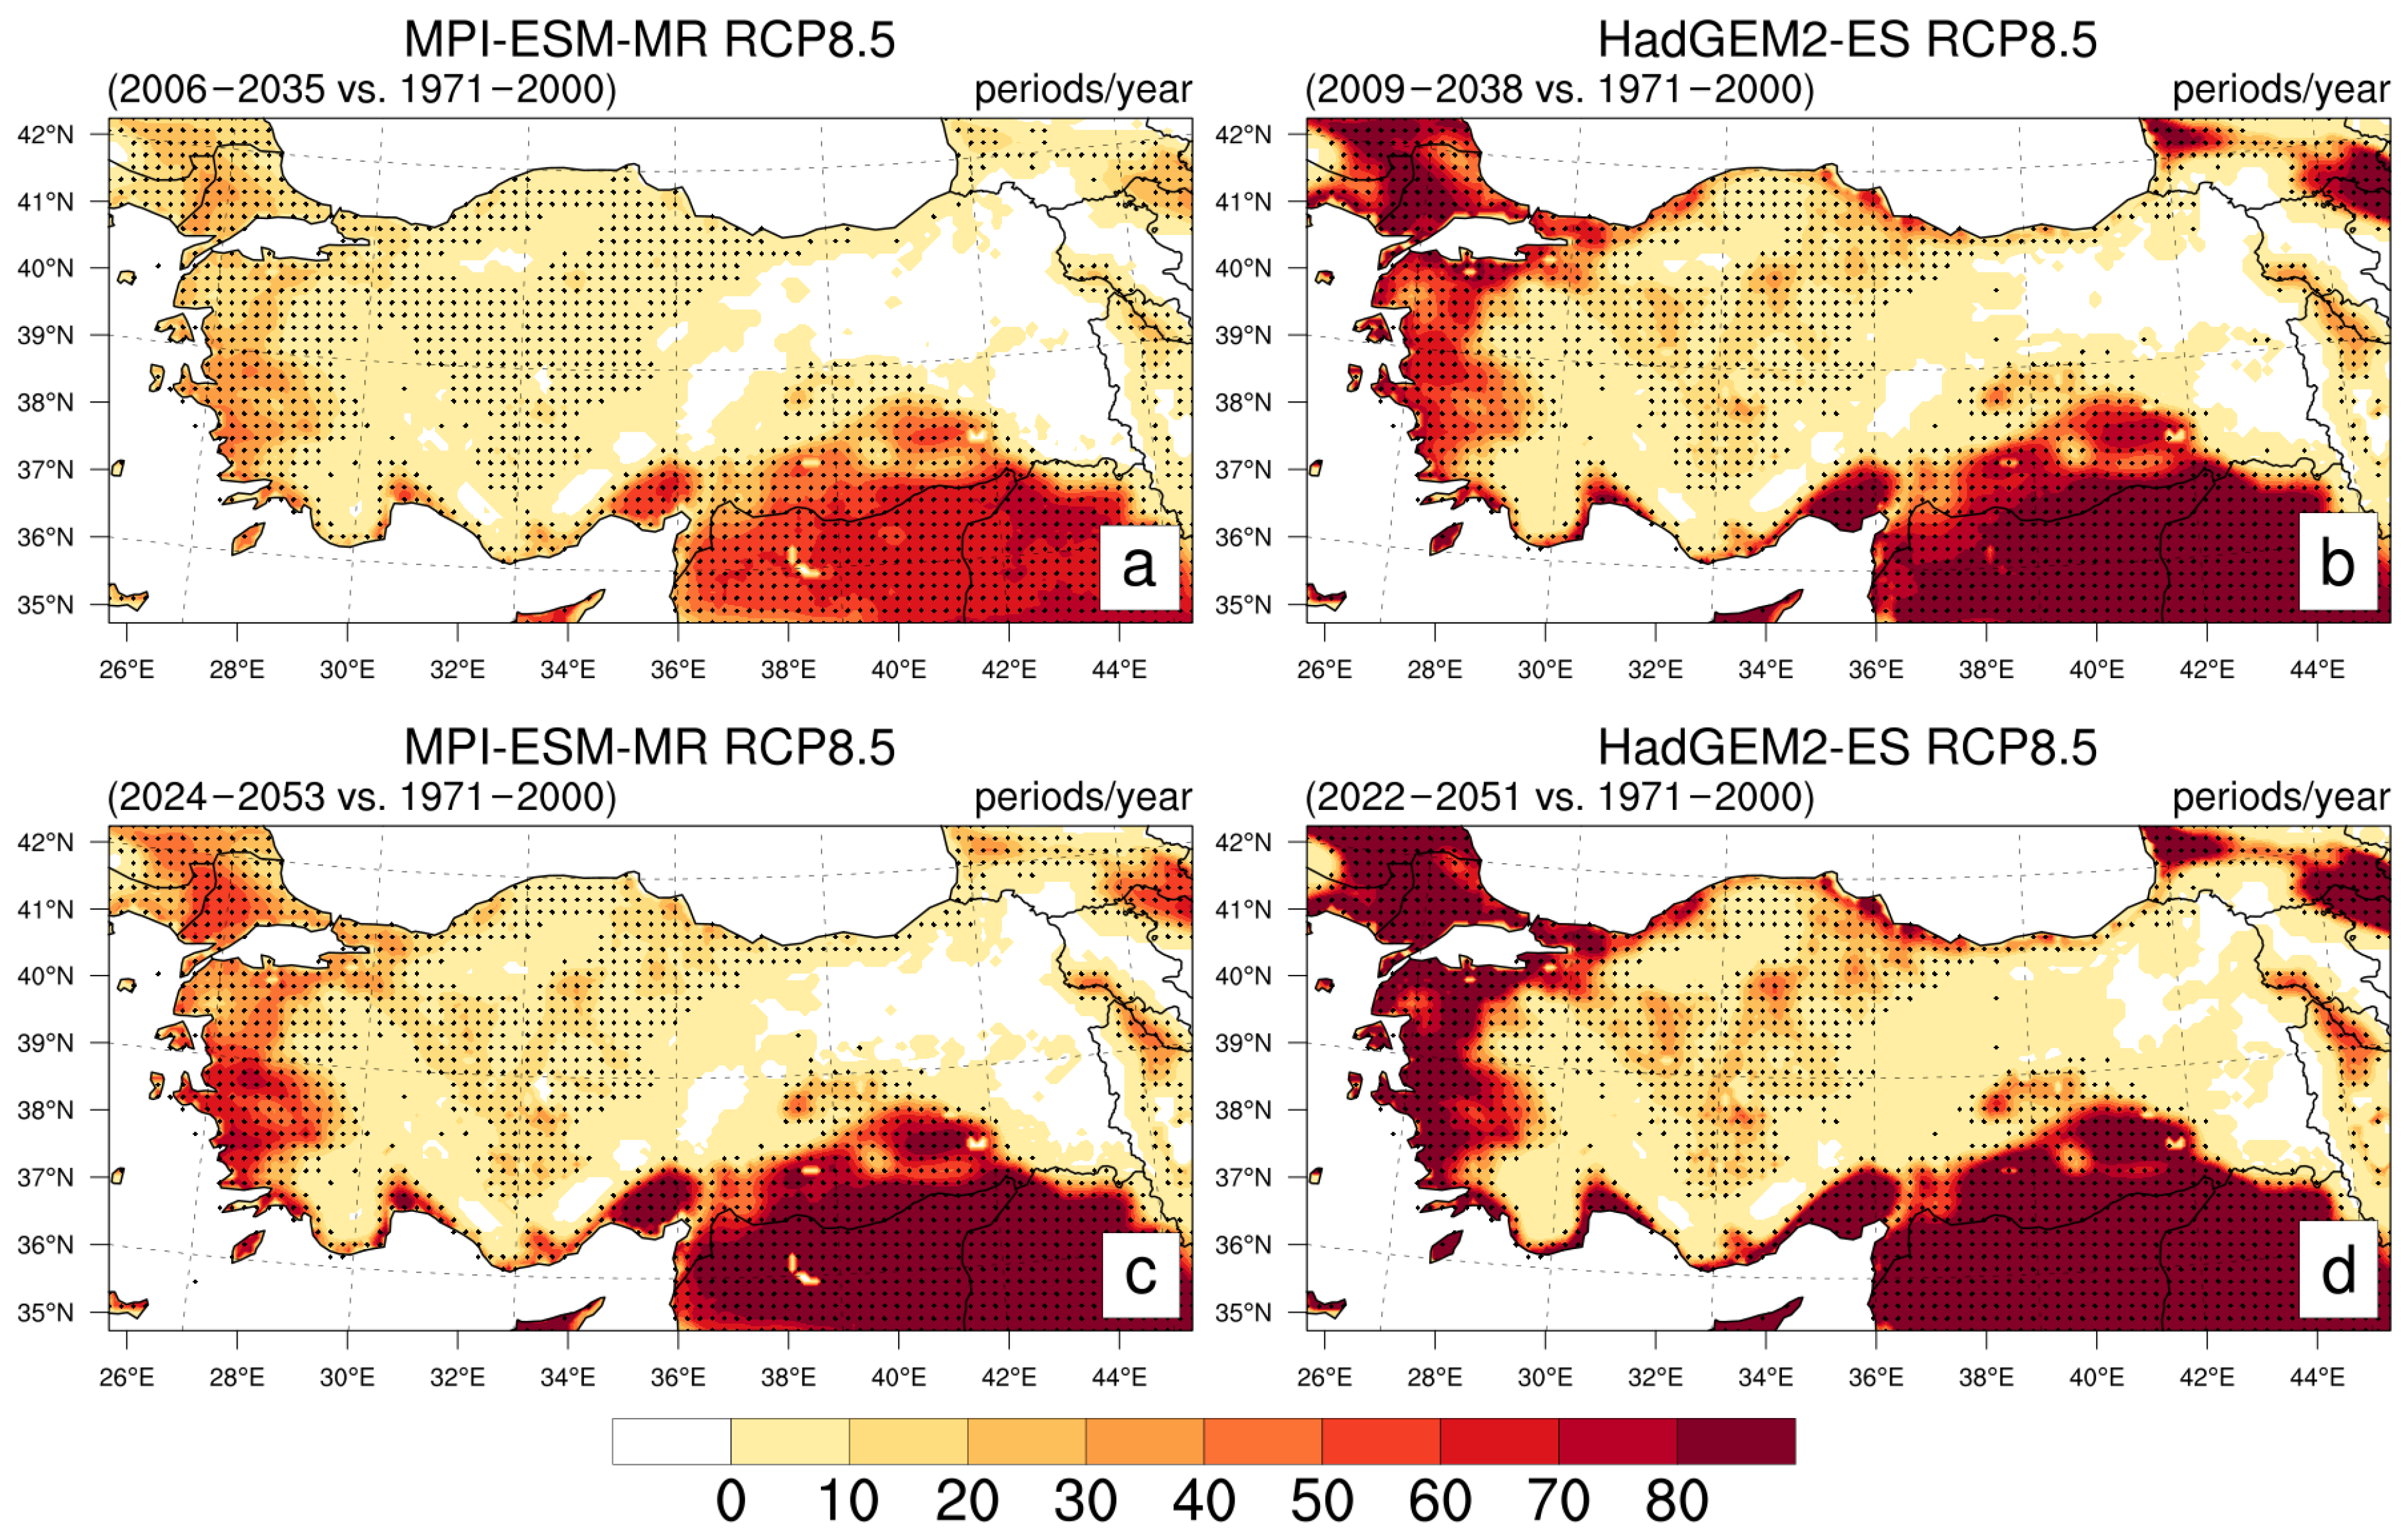
At GWTL 1.5 °C, both models indicate increased DI exceedances across Türkiye, although the spatial characteristics differ substantially (Figure 5a,b). In the RCM-MPI simulations, higher frequencies are observed mainly along the Mediterranean coast and southeastern Türkiye, while central and northern regions remain comparatively lower. The RCM-HG simulations display a broader distribution large increases in DI exceedance frequency, extending across much of western, southern, and southeastern Türkiye. This wider spatial coverage points to more frequent heat-discomfort conditions in the RCM-HG model. The country mean increase reaches 9.39 periods/year in RCM-MPI and 20.09 periods/year in RCM-HG, indicating considerably higher thermal discomfort levels in the RCM-HG simulations. Robustness is high in both simulations, although its spatial coverage is greater in RCM-HG. Non-robust cells appear primarily over cooler, higher-elevation parts of interior and eastern Türkiye, where the 27 °C threshold is crossed less frequently. Meanwhile, agreement in sign between the models is approximately 76%.
At GWTL 2 °C, both simulations show an expansion of high discomfort conditions together with increasing frequencies over large parts of the country (Figure 5c,d). In the RCM-MPI results, the area affected by higher frequencies extends from coastal regions toward central Anatolia, while southeastern Türkiye continues to experience the highest frequencies. In the RCM-HG simulations, very high frequencies dominate much of southern, western, and southeastern Türkiye, with broader spatial continuity compared to RCM-MPI. The country mean increase reaches 18.19 periods/year in RCM-MPI and 29.69 periods/year in RCM-HG. These results indicate that additional warming leads to a substantial increase in heat-related discomfort conditions across Türkiye, particularly in the RCM-HG simulations where high DI frequencies become widespread. The additional half-degree produces a modest expansion of robust coverage in RCM-MPI. Little change occurs in RCM-HG, for which robustness was already widespread at GWTL 1.5 °C. The remaining gaps are concentrated primarily over elevated terrain in interior and eastern Türkiye. Sign consistency between the models increases to approximately 81%.

3.1.2. Changes in Total Precipitation and Precipitation Extremes

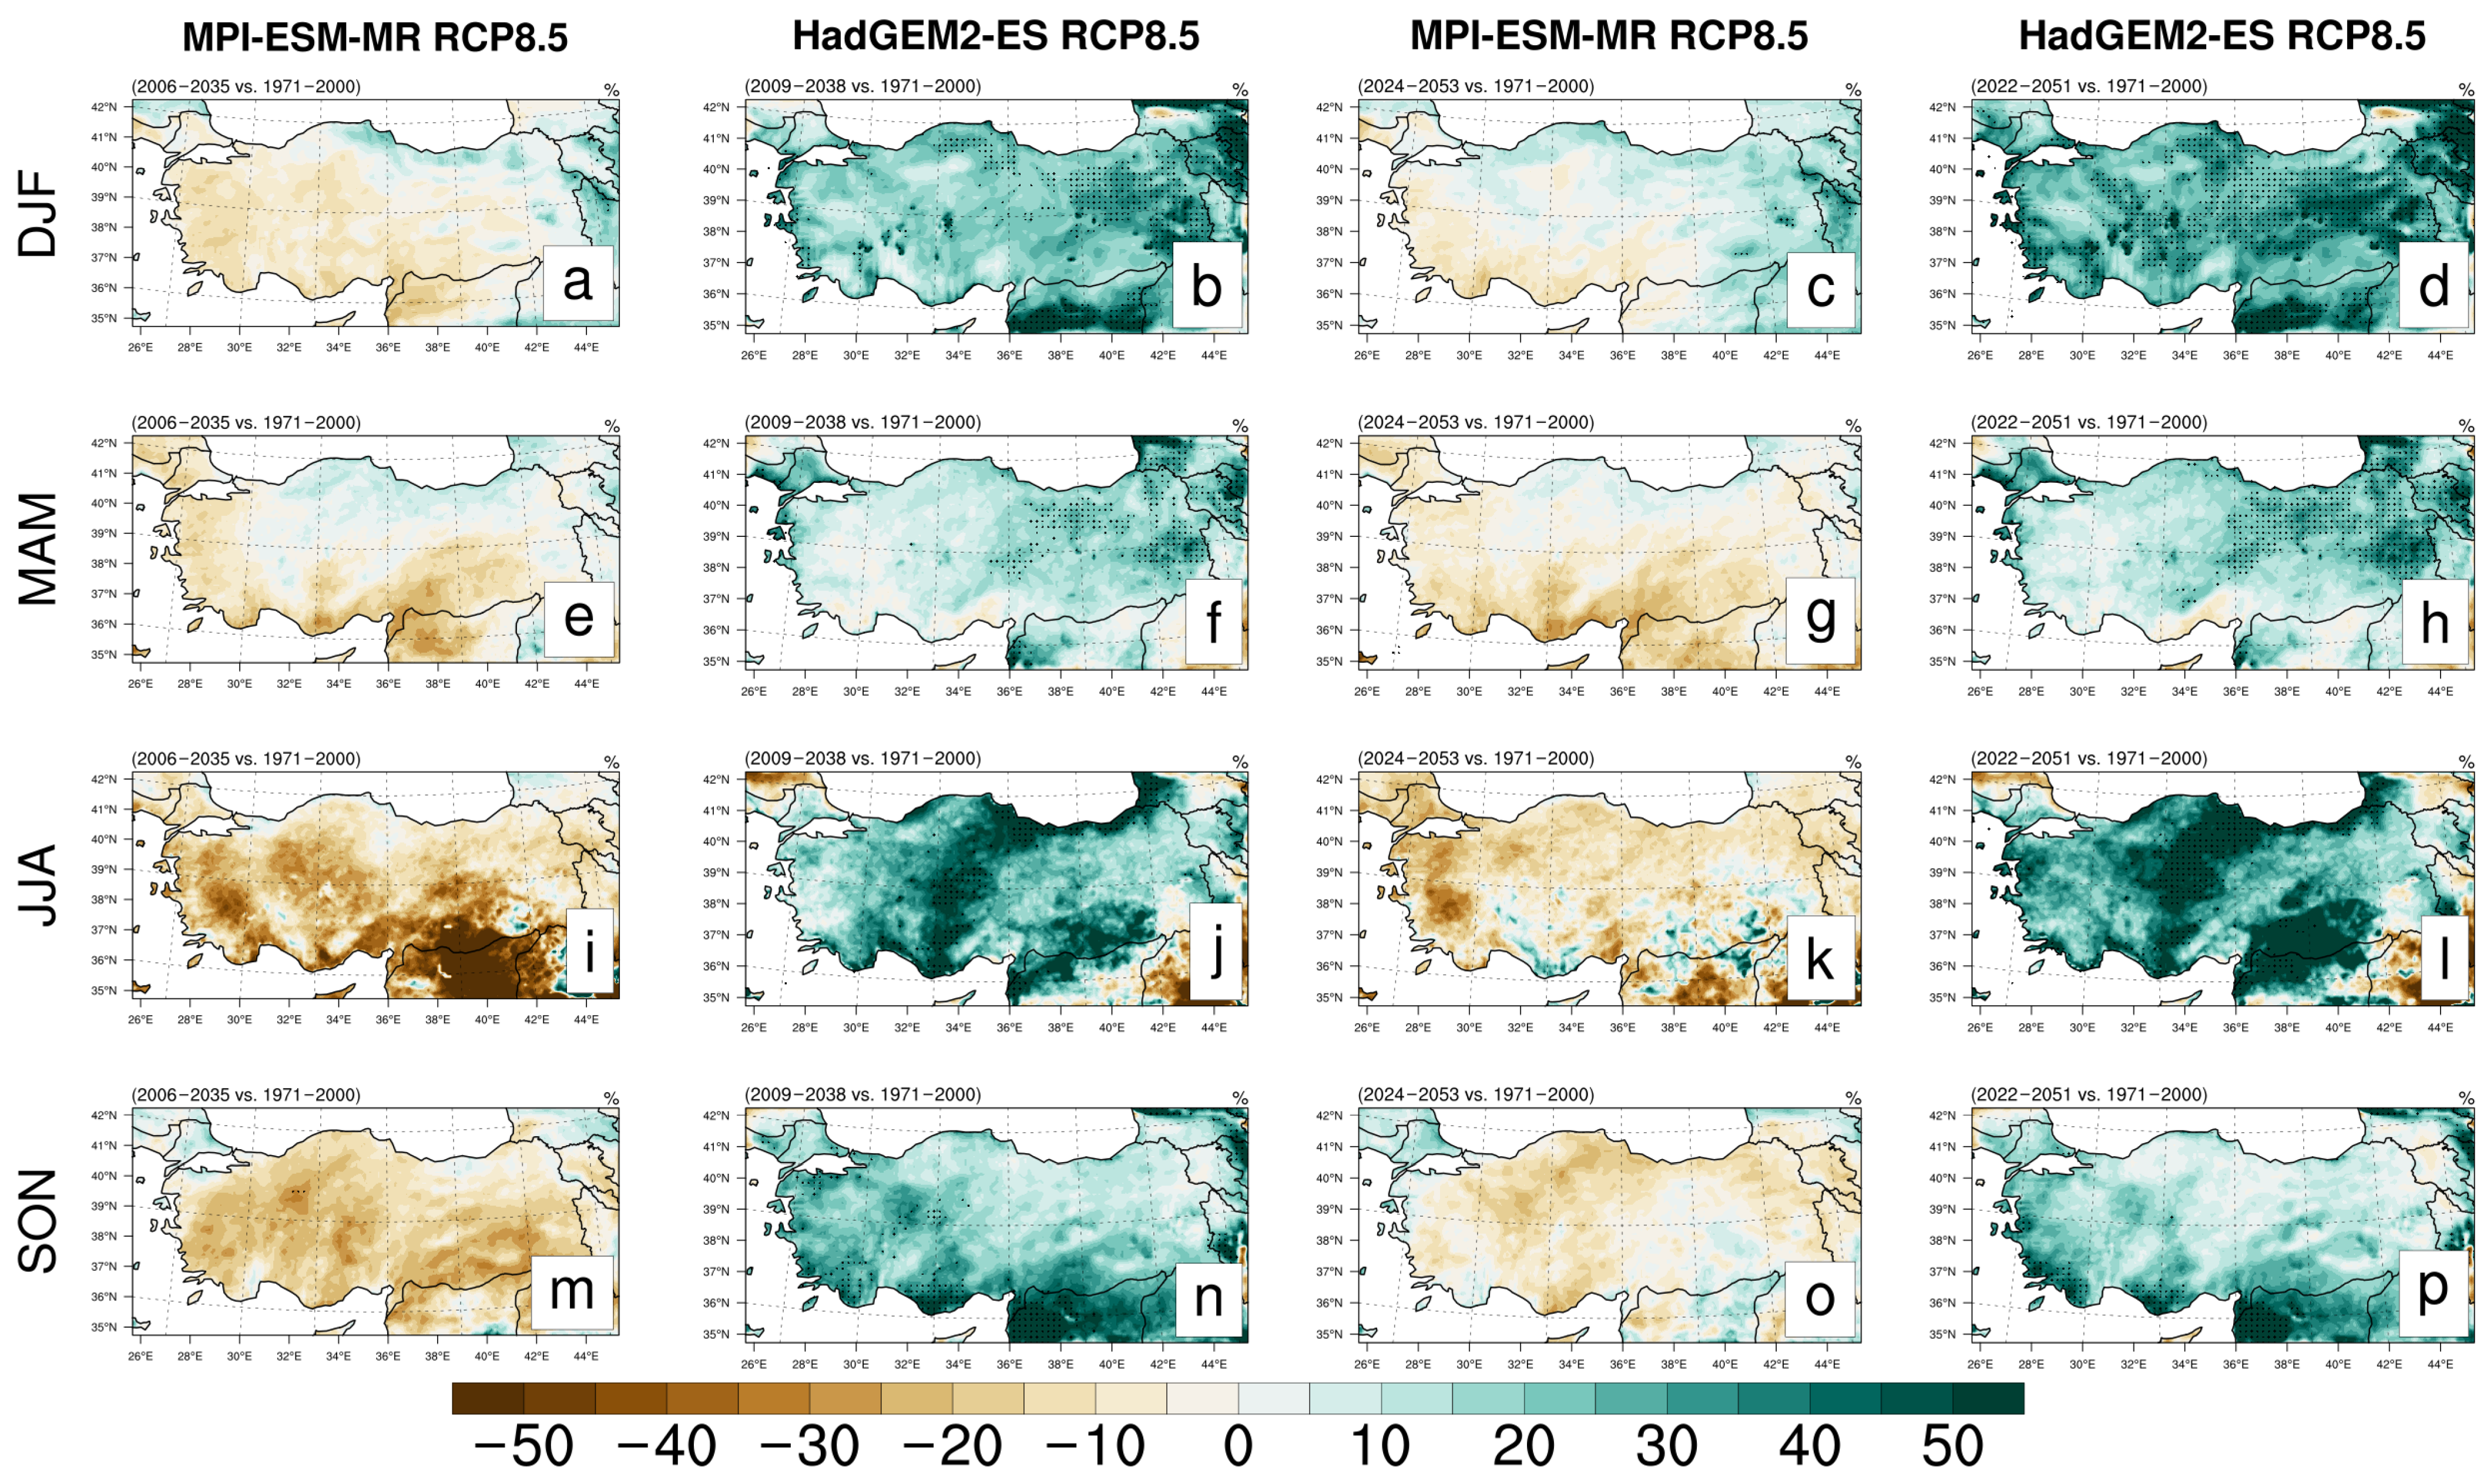
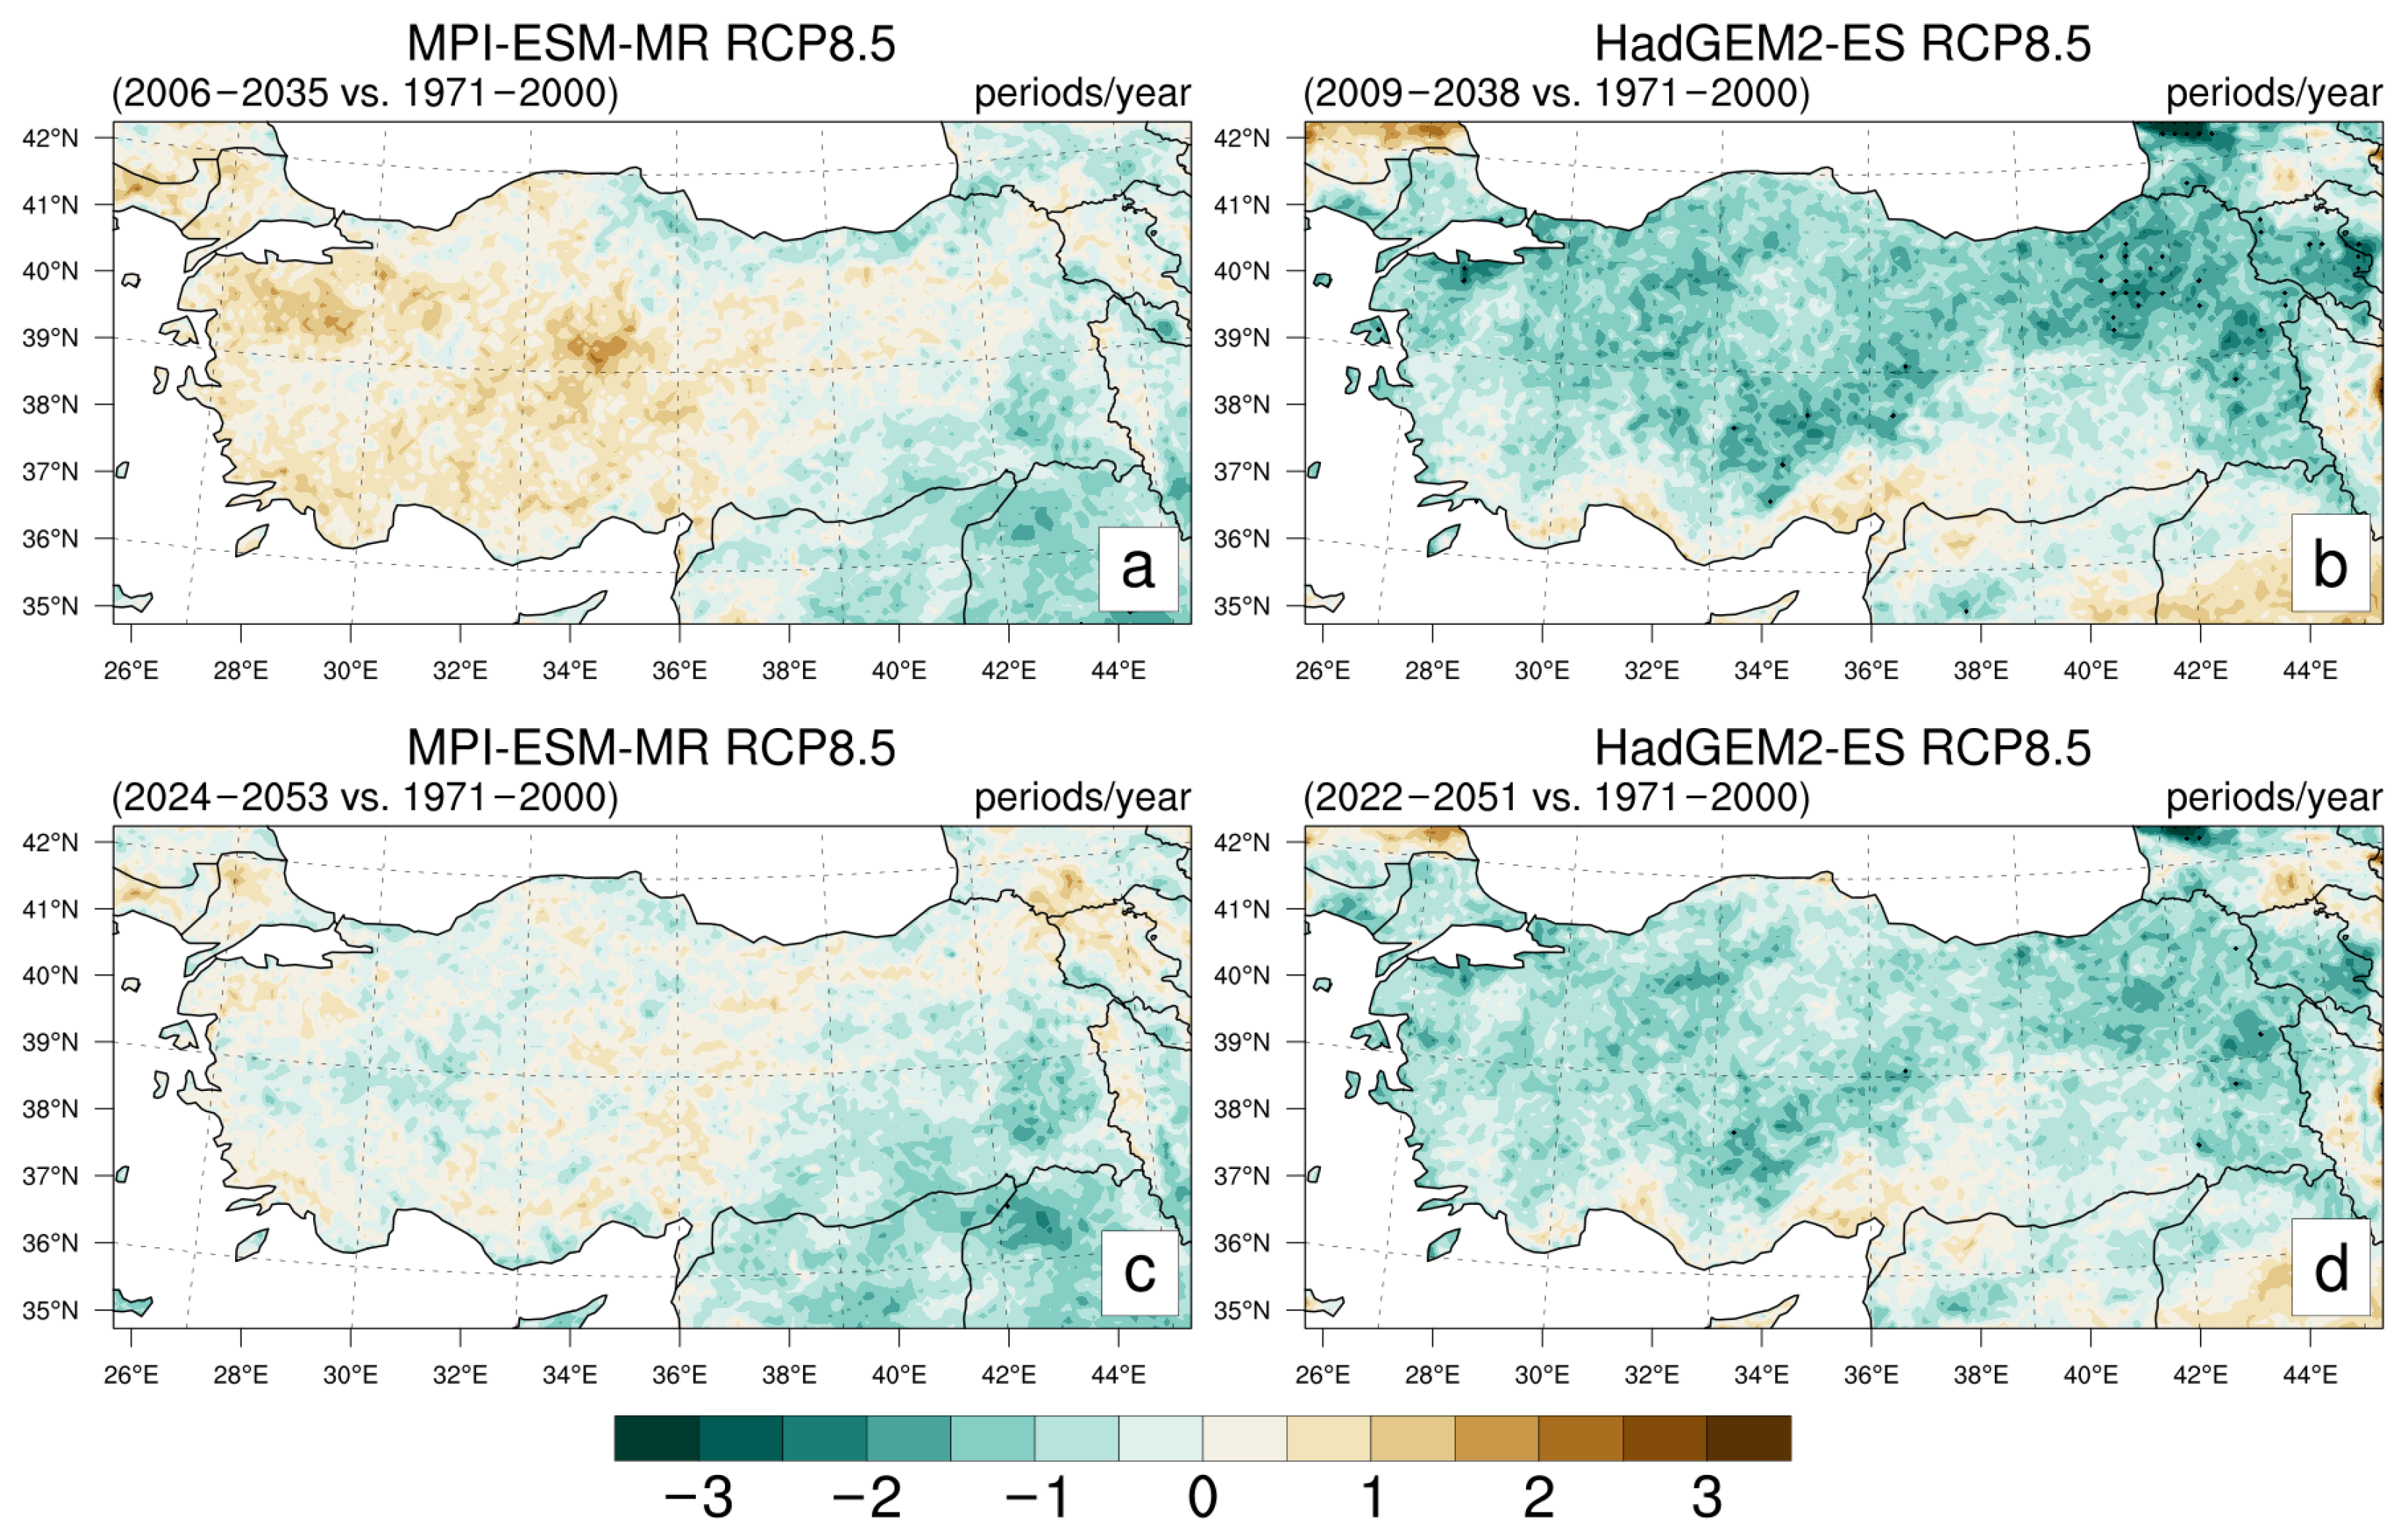
At GWTL 1.5 °C, the RCM-MPI simulations show a generally negative precipitation signal across all seasons, with country mean changes of approximately −4.21% in winter, −4.9% in spring, −18.65% in summer, and −15.23% in autumn (Figure 6). The most pronounced reductions occur during summer and autumn, pointing to a substantial weakening of precipitation, particularly over southern and interior regions. Under GWTL 1.5 °C, the RCM-HG simulations display a consistently positive precipitation response across all seasons, with increases of approximately +21.92% in winter, +12.54% in spring, +28.63% in summer, and +19.99% in autumn (Figure 6). The most pronounced intensification occurs in summer, indicating a strong enhancement of convective precipitation processes. The robustness assessment indicates that the changes in TP remain weak relative to reference-period interannual variability. In RCM-MPI, robust responses are virtually absent in all seasons, apart from a very limited area in autumn. RCM-HG shows greater, though still limited, robust coverage, which is most evident in winter and decreases toward autumn. Consistency in the sign of change between the models is approximately 26% in winter, 39% in spring, 8% in summer, and 6% in autumn.
At GWTL 2 °C, the seasonal response becomes more differentiated in the RCM-MPI simulations. Winter shifts to a positive anomaly (+2.96%), indicating increased precipitation, whereas spring (−6.6%), summer (−9.6%), and autumn (−6.16%) continue to exhibit decreasing tendencies (Figure 6). Relative to the 1.5 °C level, reductions in summer and autumn are less pronounced, suggesting a partial easing of drying conditions during these seasons. In contrast, the RCM-HG model indicates a further strengthening of precipitation in most seasons, reaching +28.77% in winter, +15.72% in spring, and +36.11% in summer, while the lowest increase is observed in autumn (+15.62%) (Figure 6). This suggests that precipitation intensification in the RCM-HG simulations becomes more pronounced with warming, particularly in winter and summer. When comparing the two models, a strong contrast becomes apparent. RCM-MPI is dominated by negative anomalies, particularly under GWTL 1.5 °C, with only limited increases at 2 °C, whereas RCM-HG consistently produces substantial positive precipitation changes across all seasons. Regarding the robustness of these changes, RCM-MPI shows a robust response only in a very limited area during winter at GWTL 2 °C, with none in the other seasons. In RCM-HG, robust precipitation changes encompass nearly half of Türkiye in winter but remain less extensive in spring and summer and become sparse in autumn. Sign agreement is approximately 60% in winter, 24% in spring, 17% in summer, and 22% in autumn.
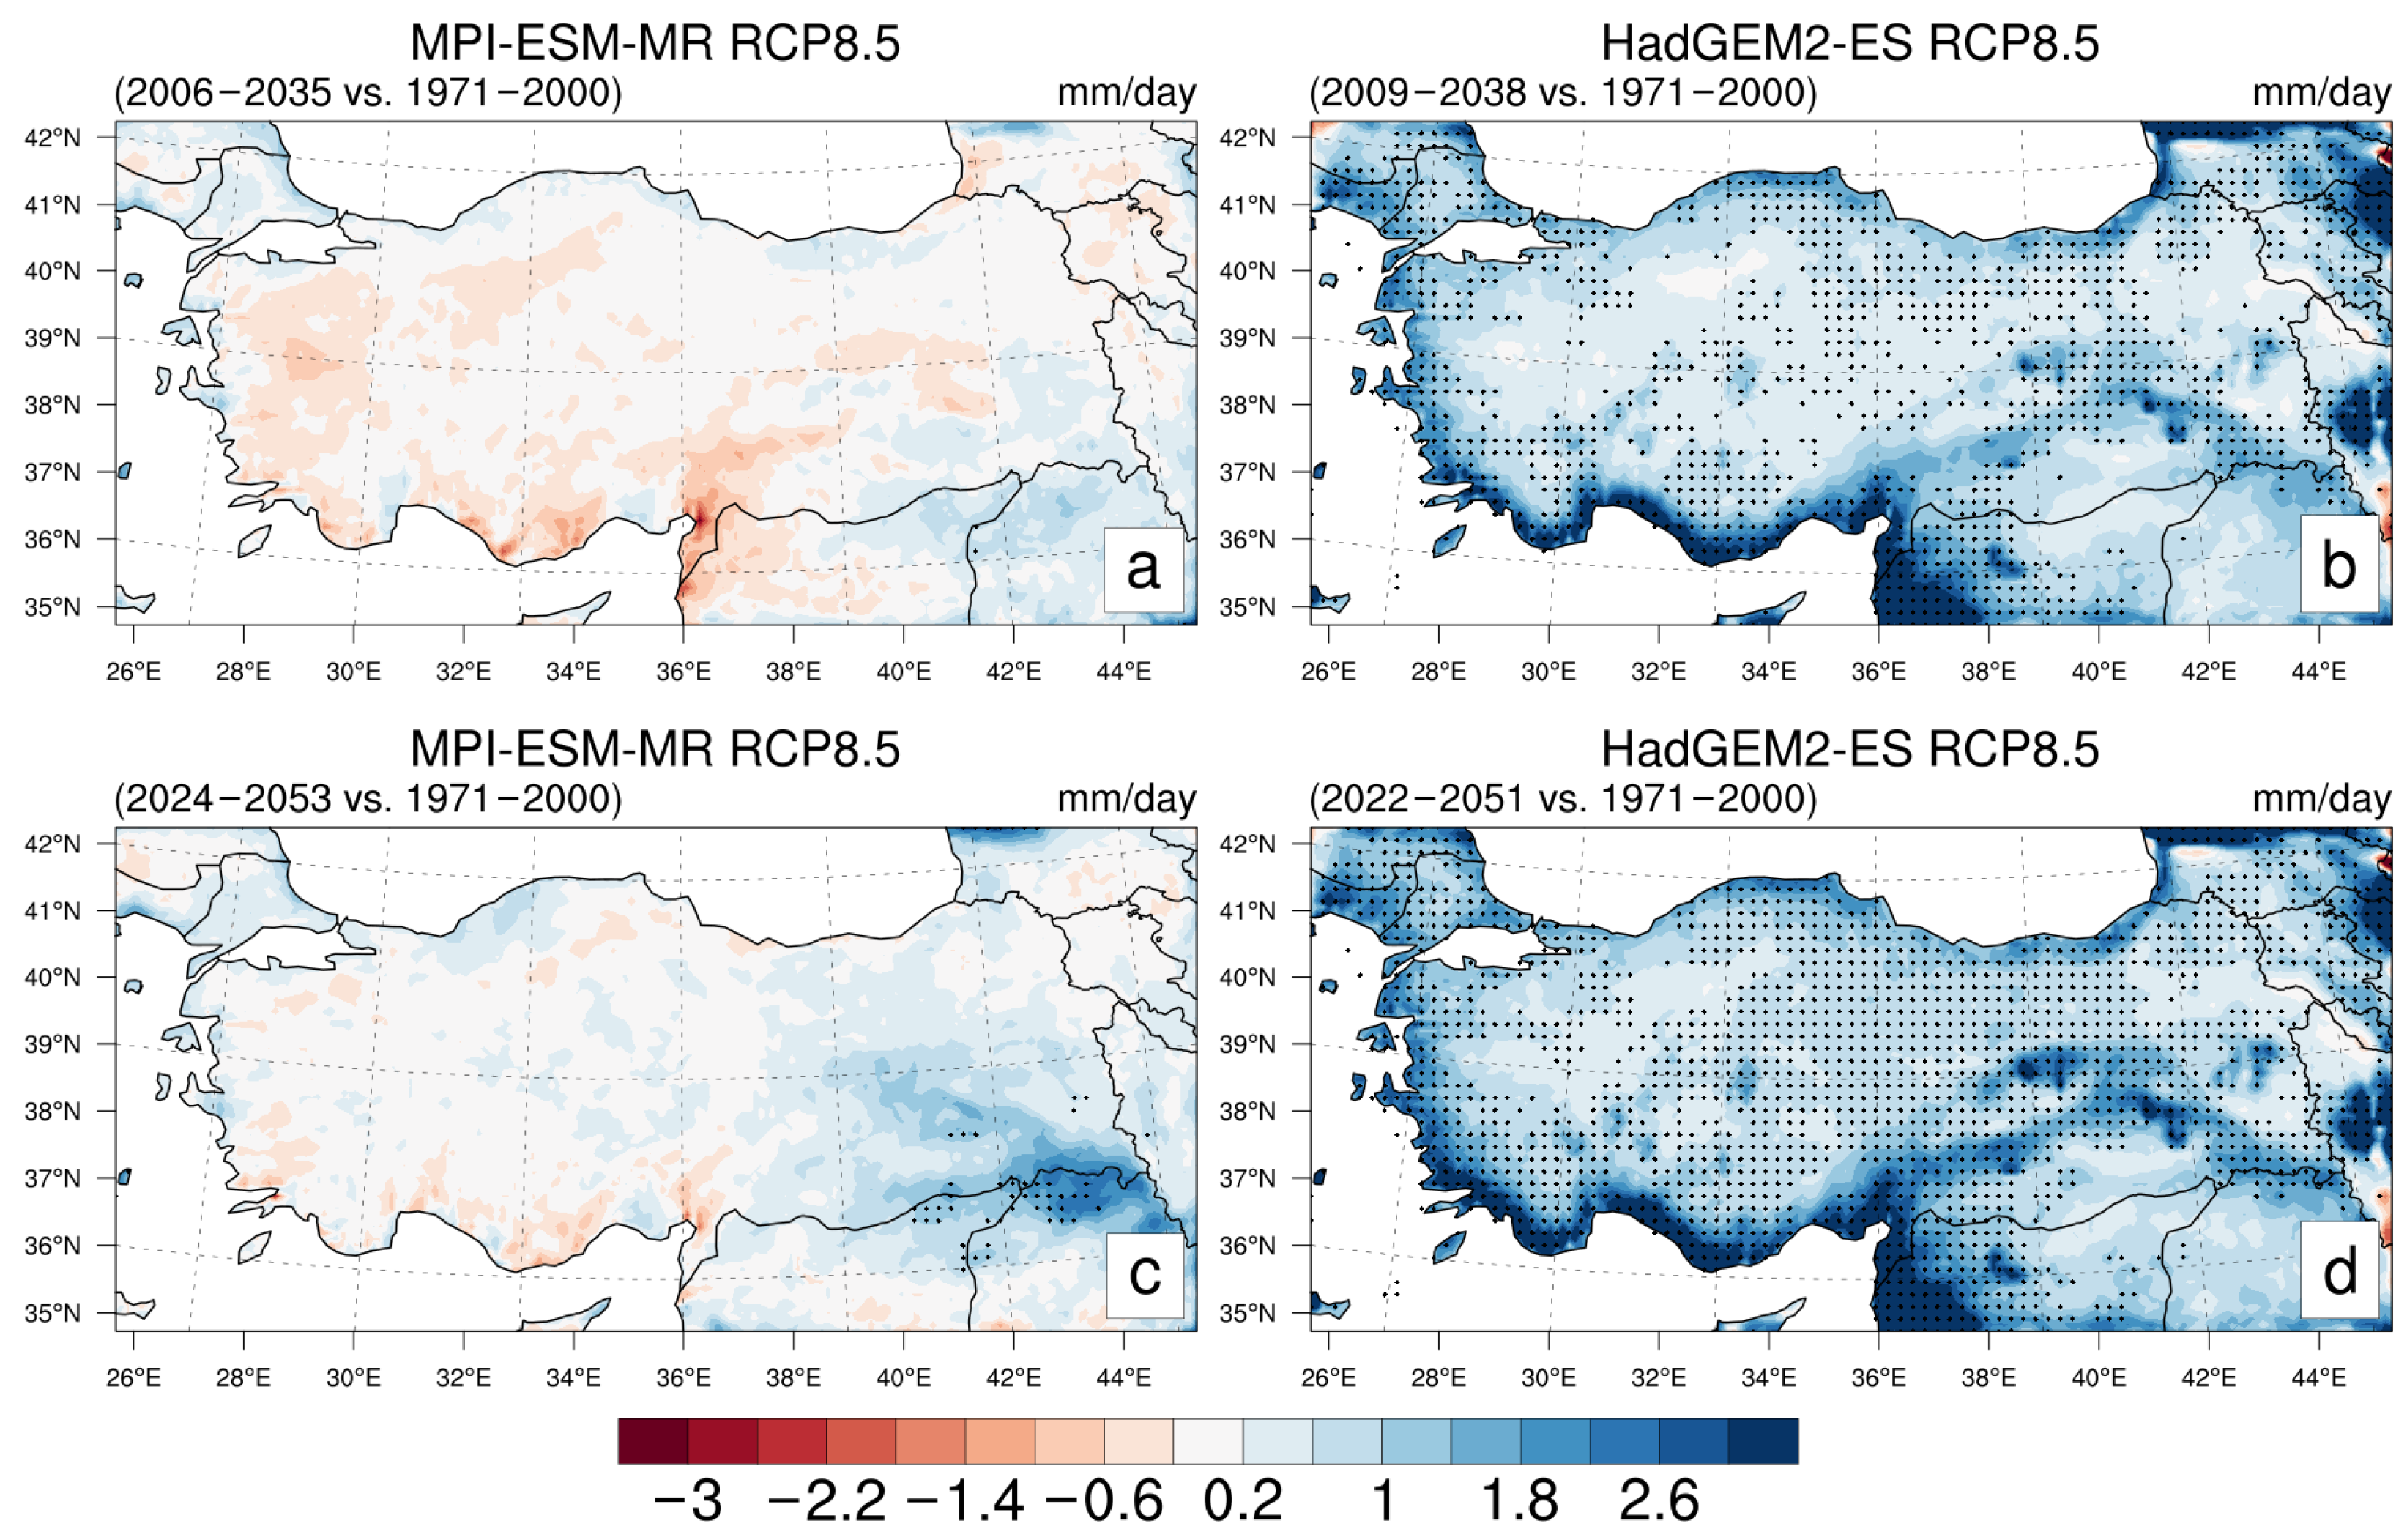
At GWTL 1.5 °C, the SDII patterns differ considerably between the two models across Türkiye (Figure 7a,b). In the RCM-MPI simulations, western and central regions generally exhibit weak negative or near-neutral changes, while limited positive values appear over parts of eastern and southeastern Türkiye. The overall spatial structure remains fragmented, with relatively small changes throughout most of the country. In contrast, the RCM-HG simulations show positive SDII changes over much broader areas, particularly along coastal regions and across southern Türkiye, where stronger increases in precipitation intensity become visible. Mean SDII change remains slightly negative in RCM-MPI (−0.08 mm/day), whereas RCM-HG produces a positive countrywide increase of approximately 0.93 mm/day, indicating higher precipitation intensity in the RCM-HG simulations. This may also be associated with stronger short-duration precipitation events, particularly in regions where SDII increases are most pronounced. None of the SDII changes in RCM-MPI meet the robustness criterion, whereas robust increases occupy approximately half of Türkiye in RCM-HG, including coastal areas and parts of interior regions. Despite the predominantly positive response in RCM-HG, the two simulations indicate the same direction of change in only approximately 39% of the domain.
At GWTL 2 °C, both models display higher SDII values compared to the 1.5 °C conditions, although their spatial characteristics remain distinct (Figure 7c,d). In the RCM-MPI results, positive changes become more noticeable over eastern and southeastern Türkiye, while some western areas continue to show weak negative values. The spatial pattern remains relatively patchy, suggesting limited changes in precipitation intensity over much of the country. In the RCM-HG simulations, positive SDII anomalies continue across large parts of Türkiye, with stronger increases persisting along southern coastal areas and parts of eastern regions. Mean SDII change rises to approximately +0.22 mm/day in RCM-MPI and +1.19 mm/day in RCM-HG. These results indicate that precipitation intensity relative to the reference period remains greater in RCM-HG at GWTL 2 °C, while the RCM-MPI model reflects comparatively smaller and more regionally variable changes. Robust increases become apparent in southeastern Türkiye in RCM-MPI, although their spatial extent remains limited. In RCM-HG, a larger proportion of the interior regions also exhibit robust changes, in addition to the coastal regions. Meanwhile, inter-model sign agreement rises to approximately 74%, indicating greater directional consistency than at GWTL 1.5 °C.
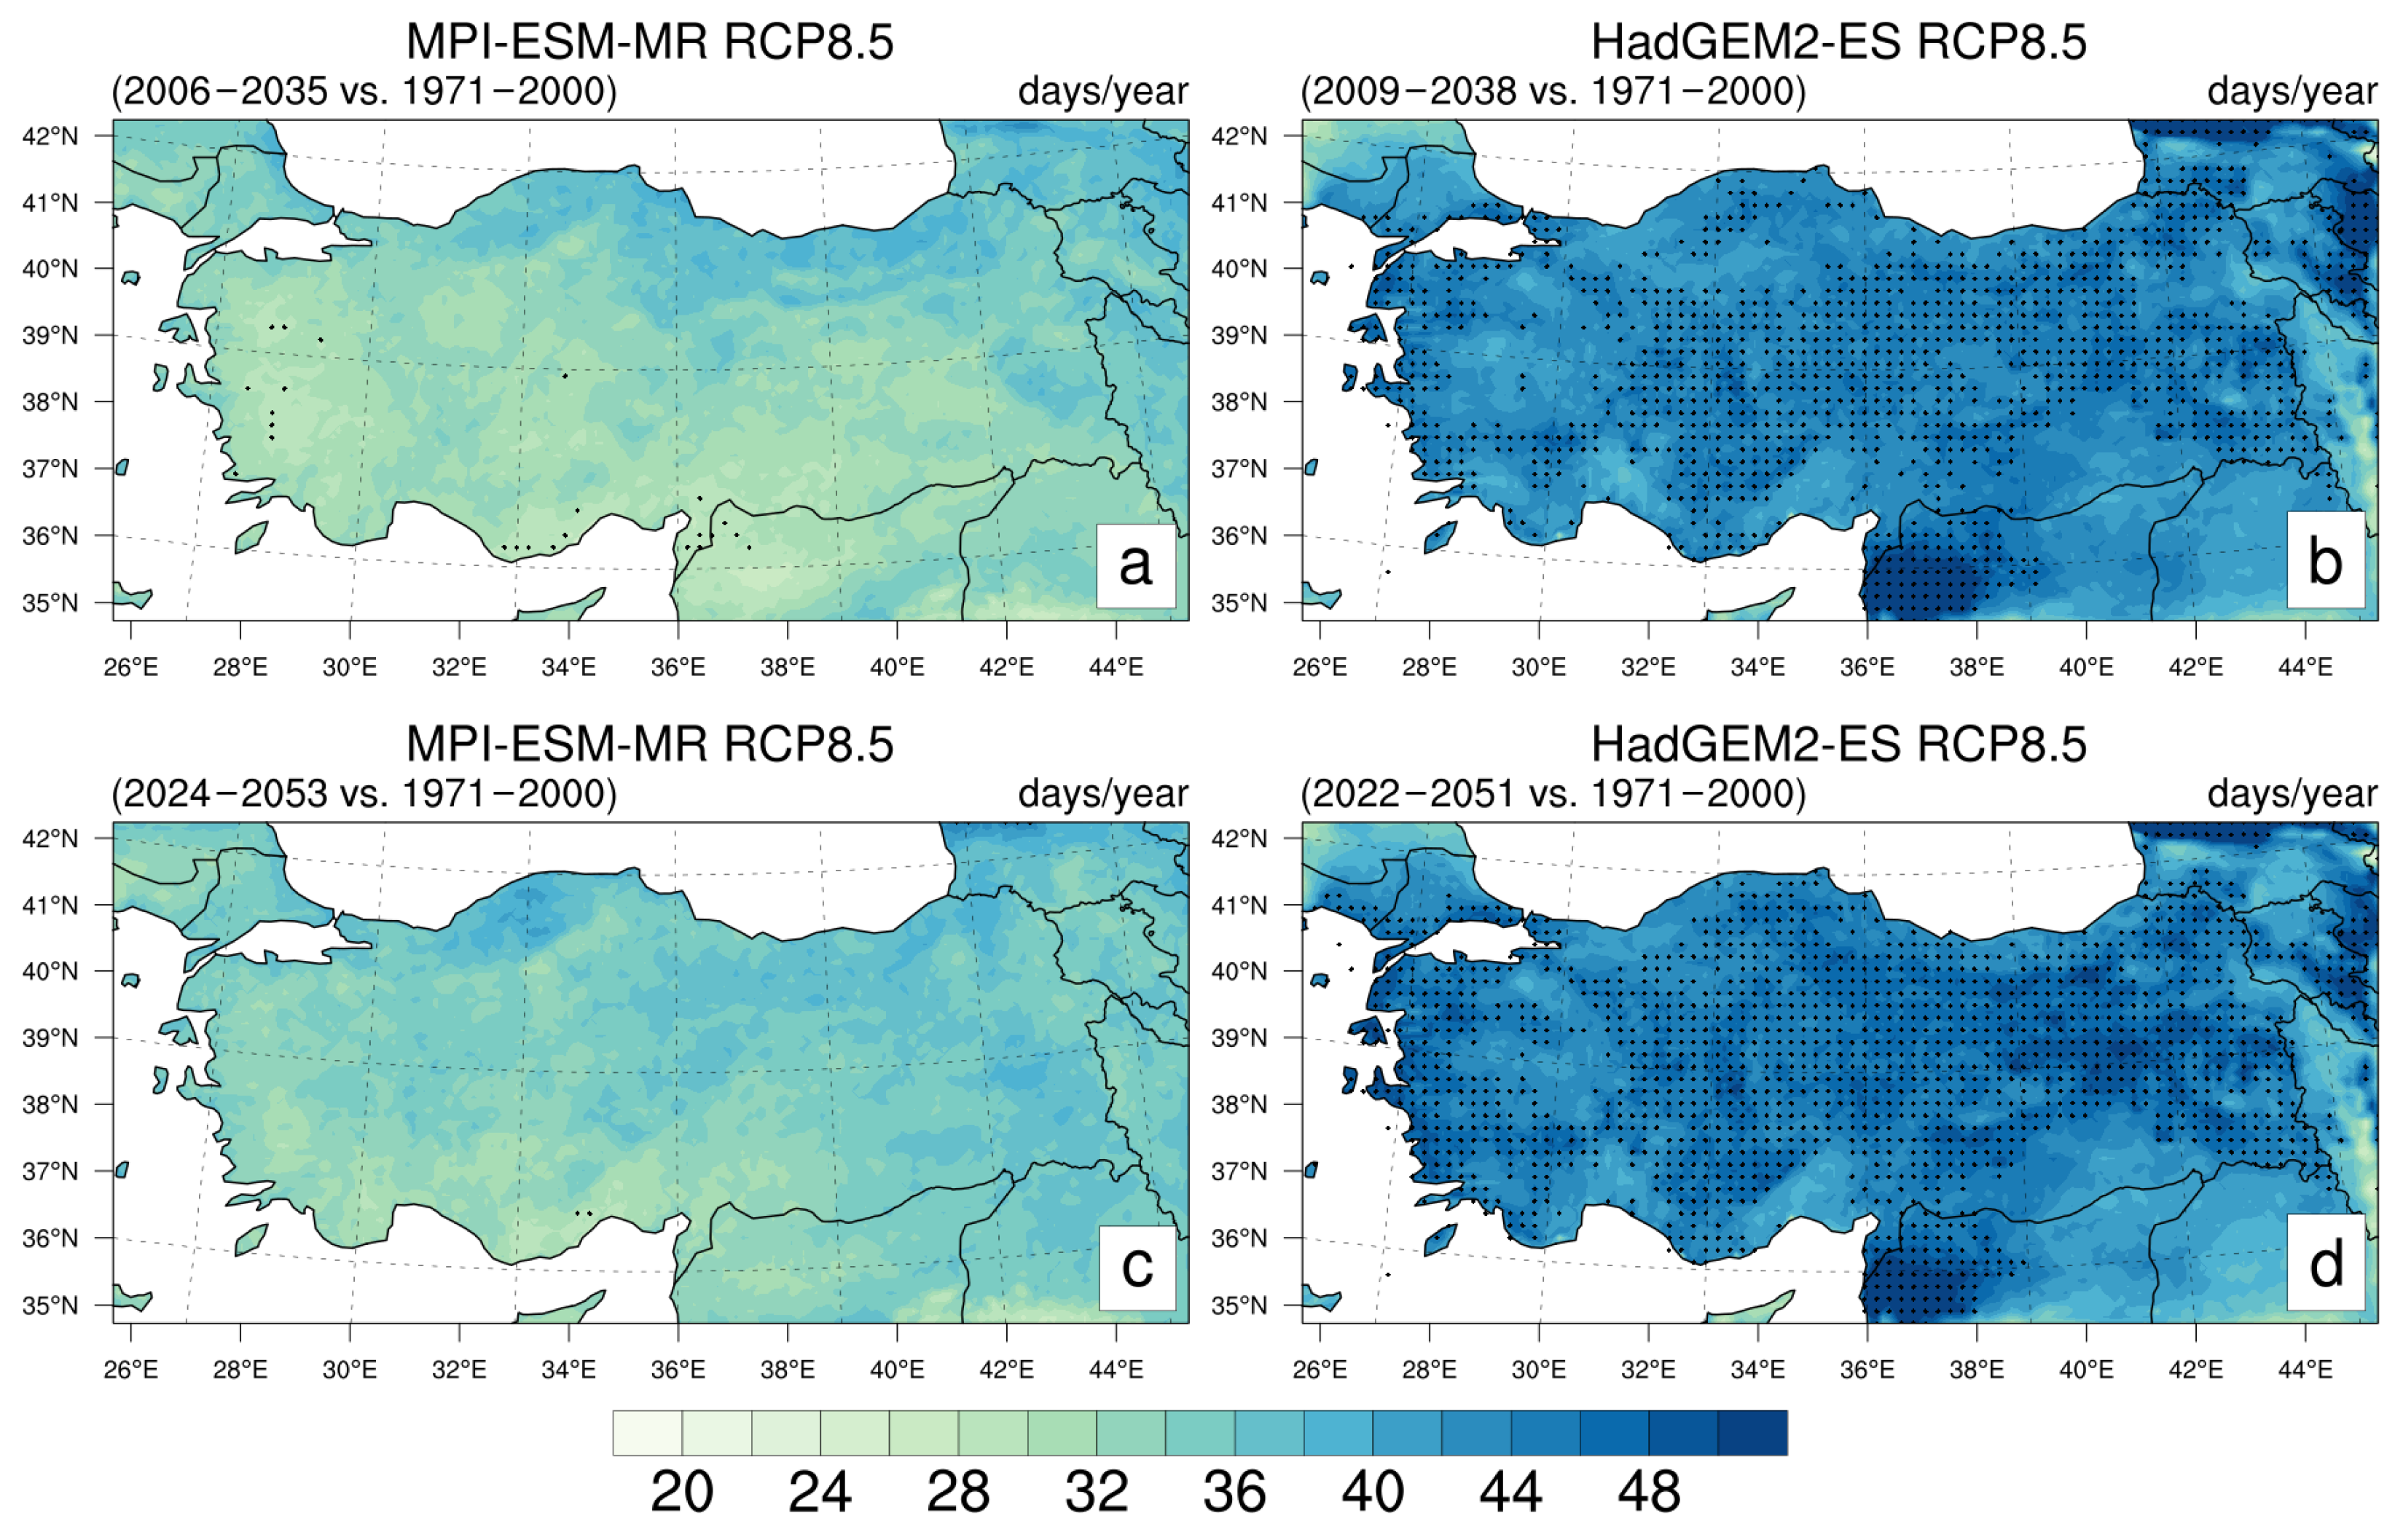
At GWTL 1.5 °C, the spatial distribution of R90P differs noticeably between the two simulations across Türkiye (Figure 8a,b). In the RCM-MPI results, relatively lower frequencies dominate much of the interior, while northern coastal regions display somewhat higher R90P values. The overall pattern remains moderate, with limited spatial variation across central Türkiye. In the RCM-HG simulations, higher R90P frequencies extend across both coastal and inland regions, indicating more frequent heavy precipitation events over large parts of the country. The mean number of R90P reaches 33.05 days/year in RCM-MPI and 43.81 days/year in RCM-HG, showing substantially higher frequencies in the RCM-HG simulations. These differences in frequency are accompanied by contrasting robustness patterns: only a small fraction of Türkiye shows robust changes in RCM-MPI, compared with more than half of the country in RCM-HG, particularly in interior regions. However, the simulations share the same sign of change relative to the reference period in only approximately 12% of the domain.
At GWTL 2 °C, both models indicate an increase in heavy precipitation days together with broader spatial coverage of higher R90P values (Figure 8c,d). In the RCM-MPI simulations, increases become more visible over northern coastal and eastern regions, although interior areas continue to show comparatively lower frequencies. The RCM-HG model maintains high R90P values across most of Türkiye, with stronger signals remaining evident over coastal zones and parts of eastern Türkiye. The mean number of R90P increases to 34.7 days/year in RCM-MPI and 45 days/year in RCM-HG. The two models show slightly different R90P responses. Based on both projections, days with extreme precipitation may become more frequent under GWTL 2 °C, with consistently higher values projected by the RCM-HG model. Despite the higher mean frequency in both simulations, robustness does not increase in both models. RCM-MPI shows a further reduction in the already limited area of robust change, while RCM-HG gains wider coverage in interior and coastal regions. Agreement in sign relative to the reference period also remains low, increasing from approximately 12% to 19%.
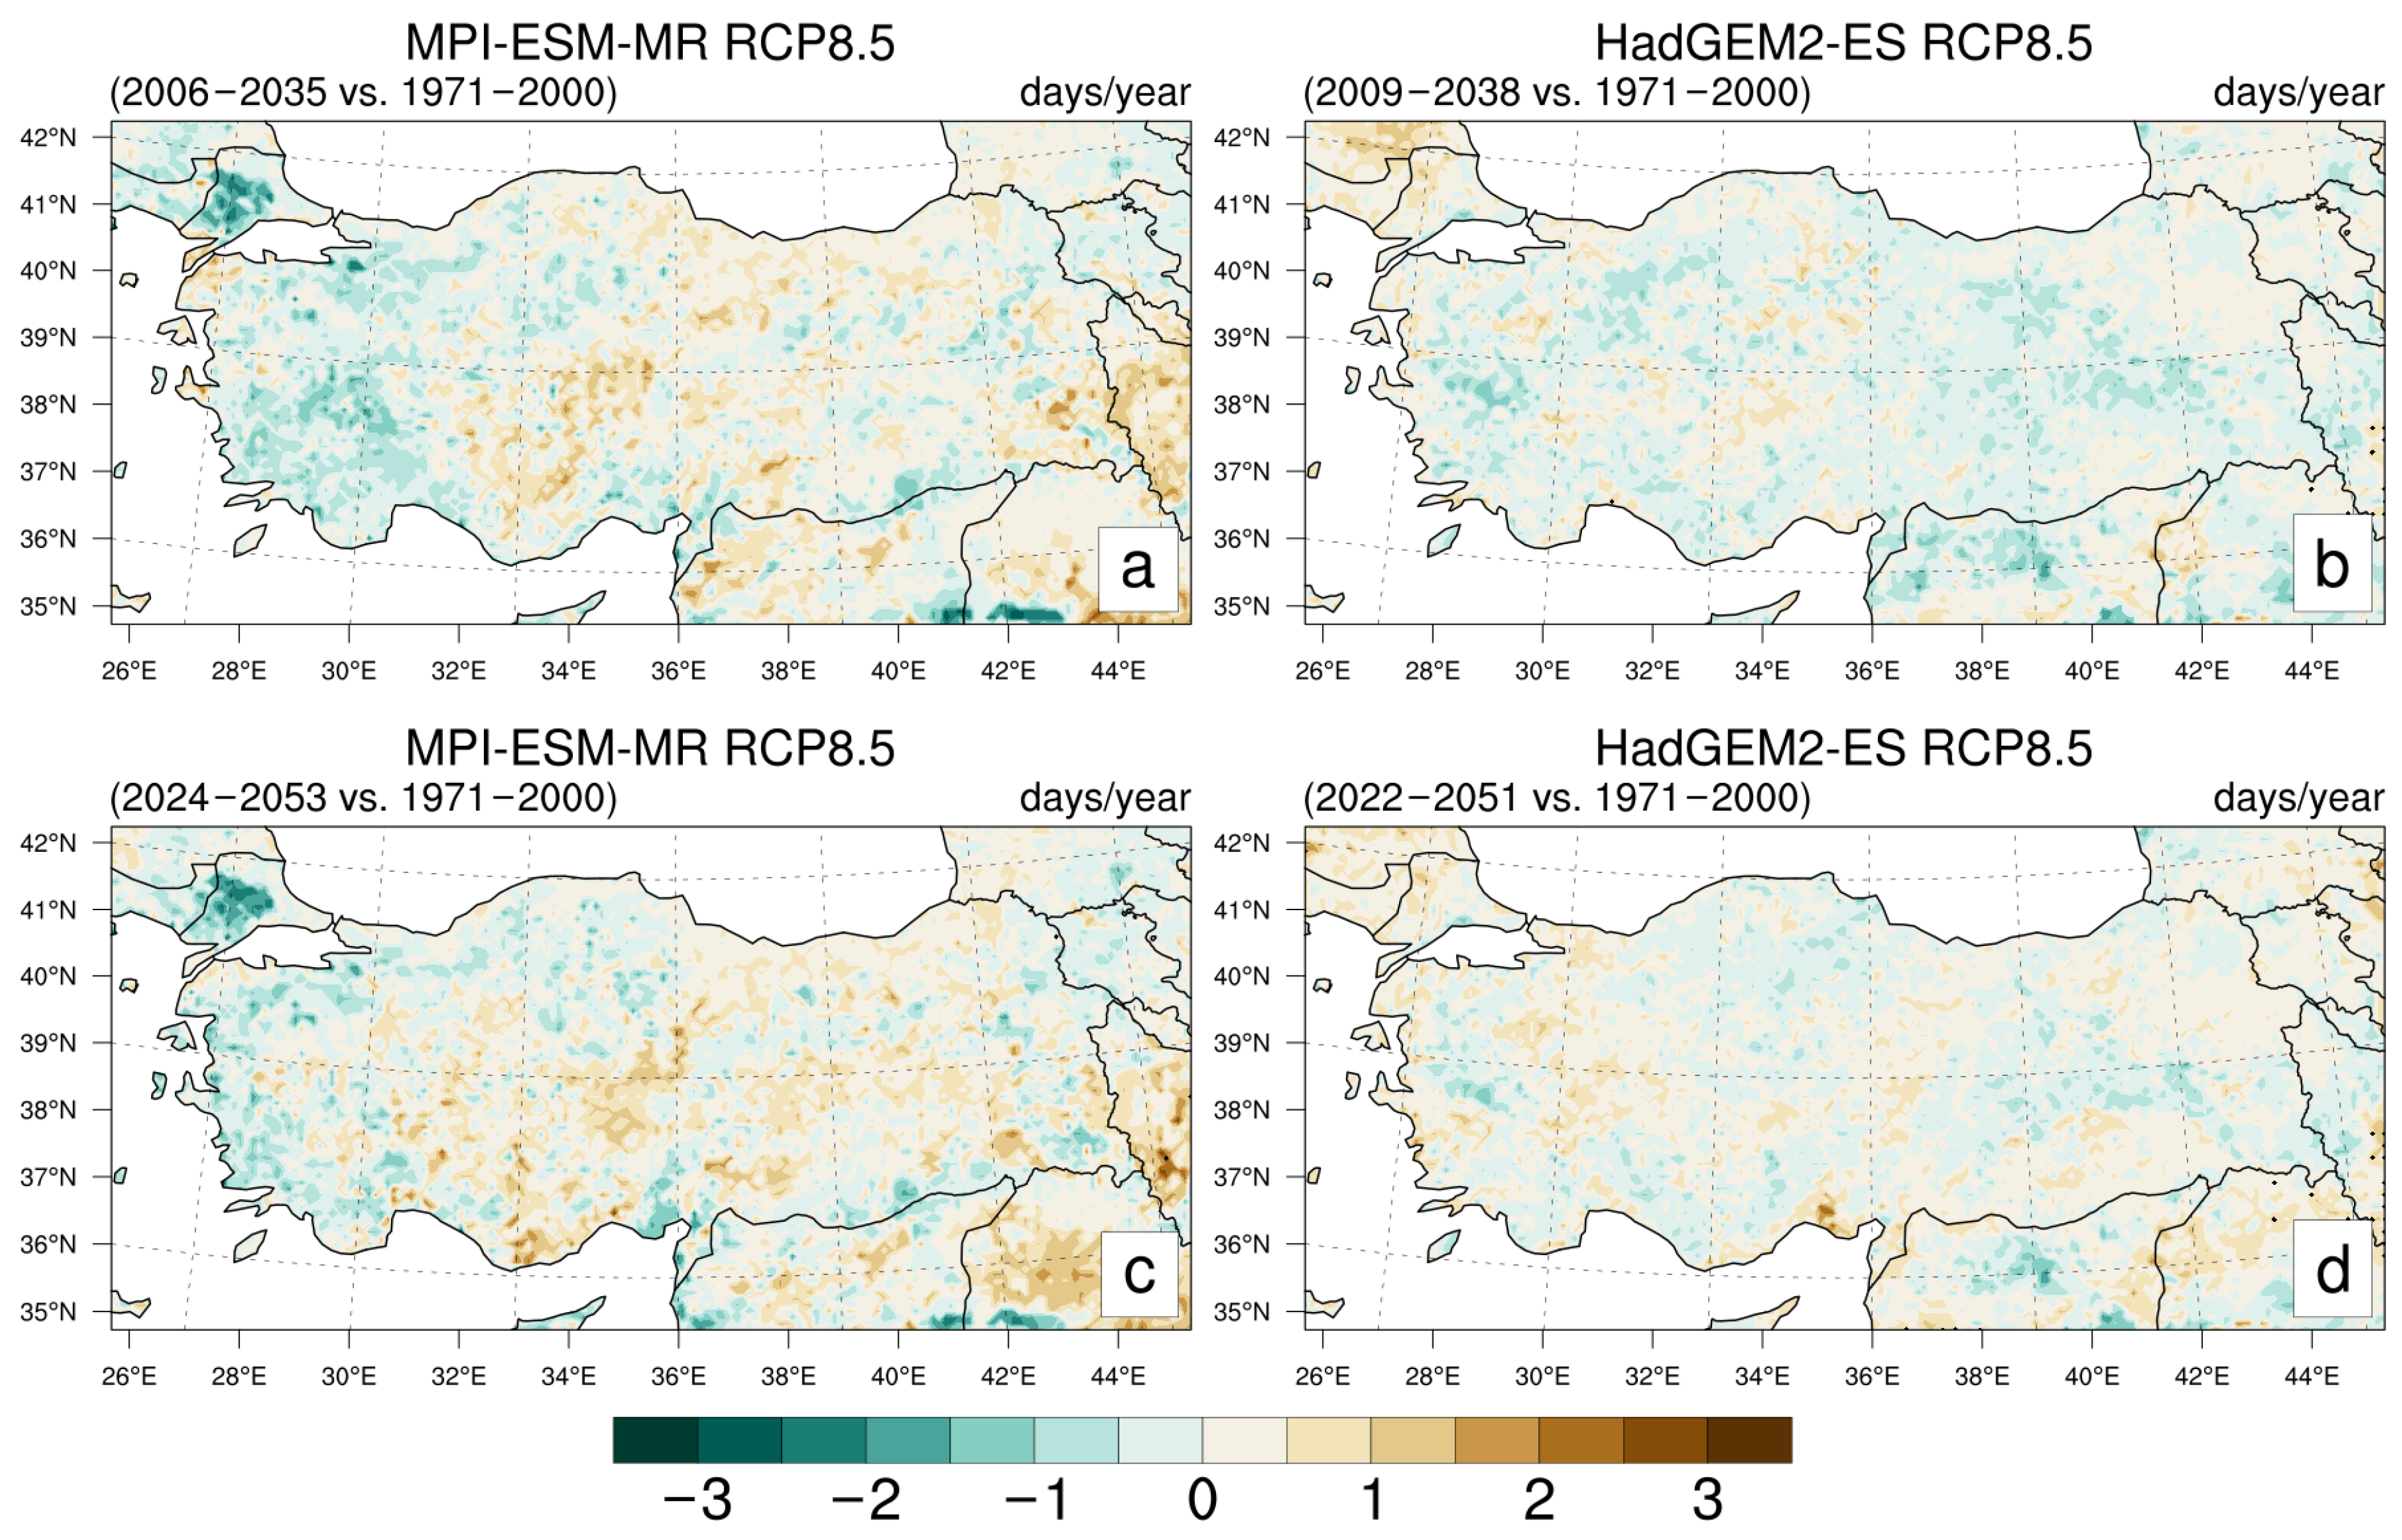
At GWTL 1.5 °C, the CDD5 patterns reveal noticeable regional contrasts between the two simulations across Türkiye (Figure 9a,b). In the RCM-MPI results, positive changes are mainly visible over central and western regions, while eastern and southeastern Türkiye generally exhibit reductions in CDD5. The spatial distribution appears mixed, with neighboring regions often showing opposite signals. In the RCM-HG simulations, decreases dominate much larger parts of the country, particularly across northern, eastern, and interior regions, whereas only limited areas in the south display slight increases. The country mean change remains close to neutral in RCM-MPI at around +0.2 periods/year, while RCM-HG produces a negative mean of approximately −0.89 periods/year, indicating fewer dry spells lasting at least five days. However, these changes are generally small relative to reference-period interannual variability: no robust response is identified in RCM-MPI, and only a very limited area meets the criterion in RCM-HG. The contrasting regional patterns yield sign agreement in approximately 34% of the domain.
At GWTL 2 °C, both models continue to display regionally variable CDD5 changes, although the spatial characteristics remain different between the simulations (Figure 9c,d). In the RCM-MPI model, decreases become more apparent over eastern Türkiye, while localized increases persist across parts of central Anatolia and the Inner Aegean region. The overall country mean signal remains weak, with a slightly negative mean of about −0.15 periods/year. In the RCM-HG simulations, negative CDD5 anomalies remain widespread across much of Türkiye, with reductions extending through northern, eastern, and interior regions. The country mean decrease approaches nearly −0.73 periods/year, indicating a greater reduction in dry-spell duration compared to RCM-MPI. Despite these regional variations, the overall magnitude of change remains relatively limited in both models. This limited magnitude is also evident in the robustness results, with no robust response in RCM-MPI and an even smaller robust area in RCM-HG than at GWTL 1.5 °C. Nevertheless, the models show greater consistency in the direction of change, with agreement increasing to approximately 55%.
At GWTL 1.5 °C, the CDD distributions in the two simulations show relatively weak changes across Türkiye, although regional variations remain visible (Figure 10a,b). In the RCM-MPI results, small positive anomalies appear over parts of central and eastern Türkiye, decreases are more evident in western and northwestern regions. The spatial structure is fragmented, with neighboring areas often showing opposite signals. In the RCM-HG simulations, negative anomalies are more common across much of the country, particularly in interior regions, whereas limited positive values remain visible in some southern locations. The country mean CDD changes remain close to neutral, with averages of approximately −0.01 days/year in RCM-MPI and −0.09 days/year in RCM-HG. Beyond these near-zero country means, the SNR assessment shows that local CDD changes remain below reference-period interannual variability throughout Türkiye in both simulations. The models nevertheless indicate the same direction of change in approximately 47% of the domain.
At GWTL 2 °C, the RCM-MPI simulations continue to indicate relatively small CDD changes across Türkiye (Figure 10c). Localized increases remain visible over parts of central Anatolia and southern and eastern regions, while western and northwestern Türkiye continue to exhibit negative anomalies. The overall country mean signal remains close to zero, reaching approximately +0.06 days/year. In contrast, the RCM-HG simulations display more extensive positive CDD anomalies at GWTL 2 °C (Figure 10d). Increases become more visible across parts of central, eastern, southern, and southeastern Türkiye, indicating longer maximum dry sequences in these regions. The mean CDD change for the country is approximately +0.07 days/year in the RCM-HG simulations. Despite the shift towards positive country means, robust coverage remains negligible in both simulations. Moreover, inter-model sign agreement decreases slightly to approximately 42%.

3.2. Differences Between GWTL 1.5 °C and 2 °C

3.2.1. Differences in Mean Temperature and Temperature Extremes

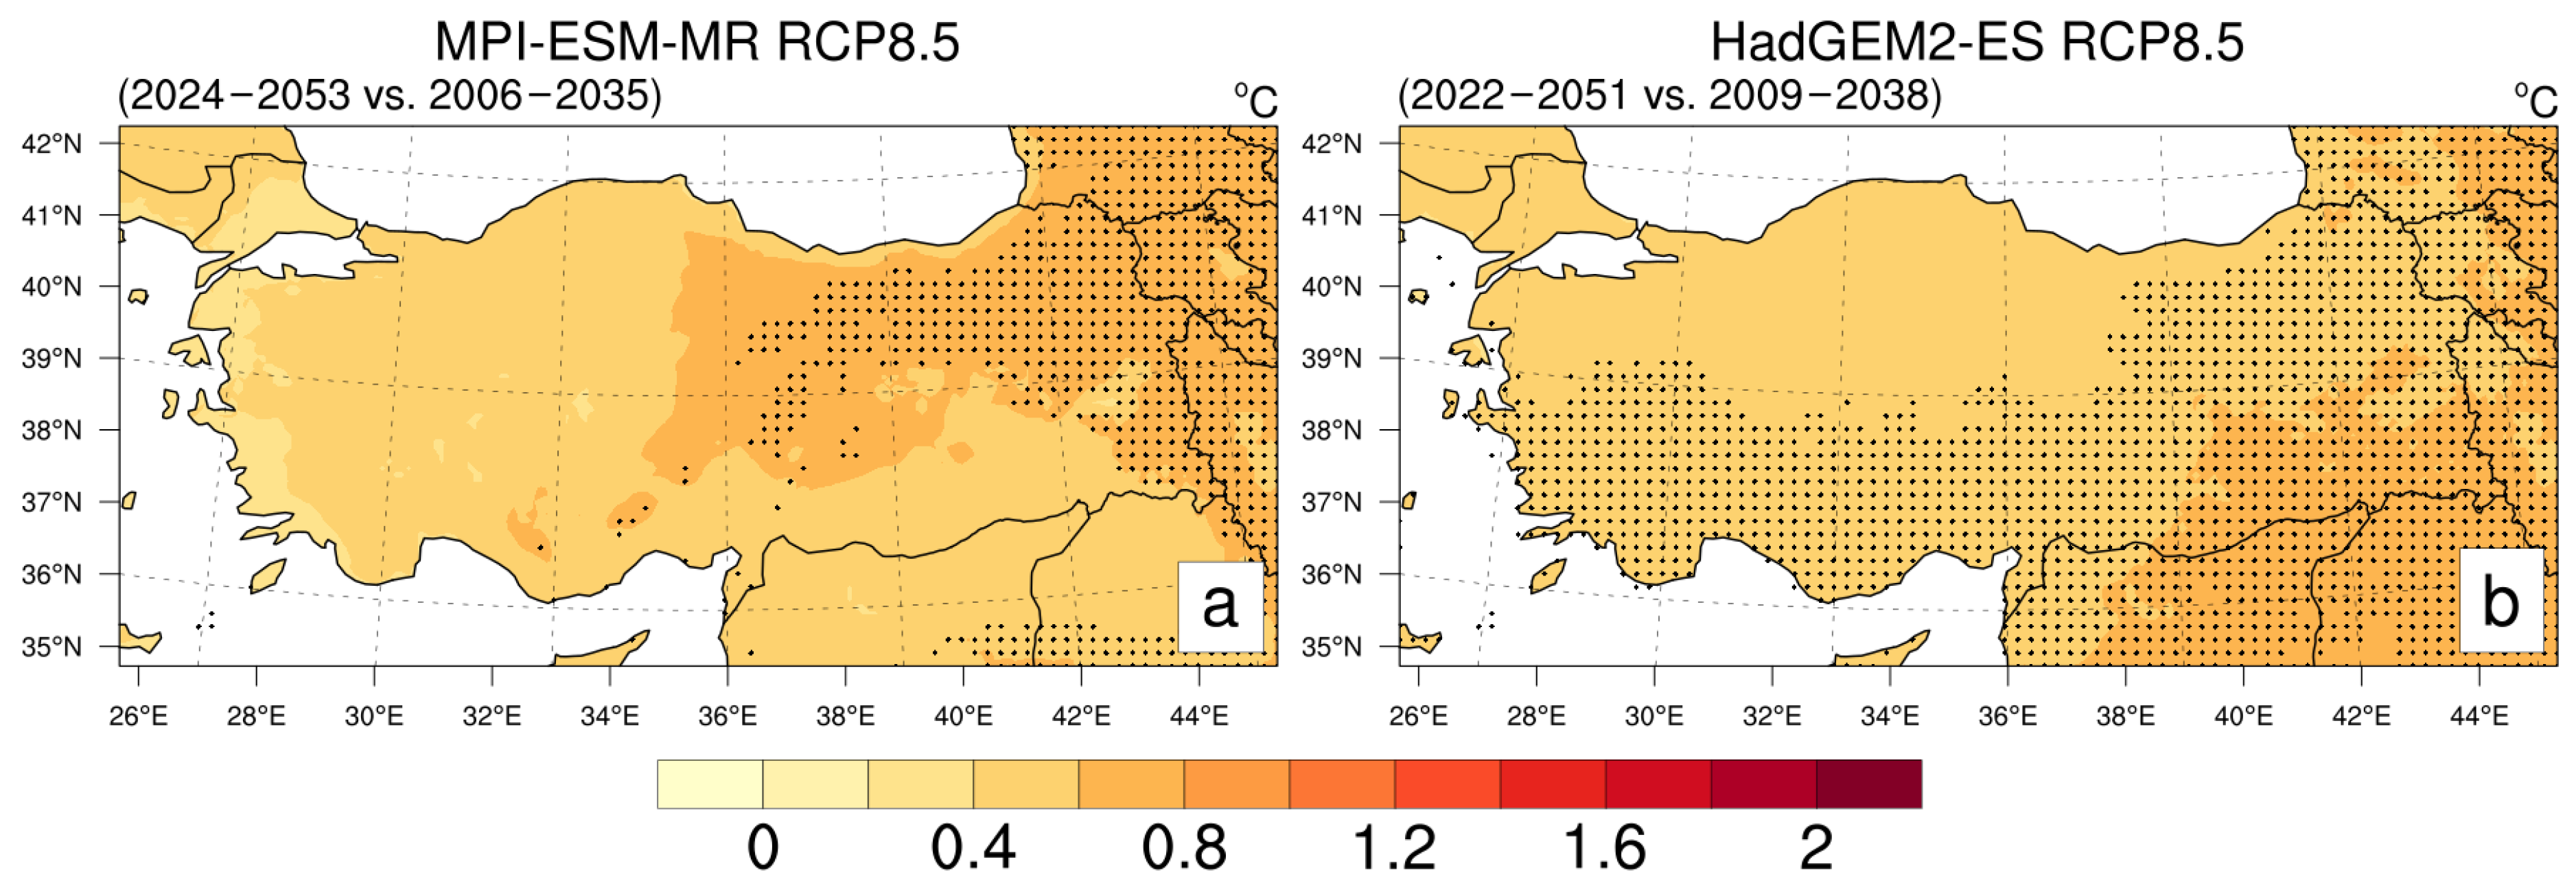
Figure 11 shows that the additional 0.5 °C warming leads to positive annual T m e a n changes throughout Türkiye in both simulations. In the RCM-MPI results, larger temperature increases are visible over eastern and parts of central Türkiye, while western coastal areas exhibit comparatively smaller changes. The spatial distribution indicates that inland and continental regions respond more strongly to the additional warming. This pattern may partly reflect the moderating influence of the surrounding seas on coastal temperatures, while inland areas are less affected by maritime conditions. Across the country, mean warming reaches approximately 0.55 °C in RCM-MPI. The robust response mainly concentrates on northeastern and eastern Türkiye, with more limited coverage in other regions.
The RCM-HG simulations also indicate warming across the entire country, with higher temperature anomalies again concentrated over eastern and southeastern Türkiye, while coastal regions remain relatively lower. The corresponding increase in RCM-HG is approximately 0.52 °C. The additional 0.5 °C warming affects the magnitude of annual temperature change more than its spatial distribution in both simulations. In RCM-HG, robust changes extend over a broader area, particularly in the southern, southwestern, central, and eastern parts of the country. RCM-HG also exhibits complete sign agreement with RCM-MPI for T m e a n changes.
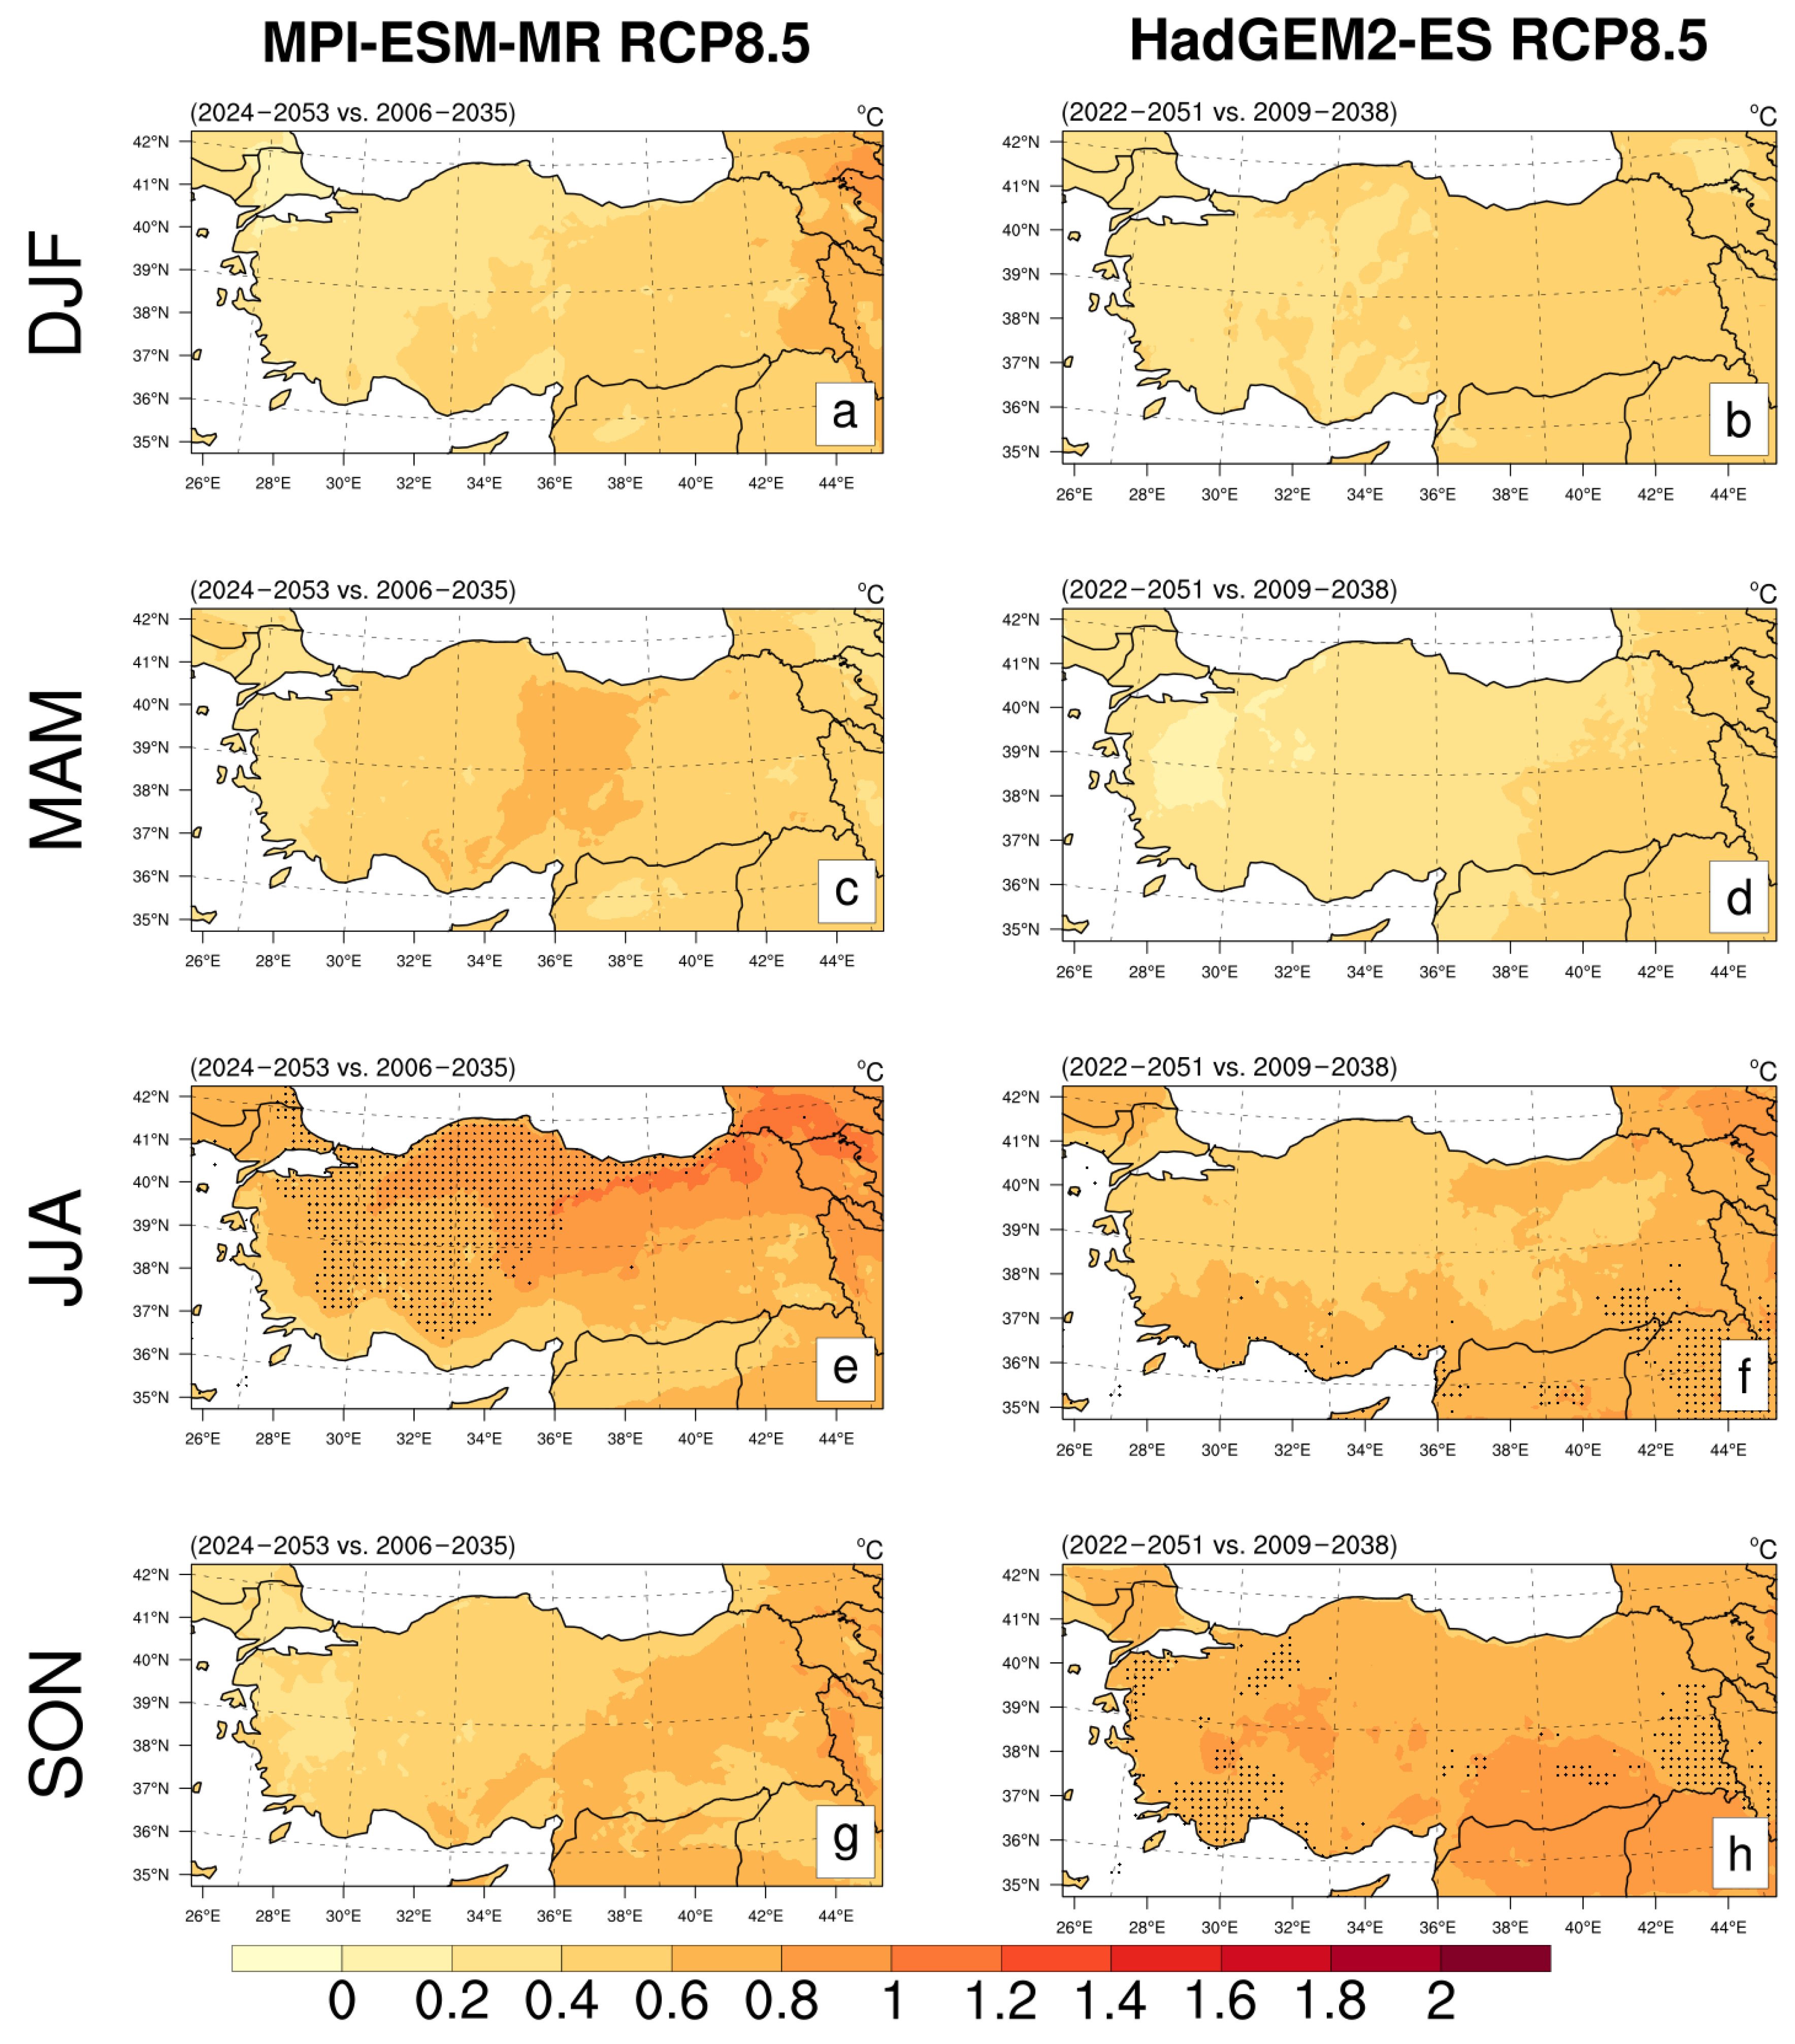
Figure 12 indicates that the additional 0.5 °C warming leads to positive mean-temperature anomalies across all seasons and throughout Türkiye in both simulations. In the RCM-MPI results, winter and spring warming generally remains between 0.4 °C and 0.8 °C, while stronger increases emerge during summer, particularly across central, eastern, and southeastern Türkiye, where values locally approach or exceed 1 °C. Autumn also shows positive anomalies across the country, with slightly higher warming toward eastern regions. The spatial structure remains relatively gradual, with warming increasing from western coastal zones toward inland and continental areas.
The RCM-HG simulations display a comparable seasonal pattern, although with some differences in regional distribution. Winter warming remains widespread across Türkiye, mostly ranging between 0.4 °C and 0.8 °C, whereas spring shows comparatively weaker anomalies than in the RCM-MPI simulations. During summer, larger temperature increases become more visible across southern, eastern, southeastern, and northeastern Türkiye, with several regions approaching or exceeding 1 °C. Autumn exhibits the highest warming values in the RCM-HG results, particularly over eastern and southeastern regions where anomalies frequently exceed 0.8 °C. Compared to RCM-MPI, the east–west contrast appears more noticeable in several seasons.
Seasonal mean warming increases reach approximately 0.41 °C in winter, 0.51 °C in spring, 0.74 °C in summer, and 0.54 °C in autumn in the RCM-MPI projections. Corresponding increases in RCM-HG are approximately 0.42 °C, 0.31 °C, 0.6 °C, and 0.75 °C, respectively. Accordingly, the seasonal distributions indicate that the additional 0.5 °C warming does not affect all periods of the year equally. Summer warming becomes more dominant in the RCM-MPI simulations, whereas autumn contributes more strongly in RCM-HG. Despite these seasonal differences, both models produce relatively similar annual mean increases across Türkiye. A clear model-dependent spatial contrast is also evident in the robustness of seasonal warming. However, the robustness of this warming varies by season and model. Neither simulation shows robust changes in winter or spring. In summer, robust warming is concentrated over western, central, and northern Türkiye in RCM-MPI, whereas it is limited mainly to parts of southeastern Türkiye in RCM-HG. In autumn, only RCM-HG shows robust changes, distributed over parts of western, southwestern, and eastern Türkiye. Despite these differences, both models indicate warming throughout the domain in every season, yielding complete inter-model agreement.
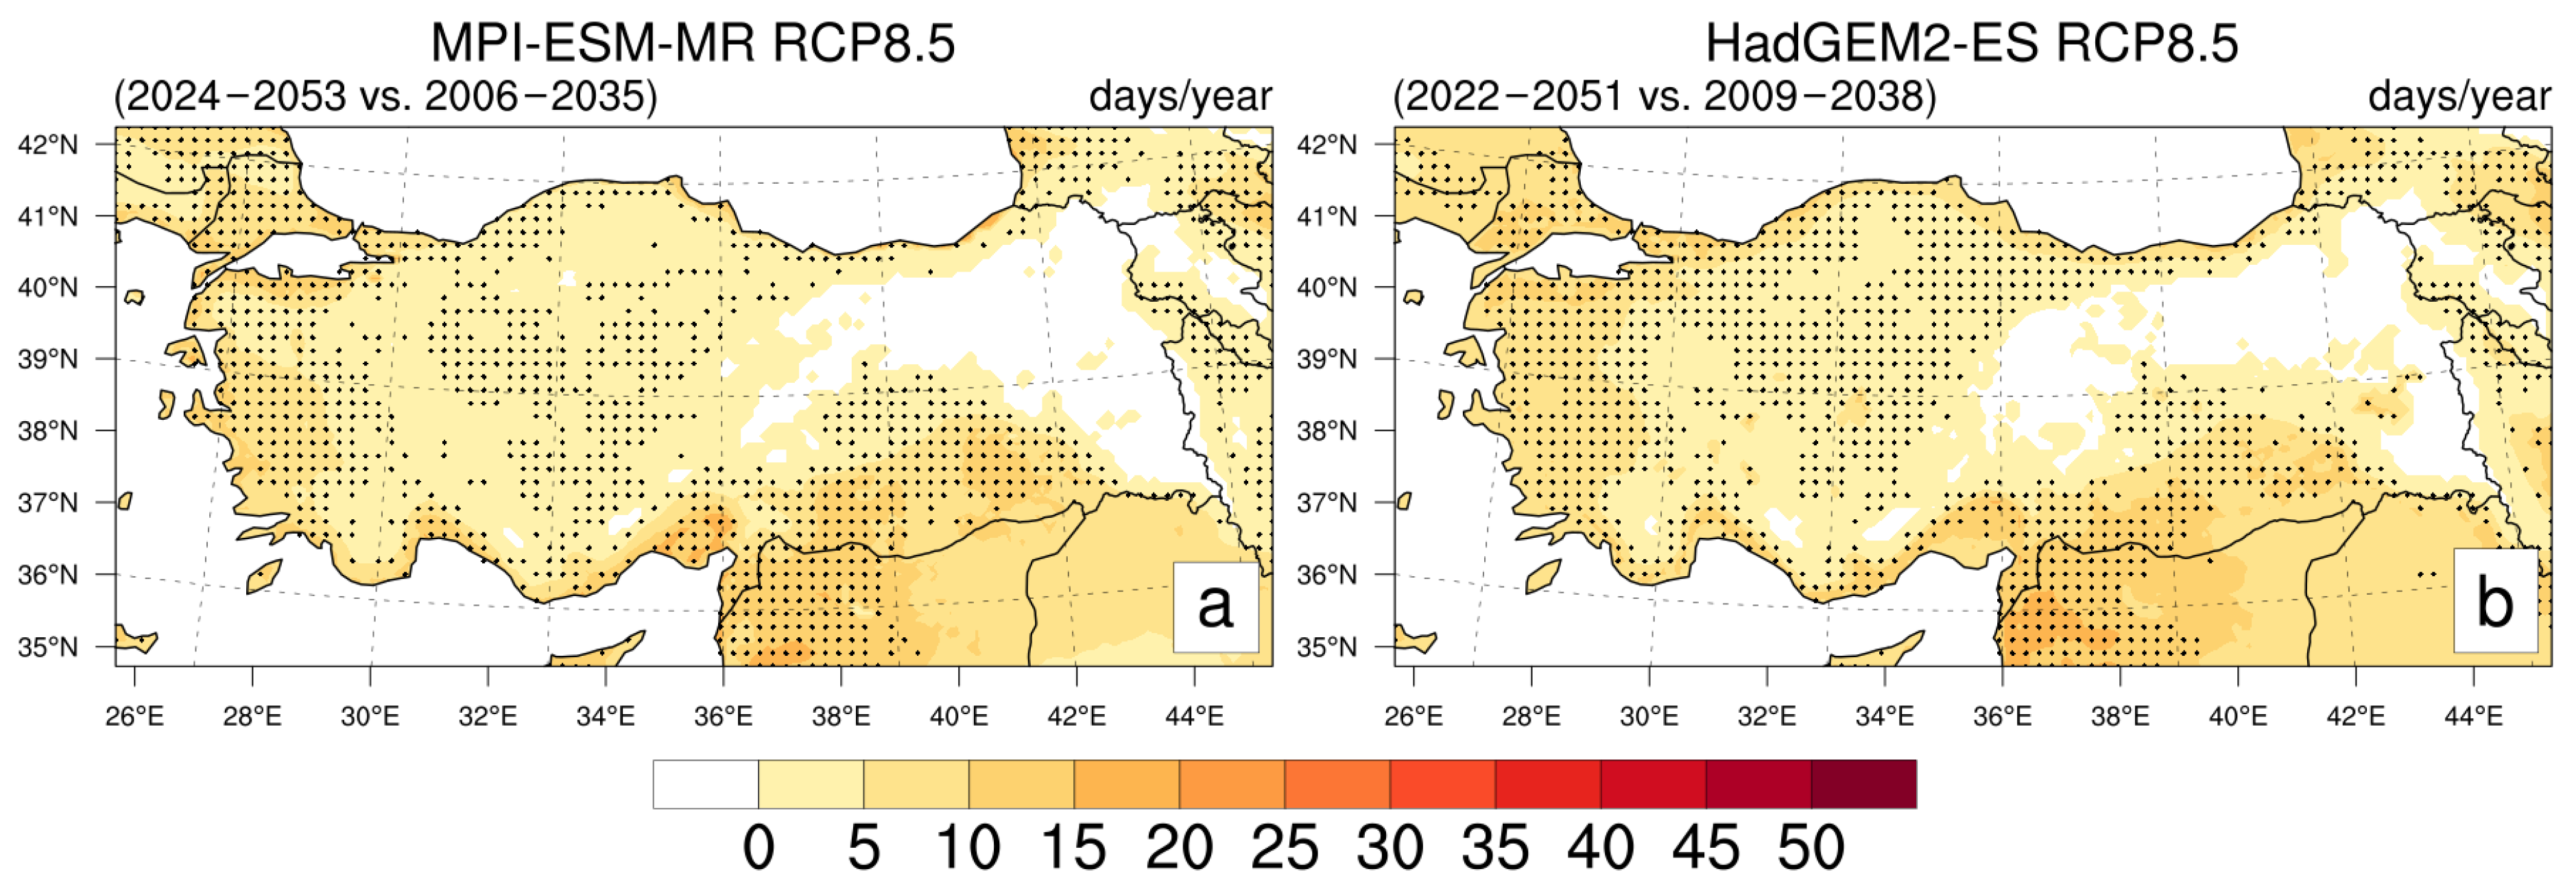
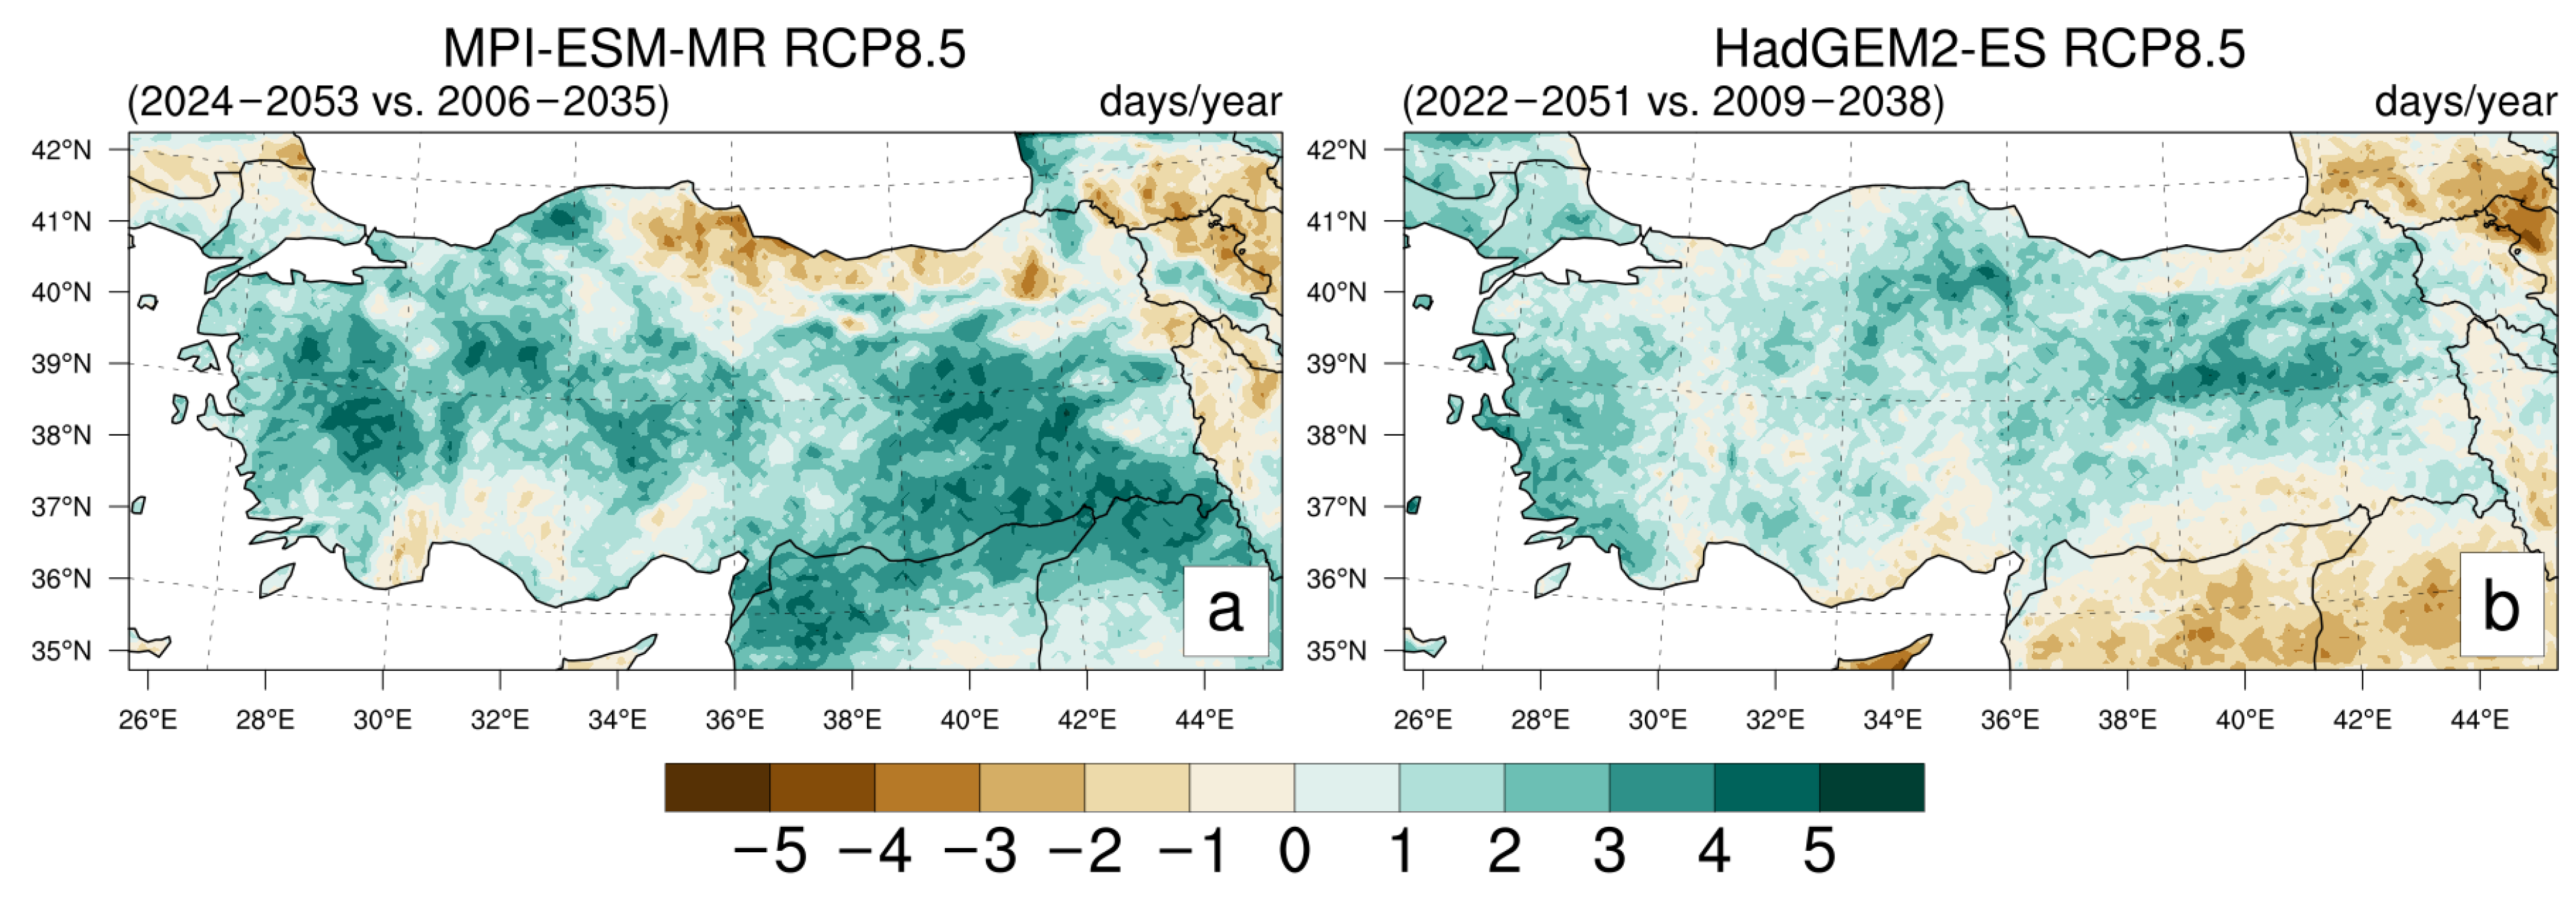
Figure 13 shows that the additional 0.5 ° warming results in higher numbers of TN across Türkiye in both simulations. In the RCM-MPI results, larger increases are visible along the Mediterranean coast, southeastern Türkiye, and several low-elevation regions, while inland and mountainous areas display comparatively smaller changes. The spatial distribution follows the existing warm-climate regions of the country, with the strongest anomalies occurring where nighttime temperatures are already relatively high. As these regions are closer to the 20 °C nighttime threshold, additional warming can more readily increase the number of threshold exceedances. The country mean increase reaches approximately +2.9 days/year.
The RCM-HG simulations also indicate increases over broad areas in TN, although the spatial coverage is more extensive than in RCM-MPI. Coastal regions, southern Türkiye, and low-altitude inland areas exhibit higher positive anomalies, while central Anatolia also experiences localized increases. Compared to the RCM-MPI simulations, larger parts of the country are affected by stronger nighttime warming signals. The country mean increase reaches approximately +3.71 days/year, which indicates a greater rise in TN frequency under the additional warming.
Regionally, southern and southeastern Türkiye remain the areas most affected by the increase in TN, reflecting the sensitivity of already warm regions to further nighttime warming. The spatial patterns also suggest that low-elevation and coastal environments are more responsive to the additional 0.5 °C warming than higher-altitude interior regions. The robustness analysis indicates that TN increases are robust over approximately half of the domain in both simulations. The spatial patterns share common features in western, northern, and southeastern regions, although the robust response covers a slightly larger area in RCM-HG. However, positive changes also occur in areas where the robustness criterion is not met. The two simulations show the same direction of TN change in approximately 59% of the domain.
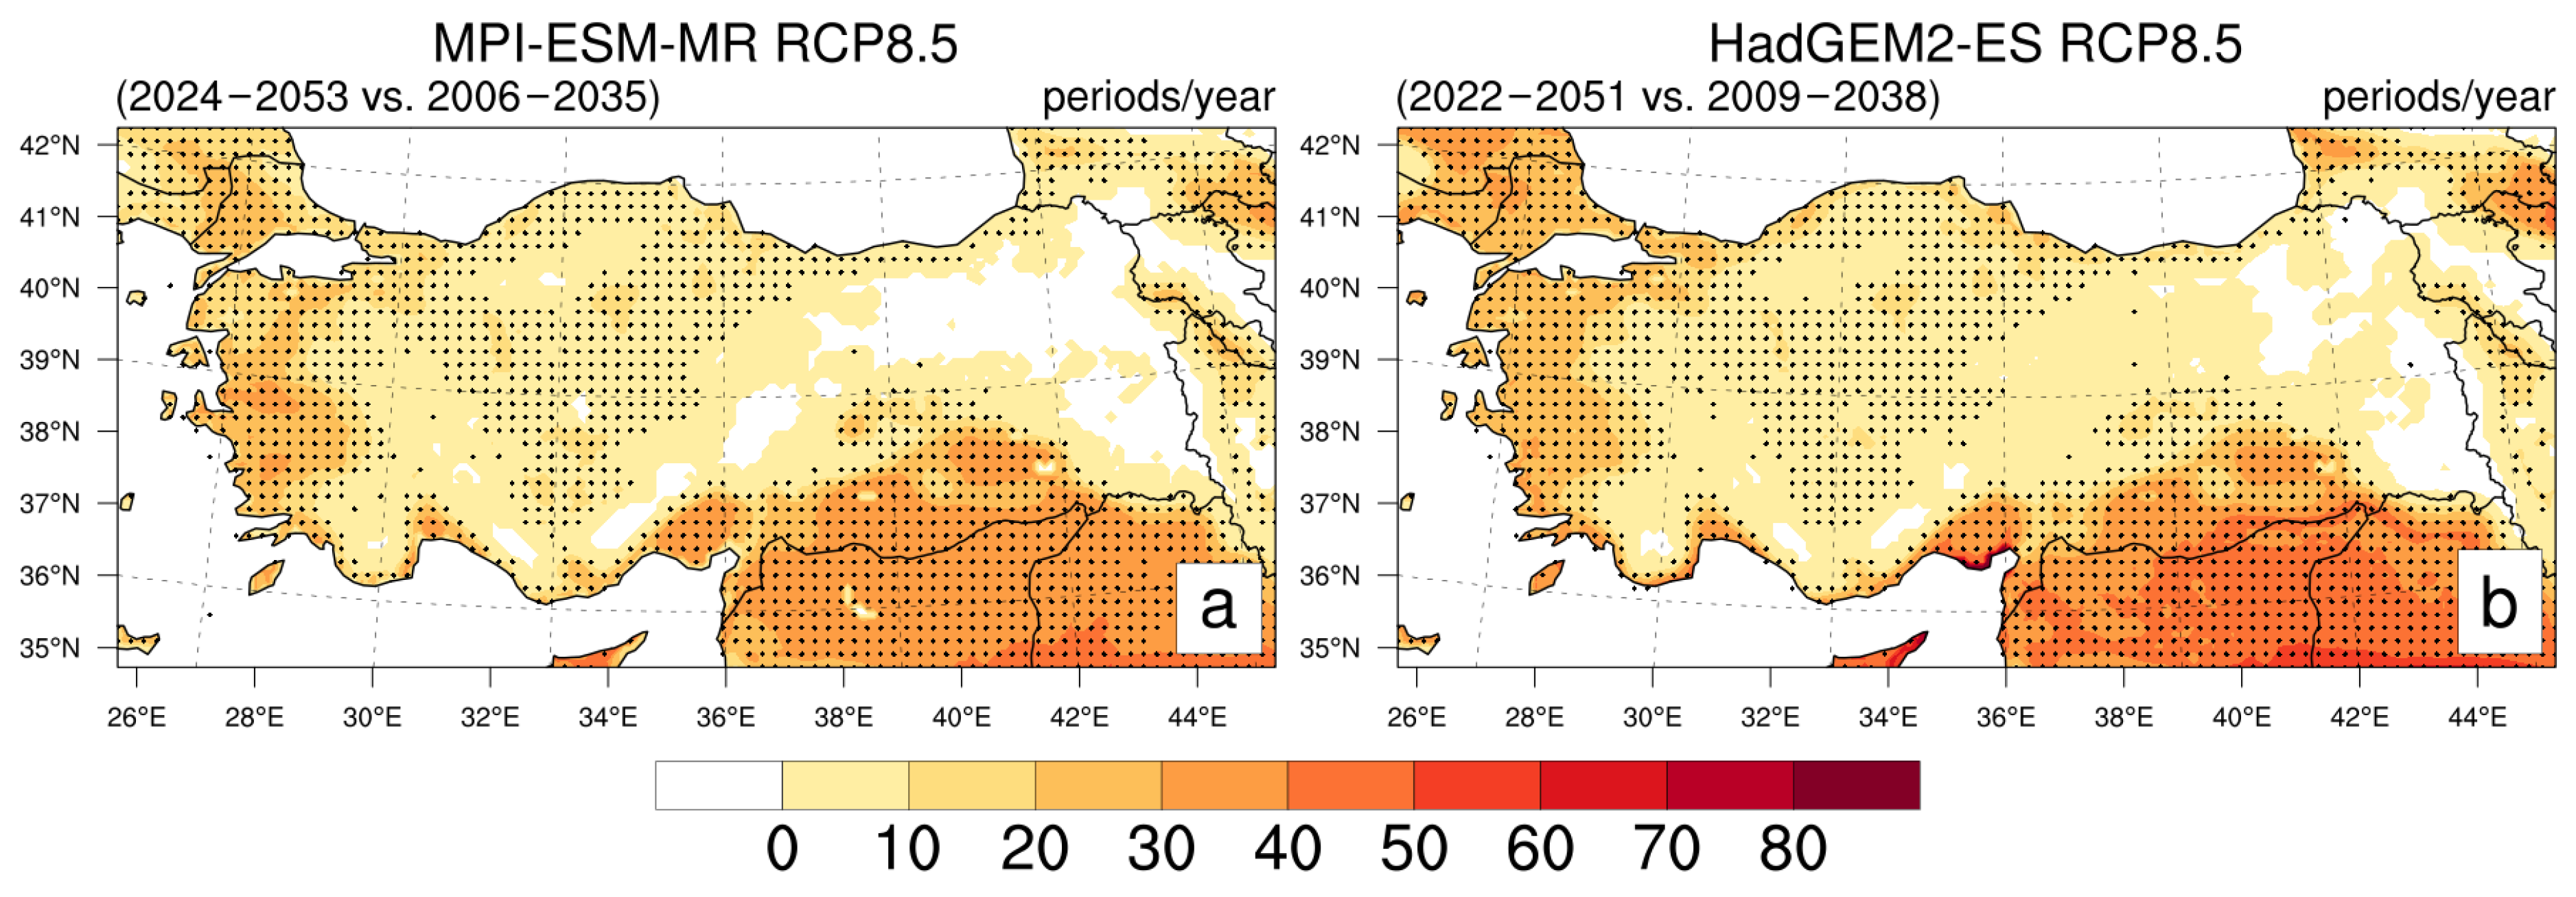
Figure 14 indicates that the additional 0.5 °C warming produces a substantial increase in DI frequency Türkiye in both simulations. In the RCM-MPI results, larger increases are visible over southern, southeastern, and low-elevation regions, while northern coastal areas display comparatively smaller changes. Central Anatolia also exhibits localized positive anomalies, although the magnitude remains lower than in the Mediterranean and southeastern regions. The country mean increase reaches approximately 8.8 periods/year, indicating a considerable rise in thermally stressful conditions under stronger warming.
The RCM-HG simulations display a similar spatial structure but with slightly higher values across much of the country. Western, southern, and southeastern parts of Türkiye again show the largest increases, while inland regions also experience widespread positive anomalies. Compared to RCM-MPI, the spatial coverage of stronger DI changes extends over broader areas, particularly across the Mediterranean coastal regions and southeastern parts of Türkiye. The country mean increase reaches approximately 9.6 periods/year, reflecting a slightly greater rise in discomfort conditions.
Regionally, the strongest increases occur in already warm and dry regions, particularly in western, southern, and southeastern Türkiye, suggesting that these areas are more sensitive to additional warming in terms of human thermal stress. DI exhibits a much clearer and more spatially consistent response to the extra 0.5 °C warming, indicating a close relationship between temperature rise and the frequency of heat-stress conditions. This widespread increase is supported by robust responses over more than half of Türkiye in both simulations, including extensive areas in western, northern, and southeastern regions. Robust coverage is slightly greater in RCM-HG, although some areas with positive changes remain below the robustness threshold in both models. Agreement in the direction of change is more limited, with the simulations showing the same sign in approximately 59% of the domain.

3.2.2. Differences in Total Precipitation and Precipitation Extremes

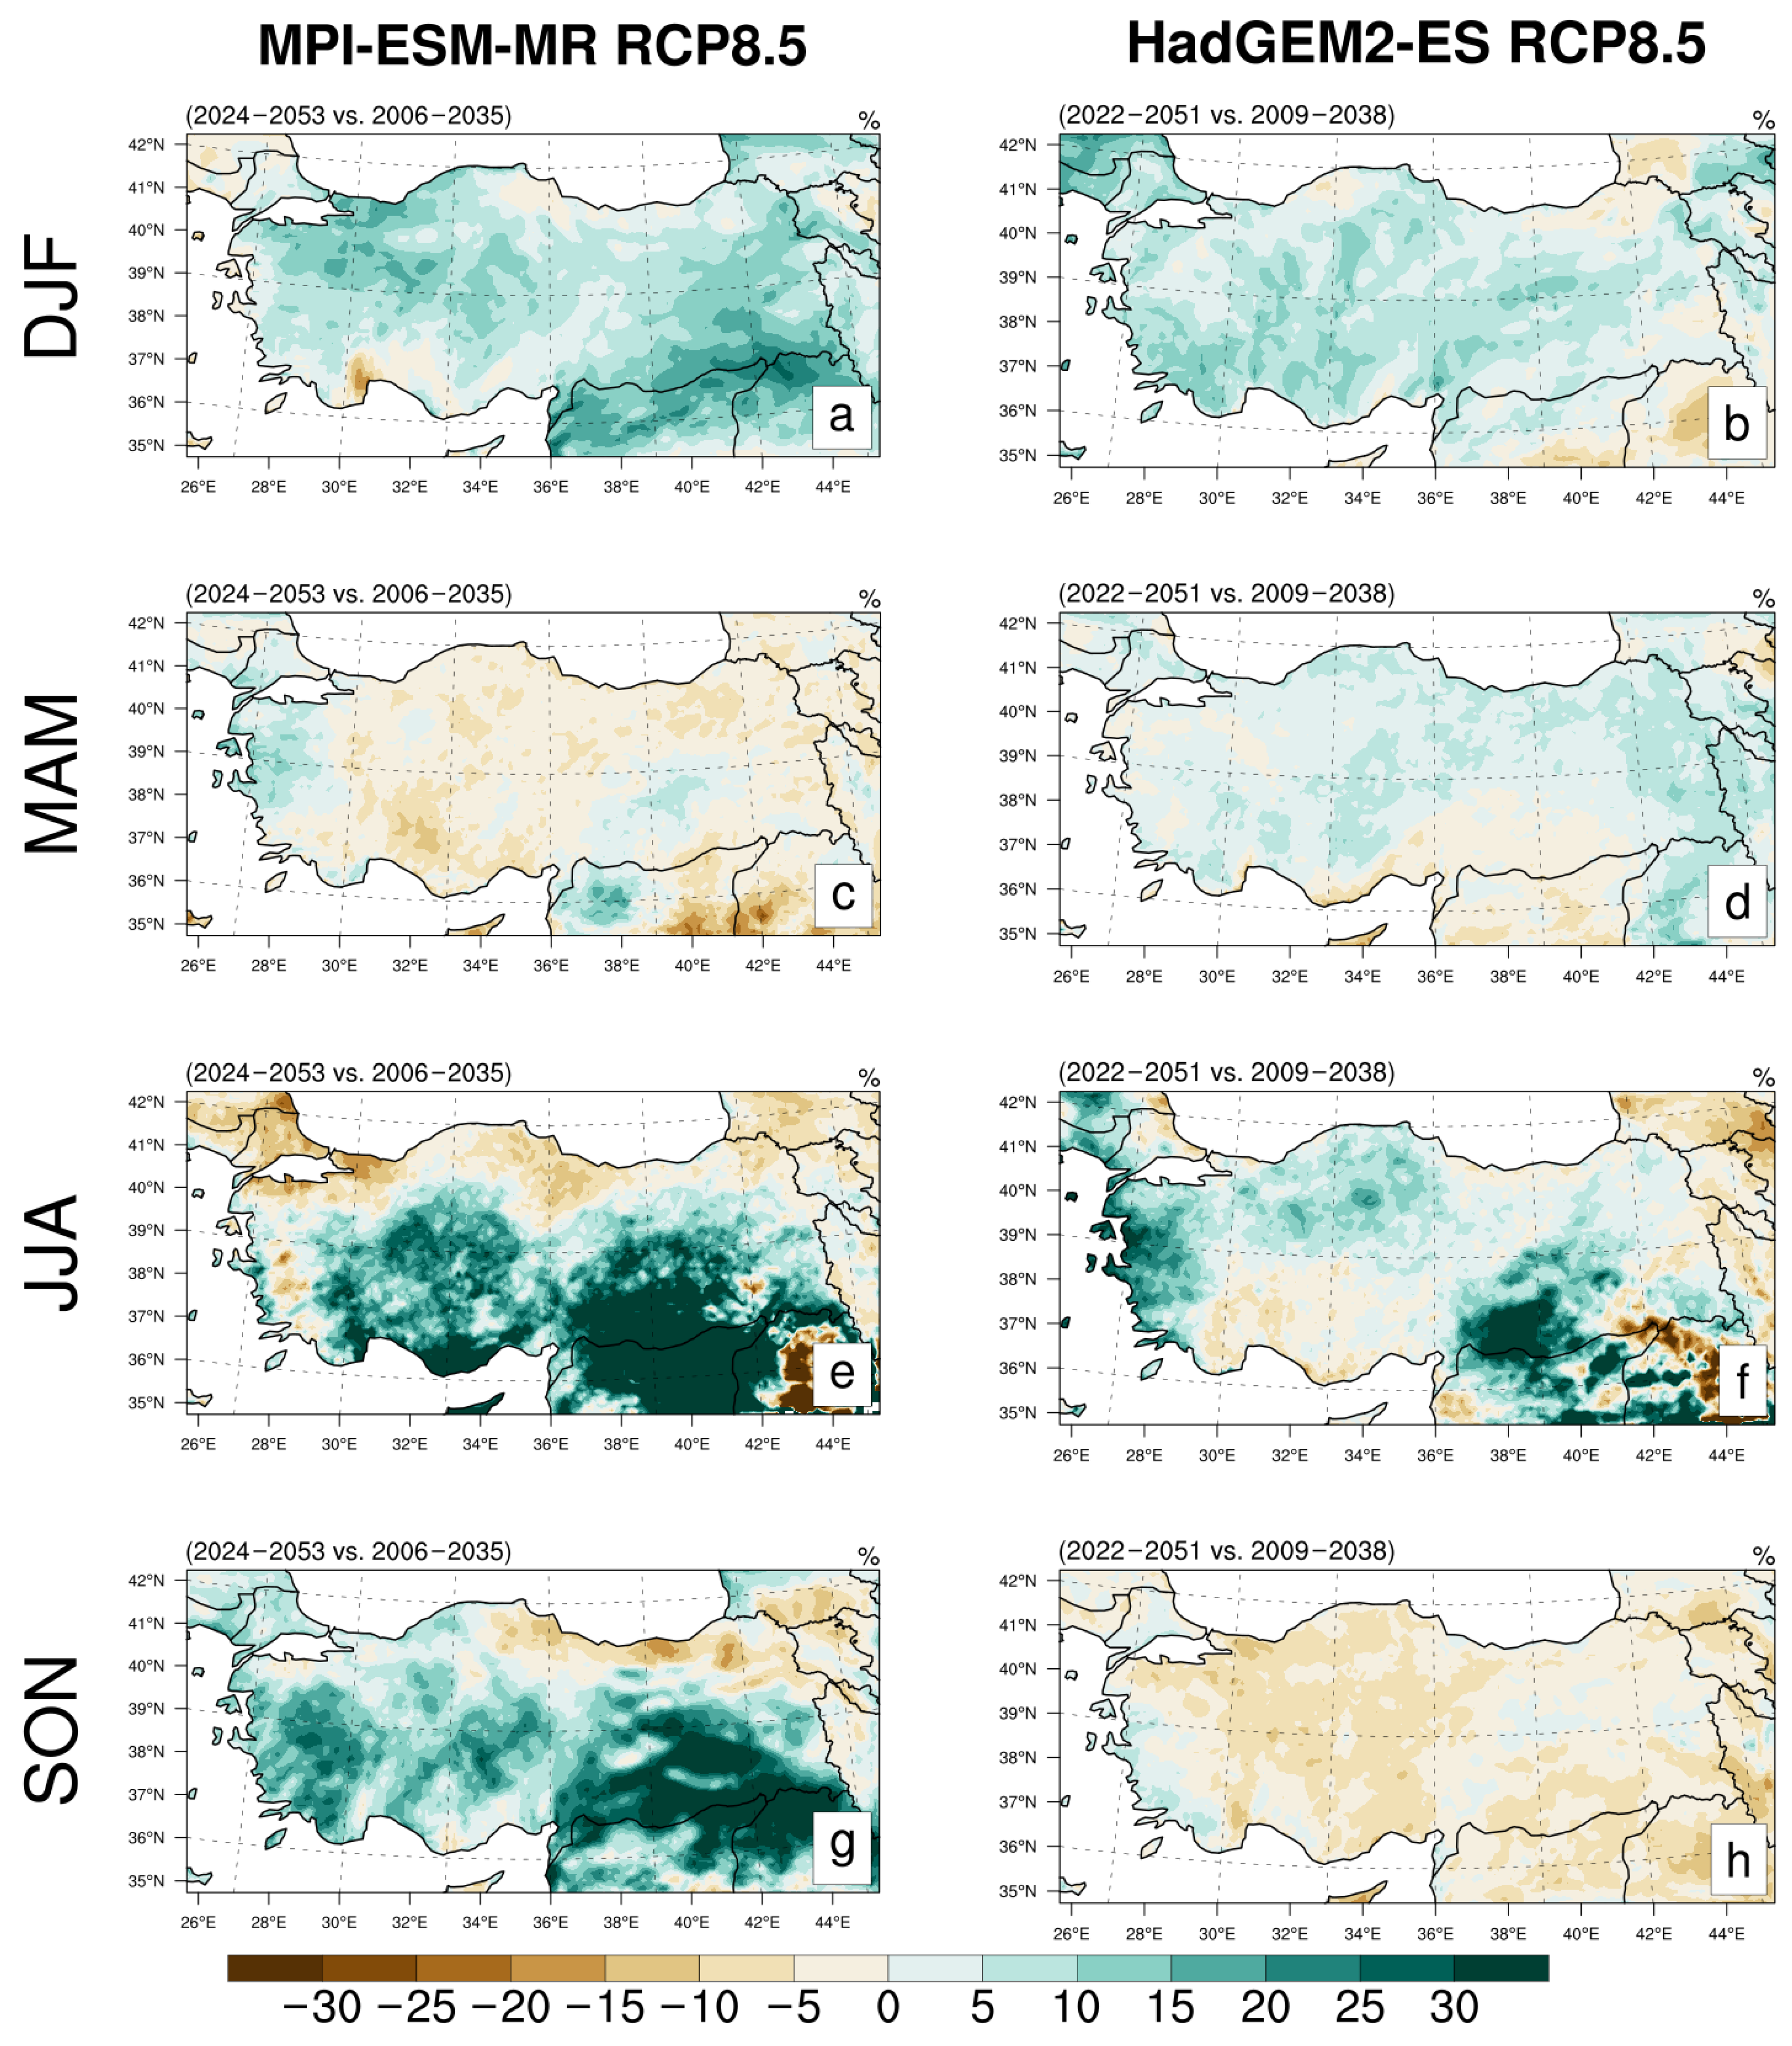
Figure 15 illustrates that the seasonal TP response to the additional 0.5 °C warming differs substantially between the two simulations and across seasons. In the RCM-MPI results, winter displays positive precipitation anomalies over much of Türkiye, with stronger increases appearing in eastern and southeastern regions and south and southeastern parts of Marmara Region. Spring is characterized by weaker and more spatially mixed signals, including localized decreases across western and central areas. The largest positive anomalies occur during summer, particularly across southern and southeastern Türkiye, as well as in the Inner Aegean region, where these increases become more widespread. Autumn also shows positive changes over broad areas, especially in eastern and southeastern regions. Seasonal means indicate increases of approximately +7.56% in winter, +14.96% in summer, and +11.47% in autumn, while spring shows a slight decrease of around −1.6%.
The RCM-HG simulations present a different seasonal structure. Winter precipitation increases are widespread and more extensive than in RCM-MPI, with positive anomalies covering large parts of Türkiye and a seasonal mean reaching approximately +5.67%. Spring exhibits generally weak positive changes, although the magnitude remains limited compared to winter. During summer, increases remain visible over western, eastern, and southeastern Türkiye, but the spatial coverage is less extensive than in the RCM-MPI results. In autumn, negative anomalies become more common across central and western Türkiye, indicating reduced precipitation over these regions. The seasonal means correspond to approximately +2.77% in spring, +5.92% in summer, and −3.63% in autumn.
The seasonal contrasts indicate that the additional 0.5 °C warming primarily modifies the timing and regional distribution of precipitation rather than producing a single nationwide response. Winter and summer emerge as the seasons with the clearest positive precipitation signals, whereas autumn displays more variable behavior between the two models, particularly in the RCM-HG simulations. The SNR analysis shows that robust seasonal precipitation changes are absent in both simulations. Despite locally large percentage changes, the projected differences generally remain within the range of reference-period interannual variability. Inter-model sign agreement for TP varies markedly by season, reaching approximately 84% in winter and 59% in summer, but falling to about 31% in spring and 30% in autumn. The comparatively high agreement in winter may arise from the dominant role of large-scale synoptic circulation and frontal systems, allowing precipitation changes to develop more coherently at the regional scale than during seasons in which local and convective processes become more influential.
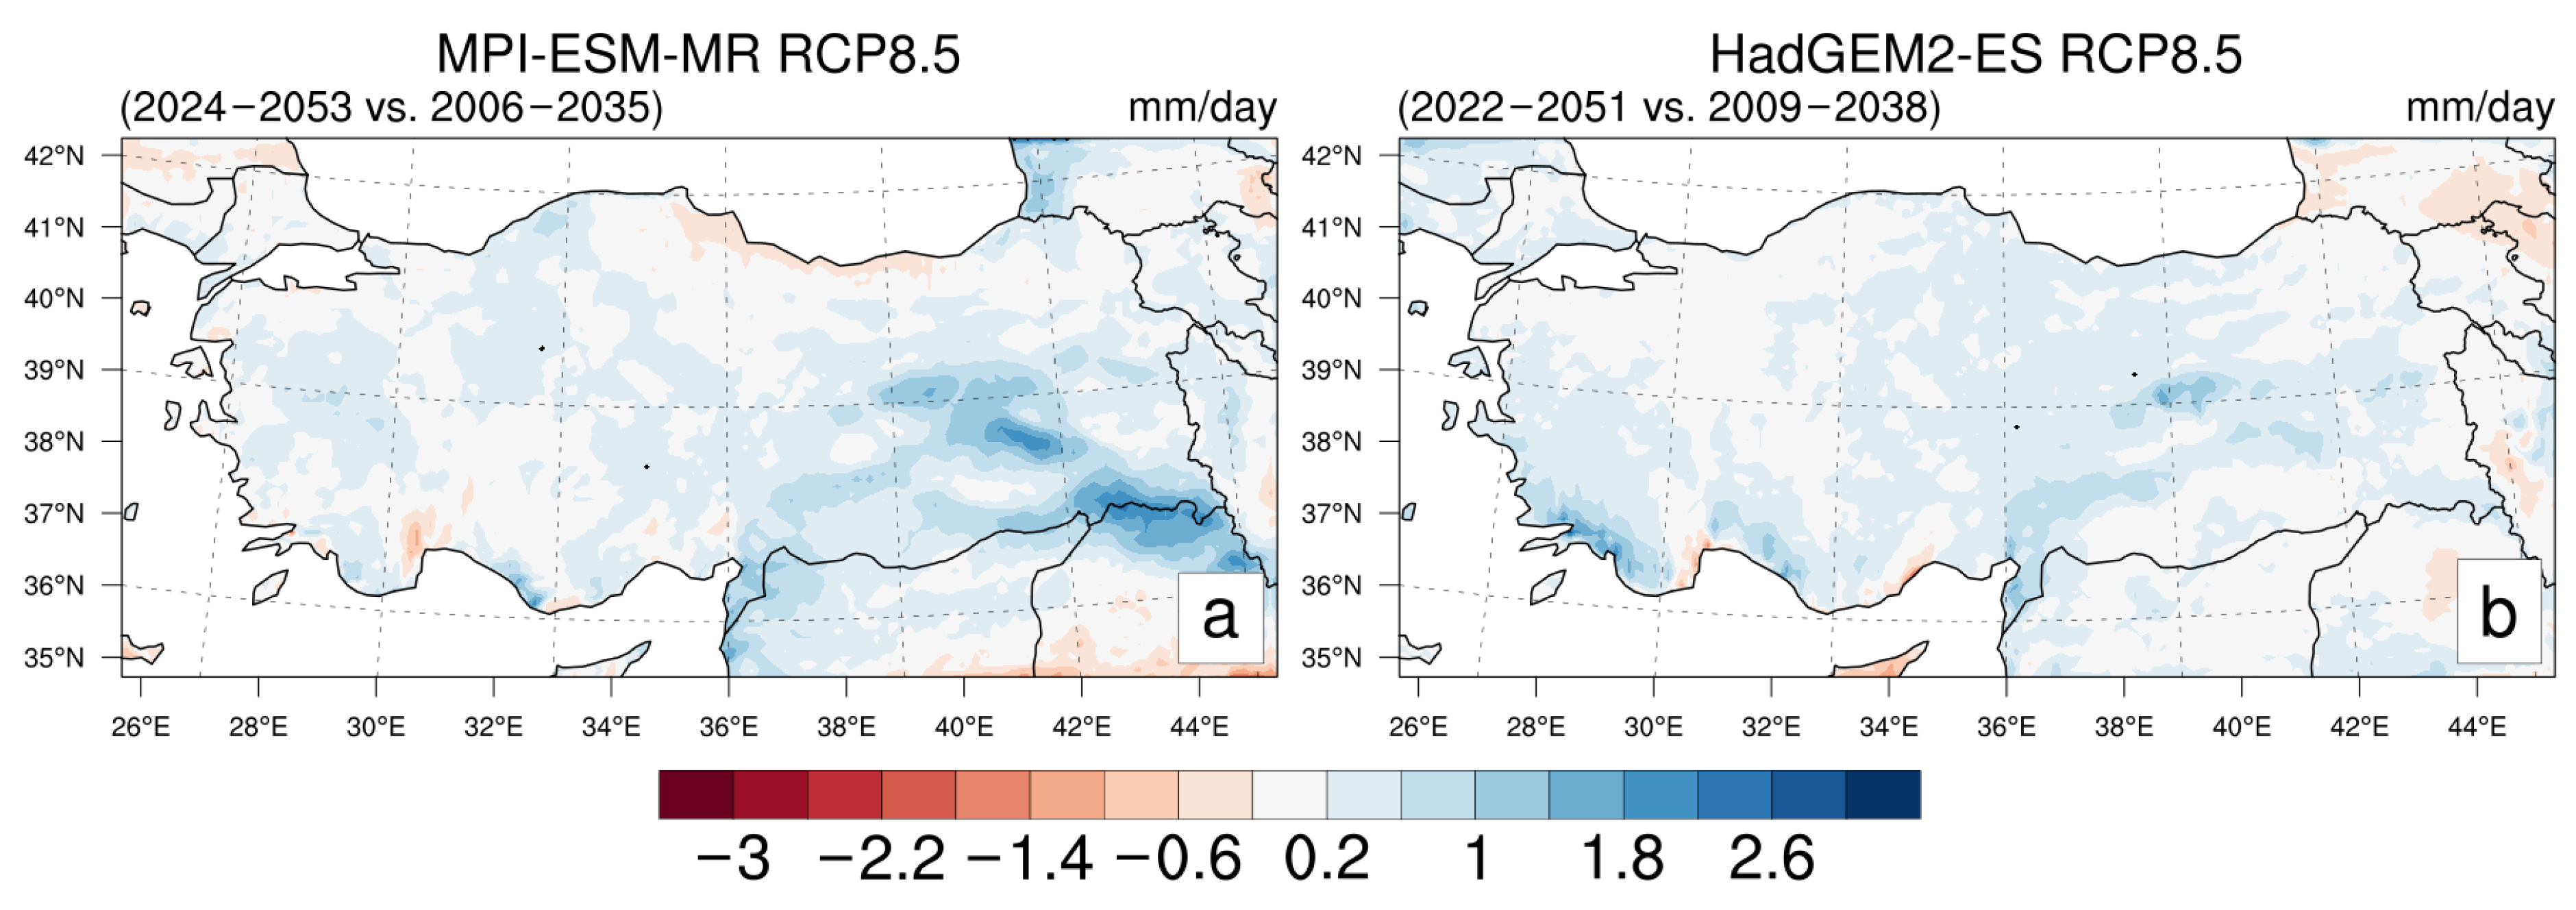
Figure 16 shows that the additional 0.5 °C warming leads to generally positive SDII changes across Türkiye in both simulations, although the regional distributions differ between the models. In the RCM-MPI results, larger increases are visible over eastern and southeastern Türkiye, while western regions display weaker signals and several near-neutral areas. The spatial pattern appears irregular, with varying magnitudes between neighboring regions. The country mean SDII increase reaches approximately +0.3 mm/day, indicating a modest rise in precipitation intensity under additional warming.
The RCM-HG simulations also indicate positive SDII anomalies across much of Türkiye, although the spatial structure appears smoother than in RCM-MPI. Central, eastern, and parts of northern Türkiye show relatively consistent increases, while only limited areas remain close to neutral conditions. The country mean increase is approximately +0.26 mm/day, remaining close to the RCM-MPI magnitude despite regional differences in spatial structure. Both models suggest that the transition from GWTL 1.5 °C to 2 °C contributes to stronger daily precipitation intensity, even though the magnitude of change remains limited.
Regionally, eastern and southeastern Türkiye exhibit the clearest positive SDII anomalies in both simulations, suggesting that short-duration precipitation events may become more intense in continental regions under additional warming. Compared to dry-spell indices, the SDII response appears more spatially consistent, indicating a closer relationship between warming and precipitation intensity changes. However, the additional warming signal in SDII is very weak relative to its interannual variability. Nevertheless, RCM-MPI and RCM-HG agree on the sign of SDII changes over approximately 83% of the domain.
Figure 17 shows that the transition from GWTL 1.5 °C to 2 °C results in generally positive changes in R90P across Türkiye in both simulations, although the regional patterns differ between the models. In the RCM-MPI results, increases are more visible across western, central, eastern, and southeastern Türkiye, while some northern areas and parts of southern Türkiye display weaker signals or localized decreases. The spatial distribution appears regionally variable, with stronger positive anomalies extending across inland regions. The country mean increase reaches approximately +1.65 days/year, indicating a moderate rise in R90P under the additional 0.5 °C warming.
The RCM-HG simulations also indicate positive anomalies across much of Türkiye, although the magnitude remains slightly lower than in RCM-MPI. Positive changes are distributed over broad areas of central and northern Türkiye, while localized decreases or near-neutral conditions occur in parts of southeastern and coastal regions. The overall spatial structure appears smoother compared to the RCM-MPI simulations. The country mean increase is approximately +1.19 days/year, suggesting a relatively moderate increase in the occurrence of extreme precipitation.
Regionally, inland and eastern parts of Türkiye display the most noticeable increases in the number of days with extreme precipitation in both simulations, whereas some coastal areas remain closer to neutral conditions. Such a distribution need not follow the spatial behavior of temperature-based indices, as extreme precipitation is governed by a different combination of thermodynamic and dynamical processes. Together with the positive SDII changes, these patterns indicate that the additional 0.5 °C warming may contribute to precipitation regimes characterized by both more frequent and stronger precipitation events in several regions of Türkiye. Despite the predominantly positive changes, the R90P signal remains below the robustness threshold throughout Türkiye in both simulations. Sign agreement between RCM-MPI and RCM-HG is observed over approximately 75% of the study area.
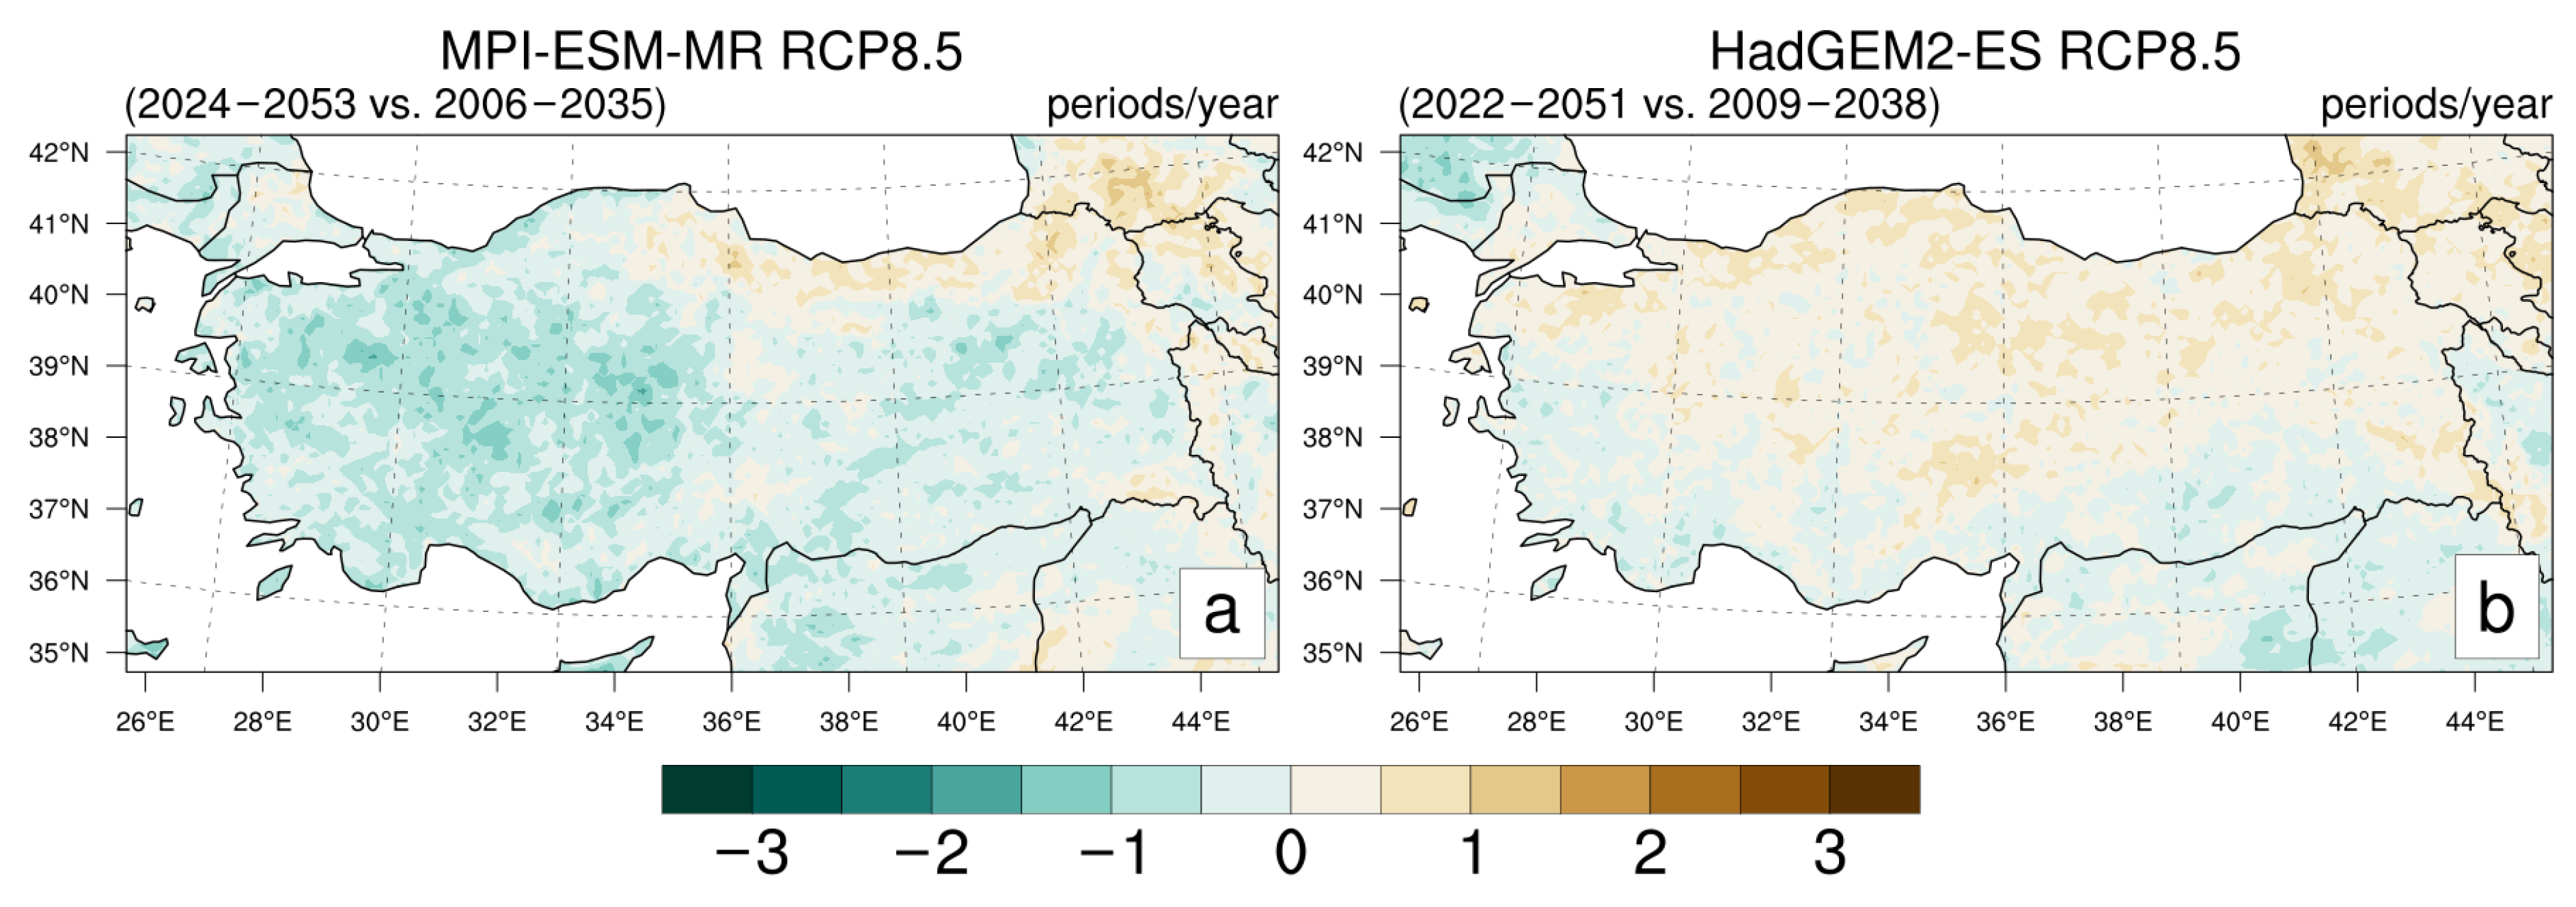
Figure 18 indicates that the additional 0.5 °C warming produces only limited changes in CDD5 across Türkiye, although the spatial distributions differ between the two simulations. In the RCM-MPI results, negative anomalies are more visible over western and central Türkiye, while weak positive changes appear across parts of the northeastern, eastern, and southeastern regions of the country. The overall spatial structure is irregular, with neighboring areas frequently displaying contrasting signals. The country mean change remains slightly negative at approximately −0.35 periods/year, indicating a small reduction in dry-spell frequency.
In the RCM-HG simulations, the CDD5 response to the additional warming remains weak but displays a somewhat smoother spatial structure compared to RCM-MPI. Slight positive anomalies occur across parts of northern, eastern and central Türkiye, as well as the southern Marmara region, whereas several western, southern, and southeastern regions remain close to neutral or show minor decreases. The country mean signal is slightly positive at around +0.16 periods/year, suggesting only a minimal extension of consecutive dry periods under stronger warming conditions. The spatial patterns indicate that the transition from GWTL 1.5 °C to 2 ° mainly alters the regional distribution of dry sequences rather than producing a strong nationwide shift.
Regional contrasts are particularly visible between northern and southern Türkiye in RCM-HG, where opposite anomaly signs frequently emerge in both models. Compared to temperature-based indices, the CDD5 changes remain relatively small, indicating that dry-spell frequency is less directly influenced by the additional 0.5 °C warming. The SNR assessment further indicates that these CDD5 changes remain below reference-period interannual variability throughout Türkiye in both simulations. Inter-model consistency is also limited, with sign agreement reaching approximately 43% of the domain.
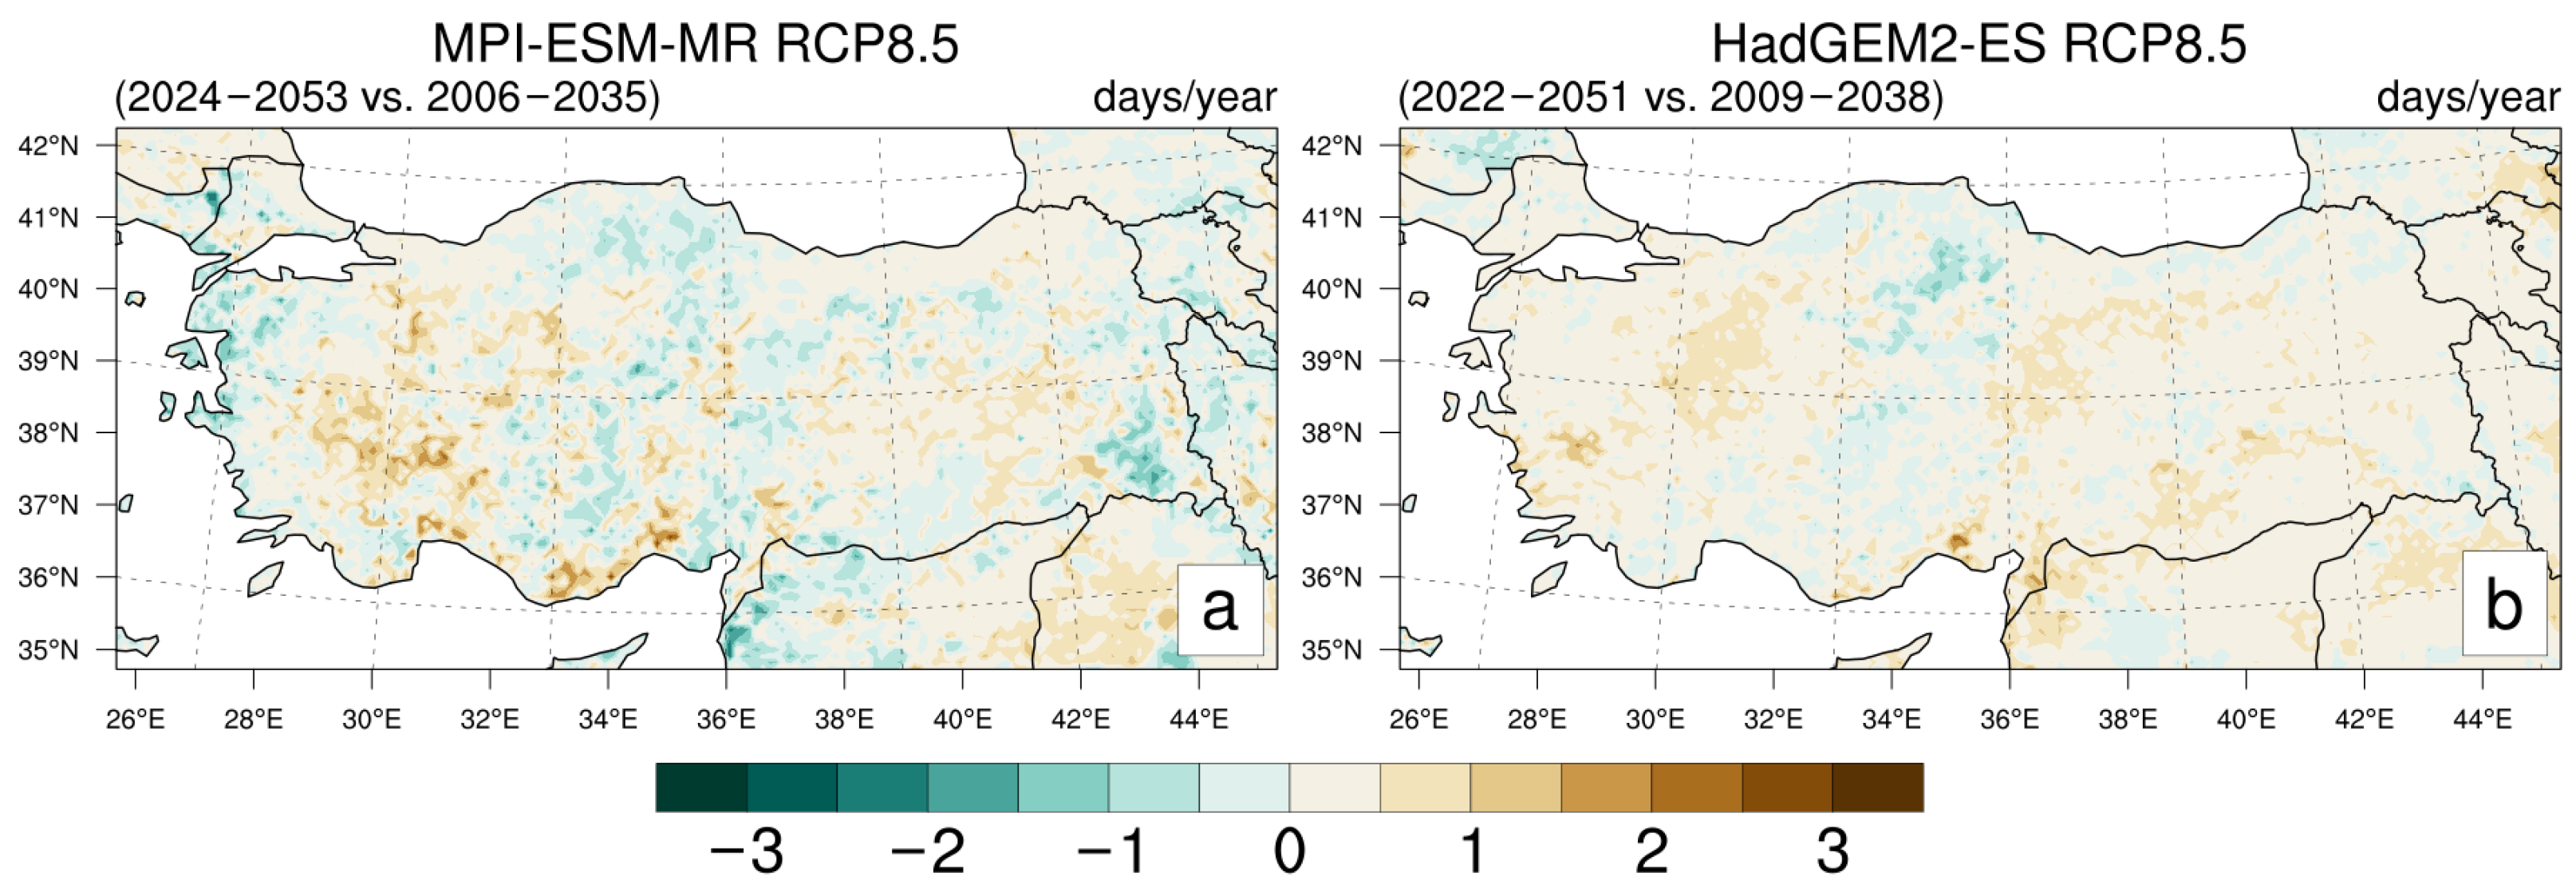
Figure 19 shows that the change in CDD associated with the additional 0.5 °C warming remains relatively limited across Türkiye, although regional variations are visible between the two models. In the RCM-MPI simulations, localized increases and decreases occur throughout Türkiye, indicating a spatially heterogeneous pattern. The spatial distribution is irregular, with neighboring areas often displaying contrasting signals. The country mean increase remains very small, with an average change of approximately +0.07 days/year between GWTL 1.5 ° and 2 °C.
The RCM-HG simulations also indicate generally low-magnitude CDD changes under the additional 0.5 °C warming, although the spatial structure appears smoother than in RCM-MPI. Slight increases are visible across parts of western and southern Türkiye, whereas some interior and northern regions exhibit weak negative anomalies. The country mean increase reaches approximately +0.16 days/year, remaining limited despite the broader spatial continuity of positive changes. The CDD signal shows limited sensitivity to incremental warming, suggesting that the duration of the longest dry periods changes only slightly.
From a regional perspective, the strongest positive anomalies in both simulations tend to occur over the Inner Western Anatolia and southern Türkiye, while eastern regions frequently display mixed changes or near-neutral conditions. The overall patterns indicate that the additional 0.5 °C warming mainly modifies the spatial distribution of dry-period duration rather than producing large nationwide increases in extreme dry spells. Similar to the other precipitation-related indices, the additional warming signal in CDD does not clearly emerge from the reference-period interannual variability. Approximately 55% of the domain shows the same sign of CDD change in RCM-MPI and RCM-HG, indicating agreement over slightly more than half of Türkiye.

4. Discussion

The spatial patterns identified in this study are broadly consistent with previous regional climate projections for Türkiye, despite differences in the experimental design and warming periods considered. For example, under high-emission scenarios such as RCP8.5, temperature increases tend to be more pronounced, particularly in southern and eastern regions during the summer [57]. Similarly, the spatial structure aligns with previous findings indicating that climate change impacts in Türkiye are particularly evident in the Mediterranean and Southeastern Anatolia Regions [36,58], which are also part of the broader Mediterranean Basin hotspot [59]. Land-atmosphere interactions may contribute to the enhanced warming, as reduced soil moisture and evapotranspiration can limit evaporative cooling and consequently increase near-surface air temperatures [60]. Other hotspot classifications also highlight these regions, together with parts of Eastern and Central Anatolia, as particularly vulnerable under higher emission pathways [38], in line with scenario-dependent tendencies discussed in the literature [61].
The results show that even a half-degree increase from GWTL 1.5 °C to 2 °C produces clear and measurable changes in several climate indicators. Temperature-related indicators vary less between the models. Increases in T m e a n , TN, and DI are spatially widespread and intensify under higher warming. The stronger TN response along coastal regions likely reflects the combined influence of maritime humidity and increasing nighttime minimum temperatures [46,62]. These conditions increase the likelihood of exceeding the 20 °C threshold under additional warming. These changes are directly relevant for human thermal comfort, energy demand, and tourism. In coastal areas, where summer tourism activity is concentrated, increasing nighttime temperatures and humidity are expected to worsen heat stress conditions during summer [48]. Such changes may shift climatic suitability toward relatively cooler regions, such as the Black Sea coast [63].
The tendency of precipitation-related variables is less consistent and shows clear model dependence. While RCM-HG generally projects increases in TP, RCM-MPI indicates decreases in certain seasons and regions. This drying tendency in RCM-MPI is broadly consistent with previous regional projections for Türkiye, although the magnitude and spatial and seasonal characteristics of the projected changes vary among studies [38,62,64]. The more widespread precipitation increases in RCM-HG, however, depart from this general tendency, further highlighting the model dependence of regional precipitation responses. This contrast does not necessarily imply that one simulation is more reliable than the other, but it reflects the sensitivity of regional precipitation to the large-scale conditions provided by the driving GCMs. Unlike temperature, thermodynamic warming alone does not control the precipitation response to global warming. A warmer atmosphere can hold more moisture, but regional precipitation also depends strongly on changes in atmospheric circulation, moisture transport, convection, and their interaction with regional topography [65]. Differences in the representation and response of these processes in MPI-ESM-MR and HadGEM2-ES can therefore propagate into the RegCM4.4 simulations through the lateral boundary conditions [66] and lead to distinct, in some cases, even opposing regional precipitation responses, as observed in this study. Previous studies also emphasize that precipitation projections over the Mediterranean Region involve substantial uncertainty [32,36]. Despite these differences, both models suggest shifts in seasonal precipitation distribution, which may have important implications for water resources and agricultural production. Changes in precipitation timing, even without large annual changes, can strongly affect crop yields and water availability [67,68,69].
Dryness-related indices, including CDD5 and CDD, display more regionally variable patterns, underscoring the impact of regional processes and internal variability. As noted by Deser et al. [70], internal climate variability constitutes a major source of uncertainty in regional climate projections and may account for a substantial fraction of inter-model spread, particularly for precipitation and atmospheric circulation, whereas temperature responses tend to be more robust. In this context, internal climate variability introduces an inherent and irreducible component of uncertainty in regional climate projections, implying that differences between model outcomes may partly represent the range of plausible realizations rather than purely model deficiencies [71].
The SNR assessment supports this distinction between temperature- and precipitation-related responses. The warming signal is more clearly distinguishable from interannual variability for the annual temperature-related indices, particularly DI, whereas robustness is largely absent for the precipitation-related indices. This difference may be associated with the inherently greater spatiotemporal variability of precipitation, which can obscure the response to an additional 0.5 °C of warming. For seasonal T m e a n , however, robustness varies between seasons and models, with no robust response in winter or spring in either simulation. Inter-model sign agreement, however, presents a more variable picture, with consistency depending on the index and, for TP, the season. For changes associated with the additional warming from GWTL 1.5 °C to 2 °C, T m e a n shows complete directional agreement, whereas TN and DI exhibit lower agreement. Agreement for SDII, R90P, and winter TP is higher than for TN and DI, whereas CDD5 and spring and autumn TP show lower consistency. CDD exhibits slightly lower agreement than TN and DI. These findings therefore suggest greater confidence in the annual temperature-related responses in terms of their robustness relative to interannual variability, while precipitation changes under the additional 0.5 °C warming should be interpreted more cautiously.
Beyond these differences in robustness, the two models also differ in the magnitude of projected changes under additional warming. While temperature responses are relatively consistent between models, precipitation projections exhibit considerable differences, with RCM-MPI indicating localized decreases and RCM-HG suggesting more widespread increases. This divergence stems from the structural uncertainty associated with precipitation processes. The generally stronger signal in HadGEM2-ES-driven projections may partly be attributed to its relatively higher equilibrium climate sensitivity [72,73,74,75,76] and associated thermodynamic responses, although precipitation differences are more likely influenced by structural uncertainties in model processes.
A limitation of this study is the use of only two GCM-RCM chains, both based on RegCM4.4. The analysis relies on the two high-resolution regional climate simulations available for the present study domain. Producing such simulations at 10-km horizontal resolution is computationally demanding, which restricted the number of model chains considered in the study. Although the use of two different driving GCMs allows part of the uncertainty associated with the large-scale climate response to be represented, it does not capture the full range of GCM and RCM structural uncertainty. In particular, the contrasting precipitation responses obtained from the MPI-ESM-MR and HadGEM2-ES-driven simulations demonstrate the sensitivity of some projected changes to the driving model. Therefore, the results should not be interpreted as a multi-model ensemble consensus, but rather as the responses simulated by the two available model chains at the specified GWTLs. Future studies using a larger ensemble of GCM-RCM combinations, including newer-generation climate models, would provide a more comprehensive assessment of the robustness and model dependence of the regional responses.
Although a 0.5 °C increase in global temperature may appear modest, the results demonstrate that this increment can lead to noticeable changes in extreme climate indicators. This effect is most clearly observed for thermal extremes, where tropical nights and uncomfortable conditions become more frequent. Global assessments similarly indicate that even small increments in warming significantly increase the frequency and intensity of extreme heat events [1]. At the same time, precipitation-related changes follow a more heterogeneous pattern under incremental warming.
From a regional perspective, the impacts of climate change in Türkiye are clearly uneven. The Mediterranean and Southeastern Anatolia Regions stand out as areas where increasing temperatures and thermal stress are most pronounced. These regions already experience high summer temperatures and limited precipitation, which increases their vulnerability to additional warming. In contrast, the Black Sea Region displays a different pattern of change, with relatively smaller temperature increases but greater sensitivity to precipitation variability and changes in extreme precipitation frequency. Projections for the Eastern Mediterranean and Middle East indicate substantial warming by mid-century, accompanied by decreasing precipitation in southern regions [23]. In Türkiye, similar tendencies have been found, with potential precipitation reductions of up to 10–20% on average and up to 30% in southern areas under high-emission scenarios [23]. Previous studies [32,36,57] have also identified changes in precipitation regimes, particularly in western Türkiye.
The broader implications of these results extend beyond physical climate changes. Exposure to climate extremes is shaped not only by warming levels but also by socio-economic conditions and regional vulnerability. Although Türkiye is classified as a very high human development country [77], its location within the Mediterranean Basin makes it physically vulnerable to climate change. At the global scale, vulnerability is even more pronounced in low human development countries, where exposure under GTWL 1.5 °C may already exceed that of very high human development countries at GTWL 2 °C [78]. Population dynamics can amplify these inequalities, as highlighted by recent studies emphasizing the role of demographic changes in shaping exposure to climate risks [79,80].
Even under 2 °C of global warming, sector-specific climate extremes can exceed the severity implied by model-mean projections at higher warming levels, suggesting that averaged responses may underestimate potential risks [81]. In this context, the pronounced differences identified between 1.5 °C and 2 °C warming levels in Türkiye highlight the importance of limiting warming to lower thresholds. More broadly, a 1.5 °C warming level should not be interpreted as a uniformly safe climate state, as regional climate responses can vary considerably depending on the spatial patterns of warming and local vulnerability conditions (e.g., [82]).

5. Conclusions

The results demonstrate that limiting global warming to 1.5 °C results in lower levels of change for Türkiye, although the magnitude of differences between 1.5 °C and 2 °C varies across climate indicators. The additional 0.5 °C warming does not affect all variables equally; however, its impact becomes particularly evident in temperature-related extremes. Increases in T m e a n , TN, and DI intensify noticeably, indicating that even a relatively small increment in global temperature can amplify climate risks.
The projected changes exhibit clear spatial differences. Coastal regions, especially along the Mediterranean, Aegean, and Marmara, experience more pronounced increases in nighttime temperatures and humidity, with direct implications for human health and tourism. At the same time, inland regions, particularly Central and Southeastern Anatolia, are more exposed to drought-related risks and increasing pressure on water resources and agricultural systems. These spatial differences highlight that climate change impacts in Türkiye strongly depend on the region, and uniform adaptation strategies cannot address them. Annual temperature-related signals are generally more robust relative to reference-period interannual variability, whereas precipitation changes remain largely non-robust, more uncertain, and model-dependent. Agreement between the simulations on the direction of change, however, varies by indicator and season. Nevertheless, the combined effects of warming and changes in precipitation regimes indicate increasing pressure on water resources and ecosystem stability.
The principal contribution of this study lies in resolving the climatic consequences of the relatively narrow interval between the 1.5 °C and 2 °C GWTLs at high spatial resolution over Türkiye. By combining the magnitude of projected changes with their emergence from background variability and their consistency between simulations, the analysis provides a more nuanced assessment of the robustness and model dependence of the projected responses to this additional half-degree of global warming.
From a policy perspective, the results underline that adaptation strategies in Türkiye should be developed with a strong regional focus, particularly in water resource management, agriculture, tourism, and urban planning, while sustained international mitigation efforts remain essential. Even a half-degree increase in global temperature can lead to measurable and regionally differentiated impacts in Türkiye. Limiting warming to 1.5 °C is therefore not only a global objective but also a critical threshold for reducing national-scale climate risks. Integrating regional climate projections into sector-specific planning frameworks will be critical to enhance resilience against increasing thermal stress, shifting precipitation regimes, and their cascading socio-economic impacts.

Author Contributions

Author Contributions: Conceptualization, M.T.T. and N.A.; methodology, M.T.T. and N.A.; software, M.T.T. and Z.D.; validation, M.T.T., N.A., Z.D., E.M.S. and D.N.Ç.; formal analysis, M.T.T., N.A., Z.D., E.M.S. and D.N.Ç.; investigation, M.T.T., N.A., Z.D., E.M.S. and D.N.Ç.; resources, M.T.T., N.A., Z.D., E.M.S. and D.N.Ç.; data curation, M.T.T., N.A., Z.D., E.M.S. and D.N.Ç.; writing—original draft preparation, M.T.T., N.A., Z.D., E.M.S. and D.N.Ç.; writing—review and editing, M.T.T., N.A., Z.D., E.M.S., D.N.Ç. and M.L.K.; visualization, M.T.T., N.A., Z.D., E.M.S. and D.N.Ç.; supervision, M.T.T., N.A. and M.L.K.; project administration, M.T.T., N.A. and M.L.K.; funding acquisition, M.T.T., N.A. and M.L.K. All authors have read and agreed to the published version of the manuscript.

Funding

This research received no external funding.

Institutional Review Board Statement

Not applicable.

Informed Consent Statement

Not applicable.

Data Availability Statement

The raw data supporting the conclusions of this article will be made available by the authors on request.

Acknowledgments

During the preparation of this manuscript, the authors used ChatGPT (OpenAI, GPT-5.5) in USA and QuillBot (version 4.1.0) in USA Premium for language editing, translation support, grammar and typo correction, wording improvements, and enhancement of readability and manuscript structure. The literature review, study design, data generation and analysis, figure preparation, interpretation of results, and all scientific content were conducted and written entirely by the authors. All outputs generated by these tools were critically reviewed, revised, and validated by the authors, who take full responsibility for the content of this publication. The authors also sincerely thank the anonymous reviewers for their careful evaluation and constructive comments and suggestions, which contributed substantially to improving the scientific interpretation and overall quality of the manuscript.

Conflicts of Interest

The authors declare no conflicts of interest.

Abbreviations

The following abbreviations are used in this manuscript:
CDDConsecutive Dry Days
CDD5Dry Periods Lasting At Least Five Consecutive Days
CORDEXCoordinated Regional Climate Downscaling Experiment
GCMGlobal Climate Model
DIDiscomfort Index
GWTLGlobal Warming Temperature Level
HadGEM2-ESHadley Centre Global Environment Model version 2-Earth System
ICTPAbdus Salam International Centre for Theoretical Physics
MENAMiddle East and North Africa
MPI-ESM-MRMax Planck Institute Earth System Model-Mixed Resolution
R90PExtreme Precipitation
RCM-HGRegCM4.4 Simulation Driven by HadGEM2-ES
RCM-MPIRegCM4.4 Simulation Driven by MPI-ESM-MR
RCP8.5Representative Concentration Pathway 8.5
RegCM4.4Regional Climate Model version 4.4
RHRelative Humidity
SNRSignal-to-noise Ratio
T m e a n Mean Temperature
TNTropical Nights
TPTotal Precipitation
SDIISimple Daily Intensity Index

References

  1. IPCC. Summary for Policymakers. In Climate Change 2021: The Physical Science Basis. Contribution of Working Group I to the Sixth Assessment Report of the Intergovernmental Panel on Climate Change; Masson-Delmotte, V., Zhai, P., Pirani, A., Connors, S.L., Péan, C., Berger, S., Caud, N., Chen, Y., Goldfarb, L., Gomis, M.I., et al., Eds.; Cambridge University Press: Cambridge, UK; New York, NY, USA, 2021; pp. 3–33. [Google Scholar] [CrossRef] [Scilit]
  2. Foster, G.; Rahmstorf, S. Global warming has accelerated significantly. Geophys. Res. Lett. 2026, 53, e2025GL118804. [Google Scholar] [CrossRef] [Scilit]
  3. Hansen, J.E.; Sato, M.; Simons, L.; Nazarenko, L.S.; Sangha, I.; Kharecha, P.; Zachos, J.C.; von Schuckmann, K.; Loeb, N.G.; Osman, M.B.; et al. Global warming in the pipeline. Oxf. Open Clim. Change 2023, 3, kgad008. [Google Scholar] [CrossRef] [Scilit]
  4. United Nations Framework Convention on Climate Change (UNFCCC). The Paris Agreement. Available online: https://unfccc.int/process-and-meetings/the-paris-agreement/the-paris-agreement (accessed on 27 October 2025).
  5. IPCC. FAQ Chapter 1—Why Are We Talking about 1.5 °C? Available online: https://www.ipcc.ch/sr15/faq/faq-chapter-1/ (accessed on 27 October 2025).
  6. United Nations Framework Convention on Climate Change (UNFCCC). The Structured Expert Dialogue (SED). Available online: https://unfccc.int/topics/science/workstreams/periodic-review/SED (accessed on 27 October 2025).
  7. Fransen, T. 1.5 Degrees C: Understanding World’s Critical Warming Threshold; World Resources Institute: Washington, DC, USA, 2025; Available online: https://www.wri.org/insights/1-5-degrees-c-target-explained#what-happens-if-we-breach (accessed on 27 October 2025).
  8. IPCC. Climate Change 2022: Impacts, Adaptation and Vulnerability. Contribution of Working Group II to the Sixth Assessment Report of the Intergovernmental Panel on Climate Change; Pörtner, H.-O., Roberts, D.C., Tignor, M., Poloczanska, E.S., Mintenbeck, K., Alegría, A., Craig, M., Langsdorf, S., Löschke, S., Möller, V., et al., Eds.; Cambridge University Press: Cambridge, UK; New York, NY, USA, 2022; 69p. [Google Scholar] [CrossRef] [Scilit]
  9. Dosio, A.; Mentaschi, L.; Fischer, E.M.; Wyser, K. Extreme heat waves under 1.5 °C and 2 °C global warming. Environ. Res. Lett. 2018, 13, 054006. [Google Scholar] [CrossRef] [Scilit]
  10. Li, D.; Yuan, J.; Kopp, R.E. Escalating global exposure to compound heat-humidity extremes with warming. Environ. Res. Lett. 2020, 15, 064003. [Google Scholar] [CrossRef] [Scilit]
  11. Kharin, V.V.; Flato, G.M.; Zhang, X.; Gillett, N.P.; Zwiers, F.; Anderson, K.J. Risks from climate extremes change differently from 1.5 °C to 2.0 °C depending on rarity. Earth’s Future 2018, 6, 704–715. [Google Scholar] [CrossRef] [Scilit]
  12. Sun, Q.; Miao, C.; Hanel, M.; Borthwick, A.G.L.; Duan, Q.; Ji, D.; Li, H. Global heat stress on health, wildfires, and agricultural crops under different levels of climate warming. Environ. Int. 2019, 128, 125–136. [Google Scholar] [CrossRef] [Scilit] [PubMed]
  13. Dosio, A.; Fischer, E.M. Will half a degree make a difference? Robust projections of indices of mean and extreme climate in Europe under 1.5 °C, 2 °C, and 3 °C global warming. Geophys. Res. Lett. 2018, 45, 935–944. [Google Scholar] [CrossRef] [Scilit]
  14. King, A.D.; Karoly, D.J. Climate extremes in Europe at 1.5 and 2 degrees of global warming. Environ. Res. Lett. 2017, 12, 114031. [Google Scholar] [CrossRef] [Scilit]
  15. Lehner, F.; Coats, S.; Stocker, T.F.; Pendergrass, A.G.; Sanderson, B.M.; Raible, C.C.; Smerdon, J.E. Projected drought risk in 1.5 °C and 2 °C warmer climates. Geophys. Res. Lett. 2017, 44, 7419–7428. [Google Scholar] [CrossRef] [Scilit]
  16. Mba, W.P.; Longandjo, G.-N.T.; Moufouma-Okia, W.; Bell, J.-P.; James, R.; Vondou, D.A.; Haensler, A.; Fotso-Nguemo, T.C.; Guenang, G.M.; Tchotchou, A.L.D.; et al. Consequences of 1.5 °C and 2 °C global warming levels for temperature and precipitation changes over Central Africa. Environ. Res. Lett. 2018, 13, 055011. [Google Scholar] [CrossRef] [Scilit]
  17. Schleussner, C.-F.; Lissner, T.K.; Fischer, E.M.; Wohland, J.; Perrette, M.; Golly, A.; Rogelj, J.; Childers, K.; Schewe, J.; Frieler, K. Differential climate impacts for policy-relevant limits to global warming: The case of 1.5 °C and 2 °C. Earth Syst. Dyn. 2016, 7, 327–351. [Google Scholar] [CrossRef] [Scilit]
  18. Teichmann, C.; Bülow, K.; Otto, J.; Pfeifer, S.; Rechid, D.; Sieck, K.; Jacob, D. Avoiding extremes: Benefits of staying below 1.5 °C compared to 2.0 °C and 3.0°C global warming. Atmosphere 2018, 9, 115. [Google Scholar] [CrossRef] [Scilit]
  19. Yu, H.; Wu, D.; Piao, X.; Zhang, T.; Yan, Y.; Tian, Y.; Li, Q.; Cui, X. Reduced impacts of heat extremes from limiting global warming to under 1.5 °C or 2 °C over Mediterranean regions. Environ. Res. Lett. 2021, 16, 014034. [Google Scholar] [CrossRef] [Scilit]
  20. Giorgi, F.; Lionello, P. Climate change projections for the Mediterranean region. Glob. Planet. Change 2008, 63, 90–104. [Google Scholar] [CrossRef] [Scilit]
  21. IPCC. IPCC WGI Interactive Atlas: Regional Information (Advanced). Available online: https://interactive-atlas.ipcc.ch/ (accessed on 15 November 2025).
  22. Lionello, P.; Scarascia, L. The relation between climate change in the Mediterranean region and global warming. Reg. Environ. Change 2018, 18, 1481–1493. [Google Scholar] [CrossRef] [Scilit]
  23. Zittis, G.; Hadjinicolaou, P.; Klangidou, M.; Proestos, Y.; Lelieveld, J. A multi-model, multi-scenario, and multi-domain analysis of regional climate projections for the Mediterranean. Reg. Environ. Change 2019, 19, 2621–2635. [Google Scholar] [CrossRef] [Scilit]
  24. Liu, Y.; Geng, X.; Hao, Z.; Zheng, J. Changes in climate extremes in Central Asia under 1.5 and 2 °C global warming and their impacts on agricultural productions. Atmosphere 2020, 11, 1076. [Google Scholar] [CrossRef] [Scilit]
  25. Shi, C.; Jiang, Z.-H.; Chen, W.-L.; Li, L. Changes in temperature extremes over China under 1.5 °C and 2 °C global warming targets. Adv. Clim. Change Res. 2018, 9, 120–129. [Google Scholar] [CrossRef] [Scilit]
  26. Yang, Y.; Jin, C.; Ali, S. Projection of heat wave in China under global warming targets of 1.5 °C and 2 °C by the ISIMIP models. Atmos. Res. 2020, 244, 105057. [Google Scholar] [CrossRef] [Scilit]
  27. King, A.D.; Karoly, D.J.; Henley, B.J. Australian climate extremes at 1.5 °C and 2 °C of global warming. Nat. Clim. Change 2017, 7, 412–416. [Google Scholar] [CrossRef] [Scilit]
  28. Lewis, S.C.; King, A.D.; Perkins-Kirkpatrick, S.E.; Mitchell, D.M. Regional hotspots of temperature extremes under 1.5 °C and 2 °C of global mean warming. Weather Clim. Extrem. 2019, 26, 100233. [Google Scholar] [CrossRef] [Scilit]
  29. Nikulin, G.; Lennard, C.; Dosio, A.; Kjellström, E.; Chen, Y.; Hänsler, A.; Kupiainen, M.; Laprise, R.; Mariotti, L.; Maule, C.F.; et al. The effects of 1.5 and 2 degrees of global warming on Africa in the CORDEX ensemble. Environ. Res. Lett. 2018, 13, 065003. [Google Scholar] [CrossRef] [Scilit]
  30. Nangombe, S.; Zhou, T.; Zhang, W.; Wu, B.; Hu, S.; Zou, L.; Li, D. Record-breaking climate extremes in Africa under stabilized 1.5 °C and 2 °C global warming scenarios. Nat. Clim. Change 2018, 8, 375–380. [Google Scholar] [CrossRef] [Scilit]
  31. Fotso-Nguemo, T.C.; Vondou, D.A.; Diallo, I.; Diedhiou, A.; Weber, T.; Tanessong, R.S.; Nghonda, J.P.; Yepdo, Z.D. Potential impact of 1.5, 2 and 3 °C global warming levels on heat and discomfort indices changes over Central Africa. Sci. Total Environ. 2022, 804, 150099. [Google Scholar] [CrossRef] [Scilit] [PubMed]
  32. Kjellström, E.; Nikulin, G.; Strandberg, G.; Christensen, O.B.; Jacob, D.; Keuler, K.; Lenderink, G.; van Meijgaard, E.; Schär, C.; Somot, S.; et al. European climate change at global mean temperature increases of 1.5 and 2 °C above pre-industrial conditions as simulated by the EURO-CORDEX regional climate models. Earth Syst. Dyn. 2018, 9, 459–478. [Google Scholar] [CrossRef] [Scilit]
  33. Matte, D.; Christensen, J.H.; Ozturk, T. Spatial extent of precipitation events: When big is getting bigger. Clim. Dyn. 2022, 58, 1861–1875. [Google Scholar] [CrossRef] [Scilit]
  34. Ferreiro-Lera, G.B.; Penas, Á.; del Río, S. Projected reorganization of Euro-Mediterranean bioclimates under climate change: Evidence from CMIP6 multi-model ensemble. Earth Syst. Environ. 2026, 10, 9833–9859. [Google Scholar] [CrossRef] [Scilit]
  35. Lazoglou, G.; Papadopoulos-Zachos, A.; Georgiades, P.; Zittis, G.; Velikou, K.; Manios, E.M.; Anagnostopoulou, C. Identification of climate change hotspots in the Mediterranean. Sci. Rep. 2024, 14, 29817. [Google Scholar] [CrossRef] [Scilit] [PubMed]
  36. Türkeş, M.; Turp, M.T.; An, N.; Ozturk, T.; Kurnaz, M.L. Impacts of climate change on precipitation climatology and variability in Turkey. In Water Resources of Turkey; Harmancioglu, N.B., Altinbilek, D., Eds.; Springer: Cham, Switzerland, 2020; Volume 2, pp. 467–491. [Google Scholar] [CrossRef] [Scilit]
  37. Ruti, P.M.; Somot, S.; Giorgi, F.; Dubois, C.; Flaounas, E.; Obermann, A.; Dell’Aquila, A.; Pisacane, G.; Harzallah, A.; Lombardi, E.; et al. Med-CORDEX initiative for Mediterranean climate studies. Bull. Am. Meteorol. Soc. 2016, 97, 1187–1208. [Google Scholar] [CrossRef] [Scilit]
  38. An, N.; Turp, M.T.; Bayindir, E.; Akverdi, Y.; Mirza, Z.N.; Kurnaz, M.L. Climate change hotspots for Türkiye. Int. J. Climatol. 2025, 45, e8825. [Google Scholar] [CrossRef] [Scilit]
  39. Peel, M.C.; Finlayson, B.L.; McMahon, T.A. Updated world map of the Köppen–Geiger climate classification. Hydrol. Earth Syst. Sci. 2007, 11, 1633–1644. [Google Scholar] [CrossRef] [Scilit]
  40. Türkeş, M. Genel Klimatoloji: Atmosfer, Hava ve İklimin Temelleri, 4th ed.; Kriter Yayınevi: Istanbul, Türkiye, 2019. [Google Scholar]
  41. Vautard, R.; Gobiet, A.; Sobolowski, S.; Kjellström, E.; Stegehuis, A.; Watkiss, P.; Mendlik, T.; Landgren, O.; Nikulin, G.; Teichmann, C.; et al. The European climate under 2 °C global warming. Environ. Res. Lett. 2014, 9, 034006. [Google Scholar] [CrossRef] [Scilit]
  42. Taylor, K.E.; Stouffer, R.J.; Meehl, G.A. An overview of CMIP5 and the experiment design. Bull. Am. Meteorol. Soc. 2012, 93, 485–498. [Google Scholar] [CrossRef] [Scilit]
  43. Giorgi, F.; Coppola, E.; Solmon, F.; Mariotti, L.; Sylla, M.B.; Bi, X.; Elguindi, N.; Diro, G.T.; Nair, V.; Giuliani, G.; et al. RegCM4: Model description and preliminary tests over multiple CORDEX domains. Clim. Res. 2012, 52, 7–29. [Google Scholar] [CrossRef] [Scilit]
  44. van Vuuren, D.P.; Edmonds, J.; Kainuma, M.; Riahi, K.; Thomson, A.; Hibbard, K.; Hurtt, G.C.; Kram, T.; Krey, V.; Lamarque, J.-F.; et al. The representative concentration pathways: An overview. Clim. Change 2011, 109, 5–31. [Google Scholar] [CrossRef] [Scilit]
  45. Diez-Sierra, J.; Iturbide, M.; Fernández, J.; Gutiérrez, J.M.; Milovac, J.; Cofiño, A.S. Consistency of the regional response to global warming levels from CMIP5 and CORDEX projections. Clim. Dyn. 2023, 61, 4047–4060. [Google Scholar] [CrossRef] [Scilit]
  46. Erlat, E.; Türkeş, M. Observed variations and trends in number of tropical nights in Turkey. Aegean Geogr. J. 2017, 26, 95–106. Available online: https://izlik.org/JA89CD45UC (accessed on 11 May 2026).
  47. Thom, E.C. The discomfort index. Weatherwise 1959, 12, 57–61. [Google Scholar] [CrossRef] [Scilit]
  48. Bilgin, B.; Bayindir, E.; Demiralay, Z.; Turp, M.T.; An, N.; Kurnaz, M.L. Human comfort analysis for Turkey’s coastal tourism in a changing climate. Theor. Appl. Climatol. 2023, 154, 945–958. [Google Scholar] [CrossRef] [Scilit]
  49. Din, M.F.; Lee, Y.Y.; Ponraj, M.; Ossen, D.R.; Iwao, K.; Chelliapan, S. Thermal comfort of various building layouts with a proposed discomfort index range for tropical climate. J. Therm. Biol. 2014, 41, 6–15. [Google Scholar] [CrossRef] [Scilit] [PubMed]
  50. Stull, R. Wet-bulb temperature from relative humidity and air temperature. J. Appl. Meteorol. Climatol. 2011, 50, 2267–2269. [Google Scholar] [CrossRef] [Scilit]
  51. Ogega, O.M.; Gyampoh, B.A.; Mistry, M.N. Intraseasonal precipitation variability over West Africa under 1.5 °C and 2.0 °C global warming scenarios: Results from CORDEX RCMs. Climate 2020, 8, 143. [Google Scholar] [CrossRef] [Scilit]
  52. Peterson, T.C.; Folland, C.; Gruza, G.; Hogg, W.; Mokssit, A.; Plummer, N. Report on the Activities of the Working Group on Climate Change Detection and Related Rapporteurs 1998–2001; WCDMP-47, WMO-TD 1071; World Meteorological Organization: Geneva, Switzerland, 2001; 143p. [Google Scholar]
  53. Wang, X.; Hou, X.; Zhao, Y. Changes in consecutive dry/wet days and their relationships with local and remote climate drivers in the coastal area of China. Atmos. Res. 2021, 247, 105138. [Google Scholar] [CrossRef] [Scilit]
  54. Zhang, Y.; Jiang, F.; Wei, W.; Liu, M.; Wang, W.; Bai, L.; Li, X.; Wang, S. Changes in annual maximum number of consecutive dry and wet days during 1961–2008 in Xinjiang, China. Nat. Hazards Earth Syst. Sci. 2012, 12, 1353–1365. [Google Scholar] [CrossRef] [Scilit]
  55. Sutton, R.T.; Hodson, D.L. Climate response to basin-scale warming and cooling of the North Atlantic Ocean. J. Clim. 2007, 20, 891–907. [Google Scholar] [CrossRef] [Scilit]
  56. Zhang, W.; Zhou, T.; Zou, L.; Zhang, L.; Chen, X. Reduced exposure to extreme precipitation from 0.5 °C less warming in global land monsoon regions. Nat. Commun. 2018, 9, 3153. [Google Scholar] [CrossRef] [Scilit] [PubMed]
  57. Turp, M.T.; Öztürk, T.; Türkeş, M.; Kurnaz, M.L. Investigation of projected changes for near future air temperature and precipitation climatology of Turkey and surrounding regions by using the regional climate model RegCM4.3.5. Aegean Geogr. J. 2014, 23, 1–24. Available online: https://izlik.org/JA65SA98CF (accessed on 18 May 2026).
  58. Ozturk, T.; Ceber, Z.P.; Türkeş, M.; Kurnaz, M.L. Projections of climate change in the Mediterranean Basin by using downscaled global climate model outputs. Int. J. Climatol. 2015, 35, 4276–4292. [Google Scholar] [CrossRef] [Scilit]
  59. Giorgi, F. Climate change hot-spots. Geophys. Res. Lett. 2006, 33, L08707. [Google Scholar] [CrossRef] [Scilit]
  60. Zittis, G.; Hadjinicolaou, P.; Lelieveld, J. Role of soil moisture in the amplification of climate warming in the eastern Mediterranean and the Middle East. Clim. Res. 2014, 59, 27–37. [Google Scholar] [CrossRef] [Scilit]
  61. Wang, Z.; Lin, L.; Zhang, X.; Zhang, H.; Liu, L.; Xu, Y. Scenario dependence of future changes in climate extremes under 1.5 °C and 2 °C global warming. Sci. Rep. 2017, 7, 46432. [Google Scholar] [CrossRef] [Scilit] [PubMed]
  62. Ozturk, T.; Saygili-Araci, F.S.; Kurnaz, M.L. Projected changes in extreme temperature and precipitation indices over CORDEX-MENA domain. Atmosphere 2021, 12, 622. [Google Scholar] [CrossRef] [Scilit]
  63. Turp, M.T.; An, N.; Bilgin, B.; Şimşir, G.; Orgen, B.; Kurnaz, M.L. Projected summer tourism potential of the Black Sea Region. Sustainability 2024, 16, 377. [Google Scholar] [CrossRef] [Scilit]
  64. Demircan, M.; Gürkan, H.; Eskioğlu, O.; Arabacı, H.; Coşkun, M. Climate change projections for Turkey: Three models and two scenarios. Turk. J. Water Sci. Manag. 2017, 1, 22–43. [Google Scholar] [CrossRef] [Scilit]
  65. Radermacher, C.; Tomassini, L. Thermodynamic causes for future trends in heavy precipitation over Europe based on an ensemble of regional climate model simulations. J. Clim. 2012, 25, 7669–7689. [Google Scholar] [CrossRef] [Scilit]
  66. Torma, C.; Giorgi, F. Assessing the contribution of different factors in regional climate model projections using the factor separation method. Atmos. Sci. Lett. 2014, 15, 239–244. [Google Scholar] [CrossRef] [Scilit]
  67. Akbas, A.; Freer, J.; Ozdemir, H.; Bates, P.D.; Turp, M.T. What about reservoirs? Questioning anthropogenic and climatic interferences on water availability. Hydrol. Process. 2020, 34, 5441–5455. [Google Scholar] [CrossRef] [Scilit]
  68. Alrteimei, H.A.; Ash’aari, Z.H.; Muharram, F.M. Last decade assessment of the impacts of regional climate change on crop yield variations in the Mediterranean region. Agriculture 2022, 12, 1787. [Google Scholar] [CrossRef] [Scilit]
  69. Claro, A.M.; Fonseca, A.; Fraga, H.; Santos, J.A. Future agricultural water availability in Mediterranean countries under climate change: A systematic review. Water 2024, 16, 2484. [Google Scholar] [CrossRef] [Scilit]
  70. Deser, C.; Phillips, A.; Bourdette, V.; Teng, H. Uncertainty in climate change projections: The role of internal variability. Clim. Dyn. 2012, 38, 527–546. [Google Scholar] [CrossRef] [Scilit]
  71. Deser, C. Certain uncertainty: The role of internal climate variability in projections of regional climate change and risk management. Earth’s Future 2020, 8, e2020EF001854. [Google Scholar] [CrossRef] [Scilit]
  72. Andrews, T.; Gregory, J.M.; Webb, M.J.; Taylor, K.E. Forcing, feedbacks and climate sensitivity in CMIP5 coupled atmosphere-ocean climate models. Geophys. Res. Lett. 2012, 39. [Google Scholar] [CrossRef] [Scilit]
  73. Forster, P.M.; Andrews, T.; Good, P.; Gregory, J.M.; Jackson, L.S.; Zelinka, M. Evaluating adjusted forcing and model spread for historical and future scenarios in the CMIP5 generation of climate models. J. Geophys. Res. Atmos. 2013, 118, 1139–1150. [Google Scholar] [CrossRef] [Scilit]
  74. Ozturk, T. Projected future changes in extreme climate indices over Central Asia using RegCM4.3.5. Atmosphere 2023, 14, 939. [Google Scholar] [CrossRef] [Scilit]
  75. Sherwood, S.C.; Bony, S.; Dufresne, J.L. Spread in model climate sensitivity traced to atmospheric convective mixing. Nature 2014, 505, 37–42. [Google Scholar] [CrossRef] [Scilit] [PubMed]
  76. Tian, B. Spread of model climate sensitivity linked to double-Intertropical Convergence Zone bias. Geophys. Res. Lett. 2015, 42, 4133–4141. [Google Scholar] [CrossRef] [Scilit]
  77. UNDP (United Nations Development Programme). Human Development Report 2025: A Matter of Choice: People and Possibilities in the Age of AI; UNDP: New York, NY, USA, 2025. [Google Scholar]
  78. Russo, S.; Sillmann, J.; Sippel, S.; Barcikowska, M.J.; Ghisetti, C.; Smid, M.; O’Neill, B. Half a degree and rapid socioeconomic development matter for heatwave risk. Nat. Commun. 2019, 10, 136. [Google Scholar] [CrossRef] [Scilit] [PubMed]
  79. An, N.; Demiralay, Z.; Ucal, M.; Kurnaz, M.L. The nexus between migration and environmental degradation based on fundamental climate variables and extreme climate indices for the MENA domain. Clim. Serv. 2025, 38, 100564. [Google Scholar] [CrossRef] [Scilit]
  80. Hosseinzadehtalaei, P.; Hamdi, R.; Moradkhani, H.; Termonia, P.; Tabari, H. Inequality in human exposure to future climate extremes. Nat. Commun. 2025, 16, 8058. [Google Scholar] [CrossRef] [Scilit] [PubMed]
  81. Bevacqua, E.; Fischer, E.; Sillmann, J.; Zscheischler, J. Moderate global warming does not rule out extreme global climate outcomes. Nature 2026, 651, 946–953. [Google Scholar] [CrossRef] [Scilit] [PubMed]
  82. Seneviratne, S.I.; Rogelj, J.; Séférian, R.; Wartenburger, R.; Allen, M.R.; Cain, M.; Millar, R.J.; Ebi, K.L.; Ellis, N.; Hoegh-Guldberg, O.; et al. The many possible climates from the Paris Agreement’s aim of 1.5 °C warming. Nature 2018, 558, 41–49. [Google Scholar] [CrossRef] [Scilit] [PubMed]
Figure 1. Köppen-Geiger climate classification map of Türkiye.
Atmosphere 17 00873 g001
Figure 2. Annual changes (°C) in mean temperature ( T m e a n ) over Türkiye at global warming threshold level (GWTL) 1.5 °C and 2 °C: (a) RCM-MPI at GWTL 1.5 °C, (b) RCM-HG at GWTL 1.5 °C, (c) RCM-MPI at GWTL 2 °C, and (d) RCM-HG at GWTL 2 °C. Stippling indicates grid cells where | S N R | 1 .
Atmosphere 17 00873 g002
Figure 3. Seasonal changes (°C) in T m e a n over Türkiye: (a) DJF, RCM-MPI, GWTL 1.5 °C; (b) DJF, RCM-HG, GWTL 1.5 °C; (c) DJF, RCM-MPI, GWTL 2 °C; (d) DJF, RCM-HG, GWTL 2 °C; (e) MAM, RCM-MPI, GWTL 1.5 °C; (f) MAM, RCM-HG, GWTL 1.5 °C; (g) MAM, RCM-MPI, GWTL 2 °C; (h) MAM, RCM-HG, GWTL 2 °C; (i) JJA, RCM-MPI, GWTL 1.5 °C; (j) JJA, RCM-HG, GWTL 1.5 °C; (k) JJA, RCM-MPI, GWTL 2 °C; (l) JJA, RCM-HG, GWTL 2 °C; (m) SON, RCM-MPI, GWTL 1.5 °C; (n) SON, RCM-HG, GWTL 1.5 °C; (o) SON, RCM-MPI, GWTL 2 °C; and (p) SON, RCM-HG, GWTL 2 °C. DJF (December–January–February), MAM (March–April–May), JJA (June–July–August), and SON (September–October–November) denote winter, spring, summer, and autumn, respectively. Stippling indicates grid cells where | S N R | 1 .
Atmosphere 17 00873 g003
Figure 4. Changes (days/year) in tropical nights (TN) over Türkiye at GWTL 1.5 °C and 2 °C: (a) RCM-MPI at GWTL 1.5 °C, (b) RCM-HG at GWTL 1.5 °C, (c) RCM-MPI at GWTL 2 °C, and (d) RCM-HG at GWTL 2 °C. Stippling indicates grid cells where | S N R | 1 .
Atmosphere 17 00873 g004
Figure 5. Changes (periods/year) in discomfort index (DI) over Türkiye at GWTL 1.5 °C and 2 °C: (a) RCM-MPI at GWTL 1.5 °C, (b) RCM-HG at GWTL 1.5 °C, (c) RCM-MPI at GWTL 2 °C, and (d) RCM-HG at GWTL 2 °C. Stippling indicates grid cells where | S N R | 1 .
Atmosphere 17 00873 g005
Figure 6. Seasonal changes (%) in total precipitation (TP) over Türkiye: (a) DJF, RCM-MPI, GWTL 1.5 °C; (b) DJF, RCM-HG, GWTL 1.5 °C; (c) DJF, RCM-MPI, GWTL 2 °C; (d) DJF, RCM-HG, GWTL 2 °C; (e) MAM, RCM-MPI, GWTL 1.5 °C; (f) MAM, RCM-HG, GWTL 1.5 °C; (g) MAM, RCM-MPI, GWTL 2 °C; (h) MAM, RCM-HG, GWTL 2 °C; (i) JJA, RCM-MPI, GWTL 1.5 °C; (j) JJA, RCM-HG, GWTL 1.5 °C; (k) JJA, RCM-MPI, GWTL 2 °C; (l) JJA, RCM-HG, GWTL 2 °C; (m) SON, RCM-MPI, GWTL 1.5 °C; (n) SON, RCM-HG, GWTL 1.5 °C; (o) SON, RCM-MPI, GWTL 2 °C; and (p) SON, RCM-HG, GWTL 2 °C. DJF (December–January–February), MAM (March–April–May), JJA (June–July–August), and SON (September–October–November) denote winter, spring, summer, and autumn, respectively. Stippling indicates grid cells where | S N R | 1 .
Atmosphere 17 00873 g006
Figure 7. Changes (mm/day) in simple daily intensity index (SDII) over Türkiye at GWTL 1.5 °C and 2 °C: (a) RCM-MPI at GWTL 1.5 °C, (b) RCM-HG at GWTL 1.5 °C, (c) RCM-MPI at GWTL 2 °C, and (d) RCM-HG at GWTL 2 °C. Stippling indicates grid cells where | S N R | 1 .
Atmosphere 17 00873 g007
Figure 8. Changes (days/year) in extreme precipitation days (R90P) over Türkiye at GWTL 1.5 °C and 2 °C: (a) RCM-MPI at GWTL 1.5 °C, (b) RCM-HG at GWTL 1.5 °C, (c) RCM-MPI at GWTL 2 °C, and (d) RCM-HG at GWTL 2 °C. Stippling indicates grid cells where | S N R | 1 .
Atmosphere 17 00873 g008
Figure 9. Changes (periods/year) in dry periods lasting at least five consecutive days (CDD5) over Türkiye at GWTL 1.5 °C and 2 °C: (a) RCM-MPI at GWTL 1.5 °C, (b) RCM-HG at GWTL 1.5 °C, (c) RCM-MPI at GWTL 2 °C, and (d) RCM-HG at GWTL 2 °C. Stippling indicates grid cells where | S N R | 1 .
Atmosphere 17 00873 g009
Figure 10. Changes (days/year) in consecutive dry days (CDD) over Türkiye at GWTL 1.5 °C and 2 °C: (a) RCM-MPI at GWTL 1.5 °C, (b) RCM-HG at GWTL 1.5 °C, (c) RCM-MPI at GWTL 2 °C, and (d) RCM-HG at GWTL 2 °C. Stippling indicates grid cells where | S N R | 1 .
Atmosphere 17 00873 g010
Figure 11. Annual difference (°C) in T m e a n between GWTL 1.5 °C and 2 °C over Türkiye: (a) RCM-MPI, (b) RCM-HG. Stippling indicates grid cells where | S N R | 1 .
Atmosphere 17 00873 g011
Figure 12. Seasonal difference (°C) in T m e a n between GWTL 1.5 °C and 2 °C over Türkiye: (a) DJF, RCM-MPI; (b) DJF, RCM-HG; (c) MAM, RCM-MPI; (d) MAM, RCM-HG; (e) JJA, RCM-MPI; (f) JJA, RCM-HG; (g) SON, RCM-MPI; and (h) SON, RCM-HG. DJF (December–January–February), MAM (March–April–May), JJA (June–July–August), and SON (September–October–November) denote winter, spring, summer, and autumn, respectively. Stippling indicates grid cells where | S N R | 1 .
Atmosphere 17 00873 g012
Figure 13. Difference (days/year) in TN between GWTL 1.5 °C and 2 °C over Türkiye: (a) RCM-MPI, (b) RCM-HG. Stippling indicates grid cells where | S N R | 1 .
Atmosphere 17 00873 g013
Figure 14. Difference (periods/year) in DI between GWTL 1.5 °C and 2 °C over Türkiye: (a) RCM-MPI, (b) RCM-HG. Stippling indicates grid cells where | S N R | 1 .
Atmosphere 17 00873 g014
Figure 15. Seasonal difference (%) in TP between GWTL 1.5 °C and 2 °C over Türkiye: (a) DJF, RCM-MPI; (b) DJF, RCM-HG; (c) MAM, RCM-MPI; (d) MAM, RCM-HG; (e) JJA, RCM-MPI; (f) JJA, RCM-HG; (g) SON, RCM-MPI; and (h) SON, RCM-HG. DJF (December–January–February), MAM (March–April–May), JJA (June–July–August), and SON (September–October–November) denote winter, spring, summer, and autumn, respectively. Stippling indicates grid cells where | S N R | 1 .
Atmosphere 17 00873 g015
Figure 16. Difference (mm/day) in SDII between GWTL 1.5 °C and 2 °C over Türkiye: (a) RCM-MPI, (b) RCM-HG. Stippling indicates grid cells where | S N R | 1 .
Atmosphere 17 00873 g016
Figure 17. Difference (days/year) in R90P between GWTL 1.5 °C and 2 °C over Türkiye: (a) RCM-MPI, (b) RCM-HG. Stippling indicates grid cells where | S N R | 1 .
Atmosphere 17 00873 g017
Figure 18. Difference (periods/year) in CDD5 between GWTL 1.5 °C and 2 °C over Türkiye: (a) RCM-MPI, (b) RCM-HG. Stippling indicates grid cells where | S N R | 1 .
Atmosphere 17 00873 g018
Figure 19. Difference (days/year) in CDD between GWTL 1.5 °C and 2 °C over Türkiye: (a) RCM-MPI, (b) RCM-HG. Stippling indicates grid cells where | S N R | 1 .
Atmosphere 17 00873 g019
Table 1. Definitions of climate indicators.
IndexDescriptionDefinitionUnit
Temperature Indices
T m e a n Mean TemperatureMean air temperature°C
TNTropical NightsDays when the daily minimum air temperature is above 20 °Cdays
DIDiscomfort IndexIt is one of the indices of thermal comfort that determines the level of human discomfort based on a combination of climate, ambient temperature and relative humidity, and is the most convenient and common method of calculating discomfort in a particular day, time, and place.period (3 h)
Precipitation Indices
TPTotal PrecipitationAccumulated precipitationmm
SDIISimple Daily Intensity IndexDefines the mean precipitation intensity of wet days. Days with more than 1 mm of precipitation per day are defined as wet days.mm/day
R90PExtreme Precipitation DaysThe sum of the number of days per year above a threshold for wet days. The threshold value is calculated as the 90th percentile of the distribution of daily precipitation amounts on days with 1 mm or more of precipitation in the reference period.days
CDD5Dry Periods Lasting At Least Five Consecutive DaysNumber of periods in which precipitation is less than 1 mm for at least 5 consecutive days.periods
CDDConsecutive Dry DaysAnnual maximum length of a dry spell with daily precipitation below 1 mm.days
Disclaimer/Publisher’s Note: The statements, opinions and data contained in all publications are solely those of the individual author(s) and contributor(s) and not of MDPI and/or the editor(s). MDPI and/or the editor(s) disclaim responsibility for any injury to people or property resulting from any ideas, methods, instructions or products referred to in the content.