1. Introduction
Drought is a recurring hydroclimatic hazard that impacts various components of the terrestrial water cycle. A precipitation deficit often manifests initially as meteorological drought, which can then extend into soil moisture, hydrological, ecological, and agricultural droughts. However, the timing, persistence, and severity of this progression can vary substantially [
1,
2]. Soil moisture plays a crucial role as it connects atmospheric water supply and evaporative demand with land-surface processes, vegetation stress, and the availability of water within the soil profile. Unlike precipitation alone, soil moisture reflects prior hydroclimatic conditions and land-surface memory, and its dynamics are further influenced by soil characteristics, vegetation, evapotranspiration, seasonality, and the intensity and timing of rainfall events [
3]. Therefore, a meteorological drought index cannot be expected to represent soil moisture drought uniformly across different climatic regimes, locations, or temporal scales.
The Standardized Precipitation Evapotranspiration Index (SPEI) is widely used for drought monitoring because it integrates precipitation with atmospheric evaporative demand while retaining a multiscalar structure [
4,
5]. This characteristic enables the characterization of drought conditions across a range of accumulation periods, from short-term climatic anomalies to prolonged water deficits. While the multiscalar nature is a major strength of the SPEI, it also presents a critical methodological challenge: the chosen accumulation period directly impacts the timing, persistence, and spatial extent of the drought signal. Short accumulation periods respond quickly to recent variations in climatic water balance, whereas longer periods tend to smooth out short-term fluctuations while incorporating influences from preceding months. Therefore, the most appropriate SPEI timescale is not an inherent characteristic of the index; rather, it depends on the hydrological variable and soil layer under consideration, as well as regional climate factors and specific monitoring objectives.
The importance of this issue is particularly pronounced when considering SPEI as a proxy for soil moisture drought. Prior observational and model-based studies have demonstrated that meteorological drought indices can capture essential components of soil moisture variability; however, their correlation varies substantially depending on factors such as soil depth, climate, season, dataset, and accumulation timescale. For instance, Yuan et al. [
6] illustrated that SPEI and several other meteorological drought indices tend to correlate more strongly with shallow soil moisture than with deeper soil conditions, and the strength of this relationship is influenced by the environmental context. Similarly, Hoffmann et al. [
7] indicated that the characterization of drought is not only sensitive to the choice of index but also to the datasets employed, warning against the assumption that a single index configuration consistently offers the optimal representation of land-surface drought. Analyzing 2405 observed soil moisture time series from 637 monitoring stations, Hoylman et al. [
8] found that the timescales of meteorological indices linked to soil moisture deficits generally extend with increasing soil depth, and reported characteristic timescales on the order of 10–80 days across the soil depths examined. More recently, Lu et al. [
9] highlighted notable spatial and seasonal variations in SPEI’s effectiveness at detecting soil moisture-based agricultural drought across China, where shorter accumulation periods generally correspond more closely to near-surface soil moisture, but the characteristic timescale lengthens towards the more arid northwest. Collectively, these studies suggest that using a predetermined SPEI timescale without assessing its relationship to the specific soil moisture state can result in inconsistent or mismatched drought characterizations.
The timescale issue may be particularly important in arid environments. Under conditions of limited and highly variable rainfall, individual precipitation events can produce rapid changes in near-surface soil moisture, followed by relatively fast drydown as water is lost through evapotranspiration, drainage, and redistribution. Global satellite observations have shown that surface soil moisture drydown timescales generally decrease with increasing aridity, indicating a particularly rapid land-surface response in dry environments [
10]. Similarly, Rondinelli et al. [
11] demonstrated that the near-surface soil layer can dry substantially faster after rainfall than deeper soil layers, highlighting the short response time of the soil layer most closely represented by satellite surface soil moisture products. At the same time, antecedent moisture conditions impart a memory effect on the land surface, such that soil moisture anomalies do not necessarily develop or recover synchronously with meteorological forcing. Observational analyses have shown that soil moisture persistence depends on the antecedent soil-water state, precipitation regime, vegetation characteristics, and interactions between current soil moisture and subsequent atmospheric forcing [
12]. Soil properties further modify this memory. In particular, Martínez-Fernández et al. [
13] demonstrated that soil moisture memory varies systematically with soil texture, organic-matter content, and soil-water storage conditions, with especially strong effects associated with soil sand fraction.
These competing processes can create a mismatch between the relatively rapid response of surface soil moisture and the progressively smoother climatic water-balance signal represented by longer SPEI accumulation periods. Consequently, the meteorological timescale that best corresponds to surface soil moisture can be expected to vary geographically, even within the same arid country, as precipitation regime, evaporative conditions, soil properties, vegetation, elevation, and other land-surface characteristics change. Global analyses of surface soil moisture drydowns similarly reveal substantial spatial variation in drying behavior and emphasize the influence of land-surface and climatic conditions on soil moisture dynamics [
14]. Empirically establishing this correspondence is therefore essential if SPEI is to be used not only to characterize meteorological drought but also as an indicator of land-surface moisture stress.
Saudi Arabia provides a suitable testbed for exploring this issue. The country is largely arid, but displays marked hydroclimatic diversity, including pronounced spatial gradients in rainfall, considerable interannual variability, and a relatively wetter southwestern highland region compared with the central, northern, and southeastern interiors [
15]. Previous studies have documented substantial spatial and temporal variability in rainfall and drought across the Kingdom [
16,
17]. Recent research has also assessed drought over multiple accumulation periods, confirming that drought behaviors and trends are not uniform across Saudi Arabia [
17]. However, most prior evaluations have concentrated on characterizing meteorological drought itself. In contrast, considerably less attention has been given to whether commonly used SPEI accumulation periods effectively reflect observed or independently derived surface soil moisture conditions throughout the Kingdom. This distinction is crucial, as the accumulation period that best illustrates climatic water-balance anomalies may not necessarily be the one that accurately represents short-term land-surface moisture deficits.
This study evaluates the spatiotemporal relationship between the Standardized Precipitation–Evapotranspiration Index (SPEI) and surface soil moisture drought across Saudi Arabia during 2003–2024, with emphasis on SPEI accumulation periods of 1, 3, and 6 months. Specifically, the study aims to: (1) assess the temporal and spatial correspondence between SPEI-1, SPEI-3, and SPEI-6 and surface soil moisture drought; (2) quantify spatial variations in the strength of the relationship between each SPEI timescale and soil moisture conditions at the grid-cell level; (3) evaluate and compare the ability of the three SPEI timescales to discriminate surface soil moisture drought using receiver operating characteristic (ROC) analysis; and (4) identify the best-performing SPEI accumulation period across the study domain and determine whether the preferred timescale varies geographically. These objectives provide a systematic basis for selecting and interpreting SPEI accumulation periods for drought monitoring in arid environments, rather than assuming that a single timescale is universally representative of land-surface moisture conditions.
2. Materials and Methods
2.1. Study Area
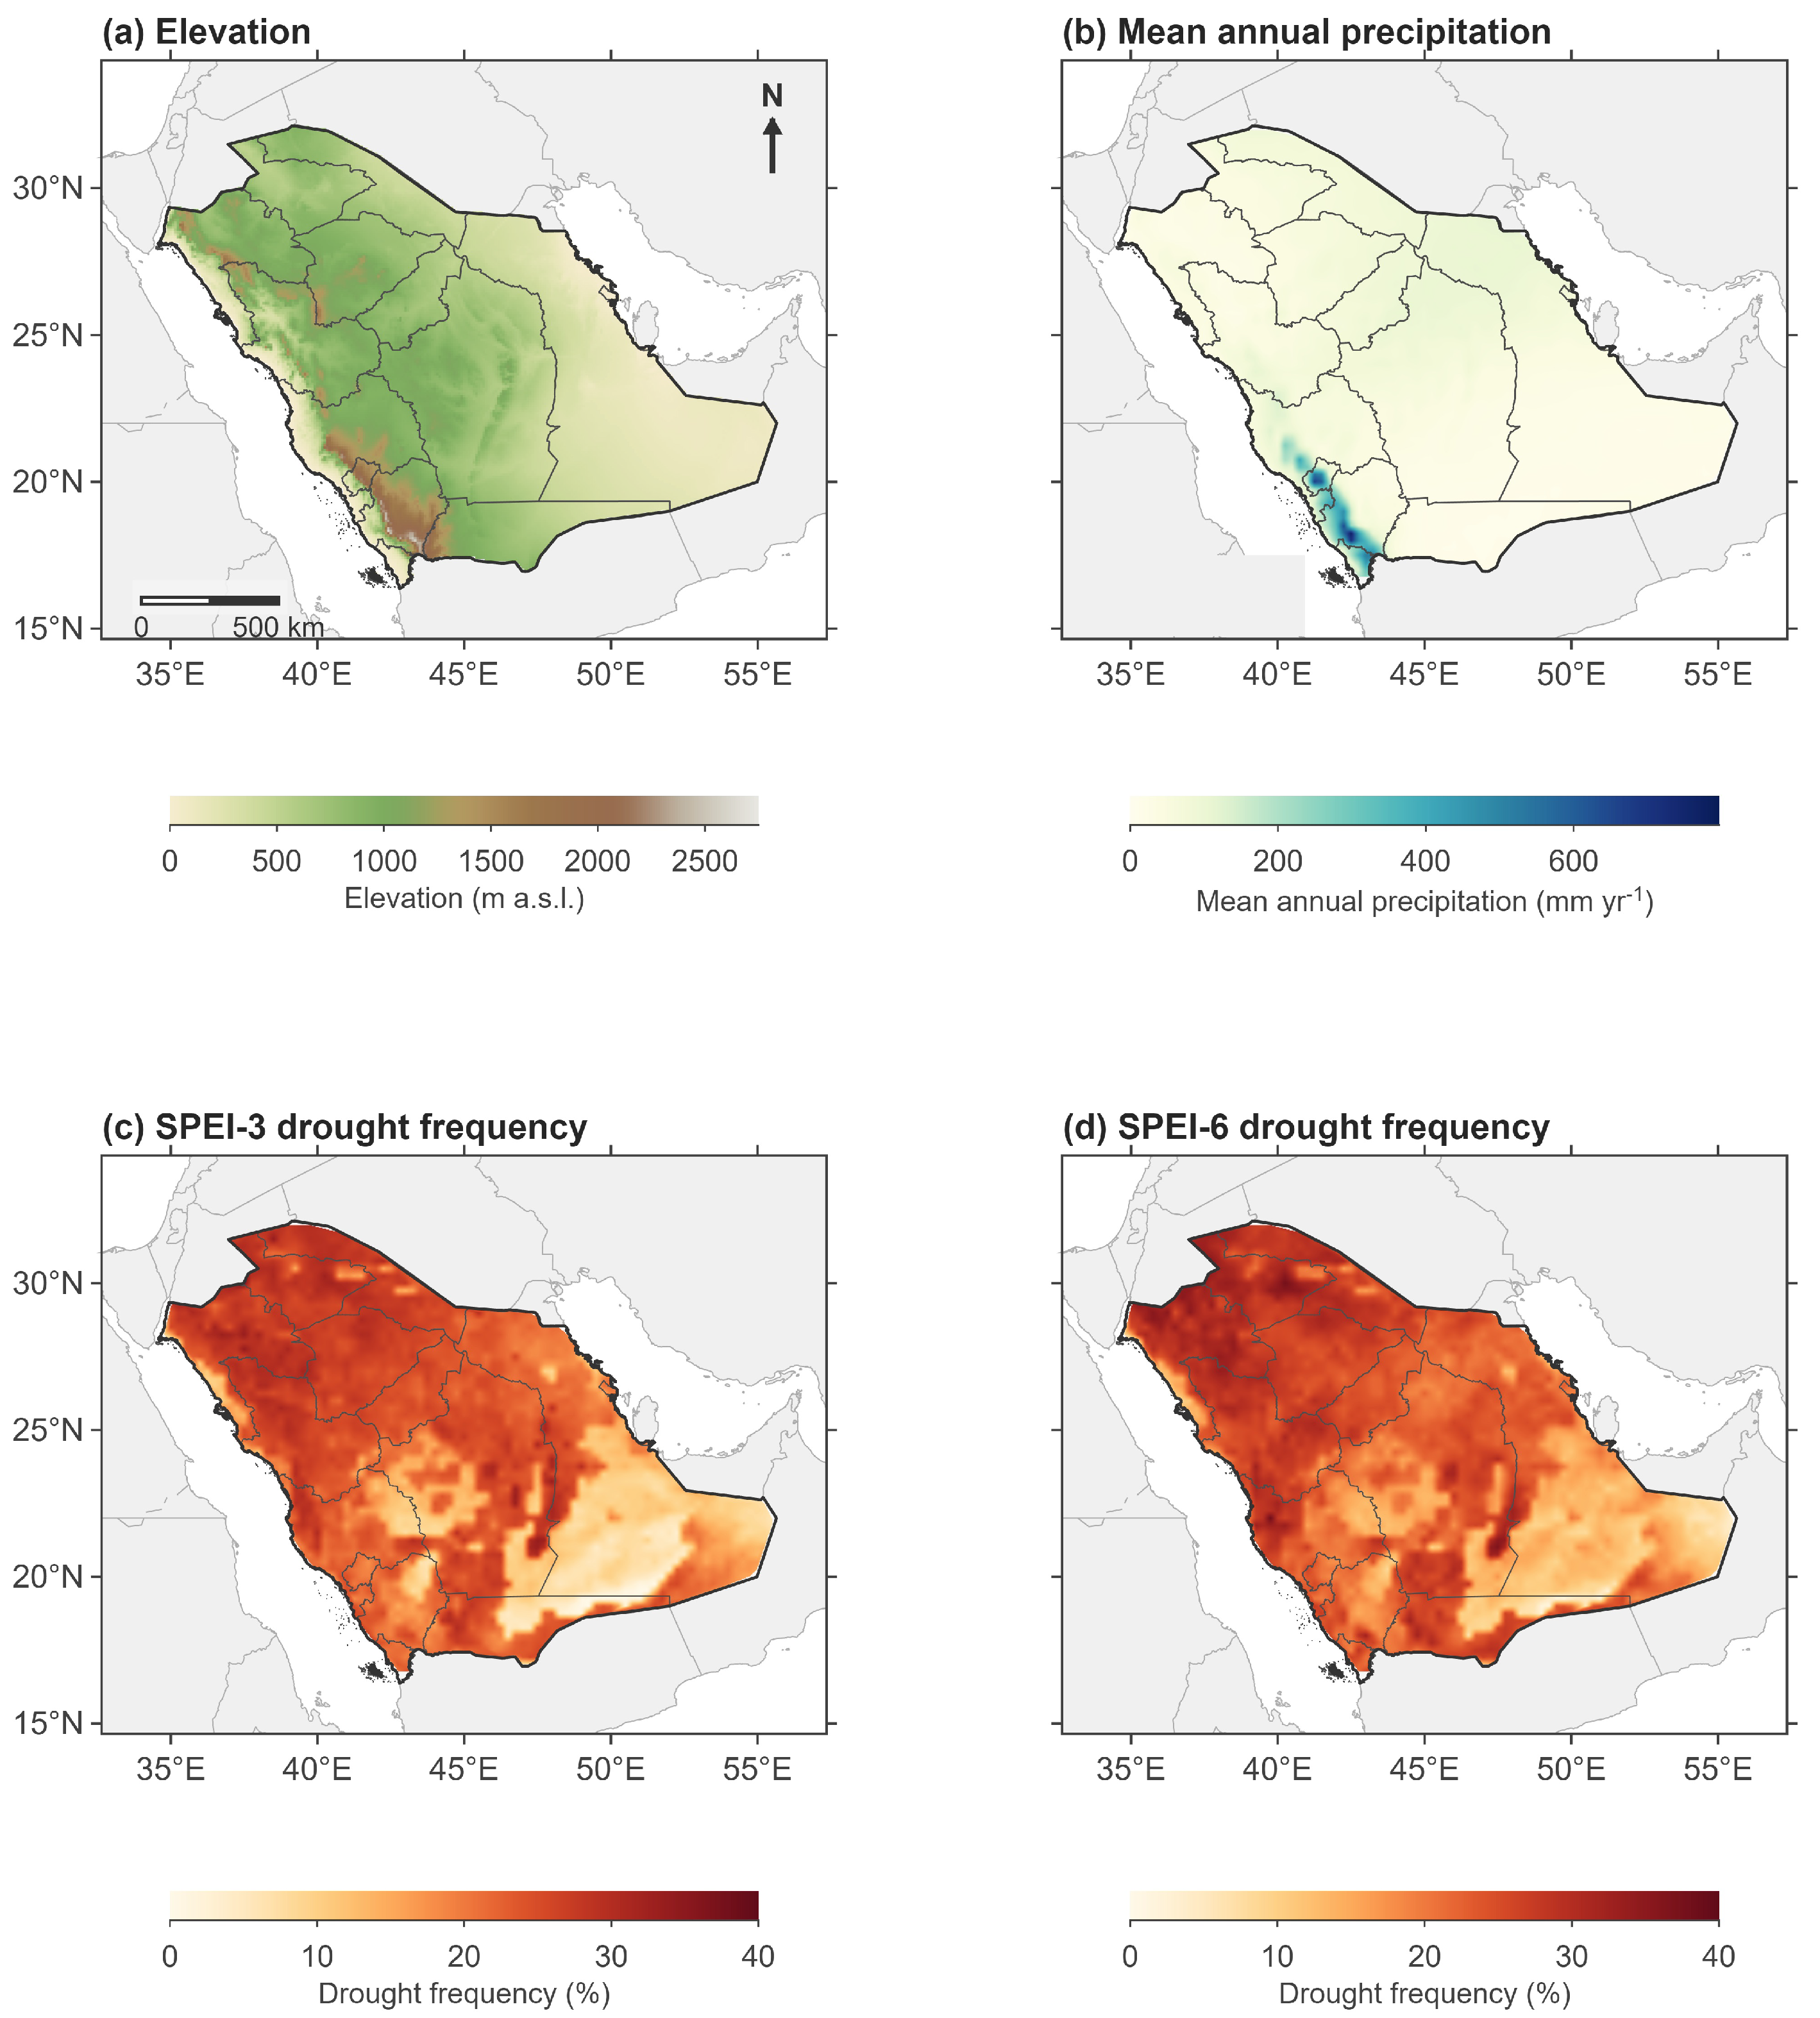
The study focuses on the Kingdom of Saudi Arabia (
Figure 1), which is predominantly characterized by arid to hyper-arid conditions and pronounced spatial variability in topography, precipitation, temperature, atmospheric evaporative demand, and land-surface characteristics [
15,
16,
18]. Elevation varies substantially across the country (
Figure 1a), from the low-lying Red Sea and Arabian Gulf coastal plains to the Hijaz–Asir mountain system in the west and southwest, where elevations approach 3000 m. The interior is dominated by the Najd Plateau and extensive desert landscapes, whereas lower-relief plains characterize much of eastern Saudi Arabia [
18,
19].
These topographic contrasts contribute to a strong spatial gradient in precipitation (
Figure 1b). Central, northern, and eastern Saudi Arabia generally receive limited and highly variable rainfall, whereas the southwestern highlands are comparatively wetter because of their higher elevations and greater influence of seasonal moisture transport [
15,
16,
17,
19]. Precipitation also exhibits pronounced interannual variability, with substantial differences between relatively wet and dry years, which is a defining feature of the country’s arid hydroclimate [
15,
16]. The spatial distributions of SPEI-3 and SPEI-6 drought frequency (
Figure 1c,d) further illustrate the hydroclimatic contrasts across the country and provide context for evaluating the correspondence between meteorological drought and near-surface soil moisture conditions.
Soil characteristics are likewise heterogeneous. Sandy soils are widespread across much of Saudi Arabia, together with loam and sandy-loam soils [
20], while calcareous and saline soil profiles occur in several agricultural regions [
21]. Differences in soil texture, depth, infiltration capacity, and water-holding capacity directly influence the response and persistence of near-surface soil moisture following precipitation [
3]. These soil contrasts are particularly relevant to the shallow surface layer represented by satellite microwave soil moisture retrievals.
The combined variability in topography, precipitation, drought occurrence, and soil characteristics therefore provides a suitable setting for assessing whether a single meteorological drought accumulation timescale can consistently represent near-surface soil moisture variability across diverse arid environments.
The analysis covers January 2003 to December 2024. National and first-order administrative boundaries were used for spatial masking and cartographic representation. All quantitative statistics were calculated directly from the underlying grid-cell values. Spatial interpolation was used only for visualization in selected maps and was not used to calculate correlations, ROC-AUC values, drought frequencies, or best-performing SPEI timescales.
2.2. Datasets
Surface soil moisture data were obtained from the European Space Agency’s Climate Change Initiative Soil Moisture (ESA CCI SM) COMBINED climate data record, version 09.2 [
22]. The product integrates retrievals from multiple active and passive microwave sensors and is provided on a regular
grid [
23,
24]. Microwave retrievals primarily represent moisture conditions within approximately the uppermost 2–5 cm of the soil column [
23]. ESA CCI SM was selected because it provides an observationally constrained measure of surface moisture that is methodologically independent of the ERA5-based atmospheric water-balance information used to derive SPEI. Accordingly, the results are interpreted specifically in relation to surface soil moisture drought rather than moisture conditions throughout the full soil profile.
SPEI was obtained from the ERA5–Drought dataset [
25], which derives global drought indices from ERA5 reanalysis [
26]. The climatic water balance is defined as monthly precipitation minus potential evapotranspiration (
), with PET estimated using the Penman–Monteith parameterization. Accumulated
series are fitted with a three-parameter log-logistic distribution and transformed to standardized values following Vicente-Serrano et al. [
4] and Beguería et al. [
5]. ERA5–Drought uses 1991–2020 as the reference period for distribution fitting and provides monthly SPEI at a native spatial resolution of
.
ERA5-derived SPEI has previously been applied to characterize drought variability across the Arabian Peninsula [
27,
28]. As a reanalysis-based product, its uncertainty reflects uncertainties in ERA5 precipitation and PET inputs, particularly where observational constraints are sparse or topography is complex [
25,
26]. In this study, SPEI-1, SPEI-3, and SPEI-6 were derived consistently from the same ERA5–Drought product and evaluated against the independent ESA CCI soil moisture record [
23,
24]. The analysis therefore emphasizes relative differences among SPEI accumulation periods rather than assuming an error-free representation of meteorological drought.
Three accumulation periods were analyzed: SPEI-1, SPEI-3, and SPEI-6. These represent progressively longer climatic-memory windows while remaining relevant to the comparatively rapid response of near-surface soil moisture. Their correspondence with surface soil moisture was therefore evaluated empirically rather than selecting a single timescale a priori [
6,
8,
9].
ERA5 precipitation was additionally used to characterize the hydroclimatic setting and calculate long-term mean annual precipitation [
26]. It was not used directly in the cell-level SPEI–soil moisture correlations or ROC-AUC rankings. The resulting hydroclimatic context is shown in
Figure 1.
All data processing, statistical analyses, and figure generation were performed using MATLAB R2025b.
2.3. Data Harmonization and Spatial Coverage
Gridded soil moisture and SPEI records were harmonized spatially and temporally prior to analysis. The three SPEI timescales were aligned to the ESA CCI SM grid before cell-level matching, with bilinear interpolation applied where spatial resampling was required. Missing observations were retained as missing; no temporal gap filling or smoothing was performed.
Cell-level correspondence and drought-discrimination analyses were limited to locations with at least 60 paired monthly observations (). This criterion retained 1462 grid cells, corresponding to 53.4% of the 2736 grid cells intersecting the Saudi national analysis domain on the grid. The minimum-support criterion was used to avoid estimating cell-level correlations and ROC-AUC values from excessively short or substantially incomplete records.
To assess the spatial representativeness of the primary analytical domain, the distribution of was evaluated across all 2736 grid cells and summarized by first-order administrative region. Long-term mean annual precipitation was compared descriptively between retained () and excluded () cells to characterize hydroclimatic differences in observational support. Sensitivity to the minimum-support criterion was evaluated by repeating the principal cell-level performance summaries using less restrictive thresholds of and .
The potential contribution of permanent water to spatial exclusion was assessed using the ERA5 static land–sea mask, regridded to the common analysis grid. For this diagnostic, cells with a land fraction below 0.50 were classified as water-dominated. The spatial distribution of observational support is mapped in
Supplementary Figure S1, while national coverage and land–sea-mask diagnostics and sensitivity to the minimum-support criterion are summarized in
Supplementary Table S2. Because observational availability was spatially nonuniform, national-scale interpretations refer to the observed analytical domain rather than assuming uniform representation of the entire national territory.
2.4. Surface Soil Moisture Drought Definition and SPEI Timescales
Absolute volumetric soil moisture values are not directly comparable across locations because their distributions depend on soil properties, surface characteristics, vegetation, climate, and satellite-retrieval behavior. Soil moisture percentiles provide a relative measure of local wetness or dryness and are therefore commonly used for drought monitoring and intercomparison across heterogeneous environments [
6,
29].
Monthly soil moisture percentiles, denoted
for grid cell
g and month
t, were computed separately for each calendar month using the empirical distribution of that calendar month across all available years. This calendar-month-specific construction removes the mean seasonal cycle before drought classification and places soil moisture anomalies on a seasonally comparable basis with standardized SPEI. Smaller percentile values indicate relatively drier surface conditions. Surface soil moisture drought was defined using the lower 20th percentile,
where
is the indicator function. Thus,
denotes a surface soil moisture drought month and
denotes a non-drought month. This indicator is referred to as SM20 in the figures. A 20th-percentile threshold is consistent with established percentile-based soil moisture drought monitoring approaches, including the categorical scheme used operationally by the U.S. Drought Monitor, and provides a relative definition that avoids imposing a single volumetric-water-content threshold across hydroclimatically and edaphically heterogeneous locations [
29,
30].
For SPEI, three accumulation periods were evaluated,
months. SPEI-1 emphasizes short-term climatic water-balance anomalies, whereas SPEI-3 and SPEI-6 progressively integrate longer antecedent conditions [
4,
5,
25]. The three timescales were evaluated independently rather than assuming that a longer or shorter accumulation period should necessarily correspond better with surface soil moisture.
Two distinct uses of SPEI were maintained throughout the analysis. For descriptive drought-frequency and drought-extent comparisons, meteorological drought was defined as
where
denotes SPEI accumulated over
k months. The threshold of
represents moderate-or-more-severe meteorological drought under the conventional SPEI classification [
4]. It should be noted that this threshold corresponds to approximately the 15.9th percentile of a standard normal distribution, whereas the soil moisture drought definition in Equation (
1) uses the 20th percentile. The two drought-extent series therefore differ in expected mean frequency by approximately four percentage points by construction, and this offset is accounted for when interpreting the absolute-disagreement statistics in
Section 3.1.
In contrast, the continuous SPEI values were retained for the correlation and ROC analyses. This separation avoided discarding information by unnecessarily converting SPEI to a binary variable when evaluating continuous correspondence or discrimination.
To assess sensitivity to the soil moisture drought definition, the threshold-dependent analyses were repeated using lower 10th- and 30th-percentile thresholds (SM10 and SM30), in addition to the primary 20th-percentile definition (SM20). For each threshold, the temporal drought-extent comparison, ROC-AUC analysis, identification of the best-performing AUC-based timescale, and regional majority classification were recomputed using otherwise identical procedures. The cell-level Spearman correlation analysis was not repeated because it uses the continuous soil moisture percentile rather than the binary drought classification and is therefore independent of the selected drought threshold. Throughout the manuscript, SM10, SM20, and SM30 refer exclusively to soil moisture percentile thresholds, whereas SPEI drought extent is defined consistently using unless explicitly stated otherwise.
2.5. Temporal and Spatial Correspondence Analysis
Temporal correspondence was evaluated by comparing the monthly spatial extent of surface soil moisture drought with the corresponding extent identified by each SPEI timescale. Because ESA CCI soil moisture availability varies among months, all four drought-extent series were calculated using the same matched spatial support within each month. Let
denote the set of grid cells containing valid soil moisture information and valid SPEI-1, SPEI-3, and SPEI-6 values in month
t. Surface soil moisture drought extent was calculated as
and the drought extent for accumulation period
k was calculated as
Both quantities therefore represent the percentage of the observed analysis domain classified as drought in a given month rather than the percentage of the entire national territory. Using identical monthly spatial support prevents changes in satellite coverage from being misinterpreted as differences between drought indicators.
Temporal correspondence between
and
was assessed using Spearman’s rank correlation coefficient,
, because the relationship between drought extents was not assumed to be linear. Absolute disagreement in spatial extent was additionally quantified using the mean absolute error,
where
T is the number of months with valid matched spatial support. The resulting
values were expressed in percentage points and are summarized in
Table 1. Because the monthly drought-extent series exhibit temporal autocorrelation and seasonal structure, uncertainty in the domain-level Spearman correlations was quantified using a moving-block bootstrap with a block length of 12 months and 1000 resamples. Percentile-based 95% confidence intervals were derived from the resulting bootstrap distributions. A domain-level correlation was considered statistically supported when its 95% confidence interval excluded zero. No moving averages, temporal interpolation, or other smoothing procedures were applied to the monthly series. The proportion of the spatial domain represented by the matched support,
, was retained throughout the analysis as a diagnostic of temporal coverage.
Spatial correspondence was evaluated independently for each grid cell using the continuous monthly variables. For accumulation period
k, cell-level correspondence was defined as
where
denotes Spearman’s rank correlation calculated over all months for which both variables were available. Positive values indicate that relatively wet soil moisture states correspond to higher (wetter) SPEI values, whereas weak or negative values indicate poorer correspondence. Only cells with at least 60 paired observations were included, resulting in 1462 cells in the primary spatial analysis. Cell-level distributions were summarized using the median, interquartile range, and 5th–95th percentile range rather than relying solely on national averages.
To quantify uncertainty in the cell-level correlations while accounting for temporal dependence, the moving-block bootstrap was also applied independently to each grid-cell–timescale combination. The January 2003–December 2024 monthly sequence was resampled using contiguous 12-month blocks, with 1000 bootstrap resamples. Missing observations were retained as missing, and the Spearman correlation in each bootstrap realization was calculated using only the shared valid soil moisture and SPEI observations. Percentile-based 95% confidence intervals were then obtained from the bootstrap distribution of . A cell-level correlation was classified as having statistically supported positive correspondence when its 95% confidence interval lay entirely above zero and statistically supported negative correspondence when the interval lay entirely below zero; intervals containing zero were interpreted as providing no clear statistical evidence that the correlation differed from zero.
Previous studies have demonstrated that the relationship between meteorological drought indices and soil moisture can vary substantially with location, soil depth, climate, and accumulation period, motivating this cell-specific approach [
6,
8,
9].
For visualization of the continuous cell-level correlation fields, natural-neighbor interpolation was used only to produce smooth map surfaces. Interpolated locations farther than 40 km from an analyzed grid cell were masked to avoid visually extending results into areas without adequate observational support. All numerical summaries, confidence intervals, and comparisons were calculated from the original grid-cell statistics and not from the interpolated surfaces.
2.6. Drought Discrimination Analysis
Correlation measures the monotonic correspondence between the full ranges of SPEI and soil moisture but does not directly indicate how effectively a given SPEI timescale distinguishes months experiencing soil moisture drought. A complementary receiver operating characteristic (ROC) analysis was therefore performed for each grid cell and SPEI accumulation period [
31].
The binary response was the surface soil moisture drought indicator defined in Equation (
1),
. Because increasingly negative SPEI values represent greater meteorological dryness, the discrimination score was defined as
Higher scores therefore consistently represent greater dryness. For each grid cell and timescale, the ROC curve describes the sensitivity–false-positive-rate trade-off obtained as the decision threshold on
varies. Drought-discrimination ability was summarized using the area under the ROC curve (ROC-AUC) [
31].
An AUC of 0.5 indicates no rank-based discrimination between soil moisture drought and non-drought months, whereas values increasingly above 0.5 indicate that drier SPEI conditions occur preferentially during months classified as surface soil moisture drought. AUC was treated as a continuous measure; no arbitrary “poor”, “moderate”, or “good” performance classes were imposed. The objective was to compare relative discrimination among SPEI-1, SPEI-3, and SPEI-6 under the same observational support rather than to perform independent hypothesis tests for each grid cell.
It is important to recognize that cell-level AUC estimates carry appreciable sampling uncertainty. At the minimum support criterion of 60 paired months, a 20th-percentile drought definition yields approximately 12 drought and 48 non-drought months, for which the standard error of an AUC near 0.63 is of order 0.08. The magnitude of AUC differences between competing timescales was therefore interpreted cautiously, particularly where differences were small relative to this sampling variability.
2.7. Spatial Identification of the Best-Performing SPEI Timescale
The final analysis evaluated whether one of the three tested accumulation periods consistently provided the strongest representation of surface soil moisture drought. Because correlation and ROC-AUC quantify different aspects of correspondence, the best-performing timescale was identified separately according to each criterion.
For drought discrimination, the best-performing evaluated accumulation period at grid cell
g was
Exact ties between two accumulation periods occurred in 12 of the 1462 analyzed cells (0.82%); no three-way ties occurred. These ties were resolved in favor of the shorter accumulation period. The strength of this selection was evaluated using the difference between the highest and second-highest AUC,
where
and
are respectively the largest and second-largest AUC values among SPEI-1, SPEI-3, and SPEI-6. This quantity is important because selecting the largest AUC alone can imply a meaningful preference even when competing accumulation periods perform almost identically.
To assess whether differences among the candidate timescales were supported beyond nominal ranking, paired moving-block bootstrap comparisons were performed for both ROC-AUC and Spearman correlation. For each grid cell, the same resampled monthly indices were applied simultaneously to the soil moisture and SPEI-1, SPEI-3, and SPEI-6 series using contiguous 12-month blocks and 1000 bootstrap resamples. Pairwise differences were calculated for SPEI-1 versus SPEI-3, SPEI-1 versus SPEI-6, and SPEI-3 versus SPEI-6, and percentile-based 95% confidence intervals were obtained from the resulting bootstrap distributions. A pairwise difference was considered clearly supported when its 95% confidence interval excluded zero.
A cell was classified as having a uniquely supported best-performing timescale only when its nominally highest-performing timescale exceeded both alternatives according to the corresponding pairwise bootstrap confidence intervals. Otherwise, the cell was classified as having no uniquely supported winner. This inferential assessment was used to distinguish statistical support from the descriptive
classifications shown in the best-performing-timescale maps. Detailed pairwise results are provided in
Supplementary Table S3.
A separate best-performing timescale was identified from the cell-level Spearman correlations,
Agreement between the two criteria was then defined as
Mapping , , , and allowed the spatial consistency and robustness of timescale selection to be examined. All quantities in this analysis were displayed at their native analysis-cell locations without spatial interpolation, smoothing, or extrapolation.
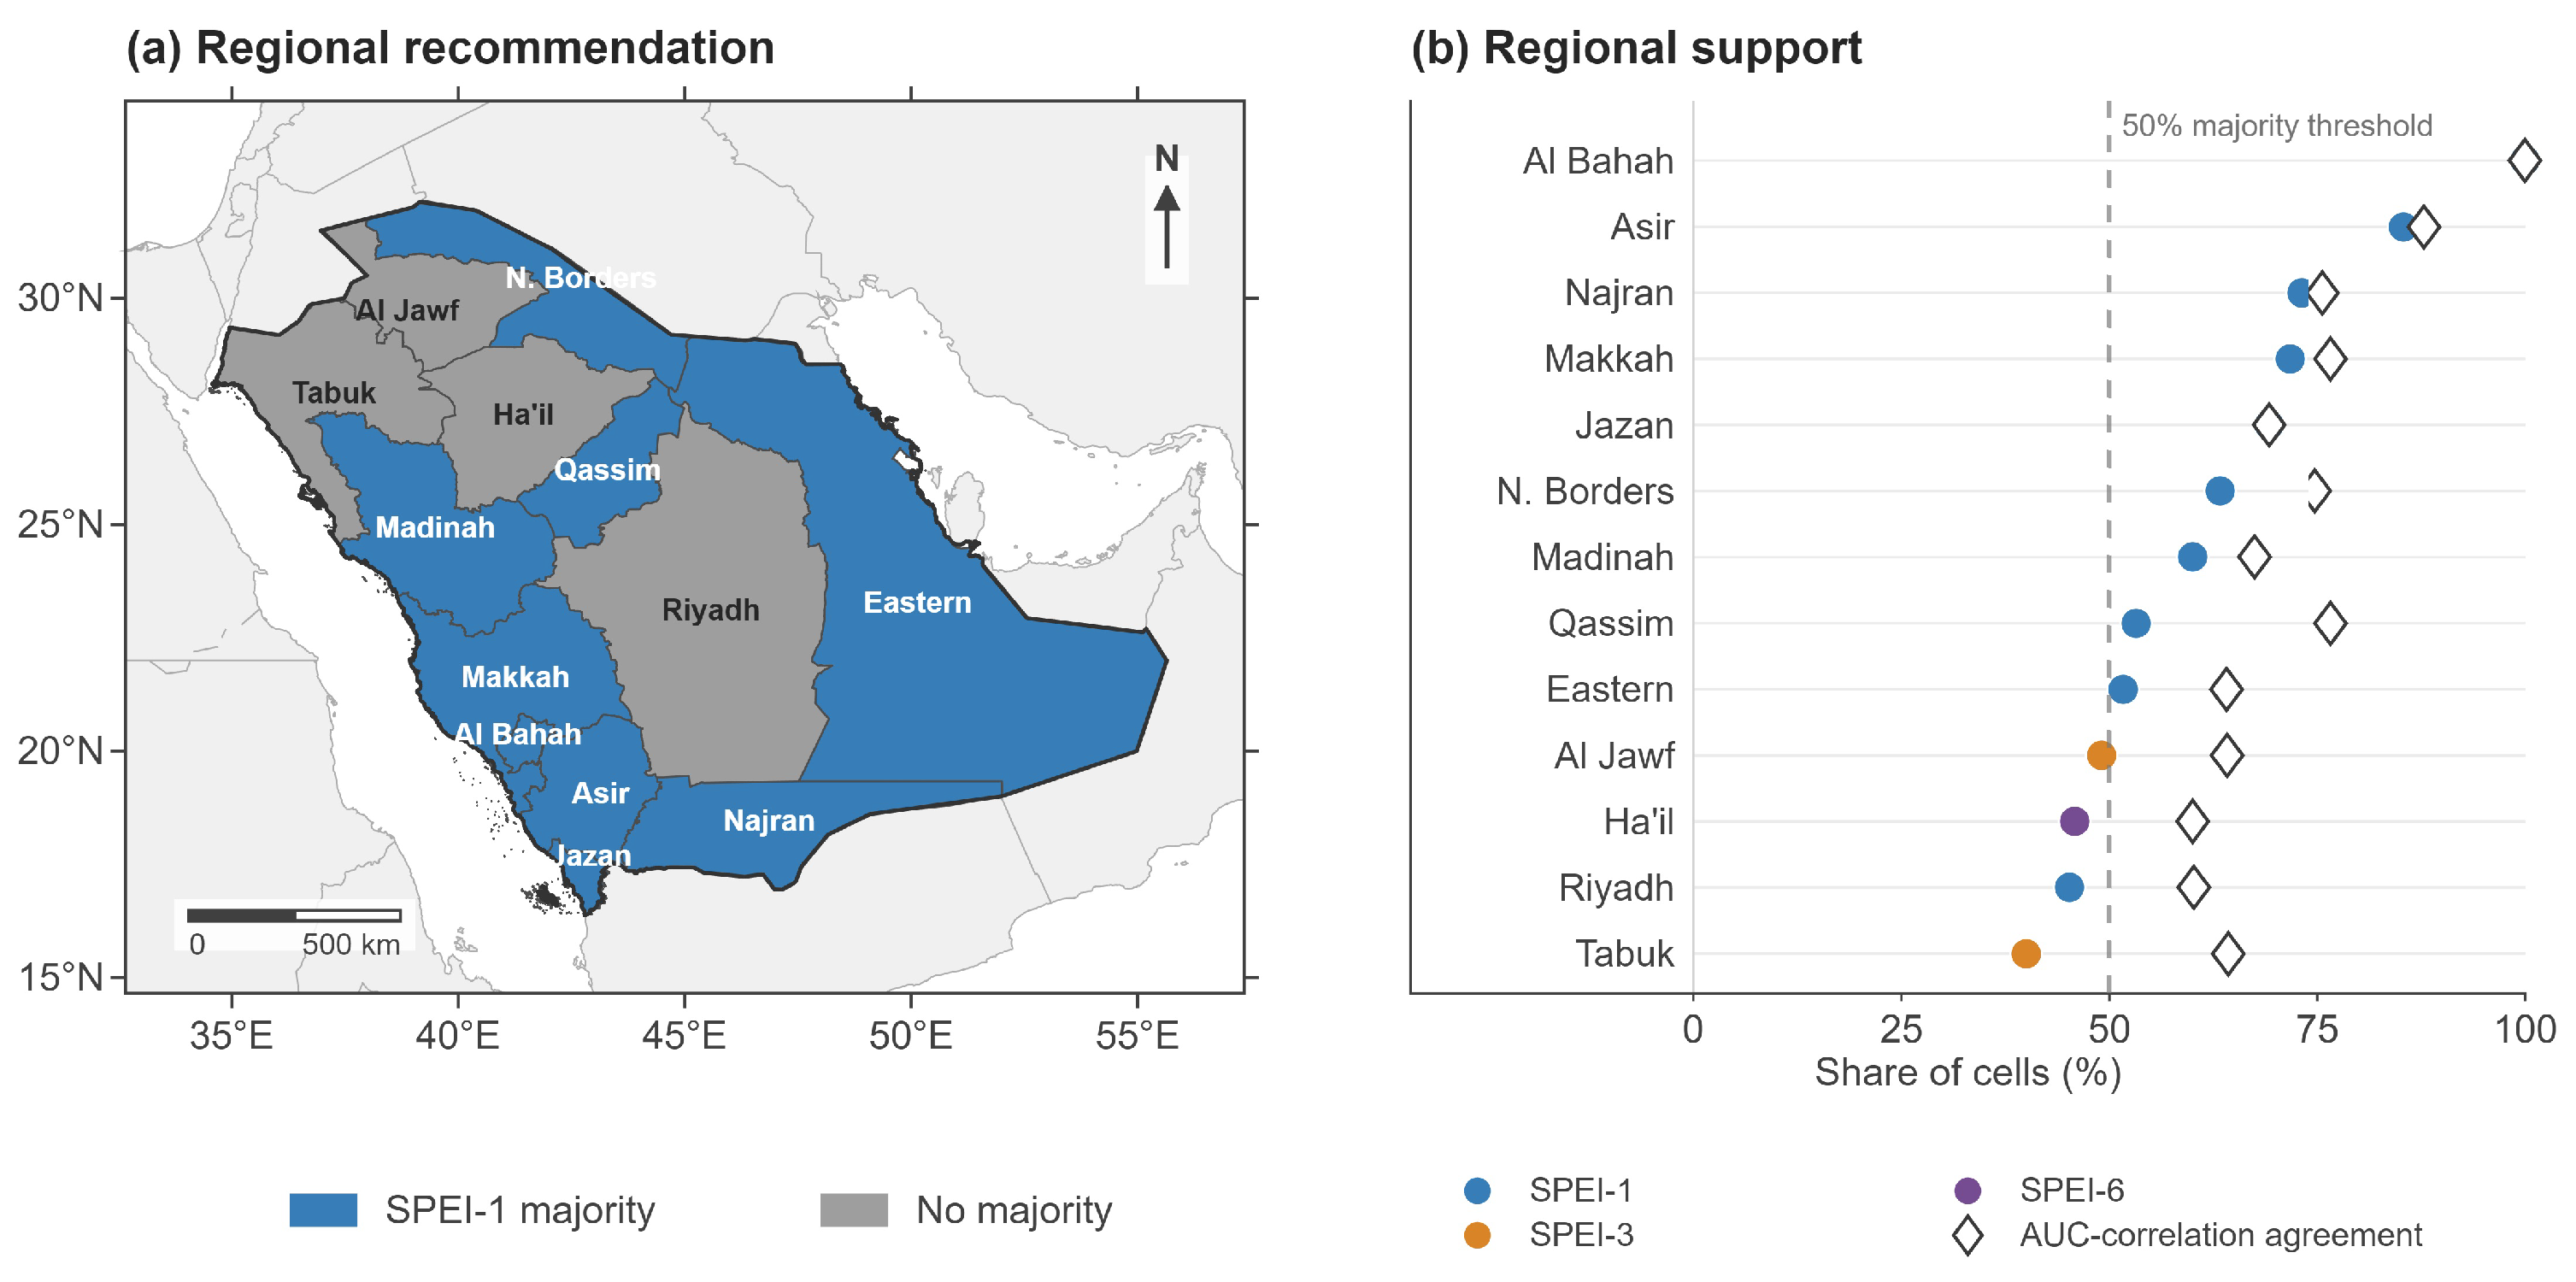
For regional interpretation, the cell-level AUC-based classifications were aggregated by first-order administrative region. A region was assigned a preferred SPEI timescale only when that accumulation period was the nominal highest-AUC timescale in more than 50% of the analyzed grid cells within the region. Regions in which no timescale exceeded this majority threshold were classified as Mixed. Regional Agreement was defined as the percentage of analyzed grid cells for which the AUC-based and correlation-based classifications selected the same SPEI accumulation period.
The term best-performing is used deliberately rather than optimal. Selection was conditional on the three accumulation periods evaluated in this study and on the two specified performance criteria. Consequently, a cell classified as SPEI-1, SPEI-3, or SPEI-6 indicates the strongest performance among the evaluated candidates; it does not imply that the selected timescale is universally optimal or statistically distinguishable from every alternative. The combined use of correlation, ROC-AUC, and the AUC margin provides complementary information on continuous correspondence, drought-state discrimination, and the strength of timescale preference [
6,
8,
9,
31].
2.8. Temporal Out-of-Sample Validation
To evaluate whether the principal timescale relationships were robust outside the periods used to define the soil moisture climatology, a blocked four-fold temporal cross-validation was performed. The January 2003–December 2024 record was divided into four non-overlapping held-out periods: 2003–2008, 2009–2013, 2014–2018, and 2019–2024. For each fold, all remaining years were used as the training period.
To avoid temporal information leakage, the calendar-month empirical soil moisture distributions were estimated using the training years only. Held-out soil moisture observations were then converted to calendar-month percentiles relative to the corresponding training-period distribution, and the SM20 drought classification was defined using the training-period 20th-percentile threshold. SPEI values were used as provided and were not re-estimated.
Cell-level Spearman correlation and ROC-AUC were then calculated within each held-out period using the same definitions as in the primary analysis. Performance was evaluated separately for each fold and also using a pooled cross-fitted analysis in which the out-of-fold soil moisture percentiles and drought classifications from all four held-out periods were combined. Thus, every month in the pooled cross-fitted evaluation was characterized using a soil moisture climatology that excluded the corresponding validation period.
The out-of-sample analysis was used to assess whether the relative performance of SPEI-1, SPEI-3, and SPEI-6 was preserved under temporal validation. ROC-AUC was calculated only where both drought and non-drought observations were available in the evaluated sample. Detailed fold-specific and pooled cross-fitted results are provided in
Supplementary Table S4.
3. Results
3.1. Temporal Correspondence of Drought Extent
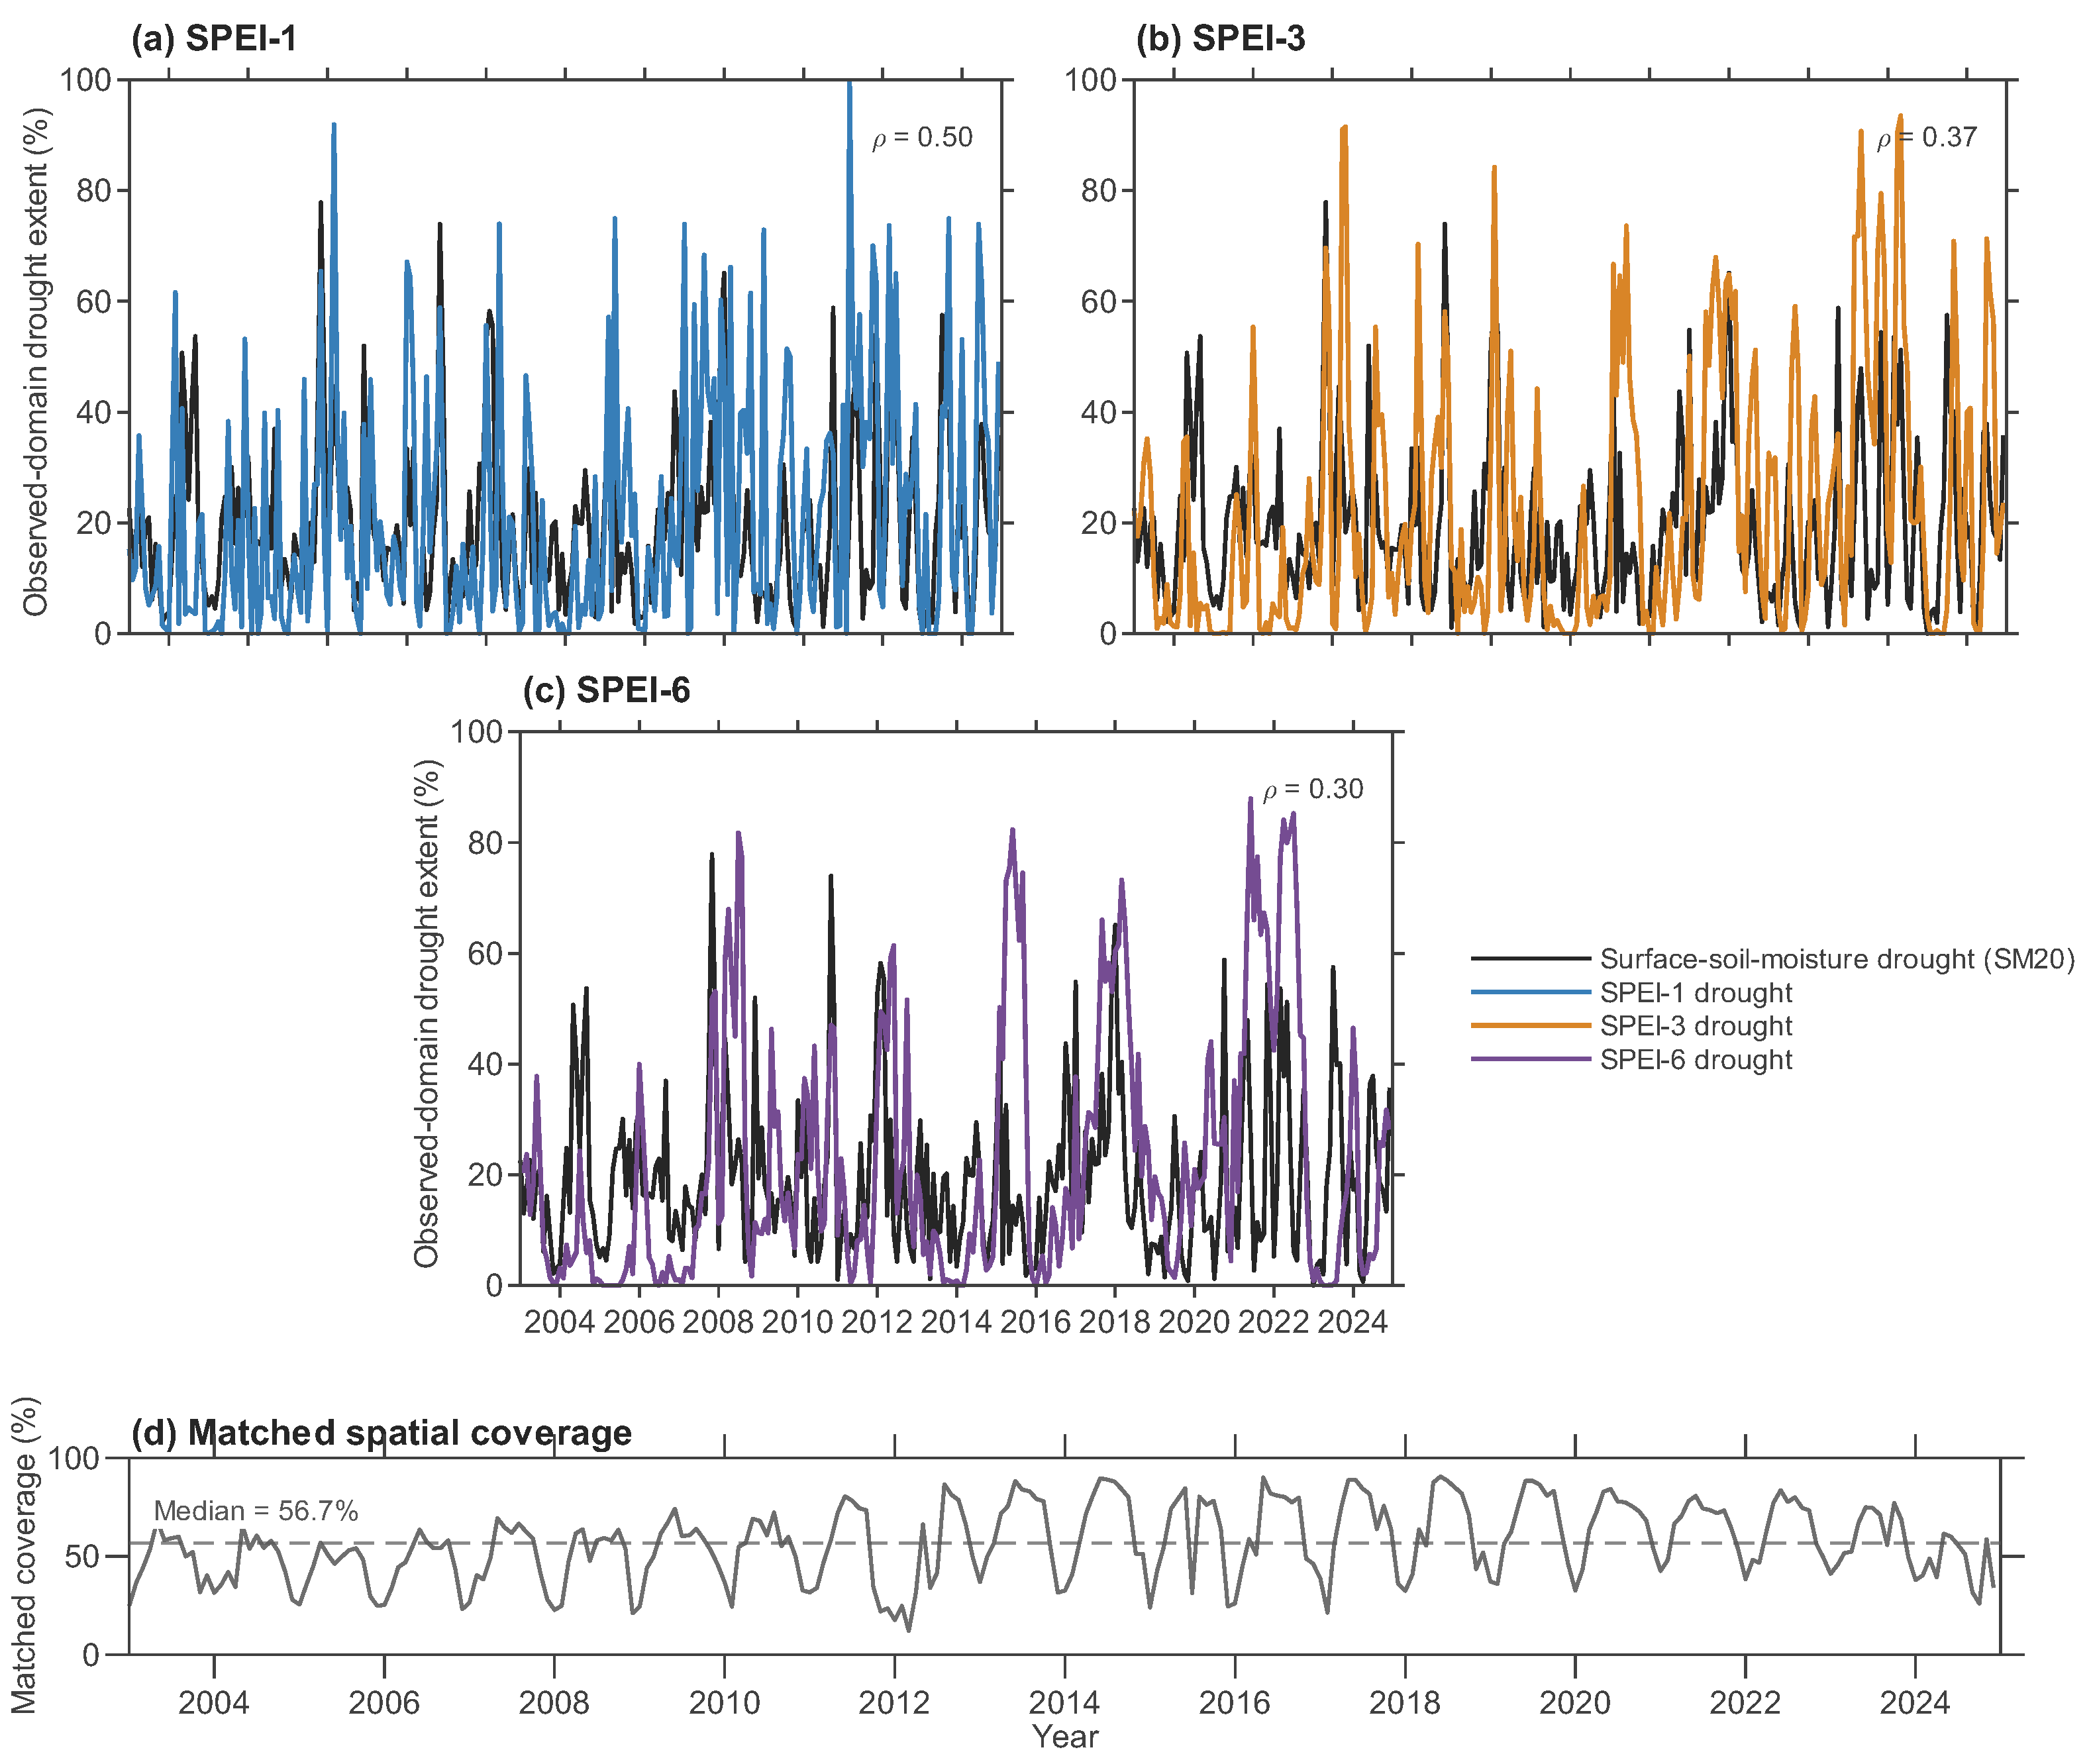
The surface soil moisture drought extent varied substantially from month to month during 2003–2024 (
Figure 2). SPEI-1 showed the strongest correspondence with the observed drought extent (
, 95% CI: 0.40–0.59), followed by SPEI-3 (
, 95% CI: 0.25–0.48) and SPEI-6 (
, 95% CI: 0.17–0.43). The moving-block bootstrap confidence intervals excluded zero for all three timescales, indicating statistically supported positive associations. SPEI-1 also produced the lowest mean absolute error (13.80 percentage points), compared with 16.21 for SPEI-3 and 16.55 for SPEI-6 (
Table 1).
The time series further show that SPEI-1 more closely tracked short-term expansions and contractions in surface soil moisture drought extent (
Figure 2a). As the accumulation period increased, the SPEI drought signal became more persistent, with SPEI-3 and particularly SPEI-6 remaining elevated during some periods after the surface soil moisture drought extent had declined (
Figure 2b,c). Short-lived changes in soil moisture drought were also less clearly reproduced at the longer accumulation timescales.
Matched spatial coverage varied through time, with a median monthly coverage of 56.7% of the analysis domain (
Figure 2d). The recurrent fluctuations indicate a seasonal component in soil moisture retrieval availability, consistent with known limitations of microwave retrievals over very dry surfaces [
23,
24]. For each month, surface soil moisture and SPEI drought extents were calculated over the same set of valid grid cells. Thus, variations in coverage affected the portion of the domain represented through time but not the spatial support used to compare the four drought-extent series within a given month.
3.2. Spatial Correspondence with Surface Soil Moisture
Differences among the SPEI accumulation periods were also evident at the grid-cell level. Among the 1462 cells meeting the primary paired-observation criterion (
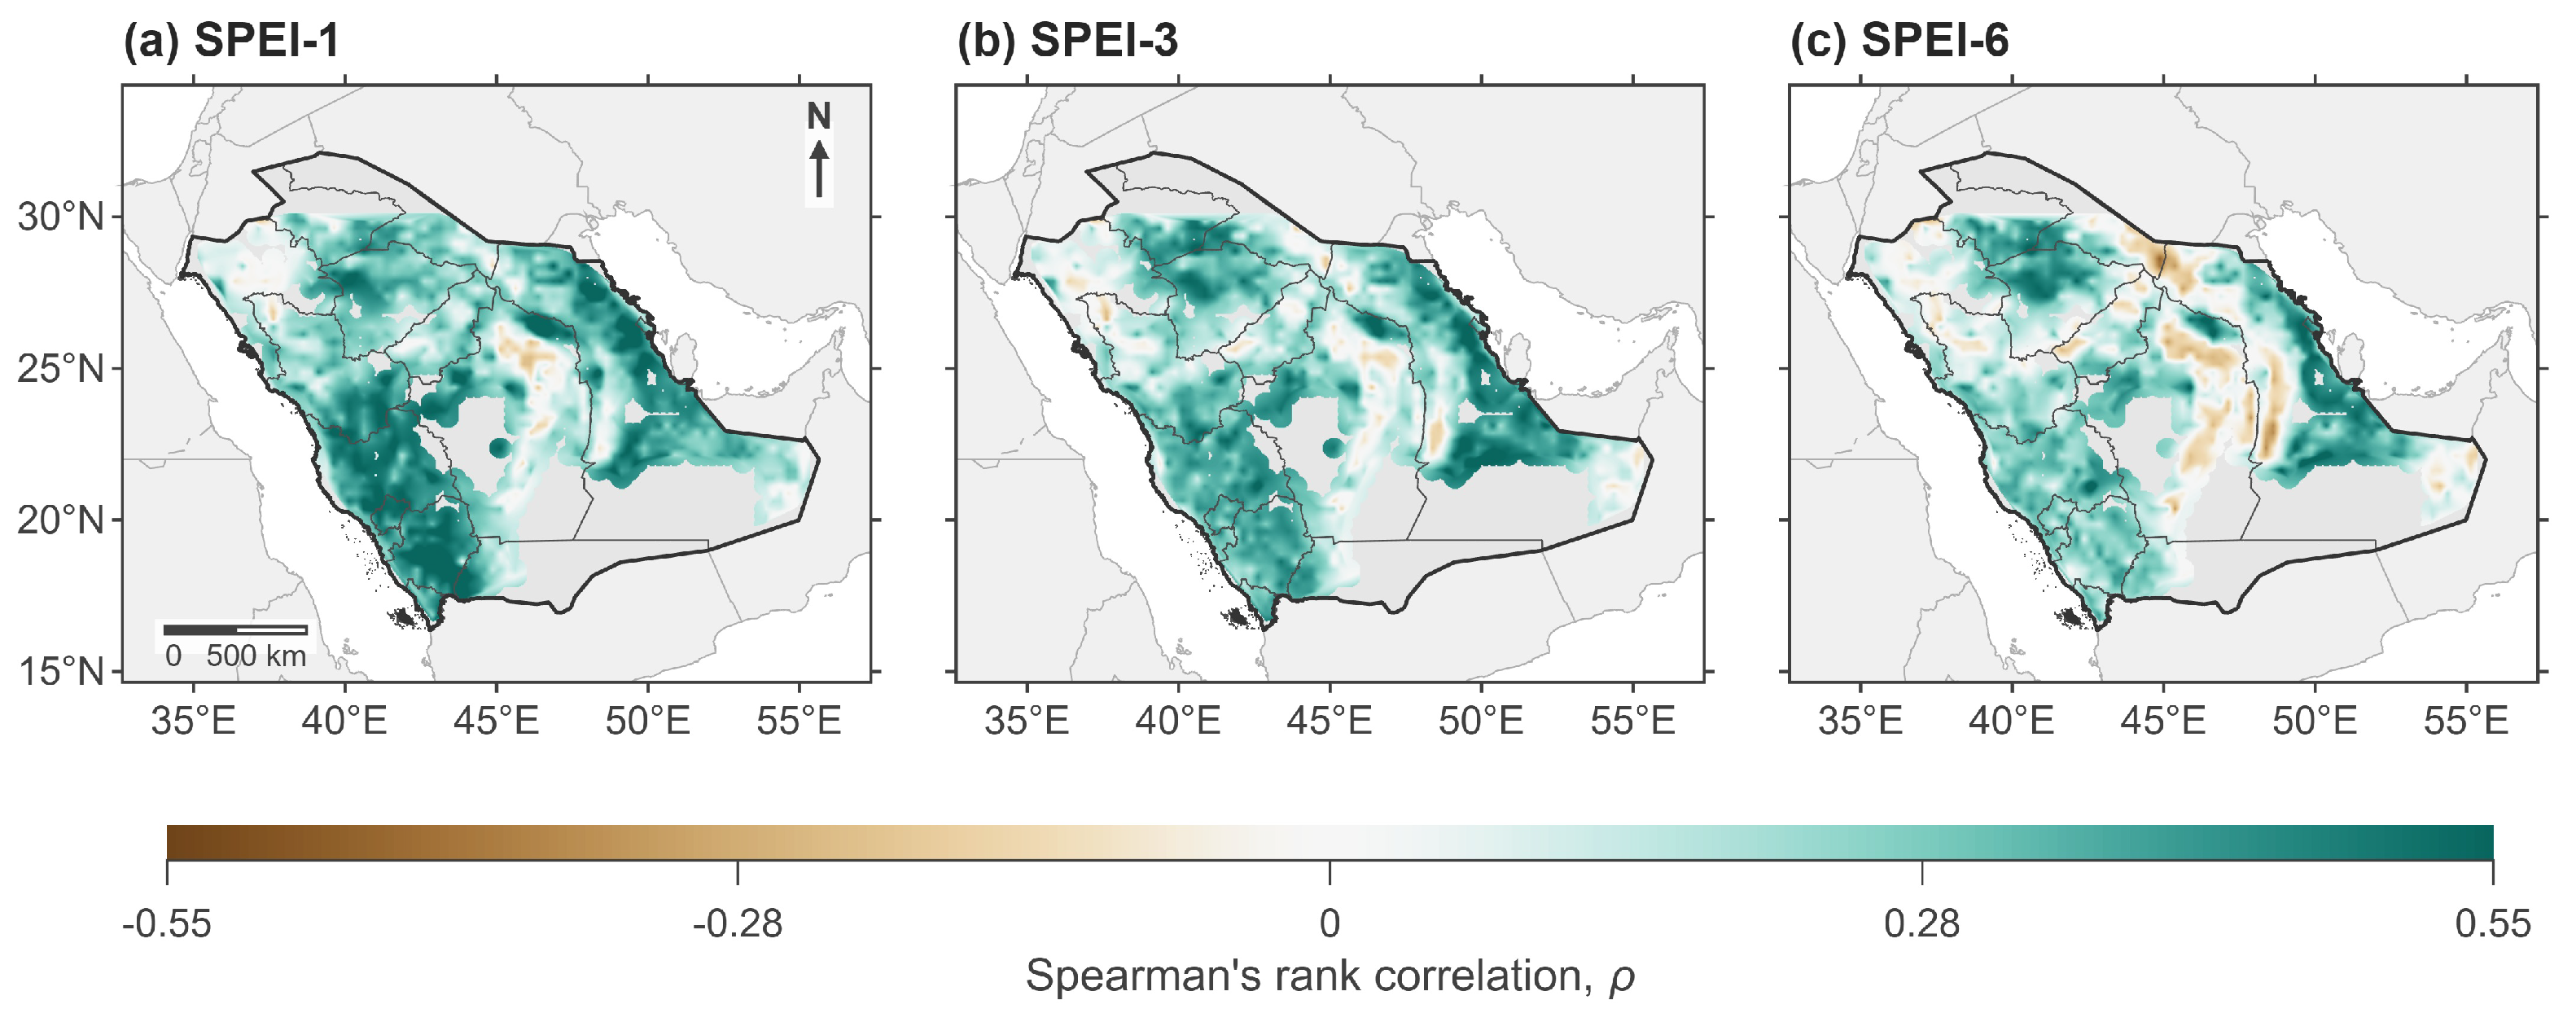
), correlations between SPEI and surface soil moisture percentiles were predominantly positive, indicating that wetter SPEI conditions generally corresponded to wetter surface soil moisture states (
Figure 3). However, the strength of this relationship varied considerably across the analysis domain. Spatial representativeness and sensitivity to the minimum-support criterion are evaluated separately in
Section 3.5.
SPEI-1 showed the highest median cell-level correlation (
), followed by SPEI-3 (
) and SPEI-6 (
). The median correlation decreased consistently with increasing accumulation period. The difference between SPEI-1 and SPEI-3 was relatively small (
), whereas the difference between SPEI-1 and SPEI-6 was larger (
). Full distributional summaries are provided in
Table 1.
The moving-block bootstrap analysis showed a similar pattern. Positive correlations with 95% confidence intervals entirely above zero occurred in 1049 cells (71.8%) for SPEI-1, 893 cells (61.1%) for SPEI-3, and 641 cells (43.8%) for SPEI-6. Confidence intervals included zero in 27.6%, 38.6%, and 54.0% of cells, respectively, while intervals entirely below zero were uncommon (0.7%, 0.3%, and 2.2%). Thus, the decline in median correlation with increasing accumulation period was accompanied by a reduction in the spatial prevalence of statistically supported positive correlations.
Spatially, positive correlations occurred across much of the analyzed domain at all three timescales (
Figure 3a–c). SPEI-1 exhibited the most spatially extensive moderate positive correspondence with surface soil moisture. The overall spatial pattern remained broadly similar for SPEI-3, although correlations weakened in several parts of the domain. This weakening became more pronounced for SPEI-6, for which weak, near-zero, and locally negative correlations were more evident. These spatial patterns support the distributional results and indicate that correspondence with near-surface soil moisture generally decreases as the SPEI accumulation period increases.
3.3. Drought Discrimination Performance
ROC analysis provided a complementary assessment of how well each SPEI accumulation period distinguished surface soil moisture drought from non-drought conditions. Median ROC-AUC values exceeded the no-discrimination reference of 0.50 for all three timescales, but discrimination generally weakened as the SPEI accumulation period increased.
SPEI-1 had the highest median ROC-AUC (
), closely followed by SPEI-3 (
), whereas SPEI-6 had a lower median value of 0.580. The difference between the SPEI-1 and SPEI-3 medians was small (0.011 AUC units), while the difference between SPEI-1 and SPEI-6 was larger (0.049 AUC units). These values represent differences between distribution medians rather than medians of paired cell-level differences; paired comparisons using
are presented in
Section 3.4. Full distributional summaries are provided in
Table 1.
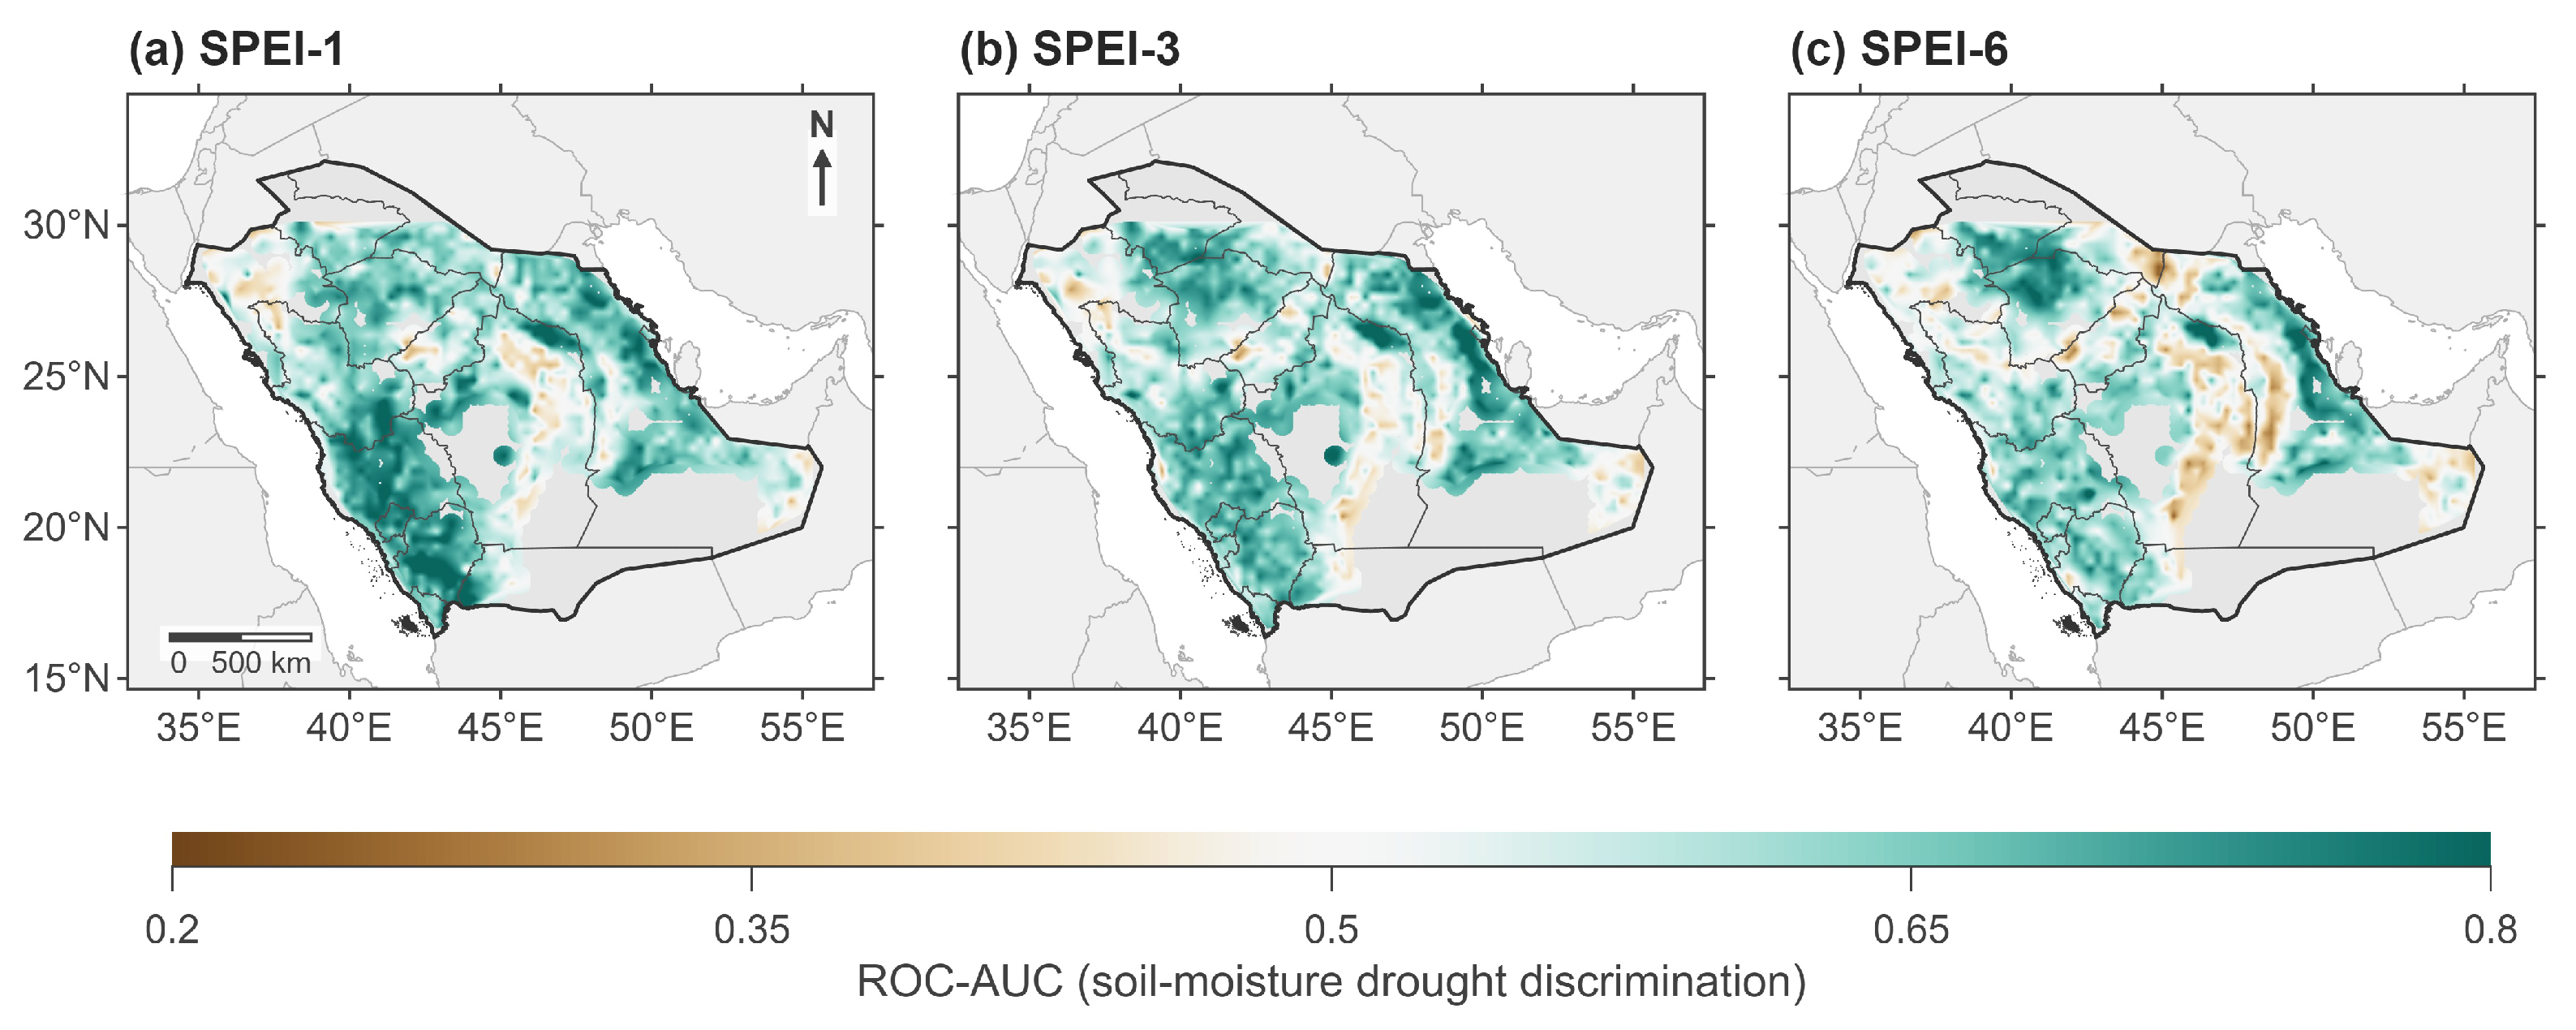
The spatial patterns were consistent with these summary statistics (
Figure 4a–c). AUC values above 0.50 were widespread for SPEI-1 and SPEI-3, although substantial spatial variability remained. SPEI-1 generally exhibited the strongest drought-discrimination performance across the analyzed domain, while SPEI-3 showed a broadly similar but somewhat weaker pattern. For SPEI-6, lower AUC values were more prevalent, with several areas approaching or falling below the 0.50 no-discrimination reference. Overall, the ROC-AUC results were consistent with the correlation analysis, indicating stronger correspondence between near-surface soil moisture drought and the shorter SPEI accumulation periods while also demonstrating substantial spatial heterogeneity in performance.
3.4. Spatial Variability in the Best-Performing SPEI Timescale
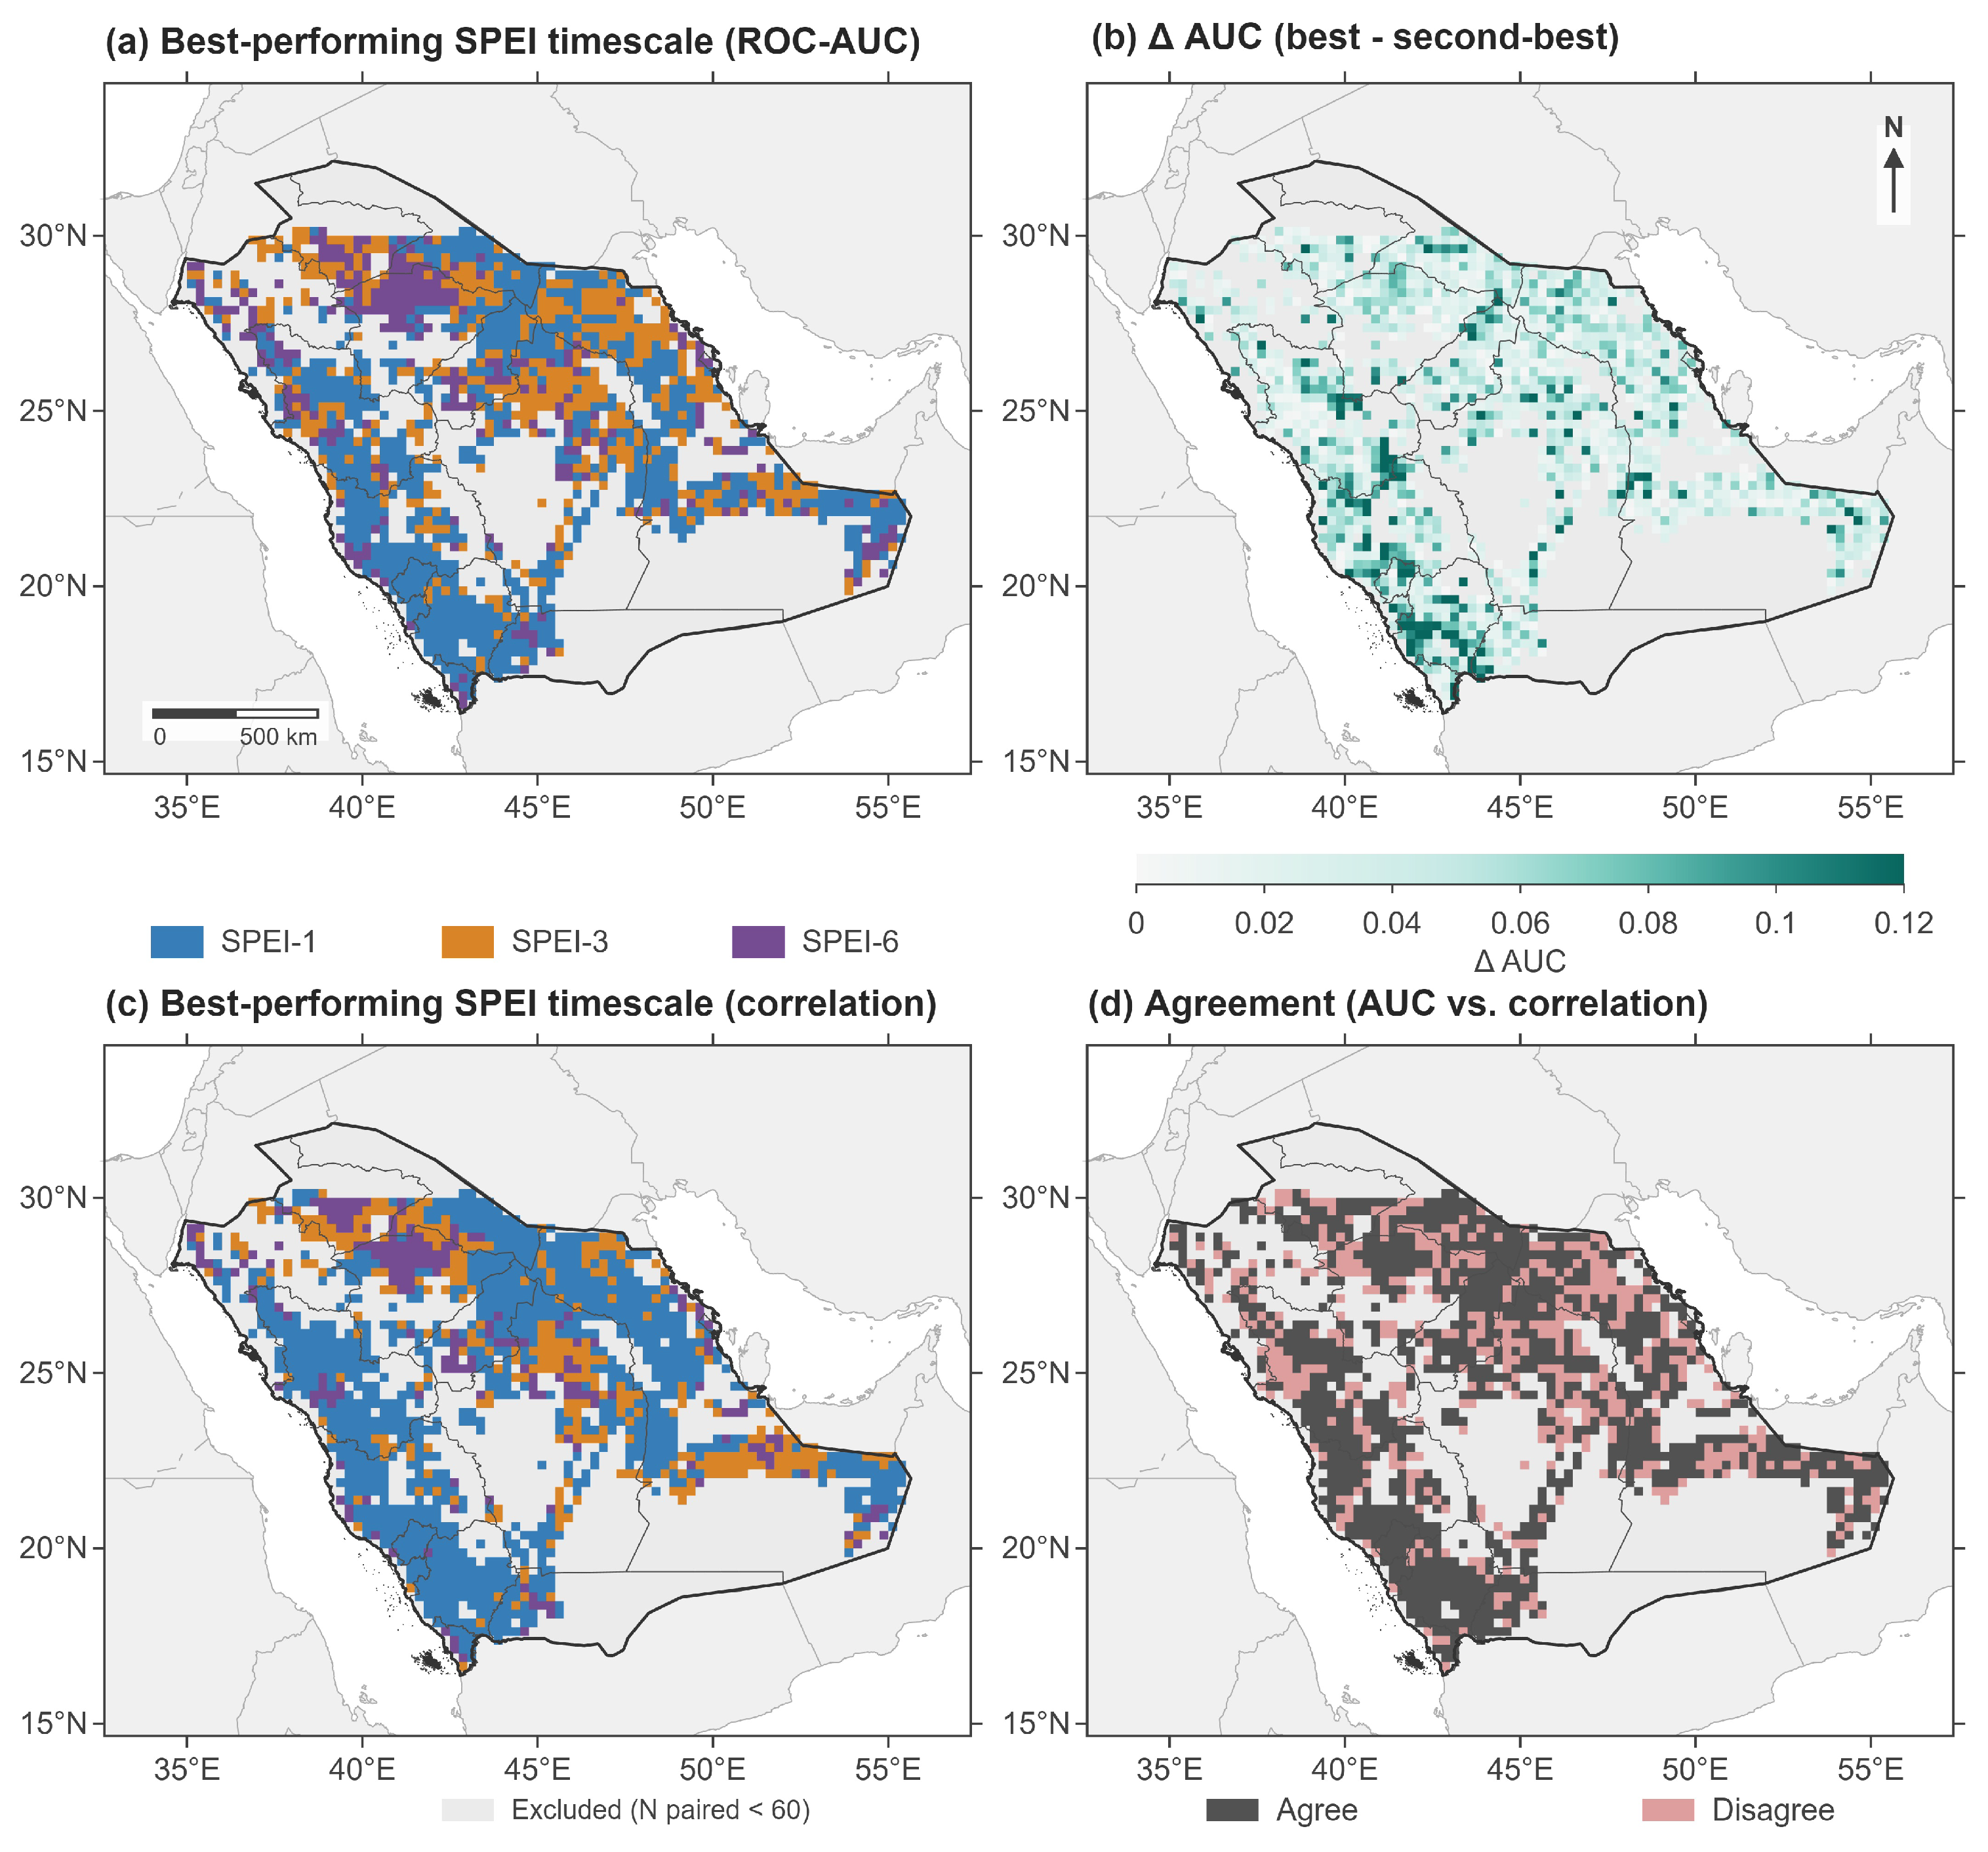
Direct comparison among accumulation periods showed that no single SPEI timescale performed best across the entire analysis domain (
Figure 5). Based on ROC-AUC, SPEI-1 was the nominally best-performing evaluated timescale in 52.5% of the 1462 analyzed cells, compared with 29.5% for SPEI-3 and 17.9% for SPEI-6 (
Figure 5a). Thus, although SPEI-1 was selected most frequently, nearly half of the analyzed cells favored either SPEI-3 or SPEI-6.
The differences among competing timescales were generally modest. The median difference between the highest and second-highest cell-level ROC-AUC was only
(
Figure 5b). The paired bootstrap analysis further showed no clear pairwise difference in 90.8% of cells for SPEI-1 versus SPEI-3, 83.5% for SPEI-1 versus SPEI-6, and 85.2% for SPEI-3 versus SPEI-6. Requiring a nominal winner to clearly outperform both alternatives yielded a uniquely supported AUC winner in only 76 cells (5.2%): SPEI-1 in 63 cells, SPEI-3 in 5 cells, and SPEI-6 in 8 cells. The remaining 94.8% had no uniquely supported AUC winner. A similar pattern was obtained for correlation-based selection, for which 86.7% of cells had no uniquely supported winner, 12.9% uniquely supported SPEI-1, and the remaining 0.4% uniquely supported SPEI-3 or SPEI-6. Detailed pairwise comparisons are provided in
Supplementary Table S3.
Selection based on the highest cell-level Spearman correlation produced a broadly similar, although not identical, spatial pattern (
Figure 5c). The AUC- and correlation-based criteria selected the same SPEI timescale in 67.9% of analyzed cells (
Figure 5d), while the remaining 32.1% favored different timescales depending on whether performance was evaluated using continuous association or drought-state discrimination.
Overall, SPEI-1 was the most frequently selected timescale and also had the strongest domain-level correspondence, highest median cell-level correlation, and highest median ROC-AUC. However, the small performance differences and limited number of uniquely supported local winners indicate that the best-timescale maps should be interpreted primarily as nominal spatial rankings rather than evidence of statistically distinct local superiority.
3.5. Spatial Coverage and Sensitivity to the Minimum-Support Criterion
The primary criterion of
retained 1462 of 2736 grid cells (53.4%), with substantial spatial variation in observational support. Regional retention ranged from 100% in Al Bahah to 25.0% in Najran. Retention exceeded 60% in Al Bahah, Al Qassim, Asir, Al Madinah, Jazan, Ha’il, and Makkah, whereas fewer than 45% of cells were retained in Riyadh, Al Jawf, Tabuk, and Najran. Retained cells were also wetter on average, with a median long-term mean annual precipitation of 62.6 mm
compared with 34.1 mm
for excluded cells. Thus, observational support was spatially nonuniform and preferentially represented wetter areas with greater ESA CCI soil moisture availability. The full spatial distribution and regional diagnostics are provided in
Supplementary Figure S1 and Supplementary Table S2.
Permanent water contributed negligibly to the spatial exclusion. Only six cells (0.22%) were classified as water-dominated using the ERA5 land–sea mask, and all had . Excluding these cells from the denominator would increase the retained fraction only from 53.44% to 53.55%, indicating that the reduced coverage primarily reflects soil moisture observational availability rather than permanent-water cells.
Relaxing the minimum-support criterion increased coverage to 1527 cells at
and 1588 cells at
, while leaving the main performance pattern essentially unchanged. Median ROC-AUC values for SPEI-1, SPEI-3, and SPEI-6 were 0.629, 0.618, and 0.580 under the primary criterion; 0.630, 0.620, and 0.581 at
; and 0.633, 0.621, and 0.581 at
. The corresponding shares of cells nominally favoring SPEI-1/SPEI-3/SPEI-6 were 52.5%/29.5%/17.9%, 52.2%/29.5%/18.3%, and 52.0%/29.2%/18.8%, respectively (
Supplementary Table S2). These results show that the overall SPEI-1 > SPEI-3 > SPEI-6 ordering was robust to reasonable relaxation of the minimum-support criterion.
3.6. Regional Consistency and Practical Guidance
Regional aggregation reinforced the overall preference for shorter SPEI accumulation periods while retaining substantial spatial heterogeneity (
Figure 6;
Table 2). A region was assigned a preferred timescale only when one accumulation period achieved the highest ROC-AUC in more than 50% of its analyzed cells. Nine of the 13 administrative regions met this criterion, and all nine favored SPEI-1. Support was strongest in Al Bahah (100%; 15 cells) and Asir (85.4%; 82 cells), followed by Najran (73.2%), Makkah (71.8%), Jazan (69.2%), Northern Borders (63.3%), Al Madinah (60.0%), Al Qassim (53.2%), and Eastern Province (51.7%). Percentages for regions with relatively few analyzed cells, particularly Al Bahah and Jazan, should be interpreted cautiously because individual-cell classifications have greater influence on the regional result.
Four regions—Al Jawf, Ha’il, Riyadh, and Tabuk—did not meet the 50% majority criterion and were therefore classified as Mixed. Al Jawf was divided mainly between SPEI-3 (49.1%) and SPEI-6 (43.4%), Ha’il had the largest share for SPEI-6 (45.8%), Riyadh was divided primarily between SPEI-1 (45.2%) and SPEI-3 (41.1%), and Tabuk had the largest share for SPEI-3 (40.0%). Agreement between the AUC- and correlation-based classifications ranged from 60% to 100% across regions, indicating that the preferred timescale depended partly on the performance criterion used.
Overall, SPEI-1 represented the leading regional tendency wherever majority support was observed, whereas the four mixed regions were better characterized by multiple competing timescales. These classifications are descriptive summaries of nominal cell-level rankings and should not be interpreted as evidence that the leading timescale is statistically superior to the alternatives throughout an entire region.
3.7. Sensitivity to the Soil Moisture Drought Threshold
Sensitivity analysis using the SM10, SM20, and SM30 drought definitions produced similar results across all three SPEI accumulation periods. Median ROC-AUC values for SPEI-1, SPEI-3, and SPEI-6 were 0.634, 0.619, and 0.570 under SM10; 0.629, 0.618, and 0.580 under the primary SM20 definition; and 0.632, 0.619, and 0.582 under SM30. SPEI-1 therefore retained the highest median drought-discrimination performance at each threshold.
The nominal shares of cells favoring SPEI-1, SPEI-3, and SPEI-6 were 50.4%, 29.6%, and 20.0% under SM10; 52.5%, 29.5%, and 17.9% under SM20; and 56.6%, 25.6%, and 17.9% under SM30. Domain-scale drought-extent correlations also retained the same ordering at all three thresholds, with SPEI-1 showing the strongest correspondence, followed by SPEI-3 and SPEI-6. Regional classifications were similarly stable, with 10 of the 13 regions retaining the same classification across all three thresholds.
Overall, the preference for shorter SPEI accumulation periods was robust to the choice of soil moisture drought threshold and was not dependent on the primary 20th-percentile definition. Detailed domain-scale and regional sensitivity results are provided in
Supplementary Table S1.
3.8. Temporal Out-of-Sample Performance
Temporal holdout validation produced a consistent ordering across the three SPEI accumulation periods. SPEI-1 had the highest median correlation and ROC-AUC in each of the four held-out periods. In the pooled cross-fitted analysis, median correlations were 0.270, 0.233, and 0.157 for SPEI-1, SPEI-3, and SPEI-6, respectively, while the corresponding median ROC-AUC values were 0.626, 0.612, and 0.566. SPEI-1 was also the nominal highest-AUC timescale in 50.1% of cells, compared with 30.4% for SPEI-3 and 19.5% for SPEI-6.
These out-of-sample results closely reproduced the ordering observed in the full-sample analysis, supporting the robustness of the overall preference for shorter SPEI accumulation periods to temporal holdout validation. Fold-specific and pooled cross-fitted results are provided in
Supplementary Table S4.
4. Discussion
4.1. Why Short SPEI Timescales Better Represent Surface Soil Moisture Drought
The results consistently show stronger correspondence between surface soil moisture and the shorter SPEI accumulation periods. SPEI-1 exhibited the strongest domain-scale temporal correspondence, the highest median grid-cell correlation, and the highest median ROC-AUC, with performance decreasing progressively for SPEI-3 and SPEI-6. This ordering was also maintained under alternative soil moisture drought thresholds and temporal out-of-sample validation. These findings indicate that near-surface soil moisture conditions in Saudi Arabia are more closely associated with recent climatic water-balance anomalies than with anomalies accumulated over several preceding months.
This behavior is consistent with the shallow sensing depth of ESA CCI soil moisture, which primarily represents approximately the upper 2–5 cm of the soil profile. Moisture in this layer can respond rapidly to precipitation and subsequently decline through evaporation, drainage, redistribution, and exchange with deeper soil layers. Consequently, near-surface soil moisture generally has a shorter hydrological memory than deeper soil-water stores [
3,
8,
32,
33]. SPEI, by contrast, integrates climatic water-balance anomalies over a specified accumulation period [
4,
5]. Longer accumulation periods therefore retain greater influence from antecedent conditions and produce smoother, more persistent drought signals. This difference in temporal memory provides a plausible explanation for the weaker correspondence of SPEI-3 and SPEI-6 with the relatively rapid variability of near-surface soil moisture.
Previous studies provide further support for this relationship. Xu et al. [
32] reported stronger associations between shallow soil moisture and short-term drought conditions, whereas deeper soil layers reflected longer-term drought development. McKellar et al. [
33] similarly showed that characteristic climatic timescales increase with soil-water depth, and Hoylman et al. [
8] demonstrated a strong dependence of the characteristic meteorological drought timescale on soil moisture measurement depth. Short-timescale drought indices have likewise been shown to correspond more closely with topsoil moisture variability in other regions [
34]. Therefore, the results for Saudi Arabia are consistent with the broader expectation that the meteorological accumulation period most closely associated with soil moisture depends, in part, on the depth of the soil layer being represented. Importantly, however, Hoylman et al. [
8] also found that operational soil moisture models can outperform meteorological indices for characterizing soil moisture drought. The present results should therefore be viewed primarily as guidance for applications in which SPEI remains the practical monitoring tool; where reliable direct observations or model-based soil moisture estimates are available, they are preferable for diagnosing the realized soil moisture state.
The monotonic decrease in performance from SPEI-1 to SPEI-6 also indicates an important limitation of the evaluated timescale range. Because one month was the shortest accumulation period considered, the analysis cannot determine whether SPEI-1 represents the physical optimum for the shallow soil layer. Characteristic response times shorter than one month are plausible for near-surface soil moisture. For example, Hoylman et al. [
8] reported characteristic meteorological timescales of approximately 10–80 days across soil depths from 2 to 36 inches, with longer timescales generally associated with greater depth. SPEI-1 should therefore be interpreted as the best-performing among the evaluated monthly timescales, rather than as a demonstrated optimal timescale.
The preference for SPEI-1 was also not spatially uniform. Although it performed best on average, SPEI-3 or SPEI-6 ranked highest in a substantial fraction of grid cells, and local differences among competing timescales were often small. Such spatial heterogeneity is consistent with evidence that characteristic drought-index timescales vary across hydroclimatic settings. Lu et al. [
9], for example, reported generally short characteristic SPEI timescales for near-surface soil moisture but longer timescales and weaker correspondence in more arid regions of China. Variations in soil properties, vegetation, climatic regime, retrieval characteristics, and local hydrological memory may similarly contribute to the spatial differences observed across Saudi Arabia, although the present analysis does not isolate the effects of these factors individually.
Finally, the relative advantage of SPEI-1 should not be interpreted as uniformly strong agreement with observed soil moisture. Its median grid-cell correlation (
) and median ROC-AUC (0.629) indicate moderate rather than strong correspondence, and statistically supported positive correlations were not observed in every analyzed cell. Meteorological drought and soil moisture drought represent related but distinct components of drought development [
2,
3,
35]. SPEI characterizes anomalies in climatic water balance, whereas realized soil moisture conditions are additionally influenced by antecedent moisture, infiltration, drainage, soil hydraulic properties, vegetation, and land–atmosphere exchanges. SPEI-1 should therefore be regarded as the most representative of the evaluated SPEI timescales for near-surface soil moisture drought at the domain scale, rather than as a direct substitute for soil moisture observations.
4.2. Spatial Variability in SPEI Timescale Selection
Although SPEI-1 performed best in the domain-wide summaries, its advantage was not spatially uniform. It produced the highest ROC-AUC in 52.5% of analyzed cells, compared with 29.5% for SPEI-3 and 17.9% for SPEI-6. Thus, nearly half of the analyzed cells nominally favored an accumulation period longer than one month. The principal spatial conclusion is therefore not that SPEI-1 is universally superior but that it is the most frequently favored of the three evaluated timescales. This interpretation was also stable under the SM10 and SM30 drought definitions, despite modest changes in the relative shares of the three timescales.
The magnitude of local performance differences further limits how strongly these rankings should be interpreted. The median difference in ROC-AUC between the first- and second-ranked timescales was only 0.033, and an classification necessarily assigns a nominal winner even when competing timescales perform similarly. The paired bootstrap analysis confirmed this ambiguity: 94.8% of cells had no single AUC-based timescale that clearly outperformed both alternatives, while the corresponding proportion for correlation-based selection was 86.7%. The best-timescale maps should therefore be interpreted primarily as spatial rankings among the evaluated candidates rather than as evidence of a statistically distinct local optimum. This distinction does not alter the domain-scale preference for SPEI-1, but it places an important constraint on the interpretation of individual grid-cell classifications.
Differences between the two performance criteria provide an additional indication of this spatial complexity. AUC- and correlation-based classifications selected the same timescale in 67.9% of cells but differed in the remaining 32.1%. This is expected because the two metrics quantify different aspects of correspondence. Spearman correlation measures monotonic association across the full range of monthly conditions, whereas ROC-AUC evaluates the ability of SPEI to distinguish soil moisture drought from non-drought conditions. A timescale may therefore reproduce general soil moisture variability relatively well without providing the strongest drought-state discrimination, or vice versa. Similar dependence on the monitored variable and evaluation criterion has been reported in previous drought-comparison studies [
6,
7,
9].
The observed heterogeneity is also physically plausible given the strong hydroclimatic and land-surface gradients across Saudi Arabia. The southwestern highlands are comparatively wetter and experience more frequent rainfall and pronounced topographic influences, whereas much of the central, northern, and southeastern interior is characterized by lower and more episodic rainfall, high evaporative demand, and extensive arid surfaces [
15,
16,
17,
20]. These contrasts can influence the persistence and recovery of near-surface soil moisture through differences in rainfall timing, antecedent moisture, soil properties, and evaporative losses [
3,
13,
36,
37]. Such processes provide plausible explanations for spatial variation in the timescale most closely associated with surface soil moisture, but they were not evaluated causally in the present study. A dedicated attribution analysis incorporating rainfall regime, evaporative demand, soil texture, elevation, vegetation, and land use would be required to identify the dominant controls.
Spatial sampling further constrains interpretation of these patterns. Cells retained under the primary observation criterion were wetter on average than excluded cells, indicating that some of the driest interior environments were underrepresented. Relaxing the minimum-support requirement to 48 and 36 paired months did not alter the overall SPEI-1 > SPEI-3 > SPEI-6 performance ordering, suggesting that the principal domain-scale result was not driven by the selected support threshold. Nevertheless, the most data-sparse hyper-arid areas remain less well constrained. Accordingly, the spatial conclusions should be interpreted as representative of the observed analytical domain rather than as uniformly applicable to every part of Saudi Arabia.
4.3. Regional and Operational Implications for Drought Monitoring
Regional aggregation provides a practical interpretation of the grid-cell results. Nine of the 13 administrative regions showed a nominal majority preference for SPEI-1, whereas Al Jawf, Ha’il, Riyadh, and Tabuk did not exhibit a majority preference for any evaluated timescale. Even among regions classified as SPEI-1, the strength of the majority varied considerably. These regional classifications should therefore be interpreted as descriptive summaries of spatially heterogeneous behavior rather than as evidence of a uniform or statistically distinct regional optimum.
From an operational perspective, SPEI-1 provides the most defensible starting point when a single climatic indicator is required to represent rapid near-surface soil moisture drought. It consistently showed the strongest domain-scale temporal correspondence, highest median grid-cell correlation, and highest median ROC-AUC, and this ordering was retained under threshold sensitivity and temporal out-of-sample validation. However, the limited statistical separation among competing timescales at many individual locations argues against prescribing SPEI-1 uniformly. In regions without a clear majority, or where local applications require greater temporal persistence, simultaneous consideration of multiple accumulation periods may provide a more informative representation of drought conditions.
These findings extend previous assessments of drought variability in Saudi Arabia by emphasizing that the interpretation of a meteorological drought index depends not only on location but also on the accumulation period and the environmental variable being represented [
16,
17]. Selection of an SPEI timescale should therefore be linked explicitly to the monitoring objective rather than treated as a fixed characteristic of the index.
This principle also applies to the choice of drought index. The Standardized Precipitation Index (SPI) remains widely used for multiscalar drought monitoring, including in arid environments [
17,
38]. Unlike SPI, which is based on precipitation alone, SPEI additionally incorporates atmospheric evaporative demand and therefore characterizes anomalies in climatic water balance [
4,
38,
39]. This distinction may be particularly relevant in hot, arid environments such as Saudi Arabia, where evaporative demand can contribute substantially to drought development. However, SPI was not evaluated in the present study, and the results should not be interpreted as demonstrating that SPEI provides superior representation of surface soil moisture. Direct comparison of SPI, SPEI, and other meteorological drought indices would provide a useful extension of this work.
Finally, the preference for SPEI-1 is specific to surface soil moisture drought and should not be generalized to root-zone soil moisture, crop water stress, streamflow, groundwater, or reservoir storage. Hydrological memory generally increases as drought propagates from atmospheric forcing into deeper soils and larger storage components, and characteristic meteorological timescales vary with soil depth and drought type [
2,
8,
33,
36]. Longer accumulation periods may therefore be more appropriate for variables with longer hydrological memory. Operational selection of SPEI timescale should consequently be process-specific: SPEI-1 is the preferred national-scale timescale among those evaluated for representing rapid surface soil moisture drought, while regional conditions and the target hydrological variable should guide whether longer accumulation periods are also considered.
5. Conclusions
This study evaluated how SPEI accumulation timescales of 1, 3, and 6 months represent surface soil moisture drought across the observed Saudi Arabian domain during 2003–2024. The results demonstrate that accumulation-timescale selection is important when SPEI is used to characterize near-surface drought conditions and that shorter accumulation periods generally provide a closer representation of the rapid variability of surface soil moisture. The main findings are summarized as follows:
SPEI-1 consistently showed the strongest domain-scale performance among the evaluated timescales. It produced the highest temporal correspondence with surface soil moisture drought extent (), the highest median grid-cell correlation (), and the highest median ROC-AUC (0.629). Performance declined progressively for SPEI-3 and SPEI-6.
The preference for shorter accumulation periods remained consistent across different soil moisture drought thresholds, the relaxation of the minimum observational-support criterion, and temporal out-of-sample validation. The ordering of SPEI-1, SPEI-3, and SPEI-6 was maintained in these sensitivity analyses.
SPEI-1 was the nominal highest-AUC timescale in 52.5% of analyzed grid cells, compared with 29.5% for SPEI-3 and 17.9% for SPEI-6. However, local differences were generally modest, and 94.8% of cells did not have a uniquely supported AUC-based winner. The best-performing timescale should therefore be interpreted as a relative local ranking rather than a statistically distinct optimum in most locations.
Regional aggregation showed a similar pattern. Nine of the 13 administrative regions exhibited a nominal majority preference for SPEI-1, whereas Al Jawf, Ha’il, Riyadh, and Tabuk showed no majority preference for a single evaluated timescale. This regional variability supports the use of multiple timescales where local conditions do not clearly favor one accumulation period.
Observational support was spatially nonuniform, with the primary analysis retaining 1462 of 2736 grid cells (53.4%). Retained cells were generally wetter than excluded cells, indicating that the driest and most data-sparse environments remain less well constrained. The conclusions should therefore be interpreted as representative of the observed analytical domain rather than uniformly applicable to all locations in Saudi Arabia.
The study is particularly useful for drought-monitoring applications where the SPEI serves as an effective indicator of rapid near-surface soil moisture conditions. This is especially relevant in situations where direct soil moisture observations are unavailable, incomplete, or need to be supplemented by a spatially continuous climatic index. For these applications, SPEI-1 is the most reliable starting point among the evaluated monthly timescales at the national level. However, SPEI-3 and SPEI-6 should also be available when regional conditions or specific monitoring objectives require a longer temporal persistence. More generally, the findings highlight the importance of validating meteorological drought indices against the specific land-surface variables they are meant to represent. The choice of timescale should depend on the process being monitored, the spatial scale, and hydrological memory, rather than simply applying a single accumulation period uniformly across all applications.