Article

Dynamic Evaluation of Flood Hazard Considering Extreme Precipitation Scenarios: A Case Study of Laiyuan County, Hebei Province

1
School of Architecture and Art, Hebei University of Architecture, Zhangjiakou 075000, China
2
Hebei Provincial Key Laboratory of Urban Safety Technology for Climate Change Response, Shijiazhuang 050000, China
3
Norendar International Ltd., Shijiazhuang 050000, China
4
Hebei Institute of Architectural Design & Research Co., Ltd., Shijiazhuang 050081, China
5
Fourth Geological Team of Hubei Geological Bureau, Xianning 437100, China
6
Hebei Jiqin Group Co., Ltd., Shijiazhuang 050000, China
7
School of Environmental Studies, China University of Geosciences, Wuhan 430034, China
*
Authors to whom correspondence should be addressed.
Atmosphere 2026, 17(9), 826; https://doi.org/10.3390/atmos17090826
Submission received: 21 June 2026 / Revised: 5 August 2026 / Accepted: 21 August 2026 / Published: 26 August 2026
(This article belongs to the Section Biosphere/Hydrosphere/Land–Atmosphere Interactions)

Abstract

Extreme precipitation events have grown more common as a result of global climate change, and conventional static hazard assessments find it difficult to account for the dynamic progression of flood disasters. This study considers extreme precipitation factors for different return times and creates different extreme precipitation scenarios based on multiyear historical precipitation data and actual storm events. The study proposes a method for the dynamic assessment of regional flood hazard that takes extreme rainfall scenarios into account by simulating the dynamic flood inundation processes under each scenario using the Accumulated Runoff and Flood Estimation Model (AccRo v.1.0), iterative flow accumulation, and hydrological calculations. A dynamic assessment and zoning of flood hazards was carried out in Laiyuan County, Hebei Province. The results reveal that high-hazard zones coincide with the distribution of historically badly damaged townships, concentrated in the river valley plains along the Juma River. The results show that spatial patterns are simultaneously influenced by precipitation, terrain, and the river network. In the temporal dimension, under Scenario 3, the superimposition of the 50-year return period daily maximum rainfall at the 12th hour increased the high-hazard area by approximately 110% compared with that at the 11th hour. In addition, the non-uniform multi-peak rainfall pattern in Scenario 4 represented the rise, peak, and recession stages of the flood process. A combined assessment of water depth and flow velocity can effectively distinguish between two disaster-causing modes—deep water with low flow velocity and shallow water with high flow velocity—thereby addressing the underestimation of hazard in transition zones associated with the use of water depth as a single indicator.

1. Introduction

Global climate change has intensified the frequency of extreme precipitation events [1,2], and the resulting floods have caused significant loss of life and economic damage. In mountainous catchments in particular, rapid runoff and steep topography further exacerbate the severity of floods [3,4]. Compared to lowland areas, short-duration heavy rainfall in mountainous regions results in rapid runoff and intense impact, with vulnerable areas concentrated along river valleys, rendering flood events in these settings more sudden and destructive. In 2021, the Eifel mountain range in western Germany was hit by extreme rainfall, causing the Ahr Valley to flood rapidly with peak flows far exceeding the 100-year return period, resulting in 134 fatalities and economic losses on the order of tens of billions of euros [5]. During the July 2023 extreme rainstorm and flood event in Hebei Province, China, influenced by the remnants of Typhoon Doksuri, the Hai River basin experienced a basin-wide catastrophic flood, while the eastern foothills of the Taihang Mountains suffered a combined impact of flash floods, river overflow, and infrastructure damage [6].
Flood hazard assessment forms the core technical foundation for disaster prevention and mitigation planning, the optimization of emergency response, and climate adaptation strategies [7,8,9]. Some traditional hazard assessments still rely on historical average precipitation statistics or design rainfall events with a single return period to generate static hazard zoning maps [10]. Such static assessments may overlook the temporal dynamics of the flood process from the onset of rainfall to the recession of the flood peak, and may fail to capture the non-linear amplification effect caused by the superimposition of short-duration, intense rainfall on antecedent wet or near-saturated conditions [11]. This effect refers to a threshold-type hydrological response in which reduced infiltration capacity, filled local storage, and enhanced catchment connectivity allow subsequent intense rainfall to be rapidly converted into surface runoff, leading to disproportionate increases in inundation depth, flow velocity, and hazard level [12]. Design storms with simplified or uniform temporal distributions may not fully characterize the complete hydrographic profile of real extreme events, including the rise, peak, and recession phases, and may therefore obscure the controlling role of rainfall temporal structure in flood response. Similarly, depth-only hazard classification may overlook hazardous combinations of relatively shallow but fast-moving flow, which has motivated the use of depth–velocity indicators or integrated hazard indices in flood hazard studies [13]. In recent years, flood hazard assessment has increasingly incorporated stochastic rainfall simulation, synthetic hyetographs, rainfall temporal patterns, coupled hydrological–hydrodynamic modeling, and dynamic or spatiotemporal hazard zoning [14,15]. These studies and models have significantly enhanced the physical realism of flood simulations; however, integrated applications combining multi-scenario extreme rainfall generation, dynamic inundation simulation, and dual-indicator hazard classification remain relatively limited, particularly in data-scarce mountainous counties. Thus, an organic coupling between multi-scenario extreme precipitation generation, effective hydrodynamic simulation, and a dual-indicator classification system is still needed, especially for mountainous regions with limited data where both precipitation forcing and runoff response show notable spatiotemporal heterogeneity.
Using Laiyuan County in Hebei Province as a case study, four extreme precipitation scenarios were constructed to represent differences in rainfall magnitude and temporal distribution. The scenario design distinguishes a uniform baseline rainfall case, a uniform 50-year design storm, a short-duration peak superimposed on a uniform rainfall background, and a multi-peak rainfall pattern generalized from the July 2023 extreme rainstorm event. Pearson Type III distribution curve fitting was used to derive extreme precipitation parameters for the relevant return periods. The Accumulated Runoff and Flood Estimation Model (AccRo v.1.0) is then used to simulate the inundation dynamics under each scenario through iterative flow accumulation and hydraulic calculations. AccRo has been benchmarked against HydroAs and RIM2D and can provide comparable estimates of maximum inundation depth, maximum flow velocity, and maximum specific discharge with lower computational requirements, making it suitable for multi-scenario hazard assessment based on peak flood conditions [16]. The product of water depth and flow velocity was used to create a thorough flood hazard index that allowed for a dynamic evaluation of the study area’s hazard levels and township-scale hazard zoning.

2. Study Area and Data

2.1. Study Area

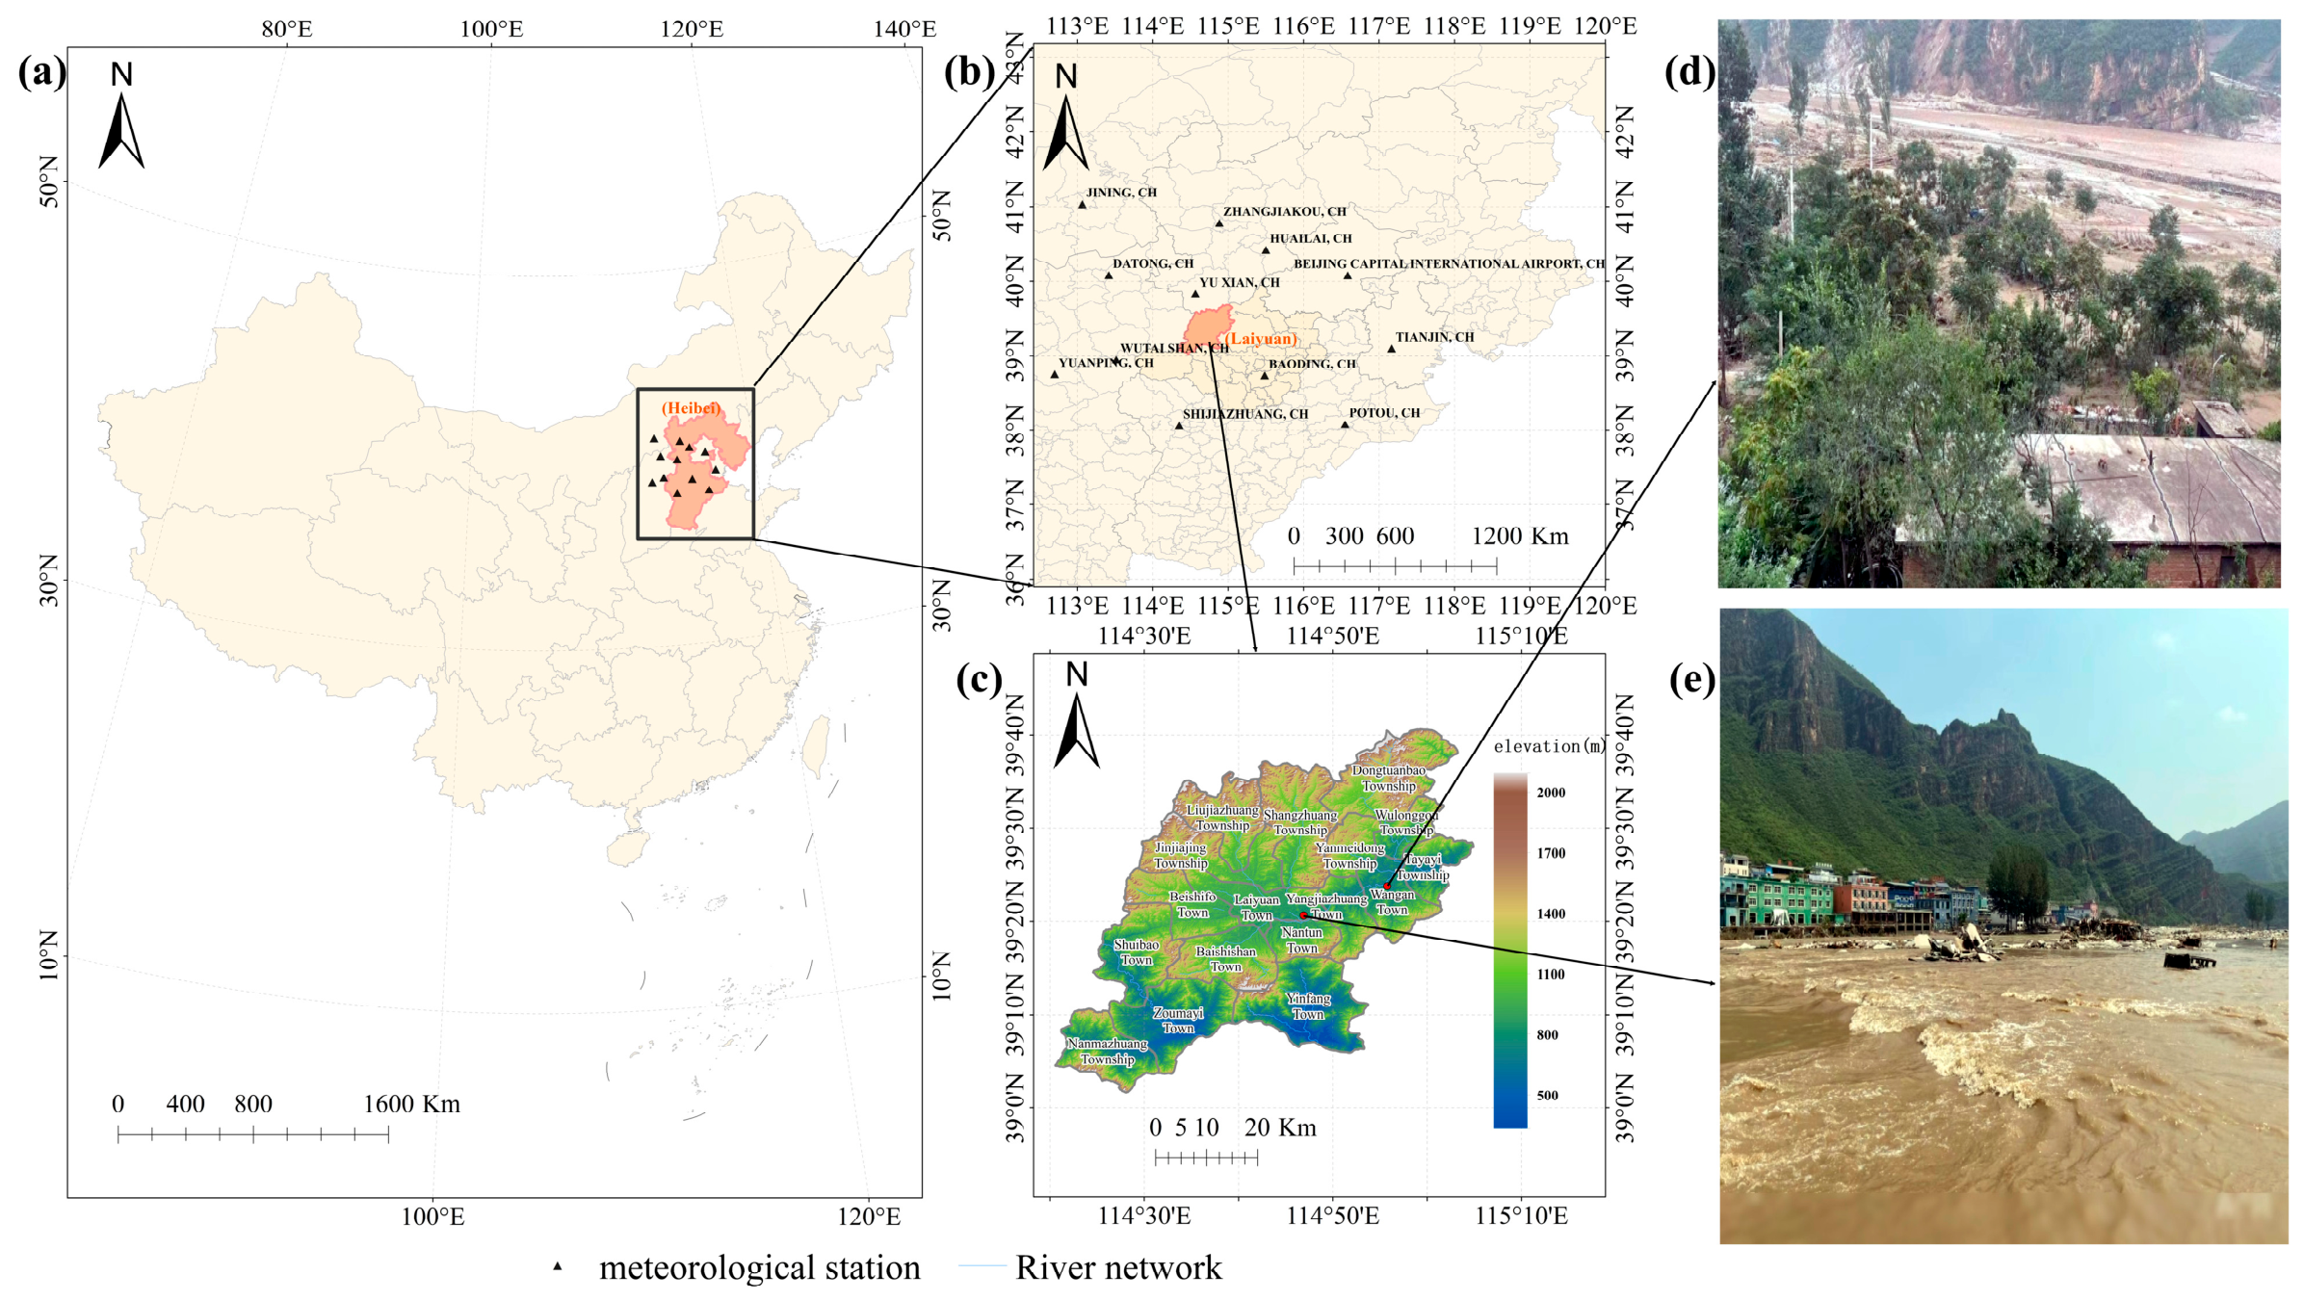
Laiyuan County in Hebei Province is a county in the Taihang Mountains prone to frequent flooding and waterlogging. It covers a total area of approximately 2448 km2 and is situated on the eastern foothills of the Taihang Mountains and along the upper reaches of the Juma River, with geographical coordinates ranging from 39°01′ N to 39°40′ N and 114°20′ E to 115°08′ E (Figure 1a). The terrain is predominantly mountainous and hilly. Based on DEM-derived topographic classification, mountainous and hilly areas cover approximately 2198.6 km2, representing nearly 90% of the valid DEM area, whereas river-valley plains and basin lowlands occupy approximately 243.8 km2, representing about 10% (Figure 1c). The county exhibits a basin-like topography with higher elevations at the periphery and a lower central area, with an intricate network of waterways crisscrossing the river valley plains (Figure 1c). The population and infrastructure of Laiyuan County are highly concentrated in the river valley plains. Towns such as Laiyuan Town and Wang’an Town serve as the primary centers of population and economic activity. Villages, farmland, roads and tourist facilities in the river valley plains are the main targets of disaster impact, while the mountainous areas are predominantly characterized by villages and forest land; disaster losses are concentrated in the low-altitude river valley regions [17]. Laiyuan County has a temperate continental monsoon climate. Influenced by monsoon circulation, summer precipitation is concentrated and characterized by frequent short-duration heavy rainfall and torrential downpours. The average annual precipitation is 550 mm, with extreme daily rainfall exceeding 200 mm; as a result, flooding occurs frequently and extensively.
Throughout its history, Laiyuan County has experienced severe flooding on multiple occasions. The county saw continuous torrential rains on 21 July 2012 (Figure 1d), with up to 300 mm of rain falling in Wang’an Town over the course of seven hours. The Juma River’s water level quickly surged, inundating a number of villages along its banks; 960 million Yuan (approximately USD 142 million) in direct economic damage and 14 fatalities were reported throughout the county [18]. In July 2023, affected by the extreme rainstorm event across the Hebei River Basin, the eastern and southern parts of the county experienced extreme torrential rain (Figure 1e), with a maximum daily rainfall of 186 mm. Six townships were affected; 32 roads were cut off [19]. The townships most severely affected by both events—Wang’an, Tayayi and Yangjiazhuang—are all concentrated along the valleys of the main stem and major tributaries of the Juma River.

2.2. Data Sources and Processing

2.2.1. Data Sources

Extreme precipitation data: Historical precipitation observations are sourced from the NOAA National Centers for Environmental Information (NCEI) Global Summary of the Day (GSOD) archive (https://www.ncei.noaa.gov/data/global-summary-of-the-day/archive/, accessed on 28 July 2026) [20]. Daily precipitation records (2000–2024) from 12 meteorological stations surrounding Laiyuan County were selected.
Basic geographic data: The Digital Elevation Model (DEM) was derived from the GDEMV2 30 m resolution digital elevation data available on the Geospatial Data Cloud (https://www.gscloud.cn, accessed on 28 July 2026). ArcGIS 10.8 was used to extract elevation, slope, aspect and relief; land-use data was downloaded from the Resource and Environment Science and Data Center, Chinese Academy of Sciences (https://www.resdc.cn, accessed on 28 July 2026) in the form of 30 m resolution land-use data for 2020; this includes eight land-use categories such as arable land, forest land and built-up land; watercourse distribution data is sourced from the 1:250,000 National Basic Geographic Database (http://www.webmap.cn, accessed on 28 July 2026), comprising features such as rivers, lakes and reservoirs.

2.2.2. Data Processing

The spherical distance from each station to Laiyuan County was calculated using the Haversine formula based on station coordinates. In total, the 12 nearest stations were selected: Jining, Datong, Wutai Mountain, Weixian, Yuanping, Shijiazhuang, Zhangjiakou, Huailai, Beijing, Tianjin, Baoding and Botou (Figure 1b). Basic information for the 12 selected stations, including coordinates, number of records, mean annual precipitation, and maximum daily precipitation, is provided in Table 1. Based on daily precipitation data for the study area from 2000 to 2024, the Pearson Type III distribution was then used for precipitation frequency analysis because it is widely applied in hydrological frequency estimation in China and is suitable for positively skewed precipitation series. Compared with GEV and Log-Pearson Type III, Pearson Type III is more consistent with regional hydrological practice and provides an interpretable basis for scenario construction. Recent studies on extreme rainfall return periods in China have also used the Pearson-III distribution to establish rainfall frequency curves, such as an analysis of an extreme rainstorm in the Xiaohua Section of the Yellow River in July 2021 [21]. The sample mean, coefficient of variation (Cv), and coefficient of skewness (Cs) were calculated for each precipitation series. The design precipitation corresponding to a return period T was estimated using the Pearson Type III frequency factor method:
XT = Xmean (1 + CvΦT)
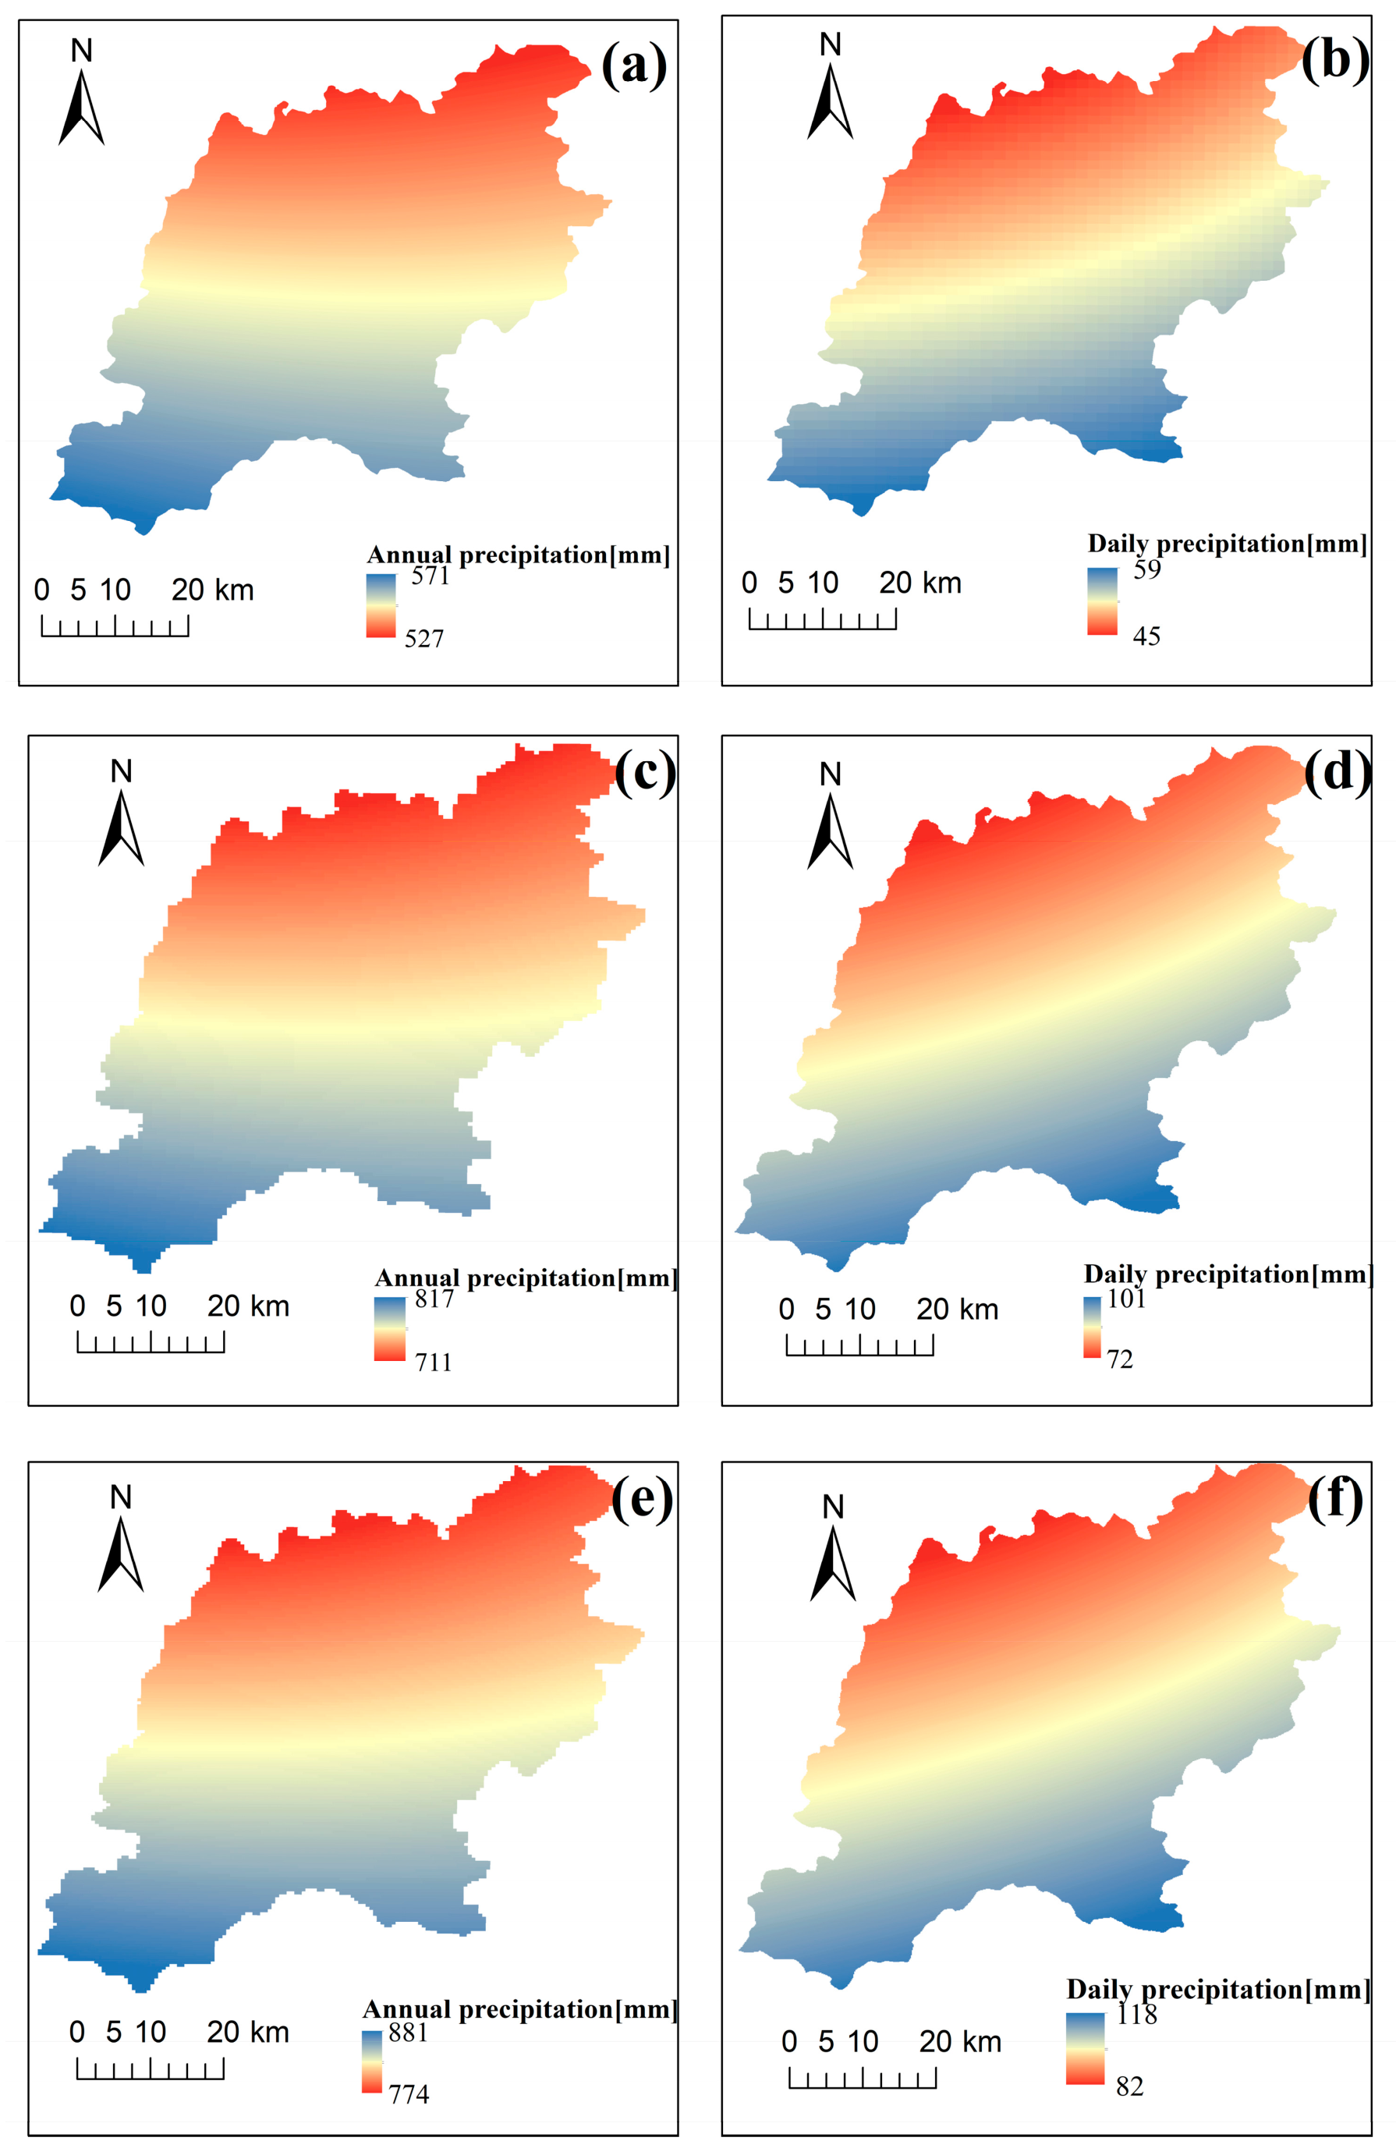
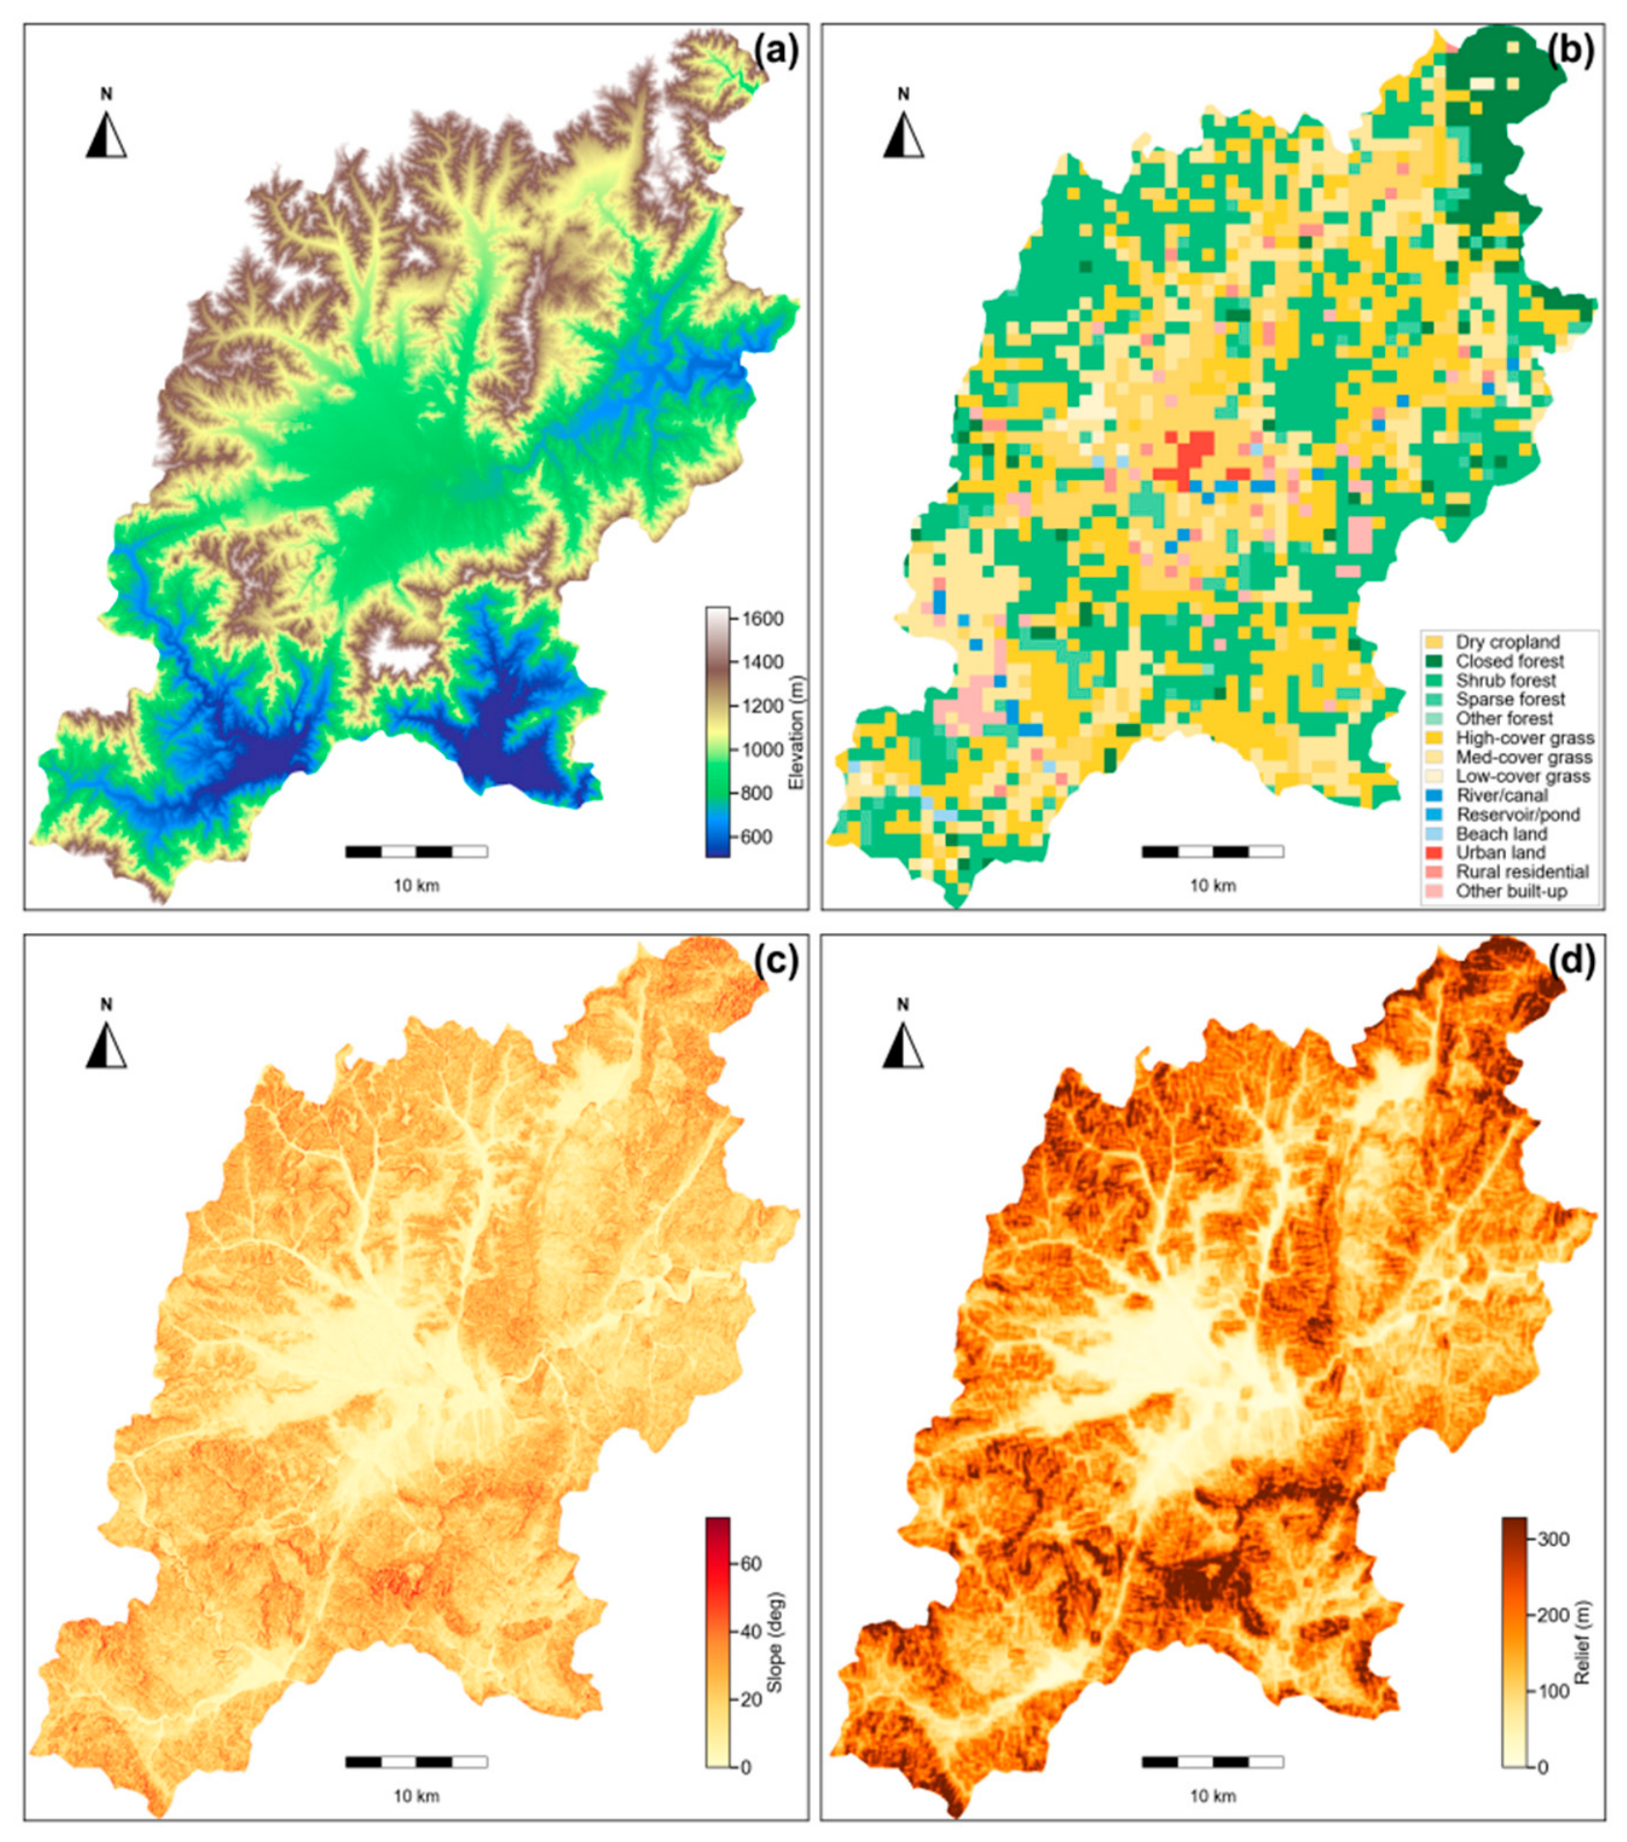
where XT is the design precipitation for return period T, Xmean is the sample mean, Cv is the coefficient of variation, and ΦT is the Pearson Type III frequency factor determined by Cs and the exceedance probability. The 20-year and 50-year return period values of annual total precipitation and annual maximum daily precipitation were then used to construct the extreme precipitation scenarios. However, the 50-year return period estimate was derived from a 25-year record and therefore involves extrapolation uncertainty. Thus, the 20-year and 50-year values were used as scenario-based inputs for comparative hazard assessment rather than deterministic engineering design values. Kriging interpolation was performed using the Geostatistical Wizard in ArcGIS to generate 30 m resolution precipitation raster data, thereby achieving full spatial coverage of the study area and ensuring consistency with the DEM and AccRo computational grid. The spatial distributions of the interpolated precipitation variables under different statistical conditions and return periods are shown in Figure 2. Topographic and hydrological data were pre-processed using ArcGIS software to extract elevation, slope, and terrain roughness from the DEM, and the river network density was calculated using hydrological analysis tools (Figure 3). All data were uniformly projected to the CGCS2000_3_Degree_GK_CM_114E coordinate system and cropped to the study area boundaries to ensure spatial consistency.

3. Methods

3.1. Dynamic Evaluation Framework for Flood Disaster Hazard Under Extreme Precipitation Scenarios

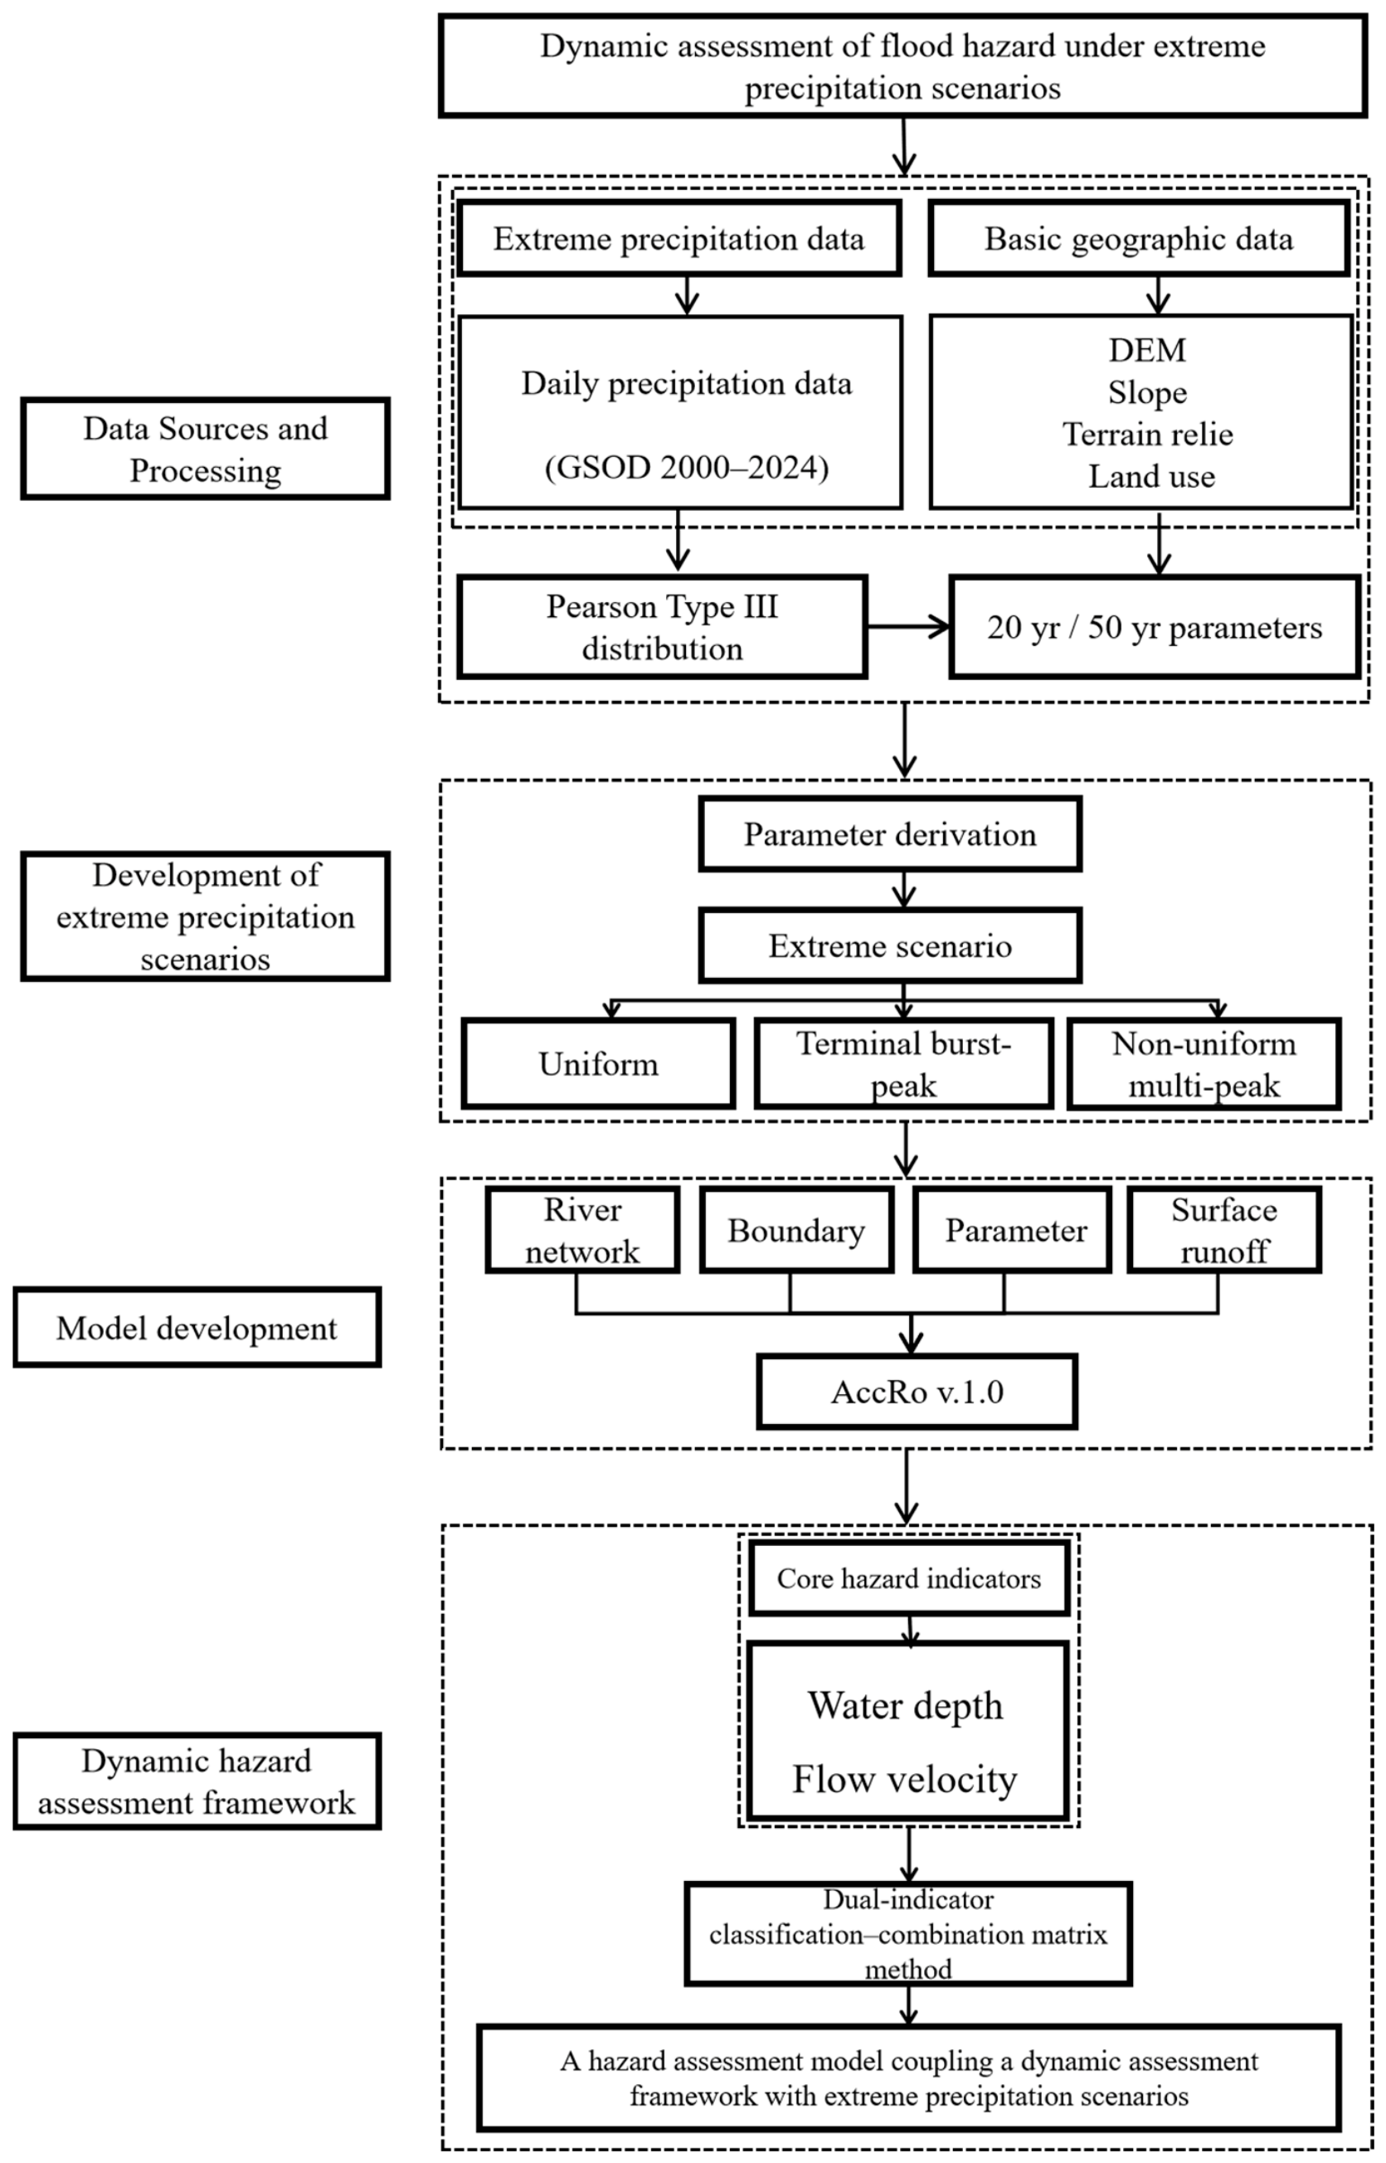
This study establishes a multi-stage assessment framework of “data-driven scenario construction–hydrodynamic simulation–dual-indicator classification–township aggregation” (Figure 4). Based on NOAA NCEI Global Summary of the Day (GSOD, 2000–2024), ASTER GDEMV2 30 m DEM, 30 m land cover data for 2020, and 1:250,000 river network data as foundational inputs, four extreme precipitation scenarios were constructed using the Pearson Type III frequency distribution to derive 20-year and 50-year return period extreme precipitation parameters, combined with the observed hyetograph of the July 2023 event. The accumulation-based runoff and pluvial flood estimation tool (AccRo v.1.0) was employed to simulate inundation dynamics under each scenario through iterative flow accumulation (FAF) and Gauckler-Manning-Strickler hydraulic routing, yielding grid-scale water depth and flow velocity for each selected rainfall-duration node. Grid-scale hazard results were then aggregated to the township level via area-weighted mean scoring. The documented 2012 and 2023 rainstorm-flood events were used as independent historical references to qualitatively examine whether the simulated high-hazard zones corresponded to townships that had experienced severe flood impacts.

3.2. Development of Extreme Precipitation Scenarios

To characterize the differential impacts of different precipitation characteristics on flood hazard, this study used daily precipitation data from 2000 to 2024. A Pearson Type III distribution curve was applied to derive extreme precipitation parameters for 20-year and 50-year return periods, and four extreme rainfall scenarios were designed based on the observed July 2023 event. The observed July 2023 rainfall process provided the local temporal pattern reference for the scenario design, particularly its short-duration rainfall peak superimposed on a sustained rainfall background and its multi-peak rainfall structure. Specifically, Scenario 1 represents a baseline stress scenario with annual rainfall compressed into a uniform rainfall process; Scenario 2 represents a uniform 50-year design storm; Scenario 3 represents a 50-year design storm with a short-duration rainfall peak superimposed on a uniform rainfall background; and Scenario 4 represents a generalized multi-peak rainfall pattern based on the observed structure of the July 2023 extreme rainstorm event. To avoid assessment biases arising from inconsistent time scales, the simulation duration for all four scenarios was uniformly set at 12 h.
Scenarios 1 and 2 distribute the annual average rainfall (571.0 mm) and the 50-year return period rainfall (884.0 mm) uniformly over a 24 h period, respectively; however, only the rainfall events occurring during the first 12 h are analyzed. The corresponding cumulative rainfall amounts are approximately 285.6 mm and 441.6 mm, respectively, with the rainfall intensity remaining constant to represent a scenario of prolonged steady-state rainfall. Scenario 3 draws on the characteristics of the sudden emergence of extreme rainfall peaks during the latter stages of the July 2023 event. For the first 11 h, the same uniform intensity as Scenario 2 (36.8 mm/h) is maintained; in the 12th hour, the 50-year return period daily maximum rainfall (118.0 mm) is superimposed, resulting in a total rainfall of 522.8 mm over 12 h. This scenario aims to characterize the disaster-inducing impact of short-duration, intense rainfall peaks against a background of continuous rainfall. This design preserves the temporal feature of sustained rainfall followed by a late-stage rainfall peak observed in the July 2023 event, while using frequency-analysis-derived rainfall magnitudes to represent a conservative extreme rainfall stress condition. Scenario 4 compresses the annual average total rainfall (571.0 mm) entirely into a 12 h period and adopts a non-uniform rainfall pattern of “increasing–bimodal–decreasing” (Table 2). This simulates the multi-peak structure of actual torrential rain, facilitating cross-comparisons with Scenario 1 (same total volume but different duration) and Scenario 3 (same duration but different rainfall pattern).

3.3. Hazard Assessment Model

To simulate flood evolution processes under different extreme rainfall scenarios and to support dynamic hazard assessments across large areas and multiple scenarios, this study employs the accumulation-based runoff and pluvial flood estimation tool (AccRo v.1.0). This grid-based hydrodynamic model was created by Leistert et al. [16] and is based on an enhanced accumulation-based runoff algorithm. It has been effectively used for storm flood mapping and hazard assessment in urban and suburban areas. It computes important hazard factors at large spatial scales with comparatively low computational cost, such as water depth, flow velocity, and discharge per unit width for a specified rainfall-runoff input.

3.3.1. Models for Estimating Cumulative Runoff and Floods

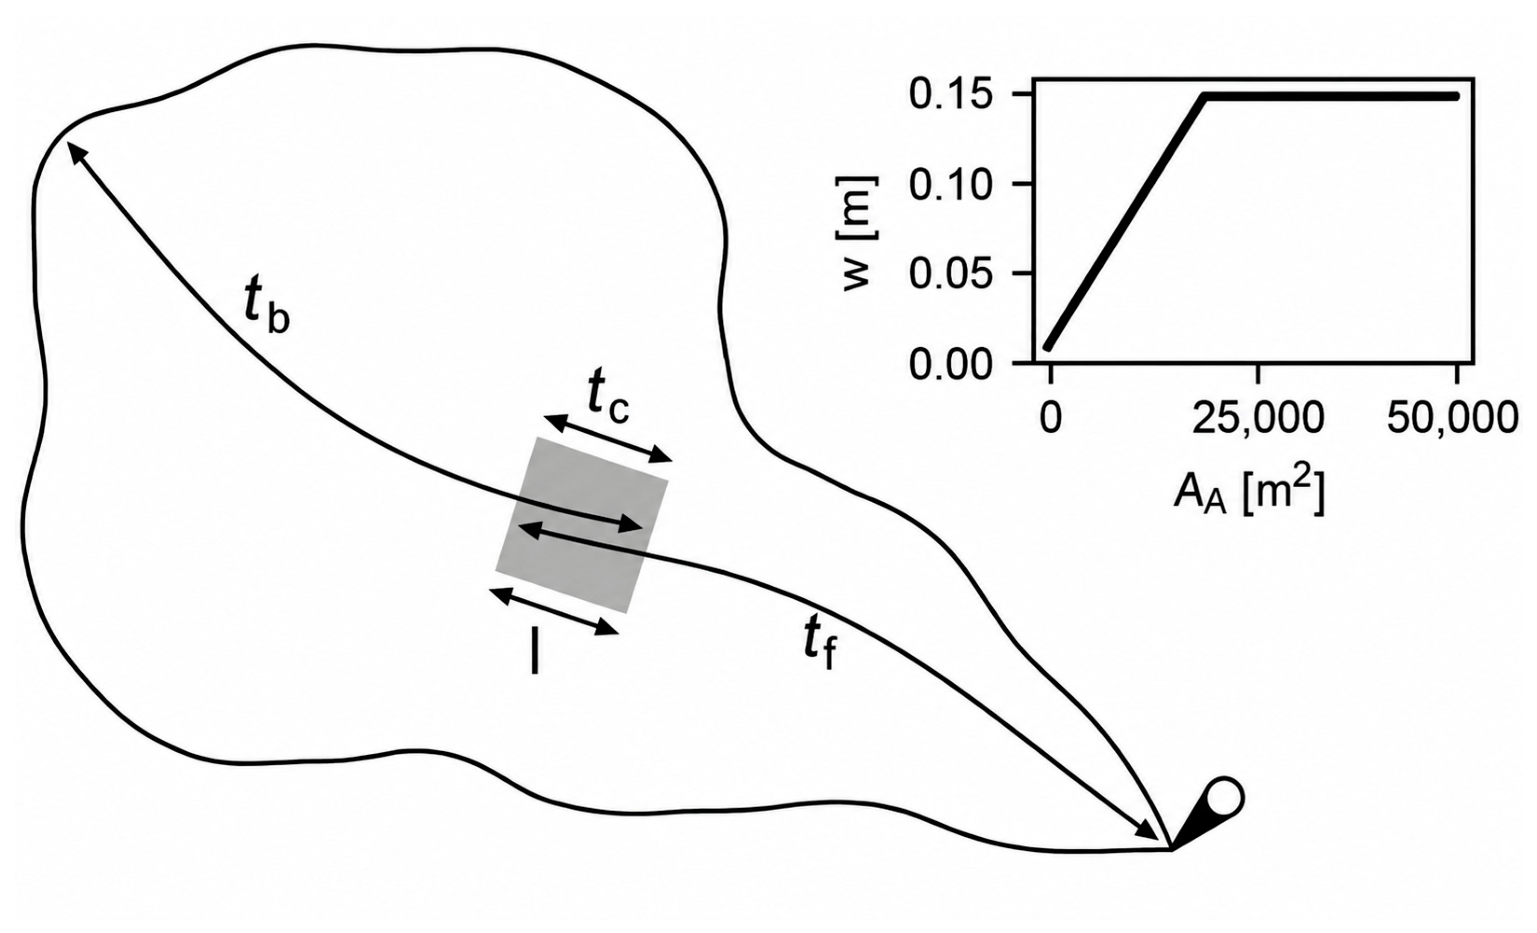
The AccRo model uses an iterative flow accumulation technique to mimic the convergence and inundation processes of surface runoff. It is based on a Digital Elevation Model (DEM). Before the flow accumulation calculation, the DEM is processed using the hydrological treatment embedded in the AccRo workflow. A sink-filled DEM generated with the richDEM epsilon-filling procedure is used for D8 accumulation and backward flow-time estimation. In the iterative accumulation process, simulated inundation depth is added to the DEM surface to update the water-surface topography, allowing channels, hollows, and local sinks to be progressively filled and overflowed. The model calculates the total accumulated runoff (As) for each grid cell using the flow accumulation function (FAF) from the richDEM library and the surface runoff intensity (s) of each grid cell as a weighting factor. In the original AccRo framework, the surface runoff intensity (s) can be generated using the RoGeR model, which represents rainfall–runoff conversion by partitioning rainfall into matrix infiltration, preferential infiltration, surface runoff, and subsurface runoff components [22]. Following this modeling concept, the rainfall intensities specified in the four extreme precipitation scenarios were used to construct the temporally distributed surface runoff intensity input for AccRo. The accumulated runoff (As) is then transformed into the maximum unit width discharge (qmax) by establishing a relationship between the backward travel time (tb) and the accumulated runoff (Figure 5). For a specified rainfall-duration input, spatially heterogeneous roughness parameters assigned according to land-use types were incorporated into the Gauckler–Manning–Strickler hydraulic calculation to obtain the AccRo-derived maximum water depth (wmax) and maximum flow velocity (vmax) for each grid cell. The following is a summary of the main computing steps:
  • Calculate the backward travel time (tb)
tb represents the total time required for water to flow from the current grid cell to the catchment outlet, calculated by accumulating backwards from the catchment outlet towards the upstream. First, the flow time (tc) for each cell is estimated based on the initial water depth; then, tb is calculated for each cell by accumulating from the highest point of the catchment downstream:
t c = l v c
v c = k R 2 3 i 0.5
where l is the grid side length (m), v_c is the unit flow velocity (m/s), k is the Strickler roughness coefficient (m^(1/3)/s), R is the hydraulic radius (approximated as the water depth w, m), and i is the grid gradient.
b.
Estimating the maximum unit width discharge from cumulative runoff (qmax):
Using the relationship between the surface runoff response curve for a given event and tb, a conversion factor F is defined to convert the cumulative runoff As into the maximum unit width discharge:
q max = As · l · F
F is obtained by analyzing how the runoff response in a specific area varies with tb, reflecting the combined influence of the spatiotemporal distribution of rainfall and the characteristics of the catchment.
c.
Iterative simulation of the inundation process:
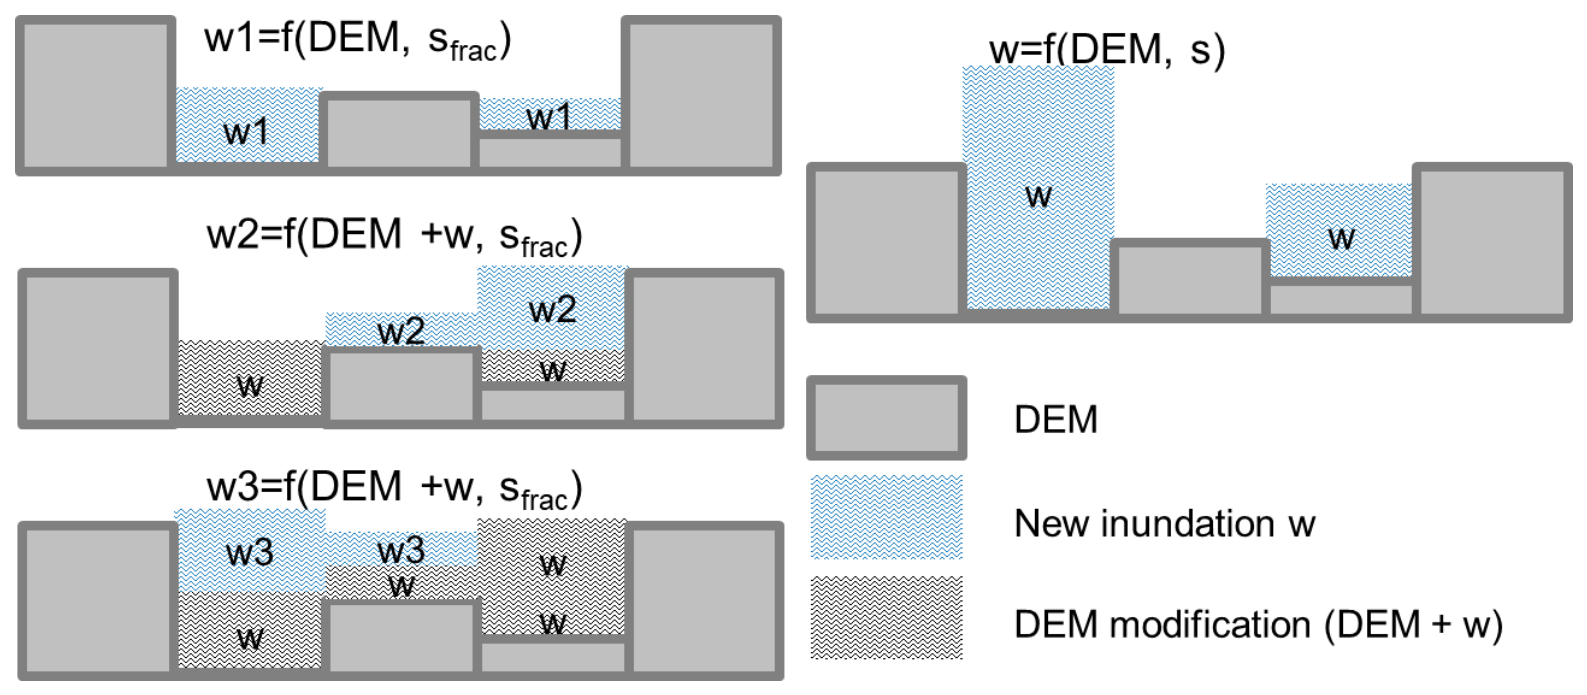
To simulate more realistically the changes in flow paths when water overflows river channels or fills depressions, AccRo employs an iterative calculation method. The total runoff (s) is divided into n equal portions, and the current water depth w is calculated in each iteration. This w is superimposed onto the DEM to serve as the basis for calculating the flow direction in the next iteration. Through multiple iterations, the process of water gradually filling depressions and expanding the inundation area is simulated, thereby yielding an inundation spatial distribution that better conforms to hydrodynamic principles. A comparison of the effects of iterative flow accumulation versus single-pass accumulation on the inundation area is shown in Figure 6.
d.
Calculate the maximum water depth and maximum flow velocity:
Based on qmax, the maximum water depth wmax is calculated using the Gauckler–Manning–Strickler formula:
w max = Q max / 1000 i 0.5 k l 3 / 5
Here, Qmax = qmax l represents the total flow rate of the cell (m3/s). Upon completion of the iteration, the maximum flow velocity vmax is calculated based on the final water surface DEM gradient (inew) and wmax.
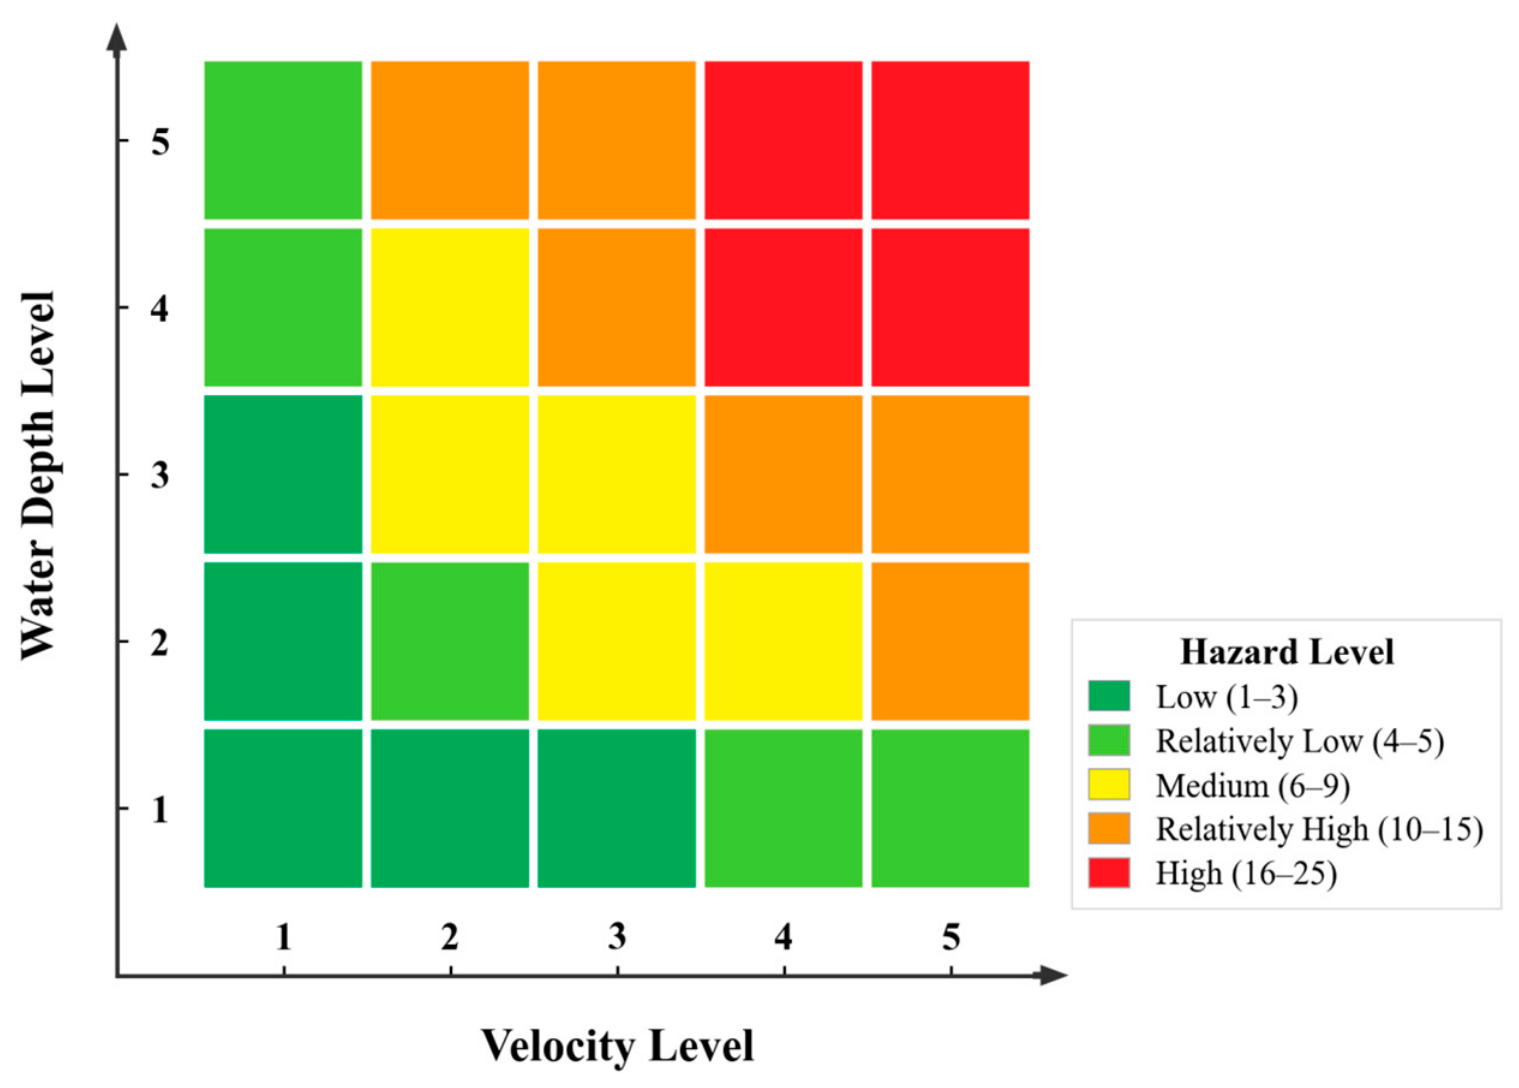
The classification thresholds for water depth and flow velocity were based on the second-phase technical report Flood Risks to People published by the UK Department for Environment, Food and Rural Affairs [23]. This framework provides a mature reference for depth–velocity-based hazard classification by considering the effects of inundation depth and flow velocity on human stability, vehicle passage, and building water ingress. However, because these thresholds were developed mainly under UK conditions and typical urban flood-risk settings, they were not applied unchanged in this study. Considering that Laiyuan County is largely mountainous, that the river valleys have steep gradients, and that the population and buildings are highly concentrated in narrow valley floors, both water depth and flow velocity were classified into five levels—low, relatively low, medium, relatively high, and high—each assigned a score of 1 to 5 (Table 3 and Table 4). This multiplicative scoring matrix effectively distinguishes between hazard combinations in which one factor is high and the other low versus those in which both factors are high. For example, a depth score of 5 combined with a velocity score of 1 produces the same additive score as a depth score of 3 combined with a velocity score of 3. However, the corresponding multiplicative scores are 5 and 9, respectively, indicating a higher combined hazard when both indicators increase simultaneously. Thus, the multiplicative matrix reduces the potential masking effect of simple additive scoring.

3.3.2. Hazard Assessment and Zoning Methods

In this study, dynamic hazard assessment refers to the comparison of hazard states at selected rainfall-duration nodes. For each scenario and selected rainfall-duration node, the AccRo-derived maximum water depth (wmax) and maximum flow velocity (vmax) were extracted separately and used as the core hazard assessment indicators. A comprehensive evaluation was then conducted using the dual-indicator grading-combination matrix method. In accordance with the Technical Guidelines for Flood Risk Zoning (SL 762-2018) [24], the product of water depth and flow velocity was used to characterize flood impact, and a comprehensive flood hazard index ( HR ) was developed:
HR = w class × v class
In particular, w class and v class represent the graded values for water depth and flow velocity, respectively, with a range of 1–5 for each; when multiplied together, the resulting composite score ranges from 1 to 25. Referring to the general grading principles of the 5 × 5 hazard matrix, grading thresholds were determined based on the product values across the entire study area (Figure 7).
To present the results of the hazard assessment for different administrative units in a clear and intuitive manner, this study employed the area-weighted average method to conduct a comprehensive hazard zoning analysis of the 17 townships in Laiyuan County. The formula for calculating the area-weighted score (Sj) is as follows:
S j = i = 1 5 i × A i , j i = 1 5 A i , j
S j : weighted mean hazard score of township j (range: 1–5); i : hazard level (1–5: low, rel. low, medium, rel. high, high); and A i , j : flooded area (pixel count) of level i within township j .
This method calculates weighted scores by integrating the area composition of hazard zones at all levels, thereby more accurately reflecting the actual coexistence of multiple hazard levels within administrative units and preventing lower-level zones, which dominate in terms of area, from obscuring the actual contribution of high-hazard patches. The classification of hazard levels employs the natural breakpoint method. Using the weighted scores of each township as input, classification thresholds are determined through iterative optimization that minimizes within-group variance and maximizes between-group variance, thereby categorizing the 17 townships into five hazard levels: low, relatively low, medium, relatively high, and high.

4. Results and Analysis

4.1. Results of Flood Simulation

Of the four extreme precipitation scenarios, Scenario 4 employs a non-uniform, multi-peaked rainfall duration distribution scheme. Its “rising–double-peaked–declining” structure represents a stylized multi-peak pattern that is consistent with observed extreme rainstorm characteristics on the eastern foothills of the Taihang Mountains, and is used to characterize the rise, peak, and recession stages of rainfall forcing during flood development. Therefore, this section uses Scenario 4 as a representative example.
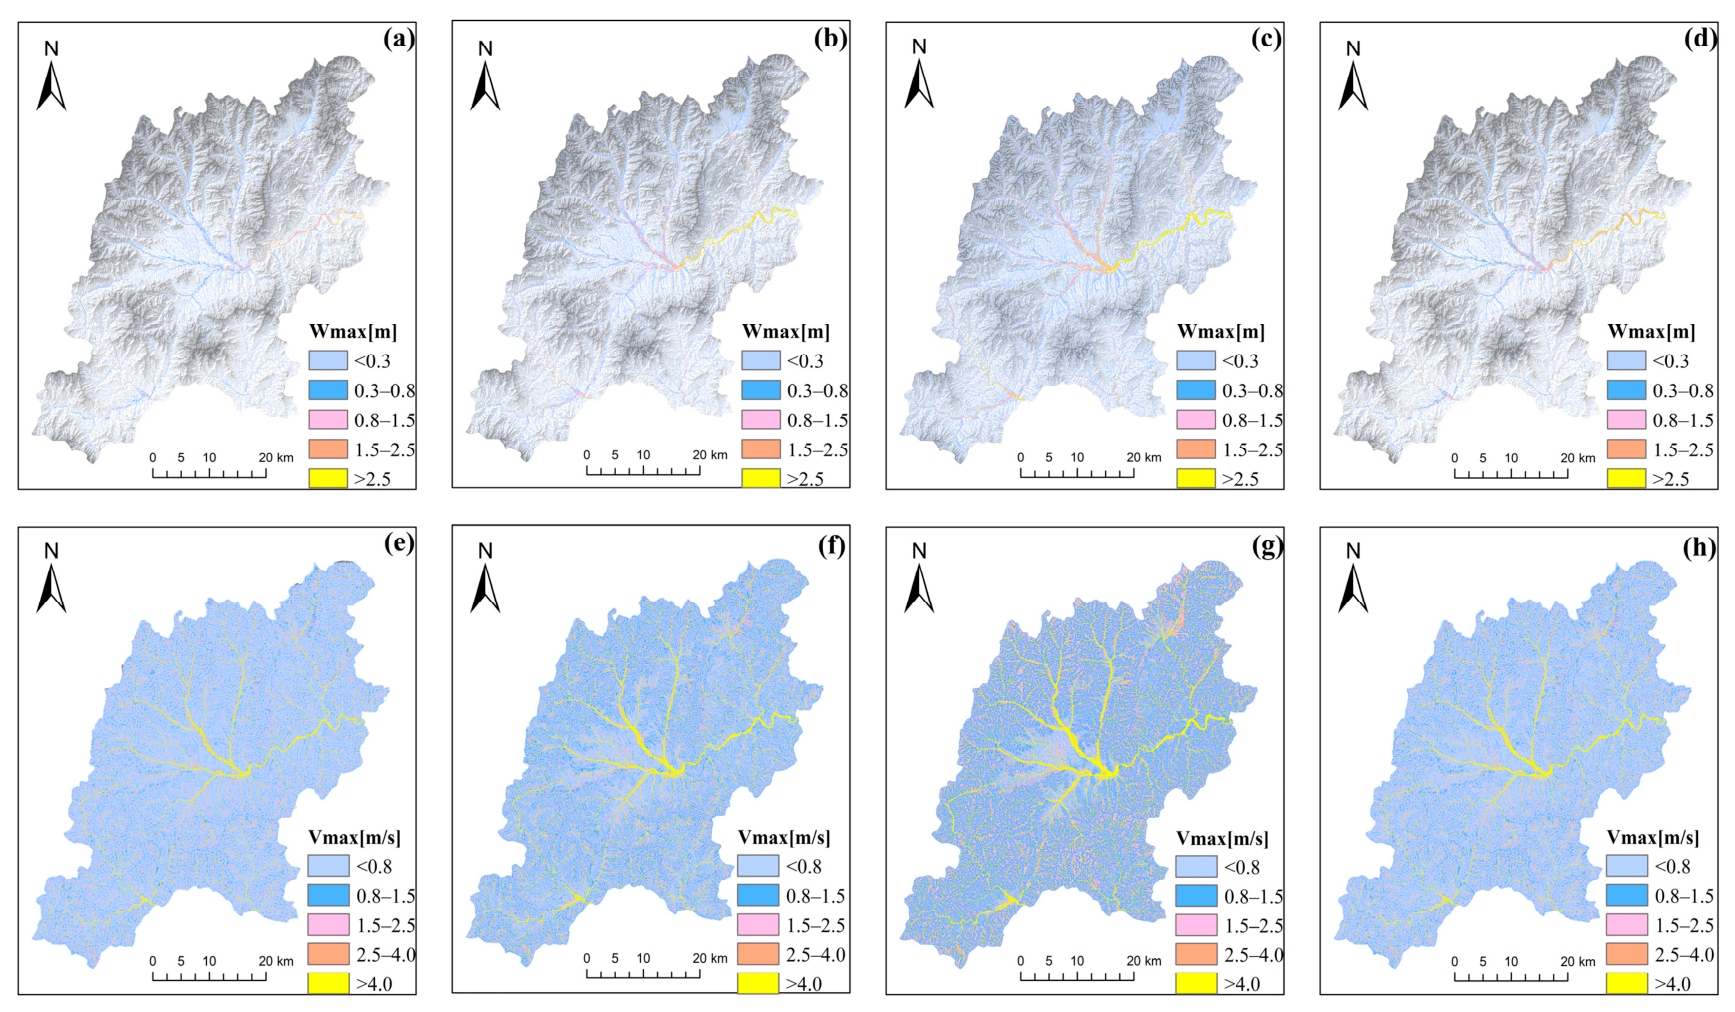
Figure 8a–d show the spatiotemporal distribution of water depth at four representative time nodes. At 3 h, the inundation area was limited, mainly confined to local sections of the Juma River; at 6 h, the inundation zone gradually expanded from the river channel into the valley on both sides, with water depths rising significantly in the river valley plain; at 8 h, corresponding to the peak of the double-peaked flood wave, both the inundation extent and water depth reached their maximum values for the entire period, with areas of high water depth clearly clustered in a strip-like pattern along the main channel of the Juma River and the valleys of its major tributaries; at 12 h, the inundation extent and water depth dropped sharply, essentially returning to initial levels, reflecting the hydrological characteristics of mountain rivers: steep gradients, rapid inflow, and swift recession. Figure 8e–h show the distribution of flow velocity at the corresponding time nodes. The spatiotemporal evolution of flow velocities is consistent with that of water depth. Areas of high flow velocity are distributed in linear patterns along the river channel, peaking at 8 h; flow velocities outside the river channel decay rapidly, while the floodplain is dominated by low-velocity overflow.
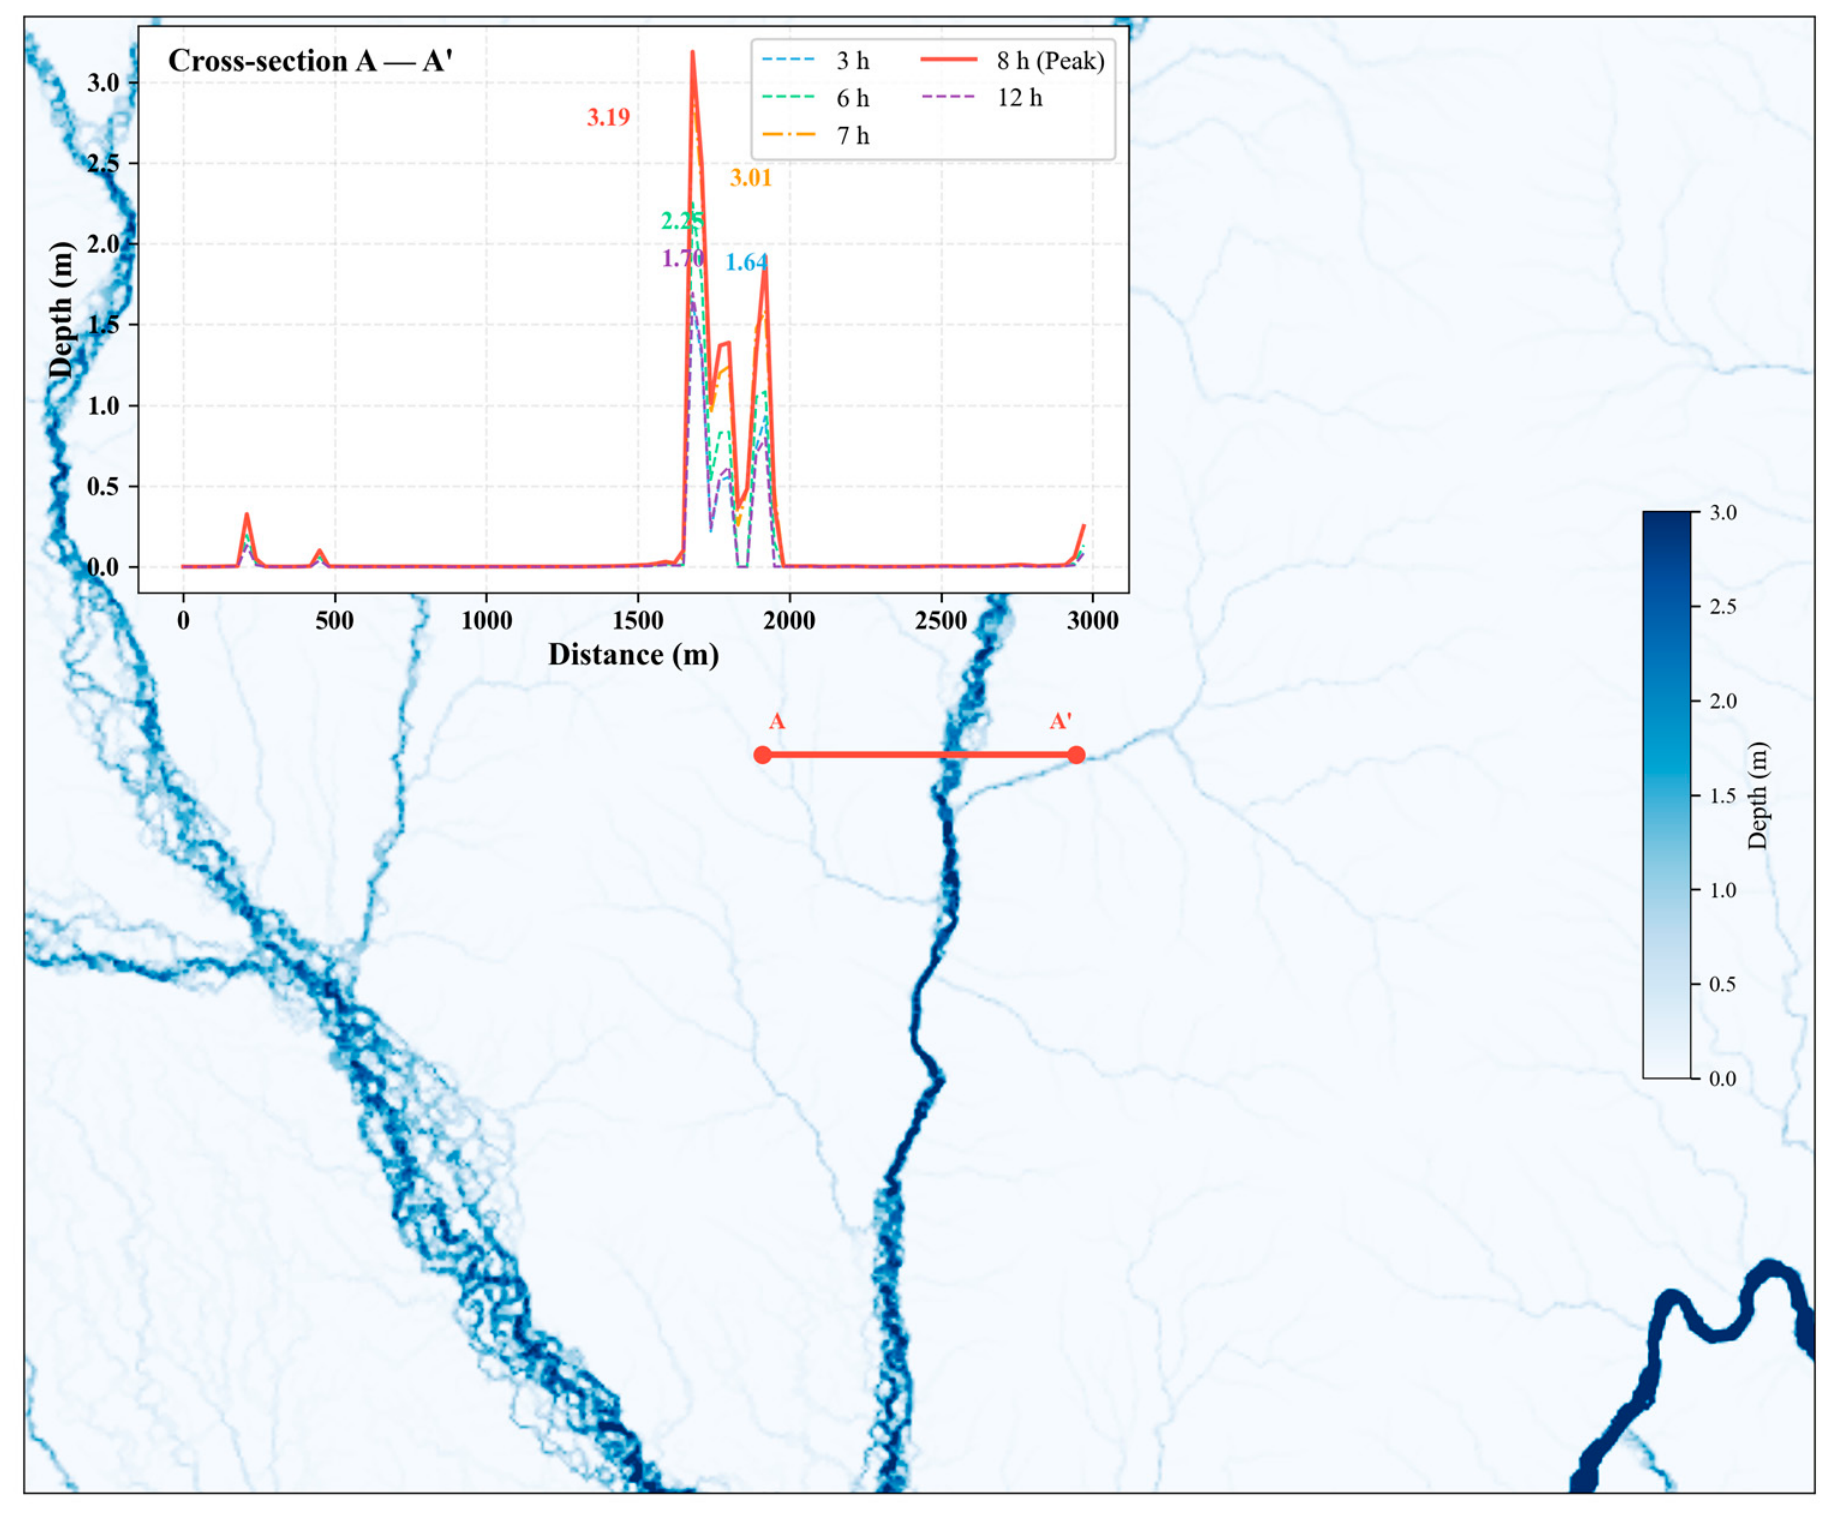
To quantitatively characterize the variation in water depth across the river valley cross-section during the flood, this study selected “cross-section A–A” (approximately 3 km in length; location shown in Figure 9), which traverses the main valley of the Juma River, and extracted water depth profiles at five selected time nodes. The maximum water depth at the cross-section rose from 1.64 m at 3 h to 2.25 m at 6 h, reached 3.01 m at 7 h, and peaked at 3.19 m at 8 h, before falling back to 1.70 m at the 12 h mark. These changes are used to indicate the relative variation in simulated water depth among selected time nodes rather than an exact deterministic prediction, because the absolute water-depth values are influenced by model parameterisation, DEM representation, roughness assignment, and rainfall inputs. The relatively small difference between the 7 h and 8 h profiles indicates that the cross-sectional water-depth response had approached a near-peak state after the first hour of intense rainfall under Scenario 4. The peak positions of all five curves were located at the main channel of the Juma River and did not shift throughout the entire flood process, indicating that the position of the main channel remained stable. The greatest increase in water depth occurred between the 6th and 8th hours, consistent with the two consecutive high-intensity rainfall periods during this stage.

4.2. Dynamic Hazard Assessment

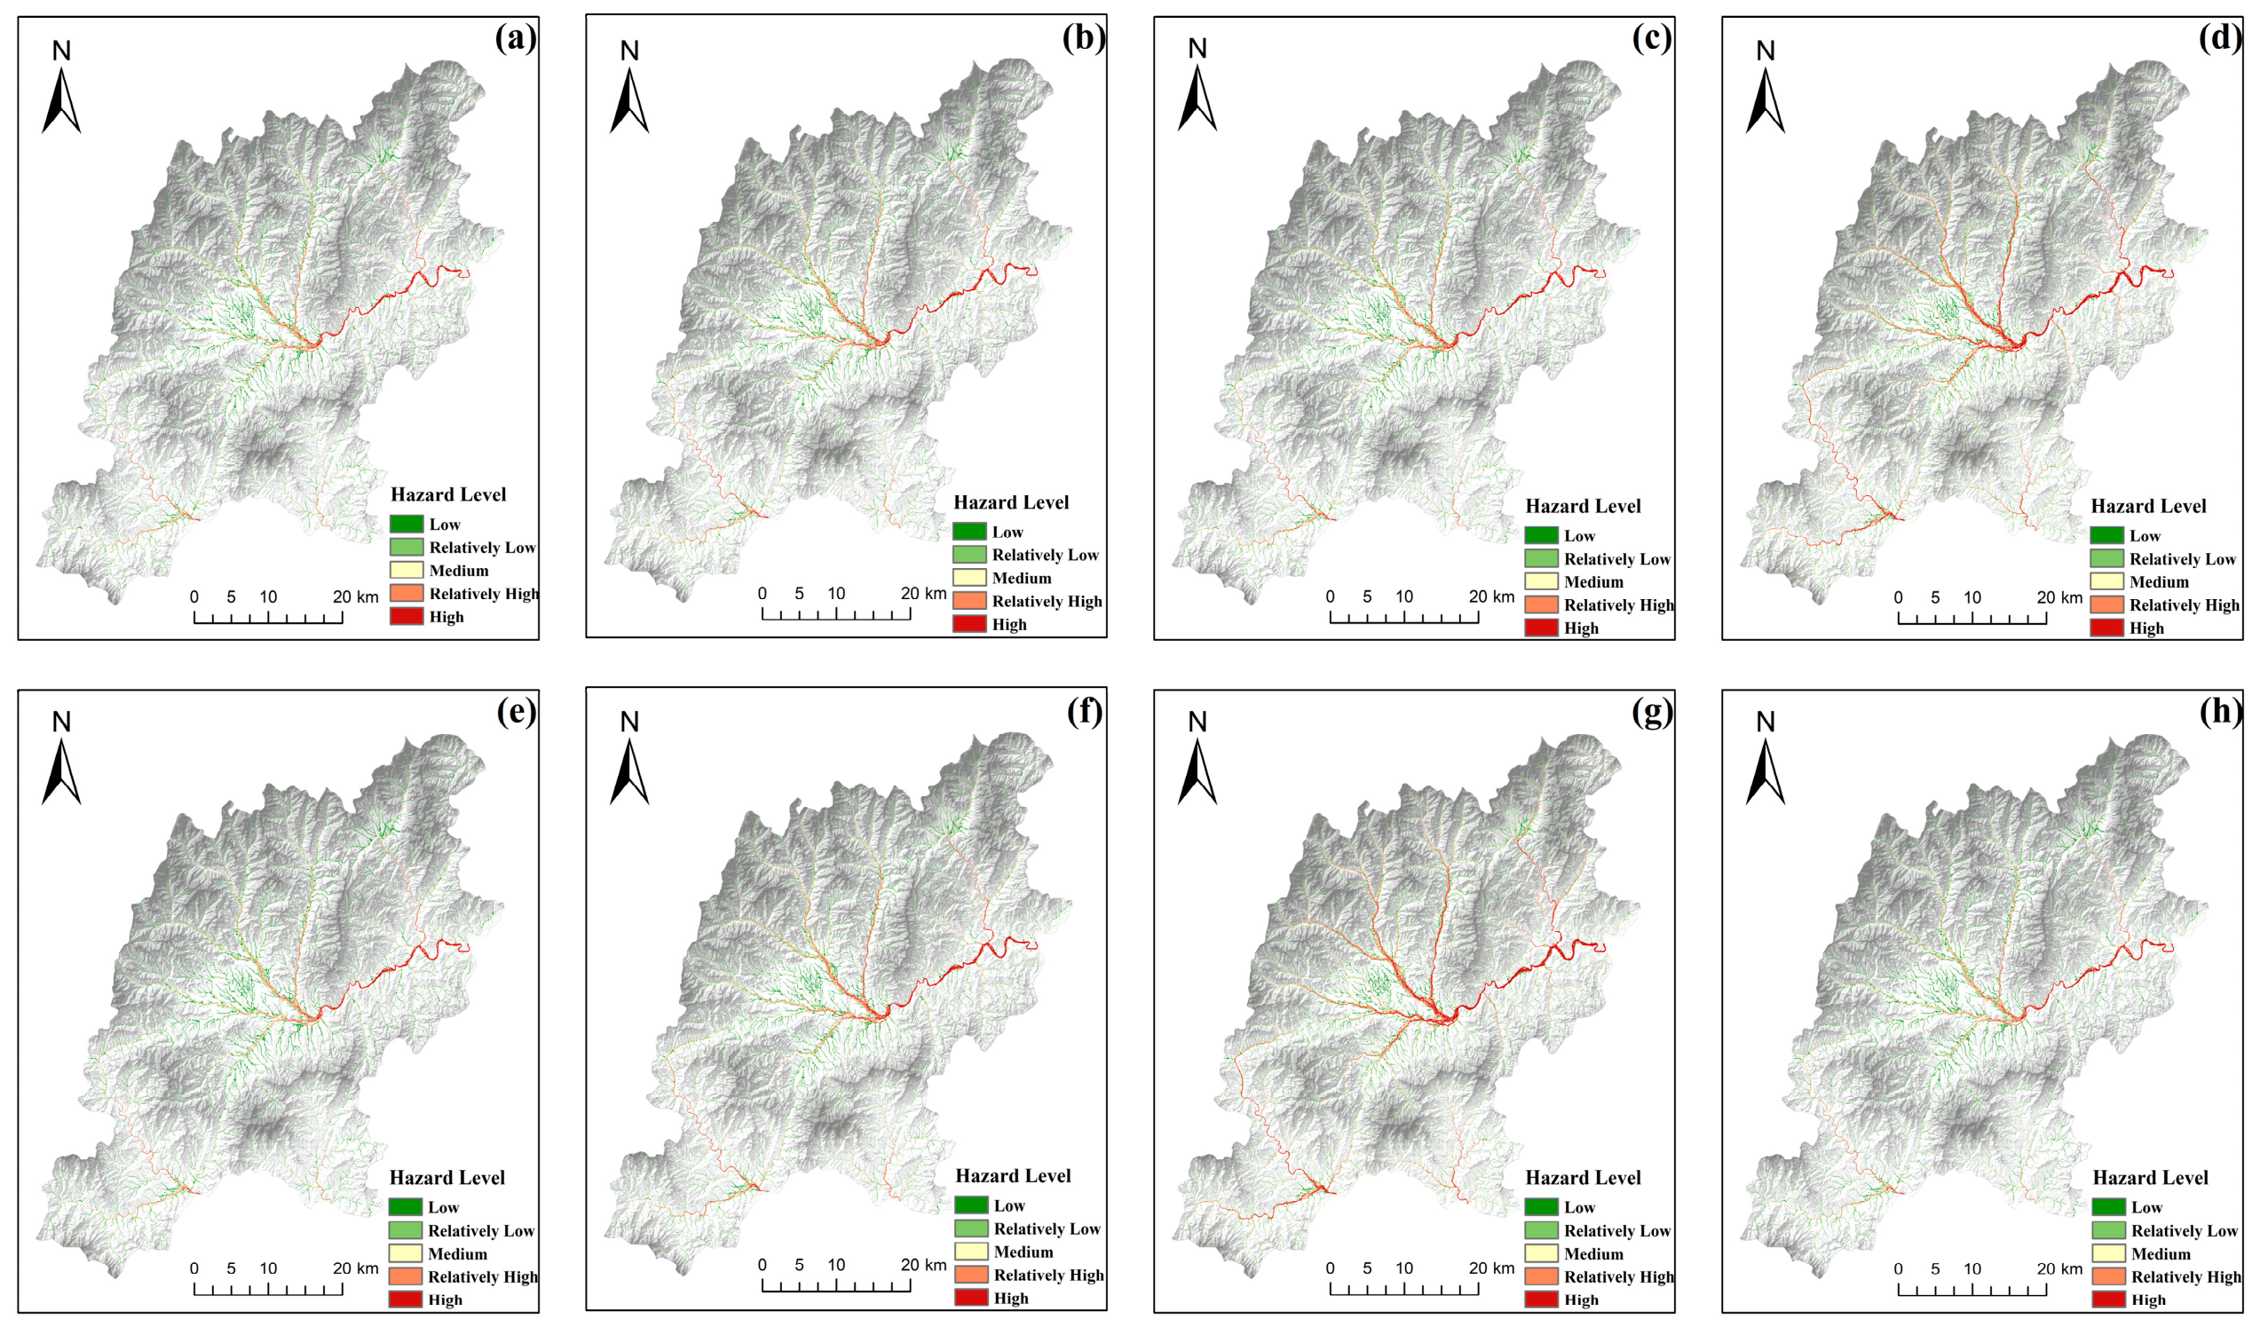
To provide a visual comparison of the spatio-temporal evolution of flood hazard under different rainfall scenarios, a total of eight hazard level distribution maps were extracted for key time points in each scenario (Figure 10): as Scenarios 1 and 2 involved uniform rainfall throughout, with hazard increasing monotonically over time, only the final state at 12 h is shown; Scenario 3 presents data for the 11th and 12th hours; Scenario 4 presents data for four representative time points: the 3rd, 6th, 8th and 12th hours.
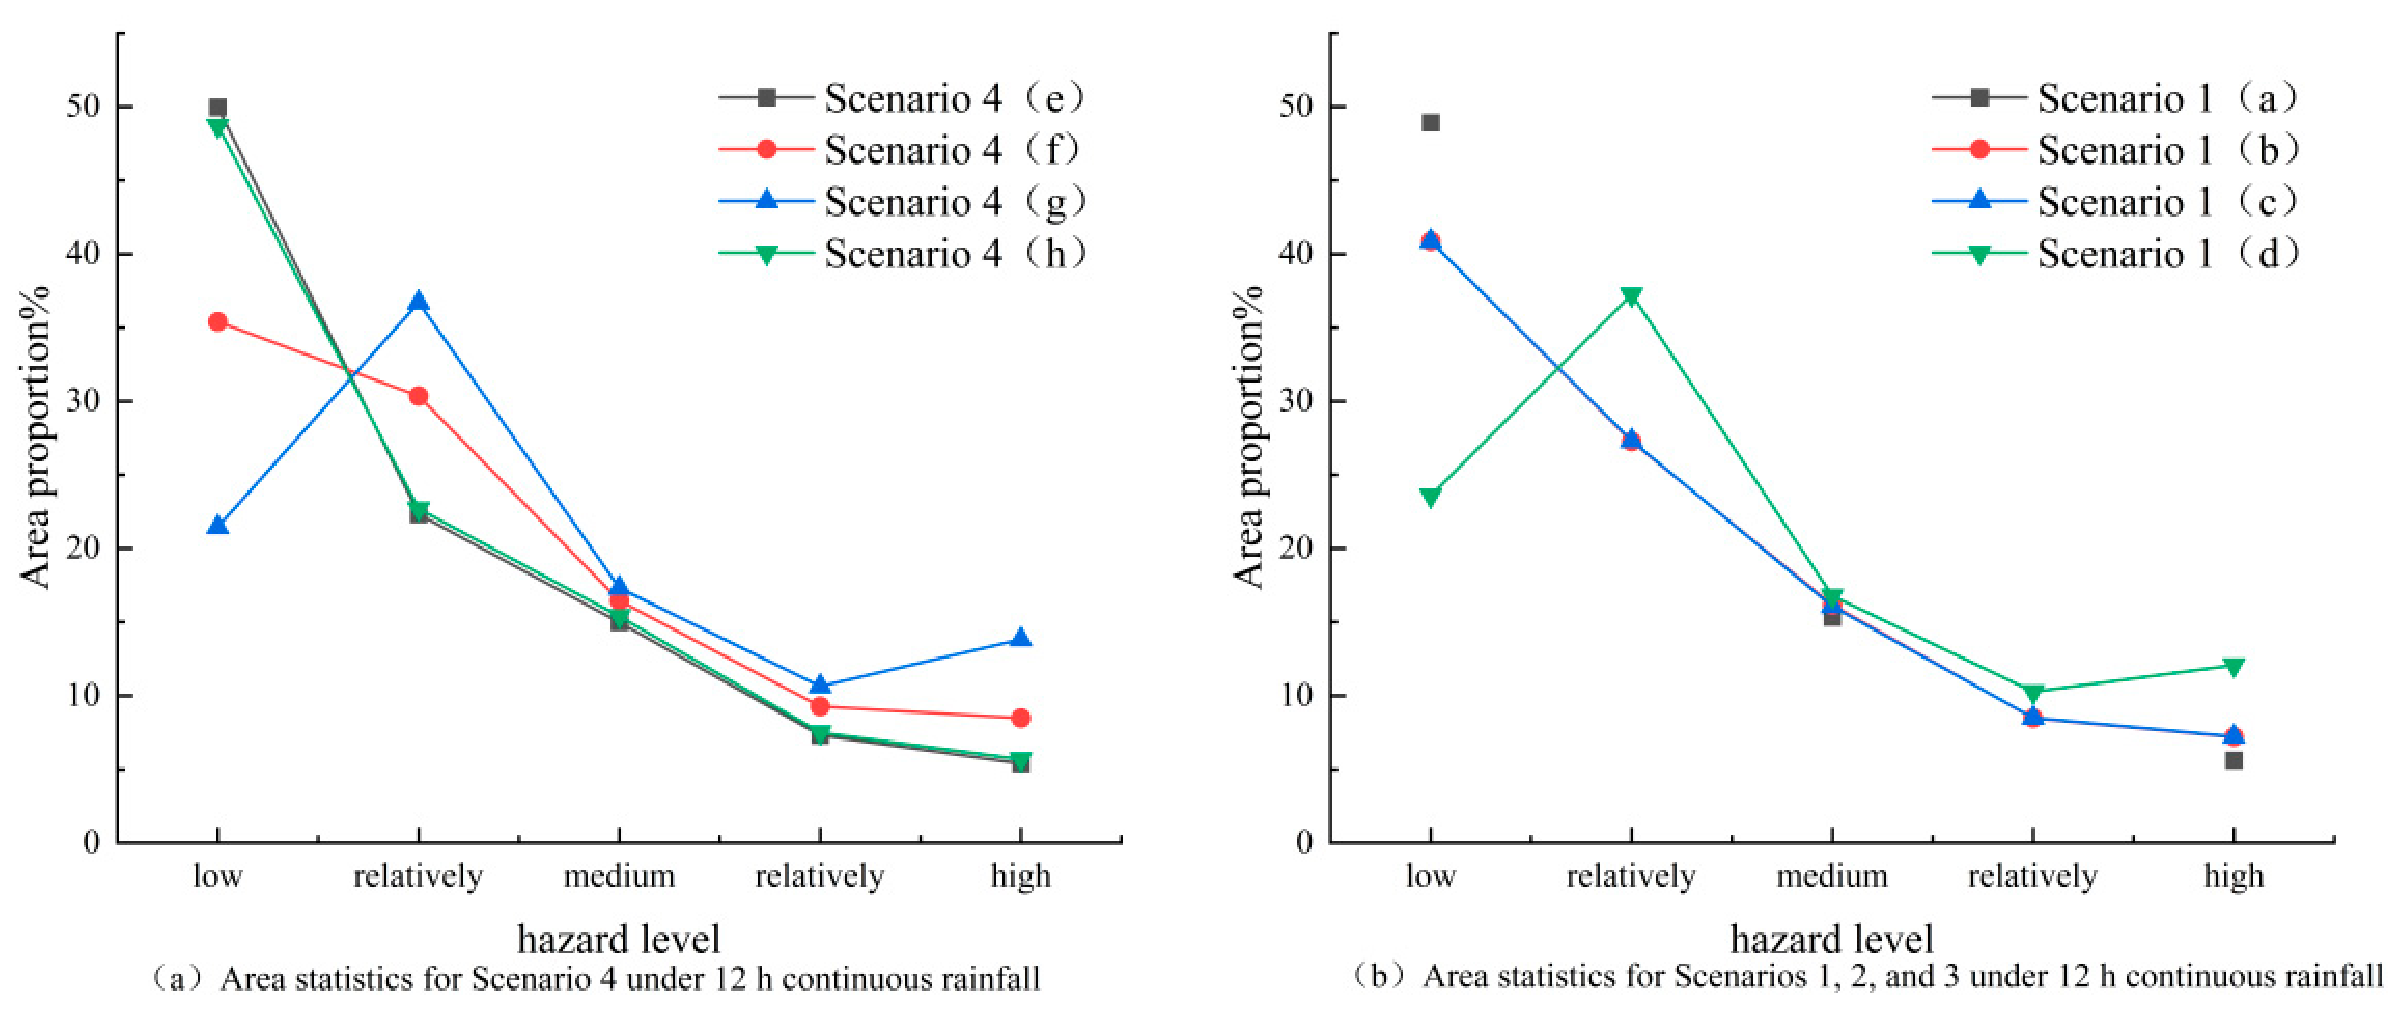
In terms of time, the hazard under different rainfall scenarios follows markedly different trajectories, highlighting the controlling influence of rainfall patterns and peak intensity on hazard evolution (Figure 11).
Scenario 3 simulates an extreme scenario in which a short-duration intense rainfall peak is superimposed on the final stages of a prolonged steady-state rainfall event. Eleven hours prior to the onset of the intense rainfall peak, the total inundation area was 170.23 km2 (Table 5). At this point, the hazard levels were predominantly “low and relatively low”, accounting for a combined 68.2% of the total, while the area classified as “high” hazard was only 12.30 km2. This indicates that during the phase of uniform rainfall intensity, the accumulated runoff had not yet reached the threshold for triggering a high-hazard level, and the increase in hazard was relatively gradual. When the 50-year return period short-duration heavy rainfall peak was superimposed at the 12 h mark, the flood hazard underwent a dramatic change within one hour: the total inundation area surged to 213.03 km2, an increase of 25.14%; the area of high-hazard zones surged from 12.30 km2 to 25.73 km2, representing a growth rate of 109.19%; the area of higher-hazard zones also increased by 51.45%. Concurrently, the area of low-hazard zones decreased by 27.74%, with a large number of previously low-hazard areas rapidly transforming into medium- and high-hazard zones. These results reveal the non-linear amplification effect of short-duration heavy rainfall on flood hazard in mountainous areas: extreme rainfall intensity far exceeds the capacity for surface infiltration and river discharge within a short timeframe, leading to rapid runoff accumulation. This is particularly pronounced in the transitional zones between hilly and mountainous terrain with steeper gradients, where the rate of convergence is faster and the impact more severe.
Scenario 4 simulates a rainfall event with a similar total volume but a non-uniform, multi-peaked temporal distribution; the evolution of the flood hazard exhibits a complete flood peak passage curve, rising initially and then declining. During the early stages of the rainfall, the inundated area was 164.83 km2, while the high-hazard area covered only 8.89 km2 (Table 6). As rainfall intensity gradually reached its double-peak maximum by the 8th hour, flood hazard rose sharply. By the 8th hour, the total inundation area peaked at 209.57 km2, while the areas of high-hazard and higher-hazard zones increased to 28.99 km2 and 22.32 km2, respectively, representing growth rates of 226.10% and 85.07%, respectively, compared to the baseline at the 3 h mark. This constituted the moment of highest disaster hazard throughout the entire rainfall event, corresponding to the cumulative effect of the double-peak structure observed during the July 2023 event on surface runoff generation. The first peak fully saturated the soil, while the subsequent peak was almost entirely converted into over-percolation runoff, forming the flood peak. However, in the latter stages of the rainfall, as the intensity of the rain diminished, the hazard did not remain at a high level; the area of high-hazard zones rapidly fell to 9.14 km2, and the total inundation area also dropped to 160.90 km2, representing a significant decrease. This dynamic recession process reflects the hydrological characteristics of the mountainous rivers in Laiyuan County, which are characterized by steep gradients, rapid runoff, and swift receding water levels.
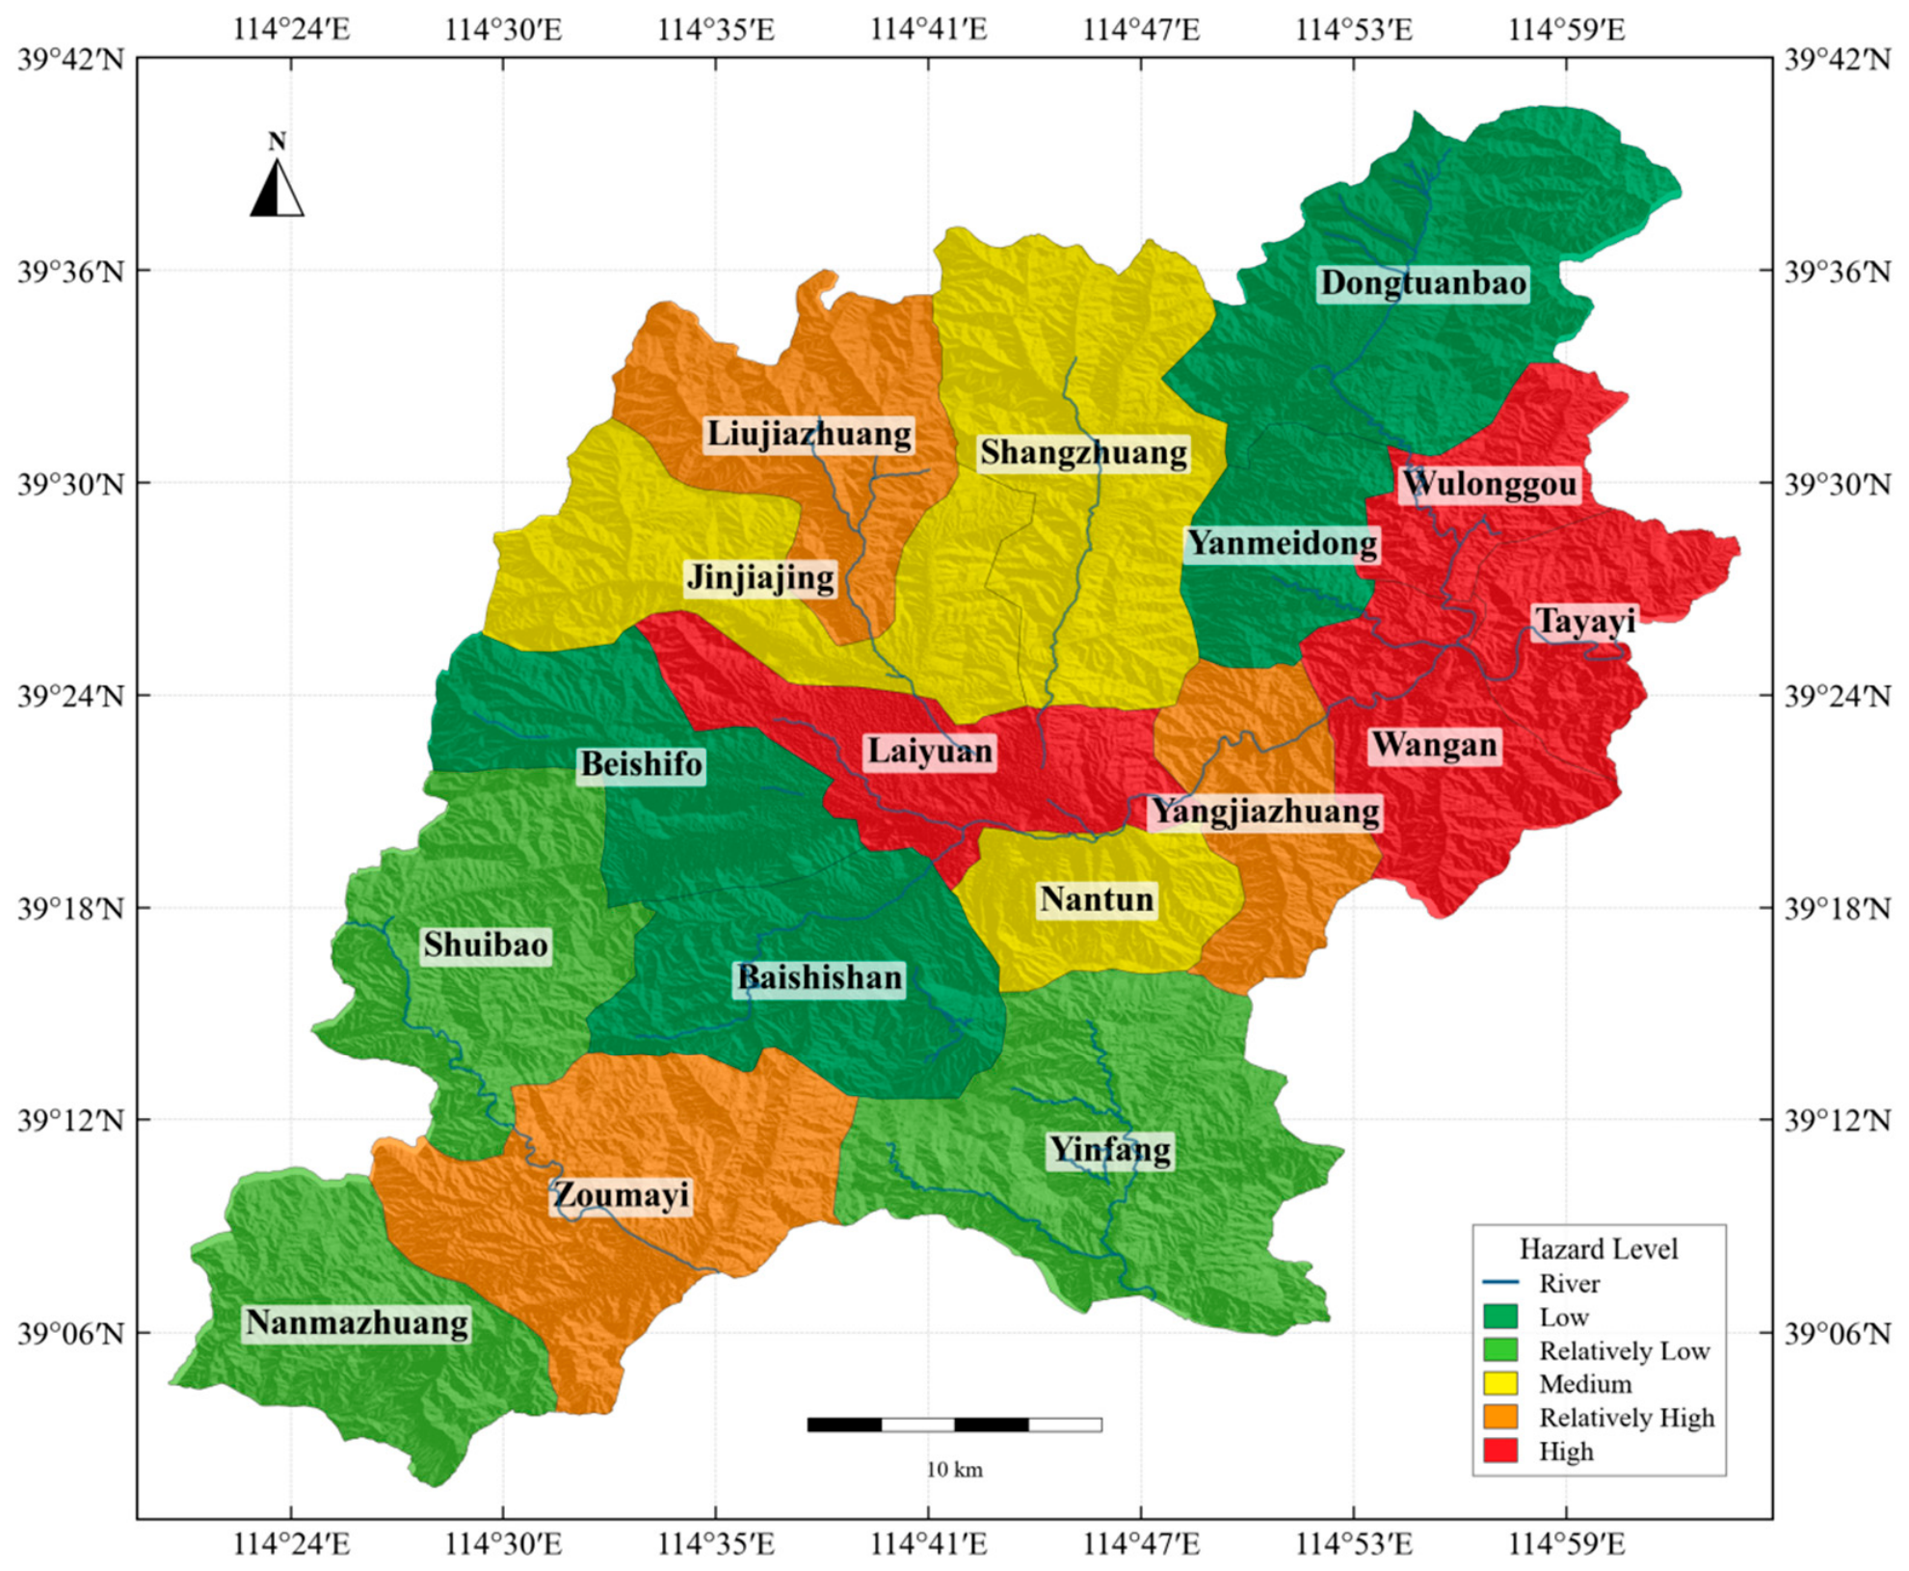
Grid-scale hazard assessment results were aggregated to the township level using the area-weighted average method, yielding a five-level hazard classification for the 17 townships (Figure 12). The township-level classification should be interpreted as an administrative aggregation of grid-scale hazard results for disaster-management purposes, rather than as a hydrological-basin-based classification. Therefore, a township containing the main river channel or local high-hazard patches may still be assigned a lower overall class if high-hazard areas occupy only a limited proportion of its administrative area. The distribution of hazard in Laiyuan County closely aligns with the basin topography and hydrological pattern of the surrounding area, a basin-in-mountain topography with elevated peripheries and a low-lying central valley. It exhibits a distribution pattern characterized by band-like clusters in river valley plains and linear extensions along ravines in hilly and mountainous areas. Under the extreme rainfall scenarios of Scenario 3 at 12 h and Scenario 4 at 8 h, high-hazard areas are highly concentrated in the river valley plains along the Ju River and its major tributaries. Population- and economically dense areas such as Laiyuan Town, Wang’an Town and Yangjiazhuang Town, situated in the Juma River main valley, are almost entirely covered by high- and very high-hazard zones. The flat topography of the river valley plains and the dense river network act as natural collection points for surface runoff, with the topographic convergence effect significantly amplifying the hazard. In contrast, the low-hazard townships of Yancoudong and Dongtuangbao are predominantly situated in mountainous areas on the periphery of the county. These regions feature higher elevations and steep slopes; although rainfall may increase due to orographic lifting, the retention time of surface runoff is short, making it difficult for large-scale, deep flooding to develop. As can be observed in Figure 10, even in low-hazard areas, during the eighth hour of Scenario 4, medium- and high-hazard bands distributed in a linear pattern appeared along the sides of some deeply incised valleys and narrow river channels. This indicates that in mountainous and hilly areas, the threat of flooding does not disappear entirely, but rather shifts from widespread inundation to linear impacts, posing a threat to villages, roads, and infrastructure along the valleys.

5. Discussion

5.1. Discussion on the Rationality of Results

Laiyuan County suffered severe flooding during two major extreme rainstorm events: the 21 July 2012 event and the July 2023 event. Official disaster reports for both events indicated that the most severely affected townships were Wang’an Town, Tayayi Township and Yangjiazhuang Town, with damage concentrated in the valleys along the main course of the Juma River and its major tributaries. In this study, the high-hazard zones simulated under Scenarios 3 and 4 were both concentrated in the river valley plains along the Juma River. The weighted assessment results at the township level showed that Wang’an Town, Tayayi Township and Yangjiazhuang Town were all classified as high or relatively high-hazard zones. The spatial distribution of the simulated high-hazard zones was largely consistent with that of the aforementioned historically severely affected townships, thereby supporting the rationality of the scenario construction and evaluation results.
Furthermore, the non-uniform multi-peak rainfall duration distribution scheme adopted in Scenario 4 is consistent with the rainfall characteristics of actual extreme downpours on the eastern foothills of the Taihang Mountains. Early rainfall peaks can increase antecedent wetness, while subsequent rainfall peaks are more likely to be converted into overland runoff, forming flood peaks. This response is consistent with the rapid rise and recession commonly associated with short-duration intense rainfall in mountainous areas. In terms of spatial pattern, the simulated high-hazard zones are distributed in a strip-like pattern along the main valley of the Juma River, while low-hazard zones are concentrated in the peripheral mountainous areas. Previous studies have shown that flash-flood hazards in mountainous catchments are strongly affected by valley topography, short concentration time, and rapid runoff generation [25]. Therefore, the spatial pattern simulated in this study is consistent with the general mechanisms of mountainous flood disasters.
Compared with static flood hazard zoning based on a single design rainfall event, the scenario-based simulation used in this study provides a clearer description of how hazard levels vary with rainfall temporal structure. However, this spatial pattern should not be interpreted as a new hydrological process. Rather, the contribution of this study lies in quantifying the expected flood-hazard response under different extreme precipitation scenarios in Laiyuan County and translating the grid-scale results into township-level information for disaster-management purposes.

5.2. Advantages and Limitations of Models and Methods

This study employs a dual-indicator matrix method combining inundation depth and flow velocity, which can identify two distinct hazard modes: deep water with low flow velocity and shallow water with high flow velocity. The results for Scenario 4 at the 8 h mark show that in the transition zone between hilly and mountainous terrain and river valley plains, although the water depth is only of medium severity, the flow velocity is high due to slope runoff, elevating the comprehensive hazard level to relatively high or even high. Compared with a depth-only assessment, this dual-indicator approach provides a more comprehensive representation of velocity-related hazards in areas where moderate water depth is accompanied by rapid flow. In terms of evaluation methodology, this study extends traditional static assessments by using multi-scenario dynamic simulations at selected rainfall-duration nodes, thereby characterizing the rapid increase in flood hazard after the superimposition of short-duration intense rainfall and the rise–peak–recession stages of the simulated flood response under the designed scenarios. In Scenario 3, the area of high-hazard zones surged by 109.19% within a single hour between the 11th and 12th hours (Table 5); in Scenario 4, the area of the high-hazard zone at the peak hazard time at the 8th hour was 3.26 times that at the 3rd hour, before rapidly declining by the 12th hour (Table 6). Compared with static hazard mapping based on a fixed return period, the time-node-based results help identify when high-hazard areas expand rapidly and when the hazard begins to recede. Furthermore, compared with conventional one-step DEM-based flow accumulation approaches, the AccRo model employed in this study updates the water-surface topography through iterative flow accumulation and backflow mechanisms, thereby better representing the progressive filling of depressions and the redistribution of flow after local overflow. In the original AccRo model study, the model was benchmarked against two hydrodynamic models, HydroAs v6.2.2 and RIM2D, and showed comparable spatial patterns of maximum inundation depth, maximum flow velocity, and maximum specific discharge with lower computational requirements. These characteristics make AccRo suitable for large-scale, multi-scenario flood hazard assessment based on maximum flood conditions.
The four scenarios developed in this study are all based on historical precipitation statistics and do not take into account future trends in the frequency and intensity of extreme precipitation in the context of climate change. In addition, the GSOD daily precipitation data used for frequency analysis can support daily-scale return-period estimation, but cannot directly resolve intra-day rainfall structure, short-duration rainfall peaks, or the timing of peak occurrence. Therefore, the 1 h peak in Scenario 3 and the multi-peak structure in Scenario 4 should be interpreted as scenario-based temporal allocations designed with reference to the observed July 2023 rainstorm process, rather than as independently estimated sub-daily return-period rainfall values. In this study, the modeling scope of AccRo is not limited to hillslope overland flow. Through DEM-based flow accumulation, roughness-based hydraulic calculation, and iterative updating of the water-surface topography, the model also represents runoff concentration in river valleys and local channel overflow. However, AccRo is not a dedicated high-resolution river hydraulic model. It does not separately solve river-channel hydraulic parameters, backwater effects, bridge or culvert controls, or cross-section conveyance capacity. Therefore, the simulation results are suitable for multi-scenario flood hazard zoning at the county scale, but should not be regarded as detailed hydraulic simulation results of river-channel processes. Furthermore, the evaluation indicators do not cover the vulnerability of affected areas, such as population density and economic exposure, nor do they incorporate the coupled impacts of secondary disasters such as landslides and debris flows. Moreover, township boundaries do not necessarily coincide with hydrological basin or sub-basin boundaries; therefore, the township-level classification should be regarded as a management-oriented summary of grid-scale hazard results rather than a hydrological-basin-based classification. Future work should integrate bias-corrected CMIP6 or regional climate model precipitation projections to derive future design storms, propagate multi-model and multi-scenario rainfall ensembles through AccRo for basin- or sub-basin-based hazard assessment, and further combine the hazard results with population, economic exposure, vulnerability data, and multi-hazard coupling to support more refined flood risk analysis.

6. Conclusions

Taking Laiyuan County and Hebei Province as the study area, based on daily precipitation data from 2000 to 2024 and actual heavy rainfall events recorded at 12 meteorological stations surrounding Laiyuan County, four extreme precipitation scenarios were designed. By coupling the accumulation-based runoff and pluvial flood estimation tool, we developed a dynamic flood hazard assessment framework. A systematic dynamic assessment and zoning of flood hazard under extreme precipitation scenarios was conducted, leading to the following conclusions:
(1)
The spatial distribution of flood hazard is jointly controlled by precipitation, topography, and the river network. High-hazard areas are concentrated in the river valley plains along the main stem and major tributaries of the Juma River, while low-hazard areas are distributed in the mountainous regions on the periphery of the county, closely matching the basin topography of Laiyuan County, which is higher at the edges and lower in the center. The results of the weighted assessment at the township level indicate that Wang’an Town, Tayayi Township, and Laiyuan Town are classified as high-hazard areas. This pattern is consistent with the distribution of townships that were heavily affected during the historic flood disasters of 21 July 2012 and 23 July 2023, providing supportive evidence for the reasonableness of the assessment framework.
(2)
The temporal evolution of flood hazard is closely influenced by rainfall pattern structure and exhibits abrupt changes under the designed extreme rainfall scenarios. In Scenario 3, following the superimposition of the 50-year return period daily maximum rainfall at the 12 h mark, the area of the high-hazard zone increased abruptly from 12.30 km2 to 25.73 km2, representing an increase of 109.19% within one hour, while the area of the low-hazard zone decreased by 27.74%. This result indicates that short-duration intense rainfall superimposed on continuous antecedent rainfall can trigger a rapid increase in flood hazard in the modeled scenario. In Scenario 4, the non-uniform rainfall pattern represents a stylized “rising–double-peaked–declining” rainfall process that is consistent with observed extreme rainstorm characteristics, rather than a quantitative reproduction of a specific historical hyetograph. Under this rainfall scenario, the simulated hazard response showed a single dominant peak: the area of the high-hazard zone increased from 8.89 km2 to 28.99 km2 before rapidly falling back to 9.14 km2 within 4 h after rainfall cessation, indicating a rapid rise-and-fall flood response characteristic of mountainous river systems.
(3)
By constructing a comprehensive hazard index based on the product of water depth and flow velocity, following the technical concept of using the depth–velocity product to represent flood impact in the Technical Guidelines for flood hazard Zoning (SL 762-2018), this study distinguished between two flood-prone conditions: deep water with low flow velocity and shallow water with high flow velocity. Compared with an assessment based only on water depth, this index helps identify high-flow-velocity hazards in the hilly-to-plain transition zone and provides a more comprehensive basis for flood hazard assessment in mountainous areas. The overall framework, including the AccRo-based inundation simulation, multi-scenario rainfall design, and depth–velocity matrix, can be transferred to other mountainous counties, but its application requires locally reliable DEM data, precipitation station records, land-use-based roughness parameters, and threshold adjustment according to local terrain and exposure conditions.

Author Contributions

Author Contributions: Formal analysis, D.S., R.Z., W.L. and Y.L. (Yuan Li); resources, S.X., L.L., Y.Z., D.S., R.Z., W.L., Y.L. (Yuan Li), Z.Z., Y.X., Y.Q., F.L., Y.L. (Yanan Li) and W.C.; data curation, S.X. and Y.Z.; writing—original draft preparation, S.C., S.X., Y.Z. and Z.Z.; writing—review and editing, Y.L. (Yanan Li) and W.C.; supervision, D.S., R.Z., W.L., Y.L. (Yuan Li), Y.X., Y.Q., F.L., Y.L. (Yanan Li) and W.C.; project administration, Y.L. (Yanan Li) and W.C.; funding acquisition, Z.Z., Y.L. (Yanan Li) and W.C. All authors have read and agreed to the published version of the manuscript.

Funding

This research And The APC were funded by the Project of the Hebei Provincial Key Laboratory of Urban Safety Technology for Climate Change Response [KY2412-1-1].

Institutional Review Board Statement

Not applicable.

Informed Consent Statement

Not applicable.

Data Availability Statement

The original contributions presented in the study are included in the article; further inquiries can be directed to the corresponding authors.

Conflicts of Interest

Shengxi Cao was employed by Norendar International Ltd. Shengyuan Xu was employed by Hebei Institute of Architectural Design & Research Co., Ltd. Weihua Lu was employed by Hebei Jiqin Group Co., Ltd. The remaining authors declare that the research was conducted in the absence of any commercial or financial relationships that could be construed as a potential conflict of interest.

References

  1. IPCC. Climate Change 2023: Synthesis Report. Contribution of Working Groups I, II and III to the Sixth Assessment Report of the Intergovernmental Panel on Climate Change; Lee, H., Romero, J., Eds.; IPCC: Geneva, Switzerland, 2023; pp. 35–115. [Google Scholar] [CrossRef] [Scilit]
  2. Ionno, A.; Arsenault, R.; Troin, M.; Martel, J.-L.; Brissette, F. Impacts of climate change on flood volumes over North American catchments. J. Hydrol. 2024, 630, 130688. [Google Scholar] [CrossRef] [Scilit]
  3. Blöschl, G.; Hall, J.; Viglione, A.; Perdigão, R.A.P.; Parajka, J.; Merz, B.; Lun, D.; Arheimer, B.; Aronica, G.T.; Bilibashi, A.; et al. Changing climate both increases and decreases European river floods. Nature 2019, 573, 108–111. [Google Scholar] [CrossRef] [Scilit] [PubMed]
  4. Shen, Y.; Jiang, C. A comprehensive review of watershed flood simulation model. Nat. Hazards 2023, 118, 875–902. [Google Scholar] [CrossRef] [Scilit]
  5. Ludwig, P.; Ehmele, F.; Franca, M.J.; Mohr, S.; Caldas-Alvarez, A.; Daniell, J.E.; Ehret, U.; Feldmann, H.; Hundhausen, M.; Knippertz, P.; et al. A multi-disciplinary analysis of the exceptional flood event of July 2021 in central Europe. Part 2: Historical context and relation to climate change. Nat. Hazards Earth Syst. Sci. 2023, 23, 1287–1311. [Google Scholar] [CrossRef] [Scilit]
  6. Jiao, Z.; Zhang, Z.; Wu, L. SAR-based dynamic information retrieving of the Beijing-Tianjin-Hebei flood-inundation happened in July 2023, North China. Geomat. Nat. Hazards Risk 2024, 15, 2366361. [Google Scholar] [CrossRef] [Scilit]
  7. Condon, L.E.; Maxwell, R.M. Modified priority flood and global slope enforcement algorithm for topographic processing in physically based hydrologic modeling applications. Comput. Geosci. 2019, 126, 73–83. [Google Scholar] [CrossRef] [Scilit]
  8. Du, S.; Cheng, X.; Huang, Q.; Chen, R.; Ward, P.J.; Aerts, J.C.J.H. Brief communication: Rethinking the 1998 China floods to prepare for a nonstationary future. Nat. Hazards Earth Syst. Sci. 2019, 19, 715–719. [Google Scholar] [CrossRef] [Scilit]
  9. Macchione, F.; Costabile, P.; Costanzo, C.; De Santis, R. Moving to 3-D flood hazard maps for enhancing risk communication. Environ. Model. Softw. 2019, 111, 510–522. [Google Scholar] [CrossRef] [Scilit]
  10. Dittes, B.; Kaiser, M.; Špačková, O.; Rieger, W.; Disse, M.; Straub, D. Risk-based flood protection planning under climate change and modeling uncertainty: A pre-alpine case study. Nat. Hazards Earth Syst. Sci. 2018, 18, 1327–1347. [Google Scholar] [CrossRef] [Scilit]
  11. Metin, A.D.; Nguyen, V.D.; Schröter, K.; Guse, B.R.; Apel, H.; Kreibich, H.; Vorogushyn, S.; Merz, B. How do changes along the risk chain affect flood risk? Nat. Hazards Earth Syst. Sci. 2018, 18, 3089–3108. [Google Scholar] [CrossRef] [Scilit]
  12. Paschalis, A.; Fatichi, S.; Molnar, P.; Rimkus, S.; Burlando, P. On the effects of small scale space-time variability of rainfall on basin flood response. J. Hydrol. 2014, 514, 313–327. [Google Scholar] [CrossRef] [Scilit]
  13. Stamellou, E.; Kalogeropoulos, K.; Stathopoulos, N.; Tsesmelis, D.E.; Louka, P.; Apostolidis, V.; Tsatsaris, A. A GIS-cellular automata-based model for coupling urban sprawl and flood susceptibility assessment. Hydrology 2021, 8, 159. [Google Scholar] [CrossRef] [Scilit]
  14. Efstratiadis, A.; Dimas, P.; Pouliasis, G.; Tsoukalas, I.; Kossieris, P.; Bellos, V.; Sakki, G.-K.; Makropoulos, C.; Michas, S. Revisiting flood hazard assessment practices under a hybrid stochastic simulation framework. Water 2022, 14, 457. [Google Scholar] [CrossRef] [Scilit]
  15. Zhou, L.; Liu, L. Enhancing dynamic flood risk assessment and zoning using a coupled hydrological-hydrodynamic model and spatiotemporal information weighting method. J. Environ. Manag. 2024, 366, 121831. [Google Scholar] [CrossRef] [Scilit]
  16. Leistert, H.; Hänsler, A.; Schmit, M.; Steinbrich, A.; Weiler, M. Accumulation-based Runoff and Pluvial Flood Estimation Tool (AccRo v.1.0). Geosci. Model Dev. 2026, 19, 2023–2037. [Google Scholar] [CrossRef] [Scilit]
  17. Hongheiku. Township Population Ranking List of Laiyuan County Based on the Seventh National Census. Available online: https://www.hongheiku.com/czjh/9374.html (accessed on 28 July 2026).
  18. China News Service. Flood Disaster in Laiyuan, Hebei Caused Casualties and Severe Damage. Available online: http://www.chinanews.com.cn/df/2012/07-23/4052994.shtml (accessed on 28 July 2026).
  19. People’s Daily Online Hebei Channel. Hebei Laiyuan: Building a “Red Embankment” to Protect Lives. Available online: http://he.people.com.cn/n2/2023/0813/c192235-40529899.html (accessed on 28 July 2026).
  20. NOAA NCEI. Global Summary of the Day (GSOD). National Centers for Environmental Information. Available online: https://www.ncei.noaa.gov/data/global-summary-of-the-day/ (accessed on 28 July 2026).
  21. Jin, S.; Guo, S.; Huo, W. Analysis on the Return Period of “7.20” Rainstorm in the Xiaohua Section of the Yellow River in 2021. Water 2022, 14, 2444. [Google Scholar] [CrossRef] [Scilit]
  22. Steinbrich, A.; Leistert, H.; Weiler, M. Model-Based Quantification of Runoff Generation Processes at High Spatial and Temporal Resolution. Environ. Earth Sci. 2016, 75, 1423. [Google Scholar] [CrossRef] [Scilit]
  23. HR Wallingford. Flood Risks to People, Phase 2 (FD2321/TR2); Department for Environment, Food and Rural Affairs: London, UK, 2006.
  24. SL 762-2018; Technical Guidelines for Flood Risk Zoning. China Water & Power Press: Beijing, China, 2018.
  25. Miao, Q.; Yang, D.; Yang, H.; Li, Z. Establishing a rainfall threshold for flash flood warnings in China’s mountainous areas based on a distributed hydrological model. J. Hydrol. 2016, 541, 371–386. [Google Scholar] [CrossRef] [Scilit]
Figure 1. Overview of the study area. (a) Geographic location of Laiyuan County. (b) Spatial distribution of the 12 selected meteorological stations. (c) DEM of Laiyuan County. (d) Flood scene on 21 July 2012. (e) Flood scene during the July 2023 event.
Atmosphere 17 00826 g001
Figure 2. Spatial distribution of precipitation in the study area. (a) Annual average precipitation [mm], (b) annual maximum daily precipitation [mm], (c) 20-year return period annual precipitation [mm], (d) 20-year return period daily maximum precipitation [mm], (e) 50-year return period annual precipitation [mm], (f) 50-year return period daily maximum precipitation [mm].
Atmosphere 17 00826 g002
Figure 3. Geomorphological factors: (a) Elevation [m], (b) land-use types, (c) slope [deg], (d) terrain relief [m].
Atmosphere 17 00826 g003
Figure 4. A general workflow of dynamic hazard assessment approaches for flood under extreme precipitation scenarios.
Atmosphere 17 00826 g004
Figure 5. Scheme of the definitions of relevant times a water parcel travels in a catchment and the assumed initial relationship between water depth and area-weighted flow accumulation [16].
Atmosphere 17 00826 g005
Figure 6. Schematic illustration of the iterative process. (Left): sfrac is accumulated in three iterations, altering the DEM with the resulting inundation and therefore changing the accumulation location of each iteration. (Right): s is accumulated once without altering the DEM [16].
Atmosphere 17 00826 g006
Figure 7. Flood hazard assessment matrix considering flow velocity and water depth.
Atmosphere 17 00826 g007
Figure 8. Water depth (ad) and flow velocity (eh) under Scenario 4 at 3, 6, 8, and 12 h.
Atmosphere 17 00826 g008
Figure 9. Cross-sectional water depth profile along transects A–A’ across the Juma River valley under Scenario 4 at 3, 6, 7, 8, and 12 h.
Atmosphere 17 00826 g009
Figure 10. Hazard level distribution under four precipitation scenarios. (a) Scenario 1 at 12 h; (b) Scenario 2 at 12 h; (c,d) Scenario 3 at 11 and 12 h; (eh) Scenario 4 at 3, 6, 8, and 12 h. Color scale: green (Low) to red (High).
Atmosphere 17 00826 g010
Figure 11. Area ratio curve of hazard levels.
Atmosphere 17 00826 g011
Figure 12. Township-level flood hazard classification in Laiyuan County under Scenario 4 at 8 h.
Atmosphere 17 00826 g012
Table 1. Information on the meteorological stations used in this study.
StationLongitudeLatitudeNumber of Valid Daily
Precipitation Records
Mean Annual
Precipitation
Maximum Daily Precipitation
Jining113°04′00″41°02′00″9057394.0934.43
Datong113°25′00″40°05′00″9052450.7937.63
Wutai Mountain113°31′00″38°57′00″9060794.0359.71
Weixian114°34′00″39°50′00″9056461.2639.23
Yuanping112°42′00″38°45′00″8435489.9748.56
Shijiazhuang114°21′00″38°04′00″9063598.8683.29
Zhangjiakou114°53′00″40°47′00″9071461.8139.17
Huailai115°30′00″40°25′00″9055452.543.03
Beijing116°35′04″40°04′48″8861589.8877.46
Tianjin117°10′00″39°06′00″9048621.3286.36
Baoding115°29′00″38°44′00″9061568.4868.53
Botou116°33′00″38°05′00″9082618.6689.57
Table 2. Rainfall parameters.
Scenario NumberStageRainfall Intensity/(mm·h−1)Duration of Rainfall/h
Scenarios 11-123.812
Scenarios 22-136.812
Scenarios 33-136.811
Scenarios 33-2118.01
Scenarios 44-123.83
Scenarios 44-247.63
Scenarios 44-3118.92
Scenarios 44-447.61
Scenarios 44-523.83
Table 3. Water depth classification table [23].
LevelWater Depth Range (m)Water Depth LevelImpact
1w < 0.3LowAccessible on foot or by wading
20.3 ≤ w < 0.8Relatively LowDifficult to walk; accessible by vehicle
30.8 ≤ w < 1.5MediumAdults are unable to stand, and vehicles cannot pass through
41.5 ≤ w < 2.5Relatively HighPedestrian in need of assistance; water ingress in ground-floor property
5w ≥ 2.5HighThe ground floor of the house was flooded, and the structure was damaged
Table 4. Flow velocity classification table [23].
LevelFlow Velocity Range (m/s)Flow Velocity LevelImpact
1v < 0.8LowVirtually no impact; the body remains stable
20.8 ≤ v < 1.5Relatively LowWalking is slightly affected, but the person can move slowly
31.5 ≤ v < 2.5MediumAdults may find it difficult to stand, and vehicles may be swept away
42.5 ≤ v < 4.0Relatively HighPeople are highly susceptible to being knocked over, and lightweight structures are prone to damage
5v ≥ 4.0HighCapable of demolishing brick walls and houses
Table 5. Area statistics by hazard level for Scenario 3.
TimeArea/km2
Low HazardRelatively Low HazardMedium HazardRelatively High HazardHigh HazardTotal
11 h69.5846.5027.3914.4612.30170.23
12 h50.2879.3635.7621.9025.73213.03
TimeGrowth rate/%
Low HazardRelatively Low HazardMedium HazardRelatively High HazardHigh HazardTotal
11 hStandardStandardStandardStandardStandardStandard
12 h−27.7470.6730.5651.45109.1925.14
Table 6. Area statistics by hazard level for Scenario 4.
TimeArea/km2
Low HazardRelatively Low HazardMedium HazardRelatively High HazardHigh HazardTotal
3 h82.3736.8024.9112.068.89164.83
6 h62.9253.9529.2416.5015.09177.70
8 h45.0076.9436.3222.3228.99209.57
12 h78.3936.5224.7812.079.14160.90
TimeGrowth rate/%
Low HazardRelatively Low HazardMedium HazardRelatively High HazardHigh HazardTotal
3 hStandardStandardStandardStandardStandardStandard
6 h−23.6146.6017.3836.8269.747.81
8 h−45.37109.0845.8085.07226.102.14
12 h−4.83−0.76−0.520.082.81−2.38
Disclaimer/Publisher’s Note: The statements, opinions and data contained in all publications are solely those of the individual author(s) and contributor(s) and not of MDPI and/or the editor(s). MDPI and/or the editor(s) disclaim responsibility for any injury to people or property resulting from any ideas, methods, instructions or products referred to in the content.