Article

Contrasting Local and Non-Local PBL Closures in the Turbulence Grey Zone: A Case Study of Convection-Permitting Dryline Simulations


Department of Chemistry, Physics & Atmospheric Sciences, Jackson State University, Jackson, MS 39217, USA
*
Author to whom correspondence should be addressed.
Atmosphere 2026, 17(9), 825; https://doi.org/10.3390/atmos17090825
Submission received: 16 July 2026 / Revised: 25 August 2026 / Accepted: 25 August 2026 / Published: 26 August 2026
(This article belongs to the Section Meteorology)

Abstract

Accurately simulating convective initiation (CI) in capped High Plains dryline environments remains a significant challenge for convection-permitting numerical weather prediction. As a follow-up work to Lu and White, this study utilizes the Model for Prediction Across Scales (MPAS) at a 3 km grid resolution to evaluate the sensitivity of dryline morphology and CI to two planetary boundary layer (PBL) parameterization schemes: the non-local Yonsei University (YSU) and the local Mellor-Yamada-Nakanishi-Niino (MYNN) frameworks. Radar observations and simulated maximum reflectivity show that while the YSU scheme successfully replicates the timing and spatial development of convective cores triggered along the elevated terrain slope at 21:30 UTC, the MYNN scheme completely suppresses deep convection throughout the study period. Vertical thermodynamic profiles indicate that YSU establishes a deeply mixed boundary layer that weakens the regional capping inversion, enabling surface parcels to break the stable lid and reach their level of free convection (LFC). Conversely, the MYNN scheme confines moisture to a thin layer near the surface beneath an unyielding temperature inversion, preventing parcels from achieving free buoyancy. For the 3 km “grey zone” of turbulence resolution, both PBL schemes successfully resolve horizontal convective rolls (HCRs) near the primary dryline boundary. YSU’s non-local mixing permits these HCR perturbations to couple vertically into deep, cap-breaching updraft plumes, while MYNN’s local turbulent kinetic energy (TKE) closure traps them as shallow horizontal waves. It was shown that the MYNN failure is driven by an intrusive synoptic wind bias, generating anomaly wind velocities of 24–28 m/s throughout the column. These winds act as a mechanical sweeper across the terrain slope which shears, flattens, and dilutes the moisture pool below 2000 m Mean Sea Level (MSL) and physically reduces fuel from the western initiation zone. In contrast, the YSU scheme maintains a well-regulated, moderate wind profile (8–12 m/s aloft), preserving a state of mesoscale equilibrium that allows moisture to ascend the terrain slope and continuously feed developing convective cells. Our findings demonstrate that the choice of PBL parameterization plays significant role in not only local vertical mixing but also the structural translation of macroscale synoptic forcing versus localized thermodynamic regulation in complex terrain.

1. Introduction

The dryline has been noticed as a primary focal point for the initiation of deep moist convection, including severe thunderstorms and tornadoes [1,2,3]. The initiation of deep, moist convection in the US High Plains is fundamentally tied to the lifecycle, orientation, and thermodynamic structure of the dryline [4]. Characterized as a narrow, low-level mesoscale boundary separating hot, dry continental air flowing from the elevated Mexican Plateau and southern Rocky Mountains from warm, moist maritime air advected from the Gulf of Mexico, the dryline serves as a primary localized focal point for severe weather development [5,6].
During the diurnal convective cycles, daytime solar heating induces deep vertical mixing on the arid western side of the boundary, while a robust capping inversion, or “lid,” typically develops on the moist eastern side due to the advection of a warm, dry elevated mixed layer overriding the shallow moisture tongue [5]. This stable layer acts as a negative buoyancy barrier, trapping high values of convective available potential energy (CAPE) near the surface. Consequently, convective initiation (CI) along the dryline becomes an “all-or-nothing” physical struggle: storms can only trigger if localized mechanical or thermo-mechanical lift along the boundary is violently intense enough to erode the convective inhibition (CIN) and push air parcels to their Level of Free Convection (LFC) [4,7].
With the advent of high-resolution, convection-permitting numerical weather prediction (NWP) frameworks, models have transitioned to horizontal grid spacings (e.g., 3 km) capable of explicitly resolving deep convective clouds without relying on traditional cumulus parameterizations [8]. This approach builds on foundational studies as well as more recent comprehensive global evaluations [9], which demonstrate that horizontal grid spacings at or below 4 km are sufficient to explicitly resolve deep convection without the need for parameterized cumulus schemes. However, this grid resolution has pushed boundary layer modeling into the turbulent “grey zone”, where the horizontal mesh size approaches the scale of dominant planetary boundary layer (PBL) transport eddies [10]. At a 3 km grid spacing, models become capable of explicitly resolving large-scale, organized boundary layer circulations, most notably Horizontal Convective Rolls (HCRs)—parallel ribbons of alternating updrafts and downdrafts aligned with the mean boundary layer flow [11]. Observational and theoretical studies have hypothesized that the intersections between these resolved HCR updrafts and the primary dryline convergence line dictate exactly where and when discrete storm cores break the capping inversion [12]. Despite the explicit resolution of these horizontal perturbations by the dynamic core, the vertical transport of heat, moisture, and momentum within individual grid columns remains heavily parameterized by 1-D planetary boundary layer schemes [13]. Current model operations rely on two main closure philosophies: non-local schemes, such as the Yonsei University (YSU) framework, which simulate deep vertical overturning by large-scale eddies across the entire depth of the boundary layer [14], and local turbulent kinetic energy (TKE) closure schemes, such as the Mellor-Yamada-Nakanishi-Niino (MYNN) framework, which compute mixing purely as a function of localized vertical gradients [15]. Recent operational sensitivity studies have frequently documented the contrasting behaviors of these schemes, noting that local TKE closures like MYNN often struggle with deep vertical momentum mixing in highly sheared environments compared to their non-local counterparts [16].
A persistent challenge in severe weather forecasting is the high degree of forecast uncertainty regarding dryline position, moisture pooling, and CI timing [17]. Small structural variations in a PBL scheme can yield completely different mesoscale environments. Local closure configurations (e.g., MYNN) frequently exhibit a bias toward shallower, overly stagnant boundary layers that preserve sharp vertical gradients, which can leave the capping inversion too rigid and prevent surface parcels from achieving free buoyancy [13,17]. On the other hand, non-local frameworks (e.g., YSU) tend to simulate deeply mixed, warmer boundary layers that physically elevate the base of the capping inversion, smoothing the local gradient and facilitating cap penetration. Previous studies have demonstrated that the choice of local versus non-local boundary layer mixing algorithms fundamentally dictates the vertical flux of heat and moisture, which directly impacts boundary layer depth and the elevation of the capping inversion [14,17,18]. Furthermore, a significant gap remains in understanding how these parameterization frameworks translate background synoptic-scale momentum down to the mesoscale surface interface [19]. If a PBL scheme generates an intrusive synoptic wind bias—such as over-developing an accelerating low-level wind core—the resulting gale-force horizontal momentum can act as a mechanical sweeper across sloping topography, which can flatten the vertical moisture profile and physically blow off moisture mass from localized initiation zones downstream [20]. If the model fails to capture the subtle balance between background momentum advection and localized thermodynamic regulation, the fuel required for storm development is evacuated before it can reach the kinematic trigger point.
While previous studies have analyzed PBL parameterization impacts using traditional nested grid configurations, few have evaluated these sub-mesoscale interactions within an unstructured, global-to-regional variable-resolution dynamic core like the Model for Prediction Across Scales (MPAS) [21]. Traditional nested grid configurations often introduce spurious wave reflections, artificial gravity wave propagation, and turbulent kinetic energy accumulation along the lateral boundaries of the nested domains [21,22]. Investigating a weakly forced High Plains dryline event provides a good opportunity as a testbed to isolate parameterization behavior under peripheral synoptic conditions, where mesoscale thermodynamics dominate the convective trigger. Understanding how parameterized vertical column closures modulate explicitly resolved 3-D HCR structures along sloped terrain is crucial for improving the precision of severe storm placement in operational forecasts. To address these challenges, this study investigates the following research objectives: (1) evaluate the sensitivity of dryline horizontal morphology, moisture tongue propagation, and 10-m surface wind gradients to local versus non-local PBL closures; (2) verify the model’s capacity to accurately simulate the temporal evolution, spatial placement, and core reflectivity of discrete CI against Next Generation Weather Radar (NEXRAD) radar observations; (3) assess the vertical thermodynamic modification of the boundary layer and the mechanical mechanisms governing the erosion and penetration of the capping inversion; (4) investigate the 3-D coupling of resolved HCRs within the turbulence grey zone and their vertical translation into cap-breaching updraft plumes; and (5) quantify the impact of vertical momentum transport and synoptic wind scaling on the preservation versus advective dissipation of the orographic moisture profile. Furthermore, while the case chosen for simulation occurred in October—outside of the typical springtime climatology of previous dryline studies—this seasonal selection was deliberate. It provides an archetypal, weakly forced synoptic environment that is ideal for strictly isolating mesoscale boundary layer mixing processes without the overwhelming macroscale dynamic interference common to aggressive spring storm systems.
The remainder of this manuscript is structured as follows: Section 2 details the MPAS model configuration, grid design, and physics parameterizations. Section 3 outlines the observational datasets and diagnostic methodology. Section 4 presents the results, including kinematic and thermodynamic comparisons of the PBL closures prior to and during convective initiation. Finally, Section 5 synthesizes the primary conclusions and discusses implications for future scale-aware modeling.

2. Model Description and Methodology

2.1. The MPAS-Atmosphere Model

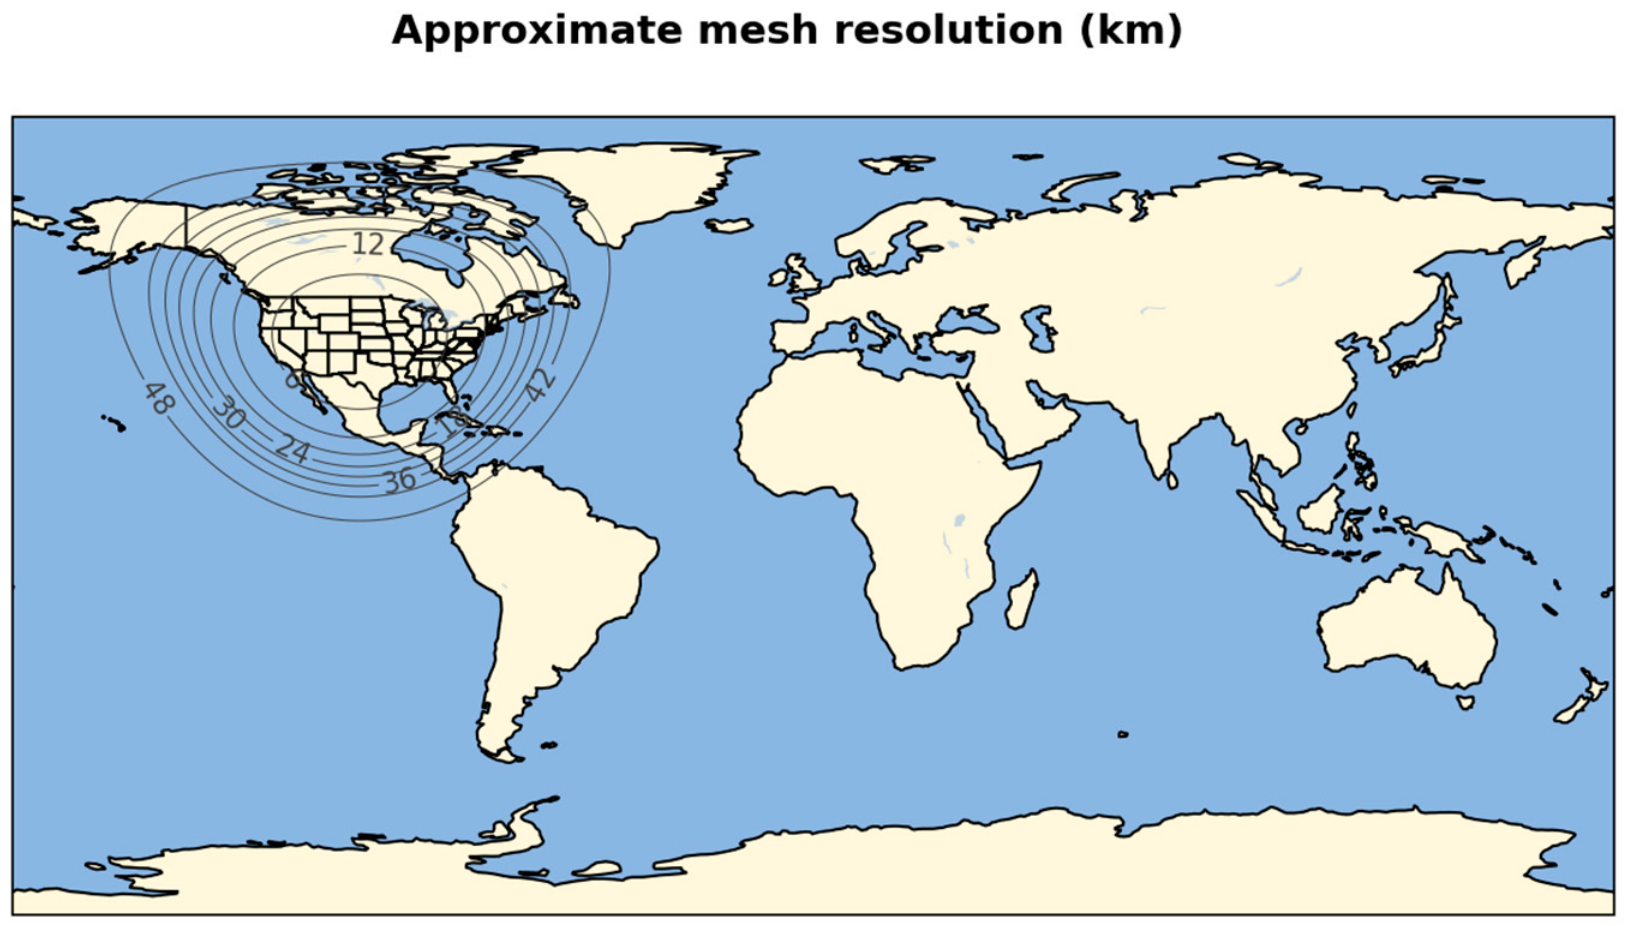
To investigate the multi-scale boundary layer interactions governing CI, this study utilizes the Model for Prediction Across Scales-Atmosphere (MPAS-A) version 8.3.1. As established in our foundational study on terrestrial drivers of dryline mobility [23], MPAS-A employs an unstructured Spherical Centroidal Voronoi Tessellation (SCVT) mesh. This architecture is highly advantageous for convective case studies [24,25,26,27], as it permits a seamless transition from a coarse global background (60 km) to a convection-permitting regional refinement (e.g., 3 km) over the High Plains domain. By utilizing a global variable-resolution approach, the simulation explicitly captures synoptic-scale momentum forcing without the artificial wave reflections and numerical noise commonly introduced by lateral boundary conditions in traditional nested regional models. For this study, a global variable-resolution mesh was implemented with a 3 km refinement centered at the Burlington, CO area (39° N, 102° W), transitioning to a 60 km global background (Figure 1). This 3 km resolution will help to resolve the steep moisture gradients and boundary layer instabilities associated with dryline evolution [22]. Meanwhile, the 3 km grid spacing is still in the “grey zone” for turbulent eddies and does not explicitly resolve the most energetic turbulent scales or the earliest stages of CI.

2.2. Initialization Data, Radar Observations and Enhanced Vertical Grid

The atmospheric and terrestrial initial conditions were prescribed by using the ECMWF ERA5 reanalysis dataset at a 0.25° horizontal resolution. ERA5 hourly fields, including three-dimensional atmospheric variables and four-layer volumetric soil moisture and temperature, were ingested to establish the baseline synoptic and surface state. The radar data used in this study were obtained from a public cloud storage container within Amazon Web Services (AWS) Simple Storage Service (S3) [28]. The observed NEXRAD reflectivities at the site of Burlington, CO (KGLD) were derived by applying the Python (version 12) ARM Radar Toolkit (Py-ART), an open-source library for working with weather radar data [29].
A critical structural enhancement in this study is the modification of the model’s vertical coordinate system. While our previous topographic sensitivity experiments utilized 55 vertical layers [24], the present study employs an expanded 75-level hybrid sigma-pressure vertical grid. To accurately resolve the sub-mesoscale kinematics of HCRs and the thermodynamic stratification of the capping inversion, vertical layer spacing was aggressively compressed within the PBL. This provides a high vertical resolution in the lowest 2.5 km above ground level (AGL), which is paramount for capturing the precise depth of local TKE fluxes and the penetration height of non-local entrainment plumes. Specifically, this 75-level configuration places the lowest prognostic thermodynamic level at approximately 30 m AGL. Within the lowest 2000 m of the atmosphere, approximately 25 discrete vertical layers are maintained, yielding an average vertical grid spacing of roughly 80 m throughout the critical initiation boundary layer.

2.3. Physical Parameterizations

The baseline physical parameterization suite remains consistent with our previous experimental design [23], ensuring physical continuity across our ongoing dryline research. Surface layer fluxes are calculated via the Revised Monin-Obukhov scheme, which couples with the Noah Land Surface Model (LSM) [30] to manage regional soil moisture and evapotranspiration. Radiative forcing is handled by the RRTMG scheme [31], and grid-scale precipitation is explicitly resolved using the WSM6 microphysics scheme [32], which is reasonably suited for 3 km convection-permitting resolutions. Because this study specifically focuses on the sensitivity of convective triggering to boundary layer mixing processes, the primary experimental variable is the PBL parameterization. Two fundamentally different boundary layer closures are evaluated: (1) the Yonsei University (YSU) Scheme [14]—a first-order, non-local closure scheme that characterizes the boundary layer by explicitly representing deep, large-scale turbulent eddies that can transport heat and momentum across the entire depth of the mixed layer. Crucially, it includes an explicit entrainment formulation at the PBL top, which is vital for simulating the erosion of elevated inversions; and (2) the Mellor-Yamada-Nakanishi-Niino (MYNN) Scheme [15]—a 2.5-level, local TKE closure scheme predicts sub-grid-scale TKE based strictly on localized vertical gradients of wind shear and buoyancy. It tends to favor highly stratified mixing rather than deep, boundary-layer-spanning overturning, making its vertical momentum transport highly sensitive to low-level stability. It is important to caveat that the performance discrepancies observed in this study stem from the holistic mathematical architectures of these schemes—encompassing fundamental differences in mixing length definitions, turbulent Prandtl number formulations, and surface layer coupling—rather than an isolated toggle of a single non-local flux term. Furthermore, both parameterizations were deployed in their “standard, out-of-the-box” configurations. This indicates that they utilized the default scaling parameters and tuning constants provided in the official model release without site-specific calibration, reflecting their typical baseline deployment in standard operational forecasting environments [16].

3. Experimental Design and Boundary Layer Sensitivities

3.1. Simulation Strategy

To isolate the dynamic impacts of non-local versus local turbulent mixing on dryline CI, two parallel simulations were executed: a YSU control run and an MYNN control run. Both simulations were initialized at 12:00 UTC on 10 October 2016. A 33-h spin-up period was utilized prior to the analysis window. This extended integration allows the 3 km explicit dynamic core to fully develop grid-scale boundary layer perturbations (such as horizontal roll vortices) and ensures the microphysics have achieved dynamic equilibrium with the underlying Noah LSM surface heat fluxes. It is important to acknowledge that soil variables, particularly deep volumetric soil moisture, possess a “long memory” and typically require multi-week or even multi-month spin-up periods to reach complete equilibrium with the atmospheric forcing. However, for the purposes of this comparative study, a 33-h spin-up is sufficient to stabilize the superficial soil “skin” temperature and immediate surface heat fluxes from the ERA5 initialization. This time frame ensures that both the YSU and MYNN boundary layer schemes inherit an identical, stable surface forcing state prior to the onset of the intense diurnal heating cycle on the day of convective initiation. The primary temporal window of analysis focuses on the afternoon convective period from 21:00 UTC to 22:00 UTC on 11 October, capturing the critical transition from boundary layer heating to localized storm initiation near Burlington, CO.

3.2. Diagnostic Evaluation Methodology

Rather than modifying the terrestrial surface state as in our preceding study [23], this experimental design holds the topography and initial soil moisture constant to strictly isolate parameterization behavior. The CI environment is evaluated across three interconnected scales: (1) macroscale and surface kinematics—10-m surface wind fields and lower-tropospheric cross-sections are analyzed to quantify localized mass convergence and downward momentum transport against overarching synoptic advective forcing; (2) mesoscale thermodynamic boundaries—2 m dewpoint fields and vertical cross-sections of derived water vapor mixing ratio are utilized to track the three-dimensional morphology of the moisture tongue and its orographic ascent over the High Plains terrain slope; and (3) sub-mesoscale convective triggering—simulated maximum reflectivity is validated against observed NEXRAD composite radar. Furthermore, high-resolution vertical velocity cross-sections are cross-referenced with Skew-T Log-P thermodynamic soundings to evaluate the mechanical erosion of the capping inversion by explicitly resolved HCRs.

4. Results and Discussions

4.1. Mesoscale Environmental Evolution and Dryline Morphology

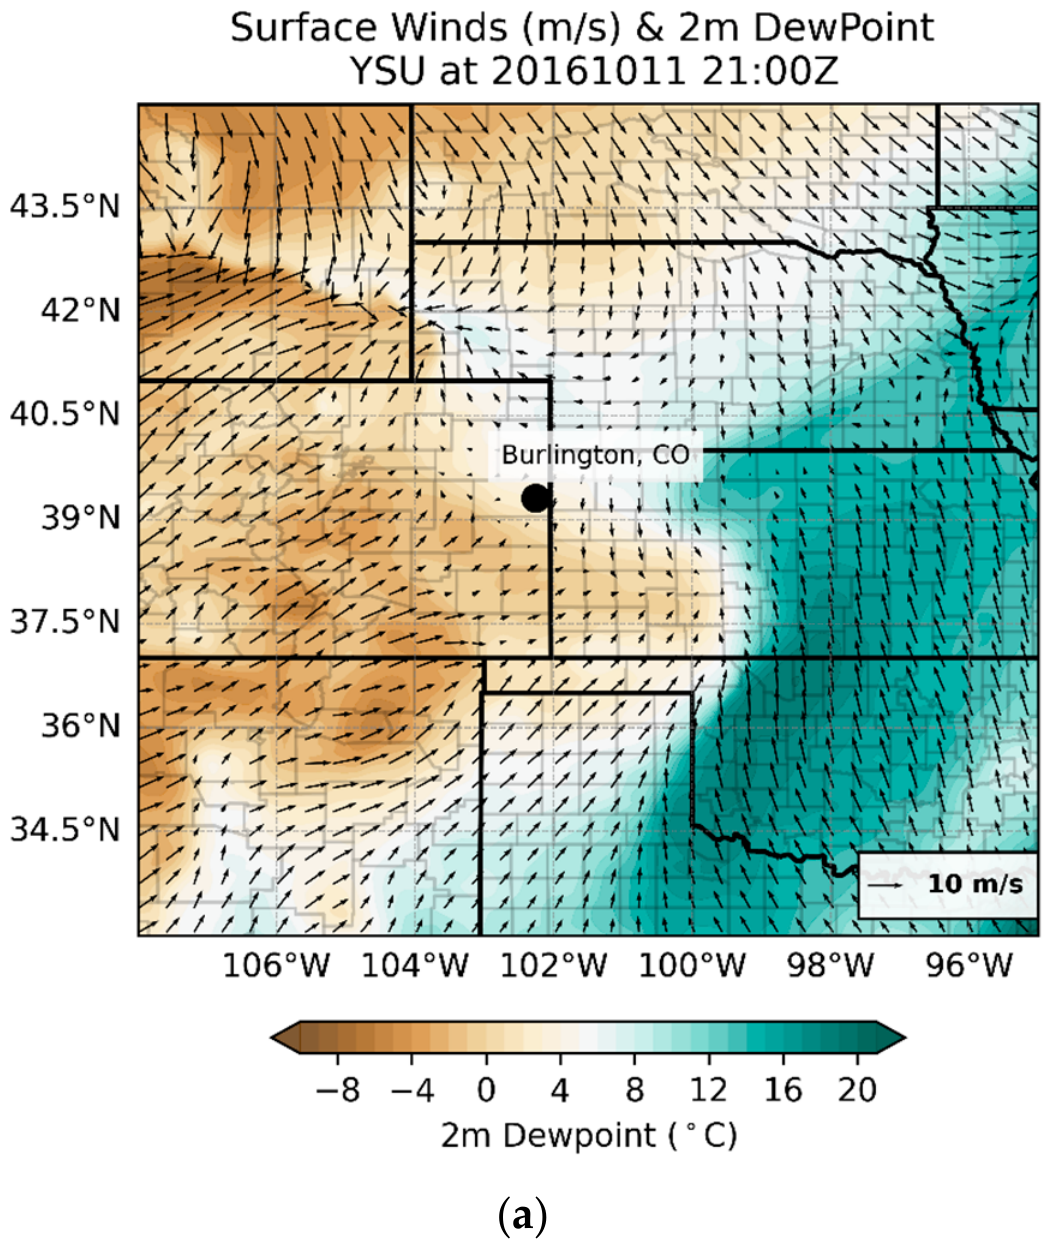
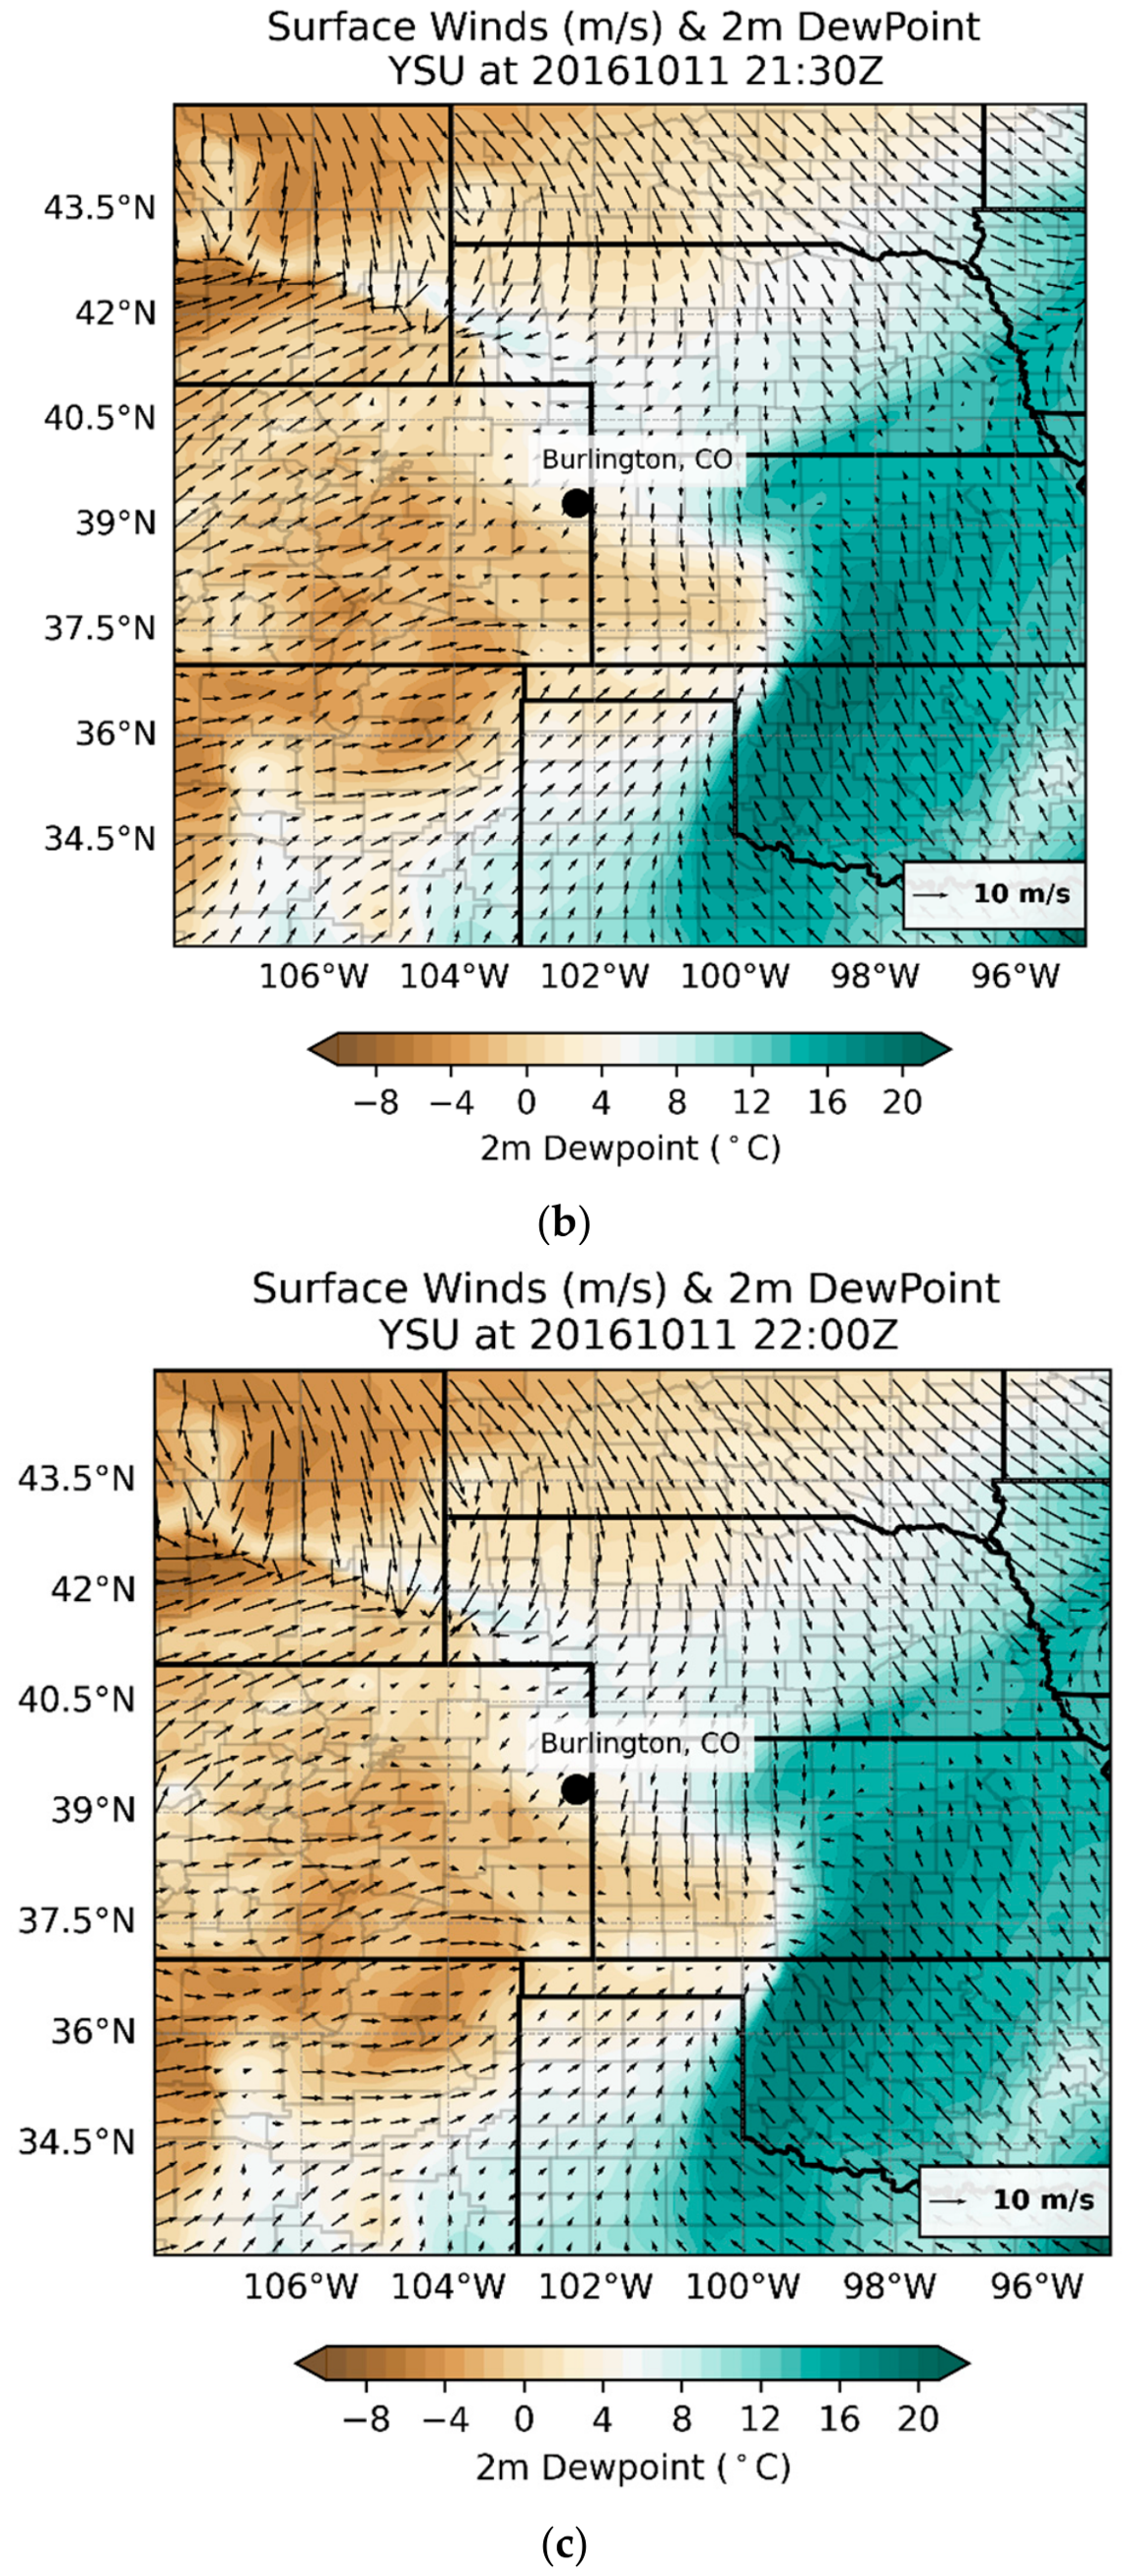
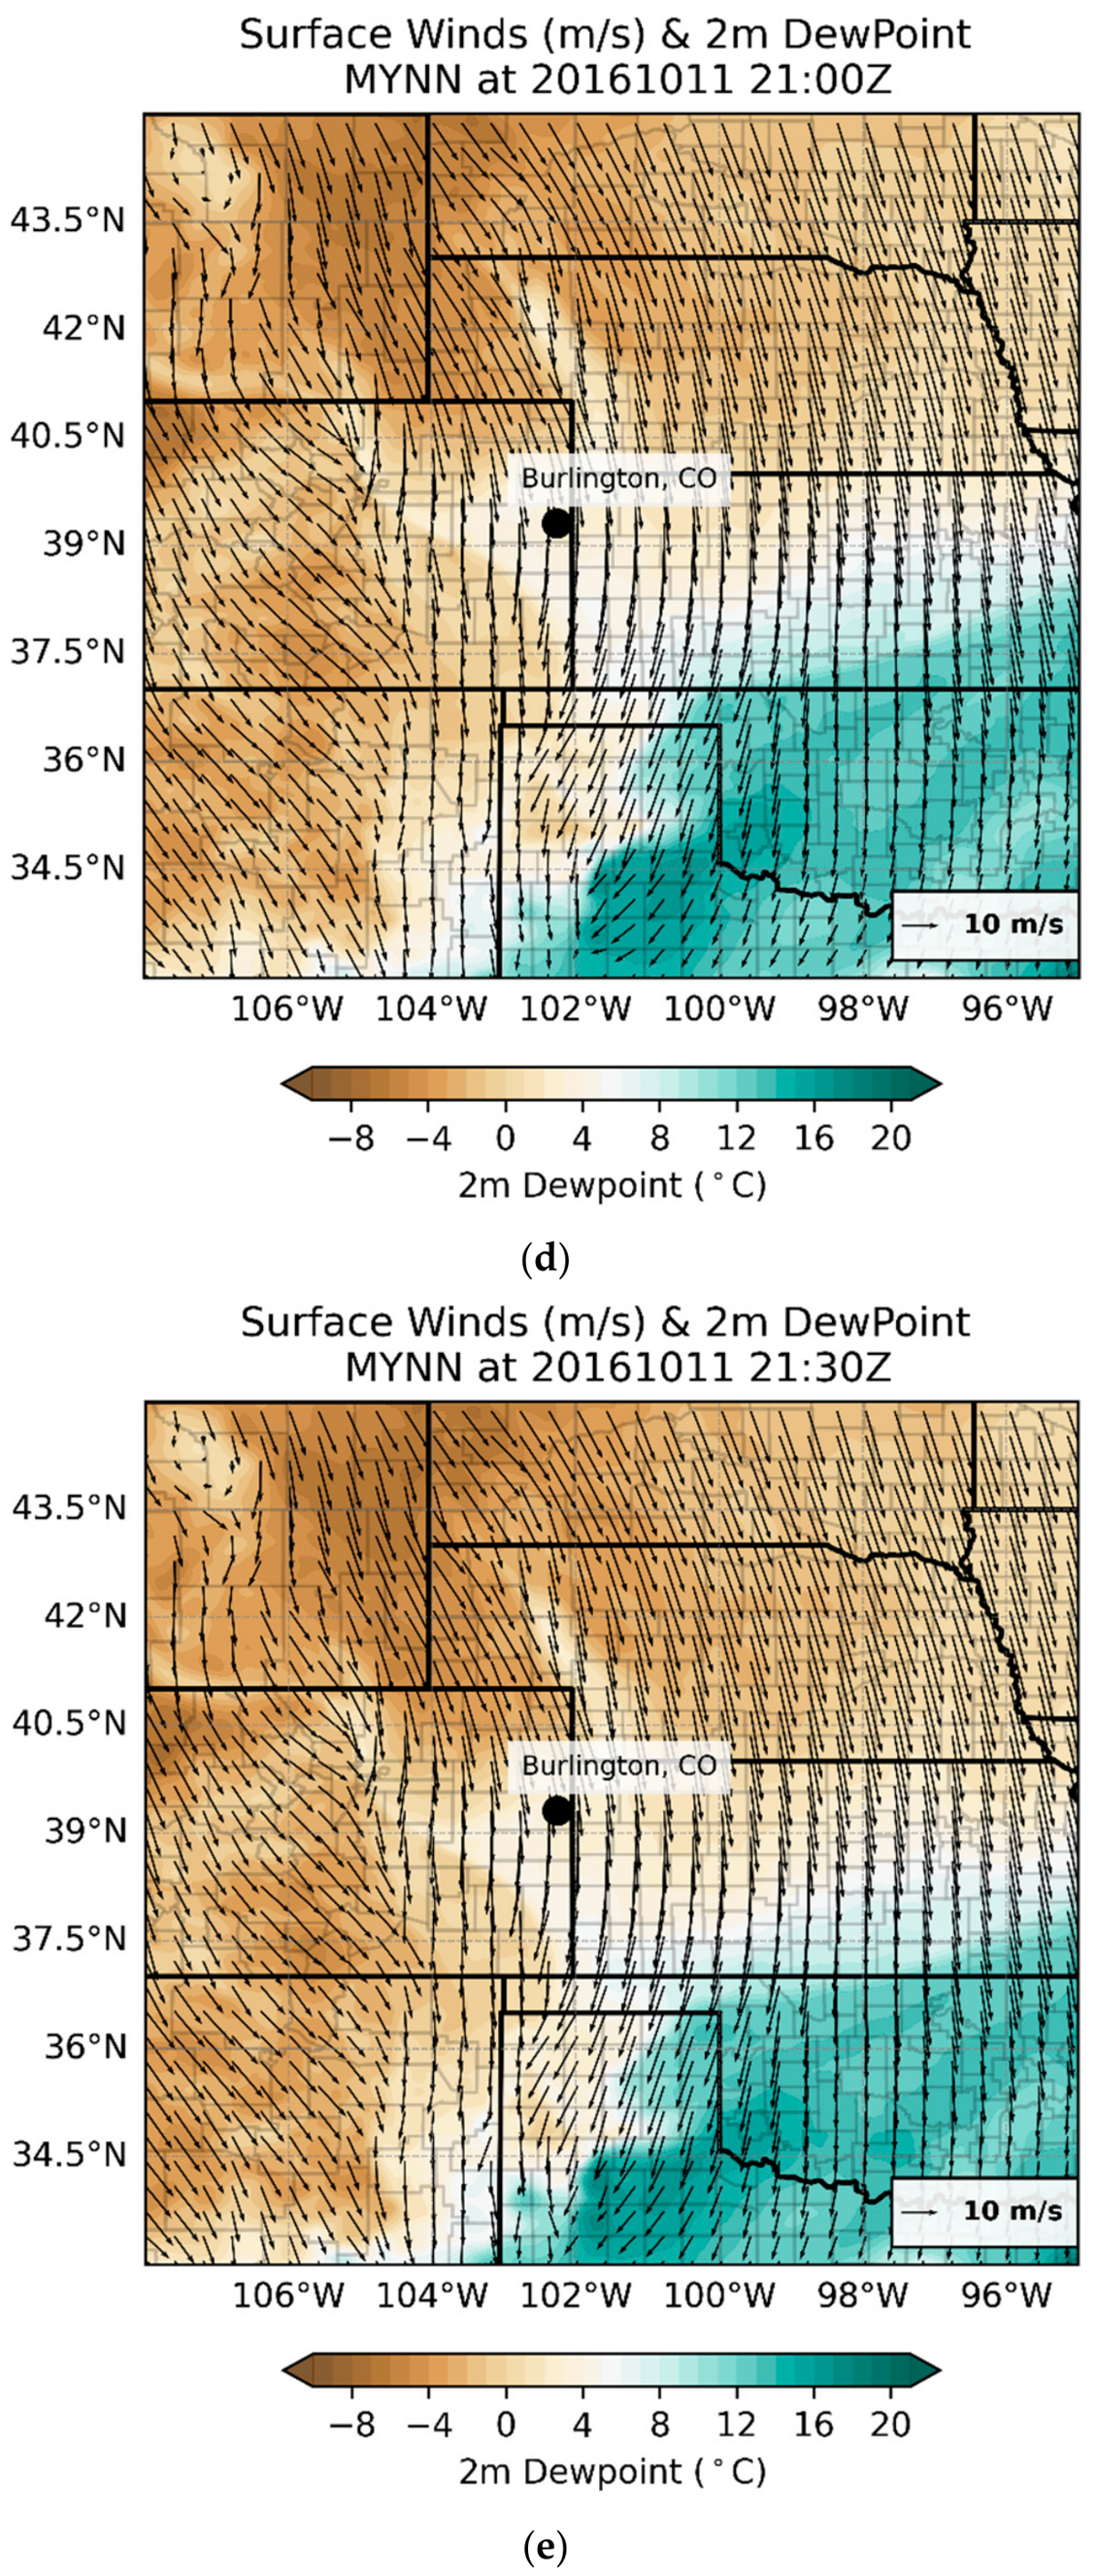
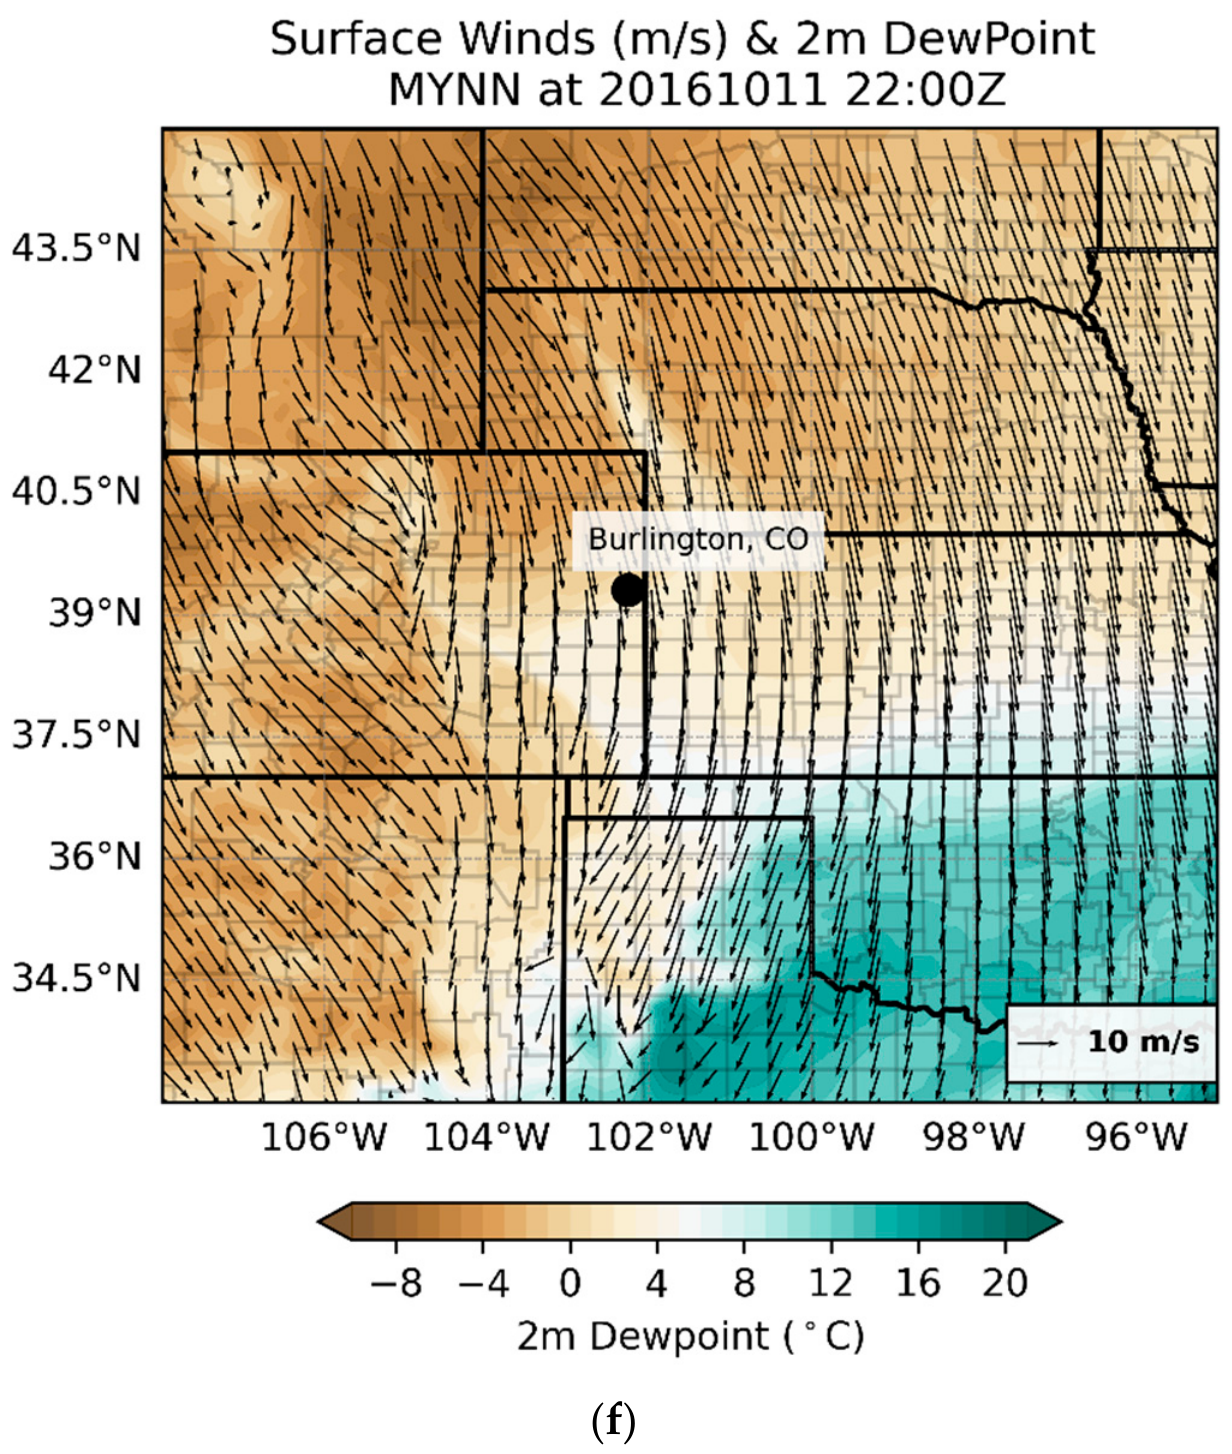
The initiation of convection in the High Plains is fundamentally tied to the lifecycle and structure of the dryline. Figure 2 illustrates the evolution of the 2 m dew point (Td) and 850 hPa wind fields for the YSU and MYNN simulations from 21:00 UTC to 22:00 UTC. At 21:00 UTC, both schemes successfully establish a sharp moisture gradient oriented northwest-southeast through eastern Colorado, separating the hot, dry continental air to the west from the moist, modified maritime air to the east. At 21:30 UTC, the dryline boundary (defined by the tight 10 °C to 12 °C dewpoint contours) sits to the east of Burlington, roughly between 100° W and 99° W.

4.1.1. Dew Point Comparison at 2 M

The horizontal morphology of the 2 m dewpoint field exhibits significant sensitivity to the chosen PBL parameterization. The YSU simulation produces a geographically expansive moisture tongue with a robust northwest-southeast oriented gradient, a structure characteristic of strong mesoscale convergence. In contrast, the MYNN simulation displays a more diffuse moisture field displaced to the south and southeast of the domain. The YSU scheme exhibits a more robust thermodynamic structure that better aligns with the regional environment supporting the observed CI zone over the elevated terrain slope west of Burlington, CO. In contrast, the MYNN scheme prevents the moisture tongue from advancing further north and westward, leaving the upstream region moisture-starved. This is consistent with previous findings that local TKE closure schemes like MYNN often result in a shallower, moister boundary layer, whereas non-local schemes like YSU tend to produce deeper, more vigorously mixed boundary layers that can push the dryline further into the drier air mass [17]. While the primary synoptic dryline advanced eastward toward the 100° W–99° W corridor, the environment exhibited a stepped moisture profile characteristic of High Plains “double dryline” structures. The western convective initiation (CI) zone near Burlington (104° W–103.5° W) did not occur along the primary synoptic boundary, but rather triggered along a secondary, localized moisture and convergence boundary. This western CI zone resulted from localized, terrain-induced ascent and localized surface wind shifting within the broader, heterogeneous dryline environment. Consequently, the HCR-boundary intersections discussed in this study represent interactions with this critical secondary boundary, which served as the primary mesoscale trigger for deep convection prior to interacting with the primary dryline further east.

4.1.2. Surface Kinematics and Convergence Analysis

The 10-m surface wind vectors provide the primary mechanism for low-level moisture transport and mechanical lift. In the YSU simulation at 21:30 UTC, we observe a southerly to southeasterly flow east of the dryline, which acts as a “moisture pump,” increasing the low-level convergence along the interface. The surface wind shift across the dryline—from westerly on the dry side to southerly or southeasterly on the moist side—creates a focused zone of horizontal mass convergence. This dryline convergence zone is critical for overcoming the CIN present in the High Plains environment [5]. By 22:00 UTC, the YSU simulation shows the convergence zone directly interacting with the moisture tongue, where the convective echoes are observed. The YSU scheme is effectively using this localized surface inflow to sharpen the moisture gradient. If the model doesn’t get the wind-moisture relationship right at this surface level, the “fuel” for the storms will not be available to trigger the CI.
The MYNN generates anomalously high wind speeds at the surface, characterized by a persistent northerly to north-northeasterly orientation throughout the 21:00 UTC–22:00 UTC period. This flow regime acts to advect cooler, drier air southward, effectively “smearing” the moisture gradient and preventing the formation of a focused convergence line. The northerly bias in the MYNN simulation represents a clear failure in capturing the mesoscale pressure gradient typical of High Plains drylines. By maintaining a northerly component, the MYNN scheme prevents the “moisture tongue” advance from pooling along the boundary. Instead of the air being forced upward, it is displaced laterally. The northerly surface flow often suggests a more stable, shallow boundary layer that is being “pushed” by a surface high-pressure influence, which reduces the deepening of the moist layer that YSU achieves through its non-local mixing and southerly moisture advection. This lack of a cross-boundary wind component means that despite having high wind kinetic energy, the MYNN run cannot trigger CI because it lacks the necessary vertical velocity [4].
The environment of the dryline is typically characterized by a robust capping inversion, or ‘lid,’ resulting from the advection of a warm, dry elevated mixed layer over the moist boundary layer [5]. This stable layer prevents the release of accumulated CAPE until localized mechanical lifting along the surface dryline convergence zone is sufficient to break the inversion [4]. The stronger surface convergence seen in the YSU wind field provides the mechanical “punch” needed to break through that lid. This confirms that the model’s dynamical trigger (the surface wind shift) agrees well with its thermodynamic fuel (the Td gradient). The fact that YSU and MYNN produce different dryline positions at 22:00 UTC demonstrates that the PBL scheme is the dominant variable in this simulation. It proves that the “mixing-out” of moisture in the lower atmosphere is the primary driver of where the surface dryline ends up [21].

4.2. Convective Initiation and Radar Reflectivity Evolution

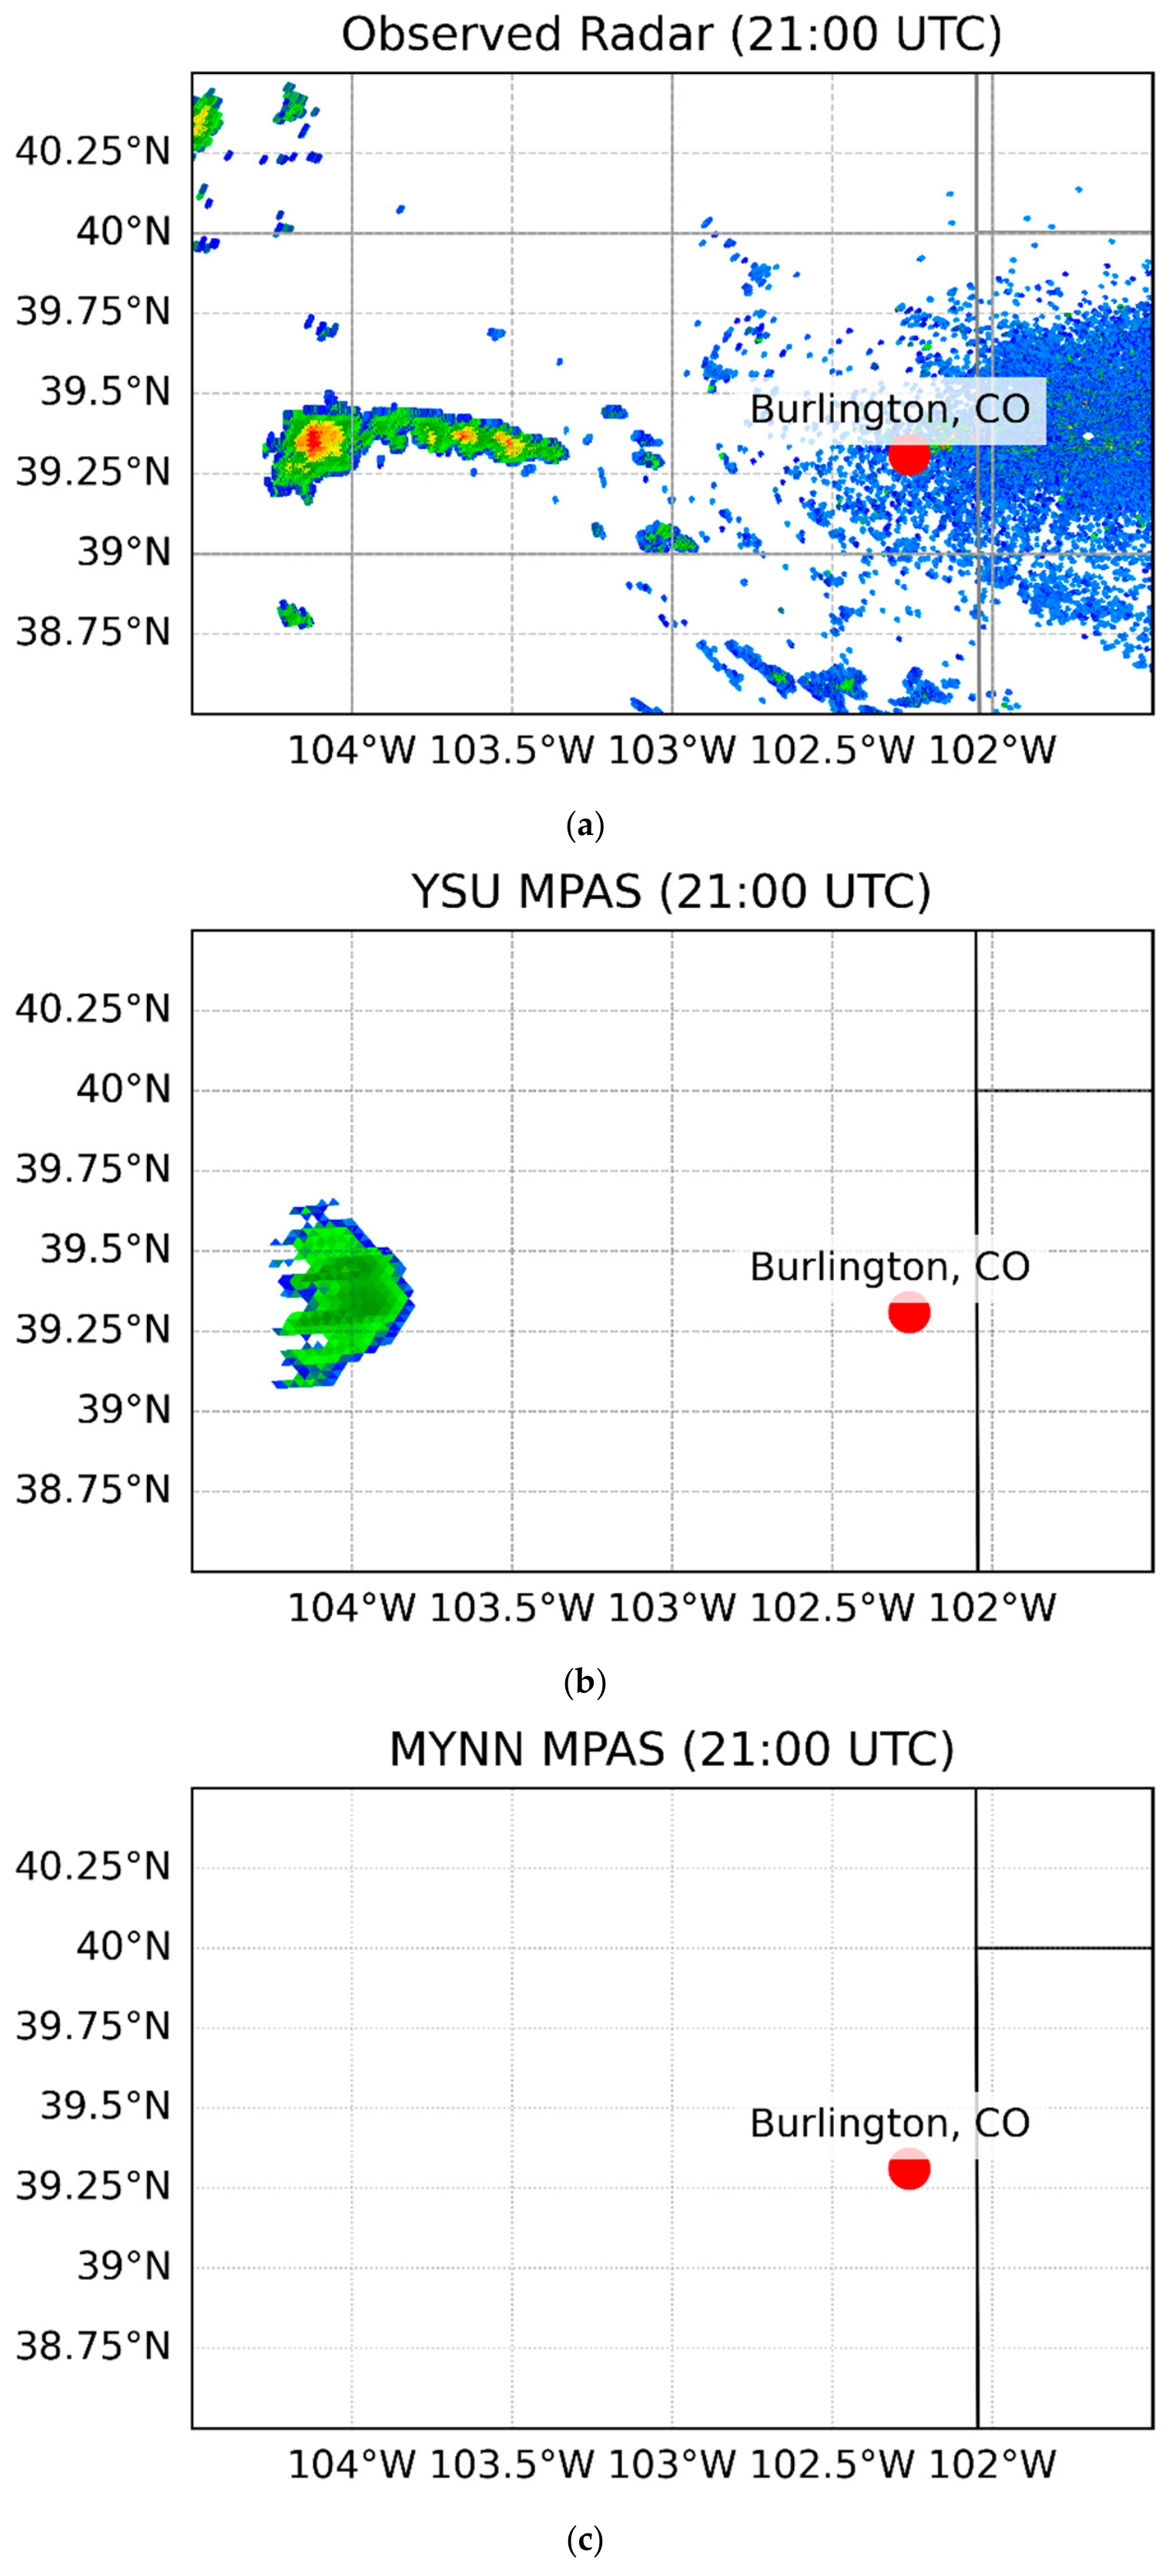
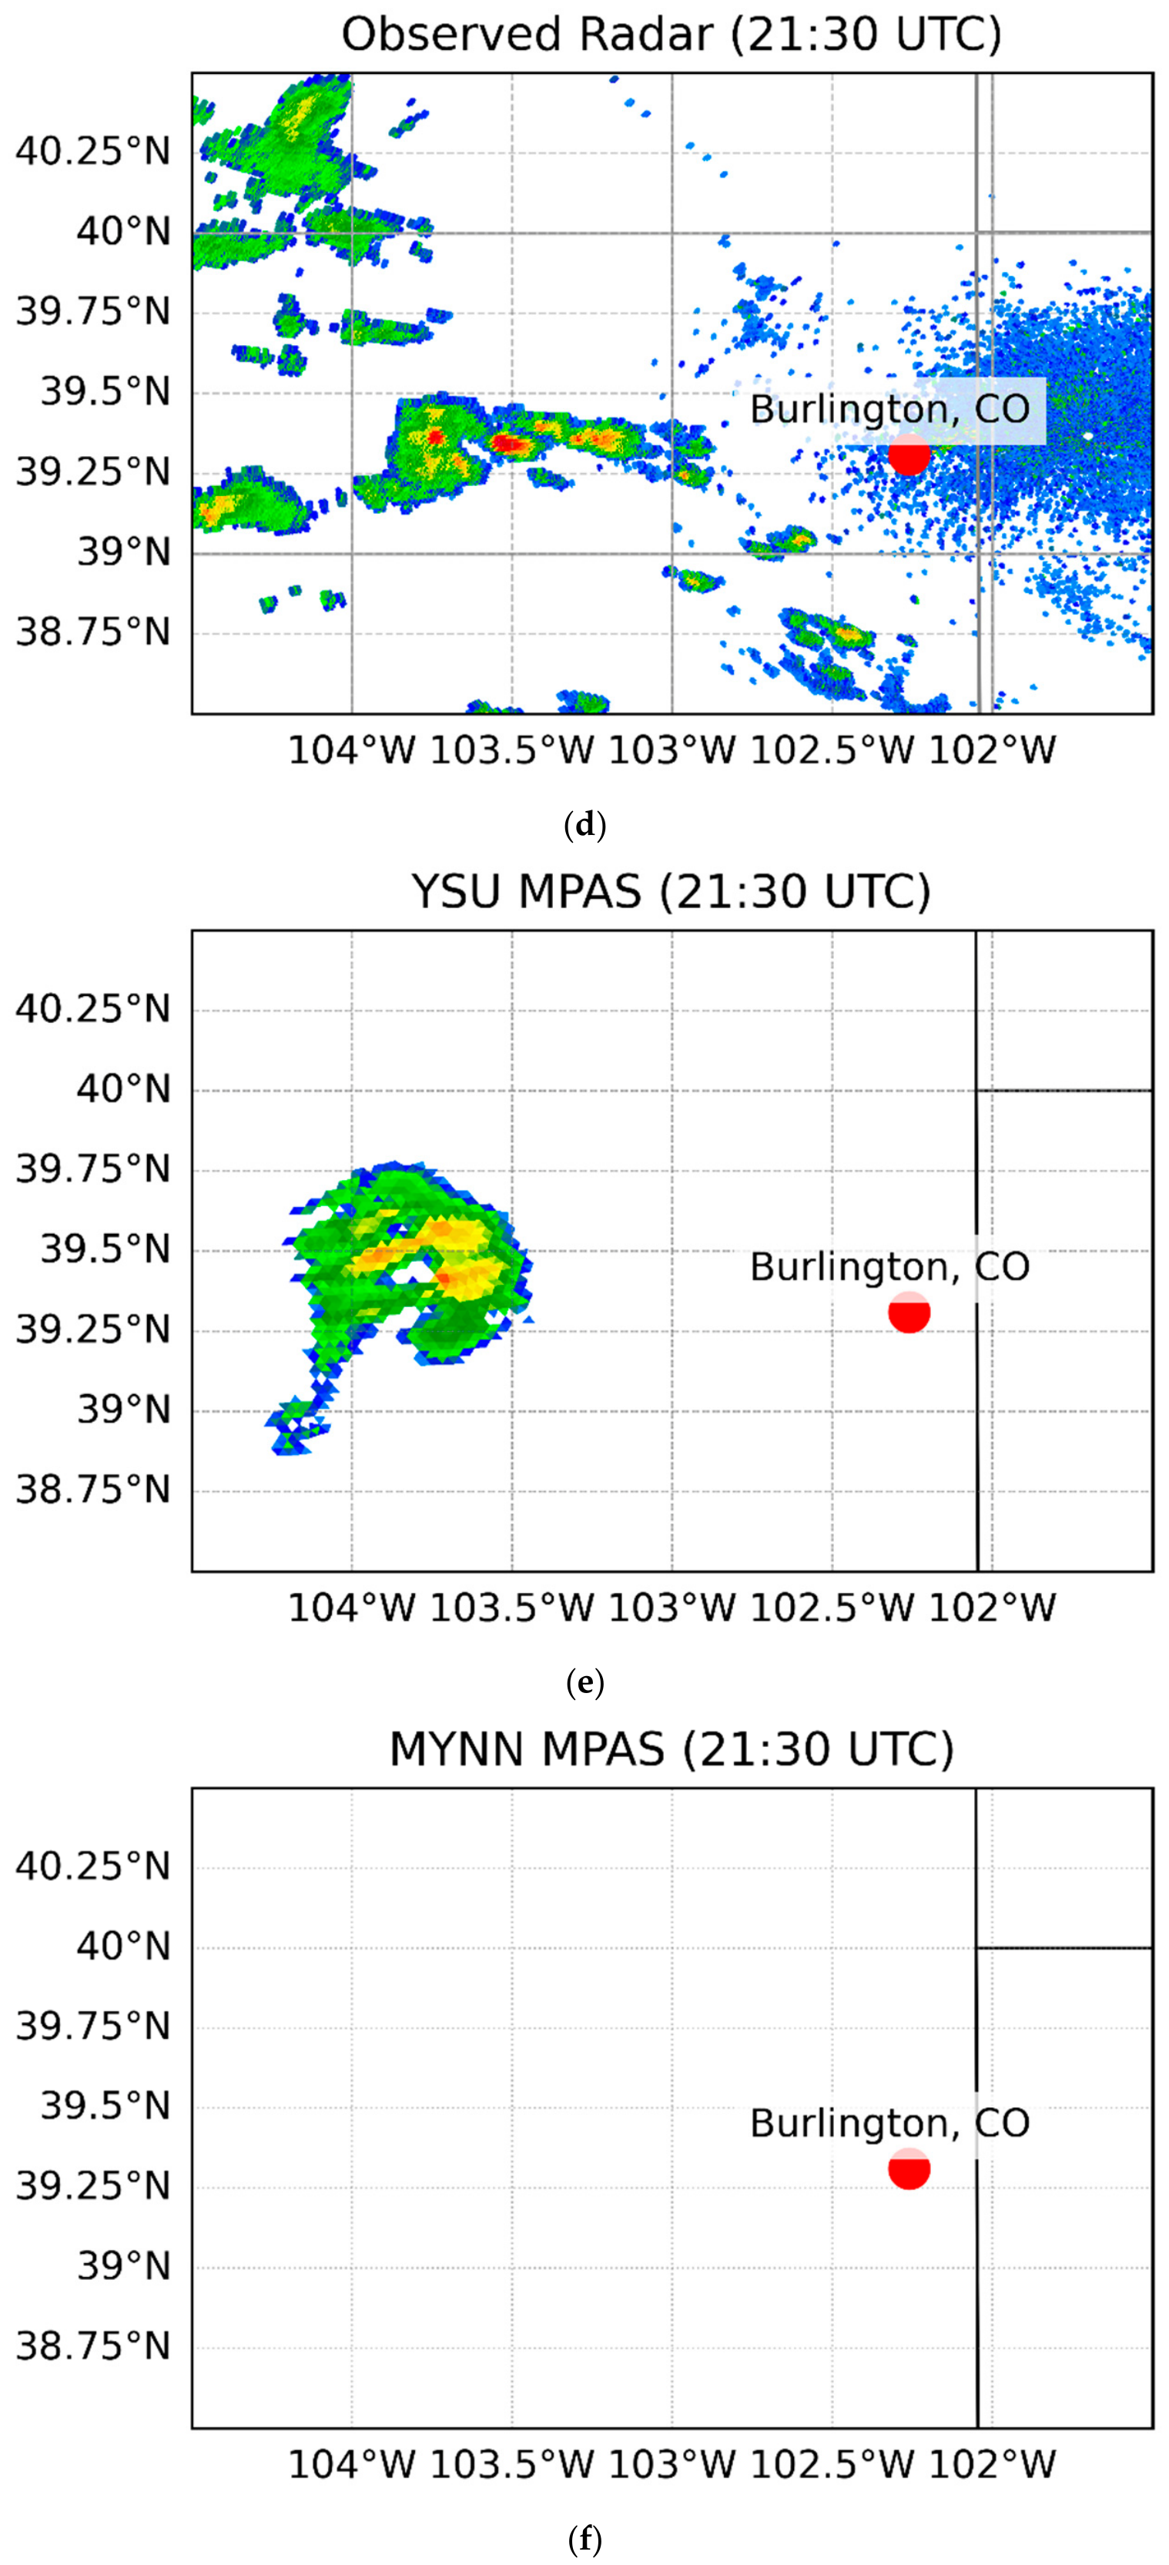
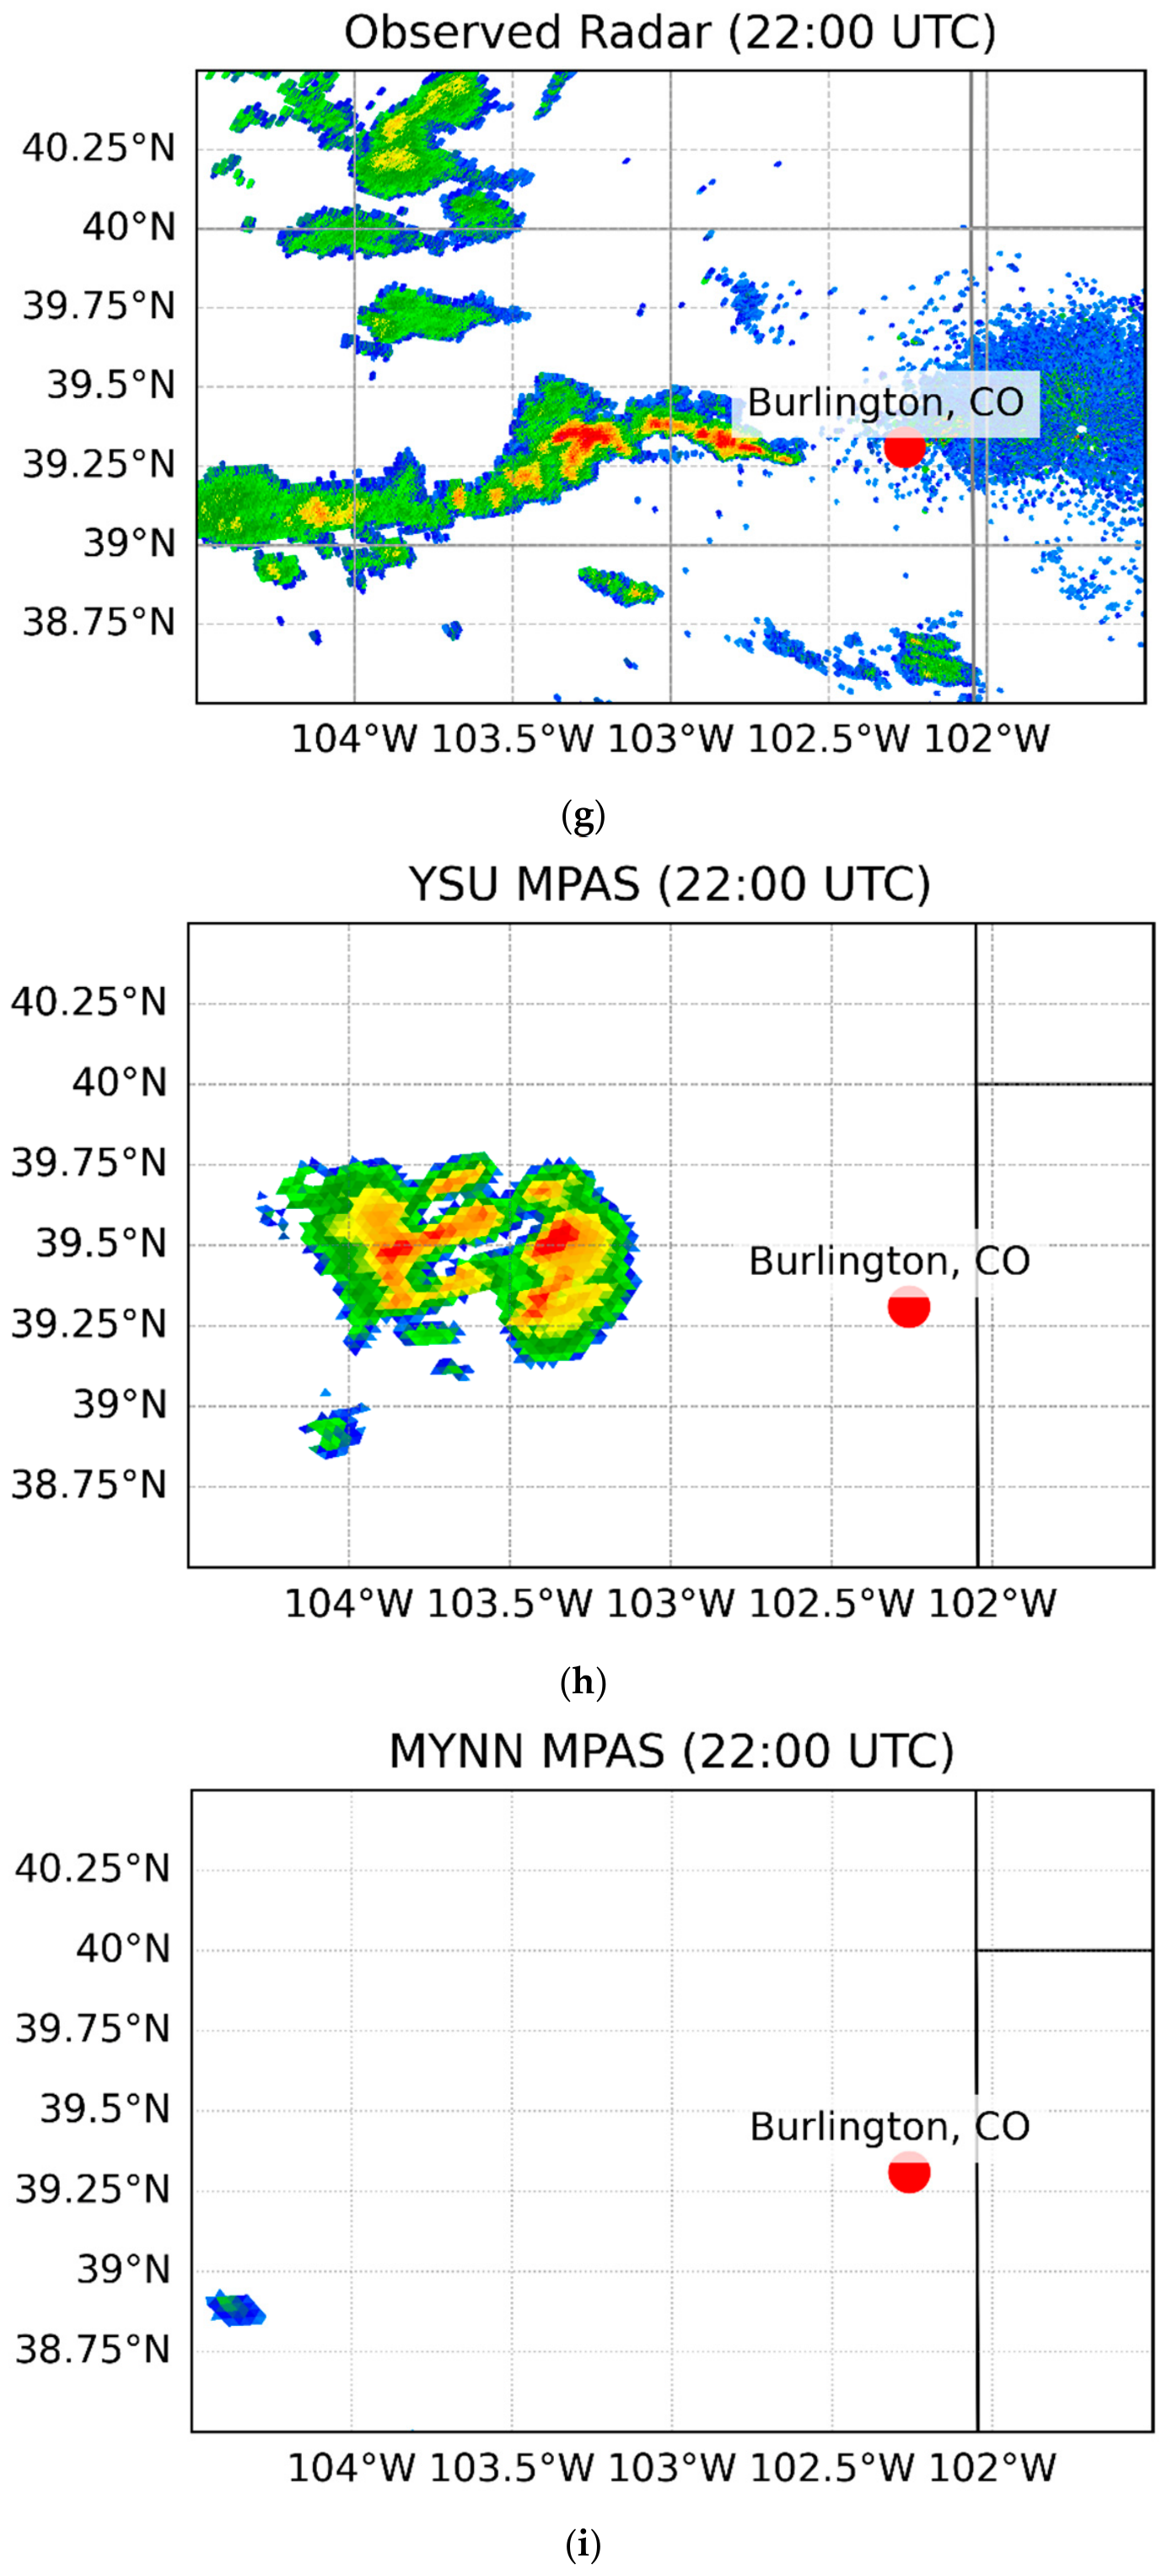
The ability of a convection-permitting model to accurately describe the time and place of initiation is a critical metric for evaluating PBL parameterization performance [6]. Figure 3 presents a 3-panel comparison of the observed NEXRAD reflectivity against the YSU and MYNN simulated maximum reflectivity at 21:00 UTC (a), 21:30 UTC (b), and 22:00 UTC (c).

4.2.1. Observations and YSU Performance

Radar observations indicate the first signs of CI near the dryline interface around 21:15–21:30 UTC, with cells rapidly intensifying into mature convective cores exceeding 50 dBZ by 22:00 UTC. The YSU simulation demonstrates remarkable skill in reproducing the timing and spatial morphology of this event. At 21:30 UTC (b), YSU begins to develop reflectivity echoes (>15 dBZ) in close proximity to the observed initiation points along the elevated terrain slope, well west of the primary dryline boundary. By 22:00 UTC (c), the YSU scheme successfully captures three distinct convective cells. While the simulated peak intensities (approximately 45–49 dBZ) are slightly lower than the observed 55+ dBZ, the spatial alignment with the dryline convergence zone is highly consistent with the observed storm evolution. As we presented in Section 4.1, YSU produced a convergent wind field that acted as a mechanical trigger. The reflectivity maps confirm that this trigger was physically valid. Because the wind shifted from southwesterly to southeasterly, the model generated enough localized “updraft power” to break the cap. The fact that YSU triggers CI at 21:30 UTC (matching observations) suggests that its boundary layer deepening (the rate at which the PBL grows during the day) was accurate. If a PBL scheme is too slow to mix, CI is delayed; if it mixes too fast, CI happens too early. YSU’s “non-local” mixing appears to have captured this growth rate correctly.

4.2.2. MYNN Convective Suppression

In contrast, the MYNN simulation fails to initiate any deep convection within the target domain throughout the study period. At 22:00 UTC, while observations and the YSU run show mature storms, the MYNN reflectivity field remains entirely clear. This total suppression of CI in the MYNN run is a direct consequence of the kinematic and moisture biases identified in Section 4.1. The lack of cross-boundary convergence and the southward displacement of the moisture tongue meant that no parcels were lifted to their LFC, highlighting the “all-or-nothing” nature of convective triggering in capped dryline environments [8].

4.3. Vertical Thermodynamic Profiles and the Capping Inversion

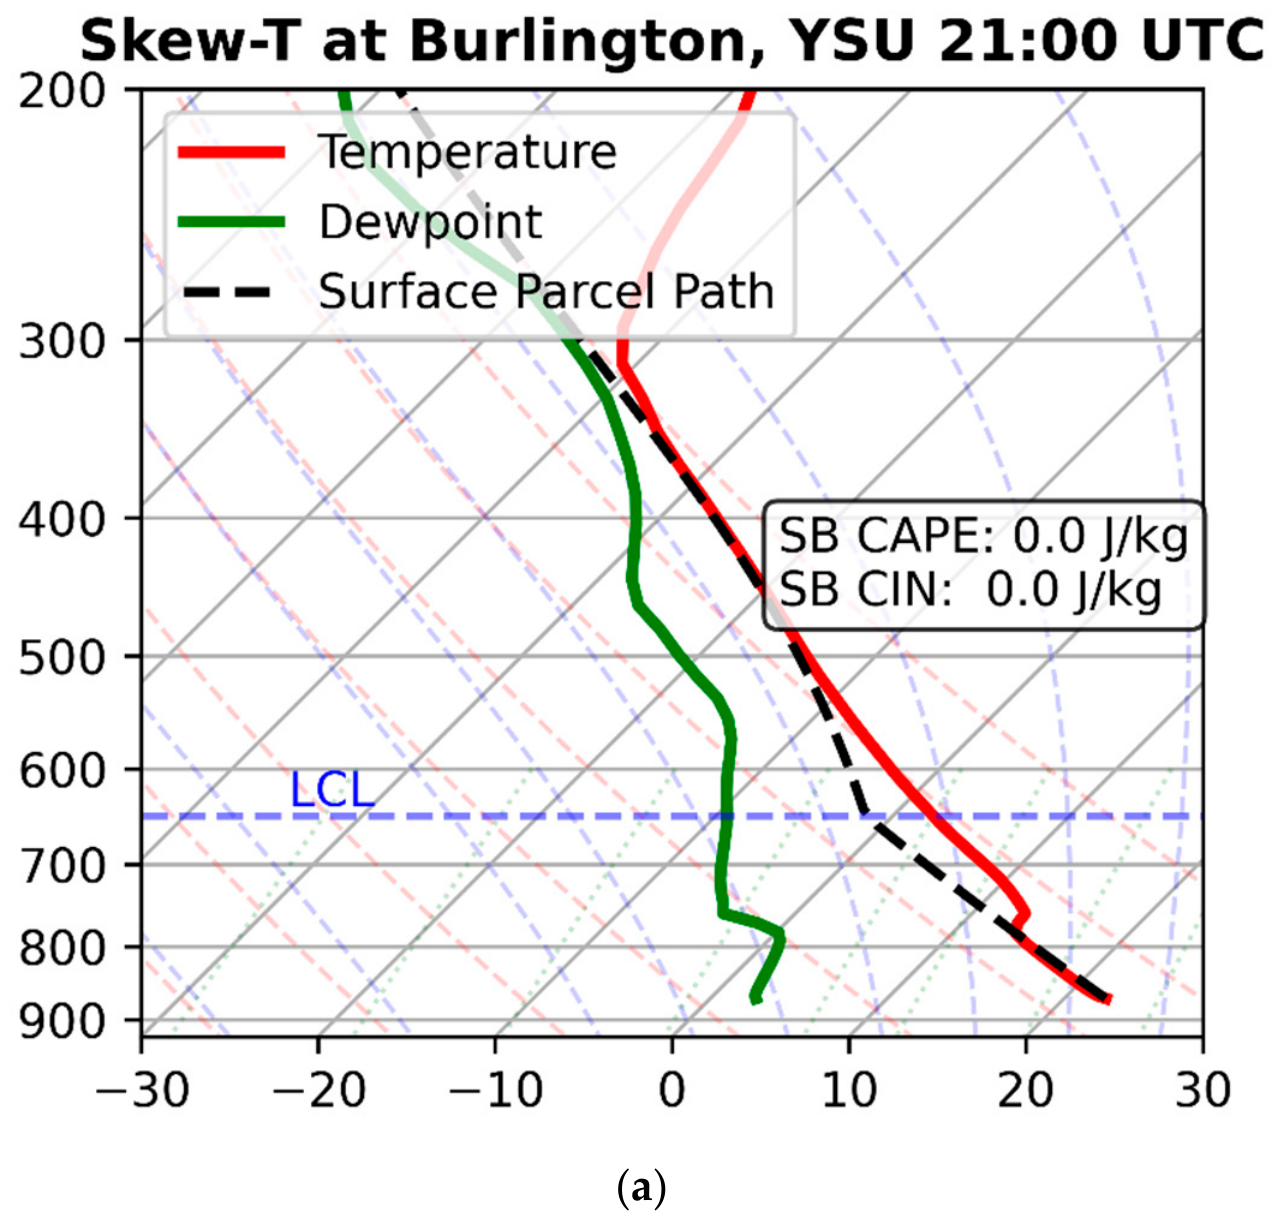
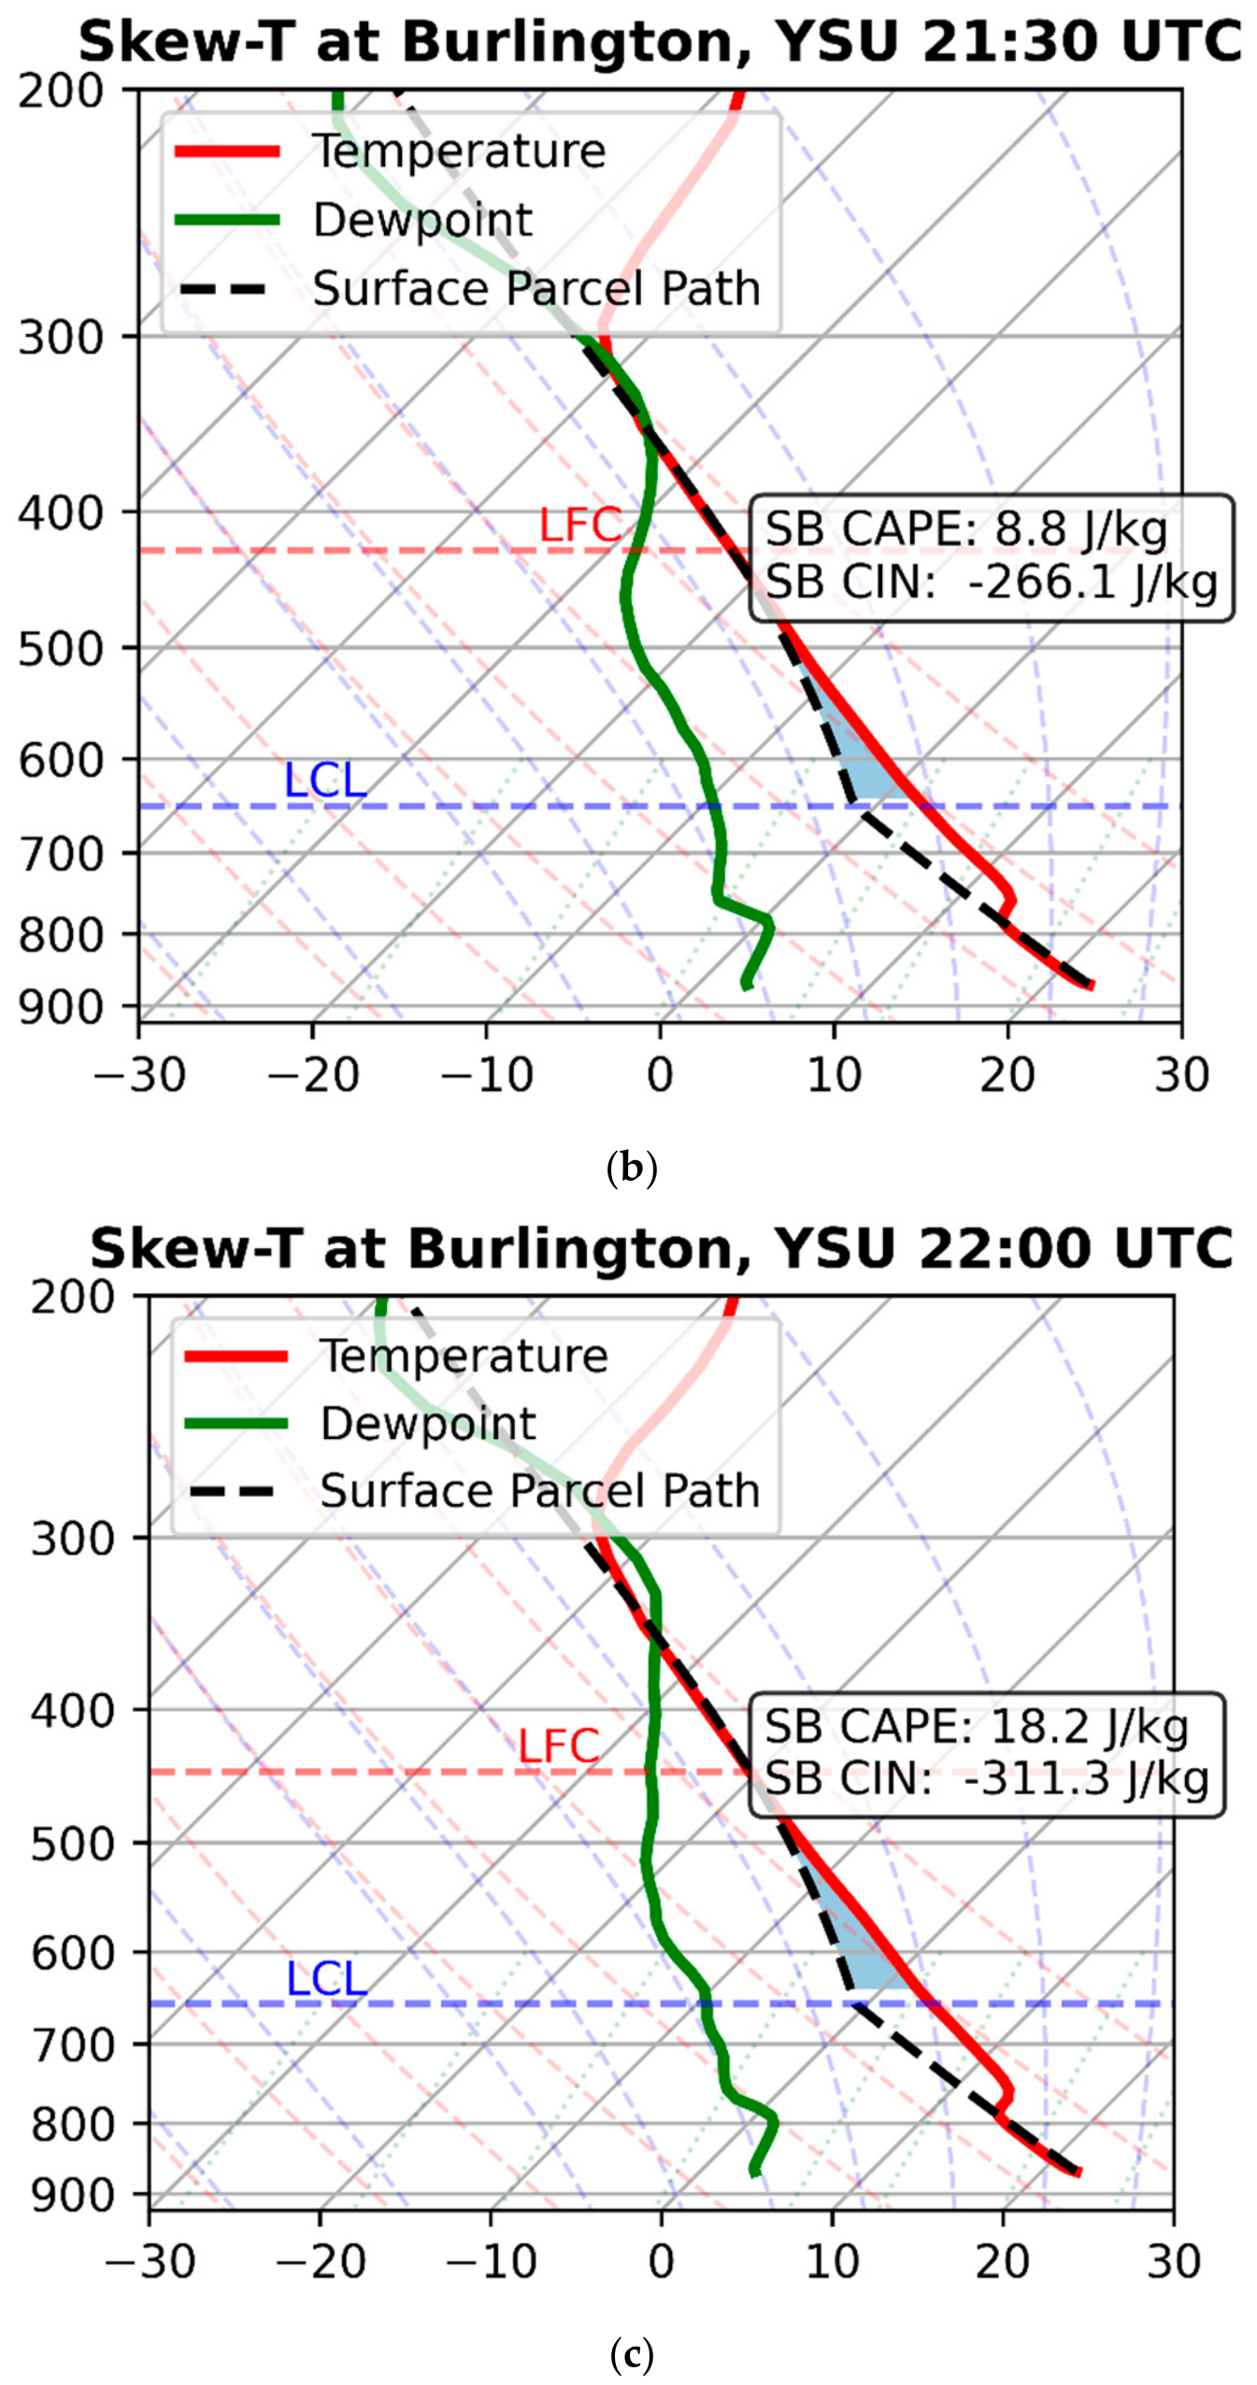
To understand the physical cause of the initiation disparity, vertical profiles (Skew-T Log-P diagrams) were analyzed at Burlington, CO (Figure 4). These profiles reveal the struggle between the available energy (CAPE) and the inhibiting “lid” (CIN).

4.3.1. Thermodynamic Evolution in YSU

At 21:00 UTC, the YSU profile at Burlington (Figure 4a) exhibits a well-mixed boundary layer extending to approximately 700 hPa. While a notable capping inversion is present between 700 hPa and 650 hPa, the YSU surface parcel is primed by high boundary layer moisture. By 21:30 (Figure 4b) and 22:00 UTC (Figure 4c), the persistent low-level convergence (identified in Section 4.1) acts to erode this inhibition. The dashed parcel path in the YSU profiles shows the surface air successfully breaching the “lid,” reaching the LFC and tapping into the significant CAPE reservoir aloft. This “erosion of the cap” implies a successful CI along drylines [4].

4.3.2. Persistent Inhibition in MYNN

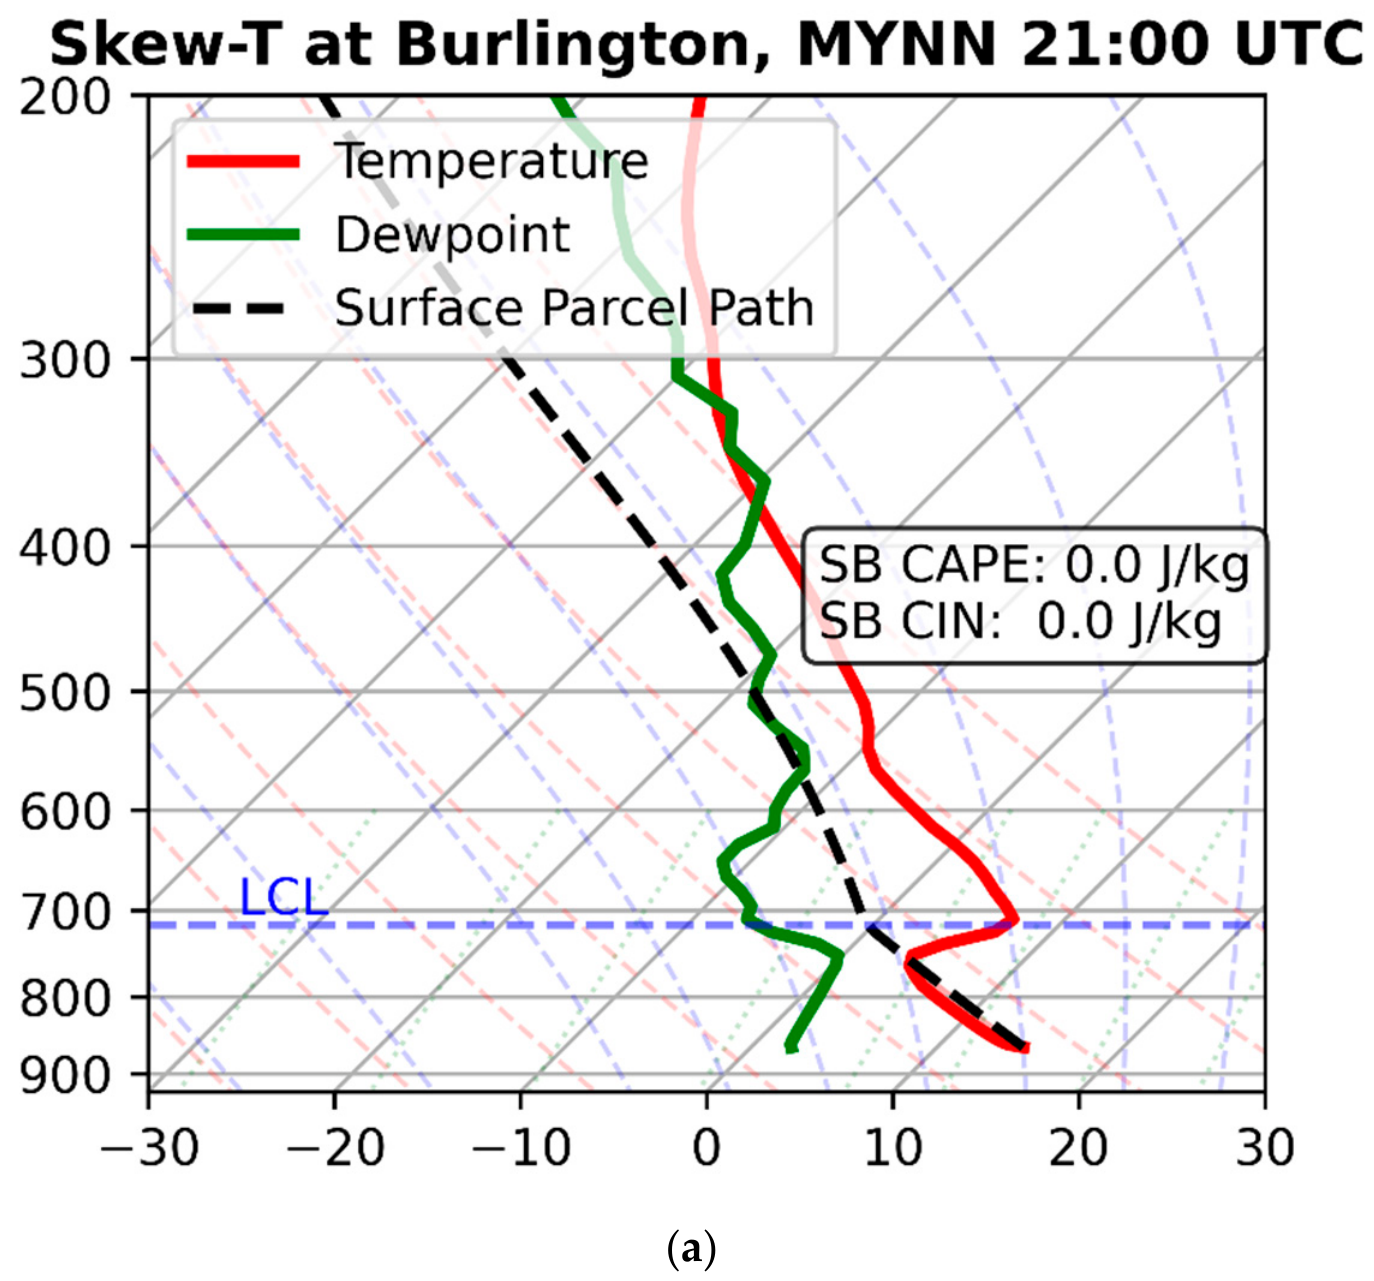
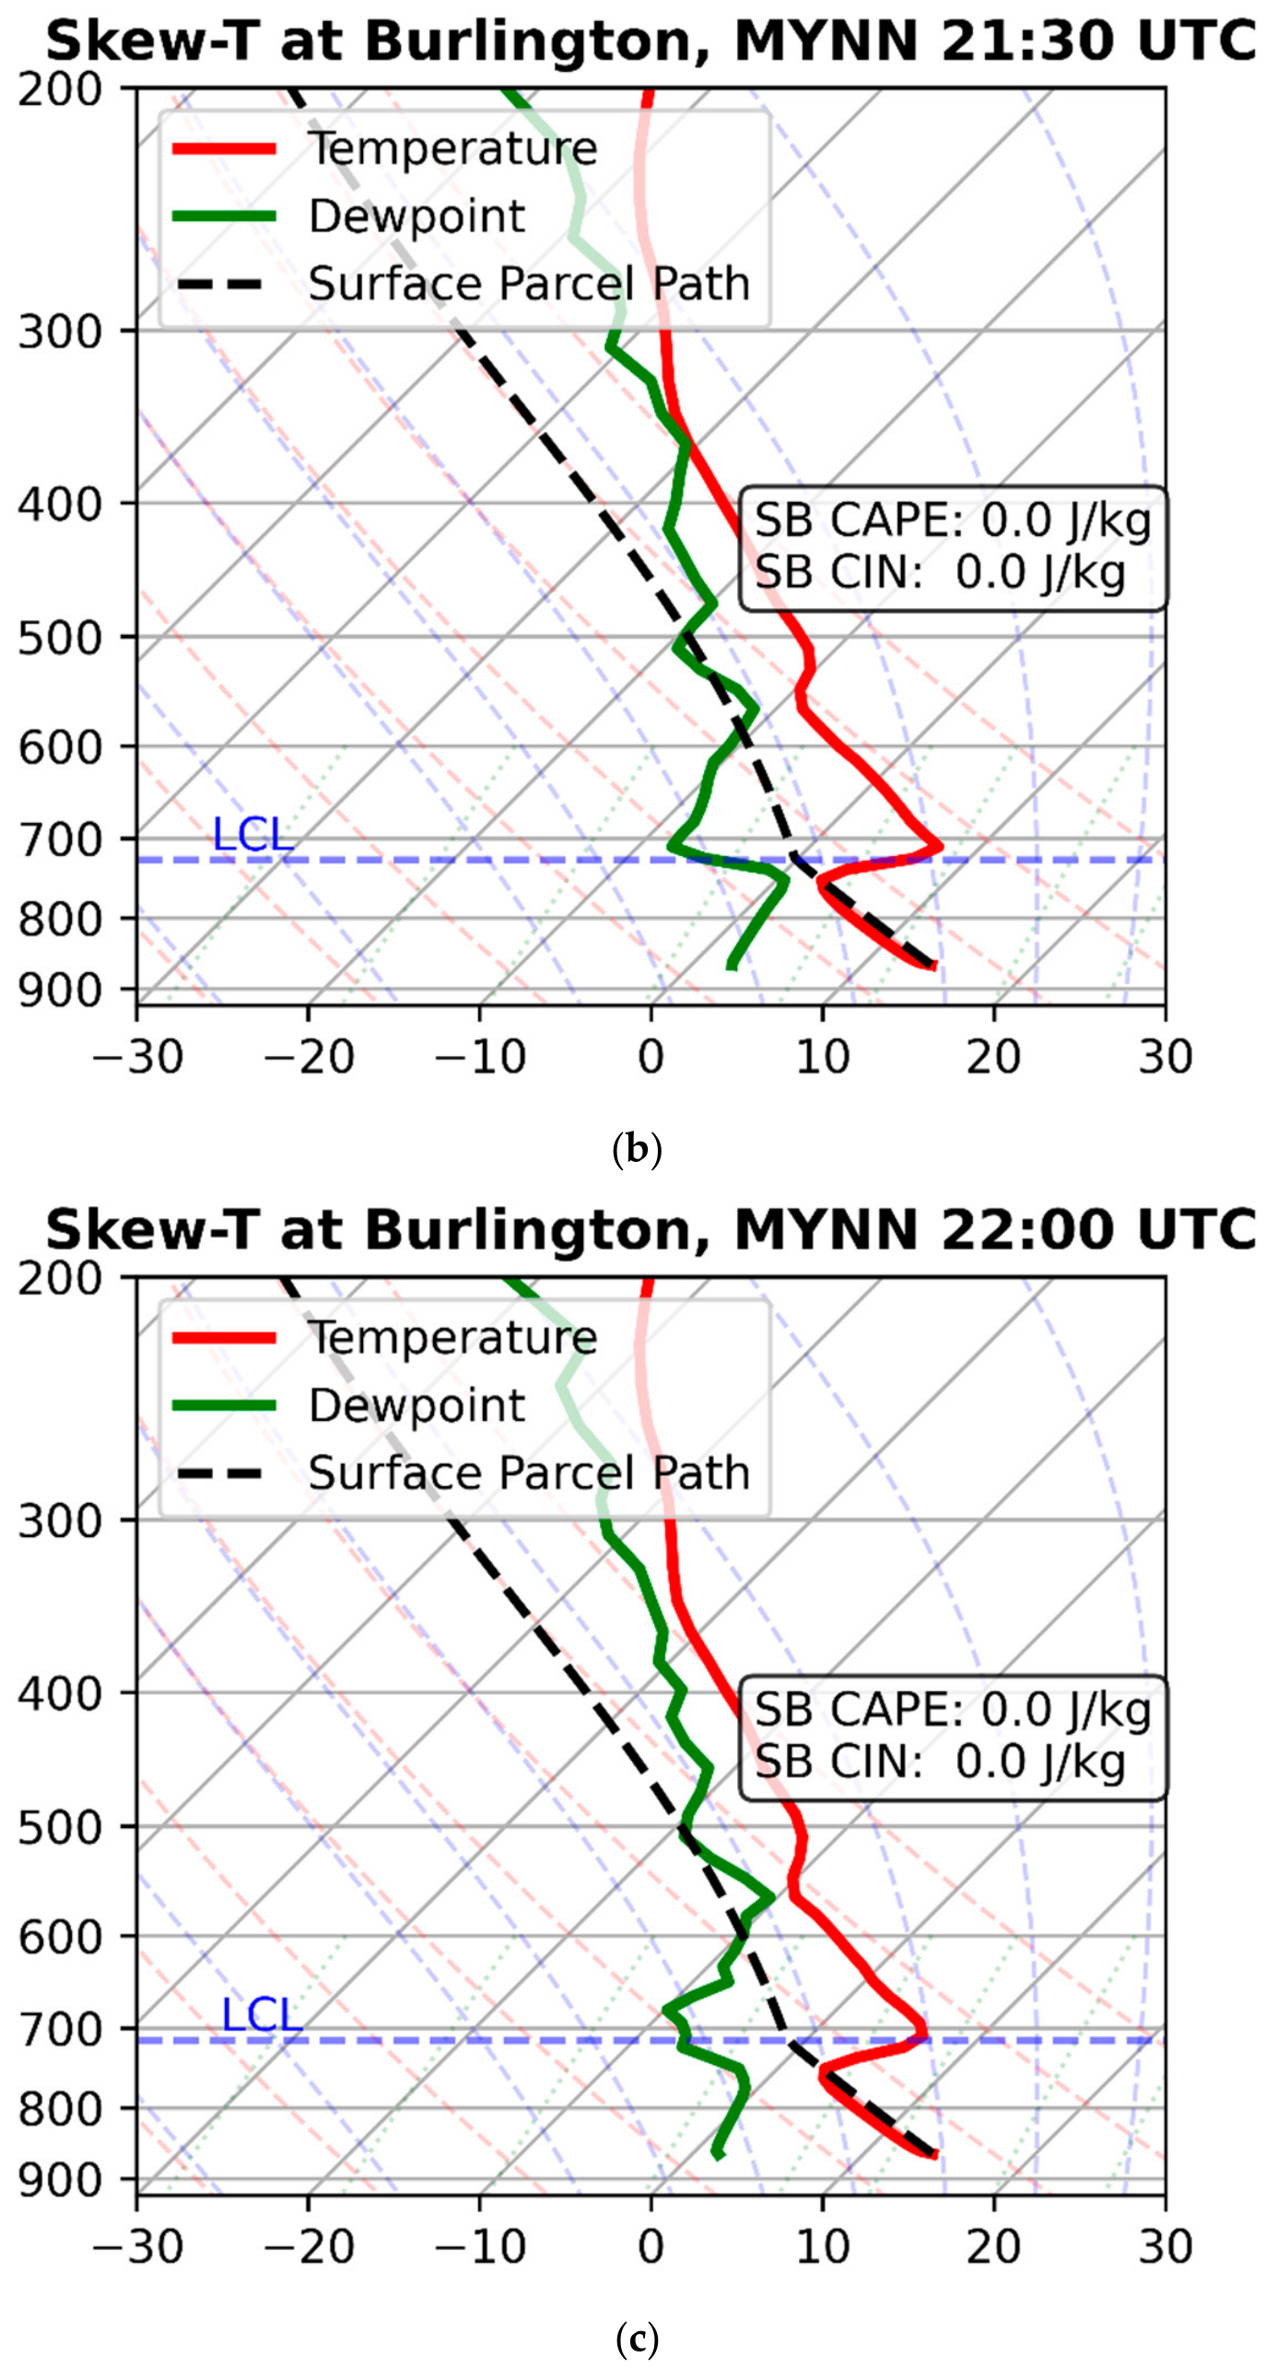
The MYNN Skew-T profiles offer a different narrative. At 21:00 UTC (Figure 5a), the MYNN profile shows a shallower mixed layer compared to YSU. Crucially, the moisture in the MYNN run is confined to a very thin layer near the surface, while the temperature inversion (the “lid”) remains much more robust. At 21:30 (Figure 5b) and 22:00 UTC (Figure 5c), the parcel path for MYNN consistently stays to the left of the environmental temperature line. This indicates that the parcels remained negatively buoyant throughout the column. The lack of a non-local mixing component in MYNN meant the “lid” was never effectively weakened, and the “northerly sweeping” winds prevented moisture from overcoming the inhibition [13]. Compared with the MYNN scheme, the YSU profile shows a “deeper” red line (Temperature) in the boundary layer. This is because YSU’s non-local mixing transports surface heat higher up. This “lifts” the base of the capping inversion, making it easier for a parcel to punch through. For the dew point lines (the green lines), YSU maintains a “fatter” moisture profile in the lowest 100 hPa. This keeps the LCL lower and the parcel warmer as it rises, increasing its chance of reaching the LFC. For the red line (the inversion), MYNN provides an inversion that is much sharper and “warmer” relative to the parcel path. This physical “lid” is what definitively blocked the convection.

4.4. HCRs and Boundary Layer Kinematic Interactions

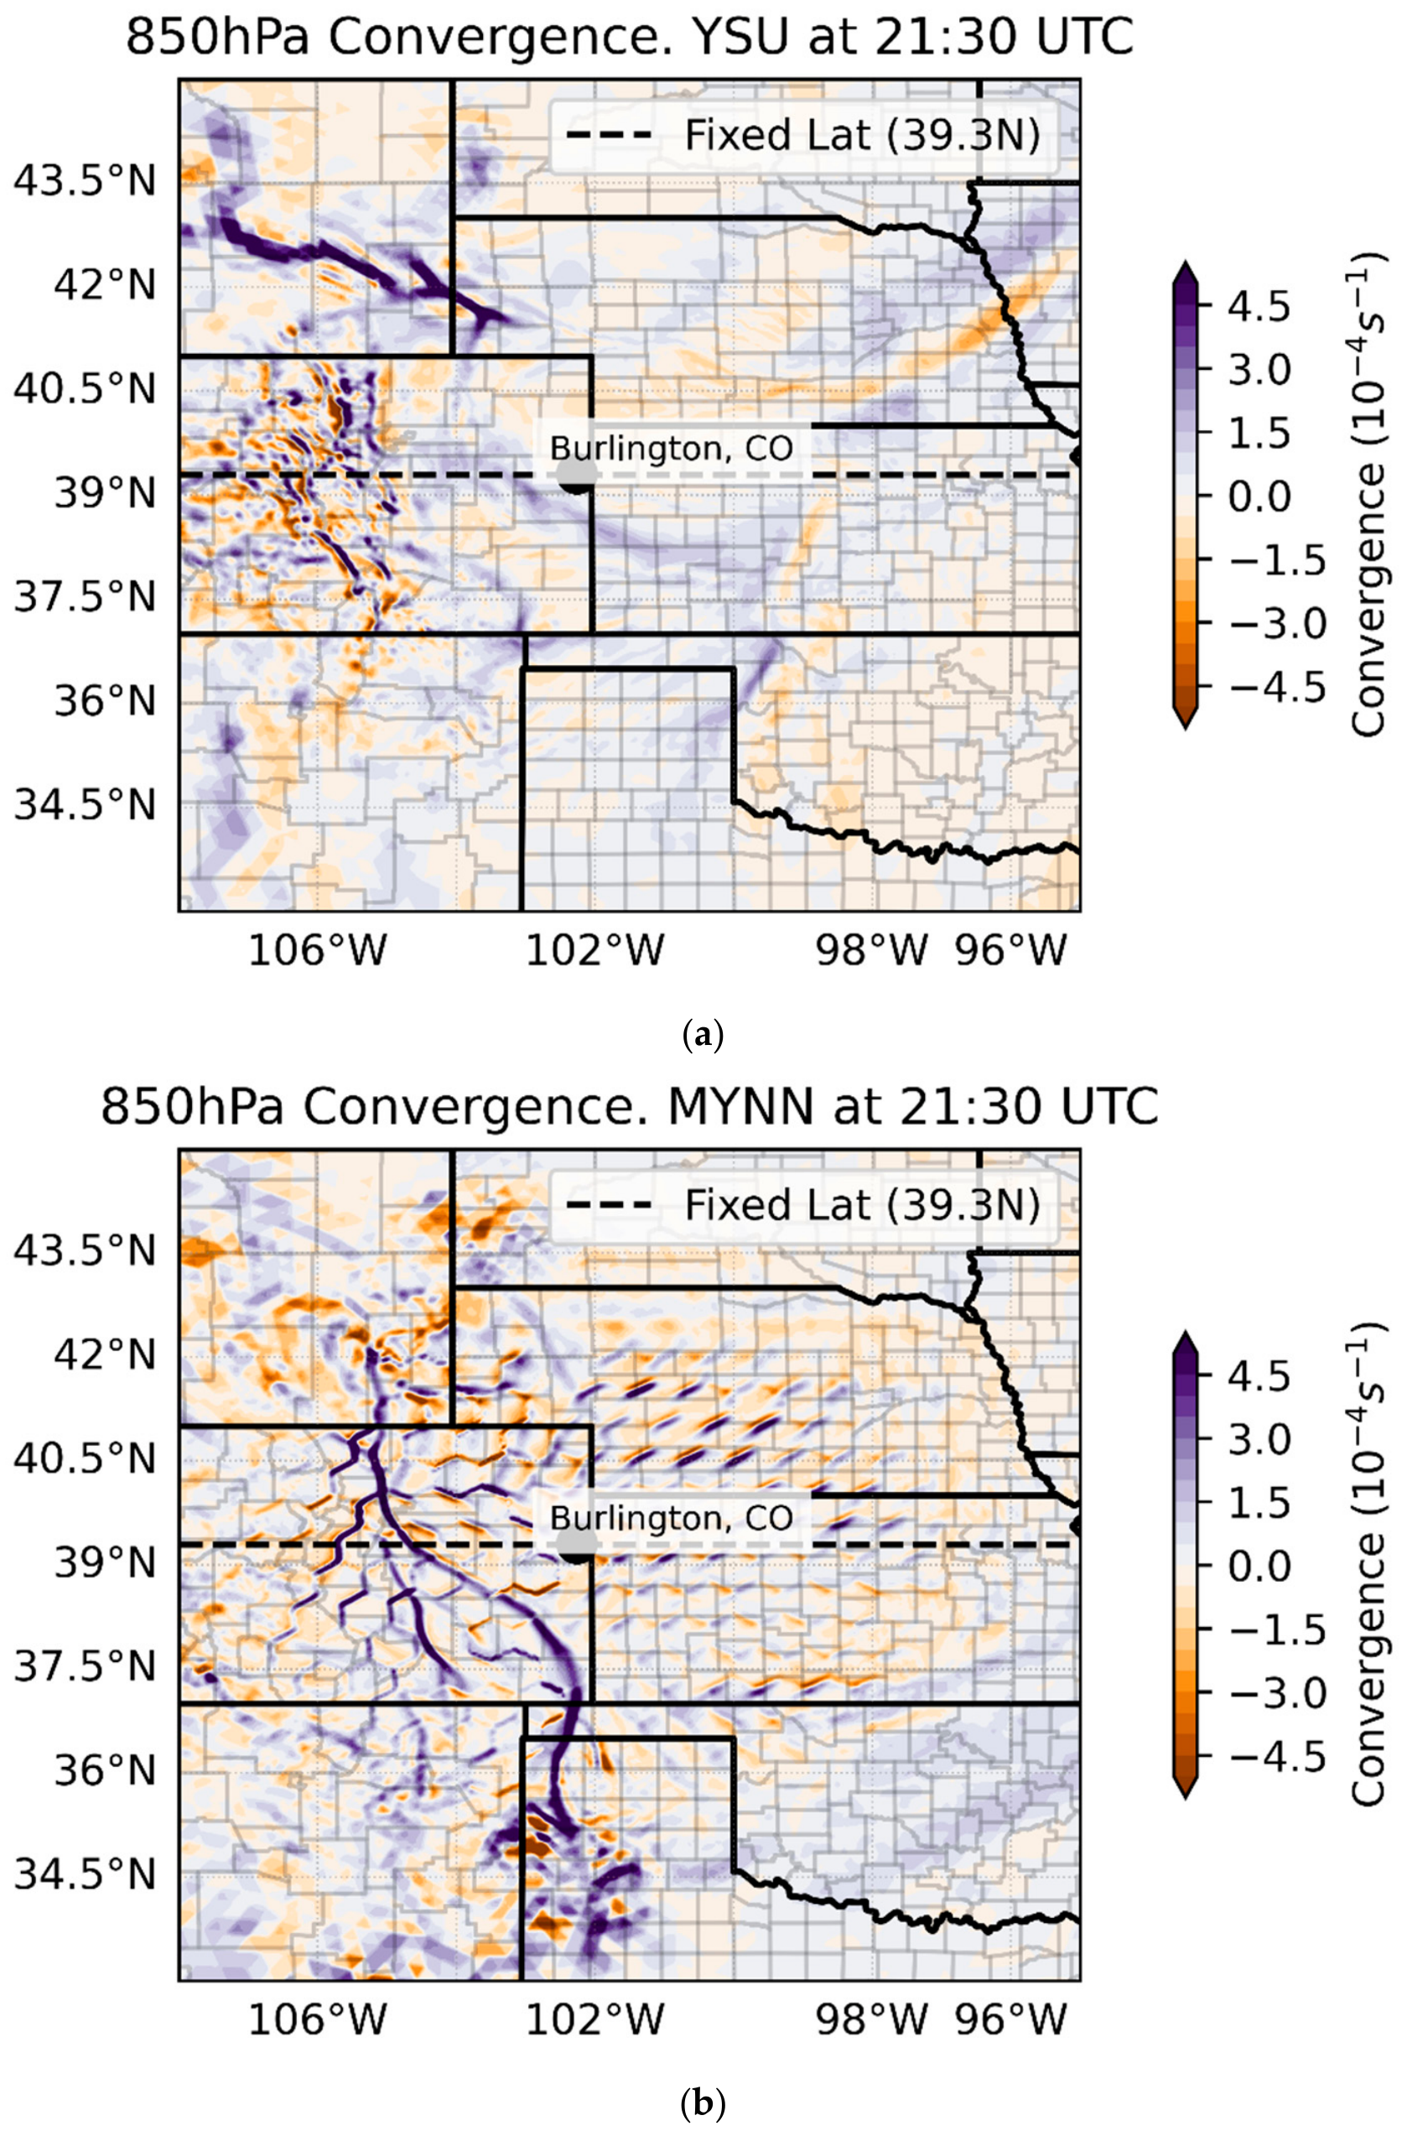
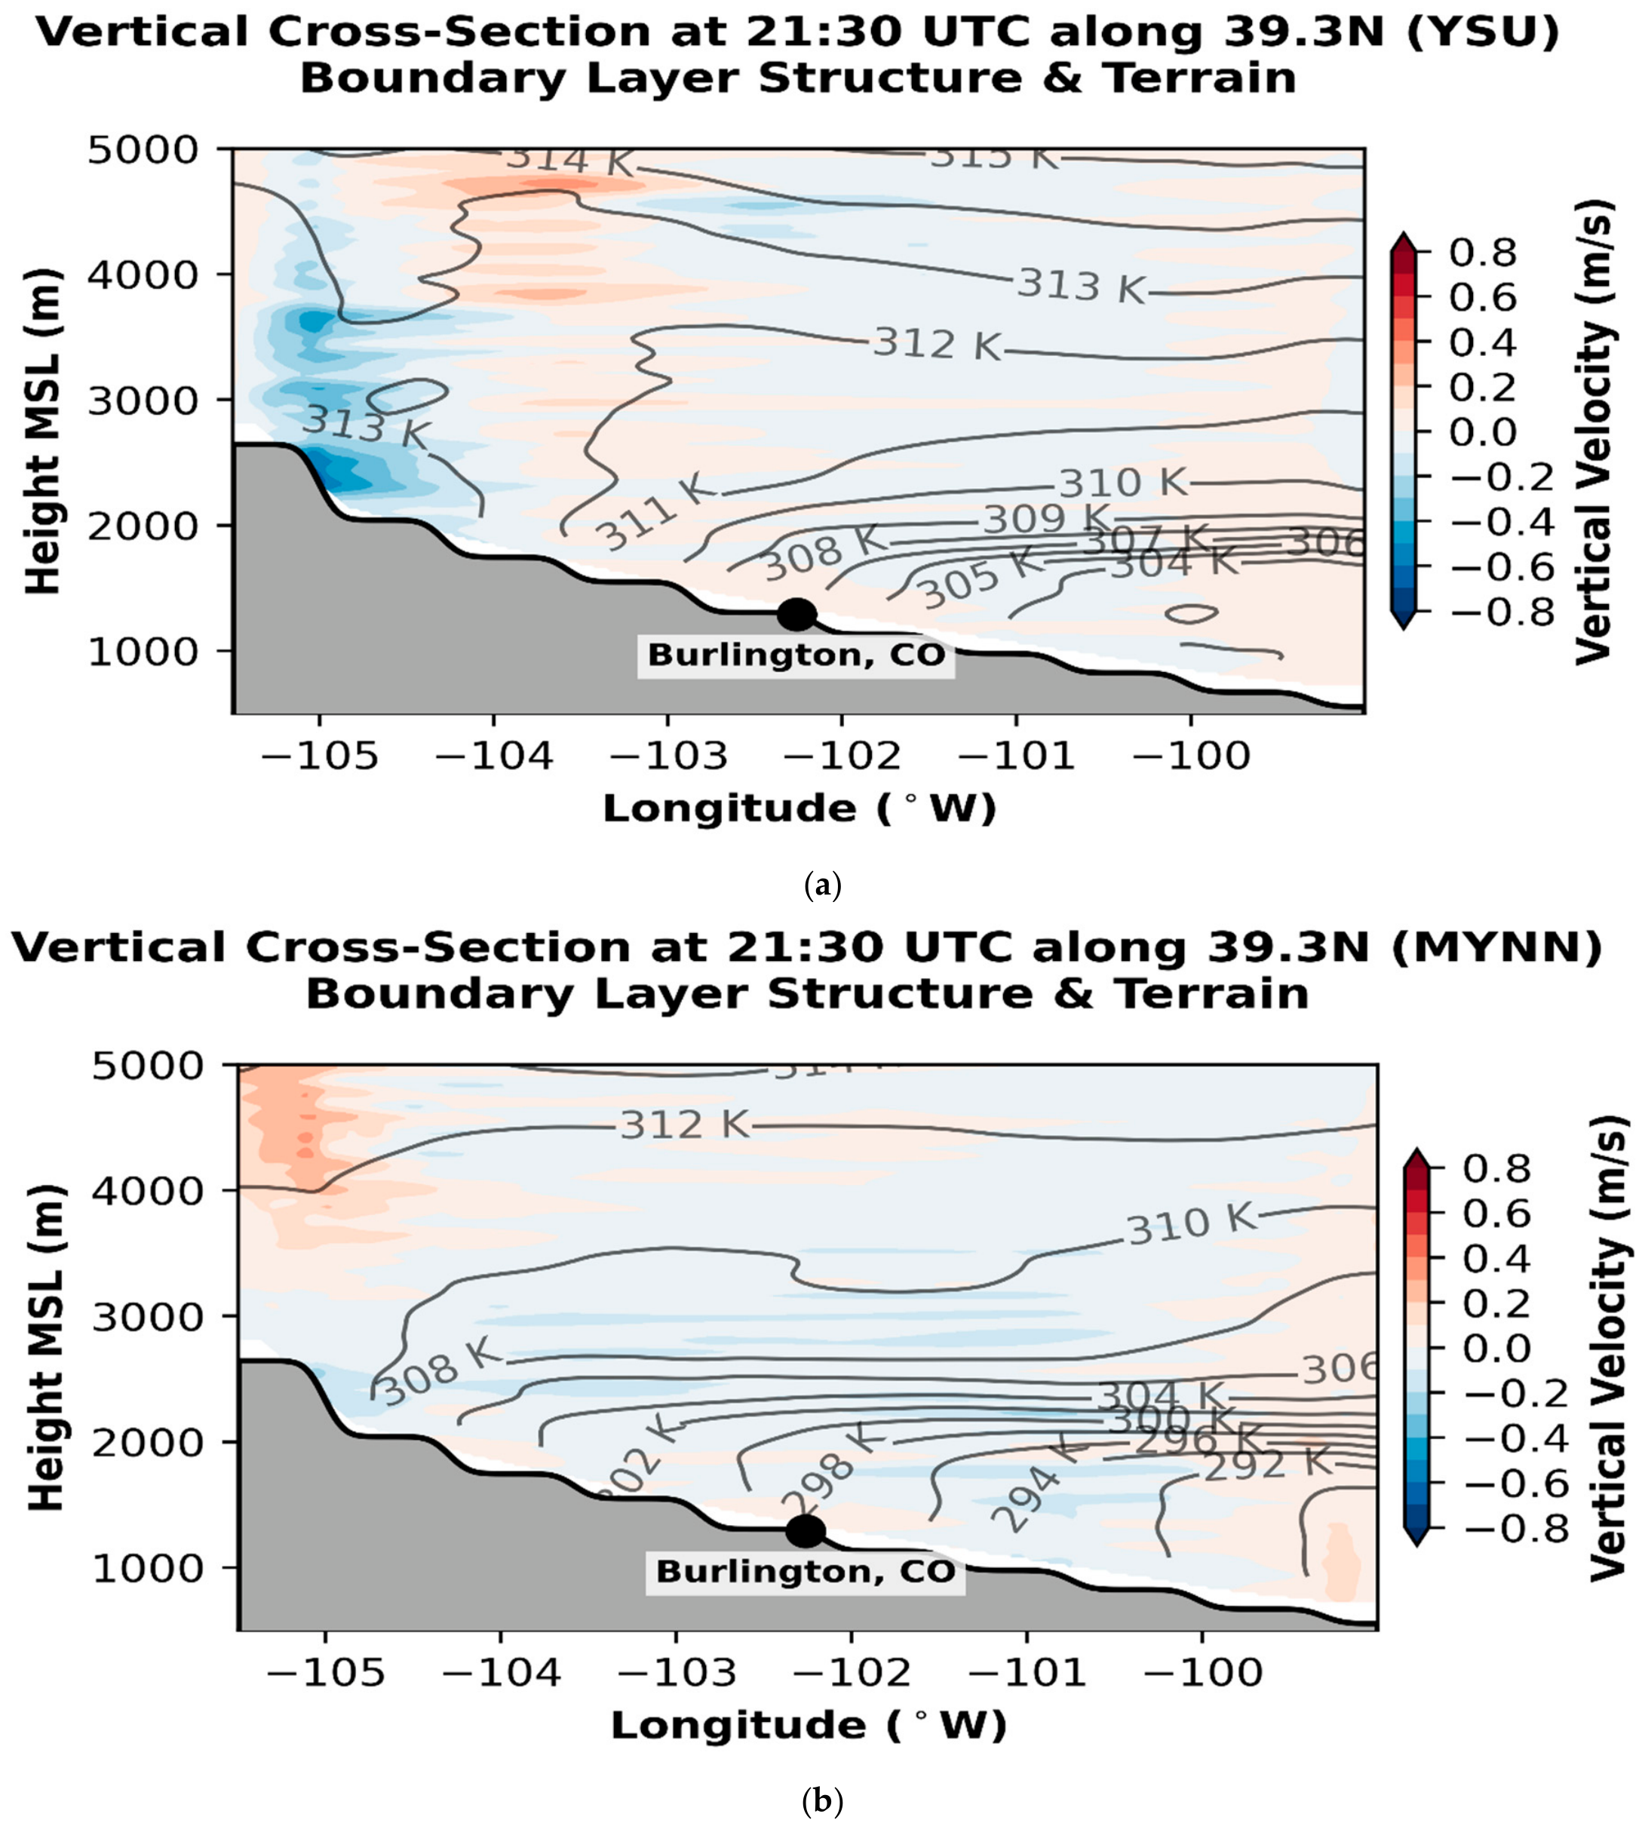
To evaluate the sub-mesoscale mechanisms governing localized convective triggering, the horizontal and vertical structures of boundary layer circulations were analyzed at 21:30 UTC. At a horizontal grid spacing of 3 km, convection-permitting models approach the “grey zone” of turbulence resolution, where large-scale boundary layer eddies can begin to be explicitly captured rather than entirely parameterized [10]. Because the intense diurnal heating over the elevated High Plains drives the boundary layer depth (h) to exceed 3000 m, the corresponding HCR wavelengths—which scale proportionally to PBL depth—expand to 6 to 9 km. Consequently, a 3 km horizontal grid spacing becomes capable of partially resolving these large-scale overturning eddies, confirming the model’s operation within the turbulence grey zone (Δx/h ≈ 1). Figure 6a and Figure 6b display both the YSU and MYNN simulations of 850 hPa horizontal convergence, while Figure 7a and Figure 7b provide the companion vertical cross-sections of vertical velocity (w) and potential temperature (θ) along 39.3° N for the YSU and MYNN simulations, respectively. At this time, as established by the surface moisture fields in Section 4.1 (Figure 2), the primary dryline interface is characterized by a sharp, coherent moisture gradient positioned further east in the domain, centered tightly around 100.0° W.

4.4.1. Horizontal Morphology of HCR-Dryline Intersections

At a horizontal grid spacing of 3 km, both simulations (Figure 6a,b) successfully resolve organized, alternating linear bands of horizontal convergence and divergence zones around the dryline. This is understandable. At a 3 km grid spacing, the explicit grid-scale equations of motion (the dynamic core of MPAS) are strong enough to resolve alternating horizontal lines of convergence and divergence when forced by daytime solar heating. This horizontal wave development is largely a function of grid resolution and horizontal wind shear, which both models share. It is noted that these parallel features are aligned with the mean boundary layer flow, exhibiting horizontal wave patterns and aspect ratios consistent with classical HCRs observed in the convective boundary layer [11]. While direct observational verification of these specific rolls is precluded by a lack of pre-initiation cloud streets on visible satellite imagery and radar beam overshooting in clear-air mode, the geometric characteristics of the modeled HCRs align strongly with established boundary layer theory, confirming the kinematic structures identified in both foundational and modern observational campaigns [11,33,34]. The structural similarity in the horizontal kinematic fields between the two parameterizations indicates that at convection-permitting resolutions, the development of horizontal boundary layer perturbations is primarily modulated by grid-scale dynamics and background horizontal shear rather than the specific closure assumptions of the boundary layer scheme. The results imply that the failure of MYNN in CI is not horizontal but mainly vertical. While both schemes generate horizontal roll-like perturbations at 850 hPa, the YSU scheme’s non-local mixing allows these perturbations to couple vertically with deep buoyant plumes that successfully punch through the capping inversion. In contrast, the MYNN scheme’s local TKE closure keeps the lower atmosphere highly stratified. The rolls in MYNN lack the vertical kinetic energy transport needed to break the stable lid. On the other hand, the roll structures from YSU do not remain isolated within the moist environment; instead, they could propagate and intersect the primary north–south oriented dryline moisture gradient. Where the convergent, updraft branches of individual HCRs collide with the background dryline convergence zone, localized “hot spots” of maximized horizontal mass convergence are established. This structural alignment implies that convective initiation along the dryline is not a spatially uniform process; rather, it is focused into highly discrete pockets of intense mechanical lift at these HCR-dryline junctions, confirming previous observational hypotheses of dryline boundary modulation by Atkins et al. [12].

4.4.2. Vertical Structure and Parameterization Sensitivity

The vertical cross-sections along 39.3° N illuminate the deep thermodynamic and kinematic consequences of these boundary layer rolls. In the YSU simulation (Figure 7a), the vertical velocity field displays a series of periodically spaced, low-level updraft and downdraft plumes (w = ±0.4~0.6 m/s) extending from the sloping terrain up to the top of the mixed layer (about 2500 m MSL). The potential temperature isentropes within the lower boundary layer are well-mixed and vertically oriented, buckling upward within the core of the active updrafts to denote the vigorous vertical transport of heat and moisture. At the west of Burlington coordinate, a convective updraft plume breaks free from the boundary layer, accelerating through the capping inversion and reaching vertical velocities exceeding 0.8 m/s. This feature marks the exact spatial and temporal coordinates of the initial radar echoes seen in the observations, demonstrating that the non-local mixing mechanism of the YSU scheme successfully weakens the local CIN by vertical plume penetration. In the YSU simulation, as the HCR bands propagate, they interact directly with the dryline zone. Eastward of Burlington, CO, near the 100.0° W dryline interface, a resolved HCR updraft branch couples directly with the deep, mesh-scale dryline updraft. This structural alignment allows the low-level horizontal convergence perturbations to translate into a deep, vertically continuous buoyant plume (w = 0.5 m/s) that organizes heat and moisture through the entirety of the mixed layer (2500 m MSL), breaching the warm capping inversion layer and driving convective initiation. In contrast, the MYNN cross-section at 21:30 UTC (Figure 7b) exhibits an almost complete absence of coherent vertical velocity plumes or roll-like structures. The vertical velocity field remains largely stagnant across the entire terrain slope, and the potential temperature field shows closely packed, horizontally stratified isentropes in the lower troposphere. This stratification indicates that the local, second-order TKE closure approach of the MYNN scheme dampens sub-grid-scale variations and favors localized vertical shearing over large-scale, non-local overturning. Consequently, the robust capping inversion layer—visible as a dense, unyielding layer of stable isentropes between 2000 and 2500 m MSL—remains entirely undisturbed in the MYNN run. Lacking the concentrated vertical velocity perturbations generated by HCR intersections, surface air parcels in the MYNN simulation remain trapped beneath the stable lid, resulting in the total suppression of CI observed in Section 4.2.
It is worth noting a distinct spatial decoupling between the primary mesoscale dryline boundary—positioned near the 100.0° W meridian—and the localized zone of convective initiation, which occurs further west along the terrain slope between 104° W and 103.5° W. This structural configuration suggests that while the eastern dryline interface acts as the regional macroscale boundary layer transition, the actual triggering of deep convection is driven by an interaction between orographic upslope transport, localized HCR perturbations, and upper-level momentum forcing overriding the elevated High Plains surface.

4.5. Synoptic Forcing vs. Mesoscale Regulation

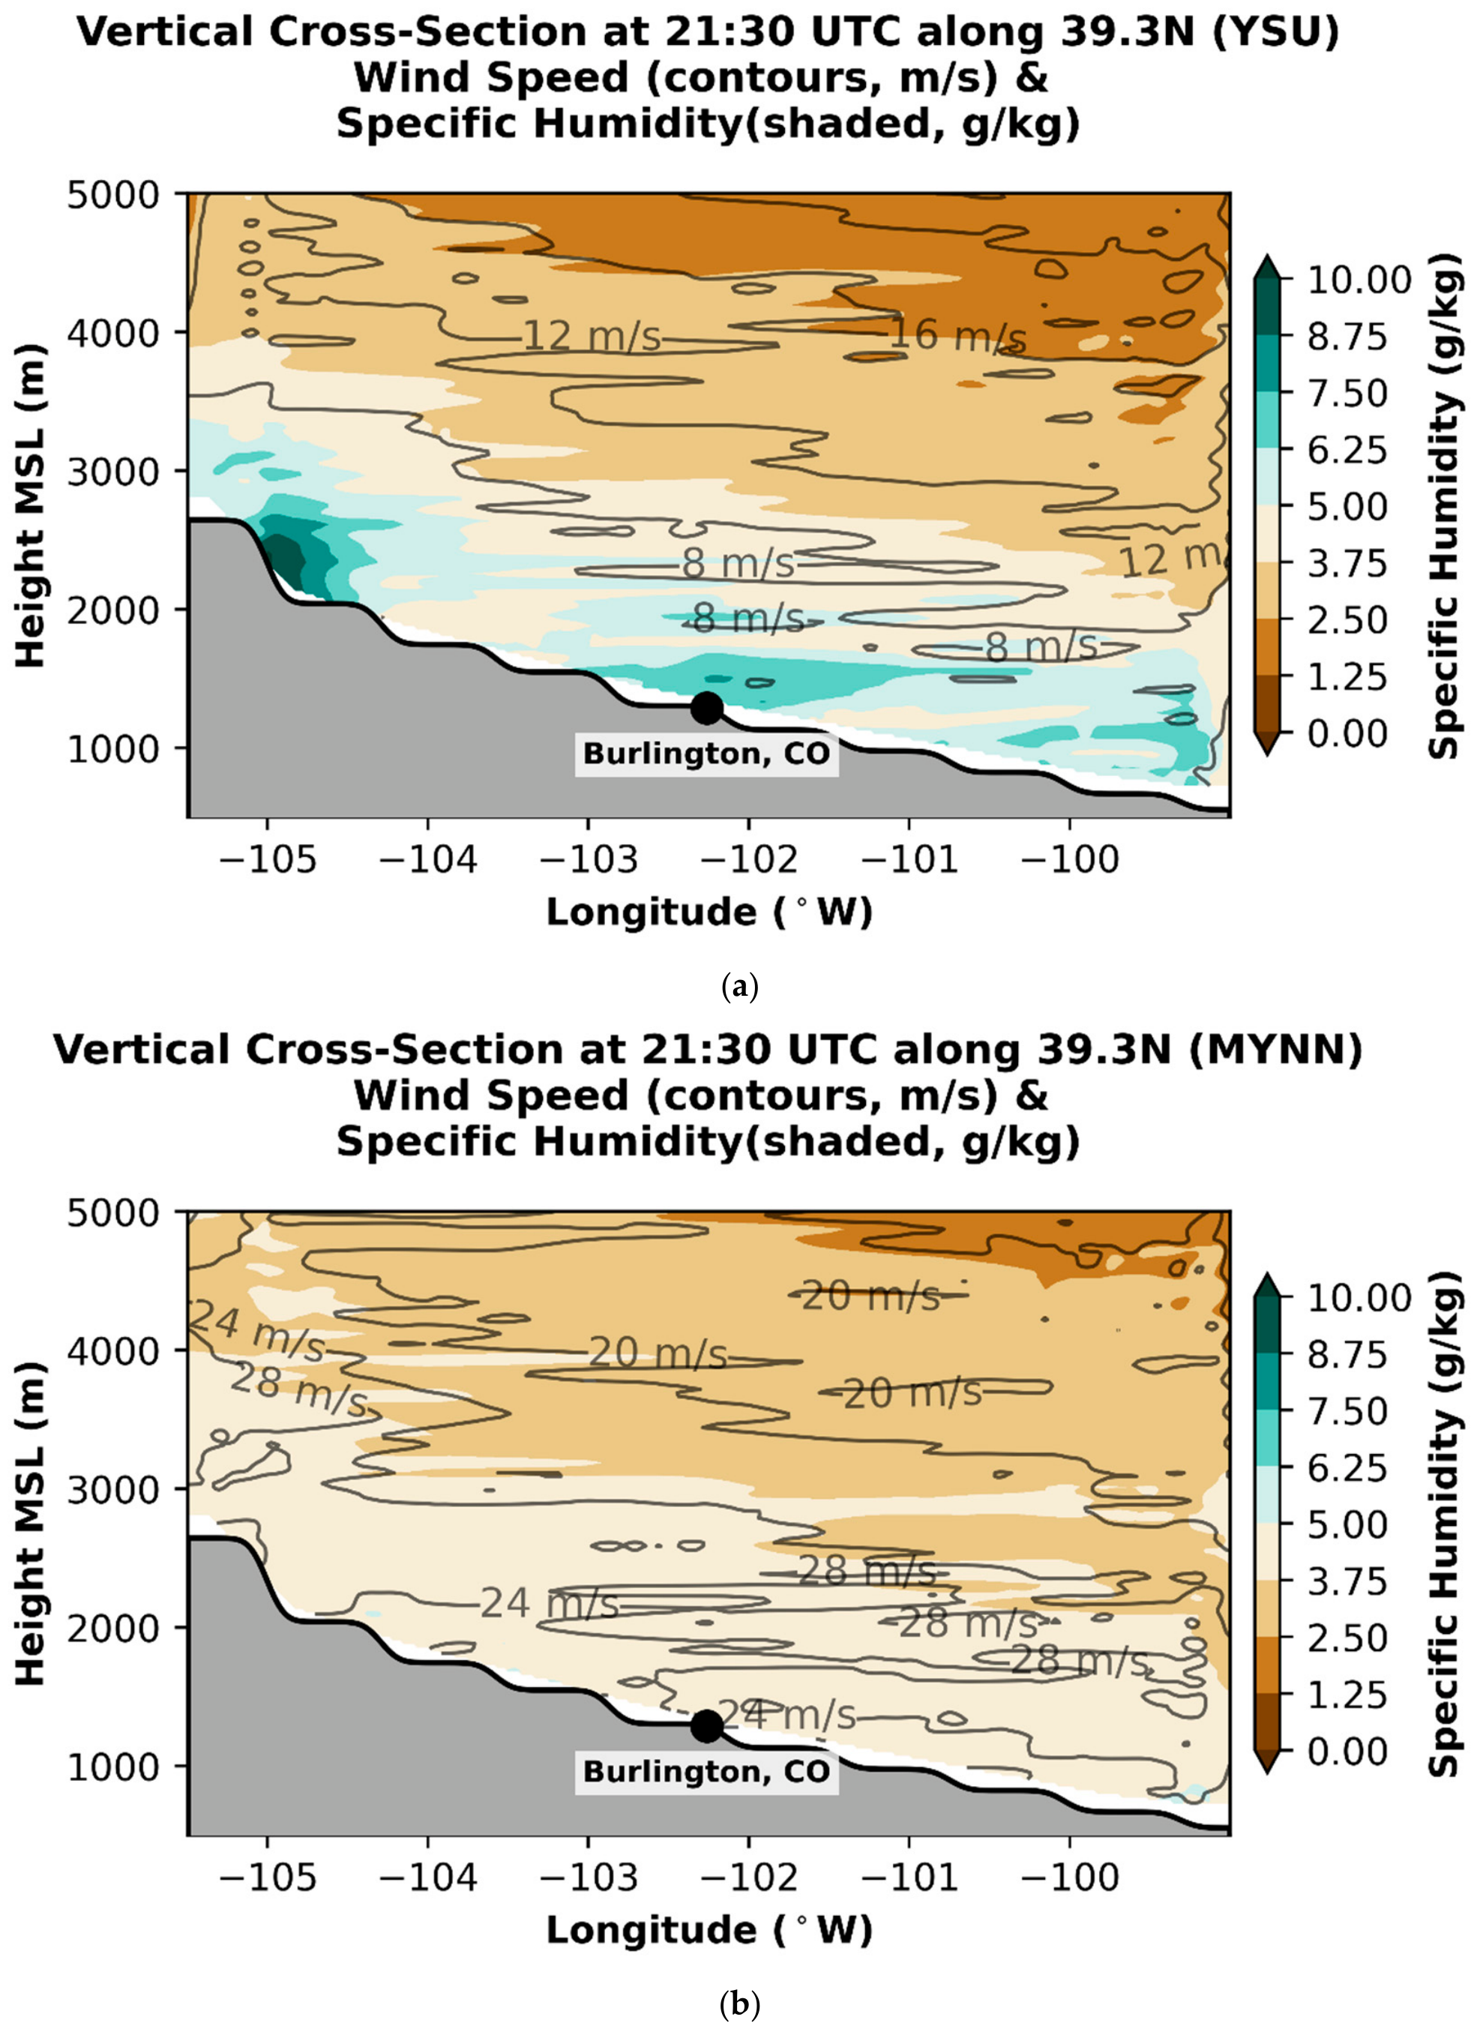
The vertical cross-sections of total horizontal wind speed and water vapor mixing ratio along the 39.3° N parallel reveal the ultimate dynamical divergence between the two simulations (Figure 8). Rather than a failure of localized mixing alone, the parameterization sensitivity demonstrates an entirely different structural translation of atmospheric scale, distinguishing a highly disrupted, synoptically over-forced environment (MYNN) from a pristine, thermodynamically regulated mesoscale environment (YSU).

4.5.1. Synoptic Momentum Dominance and Advective Dissipation in MYNN

At 21:30 UTC, the MYNN simulation (Figure 8b) exhibits an extraordinarily intense wind field across the entire tropospheric column. In the western upper levels (3500 m–5000 m MSL), a high-velocity momentum core yields wind speeds reaching 24–28 m/s. Crucially, this intense momentum is not confined aloft; the local TKE framework of the MYNN scheme channels this high-velocity core directly down the High Plains slope into the lower right quadrant, where surface-layer wind speeds maintain an equally violent 28 m/s maximum. This extreme wind magnitude alters the environment from a localized convective boundary into a regime dominated by intense synoptic-scale advection. The gale-force northerly and northwesterly winds act as a mechanical sweeper across the terrain slope. As a consequence, the water vapor mixing ratios are completely sheared, flattened, and pinned below 2000 m MSL. This massive advective displacement physically evacuates moisture from the critical initiation zones near Burlington, completely suppressing convective initiation by overwhelming localized updraft generation with destructive horizontal momentum transport. To determine whether this extreme momentum represented a physical reality or a model artifact, these fields were validated against the 0000 UTC 12 October Denver (KDNR) sounding and ERA5 reanalysis data. Both observational datasets confirmed a calm, weakly forced ambient environment, recording lower-tropospheric wind speeds of only 2.37 m/s and 2.32 m/s, respectively. This definitive departure from observations confirms that the gale-force sweeping generated by the MYNN simulation is an artificial model bias under these specific initialization fields, which ultimately forces the erroneous suppression of convection.

4.5.2. Mesoscale Equilibrium and Orographic Moisture Ascent in YSU

In contrast, the YSU simulation (Figure 8a) maintains a much more moderate, localized momentum profile. Wind speeds aloft in the western domain remain bounded between 8 and 12 m/s, while the lower right quadrant exhibits a well-regulated surface wind maximum of only 8 m/s. By avoiding the intrusive synoptic-scale wind bias seen in the MYNN run, the YSU environment achieves a state of mesoscale equilibrium where localized thermodynamic forcing can manifest. Under this relaxed horizontal momentum regime, the non-local convective eddies inherent to the YSU formulation can effectively transport moisture vertically without it being immediately stripped away by horizontal advection. The water vapor mixing ratio contours (4–6 g/kg) respond by slanting dynamically upward along the terrain profile, extending westward to provide a continuous absolute moisture source beneath the sloped boundary layer. The lower wind speeds reduce horizontal shearing deformation, allowing the localized HCR updrafts to vertically couple and break the capping inversion. This confirms that the YSU scheme’s skill is rooted in its ability to preserve the peripheral, mesoscale-dominant nature of the dryline case study [21].

5. Conclusions and Summary

This study evaluated the performance of the Yonsei University (YSU) and Mellor-Yamada-Nakanishi-Niino (MYNN) planetary boundary layer (PBL) parameterization schemes within the Model for Prediction Across Scales (MPAS) at a convection-permitting 3 km grid resolution. By analyzing a High Plains dryline event, we explored the multi-scale interactions between synoptic-scale momentum forcing, sub-mesoscale planetary boundary layer structures, and localized convective initiation (CI). The primary conclusions are summarized below:
(1)
Mesoscale Environmental Structure and Dryline Morphology: At 21:00 UTC, both boundary layer schemes successfully established a distinct north–south moisture gradient through eastern Colorado. However, the horizontal morphology of the moisture field displayed sensitivity to the choice of PBL parameterization. The YSU simulation produced a geographically expansive moisture tongue characterized by a robust northwest-southeast oriented gradient. In contrast, the MYNN simulation produced a more diffuse moisture field that was physically displaced to the south and southeast of the target domain. This displacement resulted from a persistent northerly to north-northeasterly surface wind bias within the MYNN framework, which laterally shifted and advected the moisture pool southward rather than allowing it to pool and converge along a focused surface boundary.
(2)
Convective Initiation and Radar Reflectivity Evolution: Radar observations indicated that initial convective cells rapidly developed along the western elevated terrain slope between 21:15 and 21:30 UTC, intensifying into mature convective cores exceeding 50 dBZ by 22:00 UTC. The YSU simulation demonstrated high accuracy in replicating the temporal and spatial evolution of these cells, triggering initial reflectivity echoes (>15 dBZ) along the sloped terrain at 21:30 UTC and expanding into distinct storm cores by 22:00 UTC. Conversely, the MYNN simulation experienced total convective suppression, completely failing to initiate any deep convective echoes throughout the entire study period due to a structural breakdown in its vertical kinematic trigger mechanisms.
(3)
Thermodynamic Modification of the Capping Inversion: Vertical atmospheric soundings confirmed that successful convective initiation was fundamentally dictated by a scheme’s ability to erode the stable capping inversion, or “lid”. The YSU scheme generated a deep, well-mixed boundary layer extending to approximately 700 hPa where the surface parcel was primed by high low-level moisture. The combination of moisture accumulation and strong convergence allowed surface parcels to successfully breach the capping inversion, reach the Level of Free Convection (LFC), and tap into the significant CAPE reservoir aloft. In contrast, the MYNN scheme maintained a shallower boundary layer where moisture remained confined to a very thin layer near the surface beneath an unyielding temperature inversion. As a result, the MYNN surface parcels remained negatively buoyant throughout the column and trapped beneath the stable lid.
(4)
HCR Dynamics in the Grey Zone: At a convection-permitting 3 km resolution, both boundary layer frameworks successfully resolved highly organized, alternating linear ribbons of horizontal mass convergence and divergence. These parallel features exhibited a horizontal wave pattern, matching the classic structure of planetary boundary layer HCRs. These horizontal structural patterns imply that the horizontal development of boundary layer waves is primarily modulated by grid-scale dynamics and background wind shear rather than localized closure assumptions. However, the failure of the MYNN run to trigger convection was strictly tied to vertical coupling, as its local TKE closure dampened vertical transport and turned the resolved HCRs into shallow, trapped horizontal waves. Conversely, the non-local eddy mixing formulation of the YSU scheme allowed these HCR features to propagate and intersect the dryline boundary, establishing localized convergence “hot spots” and deep vertical updraft plumes that successfully breached the capping inversion layer.
(5)
Boundary Layer Momentum Transport and Scale Interactions: Cross-sectional analysis of total horizontal wind speeds and specific humidity fields across the High Plains slope revealed that parameterization sensitivity dictates the structural translation of atmospheric scale. The MYNN simulation exhibited an intrusive synoptic wind bias, generating extreme wind velocities of 24–28 m/s throughout the tropospheric column and down to the surface layer. These strong force winds acted as a mechanical sweeper across the terrain slope, completely shearing, flattening, and diluting the specific humidity field below 2000 m MSL. This massive advective displacement physically evacuated moisture from the western initiation zones, suppressing convective triggering by overwhelming localized updraft generation with destructive horizontal momentum. In contrast, the YSU simulation maintained a well-regulated horizontal wind field of 8–12 m/s aloft and 8 m/s at the surface, preserving a state of mesoscale equilibrium where localized thermodynamic forcing could manifest. Under this relaxed horizontal momentum regime, non-local convective eddies effectively transported specific humidity vertically, allowing the moisture field to slant dynamically up the terrain slope and provide a continuous fuel source right beneath an overriding mid-level jet stream core.
While this study establishes a critical benchmark for the traditional, widely adopted formulations of the YSU and MYNN schemes, the 3 km grid spacing resides firmly within the turbulence grey zone. Traditional 1D PBL parameterizations are fundamentally designed under the assumption that boundary layer eddies are entirely sub-grid scale. As horizontal resolution approaches the depth of the daytime boundary layer, these foundational assumptions begin to break down, which can lead to the double-counting of turbulent fluxes or erroneous momentum transport, as observed in the MYNN simulation. Crucially, these performance divergences are the product of the schemes’ holistic closure philosophies—driven by how each parameterization fundamentally calculates turbulent kinetic energy and vertical mixing lengths—rather than the presence or absence of a singular non-local flux variable. Consequently, a critical next step for future research is the implementation and evaluation of scale-aware parameterizations, such as the Shin-Hong scale-aware YSU scheme. By dynamically tapering the parameterized vertical fluxes based on the ratio of the grid spacing to the boundary layer depth (∆x/h), scale-aware schemes smoothly transition partitioning between parameterized and explicitly resolved eddies, representing a necessary evolution for convection-permitting modeling over complex terrain. Furthermore, the severe low-level momentum over-amplification observed in the MYNN simulation highlights a known, characteristic vulnerability of local TKE closures when deployed over sloping, complex terrain. Because local schemes can struggle to efficiently transport and dissipate deep momentum via surface friction compared to non-local profiles, operational modelers should exercise caution when utilizing standard MYNN configurations in weakly forced dryline environments, as the resulting artificial momentum pooling can erroneously suppress convective initiation.
First, given that a 3 km horizontal grid spacing positions the model within the planetary boundary layer ‘grey zone’, future work should utilize sub-kilometer, multi-scale nesting to transition into true Large-Eddy Simulation (LES) mode. Transitioning this framework to an LES configuration (utilizing MPAS’s 3D Smagorinsky closure capabilities) will explicitly resolve these boundary layer turbulent fluxes. However, at sub-kilometer scales, the fine-scale heterogeneity of the terrestrial surface becomes a dominant forcing mechanism. Therefore, LES investigations must incorporate either significantly extended spin-up periods or the direct assimilation of high-resolution soil moisture and temperature datasets to accurately capture the land-atmosphere feedback loop governing these convective triggers. Second, because dryline intensity and propagation are intrinsically tied to surface anomalies, investigating the coupled sensitivity between non-local PBL schemes and high-resolution land-surface models is a critical next step to evaluate how soil moisture and vegetation gradients modulate low-level convergence zones. Finally, evaluating a broader, multi-season climatology of High Plains dryline events under varying synoptic regimes will help determine if the YSU scheme’s mesoscale regulatory advantage remains robust across both weakly and strongly forced convective environments.

Author Contributions

Conceptualization: D.L. and L.D.W.; data collection and curation: D.L. and L.D.W.; formal analysis: D.L.; funding acquisition: L.D.W. and D.L.; methodology: D.L.; resources: D.L. and L.D.W.; supervision: D.L.; validation: D.L. and L.D.W.; visualization: D.L. and L.D.W.; writing—original draft: D.L.; writing—review and editing: D.L. and L.D.W. All authors have read and agreed to the published version of the manuscript.

Funding

This study was supported by the NOAA Educational Partnership Program, U.S. Dept. of Commerce through the fund number of NA22SEC4810015.

Institutional Review Board Statement

Not applicable.

Informed Consent Statement

Not applicable.

Data Availability Statement

The Model for Prediction Across Scales (MPAS-Atmosphere) is an open-source atmospheric model available at https://github.com/MPAS-Dev/MPAS-Model (last access was on 27 May 2026). The ERA5 reanalysis data used for model initialization and boundary conditions were obtained from the Copernicus Climate Change Service (C3S) Climate Data Store (CDS). The specific MPAS configuration files, namelists, and processed history/diagnostic datasets generated during this study are available from the corresponding author upon reasonable request.

Acknowledgments

We would like to acknowledge high-performance computing support from the supercomputer Derecho (doi:10.5065/7q7p-m730) under project code UJSU0002 provided by NCAR’s Computational and Information Systems Laboratory, sponsored by the National Science Foundation.

Conflicts of Interest

The authors declare no conflicts of interest.

References

  1. Parsons, D.B.; Shapiro, M.A.; Hardesty, R.M.; Zamora, R.J.; Intrieri, J.M. The fine-scale structure of a West Texas dryline. Mon. Weather Rev. 1991, 119, 1242–1258. [Google Scholar] [CrossRef] [Scilit]
  2. Ziegler, C.L.; Hane, M.E. An Observational Study of the Dryline. Mon. Weather Rev. 1993, 121, 1134–1151. [Google Scholar] [CrossRef] [Scilit]
  3. Clark, A.J.; Gallus, W.A.; Chen, T.C. Comparison of the diurnal cycle of precipitation over the central United States between 12-km and 4-km WRF simulations. Mon. Weather Rev. 2007, 135, 3456–3473. [Google Scholar]
  4. Ziegler, C.L.; Rasmussen, E.N. The Initiation of Moist Convection at the Dryline: Forecasting Issues from a Case Study Perspective. Weather Forecast. 1998, 13, 1106–1131. [Google Scholar] [CrossRef] [Scilit]
  5. Carlson, T.N.; Benjamin, S.G.; Forbes, G.S.; Li, Y.-F. Elevated mixed layers in the regional severe storm environment: Conceptual model and case studies. Mon. Weather Rev. 1983, 111, 1453–1473. [Google Scholar] [CrossRef] [Scilit]
  6. Markowski, P.; Richardson, Y. Mesoscale Meteorology in Midlatitudes; John Wiley & Sons: Hoboken, NJ, USA, 2010; 407p. [Google Scholar]
  7. Roberts, N.M.; Lean, H.W. Scale-selective verification of rainfall accumulations from high-resolution forecasts of convective events. Mon. Weather Rev. 2008, 136, 78–97. [Google Scholar] [CrossRef] [Scilit]
  8. Weisman, M.L.; Davis, C.; Wang, W.; Manning, K.W.; Klemp, J.B. Experiences with 0–36-h Explicit Convective Forecasts with the WRF-ARW Model. Weather Forecast. 2007, 23, 407–437. [Google Scholar] [CrossRef] [Scilit]
  9. Prein, A.F.; Langhans, W.; Fosser, G.; Ferrone, A.; Ban, N.; Goergen, K.; Keller, M.; Tölle, M.; Gutjahr, O.; Feser, F.; et al. A review on regional convection-permitting climate modeling: Demonstrations, prospects, and challenges. Rev. Geophys. 2015, 53, 323–361. [Google Scholar] [CrossRef] [Scilit]
  10. Wyngaard, J.C. Toward numerical modelling in the “Terra Incognita”. J. Atmos. Sci. 2004, 61, 1816–1826. [Google Scholar] [CrossRef] [Scilit]
  11. Weckwerth, T.M.; Wilson, J.W.; Wakimoto, R.M.; Crook, N.A. Horizontal convective rolls: Determining their geometric characteristics and interactions. Mon. Weather Rev. 1997, 125, 501–526. [Google Scholar] [CrossRef] [Scilit]
  12. Atkins, N.T.; Weckwerth, T.M.; Wakimoto, R.M. Observations of the Finescale Structure of a Dryline during VORTEX 95. Mon. Weather Rev. 1998, 126, 525–550. [Google Scholar] [CrossRef] [Scilit]
  13. Stensrud, D.J. Parameterization Schemes: Keys to Understanding Numerical Weather Prediction Models; Cambridge University Press: Cambridge, UK, 2009; 459p. [Google Scholar]
  14. Hong, S.; Noh, Y.Y.; Dudhia, J. A new vertical diffusion package with an explicit treatment of entrainment processes. Mon. Weather Rev. 2006, 134, 2318–2341. [Google Scholar] [CrossRef] [Scilit]
  15. Nakanishi, M.; Niino, H. Development of an Improved Turbulence Closure Model (MYNN). J. Meteorol. Soc. Jpn. 2009, 87, 895–912. [Google Scholar] [CrossRef] [Scilit]
  16. Cohen, A.E.; Cavallo, S.M.; Coniglio, M.C.; Brooks, H.E. A Review of Planetary Boundary Layer Parameterization Schemes and Their Sensitivity in Simulating Southeastern U.S. Cold Season Severe Weather Environments. Weather Forecast. 2015, 30, 591–612. [Google Scholar] [CrossRef] [Scilit]
  17. Coniglio, M.C.; Correia, J.; Marsh, P.T.; Kong, F. Verification of Convection-Allowing WRF Model Forecasts of the Planetary Boundary Layer Using Sounding Observations. Weather Forecast. 2013, 28, 842–862. [Google Scholar] [CrossRef] [Scilit]
  18. Hu, X.-M.; Nielsen-Gammon, J.W.; Zhang, F. Evaluation of Three Planetary Boundary Layer Schemes in the WRF Model. J. Appl. Meteorol. Climatol. 2010, 49, 1831–1844. [Google Scholar] [CrossRef] [Scilit]
  19. Nolan, D.S.; Stern, D.P.; Chen, J.A. Evaluation of Planetary Boundary Layer Parameterizations in Tropical Cyclones by Comparison of In Situ Observations and High-Resolution Simulations of Hurricane Isabel (2003). Part II: Inner-Core Boundary Layer and Eyewall Structure. Mon. Weather Rev. 2009, 137, 3675–3698. [Google Scholar] [CrossRef] [Scilit]
  20. Hoch, J.; Markowski, P. A numerical study of the 24 May 2002 dryline. Mon. Weather Rev. 2005, 133, 2277–2296. [Google Scholar]
  21. Skamarock, W.C.; Klemp, J.B.; Duda, M.G.; Fowler, L.D.; Park, S.H.; Ringler, T.D. A multiscale nonhydrostatic atmospheric model using centroidal Voronoi tesselations and C-grid staggering. Mon. Weather Rev. 2012, 240, 3090–3105. [Google Scholar] [CrossRef] [Scilit]
  22. Harris, L.M.; Lin, S.-J. A Two-Way Nested Global-Regional Dynamical Core on the Cubed-Sphere Grid. Mon. Weather Rev. 2013, 141, 283–306. [Google Scholar] [CrossRef] [Scilit]
  23. Lu, D.; White, D.L. Numerical Simulation of the Diurnal Cycle of the West Texas Dryline: Impacts of Topography and Surface Moisture. Atmosphere 2026, 17, 580. [Google Scholar] [CrossRef] [Scilit]
  24. Ringler, T.D.; Petersen, M.; Higdon, R.L.; Jacobsen, D.; Jones, P.W.; Maltrud, M. A multi-resolution approach to global ocean modeling. Ocean Model 2013, 69, 211–232. [Google Scholar] [CrossRef] [Scilit]
  25. Park, S.-H.; Klemp, J.B.; Skamarock, W.C. A comparison of mesh refinement in the global MPAS-A and WRF models using an idealized normal-mode baroclinic wave simulation. Mon. Weather Rev. 2014, 142, 3614–3634. [Google Scholar] [CrossRef] [Scilit]
  26. Kramer, M.; Heinzeller, D.; Hartmann, H.; van den Berg, W.; Steeneveld, G.J. Assessment of MPAS variable resolution simulations in the grey-zone of convection against WRF model results and observations: An MPAS feasibility study of three extreme weather events in Europe. Clim. Dyn. 2020, 55, 253–276. [Google Scholar]
  27. Cheng, Y.; Hui, P.; Liu, D.; Fang, F.; Wang, S.; Tang, J. MPAS-A variable-resolution simulations for summer monsoon over China: Comparison between global and regional configuration. J. Geophys. Res. Atmos. 2023, 128, e2022JD037541. [Google Scholar] [CrossRef] [Scilit]
  28. AWS, Amazon Web Services. Available online: https://s3.amazonaws.com/unidata-nexrad-level2/index.html (accessed on 20 June 2026).
  29. Helmus, J.J.; Collis, S.M. The Python ARM Radar Toolkit (Py-ART), a Library for Working with Weather Radar Data in the Python Programming Language. J. Open Res. Softw. 2016, 4, 25. [Google Scholar] [CrossRef] [Scilit]
  30. Chen, F.; Dudhia, J. Coupling an advanced land surface–hydrology model with the Penn State–NCAR MM5 modeling system. Part I: Model implementation and sensitivity simulations. Mon. Weather Rev. 2001, 129, 569–585. [Google Scholar] [CrossRef] [Scilit]
  31. Iacono, M.J.; Delamere, J.S.; Mlawer, E.J.; Shephard, M.W.; Clough, S.A.; Collins, W.D. Radiative forcing by long-lived greenhouse gases: Calculations with the AER optimal continuum model. J. Geophys. Res. Atmos. 2008, 113, D13103. [Google Scholar] [CrossRef] [Scilit]
  32. Hong, S.Y.; Lim, J.J. The WRF single-moment 6-class microphysics scheme (WSM6). J. Korean Meteorol. Soc. 2006, 42, 129–151. [Google Scholar]
  33. Hironori, I.; Shoken, I.; Nobumitsu, T.; Kohei, M.; Yasuhiro, M.; Toshikazu, I.; Izumi, Y.; Naoki, M.; Dai, M.; Sha, W.; et al. Dual-Doppler lidar observation of horizontal convective rolls and near-surface streaks. Geophys. Res. Lett. 2008, 35, L14808. [Google Scholar] [CrossRef] [Scilit]
  34. Honnert, R.; Efstathiou, G.A.; Beare, R.J.; Ito, J.; Lock, A.; Neggers, F.; Plant, R.S.; de Roode, S.R.; Schalkwijk, J.; ASiebesma, A.P. The Atmospheric Boundary Layer and the “Gray Zone” of Turbulence: A Critical Review. J. Geophys. Res. Atmos. 2020, 12, e2020MS002130. [Google Scholar] [CrossRef] [Scilit]
Figure 1. Global 60–3 km variable resolution mesh of MPAS model. The center of high resolution (3-km) is located at Burlington, CO (39° N, 102° W).
Atmosphere 17 00825 g001
Figure 2. Comparison of surface moisture and winds between the YSU at 21:00 (a), 21:30 (b), 22:00 (c) and MYNN PBL schemes at 21:00 (d), 21:30 (e), and 22:00 (f) UTC. Shading represents the 2 m dewpoint (°C). Vectors represent the surface wind (m/s), with a reference vector of 10 m/s shown in the legend. The black dot identifies the location of Burlington, CO.
Atmosphere 17 00825 g002aAtmosphere 17 00825 g002bAtmosphere 17 00825 g002cAtmosphere 17 00825 g002d
Figure 3. Radar reflectivity (dBZ) comparison (a) observed NEXRAD composite reflectivity at 21:00 UTC, (b) YSU-simulated maximum reflectivity at 21:00 UTC, (c) MYNN-simulated maximum reflectivity at 20:00 UTC, (d) observed NEXRAD composite reflectivity at 21:30 UTC, (e) YSU-simulated maximum reflectivity at 21:30 UTC, (f) MYNN-simulated maximum reflectivity at 21:30 UTC, (g) observed NEXRAD composite reflectivity at 22:00 UTC, (h) YSU-simulated maximum reflectivity at 22:00 UTC and (i) MYNN-simulated maximum reflectivity at 22:00 UTC. White space in the MYNN-simulated maximum reflectivity indicates a total suppression of reflectivity (<5 dBZ).
Atmosphere 17 00825 g003aAtmosphere 17 00825 g003bAtmosphere 17 00825 g003c
Figure 4. Vertical thermodynamic evolution at Burlington, CO for the YSU simulations at (a) 21:00, (b) 21:30, and (c) 22:00 UTC. Environmental temperature (°C) and dewpoint (°C) are denoted by solid red and green lines, respectively. The dashed black line represents the surface-based air parcel trajectory. Areas of Convective Inhibition (CIN) are shaded in blue. The pressure levels of the Lifting Condensation Level (LCL) and Level of Free Convection (LFC) are annotated where applicable.
Atmosphere 17 00825 g004aAtmosphere 17 00825 g004b
Figure 5. Same as Figure 4 but for the MYNN simulations at (a) 21:00, (b) 21:30, and (c) 22:00 UTC.
Atmosphere 17 00825 g005aAtmosphere 17 00825 g005b
Figure 6. Comparison of resolved 850 hPa horizontal mass convergence (10−4/s) at 21:30 UTC between the (a) YSU and (b) MYNN simulations. Shading represents horizontal convergence (purple) and divergence (orange). The black dashed line indicates the orientation of the vertical cross-section along the 39.3° N parallel through Burlington, CO in Figure 7 and Figure 8. The background dryline interface is located near 100.0° W. Both schemes resolve linear HCR signatures running through the moist sector.
Atmosphere 17 00825 g006
Figure 7. Vertical cross-sections of vertical velocity (m/s, shaded) and potential temperature (K, contours) along the 39.3° N parallel (see Figure 6) at 21:30 UTC for the (a) YSU and (b) MYNN simulations. Solid gray shading denotes the terrain profile of the High Plains slope. The black dot and vertical line denote the location of Burlington, CO. Note the deep, cap-breaching vertical updraft plume in the YSU scheme compared to the vertically suppressed, stratified wave structures in the MYNN scheme.
Atmosphere 17 00825 g007
Figure 8. Vertical cross-sections of total horizontal wind speed (m/s, contours) and derived water vapor mixing ratio (g/kg, shaded) along the 39.3° N parallel (see Figure 6) at 21:30 UTC for the (a) YSU and (b) MYNN simulations. Solid gray shading denotes the terrain profile, and the black dot highlights the Burlington, CO station coordinate. Note the extreme synoptic wind core (24–28 m/s) in MYNN suppressing moisture height, compared to the well-regulated mesoscale wind profile (8–12 m/s) in YSU that permits deep orographic moisture slope extension.
Atmosphere 17 00825 g008
Disclaimer/Publisher’s Note: The statements, opinions and data contained in all publications are solely those of the individual author(s) and contributor(s) and not of MDPI and/or the editor(s). MDPI and/or the editor(s) disclaim responsibility for any injury to people or property resulting from any ideas, methods, instructions or products referred to in the content.