Article

Spatiotemporal Evolution of Carbon Reduction Potential from End-of-Life Resource Utilization of Onshore Wind Power in China


1
Jibei Electric Power Research Institute, State Grid Jibei Electric Power Co., Ltd., Beijing 100045, China
2
State Key Laboratory of Regional Environment and Sustainability, School of Environment, Beijing Normal University, Beijing 100875, China
3
Center for Atmospheric Environmental Studies, Beijing Normal University, Beijing 100875, China
*
Authors to whom correspondence should be addressed.
Atmosphere 2026, 17(9), 824; https://doi.org/10.3390/atmos17090824
Submission received: 5 July 2026 / Revised: 16 August 2026 / Accepted: 17 August 2026 / Published: 26 August 2026
(This article belongs to the Section Air Pollution Control)

Abstract

Wind power is a cornerstone of China’s renewable energy development, supporting the green and low-carbon transformation and “dual-carbon” goals. With rapid capacity growth and an approaching wave of decommissioning for early onshore wind, assessing the carbon reduction potential from resource recovery is critical yet challenging. This study establishes a net carbon emission assessment framework covering operational and recycling stages, evaluating the carbon reduction potential of decommissioned materials including steel, copper, and resin. Results show that total carbon reduction from resource utilization grows steadily, under the assumed end-of-life resource-utilization pathways; the cumulative carbon reduction potential during 2025–2045 is estimated at approximately 90.85 million t CO2-eq., with steel contributing roughly 60%. Between 2025 and 2045, carbon reduction from decommissioned wind power materials rises from 1.93 to 5.28 million tons of CO2-eq., stabilizing the industry’s net emissions at 21 million tons from 2040. Four regional evolution patterns were identified: continuous growth in major wind power bases such as Inner Mongolia and Xinjiang; peak–fallback in early-developed provinces such as Henan and Ningxia; late-stage rise in eastern and central provinces such as Jiangsu and Guangdong; and platform fluctuation in northeastern provinces such as Heilongjiang, Jilin, and Liaoning. These estimates are based on static life-cycle emission factors, exclude transportation between wind farms and recycling facilities, and do not incorporate formal sensitivity or probabilistic uncertainty analysis; therefore, the absolute mitigation values should be interpreted as scenario-based estimates rather than precise forecasts. The findings suggest that authorities should implement differentiated regional decommissioning strategies and plan forward-looking wind power industrial chains to maximize resource recovery and support national dual-carbon objectives.

1. Introduction

The global energy transition is accelerating. As a renewable energy source with the greatest potential for large-scale development, wind energy is playing an increasingly vital role in achieving a low-carbon energy structure and carbon neutrality goals worldwide. According to reports from the Global Wind Energy Council [1], newly installed global wind power capacity reached 165 GW in 2025, while cumulative installed capacity exceeded 1299 GW. Among this total, the Chinese market contributed approximately 120.5 GW of newly installed capacity, and nearly 80% of global new installations were concentrated in Asian countries such as China and India. The rapid expansion of the wind power industry has generated substantial benefits in terms of energy supply and carbon emission reduction. In particular, China has become the core driver of global wind power development due to its continuously increasing installed capacity and dominant contribution to newly added capacity worldwide. Statistics from the 2025 report indicate that China accounted for more than 70% of global newly installed wind power capacity, highlighting its pivotal role in the global low-carbon energy transition [2].
However, the rapid expansion of wind power installations has also led to a growing challenge regarding the management and resource utilization of decommissioned wind turbines. The decommissioning volume of wind turbines in China is projected to exceed 5 GW by 2030, while the annual decommissioning scale may reach 2 GW during the following decade [3]. Without effective recycling and resource recovery systems, large quantities of decommissioned wind turbine materials may impose increasing environmental and waste-management pressures. Meanwhile, the recycling and resource utilization of decommissioned wind turbines can not only effectively reduce resource waste, but also significantly decrease the life-cycle carbon emissions of the wind power industry. In an existing study, Nassar [4] analyzed the life-cycle carbon emissions of wind turbines and found that the material production stage is the dominant source of emissions, with steel and glass fiber composite materials contributing approximately 60–75% of the total carbon footprint. Offshore Renewable Energy Catapult [5] further demonstrated that wind turbine recycling can significantly reduce raw material consumption and lower carbon emission equivalents by at least 35%. In addition, Greenpeace and the School of Environment at Tsinghua University [6] estimated that achieving a 100% recycling rate for 280 GW of retired wind turbines could cumulatively reduce carbon emissions by approximately 113 million tons by 2040.
Recently, the European Commission Joint Research Centre [7] reported that the European Union has achieved substantial progress in the recycling of decommissioned wind turbines, with blade recycling rates reaching 50–60% in some countries. Yang [8] predicted that China will generate approximately 7.7–23.1 million tons of waste wind turbine blades by 2050, highlighting the urgent need for large-scale recycling and resource utilization technologies. Existing studies further indicate that China still faces significant barriers in wind turbine blade recycling, including technological limitations, incomplete policy frameworks, and insufficient industrial-chain coordination. In contrast, the European Union has established clear recycling targets through policies such as the Renewable Energy Directive III (RED III), which has promoted cross-sector collaboration and improved recycling efficiency [9]. These findings suggest that accelerating the development of recycling technologies and policy coordination mechanisms is essential for the sustainable development of China’s wind power industry. Existing studies on end-of-life wind turbines have mainly focused on three aspects. First, life-cycle assessment (LCA) studies have quantified the environmental impacts and carbon reduction benefits of recycling different wind turbine materials. Second, research has investigated recycling technologies, particularly for composite blades, and evaluated material recovery pathways under different technological scenarios. Third, several studies have projected future quantities of retired wind turbines and recyclable materials to estimate resource availability. These studies have provided valuable insights into the environmental and resource implications of wind turbine retirement. However, several important research gaps remain. Most existing studies focus on individual wind farms, specific turbine components, or national-scale cumulative estimates, while limited attention has been paid to the spatiotemporal evolution of carbon reduction potential associated with end-of-life resource utilization. In particular, few studies have integrated historical installation trajectories, dynamic retirement processes, regional differences in wind power deployment, and material recycling into a unified analytical framework. As a result, the spatial heterogeneity and temporal evolution of recycling-driven carbon reduction remain insufficiently understood, limiting the development of differentiated regional recycling strategies and policy planning. Given the rapidly increasing volume of retired wind turbines and the existing challenges in recycling technologies, policy frameworks, and industrial-chain coordination, it is essential for China to establish a systematic resource recycling and carbon reduction management pathway for the wind power industry, thereby supporting the low-carbon transformation and sustainable development of the entire life cycle of wind power.
To address these research gaps, this study establishes an integrated assessment framework to quantify the carbon reduction potential from resource utilization of decommissioned onshore wind turbines in China. By combining dynamic retirement forecasting, material flow analysis, and province-level carbon accounting, the study investigates the spatiotemporal evolution of carbon reduction potential from 2025 to 2045. The results provide scientific support for differentiated regional recycling strategies and policy formulation for achieving China’s carbon neutrality goals.

2. Materials and Methods

2.1. Research Framework and Data Sources

To address the research gaps identified in the Introduction, this study develops an integrated analytical framework to assess the spatiotemporal evolution of carbon reduction potential from the resource utilization of decommissioned onshore wind turbines. The framework integrates dynamic retirement forecasting, material flow analysis, and life-cycle carbon accounting to quantify carbon reduction potential at the provincial scale. By linking retirement prediction with recyclable material flows and carbon accounting, the proposed framework captures both the temporal evolution and regional heterogeneity of carbon reduction potential, thereby providing methodological support for evaluating end-of-life wind turbine resource utilization in China.
The framework mainly consists of four steps: (1) reconstruction of the spatiotemporal evolution of wind power installations based on site-level wind farm data; (2) prediction of decommissioned wind turbine capacity under Weibull lifetime distribution and repowering scenarios; (3) estimation of recyclable material stocks, including steel, copper, fiberglass, and resin; and (4) assessment of carbon emission reduction potential through material recycling and substitution effects. The analysis is based on site-level onshore wind farm data with installed capacities of no less than 10 MW released by the Global Wind Power Tracker in February 2025, including geographic location, installed capacity, and commissioning year. However, due to the exclusion of small-scale projects and incomplete historical records, the GWPT dataset underestimates installations during the early development stage of China’s wind power industry. Therefore, the dataset was calibrated using authoritative statistical data from the Chinese Wind Energy Association to improve statistical completeness and temporal consistency. Based on the corrected dataset, provincial wind power installations in China from 2005 to 2024 were reconstructed to characterize the spatiotemporal evolution of onshore wind power development and provide inputs for subsequent decommissioning and carbon reduction analyses. Detailed data correction procedures, parameter settings, and scenario assumptions are provided in the Supplementary Materials. Data processing and calculations were performed using Microsoft Excel for Microsoft 365 (Microsoft Corporation, Redmond, WA, USA), spatial data processing and mapping were conducted using ArcGIS 10.8 (Esri, Redlands, CA, USA), and data visualization was performed using Origin 2018 (OriginLab Corporation, Northampton, MA, USA).
System Boundary and Assessment Scope
This study applies a prospective material-flow-based carbon accounting framework rather than a comparative product LCA. Therefore, carbon emission reduction is treated as an assessment outcome rather than as the functional unit. The reference flow is defined as the annual mass (t) of each end-of-life wind turbine material recovered in province p in year t, as estimated from the projected decommissioned capacity, material composition, and recovery rate. Carbon reduction potential is subsequently quantified in t CO2-eq. at the province–year level using a pathway-specific avoided-emission basis, which compares the carbon burden of the reference material-production pathway with that associated with the applicable end-of-life resource-utilization pathway. The resulting avoided-emission credit therefore represents the carbon benefit associated with the assumed resource-utilization pathway rather than necessarily implying physical one-to-one substitution of virgin material.
The system boundary focuses on the end-of-life stage of onshore wind turbines and includes three main processes: (1) decommissioning and generation of recoverable materials; (2) resource recovery through material-specific recycling or utilization pathways; and (3) avoided carbon emissions associated with the corresponding material-specific end-of-life resource-utilization pathways. The assessment covers steel, copper, fiberglass, and resin. Transportation of end-of-life components to recycling facilities, construction of recycling infrastructure, and future decarbonization of electricity generation are not explicitly considered because of limited data availability and are discussed as model limitations in Section 3.4.

2.2. Projection of Future Decommissioned Wind Turbine Capacity

This study constructs a decommissioned wind turbine capacity prediction model [10] based on the Weibull distribution function [11,12], comprehensively considering the interactive effects of unit service life and the implementation timeline of the “replacing small units with large ones” policy [13,14]. Firstly, it compiles historical provincial wind power installations and identifies the implementation years of the “replacing small units with large ones” policies. A piecewise parameterization approach is used for wind turbines with different service-life categories. The Weibull parameters were adopted from previous studies on wind turbine lifetime modeling and adjusted to reflect the retirement characteristics of China’s onshore wind power sector. Specifically, the natural retirement scenario (λ1 = 19 and k1 = 4.1) represents turbines operating close to their designed service life, with retirement probability increasing rapidly after approximately 15–20 years. In contrast, the policy-driven repowering scenario (λ2 = 16 and k2 = 2.61) reflects the earlier and more dispersed retirement pattern induced by the “replacing small units with large ones” policy. These parameter values are intended to represent scenario assumptions for retirement behavior rather than empirical failure statistics derived from historical turbine failure records in China, which are currently unavailable at the national scale [15,16].
Ideal retired wind turbine capacity:
R p , t = y = t 0 t C p , y × P r e t i r e ( t y )
Among them, the retirement probability Pretire(t − y) adopts a piecewise function:
P r e t i r e ( t y ) = { k λ 1 ( t λ 1 ) k 1 1 e ( t λ 1 ) k 1 ,     i f ( t y ) 15   o r ( t y ) > 15   a n d   Y p > t k λ 2 ( t λ 2 ) k 2 1 e ( t λ 2 ) k 2 ,     i f ( t y ) > 15   a n d   Y p t
The retirement probability is independently applied to each installation cohort. Therefore, the annual retired capacity is calculated separately for each cohort and aggregated across all cohorts, ensuring that the cumulative retirement of each cohort does not exceed its originally installed capacity (i.e., cohort-level mass conservation).
Here, Rp,t—the ideal retired capacity of province p in year t, MW; Cp,y—the newly installed capacity of province p in year y, MW; λ1—scale parameter under the natural aging scenario, with a value of 19; k1—shape parameter under the natural aging scenario, with a value of 4.1; λ2—scale parameter under the capacity replacement scenario, with a value of 16; k2—shape parameter under the capacity replacement scenario, with a value of 2.61; Yp—the year when province p issued the capacity replacement policy; t0—the starting year of wind power development in this province.

2.3. Calculation of the Actual Recovered Quantity of End-of-Life Materials

On the basis of the estimated decommissioned installed capacity (Rp,t), it is further necessary to convert the retired capacity into the theoretical stock of recyclable materials. Considering the effects of material aging during turbine operation, policy-driven early retirement, and the long-term evolution of recycling technologies, this study establishes a phased and differentiated material stock estimation model for the major constituent materials of wind turbines, including steel, copper, fiberglass, and resin-based composite materials.
(1)
Segmented Setting of Material Recovery Rate
The material recovery rate in this study refers to the proportion of end-of-life materials entering resource recovery pathways, including material recycling, mechanical recycling, cement kiln co-processing, thermal treatment, and other beneficial utilization routes. It does not exclusively represent closed-loop material-to-material recycling. For thermoset composite materials such as fiberglass and resin, the adopted recovery rates represent future resource utilization scenarios based on factors such as recycling technology maturity, economic costs, policy requirements, and material aging [17]. Based on the development targets and resource utilization scenarios proposed in the China Fiber Composites Recycling Branch, together with previous life-cycle assessment studies, three recovery scenarios were established, as shown in Table 1.
(2)
Calculation of Actual Recycled Quality of Retired Materials
The calculation formula for the actual recycled quality Mm, p, t (unit: ton) of retired material m in province p in year t is as follows:
M m , p , t = y = t 0 t C p , y × Pr e t i r e ( t y ) × ω m × r m ( t y )
The recycled material quantity is calculated by aggregating the contributions from all installation cohorts retiring in year t. Each installation cohort contributes only once to the annual recycled material quantity according to its corresponding retirement probability and recovery rate, thereby avoiding double counting.
Here, ωm—weight of material m per unit installed capacity [22], t/MW; rm,t(ty)—material recovery rate based on service life and decommissioning year [23], which is determined by the following piecewise function [24]:
r m , t ( t y ) = { r m ( 3 ) ,         i f   t 2030 r m ( 2 ) ,           i f   t < 2030   a n d   ( t y ) 15 r m ( 1 ) ,   i f   t < 2030   a n d   ( t y ) > 15

2.4. Calculation of Carbon Emission Reduction

The carbon reduction potential ERp,t (t CO2-eq.) associated with the resource utilization of decommissioned wind turbine materials in province p and year t is quantified using a pathway-specific avoided-emission [25,26] approach as follows:
E R p , t = [ M m , p , t × E F m a v o i d e d ]
where Mm,p,t is the recovered quantity of material m in province p and year t (t), and E F m a v o i d e d is the material-specific avoided-emission factor (t CO2-eq./t) associated with the assumed end-of-life resource-utilization pathway. For consistency with the original carbon inventory, E F m a v o i d e d is derived from the difference between the reference material-production carbon footprint and the carbon footprint associated with the corresponding recovery/utilization process.
The interpretation of E F m a v o i d e d differs according to the end-of-life pathway of each material. For metallic materials such as steel and copper, established secondary-material recycling systems allow recovered materials to substitute primary material production to a large extent; therefore, the avoided-emission factor mainly reflects the difference between primary and secondary material production. For thermoset composites, including fiberglass and resin, current end-of-life management primarily involves mechanical recycling, thermal treatment, and cement kiln co-processing [27,28]. The recovered products are generally used in downcycled applications or substitute selected material or energy inputs rather than being recycled into new wind turbine blades [29,30]. Accordingly, the avoided-emission factors applied to fiberglass and resin are interpreted as scenario-level carbon credits associated with the assumed resource-utilization pathways and do not represent physical one-to-one substitution of virgin fiberglass or resin.
To provide a consistent basis for long-term comparison, cradle-to-gate carbon footprint factors for both virgin material production and recycling processes are assumed to remain constant throughout the study period (2025–2045). Consequently, the estimated carbon reduction potential reflects the increasing availability of recoverable materials under a static carbon accounting framework, without explicitly considering future decarbonization of the electricity system or energy-intensive industries. In addition, the system boundary focuses on the differences between virgin material production and end-of-life recycling processes; transportation emissions associated with delivering decommissioned wind turbine components to recycling facilities are not included because the future spatial distribution of recycling infrastructure and logistics networks remains highly uncertain. The calculation formula for net carbon emissions is
E n e t , t = E T o t a l ( t ) E R t
where Enet,t—net carbon emission in year t, t CO2-eq.; ETotal (t)—total carbon emission of wind power in year t [31,32], t CO2-eq.
Recycling offset rate refers to the calculation of the ratio of carbon emission reduction potential through recycling to the total carbon emissions over the full life cycle, which is used to quantify the compensation degree of circular economy strategies for the original environmental burden. The formula for the recycling offset rate [33] (%) is
R o f f s e t = A E E T o t a l ( t ) × 100 %

3. Results and Discussion

3.1. Decommissioned Wind Power Resource Potential Analysis

3.1.1. Historical Installed Capacity as the Basis for Decommissioning Prediction

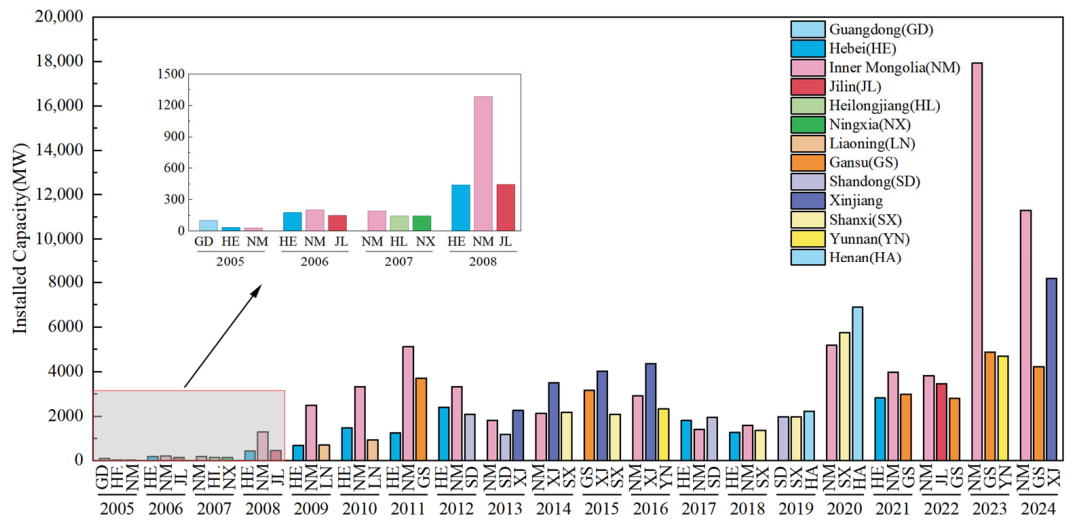
The prediction of future decommissioned wind turbine resources is fundamentally dependent on the historical evolution of installed wind power capacity. Therefore, before estimating decommissioned capacity and recyclable material stocks, it is necessary to examine the spatiotemporal development of China’s onshore wind power industry. Figure 1 presents the provincial newly installed onshore wind power capacity in China from 2005 to 2024, which provides the fundamental input data for subsequent decommissioning prediction and resource potential assessment.
The spatiotemporal evolution of newly installed wind power capacity constitutes the fundamental basis for predicting future decommissioning scales and recyclable material stocks. As shown in Figure 1, from 2005 to 2024, China’s wind power installed capacity experienced rapid growth. Among all regions, Inner Mongolia consistently ranked first in most years, peaking at 17,923.70 MW in 2023.
From 2005 to 2024, North China (including Inner Mongolia, Hebei, and Liaoning) and Northwest China (such as Xinjiang and Gansu) maintained leading positions in installed capacity. In recent years, central inland provinces like Henan and Shanxi have gradually become more prominent.
Between 2005 and 2010, Inner Mongolia’s installed capacity surged from 31.00 MW to 3310.00 MW, remaining the highest nationwide. This growth benefited from its abundant wind resources, vast grasslands, high average wind speeds, and flat terrain, which are ideal for large-scale wind farms. Moreover, Inner Mongolia is relatively close to the economically developed eastern regions, shortening transmission distances and facilitating power consumption. Hebei also developed rapidly during this period, increasing from 34.50 MW in 2005 to 1464.00 MW in 2010. Northern cities such as Zhangjiakou and Chengde have rich wind resources, and the province’s proximity to Beijing and Tianjin further boosted wind power development. In Liaoning, installed capacity reached 693.00 MW in 2009 and 929.00 MW in 2010. As a key province in Northeast China, Liaoning utilized both coastal and inland wind resources to expand wind power and optimize its energy structure.
During 2011–2014, wind power installations in Xinjiang and Gansu increased significantly. Xinjiang was not among the top three provinces in 2011, but its newly installed capacity reached 3497.00 MW in 2014. Gansu remained one of the leading provinces, with annual installations exceeding 2000 MW during this period. Both provinces are located in Northwest China and possess abundant wind energy resources, including well-known wind power bases such as Dabancheng in Xinjiang and Jiuquan in Gansu. The implementation of the Western Development Strategy and strong policy support for renewable energy provided important opportunities for wind power expansion. In addition, extensive desert and barren lands offered favorable conditions for large-scale wind farm deployment at relatively low land costs.
From 2015 to 2018, the ranking of the top three provinces by newly installed wind power capacity showed noticeable fluctuations. Xinjiang reached its peak during 2015–2016, with newly installed capacities of 4006.00 MW and 4352.00 MW, respectively. However, its growth subsequently slowed. This was mainly due to increasing challenges related to grid integration and power curtailment, which constrained further expansion of the wind power sector. In contrast, Inner Mongolia experienced renewed growth in 2017 and 2018, with newly installed capacities of 1409.00 MW and 1587.80 MW, respectively. This growth was supported by improvements in grid infrastructure, enhanced power consumption capacity, and the continuous development of new wind power projects. Jilin ranked third in 2016, with a newly installed capacity of 2317.50 MW. The province actively promoted wind power development in its resource-rich western regions. Shandong recorded 1950.00 MW of newly installed capacity in 2017. This growth was closely related to the development of coastal wind resources and the province’s ongoing energy structure transition.
From 2019 to 2024, wind power development expanded rapidly from traditional resource-rich regions to inland provinces in central China. Henan and Shanxi recorded substantial increases in newly installed capacity, reaching 6890.00 MW and 5740.40 MW in 2020, respectively. This trend reflects growing electricity demand and accelerated energy transition efforts in central China. Meanwhile, Inner Mongolia remained the dominant wind power province, achieving a peak annual installation of 17,923.70 MW in 2023. Although installations declined in 2024, Inner Mongolia still ranked first nationwide, followed by Xinjiang and Gansu. These results indicate that while northwestern China continues to serve as the core region for large-scale wind power deployment, the geographic distribution of wind power development is gradually expanding toward central provinces.
Overall, the historical evolution of wind power installations reveals substantial regional differences in development timing and deployment scale. These differences directly determine the future distribution of decommissioned wind turbine capacity and recyclable material resources, thereby providing the basis for subsequent analyses of resource recovery potential and carbon reduction benefits. Accordingly, the purpose of projecting future decommissioned capacity is to characterize the timing and regional distribution of recyclable resources rather than to optimize the scale of wind turbine retirement.

3.1.2. Temporal Evolution of Decommissioned Capacity

From 2025 to 2045, China’s onshore wind power sector will enter a rapid decommissioning stage driven by the large-scale installations constructed during the early development period and the gradual implementation of repowering policies. The annual decommissioned capacity is expected to increase continuously and gradually approach its peak around 2040, indicating substantial recycling resource potential in the coming decades.
Spatially, provinces with early wind power development and large installed capacities, including Inner Mongolia, Xinjiang, Hebei, and Shandong, will become the major sources of decommissioned wind turbines, while southern provinces generally maintain relatively lower retirement scales due to their later development stage and smaller installed bases.

3.1.3. Spatiotemporal Characteristics of Decommissioned Material Stocks

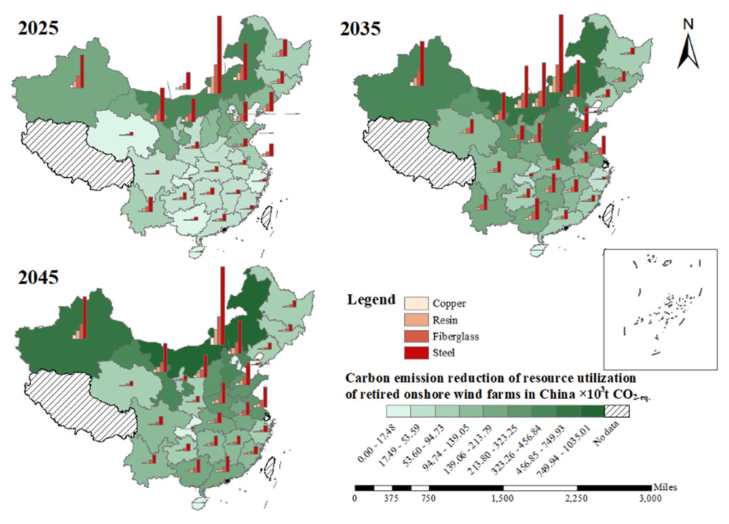
Based on the location information, installed capacity, and material composition of wind farms, the volume of decommissioned wind turbine materials in different regions was estimated. Geographic Information System technology was adopted to visualize the spatial distribution of decommissioned material stocks in representative years including 2025, 2035, and 2045 (Figure 2). The results show that decommissioned material stocks in China exhibit a continuously increasing trend from 2025 to 2045, accompanied by significant regional differences. Inner Mongolia, Xinjiang, Hebei, and Shandong consistently maintain the largest decommissioned material stocks due to their large historical installed capacities and early wind power development. In terms of material composition, steel accounts for the largest proportion of decommissioned materials, followed by fiberglass composite materials, while copper and resin contribute relatively smaller shares. Spatially, decommissioned resources are mainly concentrated in northern wind power bases, forming a distinct pattern characterized by “high in the north and low in the south”.

3.2. Spatiotemporal Evolution of Carbon Reduction from Resource Recycling

3.2.1. Regional Temporal Differentiation and Retirement Cycle Characteristics

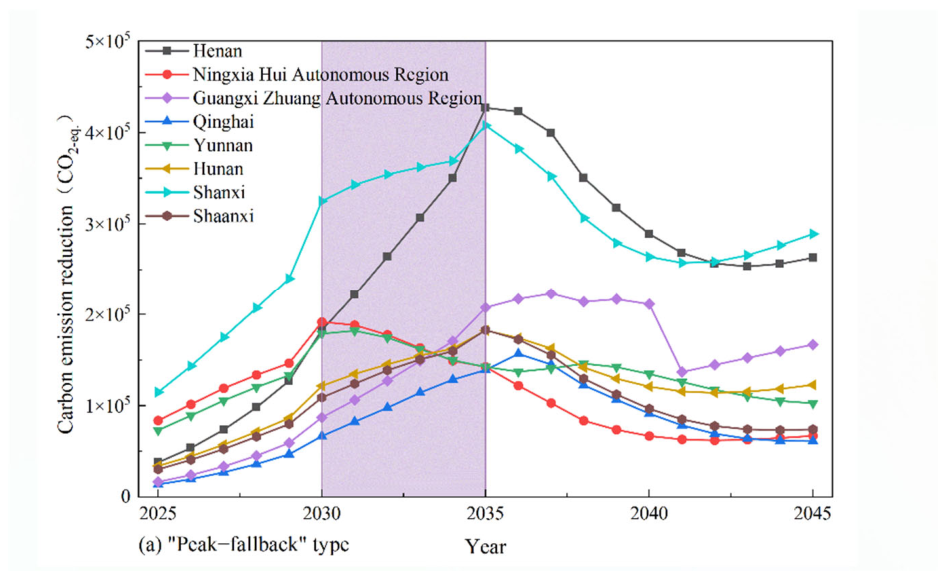
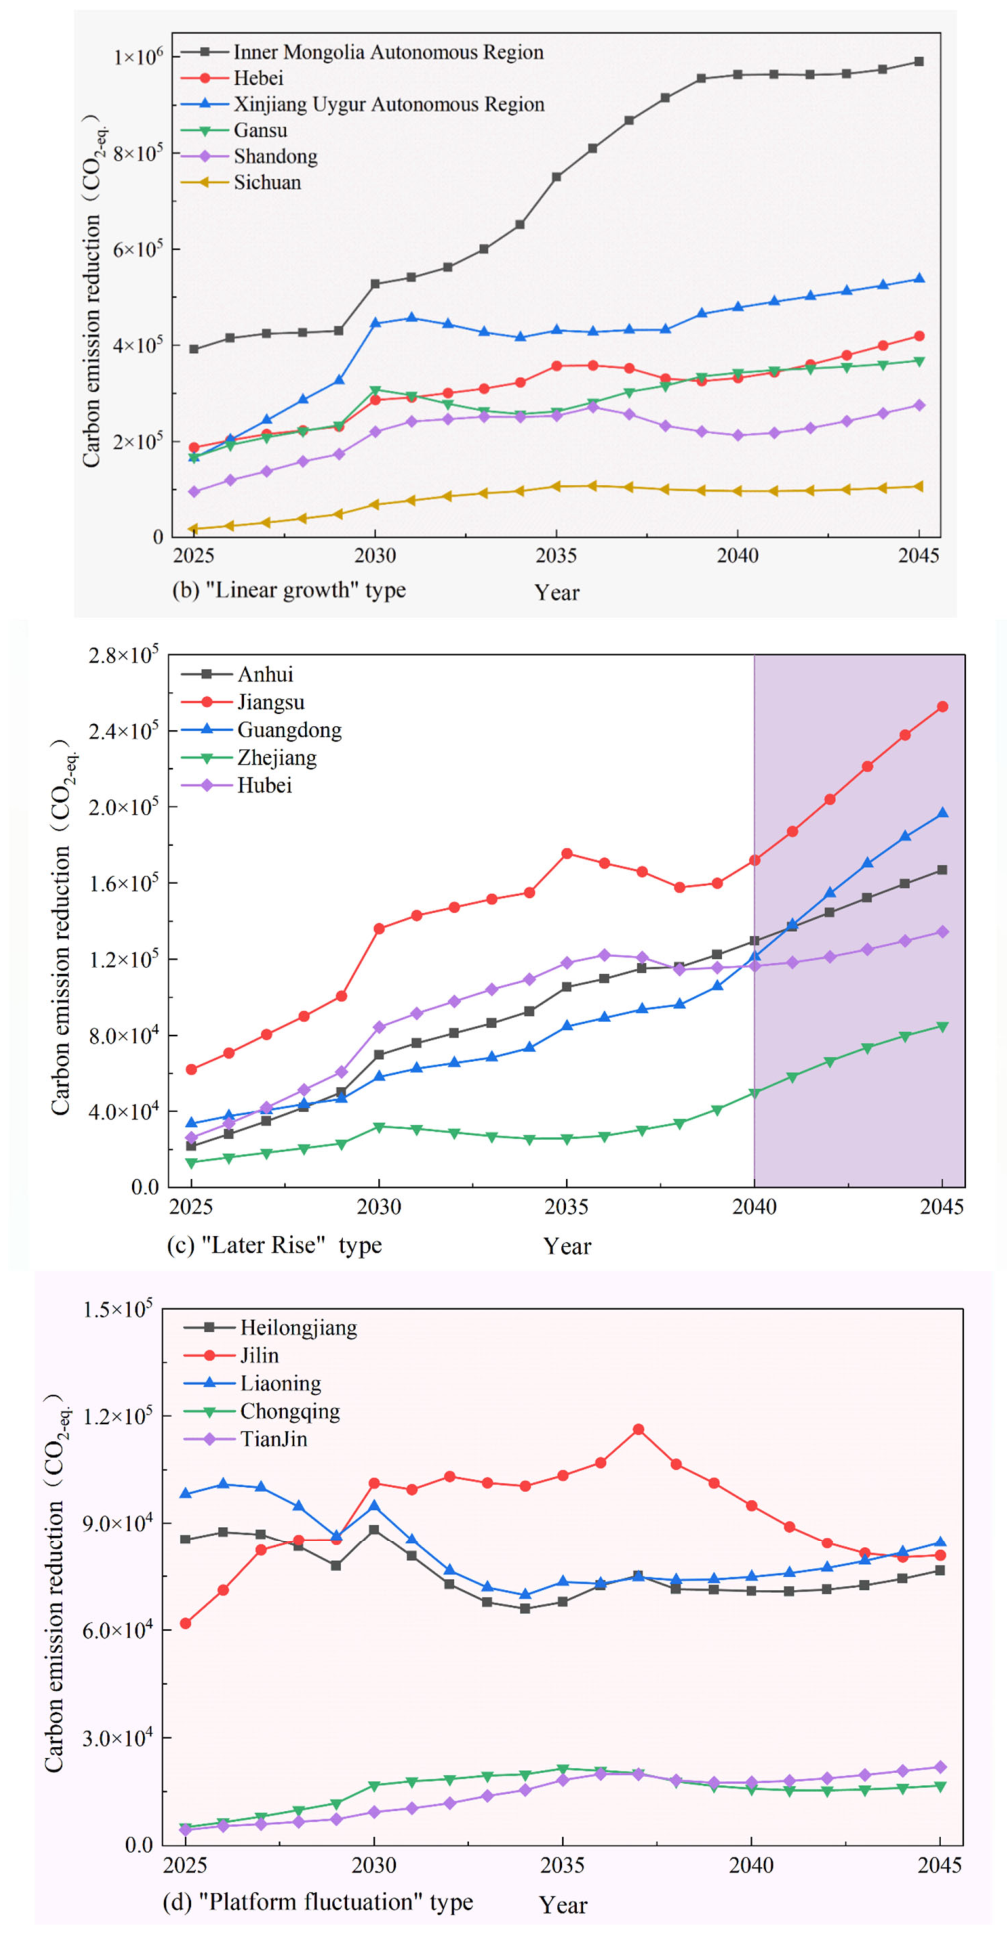
The spatiotemporal evolution patterns of carbon emission reduction from retired wind turbine recycling can be classified into four representative categories: “peak–fallback”, “linear growth”, “later rise”, and “platform fluctuation”. The regional differences in carbon emission reduction trajectories reflect the phased evolution of China’s historical wind power development and installation patterns. Among them, early wind power bases such as Henan, Ningxia, Qinghai, and Yunnan exhibit pronounced single-peak or double-peak fluctuations characteristic of the “peak–fallback” pattern (Figure 3a), with peak values mainly occurring between 2030 and 2035. For example, carbon emission reductions in Henan are projected to reach 427,100 t CO2-eq. in 2035 before declining to 263,000 t CO2-eq., while Ningxia will peak at 185,700 t CO2-eq. in 2030 and subsequently decrease to 67,000 t CO2-eq. This cyclical trend suggests that wind farms intensively constructed during the Eleventh and Twelfth Five-Year Plan periods will enter a concentrated decommissioning phase after reaching the end of their service life, followed by a temporary decline in retirement volumes once these early installations are phased out. In contrast, large-scale wind power bases with installed capacities exceeding 10 million kW—such as Inner Mongolia, Hebei, Xinjiang, and Shandong—display a pattern of sustained “linear growth” (Figure 3b). In these regions, the coexistence of extensive early installations and continuous new capacity additions has created overlapping waves of turbine retirement. As a result, carbon emission reductions increase progressively with the expansion of decommissioning scales, rising by approximately 150–240% in 2045 compared with 2025, without showing obvious peak or decline characteristics.
In contrast, the late-developing provinces in central and eastern China—such as Anhui, Jiangsu, Guangdong, and Zhejiang—exhibit accelerated growth characterized by a “later rise” pattern (Figure 3c). Although their carbon reduction baselines in 2025 remain relatively low—for example, 21,800 metric tons of CO2-eq. in Anhui, 62,100 metric tons of CO2-eq. in Jiangsu, and 33,700 metric tons of CO2-eq. in Guangdong—these values are projected to increase to 166,900, 252,800, and 196,500 metric tons of CO2-eq., respectively, by 2045, with an average annual growth rate exceeding 8%. This rapid growth is closely associated with the large-scale retirement of medium- and low-wind-speed projects developed after the 13th Five-Year Plan period, reflecting the long-term shift in China’s wind power development focus from the “Three North” regions toward central and eastern load centers.
In contrast, the Northeast wind power bases—including Heilongjiang, Jilin, and Liaoning—have long exhibited a pattern of “platform fluctuations” (Figure 3d), with carbon emission reductions fluctuating within a relatively stable range of 60,000–100,000 t CO2-eq. Because early wind farms in these regions were mainly composed of small-capacity turbines installed in dispersed batches, the retirement process remains relatively scattered and has not formed pronounced decommissioning peaks. As a result, these provinces constitute a relatively stable source of regional carbon reduction benefits.

3.2.2. Dynamic Transfer Characteristics of Echelon Pattern

The results of carbon emission reduction calculations during the study period indicate pronounced dynamic changes in the regional ranking of carbon reduction contributions. In 2025, the top ten provinces in terms of carbon emission reduction were Inner Mongolia, Hebei, Xinjiang, Gansu, Shanxi, Shandong, Yunnan, Heilongjiang, Jilin, and Jiangsu. By 2045, Xinjiang (538,100 metric tons of CO2-eq.) is projected to rise to second place, while Shandong (275,700 metric tons of CO2-eq.) and Jiangsu (252,800 metric tons of CO2-eq.) are expected to enter the top five. In contrast, Gansu (368,500 metric tons of CO2-eq.) and Yunnan (102,800 metric tons of CO2-eq.) show a relative decline in ranking.
These changes suggest that, as the concentrated decommissioning phase of the early “Three North” wind power bases gradually subsides, carbon reduction contributions from coastal and plain-based wind power regions such as Shandong and Jiangsu will continue to increase. Consequently, the regional center of carbon emission reduction is shifting from traditional resource-rich areas toward coastal provinces and load centers.
Regional heterogeneity necessitates a differentiated layout of the recycling industry. For regions experiencing sustained growth, such as Inner Mongolia and Hebei, stable and large-scale recycling capacity should be established to accommodate continuously increasing decommissioning volumes. For regions entering a post-peak stage, such as Henan and Gansu, cross-regional coordination mechanisms are needed to mitigate the risk of idle recycling capacity caused by sharp declines in retirement volumes. For late-developing regions such as Anhui and Zhejiang, recycling infrastructure should be planned 5–10 years in advance to avoid future processing shortages associated with rapidly increasing decommissioning demand.
Overall, the spatial center of carbon emission reduction from retired wind turbine recycling is gradually transitioning from the traditional “Three North” wind power bases toward coastal and load-center provinces, highlighting the growing importance of differentiated regional recycling strategies and forward-looking infrastructure planning.

3.3. Material-Driven Contributions to Carbon Reduction Potential

3.3.1. Evolution Trend of Overall Carbon Reduction Benefits

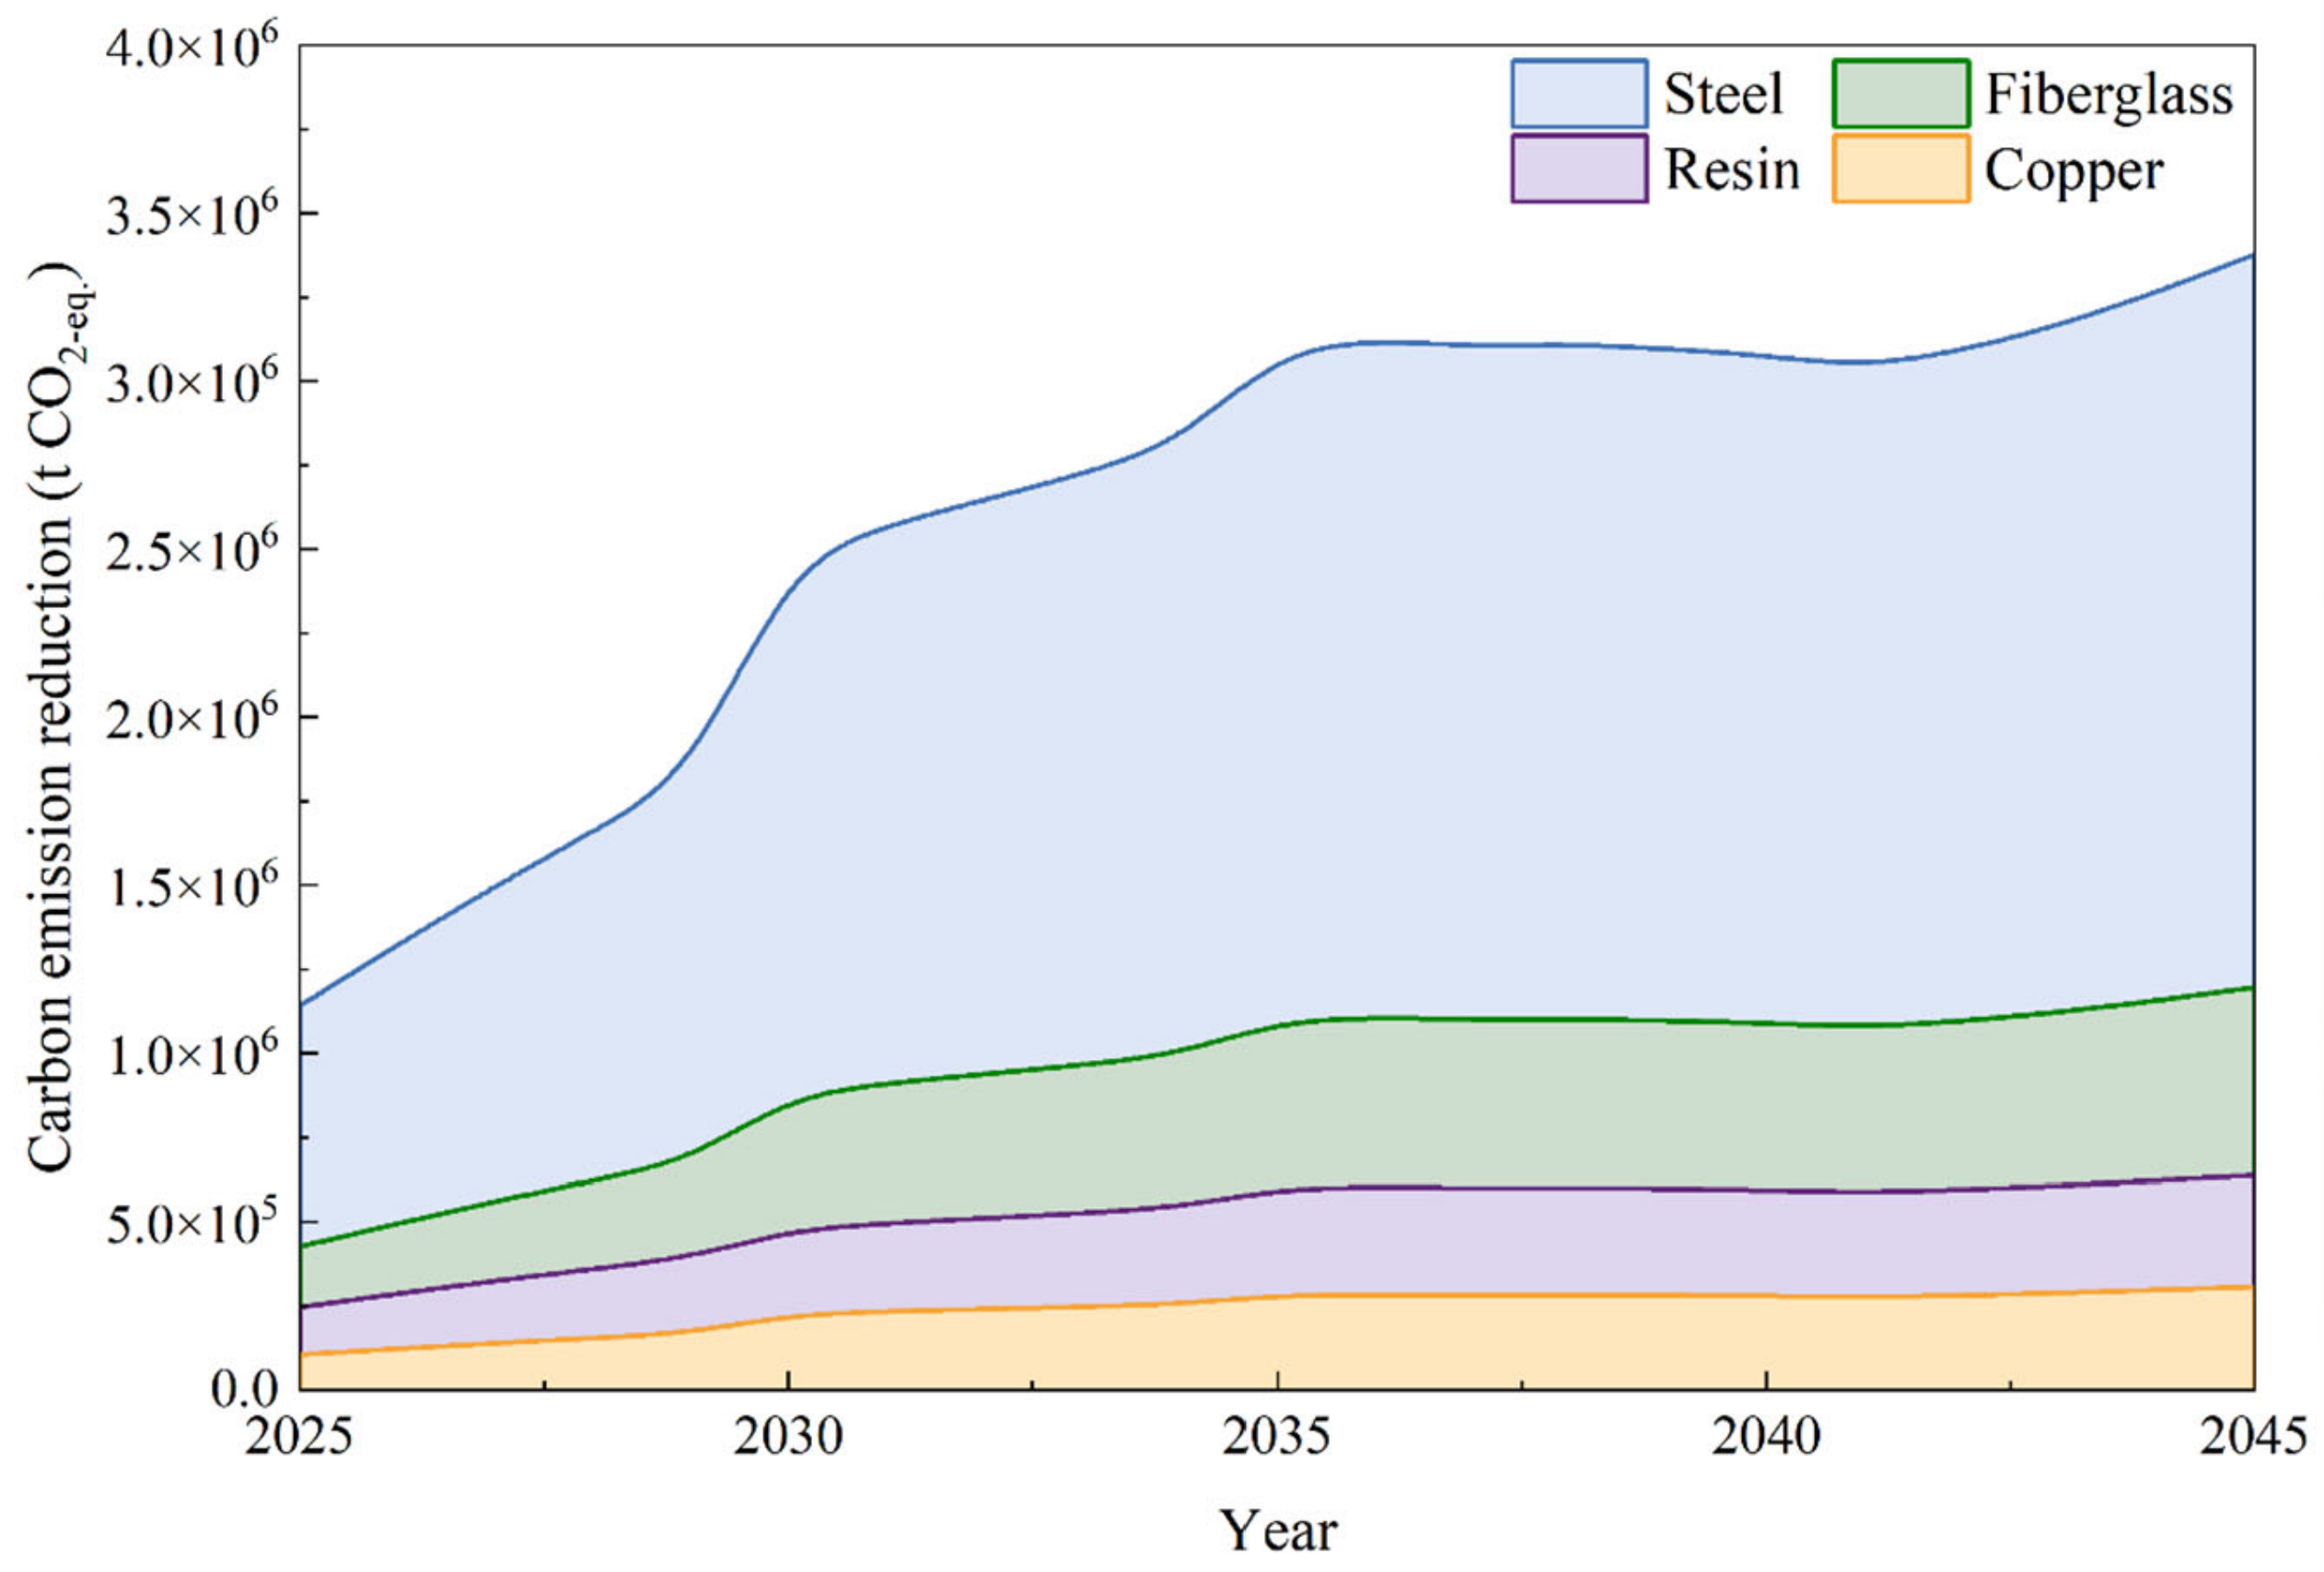
The carbon emission reduction contributions of key recyclable materials from decommissioned wind turbines between 2025 and 2045 are shown in Figure 4. Over the study period, the resource recovery of decommissioned wind turbines is estimated to achieve cumulative carbon emission reductions of approximately 90.85 million metric tons of CO2-eq. Under the assumed end-of-life resource-utilization pathways, steel, composite materials (glass fiber and resin), and copper account for approximately 60%, 33%, and 6% of the estimated carbon reduction potential, respectively. Among these materials, steel constitutes the largest source of carbon emission reduction, mainly owing to its dominant mass proportion in wind turbines and the substantial substitution benefits associated with electric arc furnace steelmaking. Furthermore, carbon emission reductions from the recycling of these four key materials exhibit a sustained upward trend, increasing from 1.93 million tons of CO2-eq. in 2025 to 5.28 million tons of CO2-eq. in 2045, representing an increase of approximately 187%. This continuous growth reflects the combined effects of expanding decommissioning scales, increasing recyclable material stocks, and ongoing improvements in recycling technologies. Through the circular utilization of key materials, significant carbon reduction benefits can be achieved, thereby generating substantial positive environmental benefits throughout the wind power lifecycle.
In terms of material composition, steel accounts for the largest share of carbon emission reductions, with its reduction volume increasing from 1.1423 million metric tons of CO2-eq. in 2025 to 3.3786 million metric tons of CO2-eq. in 2045, representing approximately 59–62% of the total carbon reduction. This dominant contribution is mainly attributed to the high mass proportion of steel in wind turbine structures and the significant emission reduction benefits of recycled steel production. Glass fiber ranks second and exhibits a steady upward trend, with carbon emission reductions reaching approximately 1.1976 million metric tons of CO2-eq. by 2045. Compared with metallic materials, however, its overall reduction efficiency remains constrained by the relatively high energy consumption and technological limitations of composite material recycling. Carbon emission reductions from resin recycling are projected to peak in 2036 at approximately 604,900 metric tons of CO2-eq., after which they gradually stabilize as the large-scale decommissioning wave of early wind farms subsides. This trend reflects the strong dependence of resin recycling benefits on the temporal concentration of blade retirement. Copper contributes a relatively smaller share to total carbon reduction but maintains a stable growth trend, reaching approximately 309,100 metric tons of CO2-eq. by 2045. Despite its comparatively low total volume, copper recycling demonstrates high carbon reduction efficiency per unit mass due to the maturity of low-carbon recycling technologies. These structural differences primarily stem from variations in material composition, carbon footprint coefficients, and the technological maturity of recycling pathways for different materials.

3.3.2. Carbon Reduction Characteristics and Differences in Technical Paths by Material

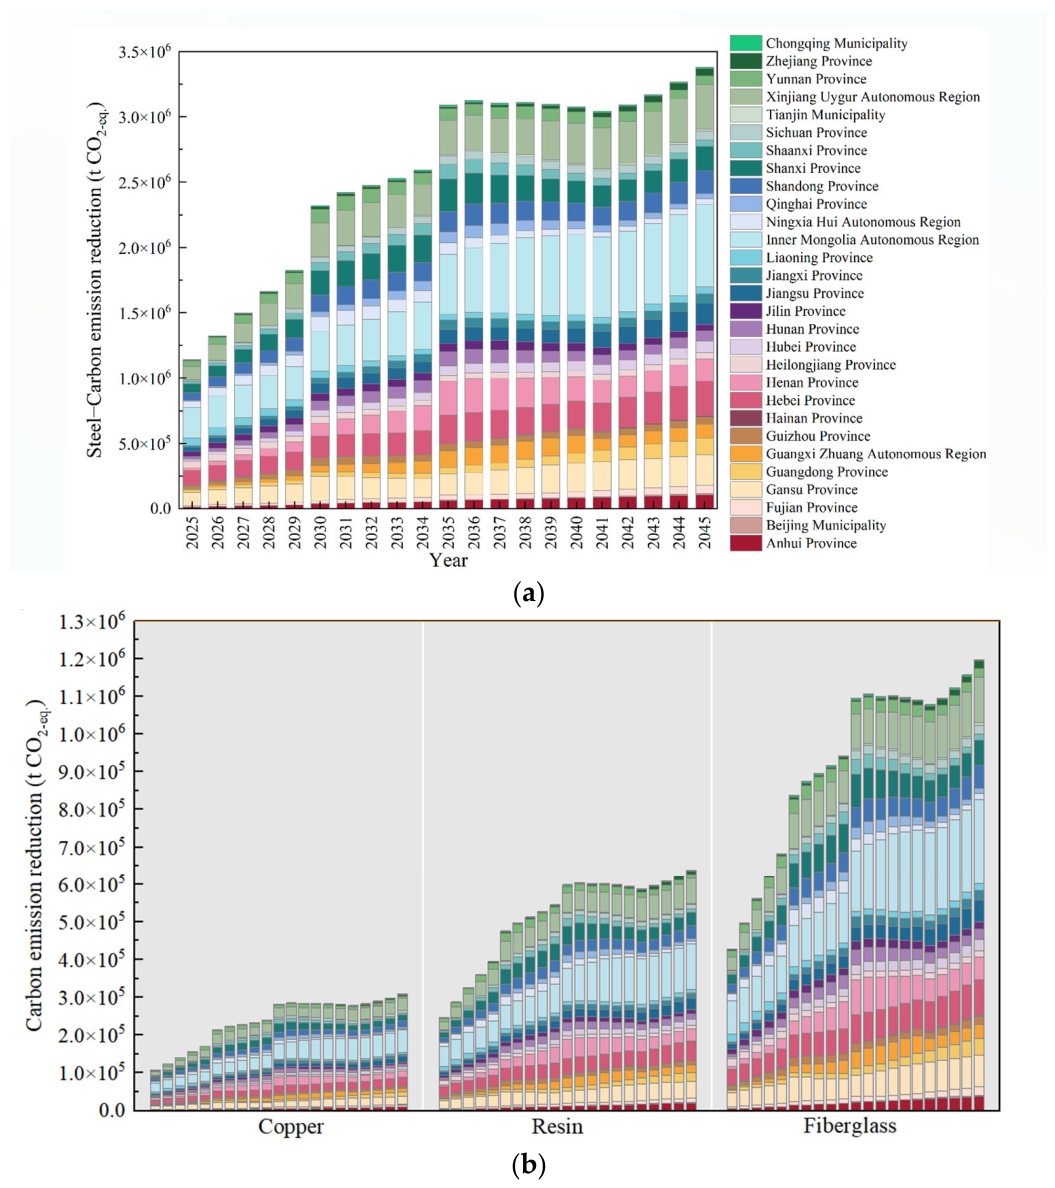
Taking into account the actual installed base and decommissioning status of wind turbines, as well as the recycling characteristics of different materials, this study compares the provincial trends in carbon emission reductions from the resource recovery of four major materials—steel, glass fiber, resin, and copper—between 2025 and 2045, as shown in Figure 5a,b. Steel exhibits the most significant carbon reduction contribution, primarily driven by its substantial material stock and the substitution effect associated with short-process steelmaking. Although the recycling rate of steel is relatively limited, steel accounts for more than 80% of the total mass of wind turbine units. In addition, electric arc furnace steelmaking can reduce carbon emissions by approximately 1440 kg CO2-eq./t compared with the conventional long-process blast furnace route (Table S2), making recycled steel the dominant contributor to overall carbon reduction benefits. Provincial comparisons further indicate that regions with high steel-related carbon reduction potential are mainly concentrated in the “Three North” regions, where wind power development started earlier and installed capacities are relatively large, as well as in several major coastal wind power bases. As the principal composite materials used in wind turbine blades, glass fiber and resin display a characteristic trend of “rapid growth followed by gradual stabilization” in carbon reduction benefits. This pattern is closely associated with the accelerated retirement of large-scale wind farms after 2030 and the subsequent stabilization of decommissioning volumes in later stages. Driven by the large-scale decommissioning of wind turbines, glass fiber ranks second in carbon reduction benefits between 2025 and 2045, increasing from 428,000 metric tons of CO2-eq. to 1,197,600 metric tons of CO2-eq., with an average annual growth rate of approximately 9%. These values represent pathway-specific avoided-emission credits under the assumed resource-utilization scenarios rather than carbon savings from direct replacement of virgin glass fiber. Despite its considerable reduction potential, however, the actual carbon reduction efficiency of glass fiber recycling remains relatively limited due to technological constraints. Mechanical recycling often causes degradation in fiber performance, while pyrolysis-based recycling processes are associated with relatively high energy consumption. As a result, the carbon reduction contribution of glass fiber recycling in most provinces remains below 10% of that achieved by metallic materials. Combined with the relatively high carbon intensity of recycled composite materials, this forms a structural characteristic of “large volume but low efficiency,” thereby constraining the overall lifecycle carbon reduction potential. The carbon reduction contribution of resin recycling is projected to peak at approximately 600,000 metric tons of CO2-eq. around 2035 and then gradually stabilize. This trend reflects the temporal coupling between the concentrated retirement of early-generation wind turbine blades and the subsequent decline in decommissioning volumes. Once specific batches of early-stage wind farms—particularly those installed between 2005 and 2010—enter the end-of-life stage, the supply of resin-based composite materials from decommissioned blades decreases progressively, thereby weakening the associated carbon reduction benefits of recycling. This finding indicates that under high-recovery-rate scenarios, the availability of decommissioned materials gradually becomes the dominant constraint on further carbon reduction potential.
Although copper contributes a relatively small share to total carbon reduction in absolute terms, it exhibits high carbon reduction efficiency per unit mass due to the maturity of low-carbon recycling technologies. Combined with the recycling rates under different scenarios (Table 1), copper recycling provides a relatively stable carbon reduction contribution throughout the decommissioning period, mainly reflecting its long-term cumulative mitigation effect.

3.3.3. Analysis of Carbon Reduction Mechanisms and Synergistic Benefits

The carbon reduction benefits quantified in this study arise primarily from avoided upstream burdens associated with material production through the recovery and utilization of end-of-life wind turbine materials. For metals, these benefits are mainly associated with reduced demand for primary steel and copper production. For thermoset composites, the benefits are pathway-dependent and arise from their utilization through mechanical recycling, thermal treatment, or cement kiln co-processing. Therefore, the magnitude of carbon reduction depends jointly on the quantity of recoverable materials and the environmental performance of the corresponding resource-utilization pathways. With the continued implementation of early retirement policies such as “replacing small units with large ones,” along with the large-scale application of high-value recycling technologies, the resource recovery of decommissioned wind turbines will become a critical “carbon sink node” within the new energy industry chain, providing essential support for the low-carbon transformation of the wind power sector across its entire lifecycle.

3.4. Model Assumptions and Limitations

The estimated carbon reduction potential is based on several simplifying assumptions regarding material recovery and carbon accounting. In particular, the recovery rates adopted in this study represent the proportion of end-of-life materials entering beneficial resource-utilization pathways rather than closed-loop recycling rates. For steel and copper, established recycling systems allow secondary materials to substitute primary production to a large extent. In contrast, thermoset composites such as fiberglass and resin are primarily treated through mechanical recycling, thermal treatment, or cement kiln co-processing, and the resulting secondary products generally enter downcycled applications. Accordingly, the composite-related avoided-emission factors used in this study represent scenario-level environmental credits associated with the assumed resource-utilization pathways rather than empirically determined one-to-one virgin-material displacement ratios. Actual displacement may vary with recycling technology, recovered-material quality, and downstream application; therefore, the estimated composite-related carbon reductions should be interpreted as prospective and pathway-dependent.
The assessment further adopts static life-cycle emission factors throughout the study period and does not explicitly incorporate future decarbonization of the electricity system or energy-intensive industries. Transportation emissions associated with delivering decommissioned components to recycling facilities were also excluded from the system boundary. Although these factors may influence the absolute magnitude of future carbon reduction potential, particularly in regions where recycling infrastructure is less developed, they are unlikely to alter the overall spatial and temporal patterns identified in this study. Similarly, macroeconomic indicators such as GDP were not explicitly included because the projected carbon reduction potential is primarily determined by retirement quantities, material composition, recycling rates, and life-cycle emission factors, with economic development influencing the results indirectly through historical and projected wind power deployment.
The long-term projections are also subject to uncertainty associated with turbine retirement behavior, technological development, material recovery efficiency, and future policy implementation. No formal sensitivity or probabilistic uncertainty analysis was conducted in the present study. Owing to the limited availability of nationwide operational and decommissioning records, the Weibull lifetime parameters adopted here should therefore be regarded as predefined scenario assumptions rather than statistically calibrated values. Accordingly, the objective of this study is to establish a deterministic framework for identifying the spatiotemporal evolution of carbon reduction potential under internally consistent scenarios, rather than to provide probabilistic confidence intervals for the projected values. Future studies should calibrate lifetime distributions using empirical retirement records and apply sensitivity analysis or Monte Carlo simulation to quantify the effects of parameter uncertainty. Despite these limitations, the present framework provides a consistent basis for evaluating the spatiotemporal evolution of carbon reduction potential from end-of-life wind turbines in China. Realizing the projected benefits will depend not only on the increasing availability of retired turbines but also on continued improvements in composite recycling technologies, recycling infrastructure, and supporting policy mechanisms. Future work should further integrate dynamic emission factors, transportation logistics, and evolving recycling technologies to improve the robustness of long-term assessments.

4. Conclusions

Based on the temporal and spatial evolution analysis of carbon emission reduction potential from the resource recycling of retired onshore wind turbines in China during 2025–2045, the main conclusions are as follows. The carbon emission reduction benefits of retired wind turbine resource recycling exhibit pronounced regional heterogeneity. The provincial trajectories of carbon reduction potential can be classified into four representative evolution patterns: continuous growth, peak–fallback, late-stage rise, and platform fluctuation. Provinces with large-scale wind power deployment, including Inner Mongolia, Xinjiang, Hebei, and Shandong, belong to the continuous expansion type. Driven by successive waves of turbine retirement, their carbon emission reduction potential increases steadily, with Inner Mongolia reaching 990.1 × 10³ t CO2-eq by 2045, making these provinces the primary contributors to China’s wind power recycling benefits. Early-developed wind power provinces, such as Henan, Ningxia, and Yunnan, exhibit a peak–decline pattern, reflecting the retirement of large numbers of turbines installed during the Eleventh and Twelfth Five-Year Plan periods. In contrast, economically developed provinces including Jiangsu, Guangdong, Zhejiang, and Anhui demonstrate a late-growth pattern, indicating that the center of future carbon reduction potential is gradually shifting from the traditional “Three-North” regions toward eastern load centers. From 2025 to 2045, the resource utilization of retired wind turbines is projected to achieve a cumulative carbon emission reduction of 90.85 million t CO2-eq, while the annual carbon reduction increases from 1.93 million t CO2-eq in 2025 to 5.28 million t CO2-eq in 2045. Steel contributes approximately 60% of the total carbon reduction because of its large material share and the high carbon-saving efficiency of electric arc furnace recycling. Under the assumed resource-utilization pathways, composite materials account for approximately 33% of the estimated carbon reduction potential. This contribution should be interpreted as a pathway-specific prospective benefit rather than as carbon savings arising from one-to-one substitution of virgin fiberglass and resin. Meanwhile, copper contributes approximately 6%, benefiting from mature recycling technologies and stable recovery efficiency. Compared with previous studies on wind turbine life-cycle assessment and end-of-life recycling, the present study confirms the significant carbon reduction benefits of recycling retired wind turbine materials while extending previous research in several important aspects. Previous studies have primarily focused on individual turbine types, specific wind farms, or static recycling scenarios, whereas this study integrates dynamic retirement forecasting, regional deployment characteristics, and material flow analysis to evaluate the long-term spatiotemporal evolution of carbon reduction potential at the national scale. Consequently, the results not only quantify the overall carbon reduction potential of end-of-life wind turbine recycling but also reveal substantial regional heterogeneity and temporal evolution that cannot be captured by static assessments. These findings provide a more comprehensive basis for optimizing regional recycling infrastructure, improving resource allocation, and supporting China’s carbon neutrality strategy through circular utilization of retired wind turbine materials.
The quantitative results should nevertheless be interpreted within the assumptions of the present framework. Specifically, the analysis applies static life-cycle emission factors over 2025–2045, excludes transportation emissions between wind farms and recycling facilities, and does not include formal sensitivity or probabilistic uncertainty analysis. These assumptions may affect the absolute magnitude of the estimated carbon reduction potential, although the framework remains useful for identifying the relative temporal evolution and regional differentiation of end-of-life resource utilization. Future research should incorporate dynamic emission factors, spatially explicit recycling logistics, and systematic uncertainty analysis as more empirical decommissioning and recycling data become available.

Supplementary Materials

The following supporting information can be downloaded at: https://www.mdpi.com/article/10.3390/atmos17090824/s1, Table S1: Average analysis table of fan material composition; Table S2: Energy consumption for recycling each material. References [34,35,36,37,38,39,40,41,42,43,44,45,46,47,48,49,50,51] are cited in the Supplementary Materials.

Author Contributions

Conceptualization, X.B. and X.H.; methodology, X.B.; software, X.H.; validation, X.H. and X.B.; formal analysis, R.S.; investigation, X.B.; data curation, X.B.; writing—original draft preparation, X.H.; writing—review and editing, R.S. and H.T.; visualization, R.S.; supervision, H.T.; project administration, C.L.; funding acquisition, P.L. All authors have read and agreed to the published version of the manuscript.

Funding

This work was funded by the State Grid Corporation of China (5200-202314489A-3-2-ZN).

Institutional Review Board Statement

Not applicable.

Informed Consent Statement

Not applicable.

Data Availability Statement

The data used in this study were obtained from publicly available sources, including the Global Wind Power Tracker database and relevant statistical publications. The processed datasets generated during the current study are not publicly shared. Further information regarding the data sources and methodology is provided in the manuscript and Supplementary Materials.

Acknowledgments

We would like to acknowledge the editors and anonymous reviewers for their valuable suggestions and comments for improving this paper.

Conflicts of Interest

Authors Xiaoxuan Bai, Peng Li, and Chao Li are employed by Jibei Electric Power Research Institute, State Grid Jibei Electric Power Co., Ltd., which also provided funding for this study. The remaining authors declare no conflicts of interest.

References

  1. Global Wind Energy Council. Global Wind Report 2026; GWEC: Brussels, Belgium, 2026. [Google Scholar]
  2. Gast, L.; Meng, F.; Morgan, D. Assessing the circularity of onshore wind turbines: Using material flow analysis for improving end-of-life resource management. Resour. Conserv. Recycl. 2024, 204, 107468. [Google Scholar] [CrossRef] [Scilit]
  3. Sun, J.; Zheng, Z.M.; Hu, L.S. Research and practice of wind power decommissioning and recycling. In Proceedings of the 12th China Wind Power After-Market Exchange and Cooperation Conference; China Agricultural Machinery Industry Association Wind Energy Equipment Branch, Ed.; Jiangsu Huaneng Smart Energy Supply Chain Technology Co., Ltd.: Nantong, China, 2025; pp. 228–233. [Google Scholar]
  4. Nassar, Y.F.; El-Khozondar, H.J.; El-Osta, W.; Mohammed, S.; Elnaggar, M.; Khaleel, M.; Ahmed, A.; Alsharif, A. Carbon footprint and energy life cycle assessment of wind energy technology in Libya. Energy Convers. Manag. 2024, 301, 118022. [Google Scholar] [CrossRef] [Scilit]
  5. Offshore Renewable Energy Catapult. Carbon Footprint of Offshore Wind Farm Components; Offshore Renewable Energy Catapult: Glasgow, UK, 2021. [Google Scholar]
  6. Greenpeace; Tsinghua University School of Environment. China’s Wind Power Equipment Recycling Industry Development Report; Greenpeace: Beijing, China, 2022. [Google Scholar]
  7. European Commission Joint Research Centre. Material Streams from Wind Energy: Decommissioned Material Streams from Wind Energy in the EU; Publications Office of the European Union: Luxembourg, 2024. [Google Scholar]
  8. Yang, J.; Meng, F.; Zhang, L.; McKechnie, J.; Chang, Y.; Ma, B.; Hao, Y.; Li, X.; Pender, K.; Yang, L.; et al. Solutions for recycling emerging wind turbine blade waste in China are not yet effective. Commun. Earth Environ. 2023, 4, 466. [Google Scholar] [CrossRef] [Scilit]
  9. European Commission. Directive (EU) 2023/2413 of the European Parliament and of the Council of 18 October 2023 Amending Directive (EU) 2018/2001, Regulation (EU) 2018/1999 and Directive 98/70/EC as Regards the Promotion of Energy from Renewable Sources, and Repealing Council Directive (EU) 2015/652 (RED III). Off. J. Eur. Union 2023./2413. Available online: https://eur-lex.europa.eu/eli/dir/2023/2413/oj?utm_source=chatgpt.com (accessed on 16 August 2026).
  10. Welte, T.M.; Wang, K. Models for lifetime estimation: An overview with focus on applications to wind turbines. Adv. Manuf. 2014, 2, 79–87. [Google Scholar] [CrossRef] [Scilit]
  11. Jang, Y.J.; Choi, C.W.; Lee, C.W.; Kang, J.H.; Weon, K. Development of fatigue life prediction method and effect of 10-min mean wind speed distribution on fatigue life of small wind turbine composite blade. Renew. Energy 2015, 79, 187–198. [Google Scholar] [CrossRef] [Scilit]
  12. Kiadaliry, F.; Raissi, S.; Komijan, A.R. Weibull-Neural Network Framework for Wind Turbine Lifetime Monitoring and Disturbance Identification. Wind Energy 2026, 29, e70103. [Google Scholar] [CrossRef] [Scilit]
  13. Tazi, N.; Kim, J.; Bouzidi, Y.; Chatelet, E.; Liu, G. Waste and material flow analysis in the end-of-life wind energy system. Resour. Conserv. Recycl. 2019, 145, 199–207. [Google Scholar] [CrossRef] [Scilit]
  14. Chen, Y.; Cai, G.; Zheng, L.; Zhang, Y.; Qi, X.; Ke, S.; Gao, L.; Bai, R.; Liu, G. Modeling waste generation and end-of-life management of wind power development in Guangdong, China until 2050. Resour. Conserv. Recycl. 2021, 169, 105533. [Google Scholar] [CrossRef] [Scilit]
  15. National Energy Administration of China. Administrative Measures for the Renovation, Upgrading and Decommissioning of Wind Farms; NEA Document No. 45 of 2023; National Energy Administration of China: Beijing, China, 2023. [Google Scholar]
  16. National Development and Reform Commission; National Energy Administration; Ministry of Industry and Information Technology; Ministry of Ecology and Environment; Ministry of Commerce; State-owned Assets Supervision and Administration Commission of the State Council. Guiding Opinions on Promoting the Circular Utilization of Decommissioned Wind Power and Photovoltaic Equipment. NDRC Environmental Resources No. 1030 of 2023; National Development and Reform Commission: Beijing, China, 2023.
  17. Andersen, P.D.; Bonou, A.; Beauson, J.; Brøndsted, P. “Recycling of Wind Turbines”. In DTU International Energy Report 2014: Wind Energy—Drivers and Barriers for Higher Shares of Wind in the Global Power Generation Mix; Technical University of Denmark: Lyngby, Denmark, 2014; pp. 91–97. Available online: https://orbit.dtu.dk/en/publications/recycling-ofwind-turbines/ (accessed on 16 August 2026).
  18. Chen, Y.H.; Ding, N.; Bai, X.X.; Li, P.; Li, C.; Yang, J.X. Carbon footprint analysis of wind power system with generation and storage. China Environ. Sci. 2025, 45, 2926–2931. [Google Scholar]
  19. Wang, Y.L.; Cai, C.C.; Zhang, D.Y.; Liu, Z.; Yiwen, L.I. Research on environmental assessment of wind power generation based on whole life cycle theory. J. North China Electr. Power Univ. (Nat. Sci. Ed.) 2023, 50, 100–109. [Google Scholar]
  20. Li, J.; Li, S.; Wu, F. Research on carbon emission reduction benefit of wind power project based on life cycle assessment theory. Renew. Energy 2020, 155, 456–468. [Google Scholar] [CrossRef] [Scilit]
  21. Fiber Composites Recycling Branch of China Association of Circular Economy. Industrial Development Report on Resource Utilization of Composite Solid Wastes Such as Wind Turbine Blades (2022); China Building Materials Press: Beijing, China, 2023. [Google Scholar]
  22. Tota-Maharaj, K.; McMahon, A. Resource and waste quantification scenarios for wind turbine decommissioning in the United Kingdom. Waste Dispos. Sustain. Energy 2021, 3, 117–144. [Google Scholar] [CrossRef] [Scilit]
  23. Meng, F.; Hawkin, J.L.; Gast, L.; Job, S.; Brádaigh, C.M.Ó.; Cullen, J.M.; Leeke, G.A.; McKechnie, J.; Poulsen, A.K.; Rothman, R.; et al. End-of-life management for wind turbines. Nat. Rev. Clean. Technol. 2025, 1, 677–698. [Google Scholar] [CrossRef] [Scilit]
  24. Demuyter, C.; Vanderveken, I.; Thomassen, G.; Godoy León, M.F.; De Lucca Peña, L.V.; Blommeart, C.; Vermeir, J.; Dewulf, J. Prospective material flow analysis of the end-of-life decommissioning: Case study of a North Sea offshore wind farm. Resour. Conserv. Recycl. 2024, 200, 107283. [Google Scholar] [CrossRef] [Scilit]
  25. ISO 14040; Environmental Management—Life Cycle Assessment—Principles and Framework. ISO: Geneva, Switzerland, 2006.
  26. Arvesen, A.; Hertwich, E.G. Assessing the life cycle environmental impacts of wind power: A review of present knowledge and research needs. Renew. Sustain. Energy Rev. 2012, 16, 5994–6006. [Google Scholar] [CrossRef] [Scilit]
  27. Nagle, A.J.; Delaney, E.L.; Bank, L.C.; Leahy, P.G. A comparative life cycle assessment between landfilling and co-processing of waste from decommissioned Irish wind turbine blades. J. Clean. Prod. 2020, 277, 123321. [Google Scholar] [CrossRef] [Scilit]
  28. Beauson, J.; Laurent, A.; Rudolph, D.P.; Jensen, J.P. The complex end-of-life of wind turbine blades: A review of the European context. Renew. Sustain. Energy Rev. 2022, 155, 11847. [Google Scholar] [CrossRef] [Scilit]
  29. Mamanpush, S.H.; Li, H.; Englund, K.; Tabatabaei, A.T. Recycled wind turbine blades as a feedstock for second generation composites. Waste Manag. 2018, 76, 708–714. [Google Scholar] [CrossRef] [Scilit]
  30. Fonte, R.; Xydis, G. Wind turbine blade recycling: An evaluation of the European market potential for recycled composite materials. J. Environ. Manag. 2021, 287, 112269. [Google Scholar] [CrossRef] [Scilit]
  31. Caduff, M.; Huijbregts, M.A.; Althaus, H.J.; Koehler, A.; Hellweg, S. Wind power electricity: The bigger the turbine, the greener the electricity. Environ. Sci. Technol. 2012, 46, 4725–4733. [Google Scholar] [CrossRef] [Scilit]
  32. Staffell, I. Measuring the progress and impacts of decarbonising British electricity. Energy Policy 2017, 102, 463–475. [Google Scholar] [CrossRef] [Scilit]
  33. Liu, P.; Meng, F.; Barlow, C.Y. Wind turbine blade end-of-life options: An eco-audit comparison. J. Clean. Prod. 2019, 212, 1268–1281. [Google Scholar] [CrossRef] [Scilit]
  34. Guo, M.X.; Cai, W.J.; Wang, C.; Chen, J.N. Quantifying CO2 emissions of one wind farm using life cycle assessment and uncertainty analysis. China Environ. Sci. 2012, 32, 742–747. [Google Scholar]
  35. Chen, G.Q.; Yang, Q.; Zhao, Y.H. Renewability of wind power in China: A case study of nonrenewable energy cost and greenhouse gas emission by a plant in Guangxi. Renew. Sustain. Energy Rev. 2011, 15, 2322–2329. [Google Scholar] [CrossRef] [Scilit]
  36. Wang, X.T. Calculation of environmental benefits of wind power based on life cycle assessment method—Taking a wind farm in Inner Mongolia as an example. Sci. Technol. Manag. Res. 2012, 32, 259–262. [Google Scholar]
  37. Xu, L.; Pang, M.; Zhang, L.; Poganietz, W.-R.; Marathe, S.D. Life cycle assessment of onshore wind power systems in China. Resour. Conserv. Recycl. 2018, 132, 361–368. [Google Scholar] [CrossRef] [Scilit]
  38. Xie, J.B.; Fu, J.X.; Liu, S.Y.; Hwang, W.S. Assessments of carbon footprint and energy analysis of three wind farms. J. Clean. Prod. 2020, 254, 120159. [Google Scholar] [CrossRef] [Scilit]
  39. Yang, D.; Liu, J.R.; Yang, J.X.; Ding, N. Carbon footprint of wind turbine by life cycle assessment. Acta Sci. Circumstantiae 2015, 35, 927–934. [Google Scholar]
  40. Wang, Y.; Wu, Z.; Song, X.; Duan, H.; Tan, H. Calculation and emission reduction effect evaluation model of wind power lifetime carbon emission under carbon neutralization target. In 2022 IEEE 6th Conference on Energy Internet and Energy System Integration; IEEE: New York, NY, USA, 2022. [Google Scholar]
  41. Xiang, N.; Wang, L.M.; Qu, Q.S.; Xiong, C.R.; Wang, B. Comparison of emissions from offshore and onshore wind power systems based on life cycle assessment. Resour. Sci. 2021, 43, 745–755. [Google Scholar]
  42. Yan, M.; Li, T.; Yang, C.; Wang, M.; Yang, D. Calculation method of life cycle assessment parameters oriented to collaborative green design and evaluation of electromechanical products. China Mech. Eng. 2023, 34, 1453–1464. [Google Scholar]
  43. Yang, J.; Chen, B. Integrated evaluation of embodied energy, greenhouse gas emission and economic performance of a typical wind farm in China. Renew. Sustain. Energy Rev. 2013, 27, 559–568. [Google Scholar] [CrossRef] [Scilit]
  44. Ji, S.Y.; Gao, C.; Chen, B.; Li, S.N. Carbon emission accounting for wind farm based on life cycle assessment. Acta Ecol. Sin. 2016, 36, 915–923. [Google Scholar] [CrossRef] [Scilit]
  45. EuRIC AISBL. Metal Recycling Factsheet; EuRIC: Brussels, Belgium, 2020. [Google Scholar]
  46. World Steel Association. World Steel in Figures 2024; World Steel Association: Brussels, Belgium, 2024. [Google Scholar]
  47. Soulier, M.; Pfaff, M.; Goldmann, D.; Walz, R.; Geng, Y.; Zhang, L.; Tercero Espinoza, L.A. The Chinese copper cycle: Tracing copper through the economy with dynamic substance flow and input-output analysis. J. Clean. Prod. 2018, 195, 435–447. [Google Scholar] [CrossRef] [Scilit]
  48. Ostachowicz, W.; McGugan, M.; Schröder-Hinrichs, J.U.; Luczak, M. MARE-WINT: New Materials and Reliability in Offshore Wind Turbine Technology; Springer International Publishing: Cham, Switzerland, 2016; pp. 421–432. [Google Scholar]
  49. Pender, K.; Yang, L. Regenerating performance of glass fiber recycled from wind turbine blade. Compos. Part B Eng. 2020, 198, 108230. [Google Scholar] [CrossRef] [Scilit]
  50. Xu, Y.; Wang, F.; Liang, D.; Lv, G.; Chen, C. A comprehensive review of waste wind turbine blades in China: Current status and resource utilization. J. Environ. Chem. Eng. 2024, 12, 113077. [Google Scholar] [CrossRef] [Scilit]
  51. Yu, D.; Sun, Y.B.; Yang, Q.; Gao, L.; Dong, B.Q.; Zeng, X.C. Current Status and Prospect of Recycling Technology of Wind Turbine Blades. South. Energy Constr. 2023, 10, 113–121. [Google Scholar]
Figure 1. New installed capacity of onshore wind turbines in China from 2005 to 2024: top three provinces.
Atmosphere 17 00824 g001
Figure 2. Carbon reduction amount from material recycling of decommissioned onshore wind farms in China (2025, 2035, 2045).
Atmosphere 17 00824 g002
Figure 3. Representative provincial trajectories for the four carbon reduction evolution patterns during 2025–2045: (a) peak–fallback; (b) continuous growth; (c) late-stage rise; and (d) platform fluctuation.
Atmosphere 17 00824 g003aAtmosphere 17 00824 g003b
Figure 4. Carbon Emission Reduction from Material Resource Utilization for 2025−2045.
Atmosphere 17 00824 g004
Figure 5. (a) Comparison of Carbon Emission Reduction Trends of Steel Material Resource Utilization in Various Provinces (2025−2045). (b) Comparison of Carbon Emission Reduction Trends in Resource Utilization of Copper, Resin, and Glass Fiber Across Provinces (2025−2045).
Atmosphere 17 00824 g005
Table 1. Scenario assumptions for end-of-life material resource recovery.
Resource Recovery RateIdeal retirement (20 Years) rm(1)Policy-Induced Early Retirement (15 Years)
rm(2)
Future Scenario
rm(3)
Reference
Steel50%57%65%Chen Yahe [18], Wang Yongli [19], Li Jinying [20]
Copper60%67%75%Wang Yongli
Fiberglass78%85%93%China Composites Recycling of CRRA [21]
Resin90%95%99%
Disclaimer/Publisher’s Note: The statements, opinions and data contained in all publications are solely those of the individual author(s) and contributor(s) and not of MDPI and/or the editor(s). MDPI and/or the editor(s) disclaim responsibility for any injury to people or property resulting from any ideas, methods, instructions or products referred to in the content.