Article

Evaluation of Precipitation and Temperature from Multiple Products and CMIP6 Simulations over the Qinghai–Tibet Plateau


1
School of Geographical Sciences, Qinghai Normal University, Xining 810016, China
2
Qinghai Provincial Key Laboratory of Plateau Climate Change and Corresponding Ecological and Environmental Effects, Qinghai Institute of Technology, Xining 810016, China
3
State Key Laboratory of Climate System Prediction and Risk Management, Nanjing University of Information Science and Technology, Nanjing 210000, China
4
College of Resource and Environment, Anhui Science and Technology University, Chuzhou 239000, China
*
Author to whom correspondence should be addressed.
Atmosphere 2026, 17(7), 669; https://doi.org/10.3390/atmos17070669
Submission received: 31 May 2026 / Revised: 28 June 2026 / Accepted: 30 June 2026 / Published: 4 July 2026

Abstract

Climate change is profoundly altering precipitation and temperature patterns across high-altitude regions worldwide. The Qinghai–Tibet Plateau (QTP), known as the “Third Pole” and the “Asian Water Tower,” is among the most climate-sensitive regions and plays a critical role in the Asian water cycle, cryospheric stability, and regional ecological security. However, the complex topography and diverse climate of the QTP result in substantial discrepancies among meteorological products over this region, highlighting the necessity of a comprehensive evaluation against in situ observational records. Using records from 85 stations (1960–2022), we evaluated four products: China’s 1 km monthly dataset (CN_1km), the Climatic Research Unit gridded Time Series (CRU TS), the fifth-generation European Centre for Medium-Range Weather Forecasts land reanalysis (ERA5-Land), and TerraClimate—selected for their long-term continuity, diverse product types, and widespread regional applications. Subsequently, we compared these products with Earth System Model (ESM) simulations from the NASA Earth Exchange Global Daily Downscaled Projections based on CMIP6 (NEX–GDDP–CMIP6). This evaluation was conducted using key statistical metrics, including the coefficient of determination (R2), root mean square error (RMSE), Kling–Gupta efficiency (KGE), and bias, together with spatially distributed long-term trend analysis using the Sen’s slope estimator and Mann–Kendall test. Station-based evaluation shows that temperature datasets generally outperform precipitation datasets, with monthly mean temperature yielding R2 values of 0.85–0.94, RMSE values of 2.38–4.79 °C, and KGE values ranging from −0.04 to 0.86. Monthly precipitation R2 values of 0.74–0.81, RMSE values of 20.60–36.12 mm, and KGE values of 0.42–0.86. For anomalies, temperature performs better (R2 = 0.41–0.67; RMSE = 0.80–1.41 °C) than precipitation (R2 = 0.28–0.44; RMSE = 16.87–20.73 mm). Overall, CN_1km and TerraClimate provide the most reliable station-based temperature estimates, while TerraClimate shows the most robust precipitation performance. All four datasets consistently indicate warming and wetting trends, with temperature rising at 0.21–0.24 °C decade−1 and precipitation increasing at 4.5–5.8 mm decade−1, featuring stronger warming in the west and greater precipitation increases in the northeast; however, the precipitation trend in ERA5-Land does not reach statistical significance. NEX–GDDP–CMIP6 simulations reproduce comparable warming and moistening signals (0.22–0.23 °C decade−1 and 4.1–4.7 mm decade−1), though their precipitation distribution differs markedly from the other datasets, with the discrepancy primarily reflected in a pronounced latitudinal gradient. These results provide a reference for the selection of climate-forcing datasets in hydrological, ecological, and cryospheric studies across the QTP.

1. Introduction

Air temperature and precipitation are fundamental variables describing weather and climate, playing key roles in surface energy balance and hydrological processes [1,2]. As basic environmental factors for terrestrial ecosystems, temperature and precipitation regulate vegetation growth, phenological dynamics, and associated ecosystem processes [3]. Changes in temperature and precipitation patterns have far-reaching consequences for water resource availability, food security, and the frequency of extreme weather events [4,5]. In particular, warming trends and shifting precipitation regimes have been identified as primary drivers of glacier retreat, permafrost degradation, and runoff variability in high-altitude regions [2,6]. Moreover, accurately characterizing the spatio-temporal variability of temperature and precipitation is essential for understanding land–atmosphere feedbacks and improving the predictive capacity of climate models [7,8,9]. High-accuracy temperature and precipitation datasets are therefore essential inputs for land surface and hydrological models, supporting studies of terrestrial ecosystem processes, precision agriculture, and extreme climate events [4].
Meteorological stations remain the primary source of temperature and precipitation observations, yet their spatial coverage is limited [7]. To address this, various global meteorological datasets have been developed through data assimilation, algorithm improvements, and multi-source fusion [10,11,12,13,14,15]. These primary sources can be broadly categorized into:
  • Global atmospheric reanalysis products, such as the fifth-generation European Centre for Medium-Range Weather Forecasts (ECMWF) reanalysis ERA5 and the Japanese 55-year Reanalysis (JRA–55) from the Japan Meteorological Agency (JMA).
  • Satellite-based precipitation estimates, including the Climate Prediction Center MORPHing technique (CMORPH) and the Precipitation Estimation from Remotely Sensed Information using Artificial Neural Networks (PERSIANN).
  • Multi-source merged products, such as the CRU TS and the Multi-Source Weighted-Ensemble Precipitation (MSWEP) [5,6,7]. At the regional scale, high-density station data have enabled the creation of refined and high-resolution datasets over China, such as the Tibetan Plateau Meteorological Forcing Dataset (TPMFD), the China Meteorological Forcing Dataset (CMFD), and China’s 1 km monthly temperature and precipitation datasets [11].
Ground-based meteorological observations, reanalysis products, and satellite-derived datasets each serve distinct but complementary roles in climate research. In situ station observations provide direct, point-scale measurements of temperature and precipitation with high temporal resolution and are widely regarded as the reference standard for dataset validation. However, their spatial representativeness is constrained by the density and distribution of the station network, which is particularly sparse over high-altitude, oceanic, and remote areas [7]. In contrast, reanalysis products offer spatially continuous, physically consistent climate fields by assimilating diverse observational streams into numerical weather prediction models; however, they are prone to systematic biases arising from model parameterization errors and the inhomogeneous spatial coverage of assimilated observations [12,13]. Satellite-derived products provide near-global coverage at fine spatial and temporal resolution; however, they rely on indirect physical relationships between remote sensing signals and surface variables, which can introduce retrieval uncertainties [14]. Multi-source merged and machine-learning-based datasets attempt to combine the complementary strengths of station, satellite, reanalysis, and climatological information to reduce random errors and systematic biases [15]. Over the QTP, complex terrain, steep elevation gradients, and the combined influences of monsoon and westerly circulations produce strong spatial heterogeneity in temperature and precipitation. Together with the uneven distribution of meteorological stations, these characteristics further amplify the uncertainties associated with different climate products in this region.
With the rapid growth of reanalysis, satellite, and multi-source gridded datasets, systematic intercomparison and evaluation have become essential. At the global scale, Beck et al. evaluated 22 precipitation datasets and found that gauge-adjusted or merged products generally outperformed single-source products in many regions [16]. Sun et al. reviewed global precipitation datasets and emphasized large differences among products due to input data, retrieval algorithms, and merging strategies [14]. Regionally, Hu et al. assessed temperature changes over Central Asia using multiple datasets [17], Liu et al. evaluated satellite-based precipitation products in an arid basin in northwestern China [18], and Rao et al. compared 11 gridded precipitation products over the Tibetan Plateau, showing that product performance varies substantially with region, timescale, and evaluation metric [19].
The QTP is the world’s highest and largest plateau. Its complex topography and unique land–atmosphere coupling exert profound thermal and dynamical effects on regional and global climate [20,21]. The rate of warming on the QTP has been approximately twice the global average, with observed temperature increases of 0.34–0.44 °C per decade from 1979 to 2020, far exceeding the global mean rate of 0.19 °C per decade [20]. Precipitation variability on the QTP is governed by the competing influences of the South Asian monsoon and the mid-latitude westerlies. Annual precipitation over the QTP exhibited a statistically significant increase of 4.3 mm per decade from 1961 to 2023, while glacial area declined by 58.37% between 1976 and 2024 and lake area expanded substantially over the same period [21,22,23,24]. Recent multi-dimensional evaluations of gridded precipitation products over the QTP have consistently revealed large discrepancies among products, with CMFD generally outperforming global reanalysis products at the monthly scale, while ERA5-Land tends to overestimate precipitation in high-elevation areas [25,26,27,28,29]. Despite valuable previous evaluations of climate products over the QTP, current assessments still exhibit three notable limitations. First, most evaluations have been confined to relatively short periods, localized sub-regions, or single categories of datasets. Second, previous research had insufficient joint evaluation of monthly anomalies, long-term evolutionary trends, and spatial trend patterns. Third, traditional observation-constrained gridded datasets and ESM are rarely evaluated within a unified comparative framework, making it challenging to ascertain whether the latest Coupled Model Intercomparison Project Phase 6 (CMIP6) historical simulations can objectively reproduce the spatio-temporal climate evolution revealed by observations.
To address the above limitations, this study provides a systematic and comprehensive evaluation of multiple climate products over the QTP, using observations from 85 meteorological stations during 1960–2022 as benchmarks. Four widely used climate products of different types that cover the meteorological observation period and the QTP region—CN_1km, CRU TS, ERA5-Land, and TerraClimate—together with the NEX–GDDP–CMIP6 dataset were selected for evaluation. The assessment focuses on three key questions:
  • To what extent the selected products can accurately reproduce the observed climatological means, monthly anomalies, and long-term trends of temperature and precipitation over the QTP;
  • How the spatial patterns of inter-product differences vary, and which types of products are most susceptible to systematic biases over complex terrain;
  • Whether the historical simulations from NEX–GDDP–CMIP6 can reproduce the spatio-temporal climate evolution revealed by station observations.
By integrating station-based validation, inter-product comparison, and CMIP6 historical simulation assessment, this study provides quantitative guidance for selecting suitable climate products for future climate, ecological, and hydrothermal studies over the QTP.

2. Materials and Methods

2.1. Study Area

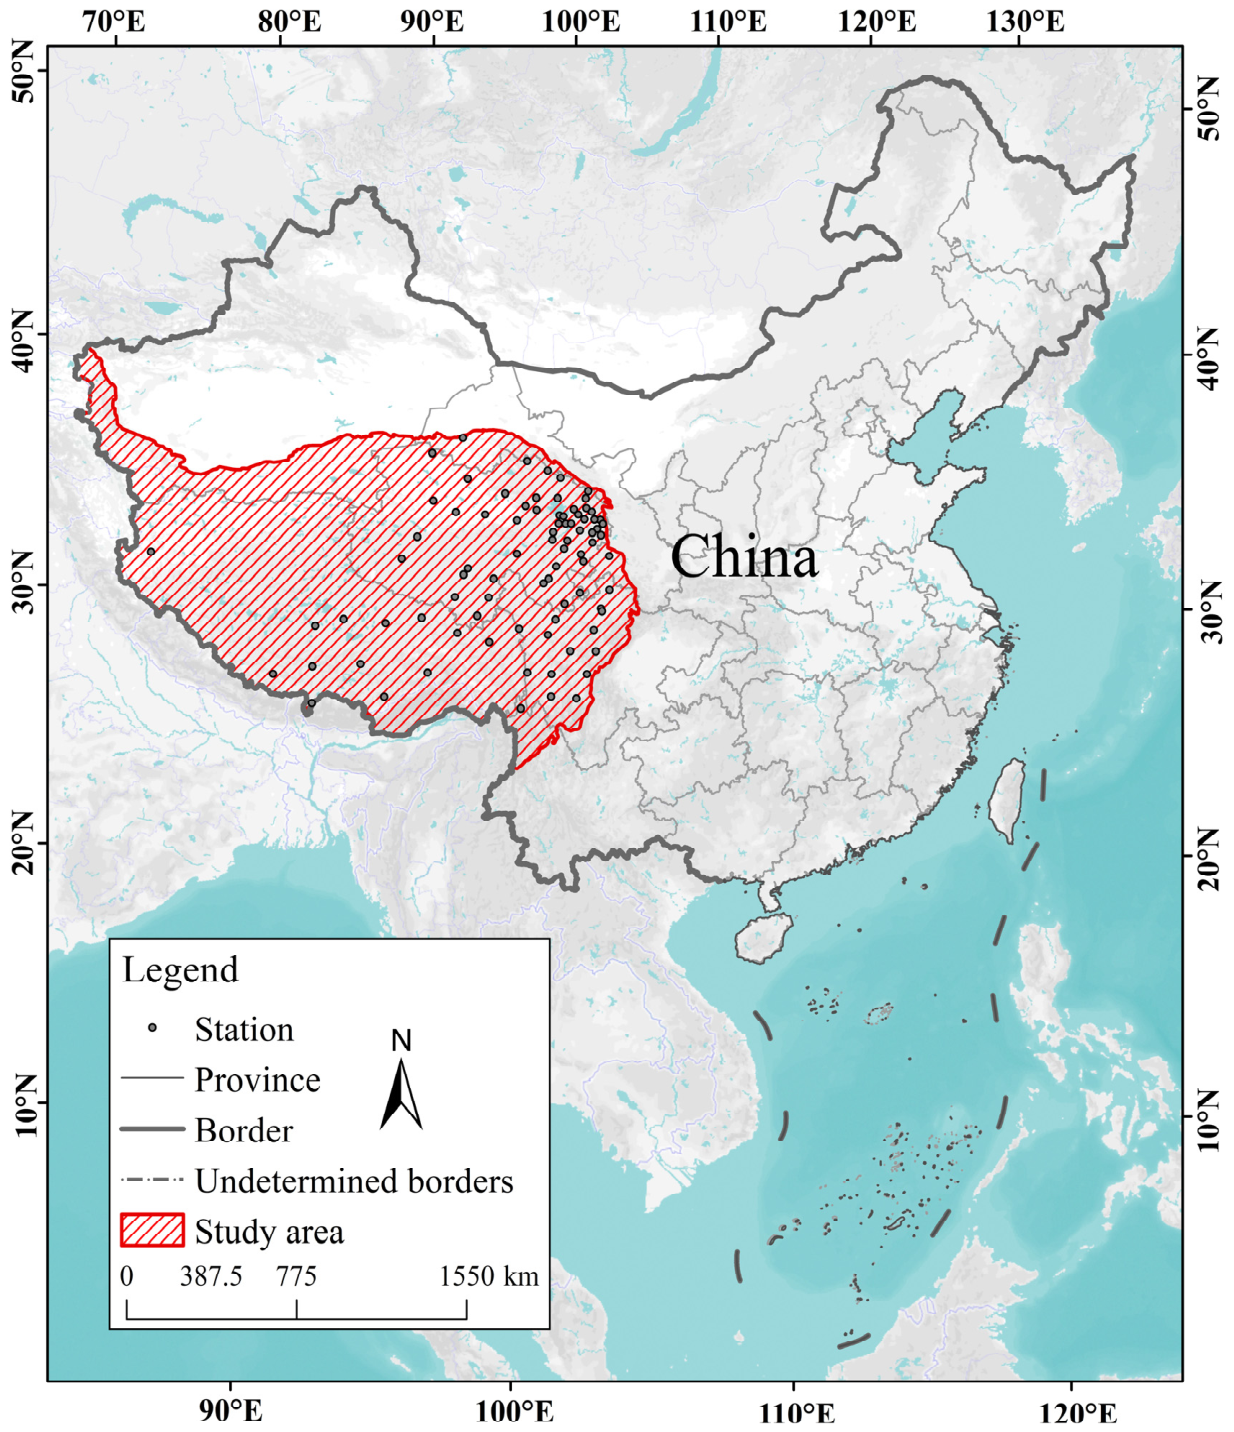
The QTP is located in the interior of Asia (Figure 1), extending from the northern foothills of the West Kunlun and Qilian Mountains in the north to the southern foothills of the Himalayas in the south, with a maximum north–south width of about 1560 km. It stretches from the Hindu Kush and Pamir Plateau in the west to the eastern margin of the Hengduan Mountains in the east, covering a total area of approximately 3.0834 × 10⁶ km2 with an average elevation of about 4320 m [30]. Its unique topography and land surface characteristics profoundly influence both the Asian monsoon system and global climate change through dynamic and thermodynamic processes.

2.2. Gridded Meteorological Datasets

Four long-term, widely used gridded climate datasets were used in this study (Table 1):
  • CN_1km [11]: Developed using the Delta downscaling method based on the CRU 0.5° global climate dataset and the high-resolution WorldClim data, providing monthly temperature and precipitation over China at a 1 km resolution.
  • CRU TS [10]: A 0.5° global gridded dataset covering all land areas except Antarctica, generated using the Angular Distance Weighting (ADW) interpolation from station observations. It provides monthly climate variables since 1901.
  • ERA5-Land [13]: A high-resolution land reanalysis product, employing an improved three-dimensional variational data assimilation system with high temporal-spatial resolution and multi-variable advantages.
  • TerraClimate [31]: A global, high-resolution (monthly) dataset of land climate and water balance variables, developed through the integration of WorldClim, CRU TS, and JRA55 data. Since it only provides minimum and maximum temperature, their mean was used here to represent the average temperature.
In addition, to assess the reliability of ESM simulations over the QTP, we used 18 models from the NEX–GDDP–CMIP6 dataset [32], which were bias-corrected and spatially downscaled using the Bias Correction Spatial Disaggregation (BCSD) method with quantile mapping for cumulative distribution function (CDF) adjustment. It should be noted that while the evaluation for multi-source gridded products covers 1960–2022 based on data availability, the CMIP6 historical experiment analysis is strictly restricted to 1960–2014, in full accordance with the standard CMIP6 historical simulation protocol timeline.

2.3. Station Observation Data

The meteorological station network over the QTP is characterized by highly uneven spatial distribution, with station densities of approximately one per 1 × 10⁴ km2 in the east but only one per 1 × 10⁵ km2 in the west [25]. Most stations are concentrated in valley and low-elevation areas due to infrastructure constraints, which may introduce representativeness biases, particularly for high-altitude grid cells. Nevertheless, satellite-based studies have demonstrated that the spatial coherence scale of annual surface temperature over the QTP reaches 302–480 km, while that of annual precipitation ranges from 111 to 182 km [26], suggesting that the current station network, despite its uneven distribution, is broadly capable of capturing the dominant climatic gradients across the Plateau.
To maximize station retention, extend observational coverage to the data-sparse western part of the QTP, and ensure the temporal continuity and representativeness of station records, the station-based evaluation period was defined as 1960–2022. The endpoint year of 2022 was determined by data availability, as it was the most recent year for which complete, continuous, officially quality-controlled, and publicly usable long-term station records from the China Meteorological Administration (CMA) were available when the core analysis was conducted. Within this period, station observations obtained from the CMA were screened according to three criteria: a continuous observation period of ≥60 years, a relocation frequency of no more than once, and a missing data rate of ≤5%. All retained stations underwent quality control in accordance with the Specifications for Surface Meteorological Observations and the Chinese national standard GB/T 33703 [33], encompassing extreme-value verification, internal consistency checks, and missing-data inspection. Subsequently, the Mann–Kendall (M–K) test was employed to detect abrupt change points in the time series. Ultimately, 85 long-term observation stations were retained as the reference baseline (Figure 1), spanning a broad range of elevations and climatic zones across the QTP.

2.4. Evaluation of NEX–GDDP–CMIP6 Datasets

Given that temperature and precipitation over the QTP are strongly influenced by complex topography and exhibit considerable inter-model differences, we first conducted an outlier diagnostic analysis of the 18 NEX–GDDP–CMIP6 simulations for 1960–2014 to assess their applicability over the Plateau. Following the general practice used in Intergovernmental Panel on Climate Change (IPCC) assessment reports for evaluating multi–model spread, spatial consistency, and fractional area [34], this diagnostic was based on the internal spread of the CMIP6 ensemble rather than on external observational constraints. Specifically, the 18-model ensemble-mean and ensemble-median fields were first constructed for annual temperature and precipitation climatologies. The ensemble mean represents the average response across models, whereas the ensemble median provides a more robust reference that is less sensitive to extreme simulations. For each model, standardized deviations of annual temperature and precipitation climatologies from the ensemble reference fields were calculated at each grid cell. The magnitude, spatial extent, and spatial distribution of large deviations were then examined to identify simulations with spatially extensive anomalies.

2.5. Data Processing

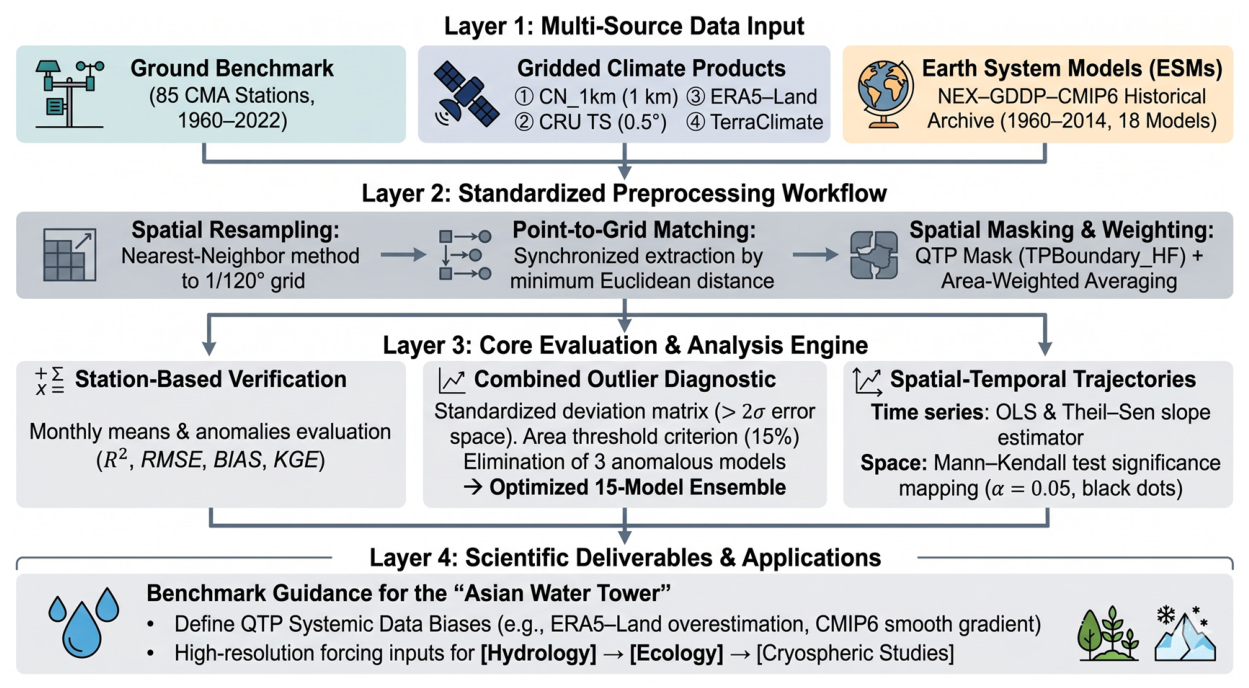
The overall methodological framework of this study is illustrated in Figure 2, which summarizes the data inputs, preprocessing procedures, evaluation metrics, and analytical modules employed across all subsequent analyses.
To harmonize differences in spatial and temporal resolution among datasets, a standardized preprocessing workflow was implemented:
  • To ensure consistency in spatial resolution for subsequent masking, data extraction, and inter-product comparison, all multi-source products were uniformly resampled to a 1/120° grid using the nearest-neighbor method. This procedure was intended to strictly preserve the original grid-cell values and their variance structure. Spatial matching between station observations and multi-source products, as well as the extraction of climatological values, was performed using the grid cell whose geographic center had the shortest Euclidean distance to the corresponding station coordinates.
  • The QTP regional mask was extracted based on the TPBoundary_HF definition from Zhang et al. [30].
  • In this study, an area-weighted averaging scheme was adopted to derive long-term temperature and precipitation time series over the entire QTP for different datasets. This approach effectively circumvents the spatial sampling biases inherent in simple arithmetic grid-averaging or uneven station distributions, thereby ensuring genuine geographic representativeness under the region’s complex topographic conditions.
For temporal consistency, annual means and interannual variability were calculated to analyze trends among datasets. For spatial consistency, we compared spatial patterns across key subregions such as the Himalayas, Qiangtang Plateau, and Hengduan Mountains.
At the station scale, monthly means and anomalies (monthly value minus long-term mean) were extracted to characterize seasonal variation and climate variability.
The agreement between reanalysis data and observations was quantified using the coefficient of determination ( R 2 ), root mean square error ( R M S E ) , mean bias ( B i a s ) and Kling–Gupta efficiency (KGE) [35,36], calculated as follows:
R 2 =   i = 1 n   x i x y i y i = 1 n   ( x i x ) 2 i = 1 n   ( y i y ) 2 2
R M S E = 1 n i = 1 n   ( x i y i ) 2
B i a s = 1 n i = 1 n   x i y i
K G E = 1 ( r 1 ) 2 + ( β 1 ) 2 + ( γ 1 ) 2
where x i and y i denote the gridded dataset value and station observation, respectively. A positive bias indicates overestimation, whereas a negative bias indicates underestimation. Respectively ( x ¯ ) and ( y ¯ ) are their corresponding means, and n is the number of valid paired station–month samples. In the KGE formulation, r represents the Pearson correlation coefficient between the simulated and observed values, which measures their linear correlation; β denotes the bias ratio, defined as the ratio of the simulated mean ( μ s ) to the observed mean ( μ o ); and γ represents the variability ratio, defined as the ratio of the simulated coefficient of variation ( C V s = σ s / μ s ) to the observed coefficient of variation ( C V o = σ o / μ o ). Here, σ s and σ o denote the standard deviations of the simulated and observed fields, respectively.

2.6. Trend and Statistical Significance Analysis

Long-term temporal trends were estimated independently for each grid cell and station record using the Theil–Sen slope estimator, and their statistical significance was assessed using the non-parametric Mann–Kendall (M–K) test. For the four gridded products and station-based evaluation, the trend analysis covered 1960–2022, whereas the NEX–GDDP–CMIP6 historical simulations were analyzed over 1960–2014. The resulting grid-cell trend fields and station-based trend estimates were used to examine the spatial distribution of warming and wetting trends across the QTP. The estimated annual slopes were multiplied by 10 and expressed as °C decade−1 for temperature and mm decade−1 for precipitation to represent decadal variation rates. Statistical significance was evaluated at the 0.05 level, where black dots on the spatial maps represent grid cells with significant trends (p < 0.05, M–K test).
The Sen’s Slope estimator is mathematically formulated as:
β = median x j x i j i , i < j
where x i and x j represent the meteorological variable values at time steps i and j, respectively, and β > 0 indicates a warming or wetting trend.
The test statistic S of the M–K test is defined as follows:
S = i = 1 n 1 j = i + 1 n sgn x j x i
where sgn x j x i is the sign function, calculated as:
sgn x j x i = + 1 ,    i f   x j x i > 0 0 ,      i f   x j x i = 0 1 ,   i f   x j x i < 0
When the sample size n ≥10, the statistic S approximately follows a standard normal distribution. Its variance, denoted as Var S , is computed by accounting for potential tied groups in the dataset:
Var S = n n 1 2 n + 5 m = 1 k t m t m 1 2 t m + 5 18
where k is the number of tied groups, and t m  represents the number of data points in the m-th tied group. Subsequently, the standardized test statistic Z c is derived as follows:
Z c = S 1 Var S ,    i f   S > 0 0 ,                     i f   S = 0 S + 1 Var S ,    i f   S < 0
In a two-tailed trend test, the null hypothesis of no trend is rejected at the 95% confidence level if | Z c | ≥ 1.96.

3. Results

This section presents a systematic evaluation of four climate products and global downscaled simulations over the QTP. First, Section 3.1 benchmarks four mainstream gridded products against 85 homogenized station records to evaluate their point-to-grid statistical accuracy and anomalies. Section 3.2 expands this to a regional scale, analyzing historical spatial–temporal trends and gradients from 1960 to 2022. Section 3.3 then introduces a combined outlier framework to screen anomalous NEX–GDDP–CMIP6 models and optimize the ensemble design, while Section 3.4 cross-examines the screened simulations against multi-source observations to identify data-model mismatches.

3.1. Evaluation of Gridded Datasets Against Station Observations

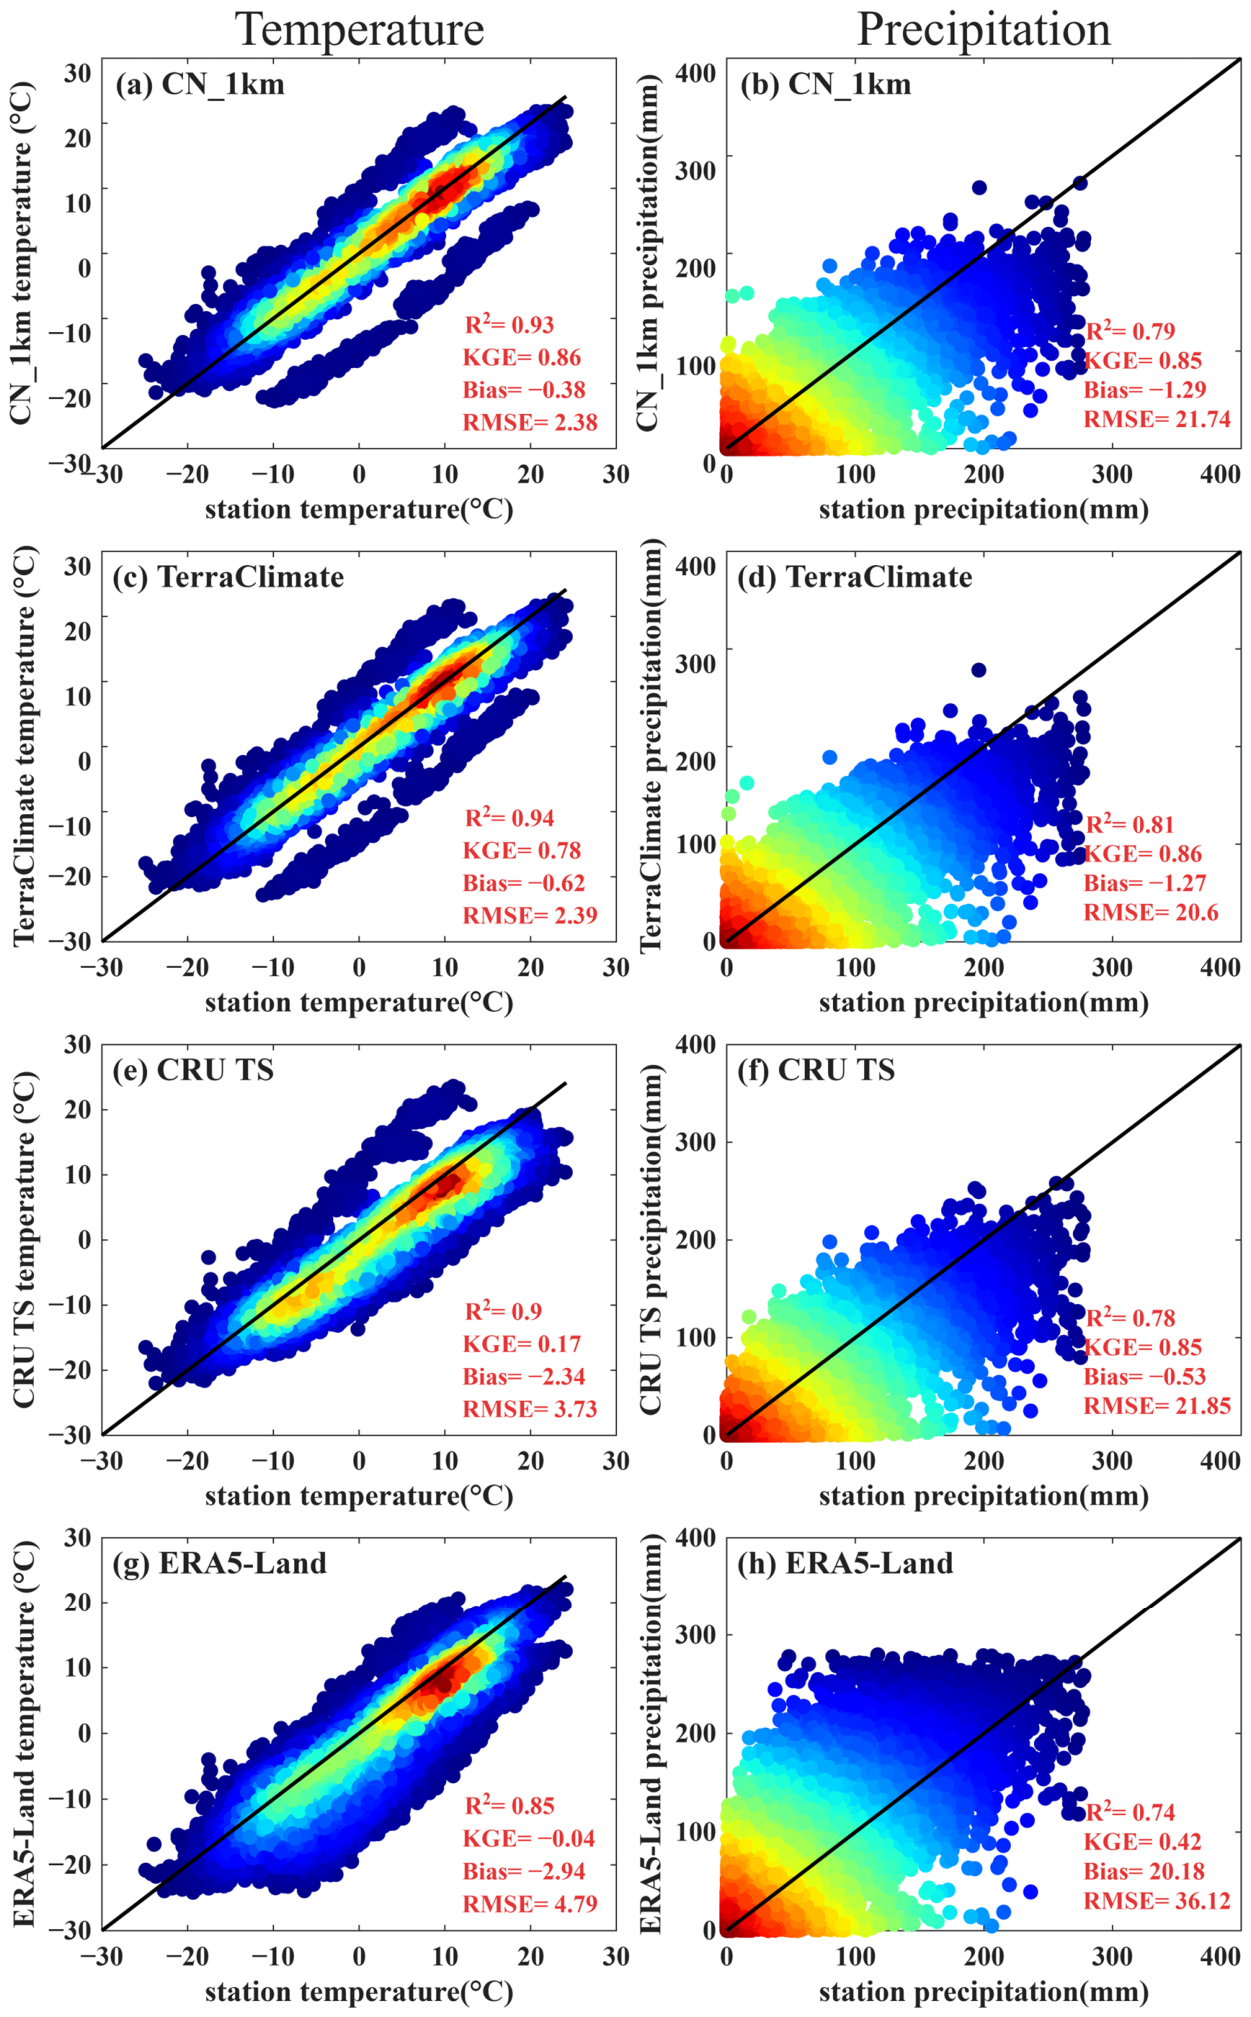
Using in situ temperature and precipitation records from 1960 to 2022 across the QTP, we evaluated the accuracy of four widely used gridded datasets: CN_1km (Figure 3a,b), TerraClimate (Figure 3c,d), CRU TS (Figure 3e,f), and ERA5-Land (Figure 3g,h). Figure 3 presents density scatterplots of monthly mean temperature and monthly precipitation totals benchmarked against station observations.
For temperature, CN_1km and TerraClimate showed the best overall agreement with station observations. CN_1km and TerraClimate yielded high R2 values of 0.93 and 0.94, low RMSE values of 2.38 °C and 2.39 °C, and relatively small cold biases of −0.38 °C and −0.62 °C, respectively. CN_1km also showed the highest KGE value of 0.86, followed by TerraClimate with a KGE of 0.78. In contrast, CRU TS and ERA5-Land showed lower temperature performance, with R2 values decreasing to 0.90 and 0.85 and RMSE values increasing to 3.73 °C and 4.79 °C, respectively. Their lower performance was mainly associated with pronounced systematic underestimation, with biases of −2.34 °C for CRU TS and −2.94 °C for ERA5-Land, resulting in substantially lower KGE values of 0.17 and −0.04, respectively. This underestimation is likely related to station–grid elevation mismatch and the limited ability of coarse- or fixed-grid products to resolve fine-scale valley microclimates and elevation-dependent thermal gradients over the complex terrain of the QTP.
Compared with temperature, precipitation exhibited larger uncertainties across all products. TerraClimate achieved the best overall precipitation performance, with the highest R2 of 0.81, the lowest RMSE of 20.60 mm, a small negative bias of −1.27 mm, and a high KGE of 0.86. CN_1km and CRU TS showed comparable and acceptable performance, with R2 values of 0.79 and 0.78, RMSE values of 21.74 mm and 21.85 mm, and identical KGE values of 0.85, respectively. Both products showed only slight underestimation, with biases of −1.29 mm for CN_1km and −0.53 mm for CRU TS. ERA5-Land showed the weakest precipitation performance, characterized by the lowest R2 of 0.74, the highest RMSE of 36.12 mm, and the lowest KGE of 0.42. This lower efficiency was mainly attributable to a marked positive bias of 20.18 mm, indicating substantial overestimation of monthly precipitation at the station locations over the complex alpine terrain of the QTP. Such overestimation may reflect the difficulty of representing orographic lifting, moisture convergence, cloud microphysics, and convective precipitation processes over steep alpine terrain in reanalysis products.
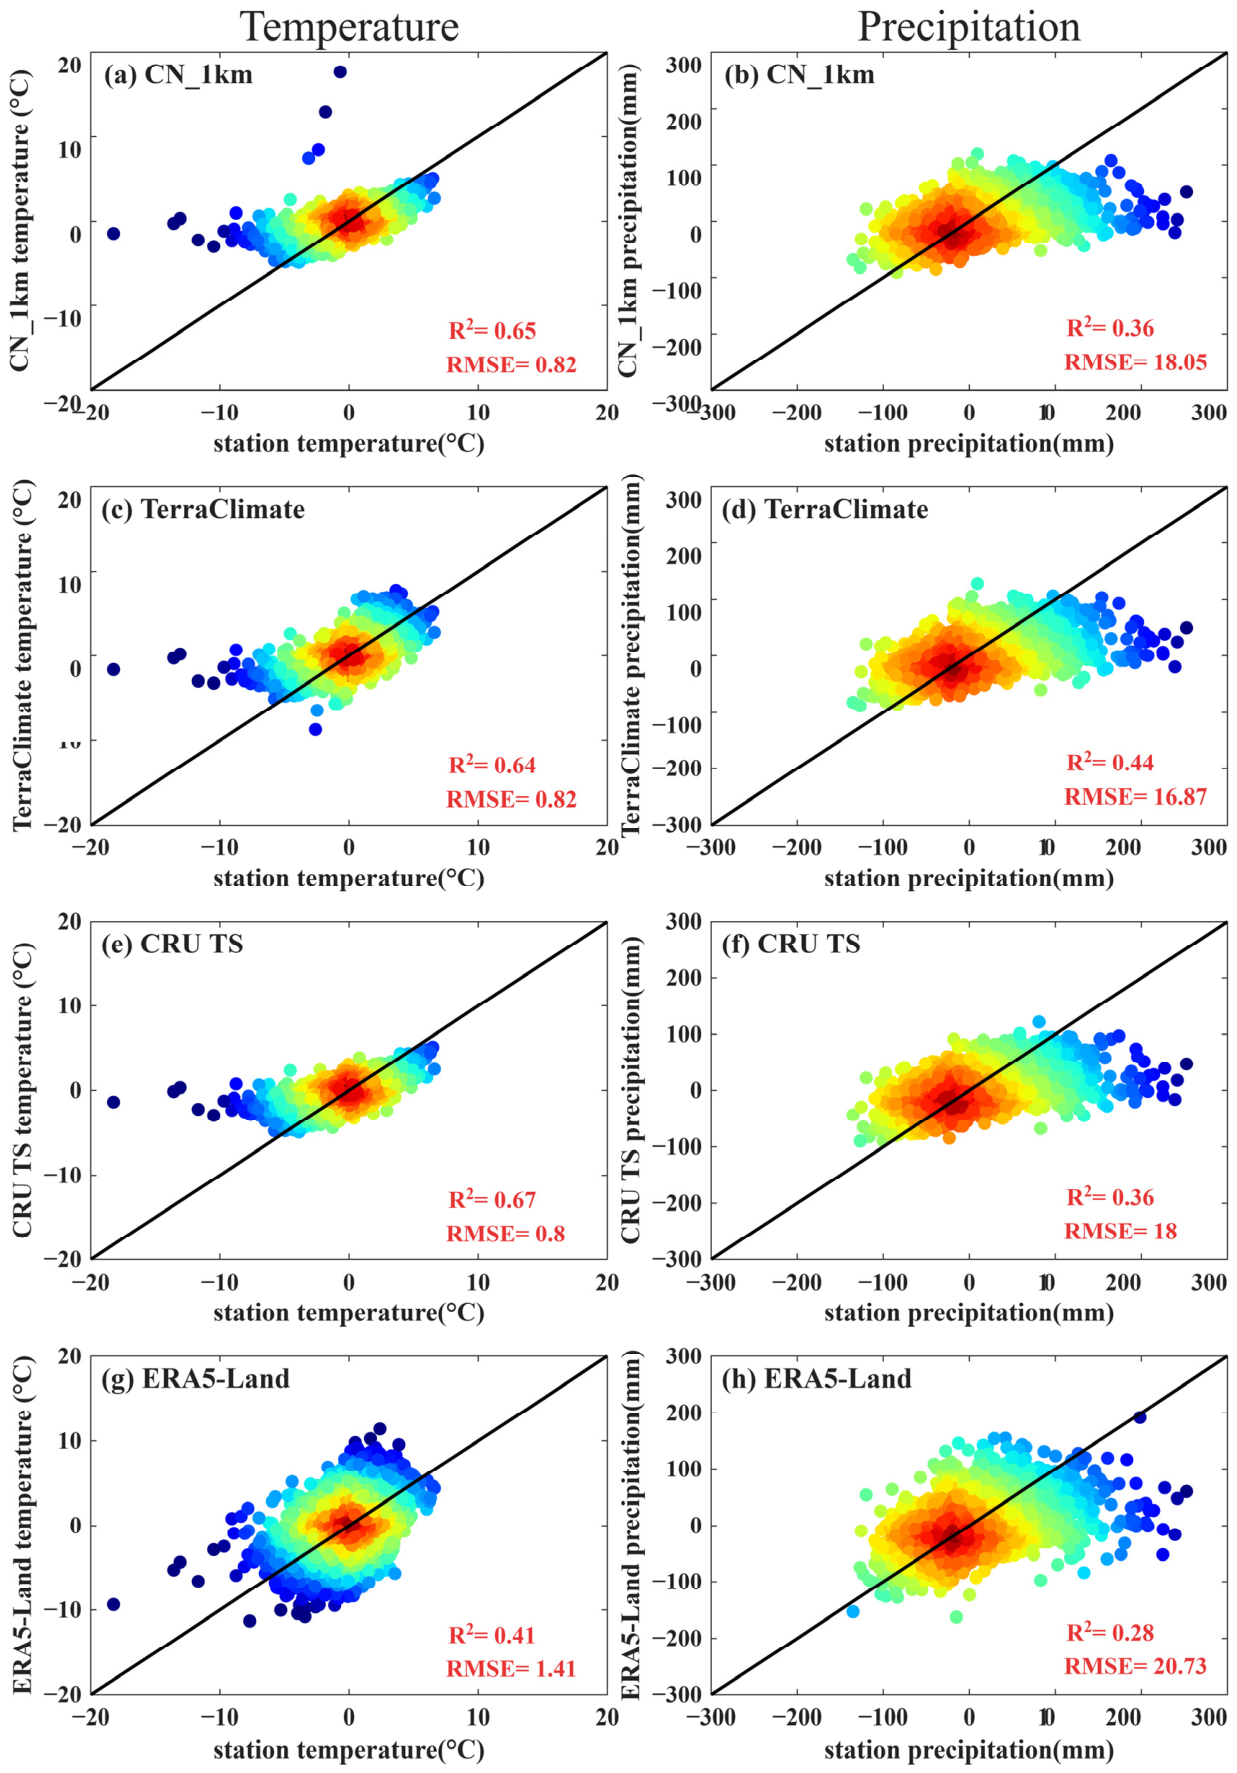
To further evaluate the ability of the gridded datasets to reproduce temporal variability after reducing the influence of mean-state biases and seasonal climatology, we conducted an anomaly-based assessment using station-derived temperature and precipitation anomalies from 1960 to 2022. Figure 4 presents density scatterplots of monthly temperature and precipitation anomalies from CN_1km (a, b), TerraClimate (c, d), CRU TS (e, f), and ERA5-Land (g, h) benchmarked against corresponding station anomalies.
The anomaly-based evaluation revealed similar patterns. For temperature anomalies, CN_1km, TerraClimate, and CRU TS yielded comparable accuracies with RMSE of 0.82 °C, 0.82 °C and 0.80 °C, and R2 values of 0.65, 0.64 and 0.67, respectively. Differences among the three datasets were minor, while ERA5-Land showed substantially poorer agreement (R2 = 0.41; RMSE = 1.41 °C).
For precipitation anomalies, TerraClimate best captured interannual variability (R2 = 0.44; RMSE = 16.87 mm). CN_1km and CRU TS had nearly identical statistics (R2 = 0.36; RMSE = 18.05 mm and 18 mm), whereas ERA5-Land again performed weakest (R2 = 0.28; RMSE = 20.73 mm).

3.2. Regional Variations in Temperature and Precipitation from Multi–Source Datasets

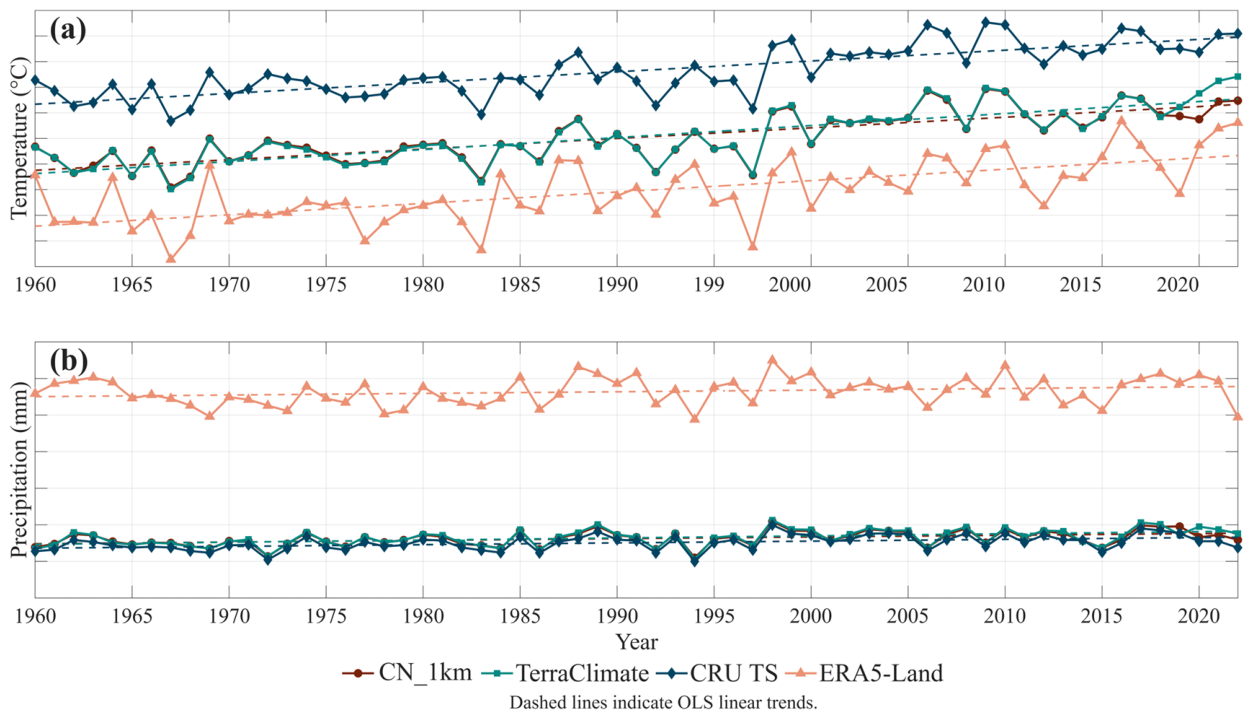
During 1960–2022, all four datasets show a consistent warming trend over the QTP, although their absolute values differ substantially (Figure 5). CRU TS reports the highest mean annual temperature (–1.22 °C), whereas ERA5-Land gives the lowest (–3.57 °C). CN_1km and TerraClimate yield similar means of –2.52 °C and –2.5 °C, respectively. All datasets indicate statistically significant warming, with trends ranging from 0.21 to 0.24 °C decade−1. TerraClimate shows the strongest warming (0.24 °C decade−1), followed by ERA5-Land (0.22 °C decade−1), while CN_1km and CRU TS both show warming rates of about 0.21 °C decade−1.
For precipitation, ERA5-Land gives the highest mean annual total (764.1 mm), whereas CRU TS shows the lowest (351.1 mm). CN_1km and TerraClimate record similar values of 362.6 mm and 364.6 mm, respectively. Annual precipitation exhibits an overall increasing tendency in all four datasets, with trends ranging from 4.5 mm decade−1 to 5.8 mm decade−1. However, statistically significant increases are found only in CN_1km, TerraClimate, and CRU TS, while the ERA5-Land increase is not significant at the 0.05 level. Overall, these results indicate that warming over the QTP is robust across datasets, whereas the wetting trend is comparatively weaker and more uncertain. Solid lines indicate area-weighted annual regional series, and dashed lines represent Theil–Sen slope estimator. All temperature trends are statistically significant at the 0.05 level, whereas for precipitation only CN_1km, TerraClimate, and CRU TS show significant positive trends.
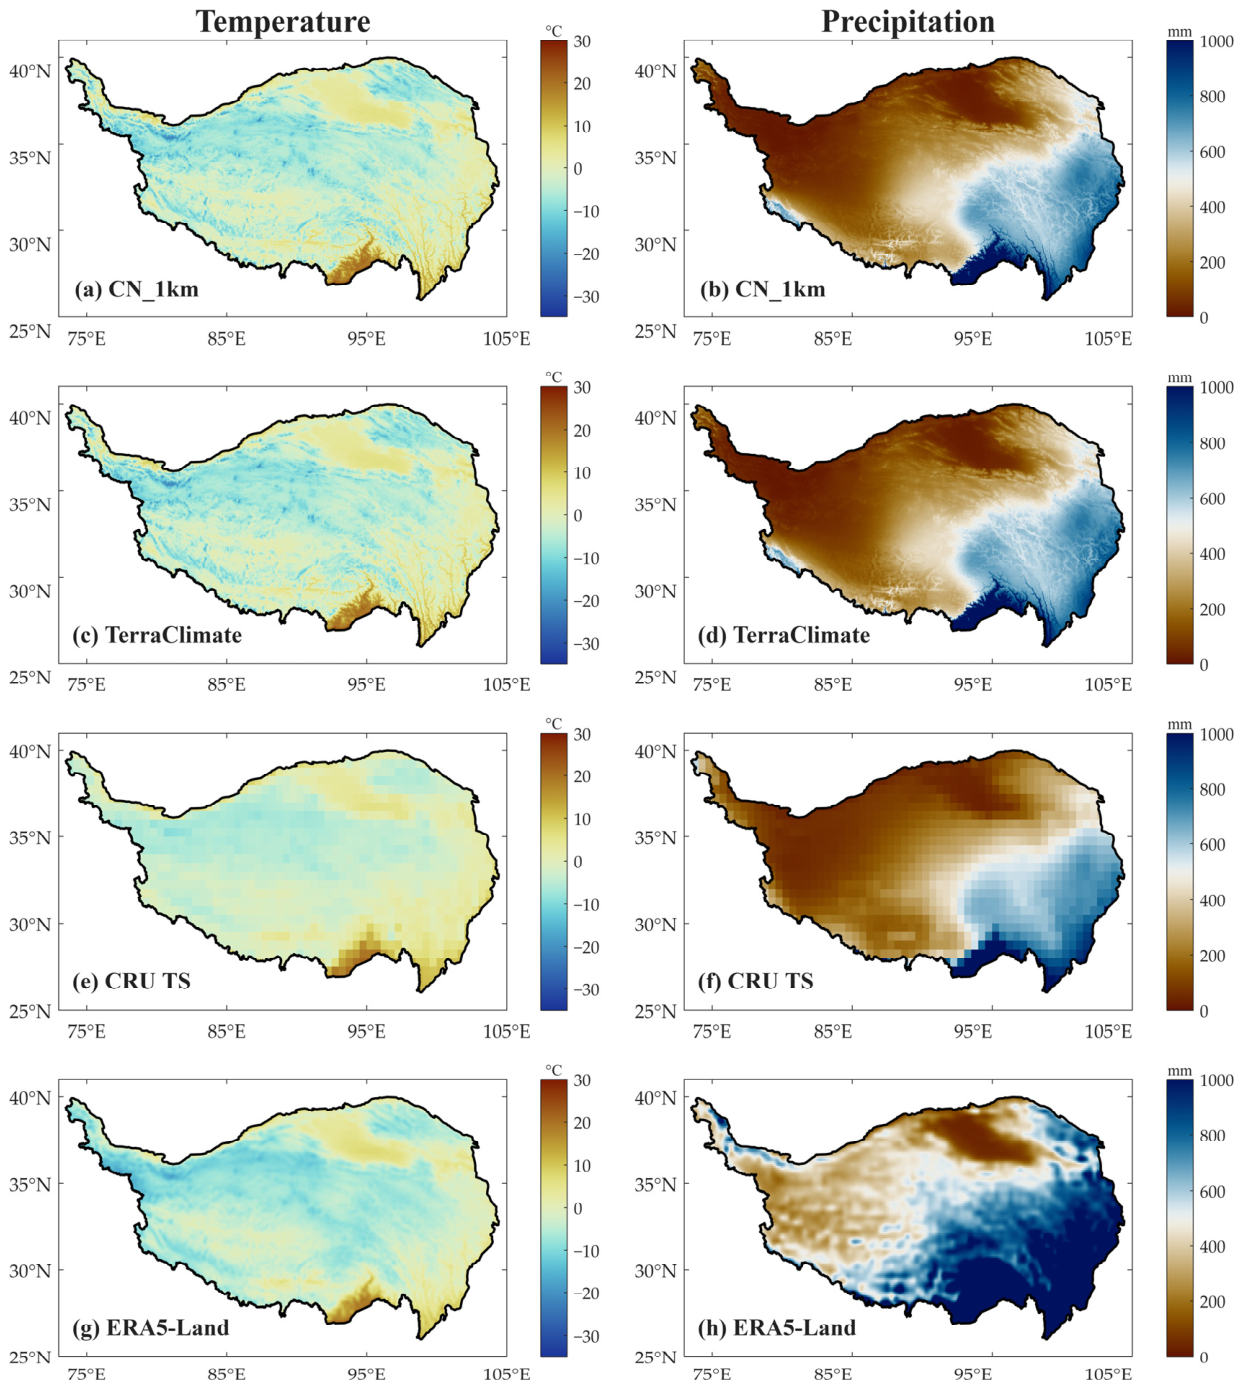
The colors in Figure 6 indicate the multi-year mean values of temperature and precipitation. The spatial distribution of mean temperature shows a clear northwest-to-southeast gradient, consistent with the combined effects of elevation and latitude. Most eastern regions exhibit mean annual temperatures above 0 °C, whereas the western and high-elevation areas remain below –5 °C. Considerable spatial heterogeneity appears among datasets, particularly in high mountain regions, reflecting the different sensitivities of reanalysis and observation-based products to complex terrain. The spatial distribution of precipitation similarly increases from northwest to southeast. CN_1km, CRU TS, and TerraClimate share comparable patterns, with most areas receiving less than 600 mm annually, while ERA5-Land extends the high-precipitation zone above 900 mm into southeastern Tibet, northwestern Yunnan, and western Sichuan.
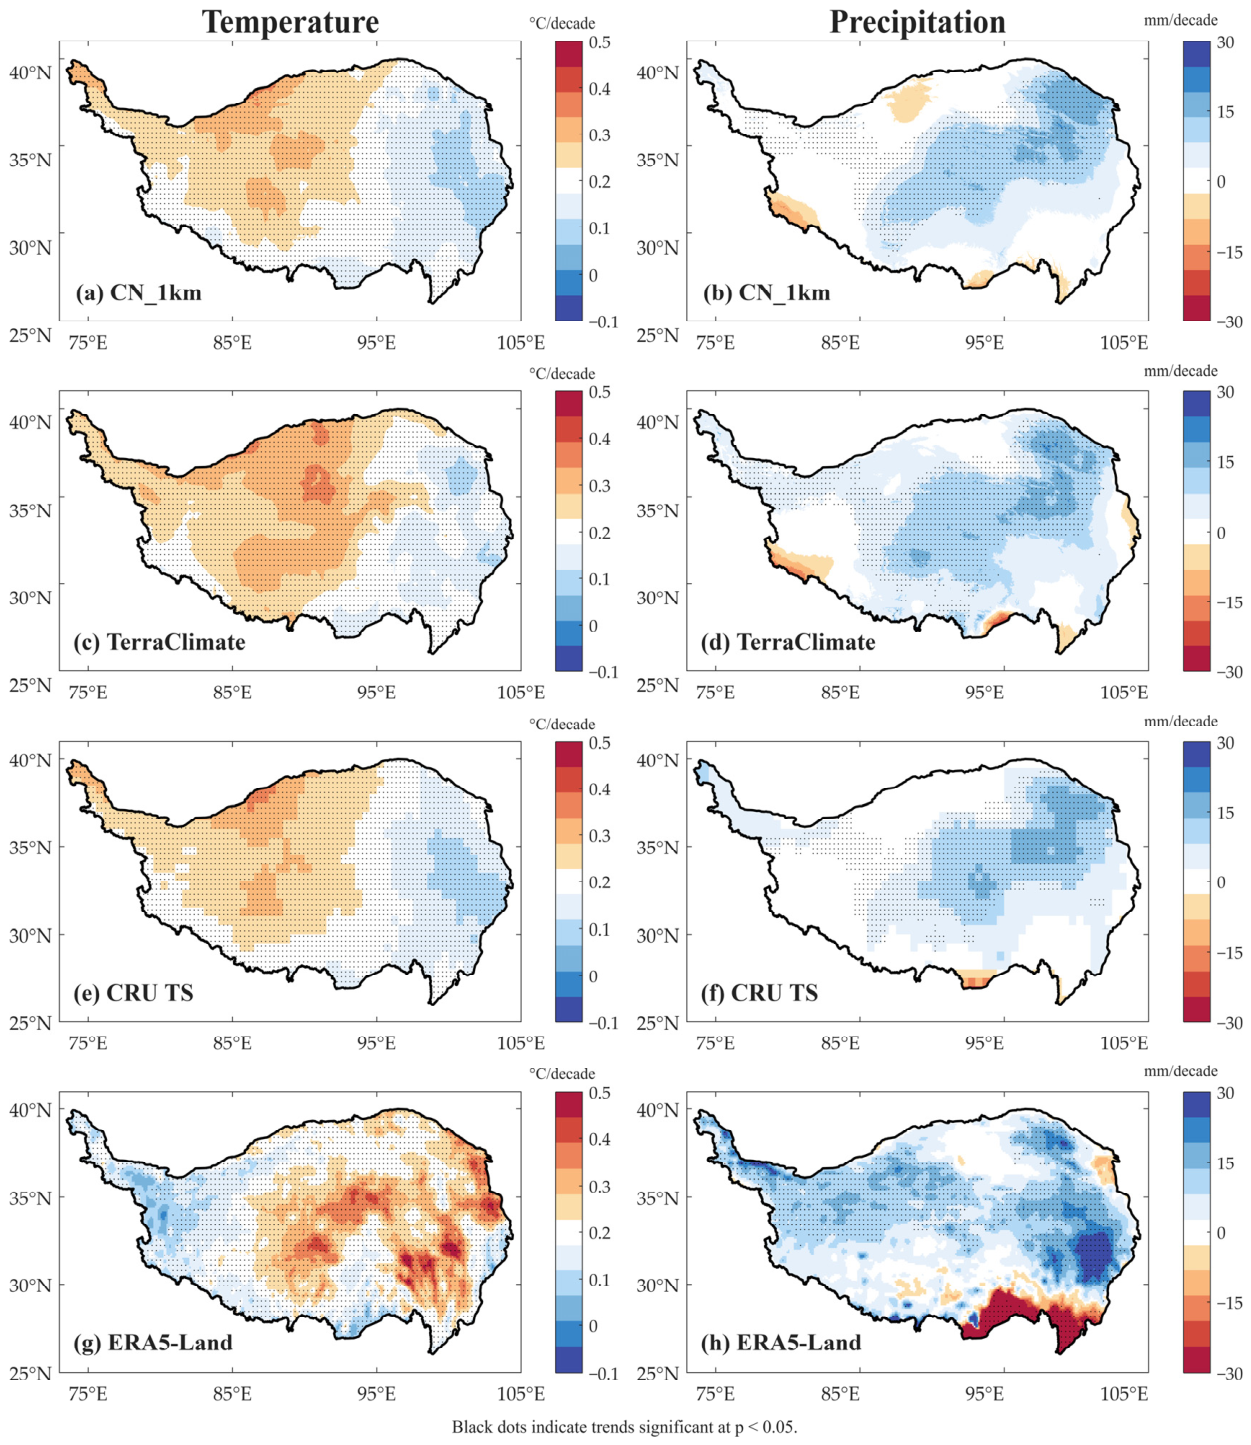
The spatial trends of temperature and precipitation further reveal both consistent climate-change signals and pronounced regional heterogeneity across the QTP (Figure 7). Colors indicate trend magnitudes estimated by the Theil–Sen slope estimator. Black dots indicate grid cells where the trends are statistically significant at the 0.05 level based on the M–K test.
For temperature, all four datasets show a coherent warming pattern, with statistically significant warming covering most of the Plateau. CN_1km, TerraClimate, and CRU TS exhibit broadly similar spatial structures, with stronger warming mainly located over the western, northern, and central parts of the QTP, generally reaching 0.3–0.4 °C decade−1. In contrast, relatively weaker warming appears over parts of the eastern and southeastern Plateau. ERA5-Land shows a somewhat different pattern, with weaker warming over the western Plateau but stronger and statistically significant warming over the central, eastern, and northeastern QTP, locally reaching 0.4–0.5 °C decade−1.
Compared with temperature, precipitation trends show larger spatial variability and stronger dataset dependence. CN_1km, TerraClimate, and CRU TS consistently indicate increasing precipitation over the northern, northeastern, and parts of the eastern QTP, with trend magnitudes generally ranging from 10 to 30 mm decade−1. The statistically significant wetting areas are mainly concentrated in the northern and northeastern Plateau. Localized drying appears along the southern and southwestern margins, but these negative trends are less spatially extensive and generally less consistent among datasets. ERA5-Land presents a more heterogeneous precipitation pattern, characterized by widespread wetting over the northern, western, and eastern Plateau and a pronounced drying belt along the southern to southeastern margins. These results indicate that warming is a robust and spatially widespread signal across datasets, whereas precipitation changes are more regionally variable and more sensitive to dataset-specific representations of terrain and moisture processes.

3.3. Outlier Diagnosis and Ensemble Construction of NEX–GDDP–CMIP6 Simulations

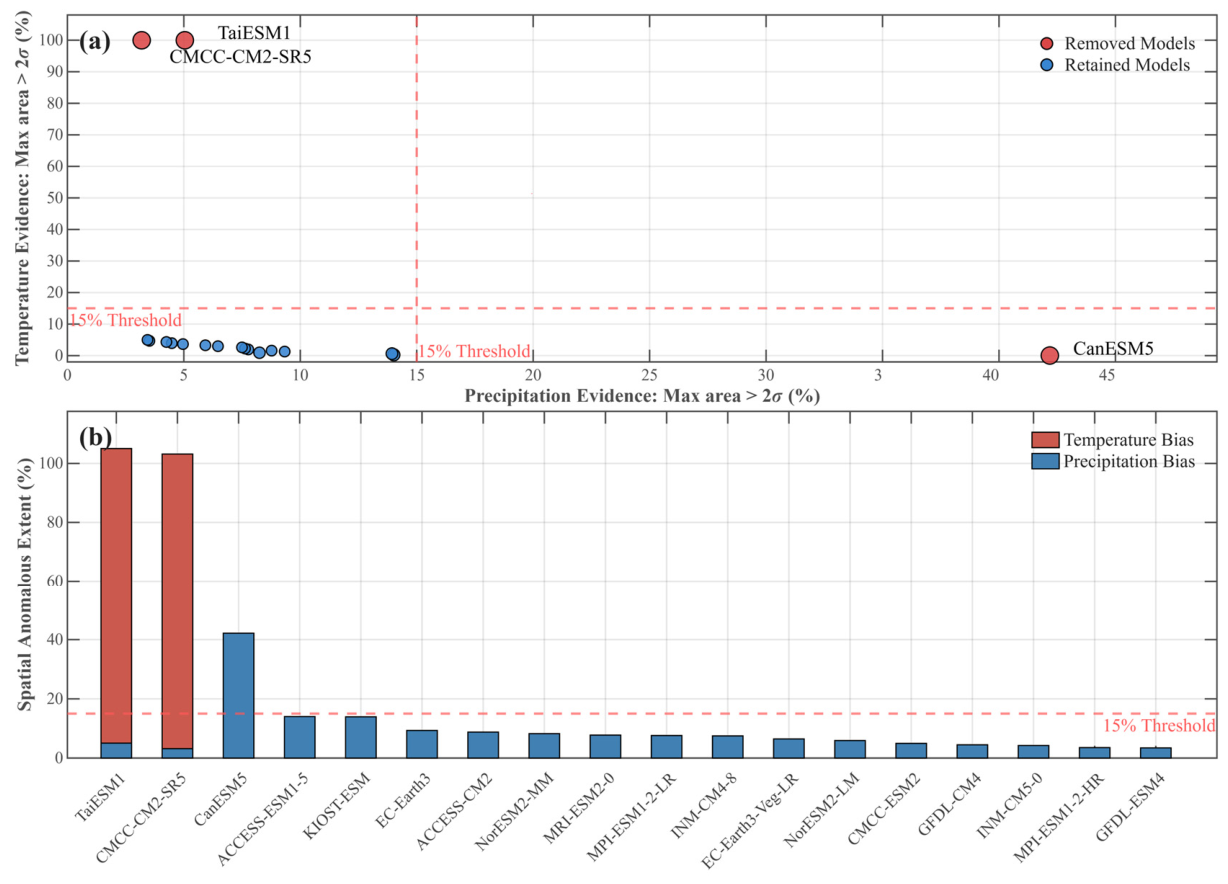
Before evaluating the NEX–GDDP–CMIP6 historical simulations, we first examined the inter-model spread of the 18 ESM simulations over the QTP during 1960–2014. As illustrated in the combined outlier diagnostic framework (Figure 8), the models exhibit a distinct separation in their spatial deviation behaviors. In Figure 8a, the x-axis represents precipitation evidence and the y-axis represents temperature evidence. Red and blue circles denote removed and retained models. The dashed red lines indicate the 15% reference threshold. The diagnostic indicated that CanESM5 exhibited substantial precipitation deviations, prominently isolated in the high-precipitation-bias quadrant of the two-dimensional evidence space with anomalous spatial extents reaching 42.2% and 39.2% of the study area for the mean and median precipitation, respectively, alongside a maximum precipitation sensitivity score of 18. Conversely, TaiESM1 and CMCC–CM2–SR5 showed pronounced temperature deviations, clustering at the extreme upper boundary of the diagnostic plot, each covering an extreme 100% of the area for both mean and median temperature metrics and recording a temperature sensitivity score of 18 (Table 2). In Figure 8b, blue and red bars indicate precipitation and temperature components. The dashed red line denotes the 15% reference threshold. The stacked spatial anomalous extent further emphasizes that these three outlier models exceed the 15% diagnostic reference threshold. The 15% diagnostic reference threshold was defined as a conservative area-based criterion for identifying spatially extensive model anomalies. Specifically, it denotes the fractional area of the QTP in which a model exhibits standardized deviations exceeding 2σ. Under a normal distribution, such deviations would theoretically be expected to occur over only a small fraction of the domain; therefore, a 15% threshold was adopted to distinguish spatially coherent and potentially systematic model biases from localized or random deviations. This threshold was used as a diagnostic reference rather than a formal statistical significance level. The outlier models were driven almost entirely by their respective single-variable biases. These deviations were spatially coherent and could exert disproportionate influences on the ensemble statistics and spatial trend assessment. Therefore, these three simulations were excluded from the screened ensemble. The remaining 15 models were retained for the subsequent CMIP6 analysis.
Individual ESMs can exhibit substantial simulation uncertainty because of differences in model structure, physical parameterizations, and internal variability. Multi-model ensemble approaches are therefore commonly used to reduce model-specific random errors and improve the robustness of climate simulations [37]. In this study, both ensemble-mean and ensemble-median approaches were applied in the subsequent analyses. The ensemble mean reflects the average response across the retained models but may still be influenced by extreme simulations, whereas the ensemble median provides a robust estimate of the central tendency by reducing the influence of outliers. Comparing these two ensemble measures allows us to evaluate the robustness of the CMIP6-based results and to identify whether the simulated temperature and precipitation changes are sensitive to model-dependent anomalies.

3.4. Evaluation of the NEX–GDDP–CMIP6 Historical Dataset

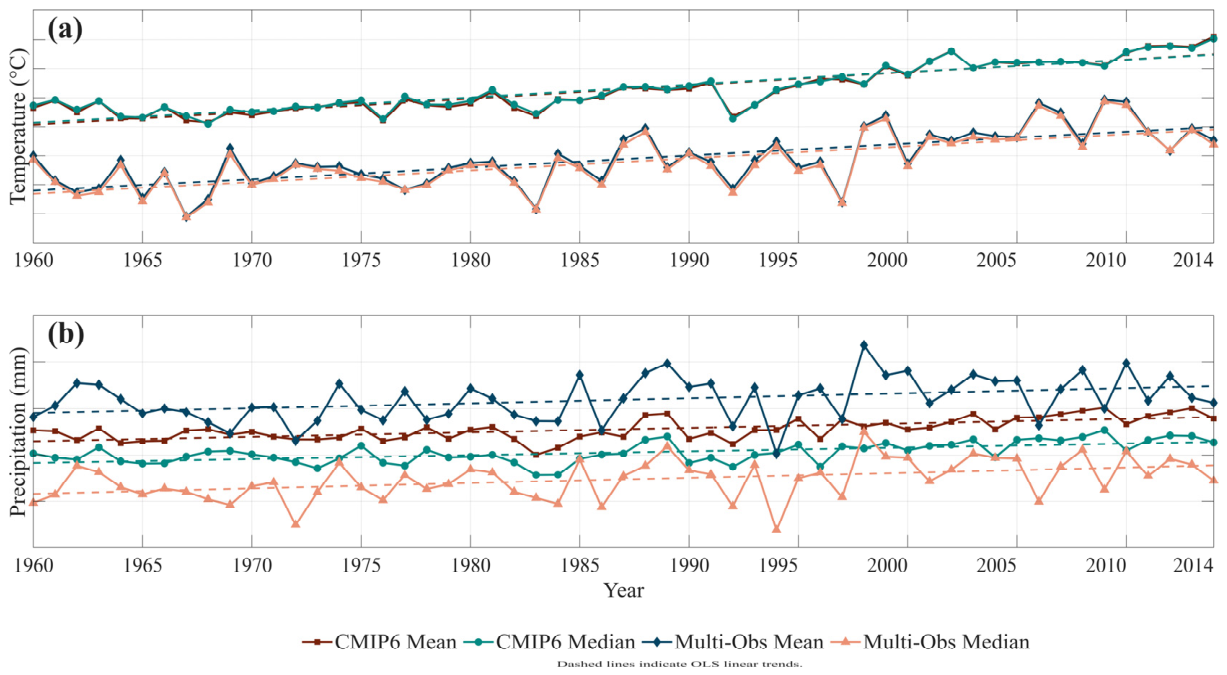
Figure 9 illustrates the interannual variations in the mean and median temperature and precipitation derived from the NEX–GDDP–CMIP6 dataset and the four multi-source gridded datasets from 1960 to 2014. Solid lines indicate area-weighted annual regional series, and dashed lines represent Theil–Sen trend estimates. All reported trends are statistically significant at the 99% confidence level (p < 0.01).
Both CMIP6 and the observation-constrained products indicate statistically significant warming over the QTP. The CMIP6 ensemble mean exhibits a warming rate of 0.23 °C decade−1, while the ensemble median shows a slightly lower but still significant rate of 0.22 °C decade−1. In comparison, the mean and median warming rates from the multi-source observations are 0.22 °C decade−1 and 0.21 °C decade−1, respectively. These results demonstrate that while NEX–GDDP–CMIP6 adequately reproduces the observed warming trend, it displays a slightly stronger warming signal than the observation-constrained datasets.
Regarding precipitation, both CMIP6 and the observational datasets demonstrate statistically significant increasing trends, though they differ in magnitude and uncertainty. The CMIP6 ensemble-mean precipitation increases at a rate of 4.7 mm decade−1, and the median increases at 4.1 mm decade−1, respectively. Although all precipitation trends are highly significant (p < 0.01), the wider confidence intervals for the observational trends indicate greater uncertainty in precipitation trends compared to temperature trends. In the multi-source observations, the difference between the mean and median is substantially larger. This reflects greater spatial or inter-dataset heterogeneity within the observation-constrained precipitation products. Overall, CMIP6 successfully captures the fundamental warming and wetting trajectories over the QTP from 1960 to 2014, but it tends to simulate a slightly stronger warming signal and a weaker precipitation increase relative to the observations.
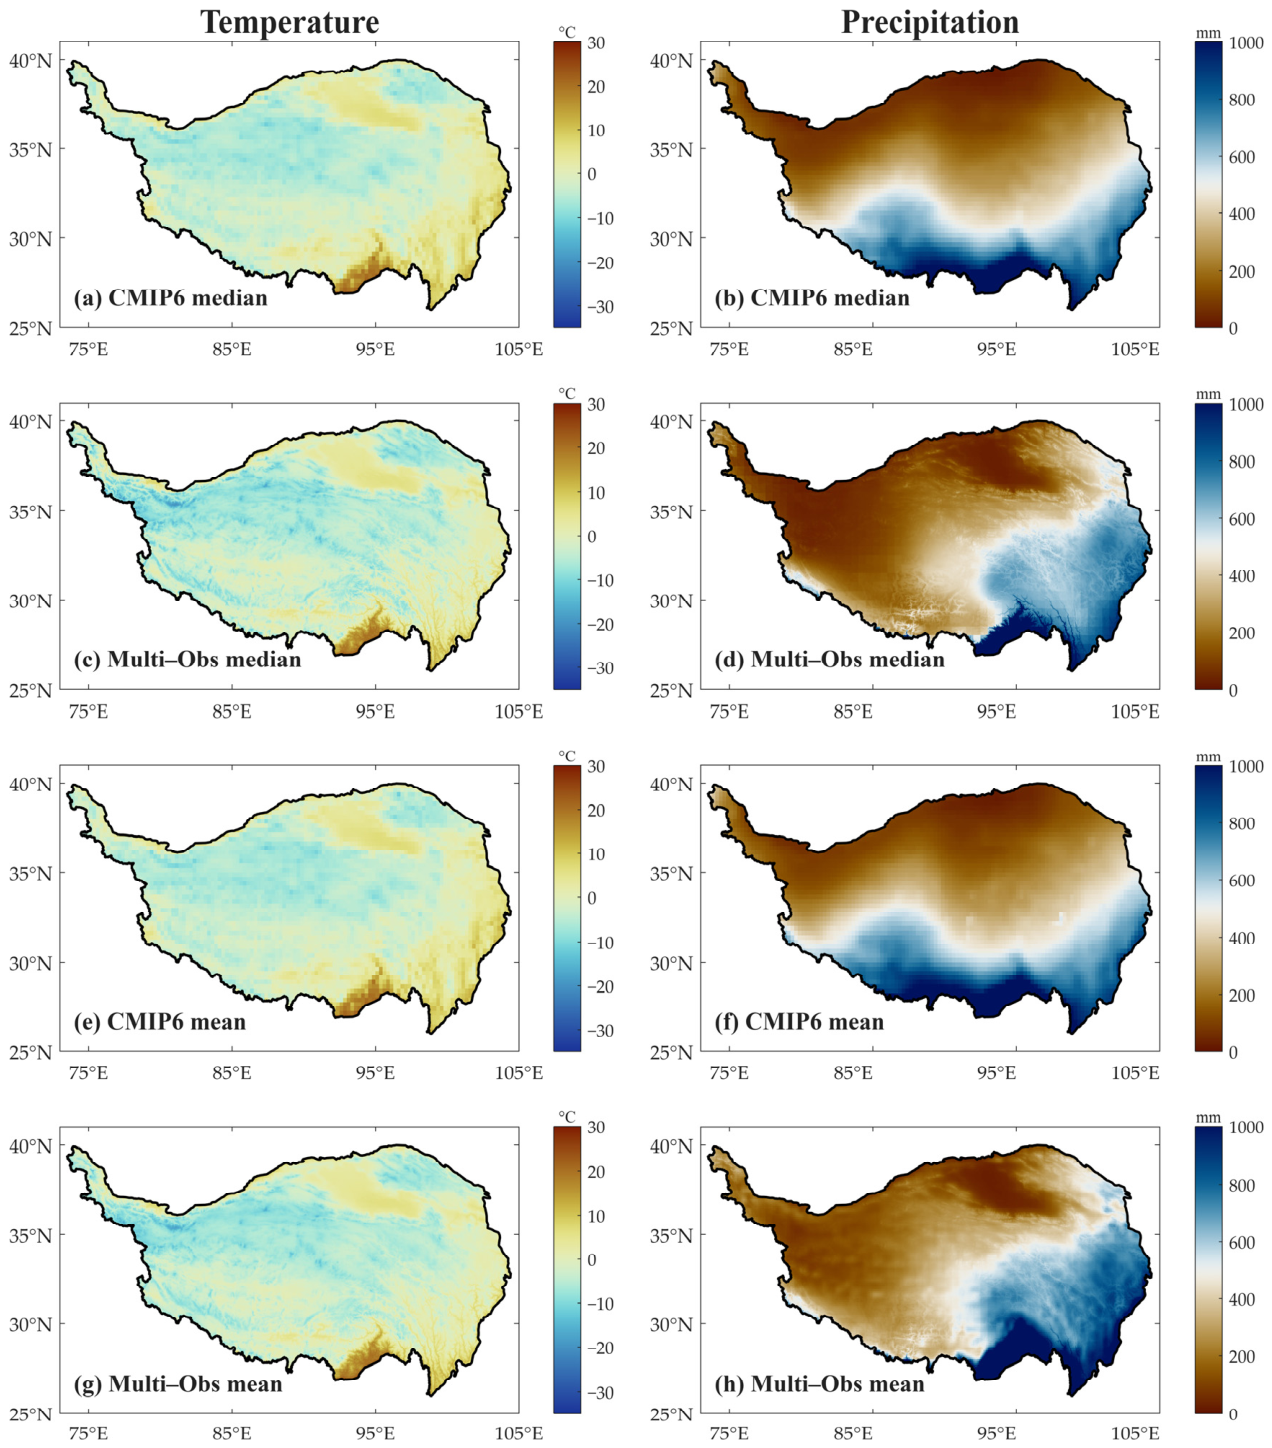
The spatial distributions of the mean and median temperature and precipitation from the NEX–GDDP–CMIP6 dataset and the four contemporaneous observational datasets (hereafter Multi-Obs) are shown in Figure 10, with colors indicating the climatological mean values. Comparisons of the spatial patterns indicate that the NEX–GDDP–CMIP6 simulations successfully capture the broad geographic distributions of both mean and median temperatures. However, a pronounced spatial mismatch is observed over the southern QTP, where the temperature values in the Multi-Obs baseline are markedly warmer than those simulated by CMIP6, highlighting a persistent model cold bias over low-latitude, high-temperature zones.
With respect to precipitation, the NEX–GDDP–CMIP6 dataset exhibits a distinct latitudinal gradient, characterized by a northward-to-southward increase in precipitation. This simulated pattern diverges substantially from the Multi-Obs fields, which exhibit a classic northwest-to-southeast spatial gradient governed by the Indian/East Asian summer monsoon water vapor pathways. Specifically, in the Multi-Obs datasets, low-precipitation areas (~200 mm) are confined to the arid northwestern interior, whereas the prominent orographic rainfall core (~1000 mm) is predominantly concentrated in the Yarlung Zangbo River valley across southeastern Tibet (Shannan and Nyingchi prefectures)—a characteristic feature of QTP precipitation that the relatively coarse CMIP6 grids fail to fully resolve.
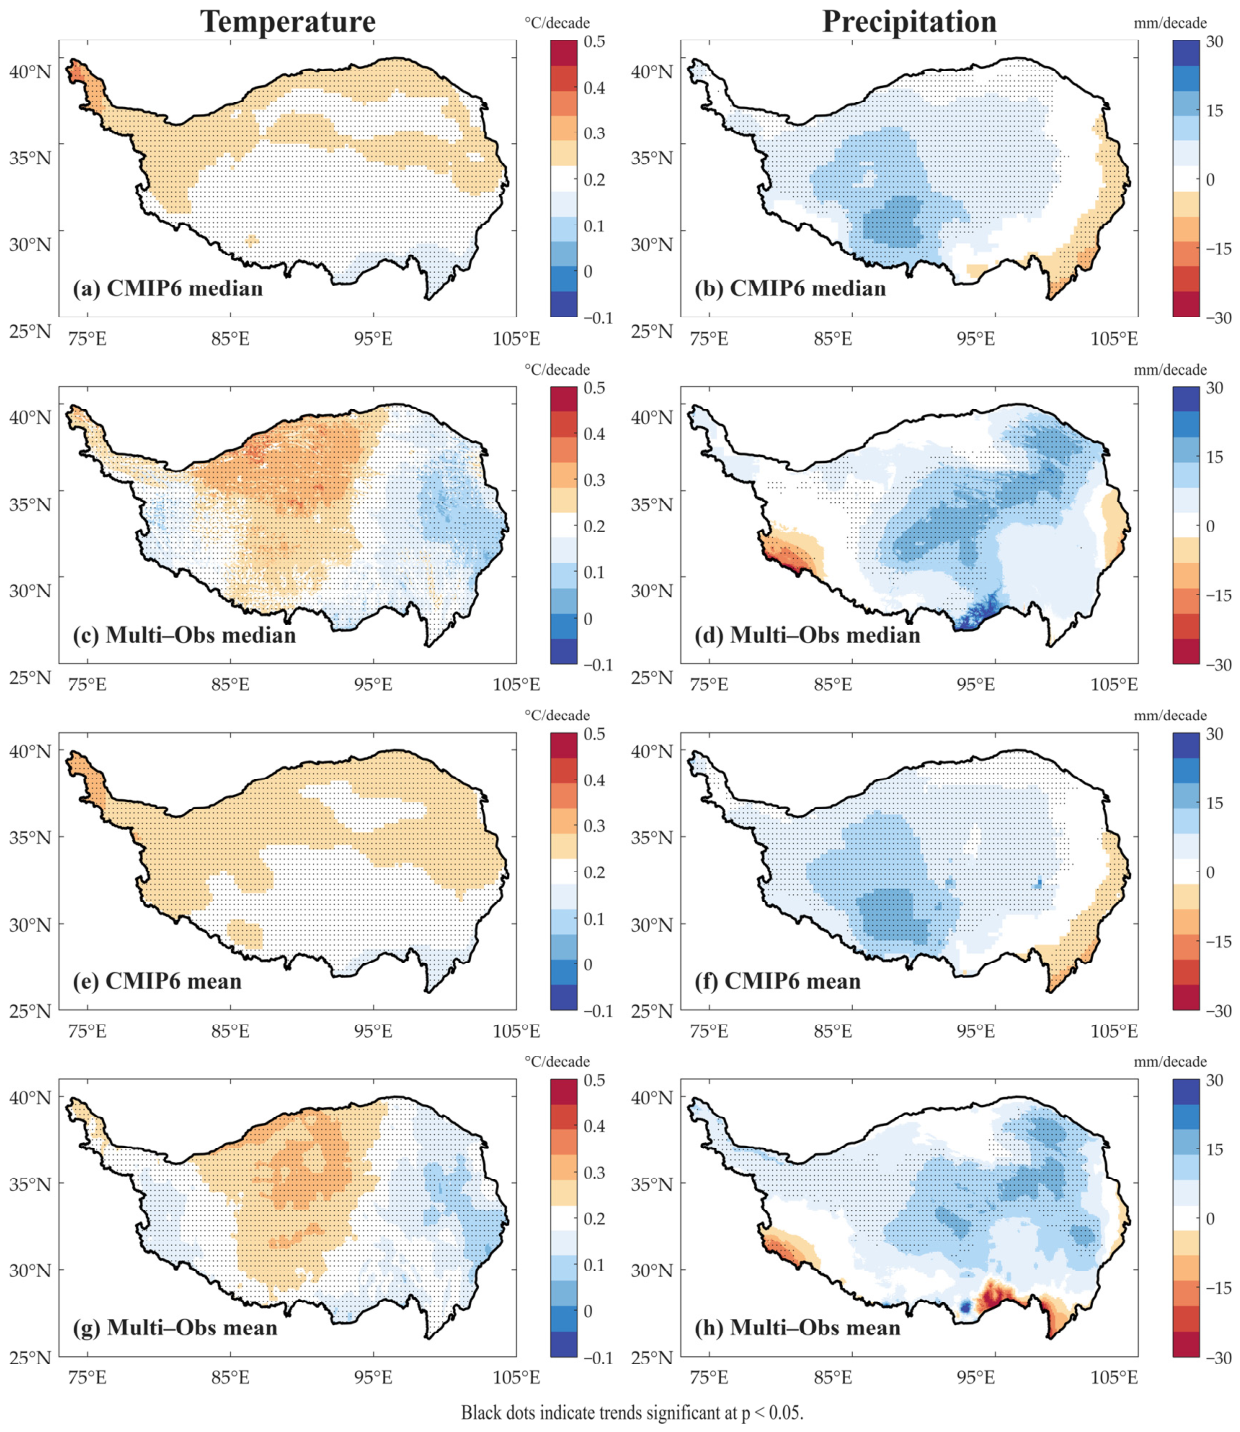
Figure 11 compares the spatial trends in the mean and median temperature and precipitation between NEX–GDDP–CMIP6 and Multi-Obs during 1960–2014. Colors indicate trend magnitudes estimated by the Theil–Sen slope estimator, and black dots indicate grid cells where the M–K trend test is significant at p < 0.05. Both datasets exhibit widespread and statistically significant warming across most of the QTP. However, CMIP6 displays a smoother warming pattern, with relatively stronger warming over the northern and northwestern Plateau, whereas Multi-Obs reveals more pronounced regional contrasts, including enhanced warming over the western, northern, and central Plateau and weaker warming over the eastern and southeastern Plateau.
Precipitation trends show considerably greater spatial discrepancies. CMIP6 locates the main wetting center over the western, central, and northern Plateau, while Multi-Obs indicates more pronounced wetting over the northern, northeastern, and eastern QTP. Drying trends occur predominantly along the southern and southeastern margins, especially in the Multi-Obs mean field. These results suggest that CMIP6 captures the overall warming and wetting tendency over the QTP, but it does not fully reproduce the observed spatial pattern of precipitation changes.

4. Discussion

Ground-based meteorological observations are generally regarded as the closest approximation to surface “truth” and therefore provide an essential benchmark for evaluating the accuracy of climate datasets. However, existing evaluations over the QTP have commonly been constrained by limited spatial and temporal coverage of in situ observations. For example, Li et al. used records from 28 stations for 1980–2018 [38], Huang et al. employed only 17 stations for 2017–2018 [39], Other studies evaluated CMIP6 simulations and multiple gridded precipitation datasets over the QTP [40,41], while Gao et al. included 131 stations but restricted the analysis to 1980–2014 [42], thereby failing to capture longer-term climate variability. In addition, most stations are concentrated in eastern valleys, whereas the high-elevation western and interior Plateau remain poorly represented. Compared with previous assessments that were limited by short observation periods, fewer stations, or single product categories [19,38,39,40,41,42], this study integrates 63 years of observations from 85 national meteorological stations during 1960–2022, covering nearly the full period of modern instrumental meteorological monitoring over the QTP. Moreover, all station records were subjected to standardized quality-control procedures by the national meteorological data center, ensuring a higher level of data reliability than that of many raw observational records used in earlier evaluations.
On this basis, this study systematically evaluated the climatic applicability of four datasets—CN_1km, CRU TS, ERA5-Land, and TerraClimate—over the QTP, and further examined the performance of the NEX–GDDP–CMIP6 multi-model ensemble. The results indicate that temperature products generally perform substantially better than precipitation products, with TerraClimate showing the best overall performance for both variables. All four datasets consistently reveal a pronounced warming and wetting tendency over the past six decades, with air temperature increasing by approximately 0.21–0.24 °C decade−1 and precipitation increasing by approximately 4.5–5.8 mm decade−1. These trends exhibit marked spatial heterogeneity, characterized by stronger warming in the western Plateau and more pronounced wetting in the northeastern Plateau. The NEX–GDDP–CMIP6 multi-model ensemble broadly reproduces the long-term trends in temperature and precipitation, but it shows an overly strong latitudinal gradient in the spatial distribution of precipitation.
The temperature evaluation reveals significant warming across most of the QTP, with stronger increases in the central and western regions than in the eastern Plateau. This pattern is broadly consistent with previous studies on temperature variability, warming amplification, and elevation-dependent warming over the QTP [43,44,45,46]. The superior performance of CN_1km and TerraClimate for temperature is consistent with their explicit use of high-resolution climatological surfaces and station-based constraints [11,31]. CRU TS provides a relatively stable large-scale temperature field, but its coarse spatial resolution limits its ability to resolve fine-scale elevation-dependent thermal gradients [10]. ERA5-Land exhibits a systematic cold bias at station locations, reflecting the known sensitivity of near-surface thermal representation to sub-grid elevation mismatch, land-surface parameterization, and the inability of fixed grids to fully resolve complex alpine valley microtopography [13]. Among all evaluated gridded products, TerraClimate achieves the highest overall statistical performance for both temperature and precipitation anomalies, demonstrating the effectiveness of multi-source statistical fusion that anchors coarse-resolution atmospheric reanalysis fields to local high-resolution climatological surfaces [31].
The precipitation evaluation shows substantially larger inter-product discrepancies. TerraClimate provides the best overall station-scale precipitation performance, while CN_1km and CRU TS also show acceptable agreement with observations. By contrast, ERA5-Land overestimates annual precipitation, yielding the highest regional mean annual precipitation of 764.1 mm and extending the high-precipitation core (>900 mm) into topographically complex marginal regions, including the southeastern Himalayas and the Hengduan Mountains. This overestimation likely reflects a combination of misrepresentation of complex orographic lifting and systematic difficulties in resolving sub-grid cloud dynamics, moisture convergence, and convective processes over steep alpine terrain [13,47,48]. Similar wet biases in ERA5 and ERA5-Land have also been reported in the Yarlung Zangbo River Basin and along the eastern and northwestern margins of the QTP [27,28,29,47]. Beyond mean-state biases, all precipitation products show relatively weak anomaly correlations, indicating that reproducing interannual precipitation variability remains more challenging than reproducing climatological means. This limitation is particularly important over the QTP, where precipitation variability is jointly regulated by the South Asian summer monsoon, mid-latitude westerlies, and complex topographic moisture pathways [22,23,24].
The NEX–GDDP–CMIP6 ensemble broadly captures the large-scale warming and wetting trajectories during 1960–2014. However, the ensemble exhibits an overly smoothed zonal precipitation gradient, which obscures the classic northwest-to-southeast moisture gradient maintained by the interaction between the South Asian monsoon and the mid-latitude westerlies. This limitation is consistent with previous evaluations of CMIP6 simulations over the Tibetan Plateau [37,40,49]. Therefore, NEX–GDDP–CMIP6 is suitable for assessing broad climate-change signals and driving large-scale impact models, but local precipitation applications over the QTP should be accompanied by systematic bias assessment, ensemble uncertainty analysis, and, where feasible, process-based regional correction.
The persistent warming and wetting trends over the QTP reflect a substantial reorganization of regional energy and water cycles under global warming. Previous studies have also shown that the QTP is undergoing accelerated climate transformation at a rate approximately twice the contemporary global mean, consistent with broader evidence of warming amplification over the Asian Water Tower [6,20,46]. Sustained warming over the Plateau is driven by multiple interacting feedbacks, including snow–albedo feedback associated with cryospheric retreat, altered longwave radiation balance related to permafrost degradation, enhanced water-vapor and cloud-radiative effects at high elevations, and weakened atmospheric boundary-layer stability over high-altitude cryospheric regions [20,46,48,50,51]. In contrast, the contemporaneous wetting signal of 4.5–5.8 mm decade−1 is less spatially uniform than the warming signal and exhibits strong regional heterogeneity. Statistically significant wetting is mainly concentrated in the northern and northeastern Plateau, a pattern jointly controlled by Indian monsoon moisture pathways, orographic enhancement, and the role of the Yarlung Tsangpo Grand Canyon as an efficient moisture transport corridor into the interior Plateau [23,24]. This asymmetric wetting pattern is further regulated by complex land–atmosphere coupling processes, including enhanced northward penetration of the South Asian summer monsoon, increased regional evapotranspiration, and accelerated local precipitation recycling under warming conditions [52,53]. These processes help explain why the strongest wetting signals in observation-constrained products are concentrated in the northern and northeastern QTP rather than being spatially uniform across the entire Plateau.
The evaluation results also highlight a fundamental geophysical contrast between near-surface temperature and precipitation. Near-surface air temperature generally exhibits stronger spatial coherence and is primarily controlled by elevation-dependent lapse rates and large-scale atmospheric dynamics. In contrast, precipitation is intrinsically intermittent, highly localized, and governed by complex interactions among orographic lifting, convective triggering, South Asian monsoon moisture transport, and local land–atmosphere feedbacks over the extreme terrain of the QTP [22,23,24]. This contrast explains why temperature products show consistently higher agreement with station observations, whereas precipitation products display larger uncertainties, especially in anomaly representation and mountainous regions.
Despite the comprehensive multi-source and long-term nature of this evaluation, several limitations remain. First, as described in Section 2.3, the uneven spatial and vertical distribution of meteorological stations remains an important limitation. Although the current station network can generally capture the dominant climatic gradients across the QTP, 59 stations in this study are concentrated in the eastern Plateau, whereas only 26 stations cover the vast western Plateau, and many stations are located at relatively low elevations within their respective regions. This observational configuration inevitably introduces representativeness biases, which may lead to an underestimation of gridded-product uncertainty in remote western and high-elevation regions. Second, the nearest-neighbor resampling method used during preprocessing may introduce terrain-edge effects and cannot eliminate the fundamental scale mismatch between point-based station observations and grid-cell area averages, thereby affecting local-scale accuracy. Finally, the observational records used in this study are monthly data. Although they are sufficient for characterizing climatological means and long-term trends, they cannot represent short-duration extreme events, limiting the applicability of the results for high-temporal-resolution climate applications.

5. Conclusions

This study systematically evaluated four widely used gridded climate products against continuous observations from 85 national meteorological stations over the QTP during 1960–2022, and further assessed the historical simulation performance of the screened NEX–GDDP–CMIP6 multi-model ensemble for 1960–2014. The main conclusions are as follows.
Across all evaluation metrics, temperature products exhibit substantially higher reliability than precipitation products. CN_1km and TerraClimate achieve the best temperature performance, with R2 values of 0.93–0.94, RMSE values of 2.38–2.39 °C, and KGE values of 0.86 and 0.78, respectively. For precipitation, TerraClimate provides the best overall station-scale consistency, with R2 = 0.81, RMSE = 20.60 mm, bias = −1.27 mm, and KGE = 0.86. ERA5-Land shows the largest biases among the four evaluated products and performs poorly for both temperature and precipitation.
All four gridded datasets consistently detect a robust and statistically significant warming trend over the QTP, ranging from 0.21 to 0.24 °C decade−1. Meanwhile, all products indicate a general wetting tendency of 4.5–5.8 mm decade−1. However, the wetting signal exhibits substantially stronger spatial heterogeneity and greater dataset dependence than the warming signal. Notably, the precipitation trend in ERA5-Land does not reach the 0.05 significance level, further questioning its reliability for trend-based precipitation assessments over the Plateau.
The optimized NEX–GDDP–CMIP6 ensemble reasonably captures the broad warming trajectory of 0.22–0.23 °C decade−1 and the wetting tendency of 4.1–4.7 mm decade−1 during 1960–2014, but it fails to reproduce the observed spatial configuration of precipitation over the QTP. The ensemble generates a smoothed north–south meridional gradient, obscuring the monsoon-driven northwest-to-southeast moisture pathway and the localized orographic precipitation pattern sustained by the Yarlung Tsangpo moisture corridor.
Overall, this evaluation suggests that the 1 km monthly temperature dataset for China or TerraClimate should be prioritized for temperature-related studies over the QTP. For precipitation studies, CRU TS is recommended when bias control is the primary concern, whereas TerraClimate is generally the preferable choice.

Author Contributions

Conceptualization, W.L. and T.C.; methodology, W.L., T.C. and X.C.; software, W.L. and X.C.; validation, W.L., T.C. and X.C.; formal analysis, W.L., T.C., X.C., J.Z.; investigation, W.L. and J.Z.; resources, T.C.; data curation, W.L., S.W.; writing—original draft preparation, W.L.; writing—review and editing, T.C., X.C., J.Z., S.W., Y.Y. and Z.G.; visualization, W.L. and Z.G.; supervision, T.C.; project administration, T.C.; funding acquisition, T.C. All authors have read and agreed to the published version of the manuscript.

Funding

This study is supported by the Natural Science Foundation of Qinghai Province (Nos. 2023–QLGKLYCZX–006, 2023–QLGKLYCZX–004, 2023–QLGKLYCZX–003), the Natural Science Foundation of Qinghai Province (2025–ZJ–999M).

Institutional Review Board Statement

Not applicable.

Informed Consent Statement

Not applicable.

Data Availability Statement

Ground-based meteorological observations used in this study were obtained from the National Climate Center of the China Meteorological Administration (CMA; http://data.cma.cn/). Access to these data requires registration and formal application through the CMA Data Service System. The four gridded climate datasets evaluated here are publicly available from their respective data portals: the 1 km monthly temperature and precipitation dataset for China (CN_1km) [11] from the National Tibetan Plateau Data Center (https://data.tpdc.ac.cn/zh–hans/data/71ab4677–b66c–4fd1–a004–b2a541c4d5bf (accessed on 10 December 2025)); The Climatic Research Unit Time Series dataset (CRU TS) [10] from the Climatic Research Unit at the University of East Anglia (https://crudata.uea.ac.uk/cru/data/hrg/ (accessed on 15 January 2026)); The ERA5-Land reanalysis dataset [13] from the Copernicus Climate Data Store (https://cds.climate.copernicus.eu/datasets/reanalysis-era5-land-monthly-means?tab=download (accessed on 20 February 2026)); and the TerraClimate dataset [31] from the Climatology Lab at the University of Idaho (https://www.climatologylab.org/terraclimate.html (accessed on 25 March 2026)). The NASA Earth Exchange Global Daily Downscaled Projections based on CMIP6 (NEX–GDDP–CMIP) [32] are available from the NASA Center for Climate Simulation (https://nex-gddp-cmip6.s3.us-west-2.amazonaws.com/index.html#NEX-GDDP-CMIP6/ (accessed on 15 April 2026)).

Conflicts of Interest

The authors declare no conflicts of interest for this manuscript.

Abbreviations

The following abbreviations are used in this manuscript:
ADWAngular Distance Weighting
BCSDBias Correction Spatial Disaggregation
BiasMean bias
CDFcumulative distribution function
CMAChina Meteorological Administration
CMIP6Coupled Model Intercomparison Project Phase 6
CMFDChina Meteorological Forcing Dataset
CMORPHClimate Prediction Center MORPHing Technique
CN_1kmChina’s 1 km Gridded Monthly Climate Dataset
CRU TSClimatic Research Unit Time Series
ECMWFEuropean Centre for Medium-Range Weather Forecasts
ERA5-LandThe fifth-generation European Centre for Medium-Range Weather Forecasts land reanalysis
ESMEarth System Model
JMAJapan Meteorological Agency
JRA-55Japanese 55-year Reanalysis
IPCCIntergovernmental Panel on Climate Change
KGEKling–Gupta Efficiency
MSWEPMulti-Source Weighted-Ensemble Precipitation
M–KMann–Kendall
NEX–GDDP–CMIP6NASA Earth Exchange Global Daily Downscaled Projections based on CMIP6
PERSIANNPrecipitation Estimation from Remotely Sensed Information using Artificial Neural Networks
QTPQinghai–Tibet Plateau
R2Coefficient of determination
RMSERoot mean square error
TPMFDTibetan Plateau Meteorological Forcing Dataset

References

  1. Van Der Molen, M.K.; Dolman, A.J.; Ciais, P.; Eglin, T.; Gobron, N.; Law, B.E.; Meir, P.; Peters, W.; Phillips, O.; Reichstein, M.; et al. Drought and ecosystem carbon cycling. Agric. For. Meteorol. 2011, 151, 765–773. [Google Scholar] [CrossRef]
  2. Luo, L.; Ma, W.; Zhuang, Y.; Zhang, Y.; Yi, S.; Xu, J.; Long, Y.; Ma, D.; Zhang, Z. The impacts of climate change and human activities on alpine vegetation and permafrost in the Qinghai–Tibet Engineering Corridor. Ecol. Indic. 2018, 93, 24–35. [Google Scholar] [CrossRef]
  3. Shen, M.; Wang, S.; Jiang, N.; Sun, J.; Cao, R.; Ling, X.; Fang, B.; Zhang, L.; Zhang, L.; Xu, X.; et al. Plant phenology changes and drivers on the Qinghai–Tibetan Plateau. Nat. Rev. Earth Environ. 2022, 3, 633–651. [Google Scholar] [CrossRef]
  4. El–Bagoury, H.; Gad, A. Integrated hydrological modeling for watershed analysis, flood prediction, and mitigation using meteorological and morphometric data, SCS–CN, HEC–HMS/RAS, and QGIS. Water 2024, 16, 356. [Google Scholar] [CrossRef]
  5. IPCC. Climate Change 2021: The Physical Science Basis. Contribution of Working Group I to the Sixth Assessment Report of the Intergovernmental Panel on Climate Change; Masson-Delmotte, V., Zhai, P., Pirani, A., Connors, S.L., Péan, C., Berger, S., Caud, N., Chen, Y., Goldfarb, L., Gomis, M.I., et al., Eds.; Cambridge University Press: Cambridge, UK, 2021. [Google Scholar] [CrossRef]
  6. Yao, T.; Bolch, T.; Chen, D.; Gao, J.; Immerzeel, W.; Piao, S.; Su, F.; Thompson, L.; Wada, Y.; Wang, L.; et al. The imbalance of the Asian water tower. Nat. Rev. Earth Environ. 2022, 3, 618–632. [Google Scholar] [CrossRef]
  7. Kidd, C.; Becker, A.; Huffman, G.J.; Muller, C.L.; Joe, P.; Skofronick-Jackson, G.; Kirschbaum, D.B. So, how much of the Earth’s surface is covered by rain gauges? Bull. Am. Meteorol. Soc. 2017, 98, 69–78. [Google Scholar] [CrossRef] [PubMed]
  8. Di Luzio, M.; Johnson, G.L.; Daly, C.; Eischeid, J.K.; Arnold, J.G. Constructing retrospective gridded daily precipitation and temperature datasets for the conterminous United States. J. Appl. Meteorol. Climatol. 2008, 47, 475–497. [Google Scholar] [CrossRef]
  9. Adler, R.; Sapiano, M.; Huffman, G.; Wang, J.-J.; Gu, G.; Bolvin, D.; Chiu, L.; Schneider, U.; Becker, A.; Nelkin, E.; et al. The Global Precipitation Climatology Project (GPCP) monthly analysis (new version 2.3) and a review of 2017 global precipitation. Atmosphere 2018, 9, 138. [Google Scholar] [CrossRef] [PubMed]
  10. Harris, I.; Osborn, T.J.; Jones, P.; Lister, D. Version 4 of the CRU TS monthly high–resolution gridded multivariate climate dataset. Sci. Data 2020, 7, 109. [Google Scholar] [CrossRef] [PubMed]
  11. Peng, S.; Ding, Y.; Liu, W.; Li, Z. 1 km monthly temperature and precipitation dataset for China from 1901 to 2017. Earth Syst. Sci. Data 2019, 11, 1931–1946. [Google Scholar] [CrossRef]
  12. Hersbach, H.; Bell, B.; Berrisford, P.; Hirahara, S.; Horányi, A.; Muñoz-Sabater, J.; Nicolas, J.; Peubey, C.; Radu, R.; Schepers, D.; et al. The ERA5 global reanalysis. Q. J. R. Meteorol. Soc. 2020, 146, 1999–2049. [Google Scholar] [CrossRef]
  13. Muñoz–Sabater, J.; Dutra, E.; Agustí–Panareda, A.; Albergel, C.; Arduini, G.; Balsamo, G.; Boussetta, S.; Choulga, M.; Harrigan, S.; Hersbach, H.; et al. ERA5–Land: A state–of–the–art global reanalysis dataset for land applications. Earth Syst. Sci. Data 2021, 13, 4349–4383. [Google Scholar] [CrossRef]
  14. Sun, Q.; Miao, C.; Duan, Q.; Ashouri, H.; Sorooshian, S.; Hsu, K. A review of global precipitation datasets: Data sources, estimation, and intercomparisons. Rev. Geophys. 2018, 56, 79–107. [Google Scholar] [CrossRef]
  15. Beck, H.E.; Wood, E.F.; Pan, M.; Fisher, C.K.; Miralles, D.G.; van Dijk, A.I.J.M.; McVicar, T.R.; Adler, R.F. MSWEP V2 global 3-hourly 0.1° precipitation: Methodology and quantitative assessment. Bull. Am. Meteorol. Soc. 2019, 100, 473–500. [Google Scholar] [CrossRef]
  16. Beck, H.E.; Vergopolan, N.; Pan, M.; Levizzani, V.; Van Dijk, A.I.J.M.; Weedon, G.P.; Brocca, L.; Pappenberger, F.; Huffman, G.J.; Wood, E.F. Global-scale evaluation of 22 precipitation datasets using gauge observations and hydrological modeling. Hydrol. Earth Syst. Sci. 2017, 21, 6201–6217. [Google Scholar] [CrossRef]
  17. Hu, Z.; Zhang, C.; Hu, Q.; Tian, H. Temperature changes in Central Asia from 1979 to 2011 based on multiple datasets. J. Clim. 2014, 27, 1143–1167. [Google Scholar] [CrossRef]
  18. Liu, Y.; Zheng, Y.; Li, W.; Zhou, T. Evaluating the performance of satellite-based precipitation products using gauge measurement and hydrological modeling: A case study in a dry basin of northwest China. J. Hydrometeorol. 2022, 23, 541–559. [Google Scholar] [CrossRef]
  19. Rao, P.; Wang, F.; Yuan, X.; Liu, Y.; Jiao, Y. Evaluation and comparison of 11 sets of gridded precipitation products over the Qinghai–Tibet Plateau. Atmos. Res. 2024, 302, 107315. [Google Scholar] [CrossRef]
  20. You, Q.; Cai, Z.; Pepin, N.; Chen, D.; Ahrens, B.; Jiang, Z.; Wu, F.; Kang, S.; Zhang, R.; Wu, T.; et al. Warming amplification over the Arctic Pole and Third Pole: Trends, mechanisms and consequences. Earth-Sci. Rev. 2021, 217, 103625. [Google Scholar] [CrossRef]
  21. Cao, X.; Zhao, Z.; Zheng, Y.; Su, C.; Lei, Q.; Li, W.; Li, C. Climate change threatens water resources over the Qinghai-Tibetan plateau. Sci. Rep. 2025, 15, 21996. [Google Scholar] [CrossRef] [PubMed]
  22. Lu, H.; Li, F.; Gong, T.; Gao, Y.; Qiu, J. Temporal variability of precipitation over the Qinghai-Tibetan Plateau and its surrounding areas in the last 40 years. Int. J. Climatol. 2023, 43, 1912–1934. [Google Scholar] [CrossRef]
  23. Yuan, X.; Yang, K.; Lu, H.; Wang, Y.; Ma, X. Impacts of moisture transport through and over the Yarlung Tsangpo Grand Canyon on precipitation in the eastern Tibetan Plateau. Atmos. Res. 2023, 282, 106533. [Google Scholar] [CrossRef]
  24. Dong, W.; Lin, Y.; Wright, J.S.; Ming, Y.; Xie, Y.; Wang, B.; Luo, Y.; Huang, W.; Huang, J.; Wang, L.; et al. Summer rainfall over the southwestern Tibetan Plateau controlled by deep convection over the Indian subcontinent. Nat. Commun. 2016, 7, 10925. [Google Scholar] [CrossRef] [PubMed]
  25. Yin, B.; Xie, Y.; Yao, C.; Liu, B.; Liu, B. Evaluating rainfall erosivity on the Tibetan Plateau by integrating high spatiotemporal resolution gridded precipitation and gauge data. Sci. Total Environ. 2024, 951, 175385. [Google Scholar] [CrossRef] [PubMed]
  26. Chen, D.; Tian, Y.; Yao, T.; Ou, T. Satellite measurements reveal strong anisotropy in spatial coherence of climate variations over the Tibet Plateau. Sci. Rep. 2016, 6, 30304. [Google Scholar] [CrossRef] [PubMed]
  27. Chen, Y.; Ding, M.; Zhang, G.; Wang, Y.; Li, J. Evaluation of ERA5 reanalysis precipitation data in the Yarlung Zangbo River Basin of the Tibetan Plateau. J. Hydrometeorol. 2023, 24, 1491–1507. [Google Scholar] [CrossRef]
  28. Hu, X.; Yuan, W. Evaluation of ERA5 precipitation over the eastern periphery of the Tibetan Plateau from the perspective of regional rainfall events. Int. J. Climatol. 2021, 41, 2625–2637. [Google Scholar] [CrossRef]
  29. Ou, T.; Chen, D.; Tang, J.; Lin, C.; Wang, X.; Kukulies, J.; Lai, H.-W. Wet bias of summer precipitation in the northwestern Tibetan Plateau in ERA5 is linked to overestimated lower–level southerly wind over the plateau. Clim. Dyn. 2023, 61, 2139–2153. [Google Scholar] [CrossRef]
  30. Zhang, Y.; Li, B.; Zheng, D. Datasets of the Boundary and Area of the Tibetan Plateau. Acta Geogr. Sin. 2014, 69, 65–68. [Google Scholar] [CrossRef]
  31. Abatzoglou, J.T.; Dobrowski, S.Z.; Parks, S.A.; Hegewisch, K.C. TerraClimate, a high–resolution global dataset of monthly climate and climatic water balance from 1958–2015. Sci. Data 2018, 5, 170191. [Google Scholar] [CrossRef] [PubMed]
  32. Thrasher, B.; Wang, W.; Michaelis, A.; Melton, F.; Lee, T.; Nemani, R. NASA Global Daily Downscaled Projections, CMIP6 (NEX–GDDP–CMIP6). Sci. Data 2022, 9, 260. [Google Scholar] [CrossRef] [PubMed]
  33. GB/T 33703; Specifications Observing for Automatic Weather Station. China Standard Press: Beijing, China, 2017.
  34. Randall, D.A.; Wood, R.A.; Bony, S.; Colman, R.; Fichefet, T.; Fyfe, J.; Kattsov, V.; Pitman, A.; Shukla, J.; Srinivasan, J.; et al. Climate models and their evaluation. In Climate Change 2007: The Physical Science Basis; Solomon, S., Qin, D., Manning, M., Chen, Z., Marquis, M., Averyt, K.B., Tignor, M., Miller, H.L., Eds.; Cambridge University Press: Cambridge, UK, 2007; pp. 589–662. [Google Scholar]
  35. Gupta, H.V.; Kling, H.; Yilmaz, K.K.; Martinez, G.F. Decomposition of the mean squared error and NSE performance criteria: Implications for improving hydrological modelling. J. Hydrol. 2009, 377, 80–91. [Google Scholar] [CrossRef]
  36. Kling, H.; Fuchs, M.; Paulin, M. Runoff conditions in the upper Danube basin under an ensemble of climate change scenarios. J. Hydrol. 2012, 424–425, 264–277. [Google Scholar] [CrossRef]
  37. Cui, T.F.; Li, C.; Tian, F. Evaluation of temperature and precipitation simulations in CMIP6 models over the Tibetan Plateau. Earth Space Sci. 2021, 8, e2020EA001620. [Google Scholar] [CrossRef]
  38. Li, Y.; Qin, X.; Liu, Y.; Jin, Z.; Liu, J.; Wang, L.; Chen, J. Evaluation of long–term and high–resolution gridded precipitation and temperature products in the Qilian Mountains, Qinghai–Tibet Plateau. Front. Environ. Sci. 2022, 10, 906821. [Google Scholar] [CrossRef]
  39. Huang, X.; Han, S.; Shi, C. Evaluation of three air temperature reanalysis datasets in the alpine region of the Qinghai–Tibet Plateau. Remote Sens. 2022, 14, 4447. [Google Scholar] [CrossRef]
  40. Gao, J.; Du, J.; Yang, C.; Deqing, Z.; Ma, P.; Zhuo, G. Evaluation and correction of climate simulations for the Tibetan Plateau using the CMIP6 models. Atmosphere 2022, 13, 1947. [Google Scholar] [CrossRef]
  41. You, Q.; Min, J.; Zhang, W.; Pepin, N.; Kang, S. Comparison of multiple datasets with gridded precipitation observations over the Tibetan Plateau. Clim. Dyn. 2015, 45, 791–806. [Google Scholar] [CrossRef]
  42. Gao, Y.C.; Liu, M.F. Evaluation of high–resolution satellite precipitation products using rain gauge observations over the Tibetan Plateau. Hydrol. Earth Syst. Sci. 2013, 17, 837–849. [Google Scholar] [CrossRef]
  43. You, Q.; Fraedrich, K.; Ren, G.; Pepin, N.; Kang, S. Variability of temperature in the Tibetan Plateau based on homogenized surface stations and reanalysis data. Int. J. Climatol. 2013, 33, 1337–1347. [Google Scholar] [CrossRef]
  44. Wu, F.; You, Q.; Cai, Z.; Sun, G.; Normatov, I.; Shrestha, S. Significant elevation dependent warming over the Tibetan Plateau after removing longitude and latitude factors. Atmos. Res. 2023, 284, 106603. [Google Scholar] [CrossRef]
  45. Meng, Y.; Duan, K.; Shi, P.; Shang, W.; Li, S.; Cheng, Y.; Xing, L.; Chen, R.; He, J. Sensitive temperature changes on the Tibetan Plateau in response to global warming. Atmos. Res. 2023, 294, 106948. [Google Scholar] [CrossRef]
  46. You, Q.; Chen, D.; Wu, F.; Pepin, N.; Cai, Z.; Ahrens, B.; Jiang, Z.; Wu, Z.; Kang, S.; AghaKouchak, A. Elevation–dependent warming over the Tibetan Plateau: Patterns, mechanisms and perspectives. Earth–Sci. Rev. 2020, 210, 103349. [Google Scholar] [CrossRef]
  47. Zhao, K.; Zhong, S.S. Evaluation and Error Analysis of Multi–Source Precipitation Datasets during Summer over the Tibetan Plateau. Atmosphere 2024, 15, 165. [Google Scholar] [CrossRef]
  48. Yan, Y.; Liu, Y.; Lu, J. Cloud vertical structure, precipitation, and cloud radiative effects over Tibetan Plateau and its neighboring regions. J. Geophys. Res. Atmos. 2016, 121, 5864–5877. [Google Scholar] [CrossRef]
  49. Liu, Y.; Gao, J.; Wang, Y. Evaluation of atmospheric moisture transport to the Tibetan Plateau from 33 CMIP6 models. npj Clim. Atmos. Sci. 2024, 7, 231. [Google Scholar] [CrossRef]
  50. Chen, X.; Škerlak, B.; Rotach, M.W.; Añel, J.A.; Su, Z.; Ma, Y.; Li, M. Reasons for the extremely high–ranging planetary boundary layer over the western Tibetan Plateau in winter. J. Atmos. Sci. 2016, 73, 2021–2038. [Google Scholar] [CrossRef]
  51. Pepin, N.; Bradley, R.S.; Diaz, H.F.; Baraer, M.; Caceres, E.B.; Forsythe, N.; Fowler, H.; Greenwood, G.; Hashmi, M.Z.; Liu, X.D.; et al. Elevation–dependent warming in mountain regions of the world. Nat. Clim. Chang. 2015, 5, 424–430. [Google Scholar] [CrossRef]
  52. Cai, W.; Xu, X.; Liu, Y.; Ma, Y.; Wang, C.; Zhao, R.; Sun, C.; Dong, N.; Wang, R. Northward propagation of Hadley cell in the South Asian monsoon region driven by active convection over the Qinghai–Tibet Plateau triggered by sea surface temperature warming of the North Atlantic. npj Clim. Atmos. Sci. 2025, 8, 224. [Google Scholar] [CrossRef]
  53. Cheng, T.F.; Chen, D.; Wang, B.; Ou, T.; Lu, M. Human–induced warming accelerates local evapotranspiration and precipitation recycling over the Tibetan Plateau. Commun. Earth Environ. 2024, 5, 388. [Google Scholar] [CrossRef]
Figure 1. Spatial distributions of the study area and meteorological stations.
Atmosphere 17 00669 g001
Figure 2. Schematic flowchart of the climate product evaluation over the QTP. The workflow comprises four structural layers: (L1) multi-source data input, (L2) data preprocessing, (L3) data evaluation, and (L4) application of the evaluation results.
Atmosphere 17 00669 g002
Figure 3. Scatter density plots of monthly mean temperature (°C; (a,c,e,g)) and precipitation (mm; (b,d,f,h)) between station observations (x-axis) and gridded products (y-axis) over the QTP during 1960–2022. Colors indicate the local point density.
Atmosphere 17 00669 g003
Figure 4. Scatter density plots of monthly mean temperature anomalies (°C; (a,c,e,g)) and precipitation anomalies (mm; (b,d,f,h)) between station observations (x-axis) and gridded products (y-axis) over the QTP during 1960–2022. Colors indicate the local point density.
Atmosphere 17 00669 g004
Figure 5. (a) Annual mean temperature (°C) and (b) annual precipitation (mm) over the QTP during 1960–2022 derived from the four gridded datasets.
Atmosphere 17 00669 g005
Figure 6. Spatial distributions of multi-year mean temperature (°C; (a,c,e,g)) and precipitation (mm; (b,d,f,h)) over the QTP during 1960–2022.
Atmosphere 17 00669 g006
Figure 7. Spatial distributions of long-term linear trends in mean temperature (°C decade−1; (a,c,e,g)) and precipitation (mm decade−1; (b,d,f,h)) over the QTP during 1960–2022.
Atmosphere 17 00669 g007
Figure 8. Diagnostic evidence for identifying outlying NEX–GDDP–CMIP6 simulations over the QTP. (a) Two-dimensional diagnostic plot showing the maximum fractional area with standardized deviations exceeding 2σ for precipitation and temperature. (b) Stacked bar chart showing the spatial anomalous extent of precipitation and temperature for each of the 18 models, sorted by the total anomalous extent.
Atmosphere 17 00669 g008
Figure 9. (a) Interannual variations and long-term trends of annual mean temperature (°C) and (b) annual precipitation (mm) derived from the NEX–GDDP–CMIP6 dataset and the multi-source observational synthesis (Multi-Obs) over the QTP from 1960 to 2014.
Atmosphere 17 00669 g009
Figure 10. Spatial distributions of mean and median temperature (°C; (a,c,e,g)) and precipitation (mm; (b,d,f,h)) over the QTP during 1960–2014, based on the CMIP6 dataset and the contemporaneous observational synthesis (Multi-Obs).
Atmosphere 17 00669 g010
Figure 11. Spatial distributions of trends in mean and median temperature (°C decade−1; (a,c,e,g)) and precipitation (mm decade−1; (b,d,f,h)) over the QTP during 1960–2014, based on NEX–GDDP–CMIP6 and the four contemporaneous observationally constrained datasets (Multi-Obs).
Atmosphere 17 00669 g011
Table 1. Information on the gridded datasets used in this study.
Data NameTime PeriodSpatial
Resolution
Temporal
Resolution
Data Sources
CN_1km1901–20221/120°monthlyhttps://data.tpdc.ac.cn/zh−hans/data/71ab4677−b66c−4fd1−a004−b2a541c4d5bf (accessed on 10 December 2025)
CRU TS1901–20220.5°monthlyhttps://crudata.uea.ac.uk/cru/data/hrg/ (accessed on 15 January 2026)
ERA5-Land1960–20220.1°monthlyhttps://cds.climate.copernicus.eu/datasets/reanalysis-era5-land-monthly-means?tab=download (accessed on 20 February 2026)
TerraClimate1960–20220.04°monthlyhttps://www.climatologylab.org/terraclimate.html (accessed on 25 March 2026)
NEX–GDDP–CMIP61950–2014 (historical)0.25°monthlyhttps://nex-gddp-cmip6.s3.us-west-2.amazonaws.com/index.html#NEX-GDDP-CMIP6/ (accessed on 15 April 2026)
Table 2. Outlier diagnostic metrics for the 18 NEX–GDDP–CMIP6 simulations over the QTP during 1960–2014.
Model NamePR Area
_mean (%)
PR Area
_median (%)
TA Area
_mean (%)
TAS Area
_median (%)
PR_SensitivityTAS_SensitivityDecision
CanESM542.239.200180Remove
CMCC–CM2–SR51.75.0100100018Remove
TaiESM12.13.2100100018Remove
ACCESS–ESM1–514.05.00040Retain
KIOST–ESM13.95.00020Retain
NorESM2–MM8.35.80030Retain
MPI–ESM1–2–LR5.59.30000Retain
INM–CM4–86.08.80000Retain
ACCESS–CM24.27.80000Retain
NorESM2–LM7.64.70000Retain
EC–Earth37.56.60000Retain
INM–CM5–02.76.50000Retain
MRI–ESM2–05.95.10000Retain
MPI–ESM1–2–HR1.45.00000Retain
GFDL–CM43.14.50000Retain
EC–Earth3–Veg–LR4.32.20000Retain
GFDL–ESM43.53.10000Retain
CMCC–ESM22.53.40000Retain
PR denotes precipitation, and TAS denotes near-surface air temperature. The anomalous area indicates the percentage of QTP grid cells where the standardized deviation of a given model exceeds ±2σ relative to the ensemble-mean or ensemble-median reference field.
Disclaimer/Publisher’s Note: The statements, opinions and data contained in all publications are solely those of the individual author(s) and contributor(s) and not of MDPI and/or the editor(s). MDPI and/or the editor(s) disclaim responsibility for any injury to people or property resulting from any ideas, methods, instructions or products referred to in the content.