Article

Meteorological Observations of a Funnel Cloud at Zhuhai, China, on 8 May 2026 and the Forecasting of the Associated Mesocyclone


Hong Kong Observatory, Hong Kong, China
*
Author to whom correspondence should be addressed.
Atmosphere 2026, 17(7), 640; https://doi.org/10.3390/atmos17070640
Submission received: 18 May 2026 / Revised: 23 June 2026 / Accepted: 25 June 2026 / Published: 29 June 2026
(This article belongs to the Section Meteorology)

Abstract

A funnel cloud is a rotating column of air that extends from the cloud base towards the ground yet does not touch the ground. It can be the precursor to a tornado or waterspout. The associated high winds can be destructive. This paper analyzed the meteorological observations for a funnel cloud spotted at Zhuhai in the afternoon of 8 May 2026, and performed simulation of its associated mesocyclone to study the formation mechanism of the funnel cloud. The funnel cloud was found to occur within a surface trough of low pressure under moderately unstable atmospheric conditions; winds were generally weak in the atmospheric boundary layer and the middle troposphere was wavy. The vorticity in the atmospheric boundary layer was lifted by the upward motion associated with the mid-tropospheric waves and daytime heating to form a funnel cloud; such a mechanism is supported by observations and model simulations. The weather radar generally captured the shallow convection and the radar-analyzed wind field depicted significant updraft in the reflectivity core associated with the mesocyclone. On the simulation side, the atmosphere–ocean–wave coupled model with radar data assimilation captured the isolated cyclonic feature near Zhuhai and the upward motion of the air column. Apart from the formation mechanism, this paper documented this rare event as a step forward in building up the climatology for the atmospheric conditions favourable for funnel cloud formation in the region.

1. Introduction

1.1. Background

A funnel cloud is a rapidly rotating column of air that extends from a convective cloud but does not touch the ground [1]. When the funnel cloud makes contact with the surface, it becomes a tornado over land or a waterspout over water [2,3]. Wind speed in a tornadic system can reach over 100 m/s, which poses a threat to lives and properties [3]. According to the records of the Hong Kong Observatory (HKO), between 1959 and 2025 for a distance within 250 nautical miles of Hong Kong, there have been 27 reports of funnel clouds over the period of 67 years, mostly occurring from May to September of the year. On average, there was about 0.4 sighting per year. If taking waterspouts and funnel clouds together, there were 84 reported sightings. Over a larger area, such as Guangdong province of southern China, no statistics of funnel cloud sighting have been reported to our knowledge. Yet, for tornado itself, according to [4], there were about 108 tornadoes for the period of 2003 to 2019, making Guangdong the second province in China in terms of the number of occurrences of tornadoes. If we focus on Zhuhai, which is about 50 to 100 km to the west of Hong Kong, on the western coast of the Pearl River Estuary (PRE), the number of tornadoes was only about three in the period 1961 to 2022 based on the study of [5]. In fact, about 42% of the tornadoes in Guangdong province were found to be associated with landfalling typhoons [6]. As such, funnel cloud occurrence under non-tropical-cyclone situation over the PRE was rare. The event of funnel cloud analyzed in the present study was one example. It occurred in a meteorological background of a surface trough of low pressure over southern China in late spring, not associated with a tropical cyclone.
The importance of this study lies in two aspects. Firstly, it documented such a rare event which can contribute to building up the climatology of funnel cloud occurrence in the PRE. Secondly, this work analyzed the formation mechanism of funnel clouds based on Doppler radars, storm relative helicity (SRH), vertical wind profiles and high-resolution numerical weather prediction (NWP) models. The results would be useful for future reference in the meteorological analysis and forecasting of funnel clouds and the associated mesocyclone.
This work is organized as follows. First, the synoptic pattern of the atmosphere derived from satellite imagery and measurements over southern China around the time when the funnel cloud occurred will be discussed. Second, more localized yet higher-resolution observations including Doppler radar, wind profiler, etc., will be presented to provide measurements of the mesocyclone and look into the physical mechanism underlying its formation. Finally, simulation from NWP models will be shown to provide further details on the mesocyclone and to evaluate the performance of models in forecasting such a feature.

1.2. Observation of the Funnel Cloud and the Analysis of Synoptic Pattern

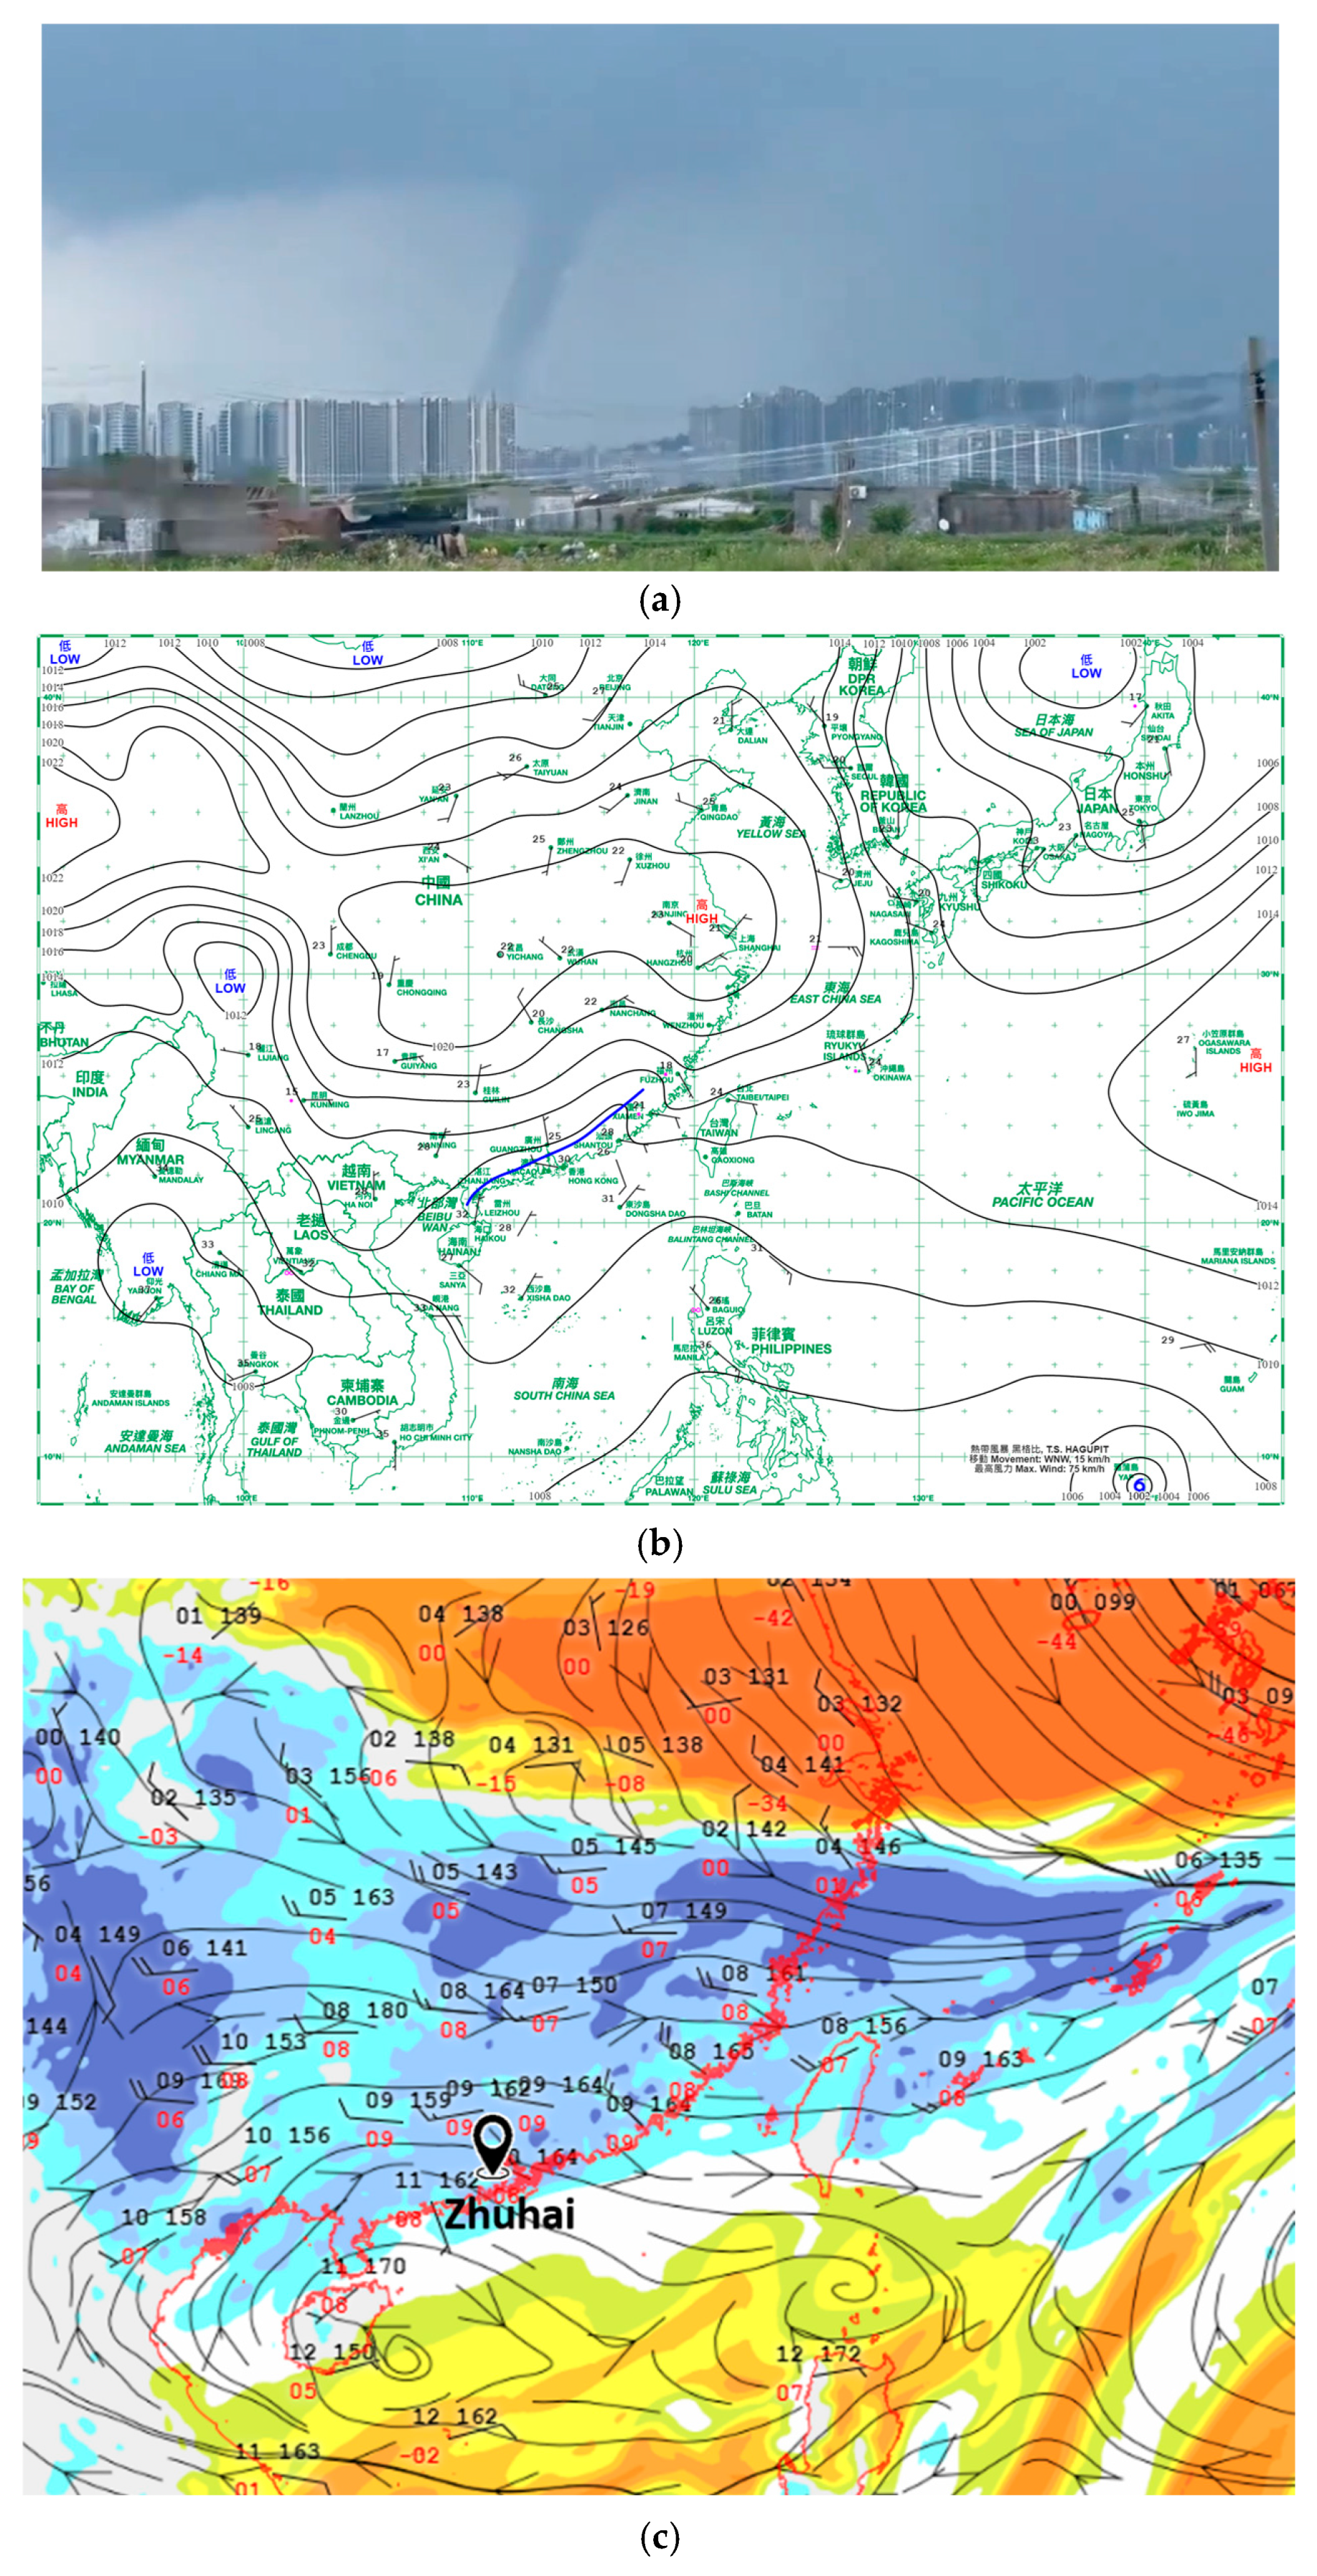
At about 3:30 p.m. on 8 May 2026, there was a sighting of a funnel cloud at Zhuhai according to the news report [7]. It was once reported as a tornado but later the meteorological office at Zhuhai confirmed that the swirling cloud had not yet touched the ground. A photo of the rather massive funnel cloud in the newspaper is reproduced in Figure 1a. The surface isobaric chart at 2 p.m. (Figure 1b, local time = UTC+8) showed a surface trough close to the coast of Guangdong. The system was characterized by the convergence between a weak northeast monsoon push and light-to-moderate southerly coastal winds, potentially driven by sea breezes [8]. The low-level convergence, albeit weak, provided positive vorticity that promoted cyclonic flow of air [9]. Based on the upper-air analysis at 700 hPa at 12 UTC on that day (Figure 1c), it was rather wavy in the middle troposphere aloft southern China. The passage of waves triggered upward motion and thus vertical stretching of the air column to facilitate the formation of the funnel cloud [10,11].

2. Methods

2.1. Details on the Observations Used

The surface isobaric chart and upper-air analysis shown in Figure 1b,c were drawn based on observations and the analysis field from NWP model with human adjustments. The weather radar at Cheung Chau (an island at the southern part of Hong Kong) mentioned in Section 3.1 is a C-band solid-state dual-polarization radar with a measurement range of about 300 km, situated at a height of 85 m above mean sea level; the weather radar at Tai Mo Shan of Hong Kong is a dual-polarization S-band radar [12] with a measurement range of about 256 km, situated at a height of 968 m above mean sea level. The 3D wind field analysis from radar shown in Figure 3 adopted the technique of variational multiple Doppler radar analysis following the method described in [13,14]. The hodograph presented in Figure 5 was derived from wind profiler data. It is a vector representation of the vertical distribution of horizontal wind [15] and is used to visualize the wind shear with height. It is one of the tools adopted in the forecasting of severe thunderstorms [16,17].

2.2. Details of NWP Models

The Unified Wave INterface-Coupled Model (UWN-CM) described in Section 3.3 is an atmosphere–ocean–wave coupled model [18,19]. The model comprises the atmospheric model WRF, the ocean model HYCOM and the Donelan Wave Model. Model fields were exchanged among components at each time step with details found in [20]. The domain configuration is the same as that in [21]. In particular, its innermost domain has a horizontal resolution of 1.33 km, which enables convection-permitting modelling [22]. In addition, data assimilation (DA) [23,24] of weather radar at Tai Mo Shan was adopted.
The Urban Model described in Section 3.3 utilized the urban canopy scheme in WRF [25], following the configuration as described in [26]. There is no coupling with ocean and wave in the Urban Model; i.e., it is a pure atmospheric model. Its innermost domain has a horizontal resolution of 200 m with 83 vertical levels, and the vertical resolution is less than 50 m within the first 1000 m above sea level. Its innermost domain covers Hong Kong only; in this paper the results of an outer domain covering the PRE with a horizontal resolution of 1 km are presented. It has been implemented with building effect parameterization with high horizontal resolution (down to 100 m) of land use data, urban canopy parameter and terrain height. This model aims to provide higher boundary layer resolution and improved land-use representation. It investigates how urban heat island effects, combined with meso- and micro-scale circulations like land–sea breezes, influence convective development. Moreover, DA of weather radar at Tai Mo Shan was implemented.

3. Results

3.1. Radar Measurements and the Associated Mesocyclone

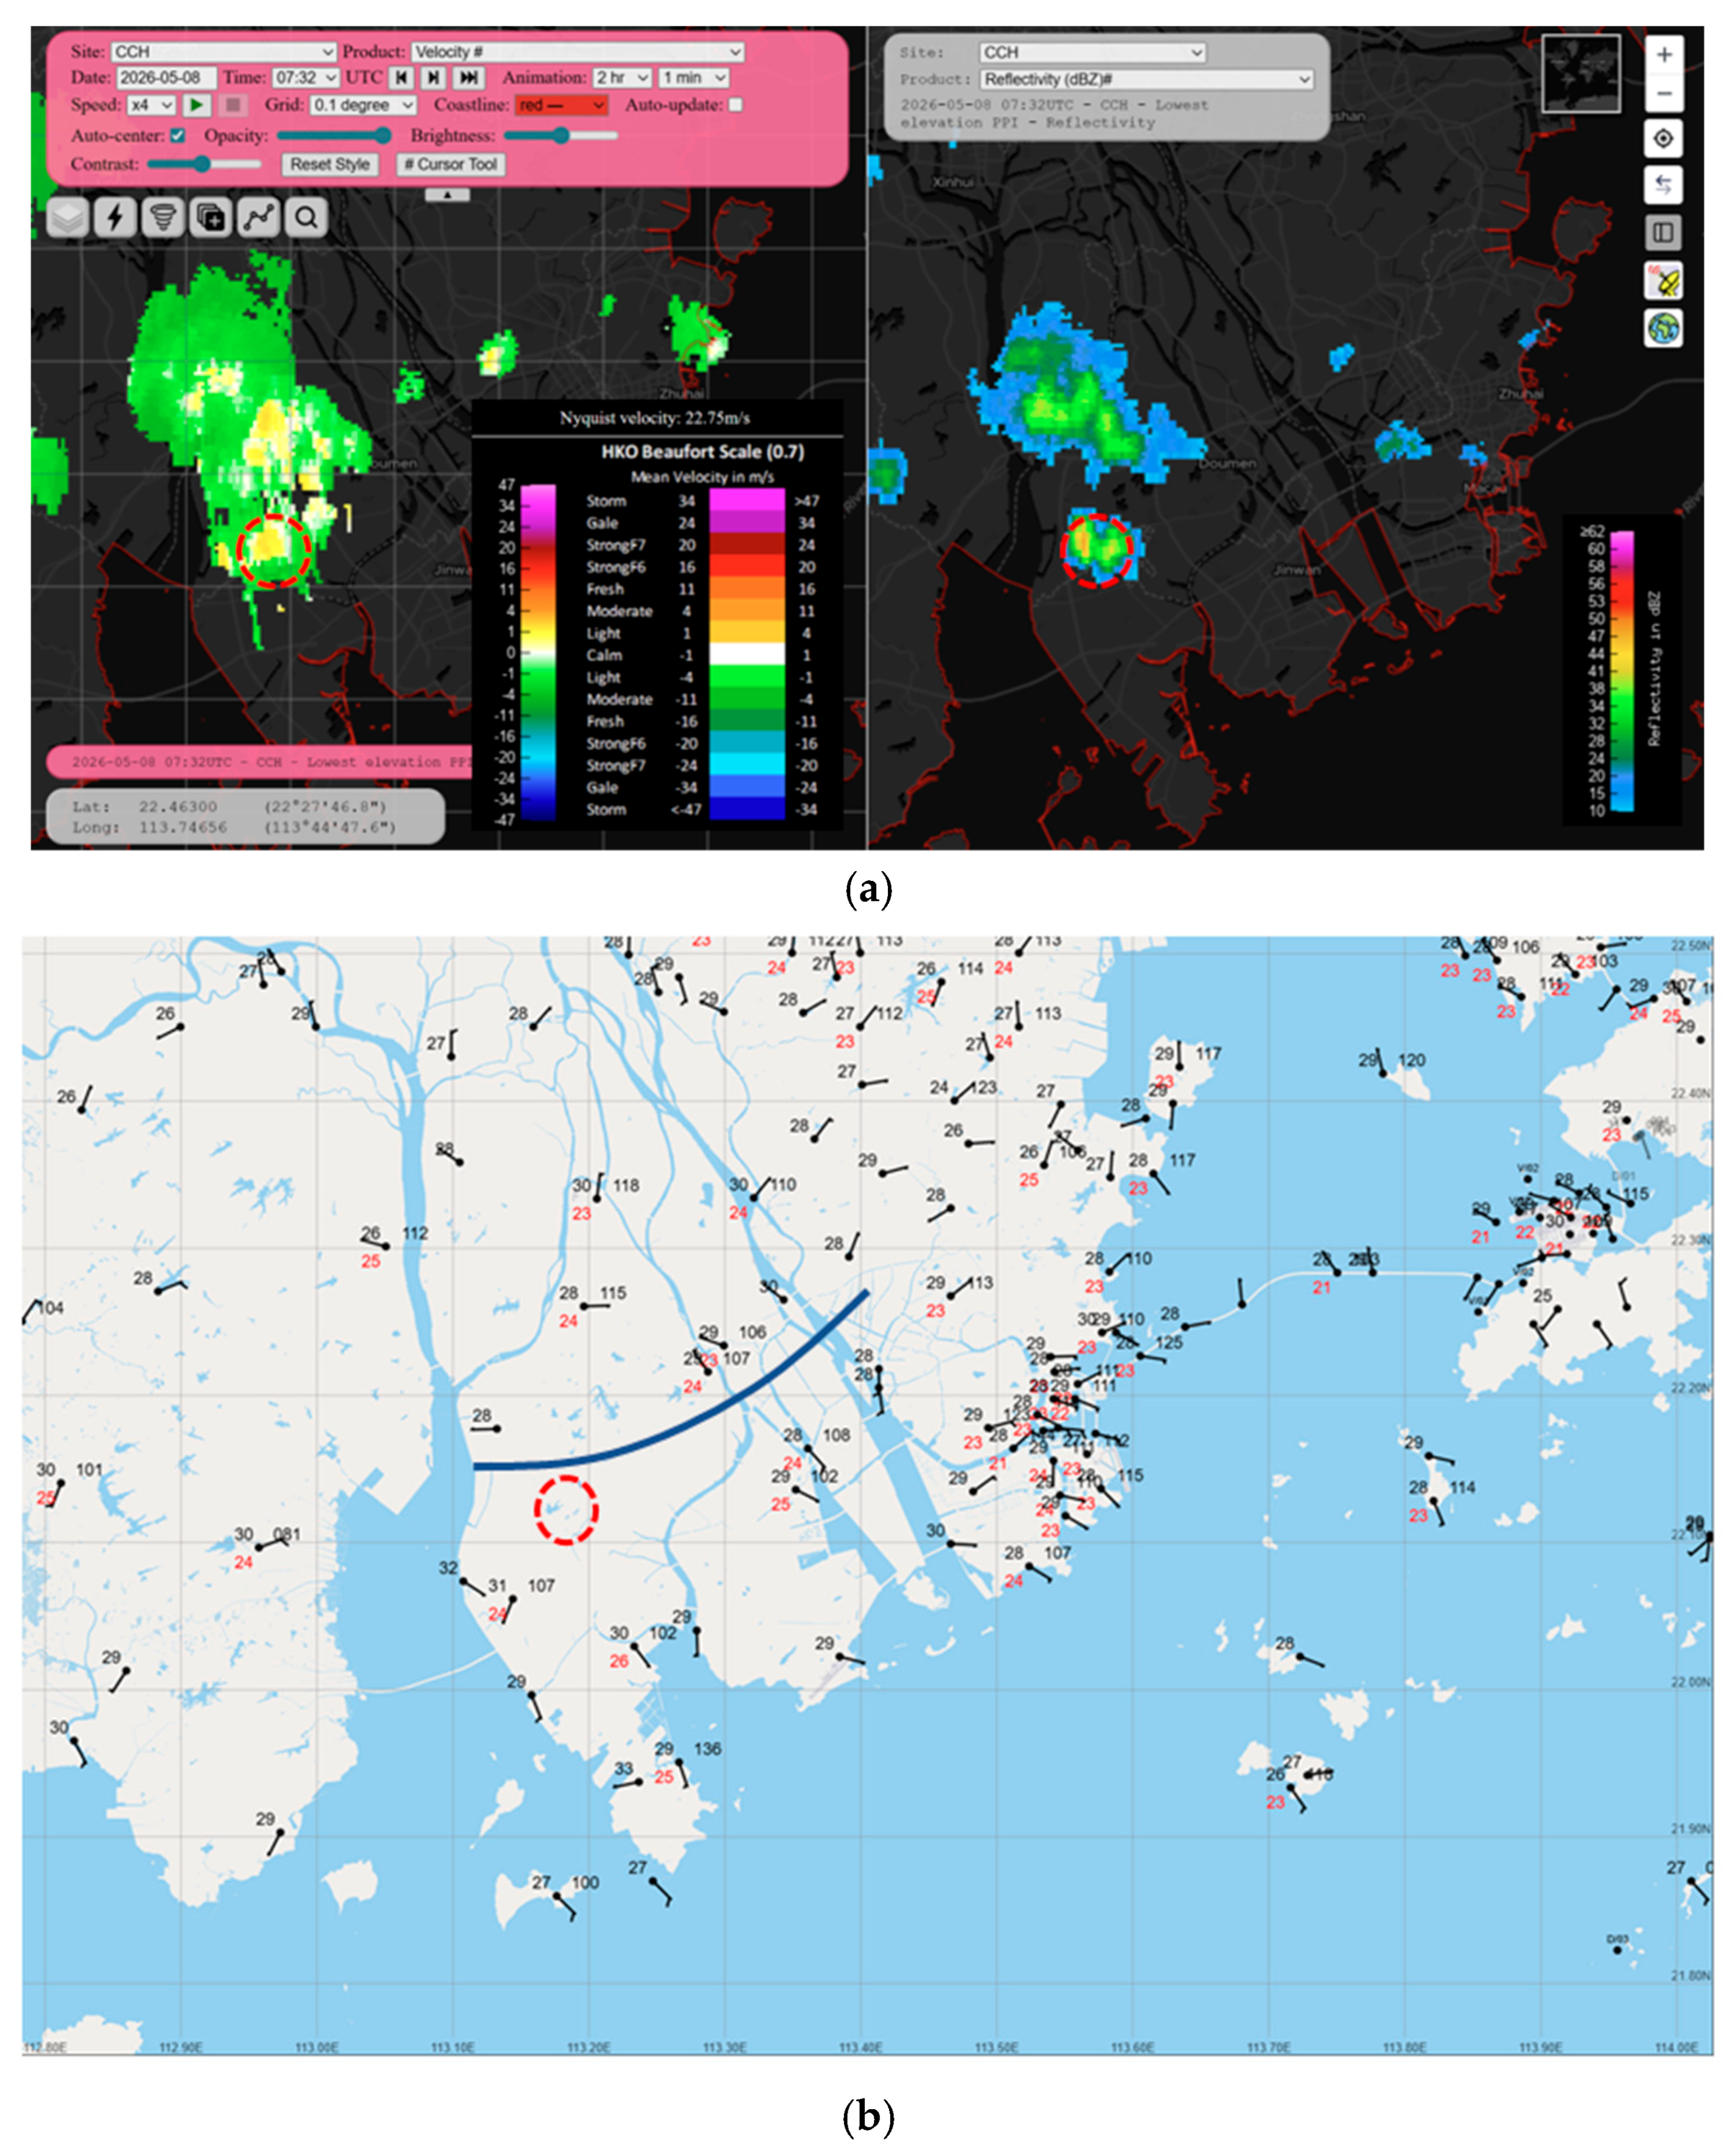
Based on the observation from the weather radar at Cheung Chau, the radar echo that could be associated with the funnel cloud is shown in Figure 2a, with the Doppler velocity imagery on the left and the reflectivity imagery on the right. The images are based on a 0.8-degree plan position indicator (PPI) scan of this radar. The reflectivity is not particularly high, about 50 dBZ. The Doppler velocity of the associated mesocyclone is minimal, approximately 3 m/s; however, the velocity couplet signature remains distinct. The couplet is located at 22.13° N, 113.18° E (indicated by red circles in Figure 2). The surface wind observations in that region at 3:30 p.m. are shown in Figure 2b. There are no surface observations that are sufficiently close to the velocity couplet. Based on the available information, the winds are rather weak, with around 5 knots only. Nonetheless, a surface trough of low pressure (blue dotted line) can be analyzed near the location of the velocity couplet as shown in Figure 2b. Although the northerly wind to the north of the trough as well as the strength of the sea breeze to the south were both rather weak, the convergence of the two airstreams provided some degree of vorticity [27], which was the basis for the occurrence of the funnel cloud.
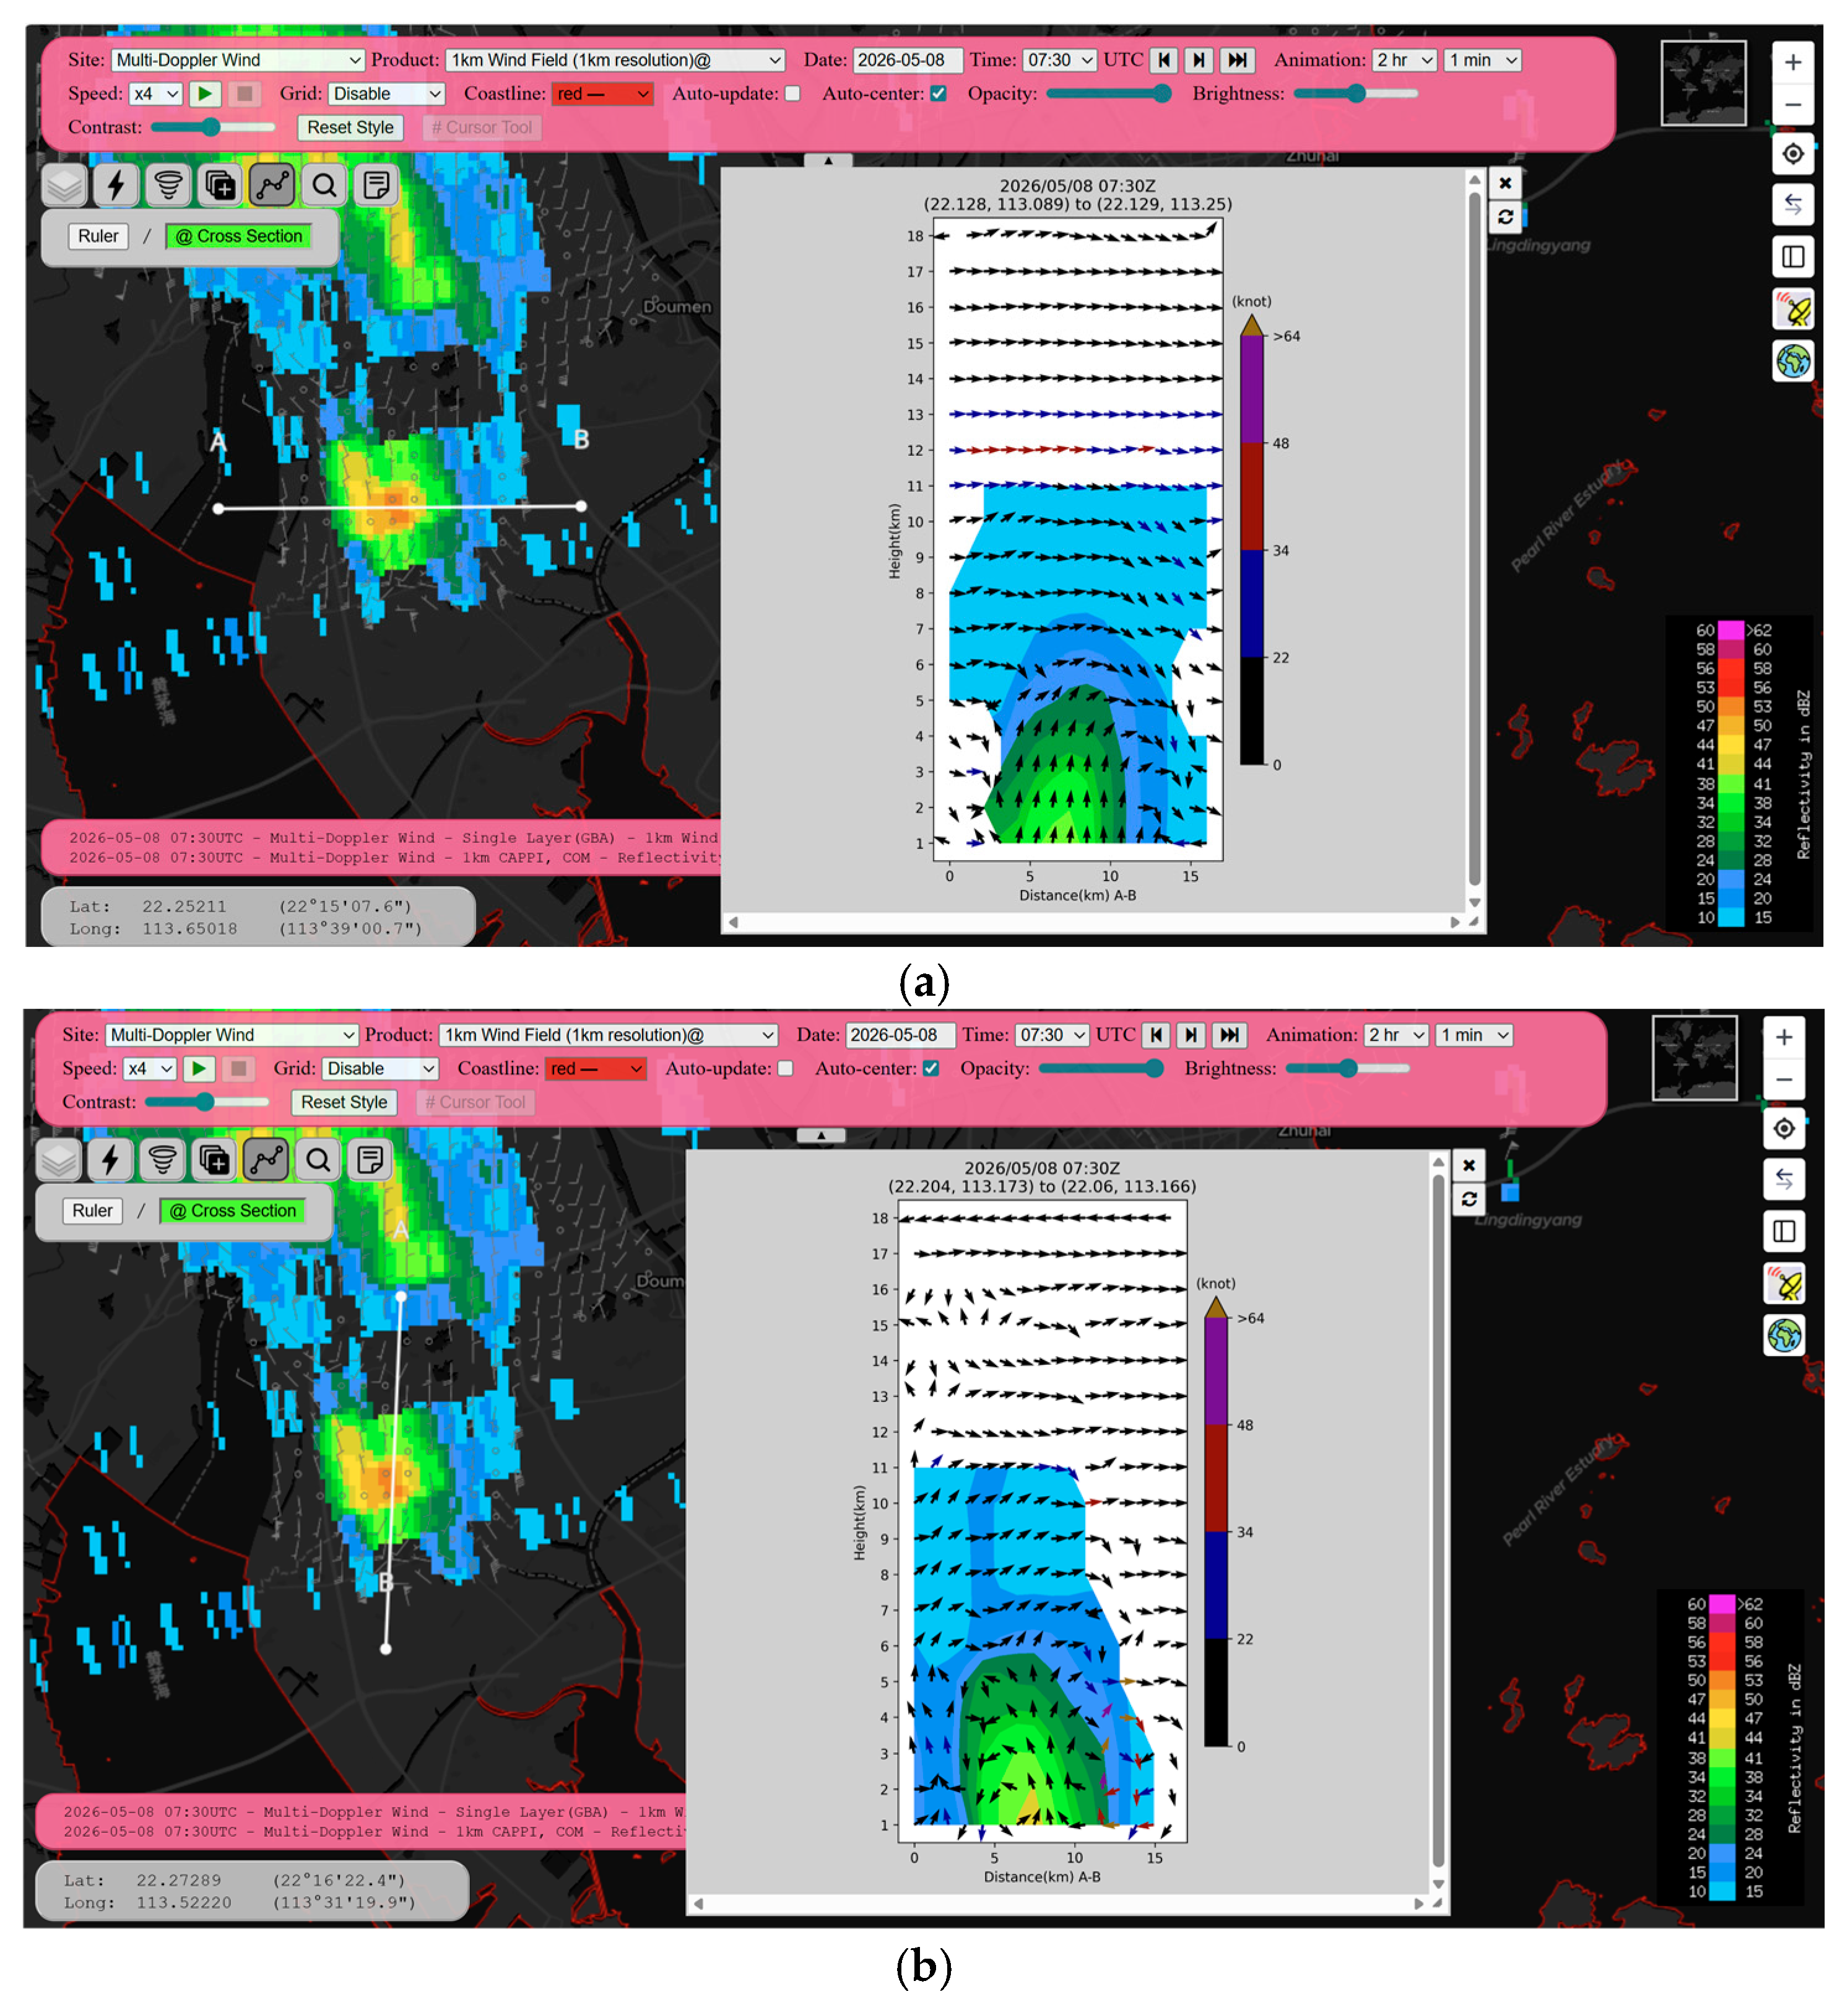
The reflectivity imageries taken from the 0-degree PPI scan of the radar at Tai Mo Shan (refer to Section 2.1) are shown in Figure 3. Two vertical cross-sections are made to show the reflectivity core associated with the funnel cloud. The east–west oriented cut is shown in Figure 3a, together with the vertical cross-section of the wind in the inset. Figure 3a shows the radar-analyzed wind at a height of 1 km above sea level. Low-level wind convergence was again identified from the 1 km winds, consistent with the surface wind observations. The winds were still light at 1 km level, with a wind speed generally in the order of 5 knots only. The low wind speed is shown in the analyzed wind in the vertical cross-section as well. However, there was upward motion of the air up to a height of about 5 km above the sea surface within the radar reflectivity core.
The north–south oriented cross-section is shown in Figure 3b, together with the analyzed winds in the cross-section given in the inset. Within the radar reflectivity core (about 40 dBZ, yellow in colour), the air motion is generally upward up to a height of about 5 to 6 km above sea level. Slightly to the north of the radar reflectivity core, downward motion of the air is found between 1 km and 3 km above sea level, which is related to the downdraft of the rain cell.
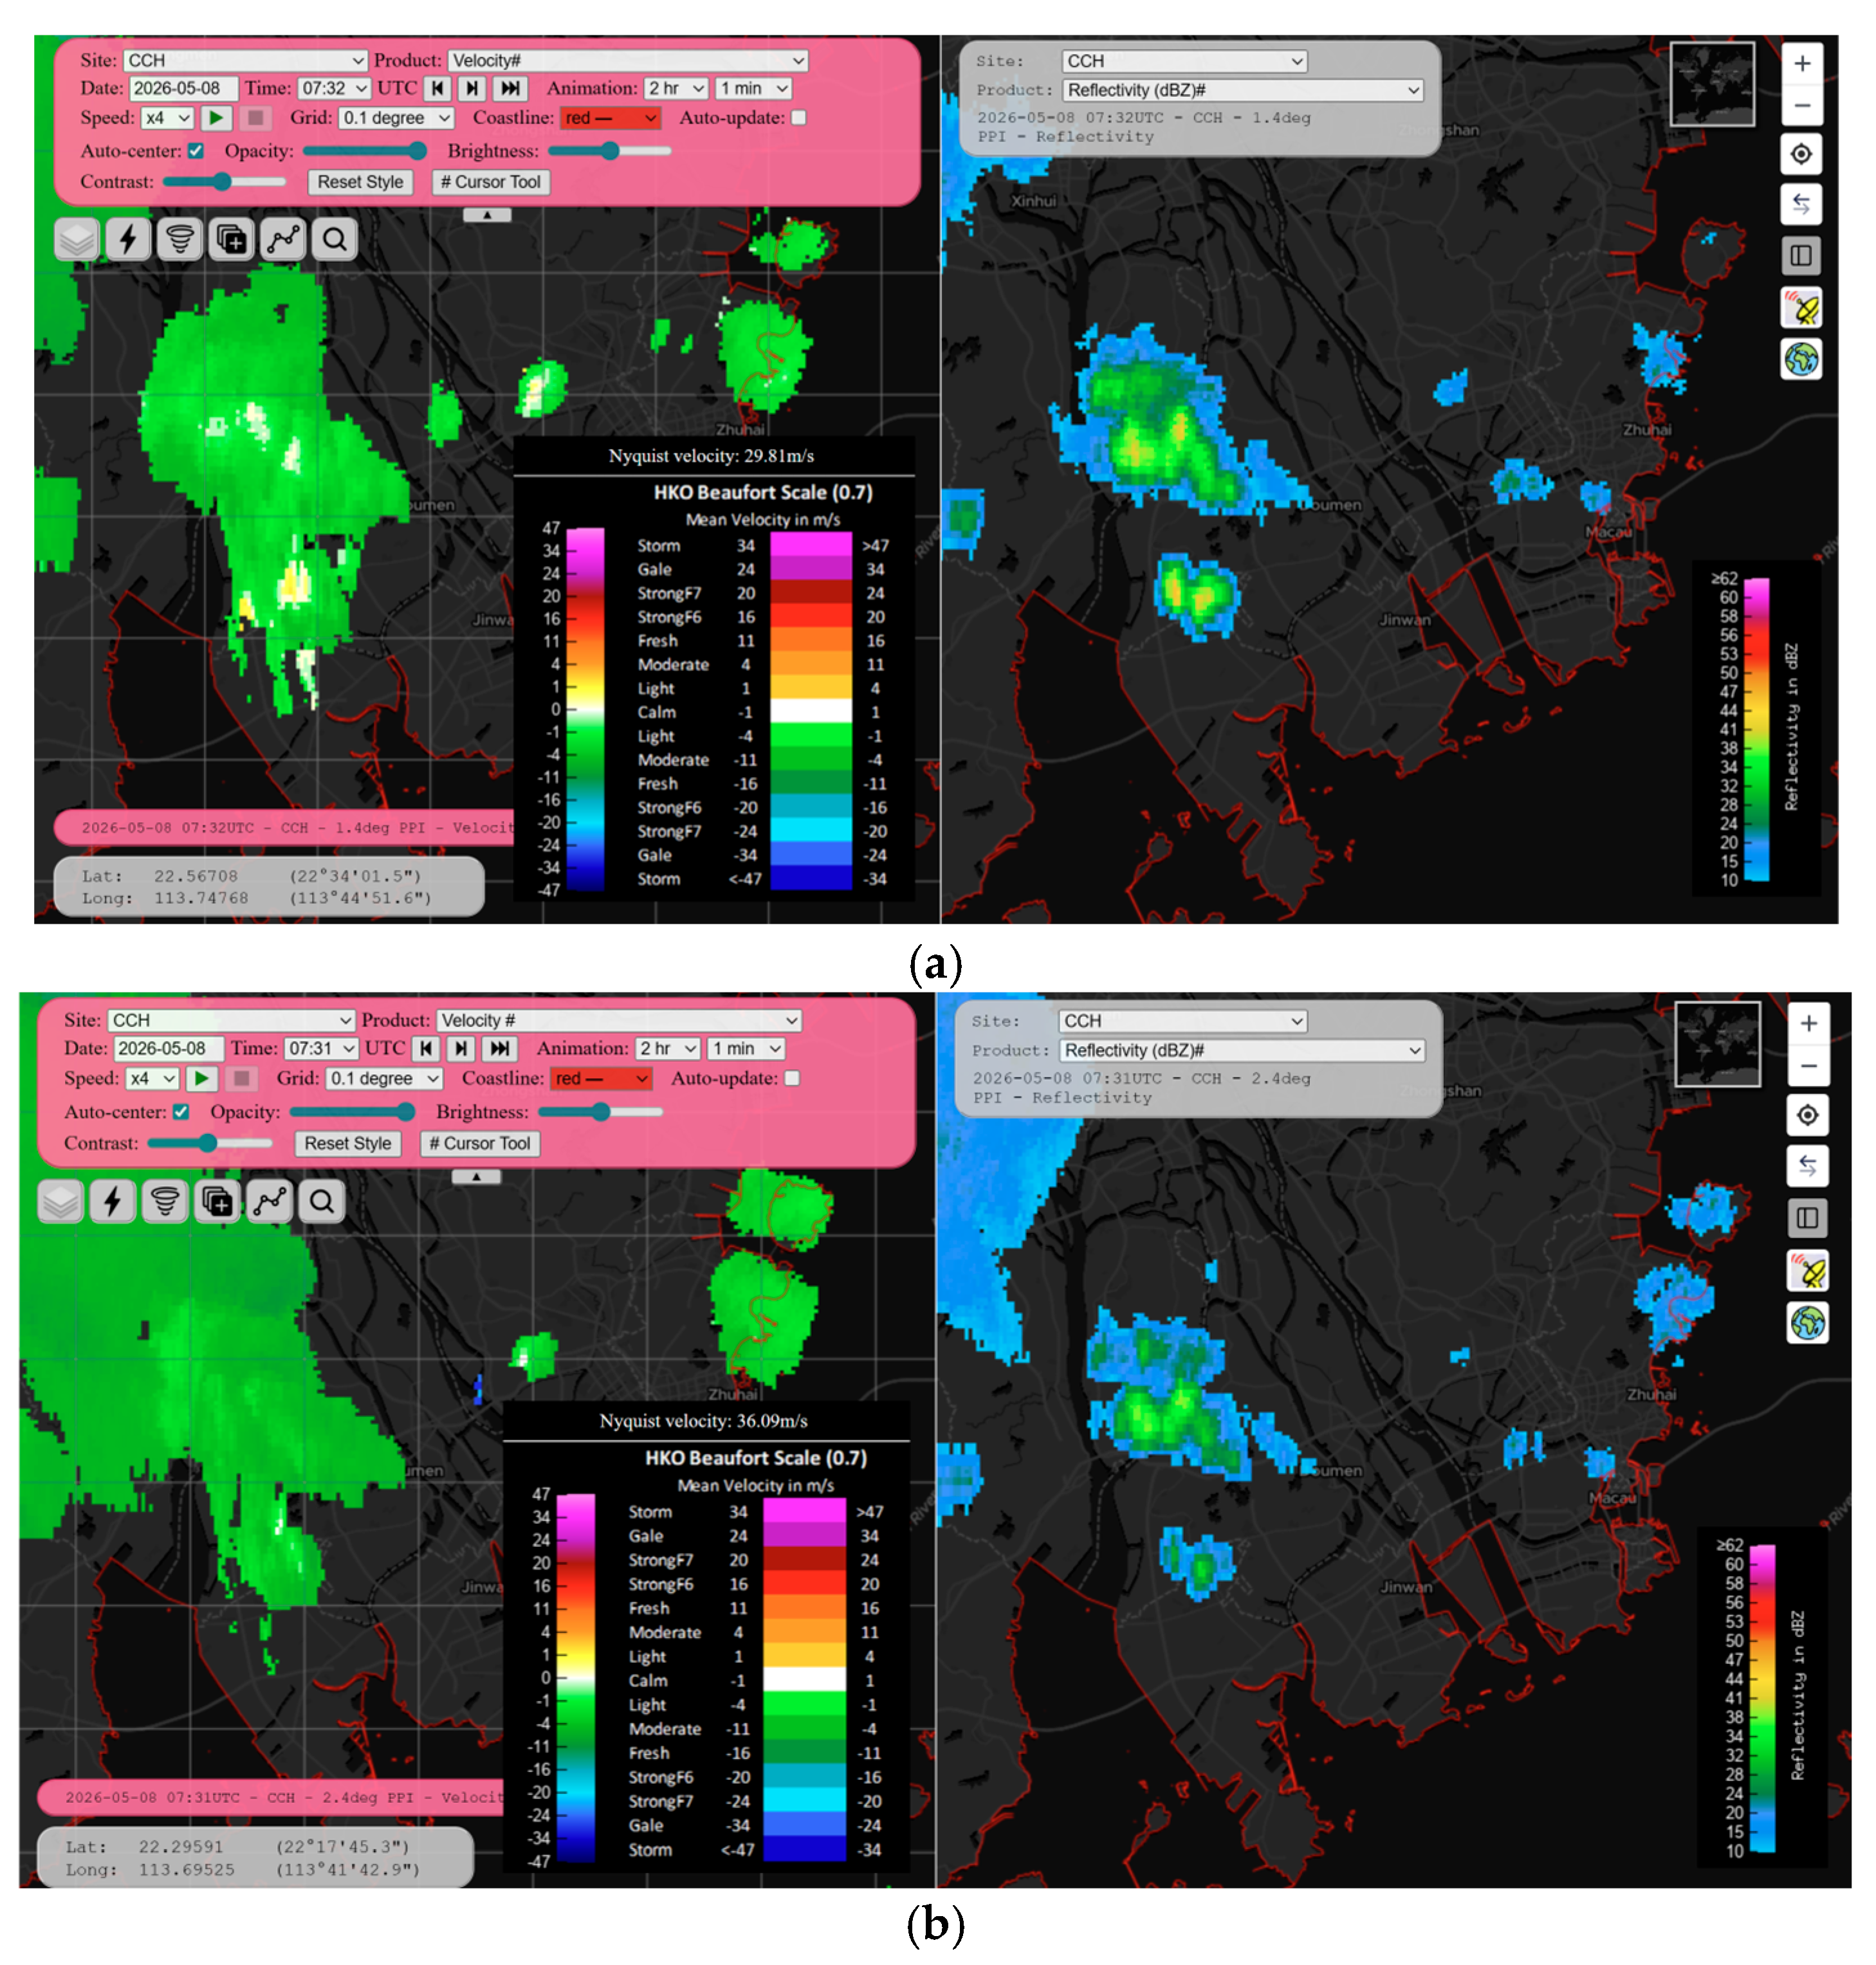
The radar taking the imagery in Figure 3 is located on a mountain with a height of about 1 km above mean sea level, and thus cannot capture the lower part of the mesocyclone associated with the funnel cloud. To study the vertical extent of the mesocyclone, measurements from the Cheung Chau weather radar are considered, namely, the 1.4-degree (Figure 4a) and 2.4-degree (Figure 4b) PPI scans. In each sub-figure, Doppler velocity is shown on the left-hand side and radar reflectivity is shown on the right-hand side. The 2.4-degree PPI corresponds to a height of about 4 km above sea level at the location of the mesocyclone. It could be seen that the velocity couplet as well as the radar reflectivity is barely discernible, which is consistent with the vertical cross-sections in Figure 3. The radar reflectivity core of the mesocyclone associated with the funnel cloud had a height of about 4 to 5 km above sea level. The convection was rather shallow and had barely reached the freezing level (4969 m) as obtained from the radiosonde ascent in Hong Kong at 00 UTC on that day.

3.2. Analysis of Radiometer, Hodograph and Wind Profiler Measurements

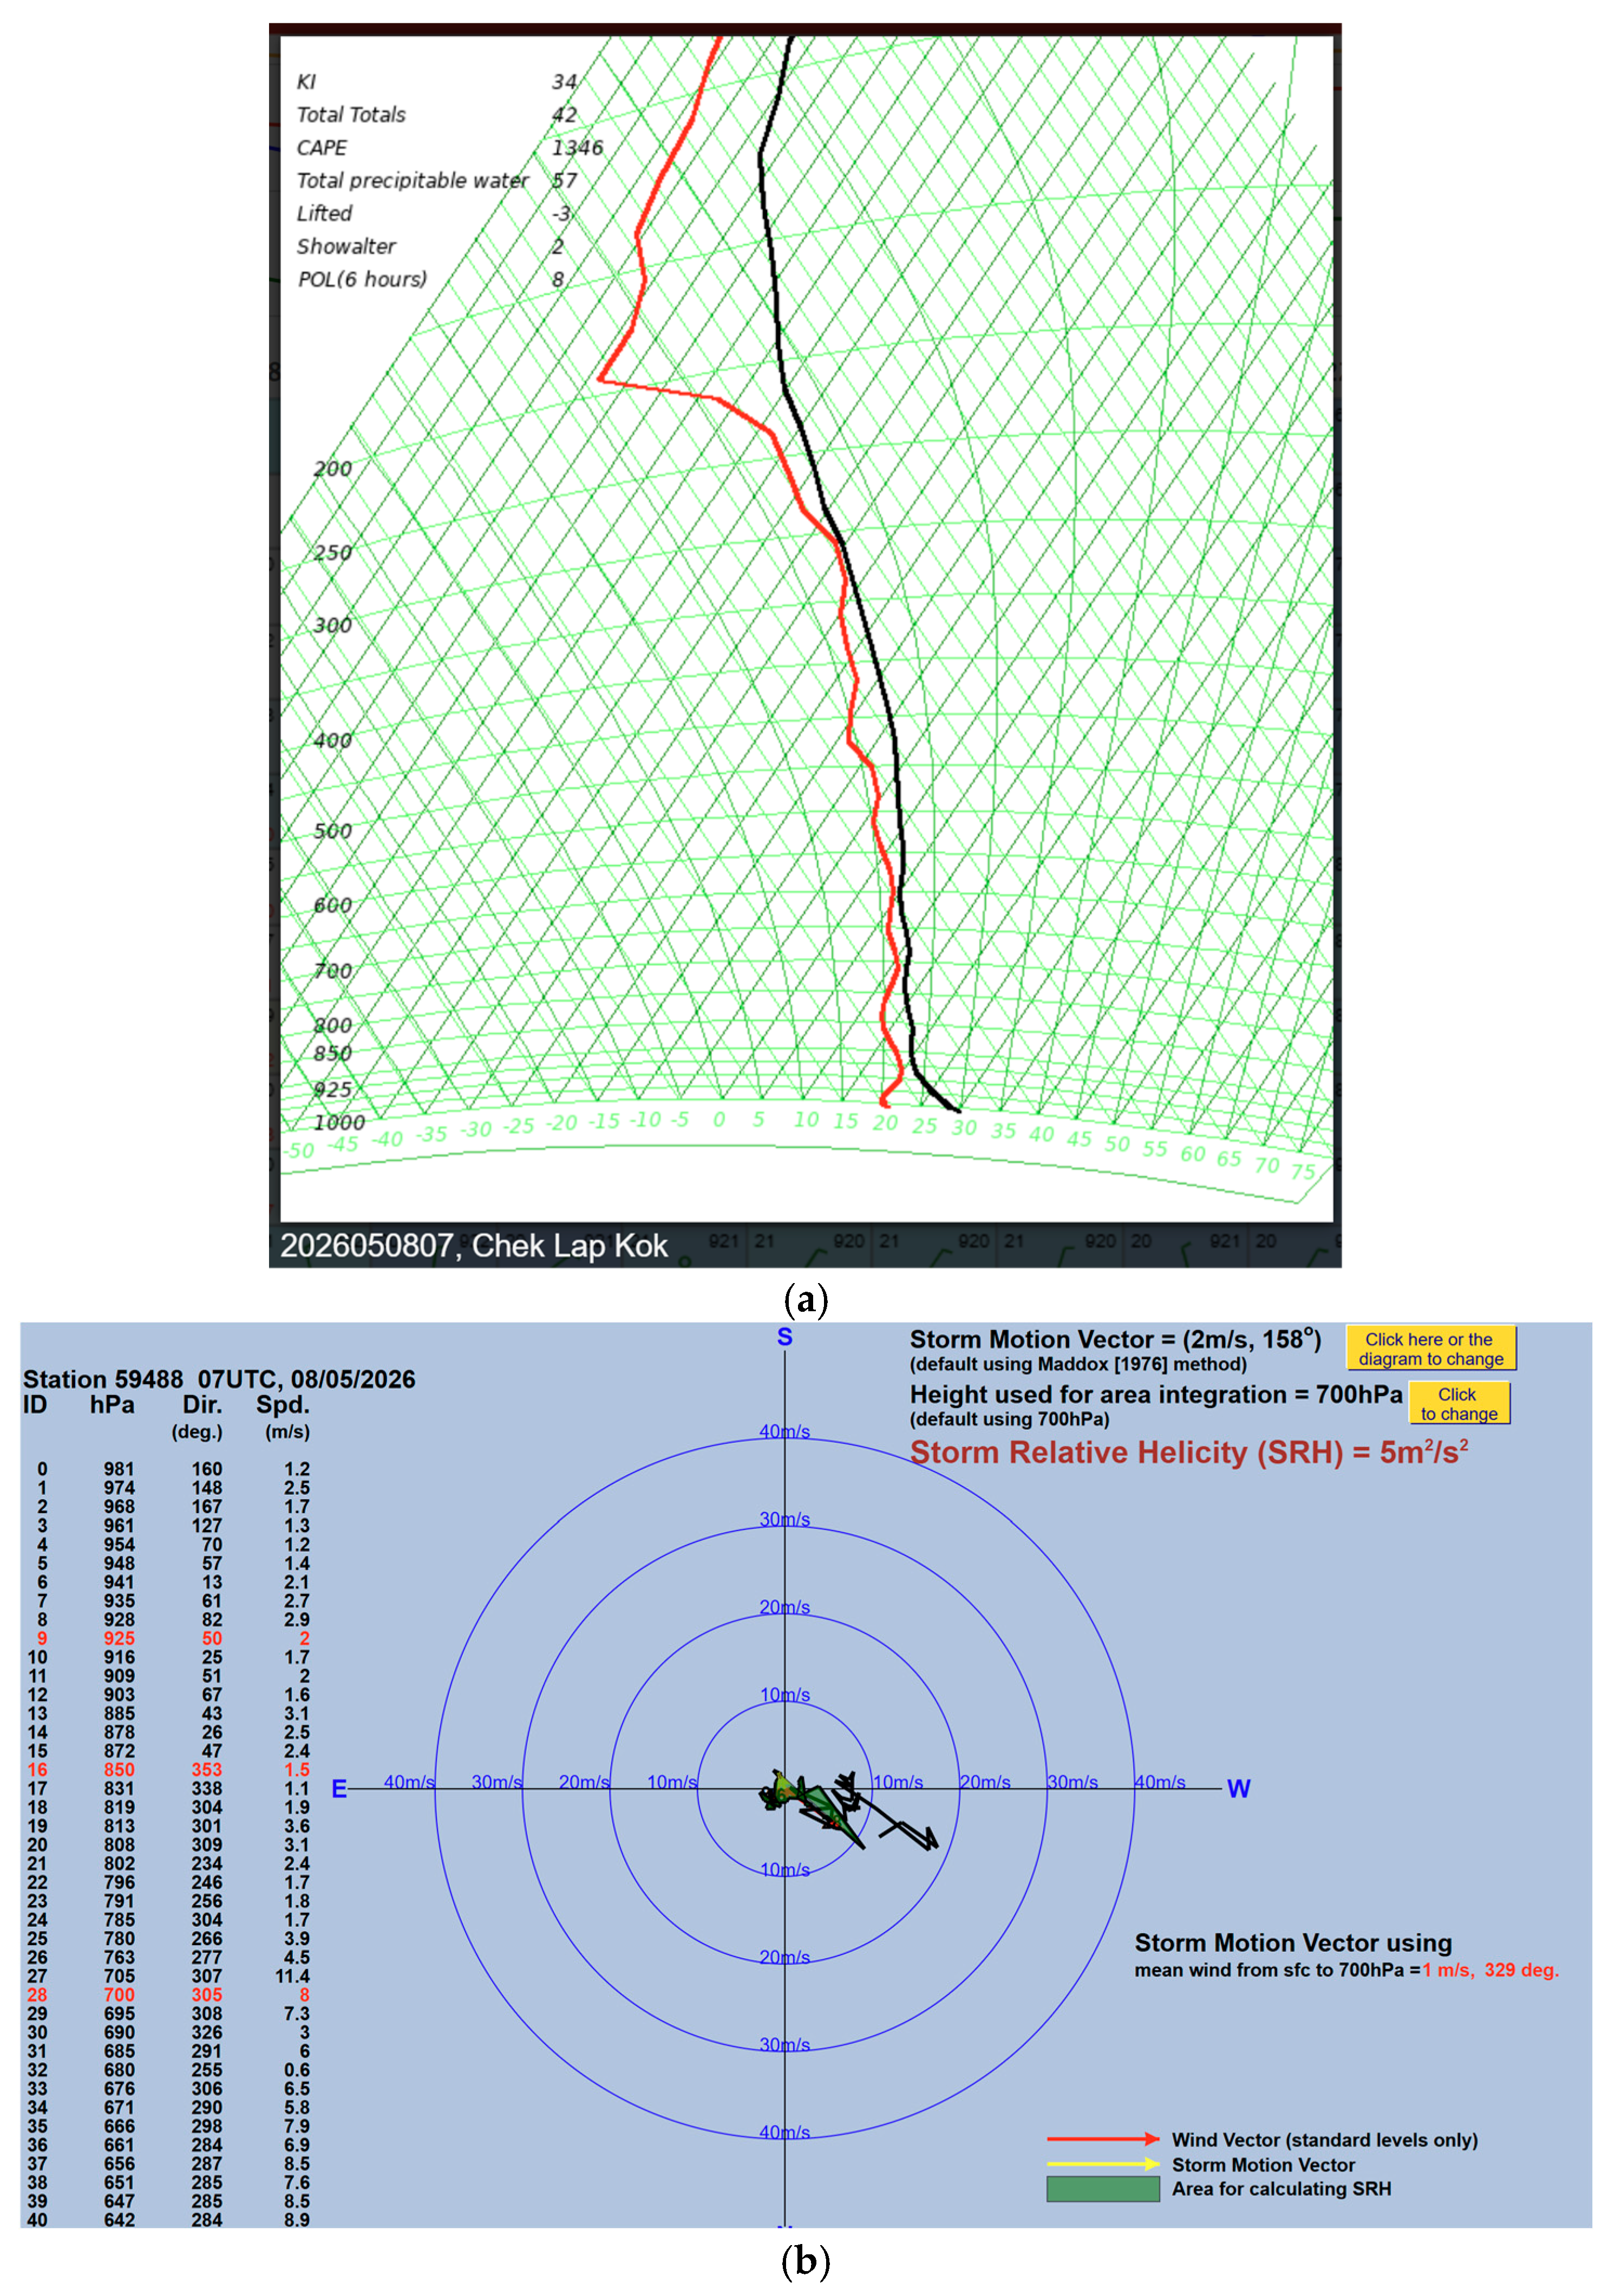
Radiosonde ascents were only available at 00 UTC and 12 UTC on 8 May 2026; thus, the thermodynamic background of the atmosphere closer to the time of the occurrence of the funnel cloud, namely, at 07 UTC, was considered using the microwave radiometer data at the Hong Kong International Airport, as shown in Figure 5a. The K-index (KI) was 34 °C and the convective available potential energy (CAPE) was 1346 J/kg. KI exceeding 30 °C was considered to have a high potential for thunderstorm activities [28], and the CAPE value indicated that the atmosphere was moderately unstable [29]. Apart from a shallow layer in the atmospheric boundary layer, the atmosphere was mostly close to saturation at that time. The total precipitable water vapour (PWV) was 57 mm, which was around the 75th percentile in the historical PWV measurement in April–May–June from 2016 to 2020 in Hong Kong. This suggested an abundant supply of moisture for the potential release of latent heat when air parcels were lifted and condensed [30]. Based on the radiometer data, the atmosphere was unstable and was in favour of convective development.
Storm relative helicity (SRH) is a parameter that quantifies the tendency for an uplifted air parcel to rotate [31], and is used to forecast the genesis of tornadoes [32]. From the 00 UTC radiosonde ascent in Hong Kong on that day, the storm relative helicity (SRH) was 35 m2/s2, which was not particularly high when compared with the average SRH in May from 2010 to 2020 (equal to 81 m2/s2). From the hodograph of Zhuhai at 07:30 UTC on that day as shown in Figure 5b, the SRH had a low value of 5 m2/s2 only. The storm motion vector was weak, with a speed of 2 m/s. The rain cell, once developed, would be slow moving, which was consistent with the radar observations.
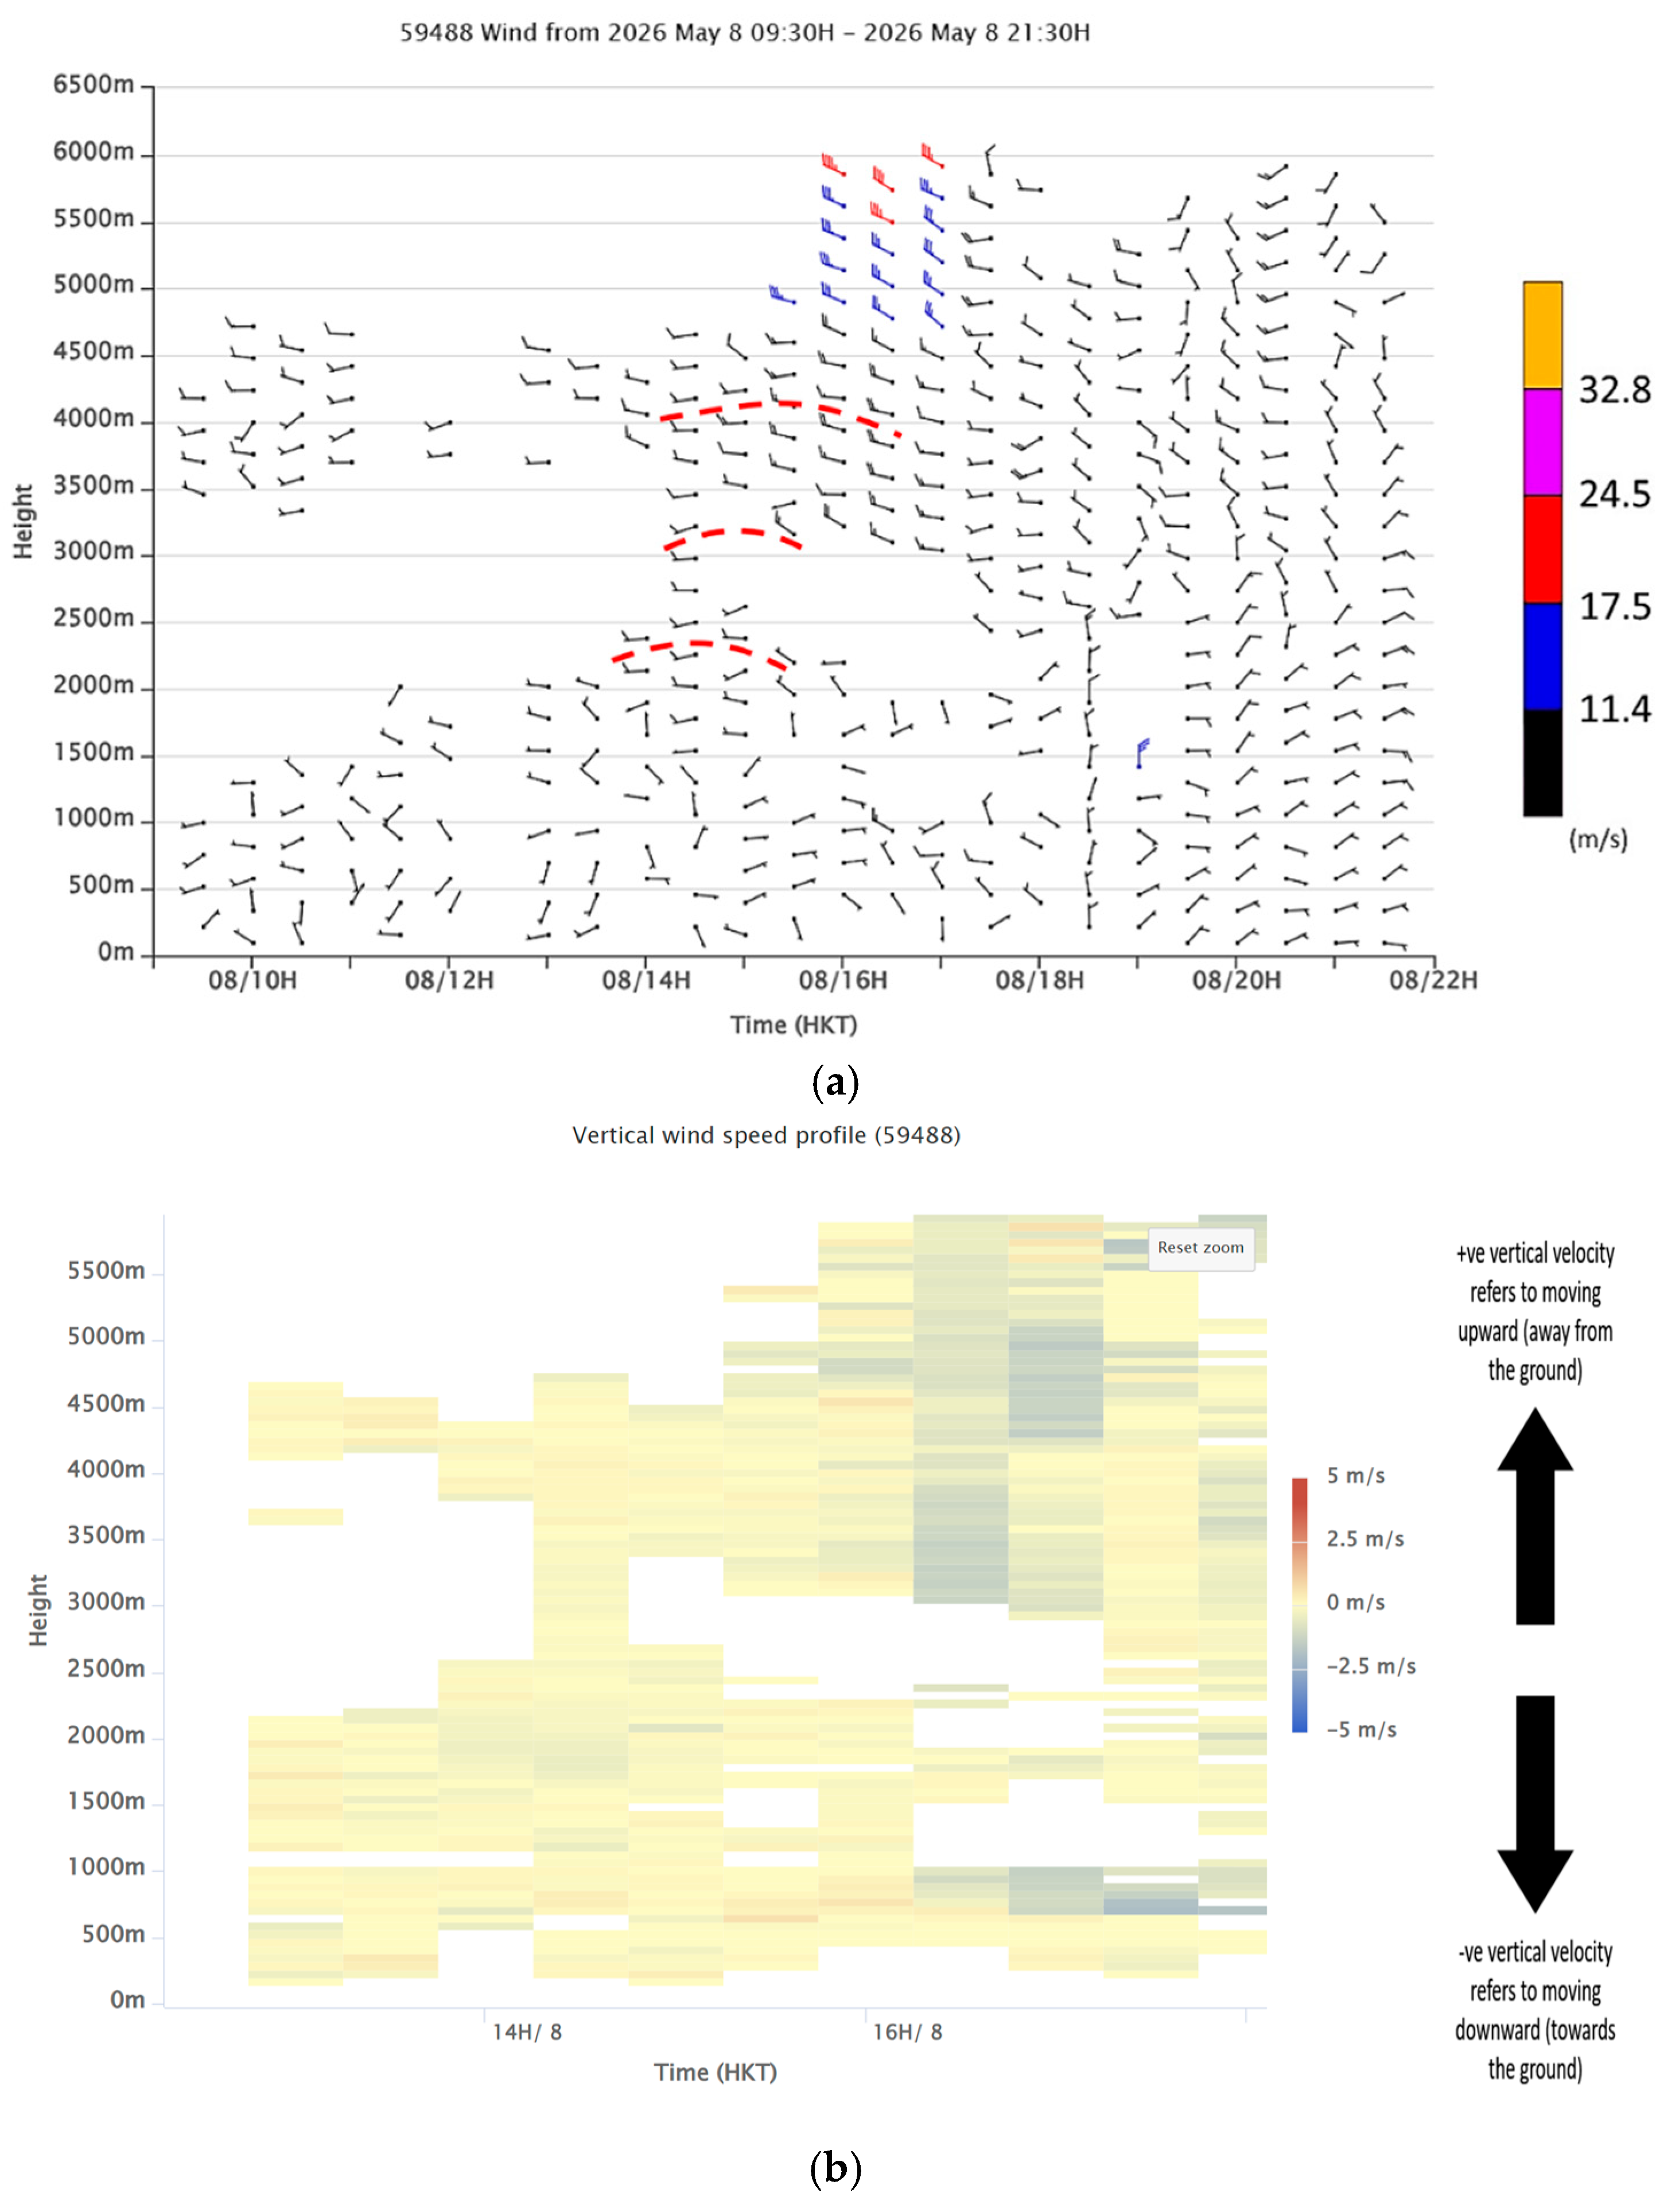
The time–height cross-section of the wind from the radar wind profiler at Zhuhai on 8 May 2026 is shown in Figure 6a. At about 3:30 p.m., the winds were light up to a height of about 2500 m. In the middle troposphere, the northwesterly winds were descending and a couple of waves were identified from 2000 m to 5000 m at around 3 p.m., as marked by red dotted lines in Figure 6a. The vertical velocity from this wind profiler is shown in Figure 6b. At 3:30 p.m., vertical motion was observed in the atmospheric boundary layer, with a weak upward velocity of 0.2 to 0.6 m/s. The upward motion was attributed to (a) passage of the mid-tropospheric waves [33], and (b) updraft arising from solar heating in the daytime [34], which helped stretch the vorticity in the atmospheric boundary layer to develop into a funnel cloud [35].

3.3. Forecasting of the Mesocyclone by NWP Models

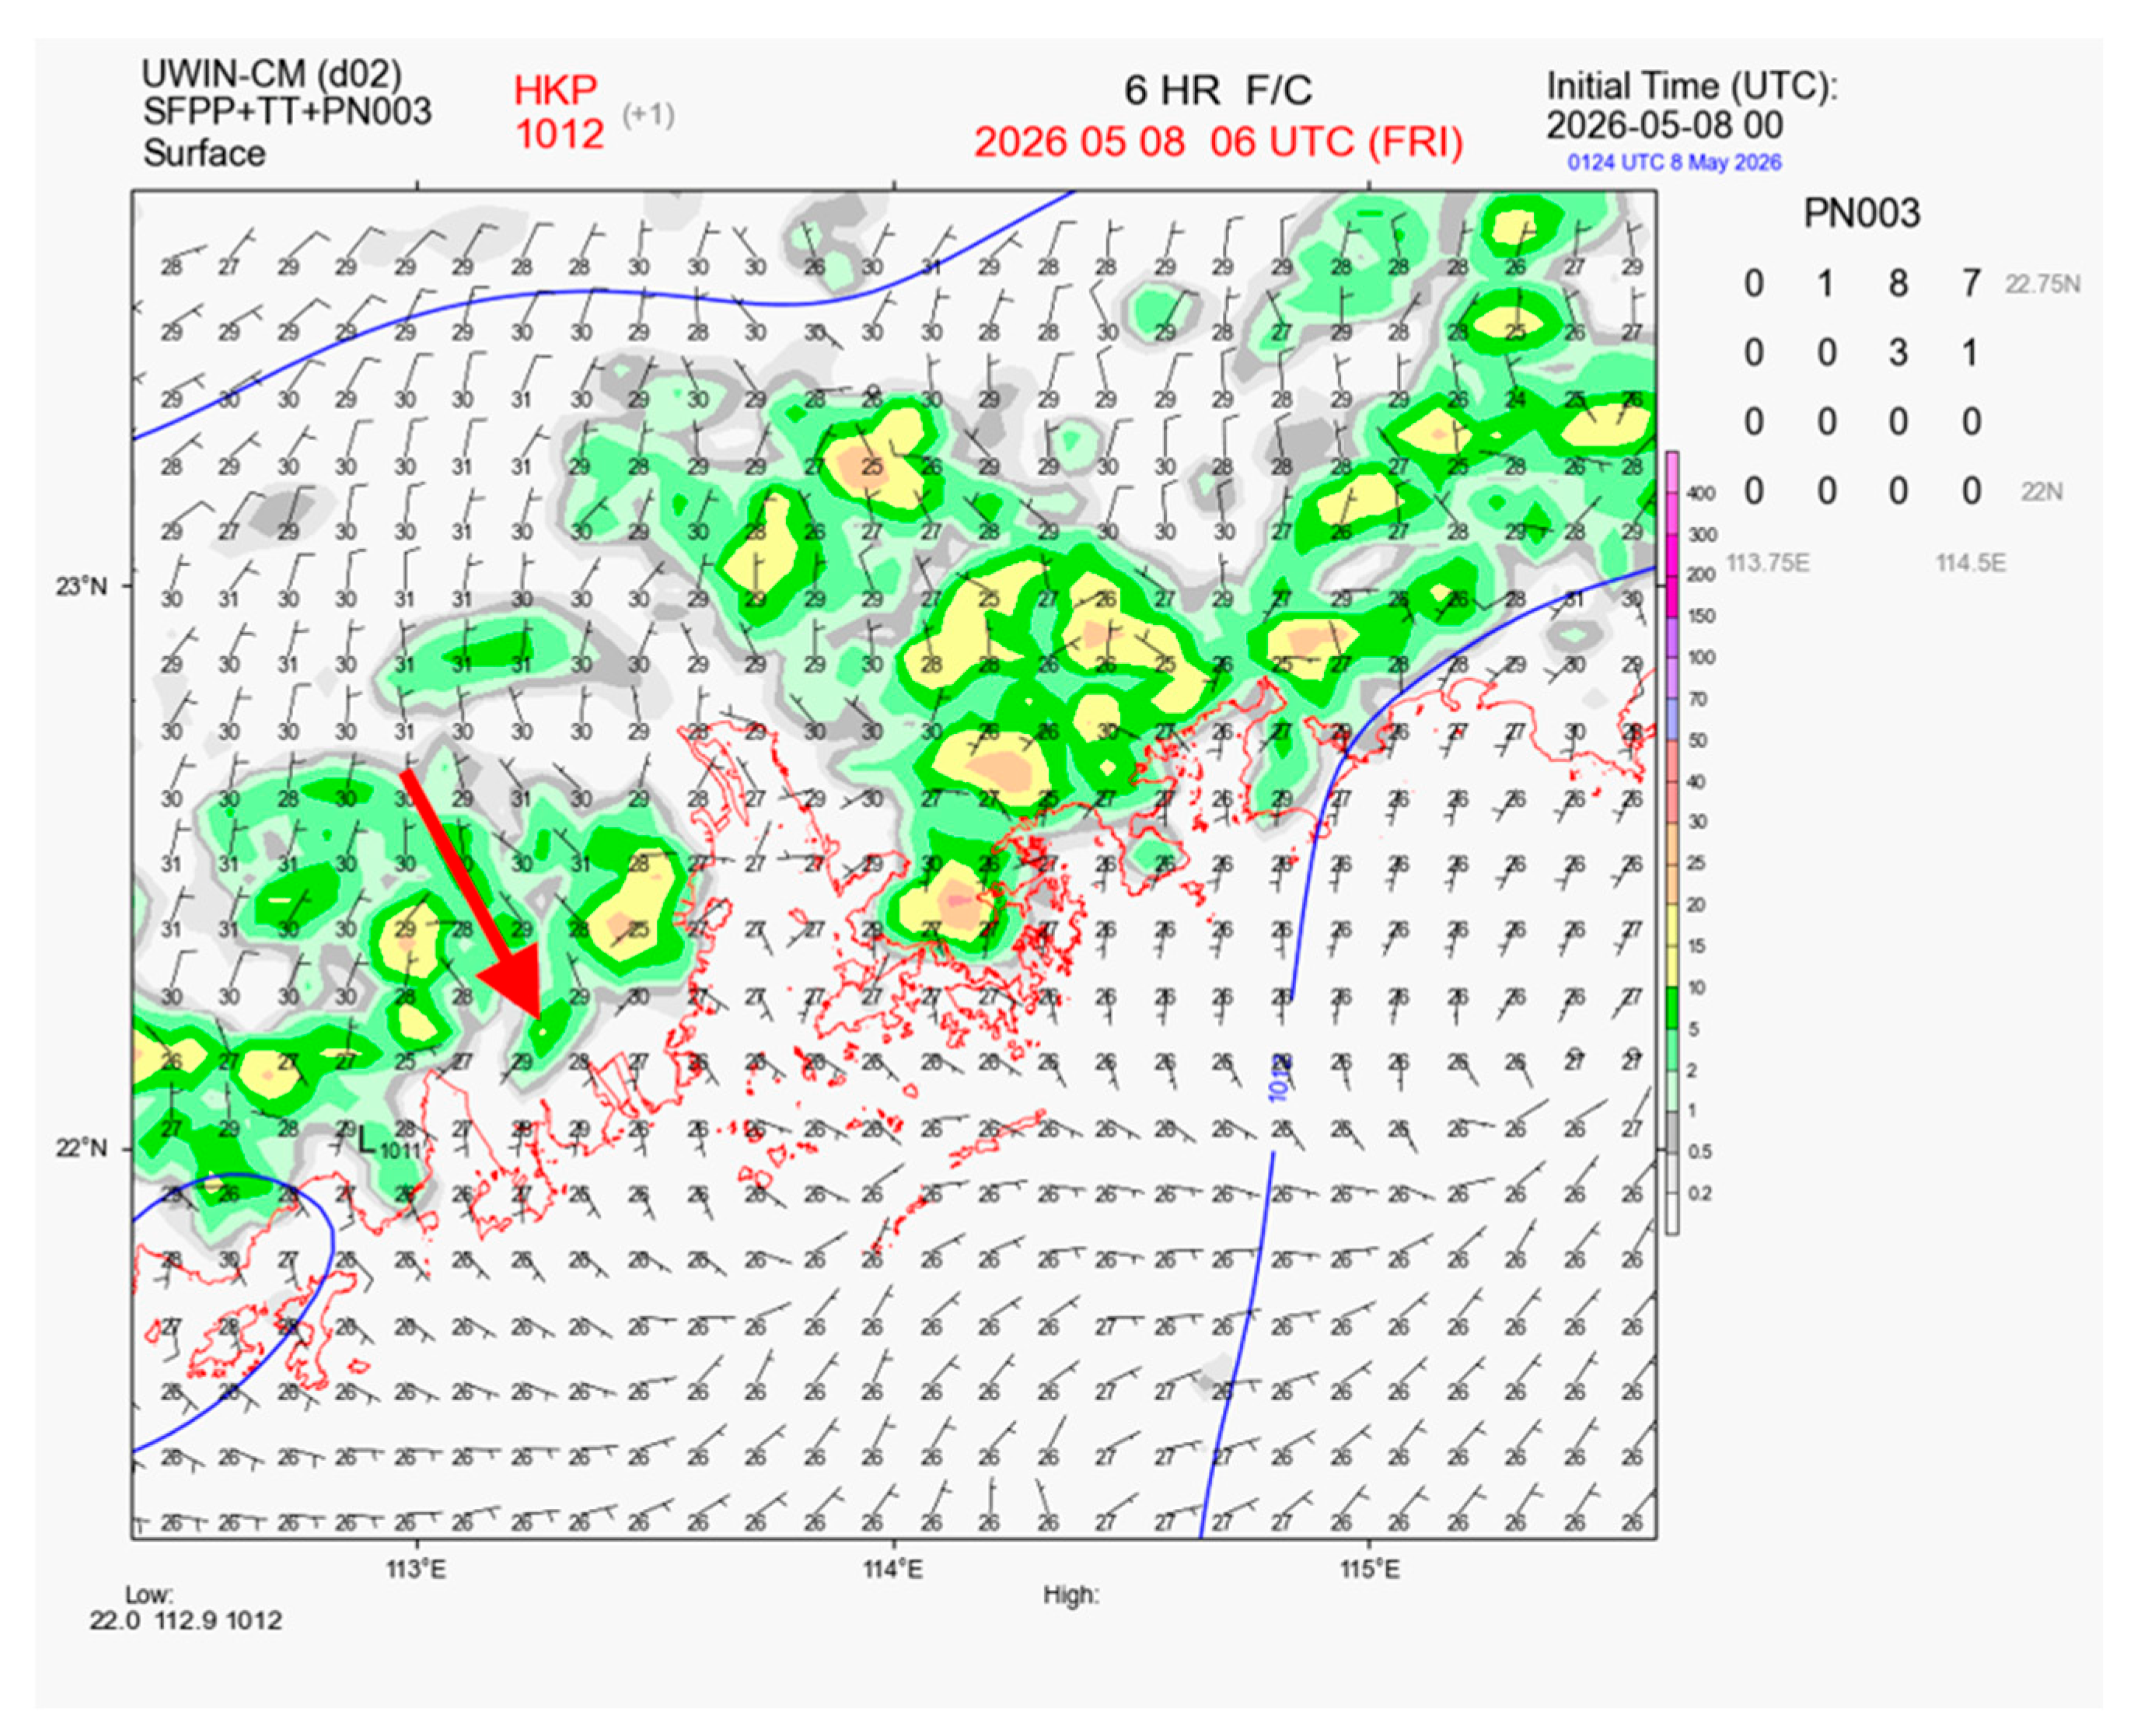
To provide more insight into the formation mechanism of the funnel cloud and to explore the feasibility of forecasting such a feature, numerical simulation from UWIN-CM (refer to Section 2.2) with an initial time at 00 UTC of 8 May 2026 was considered, and the 6th hour forecast is shown in Figure 7. An isolated rain cell near the location of the velocity couplet in Figure 2 was simulated (marked by red arrow in Figure 7 and Figure 8a), though the location was slightly displaced to the northeast compared with the actual observation (Figure 2).
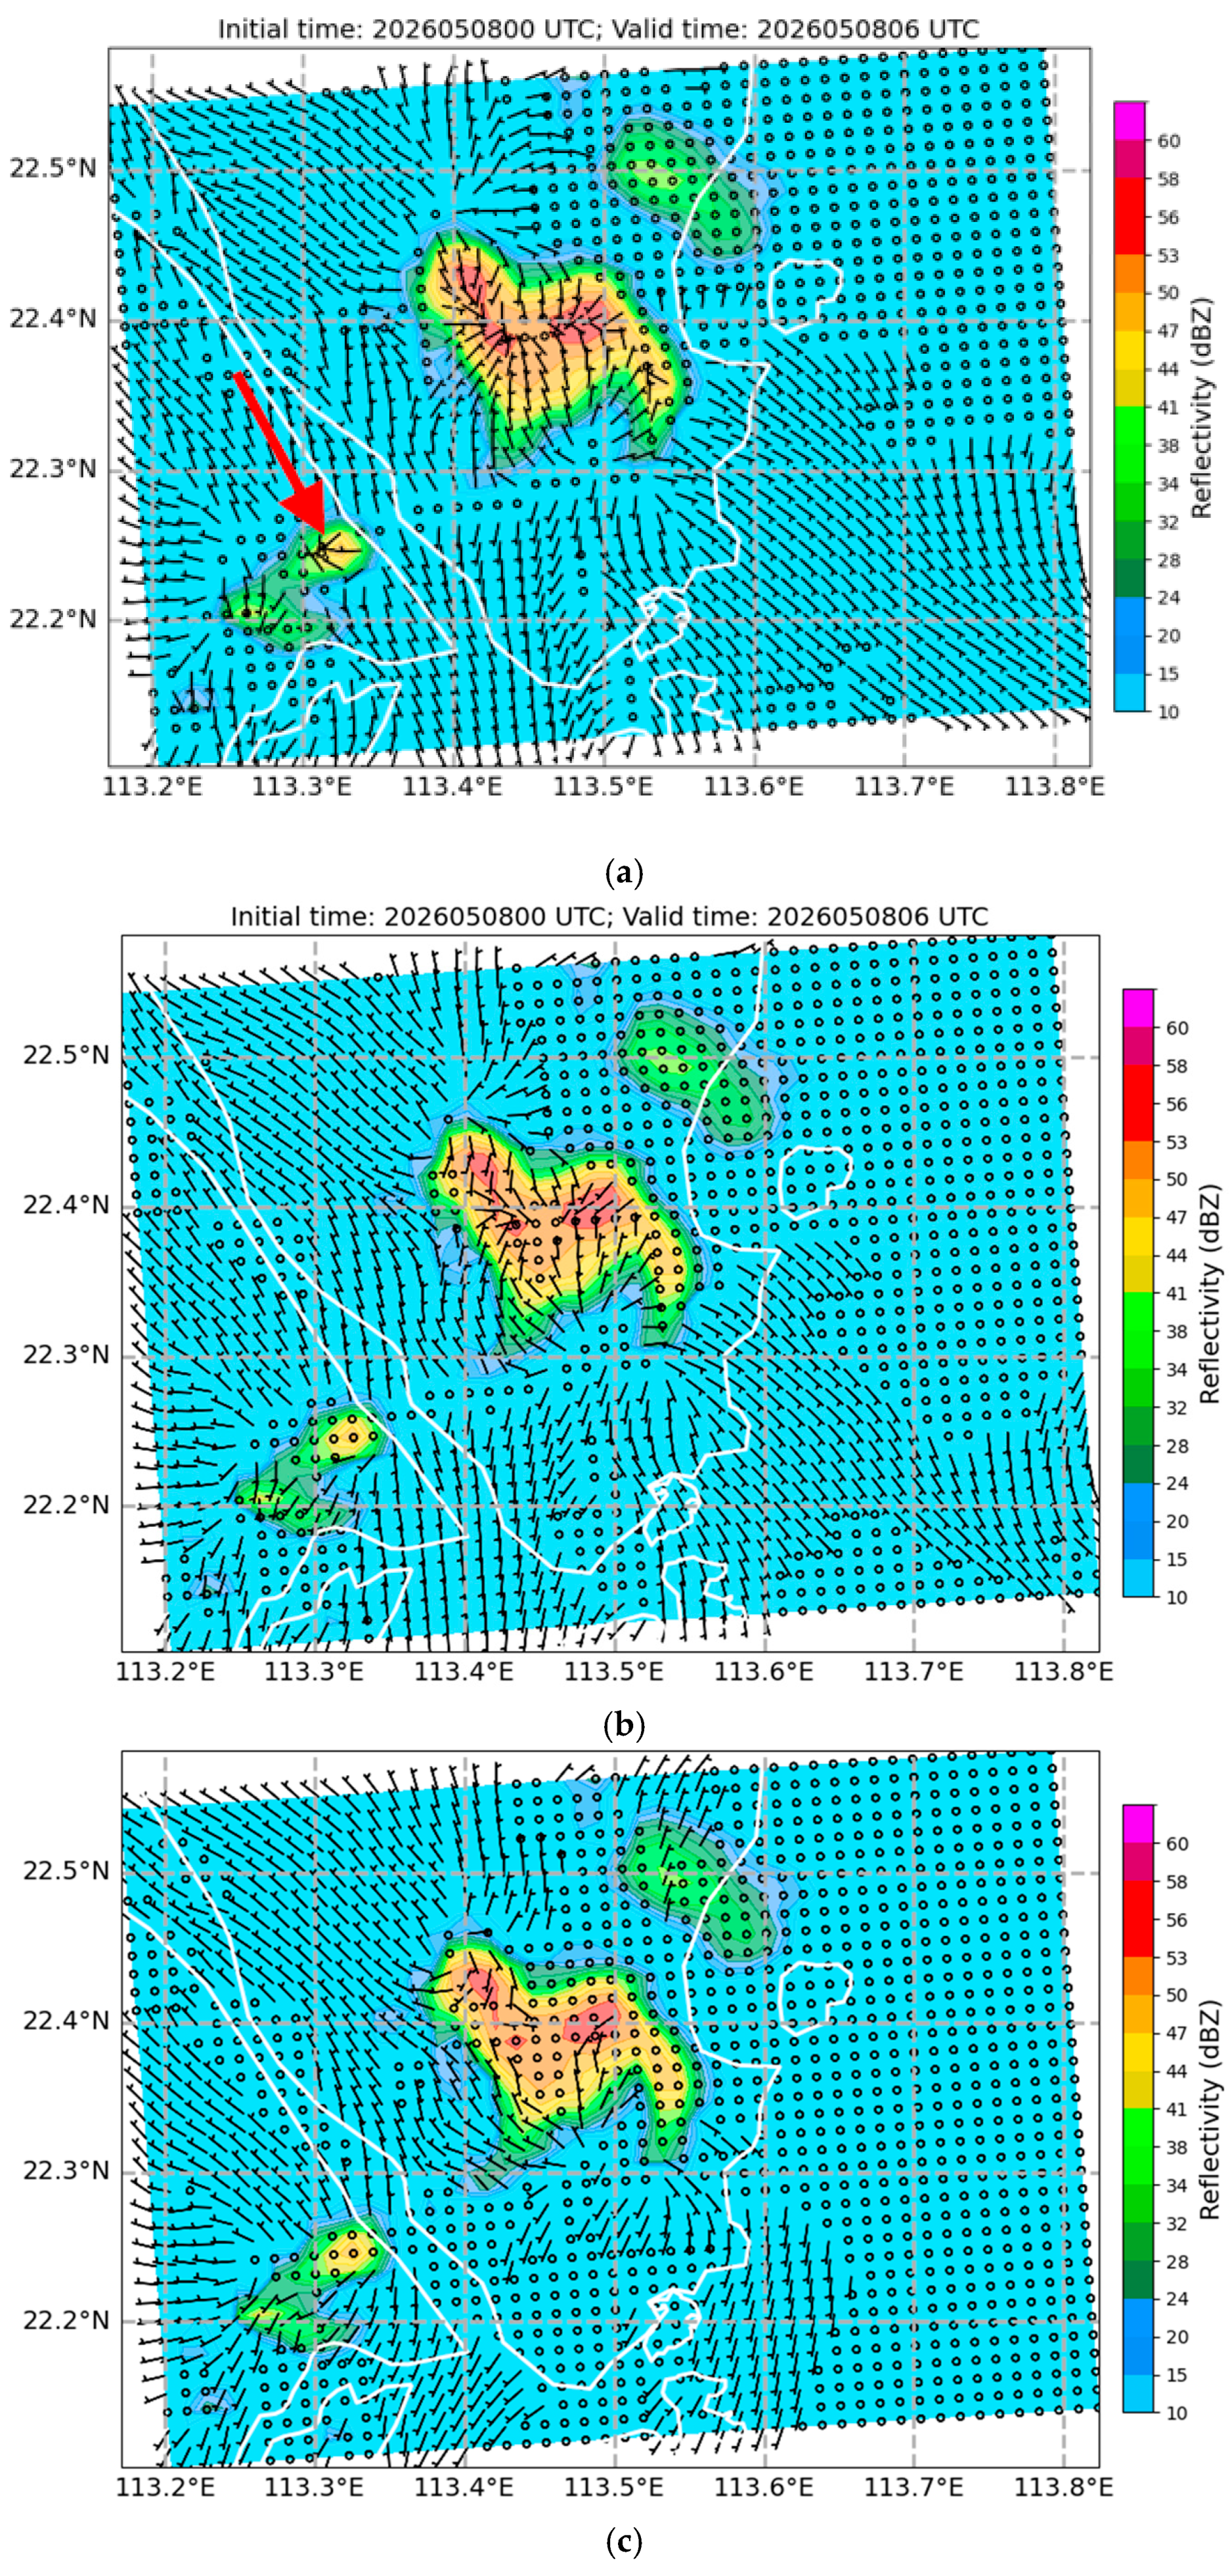
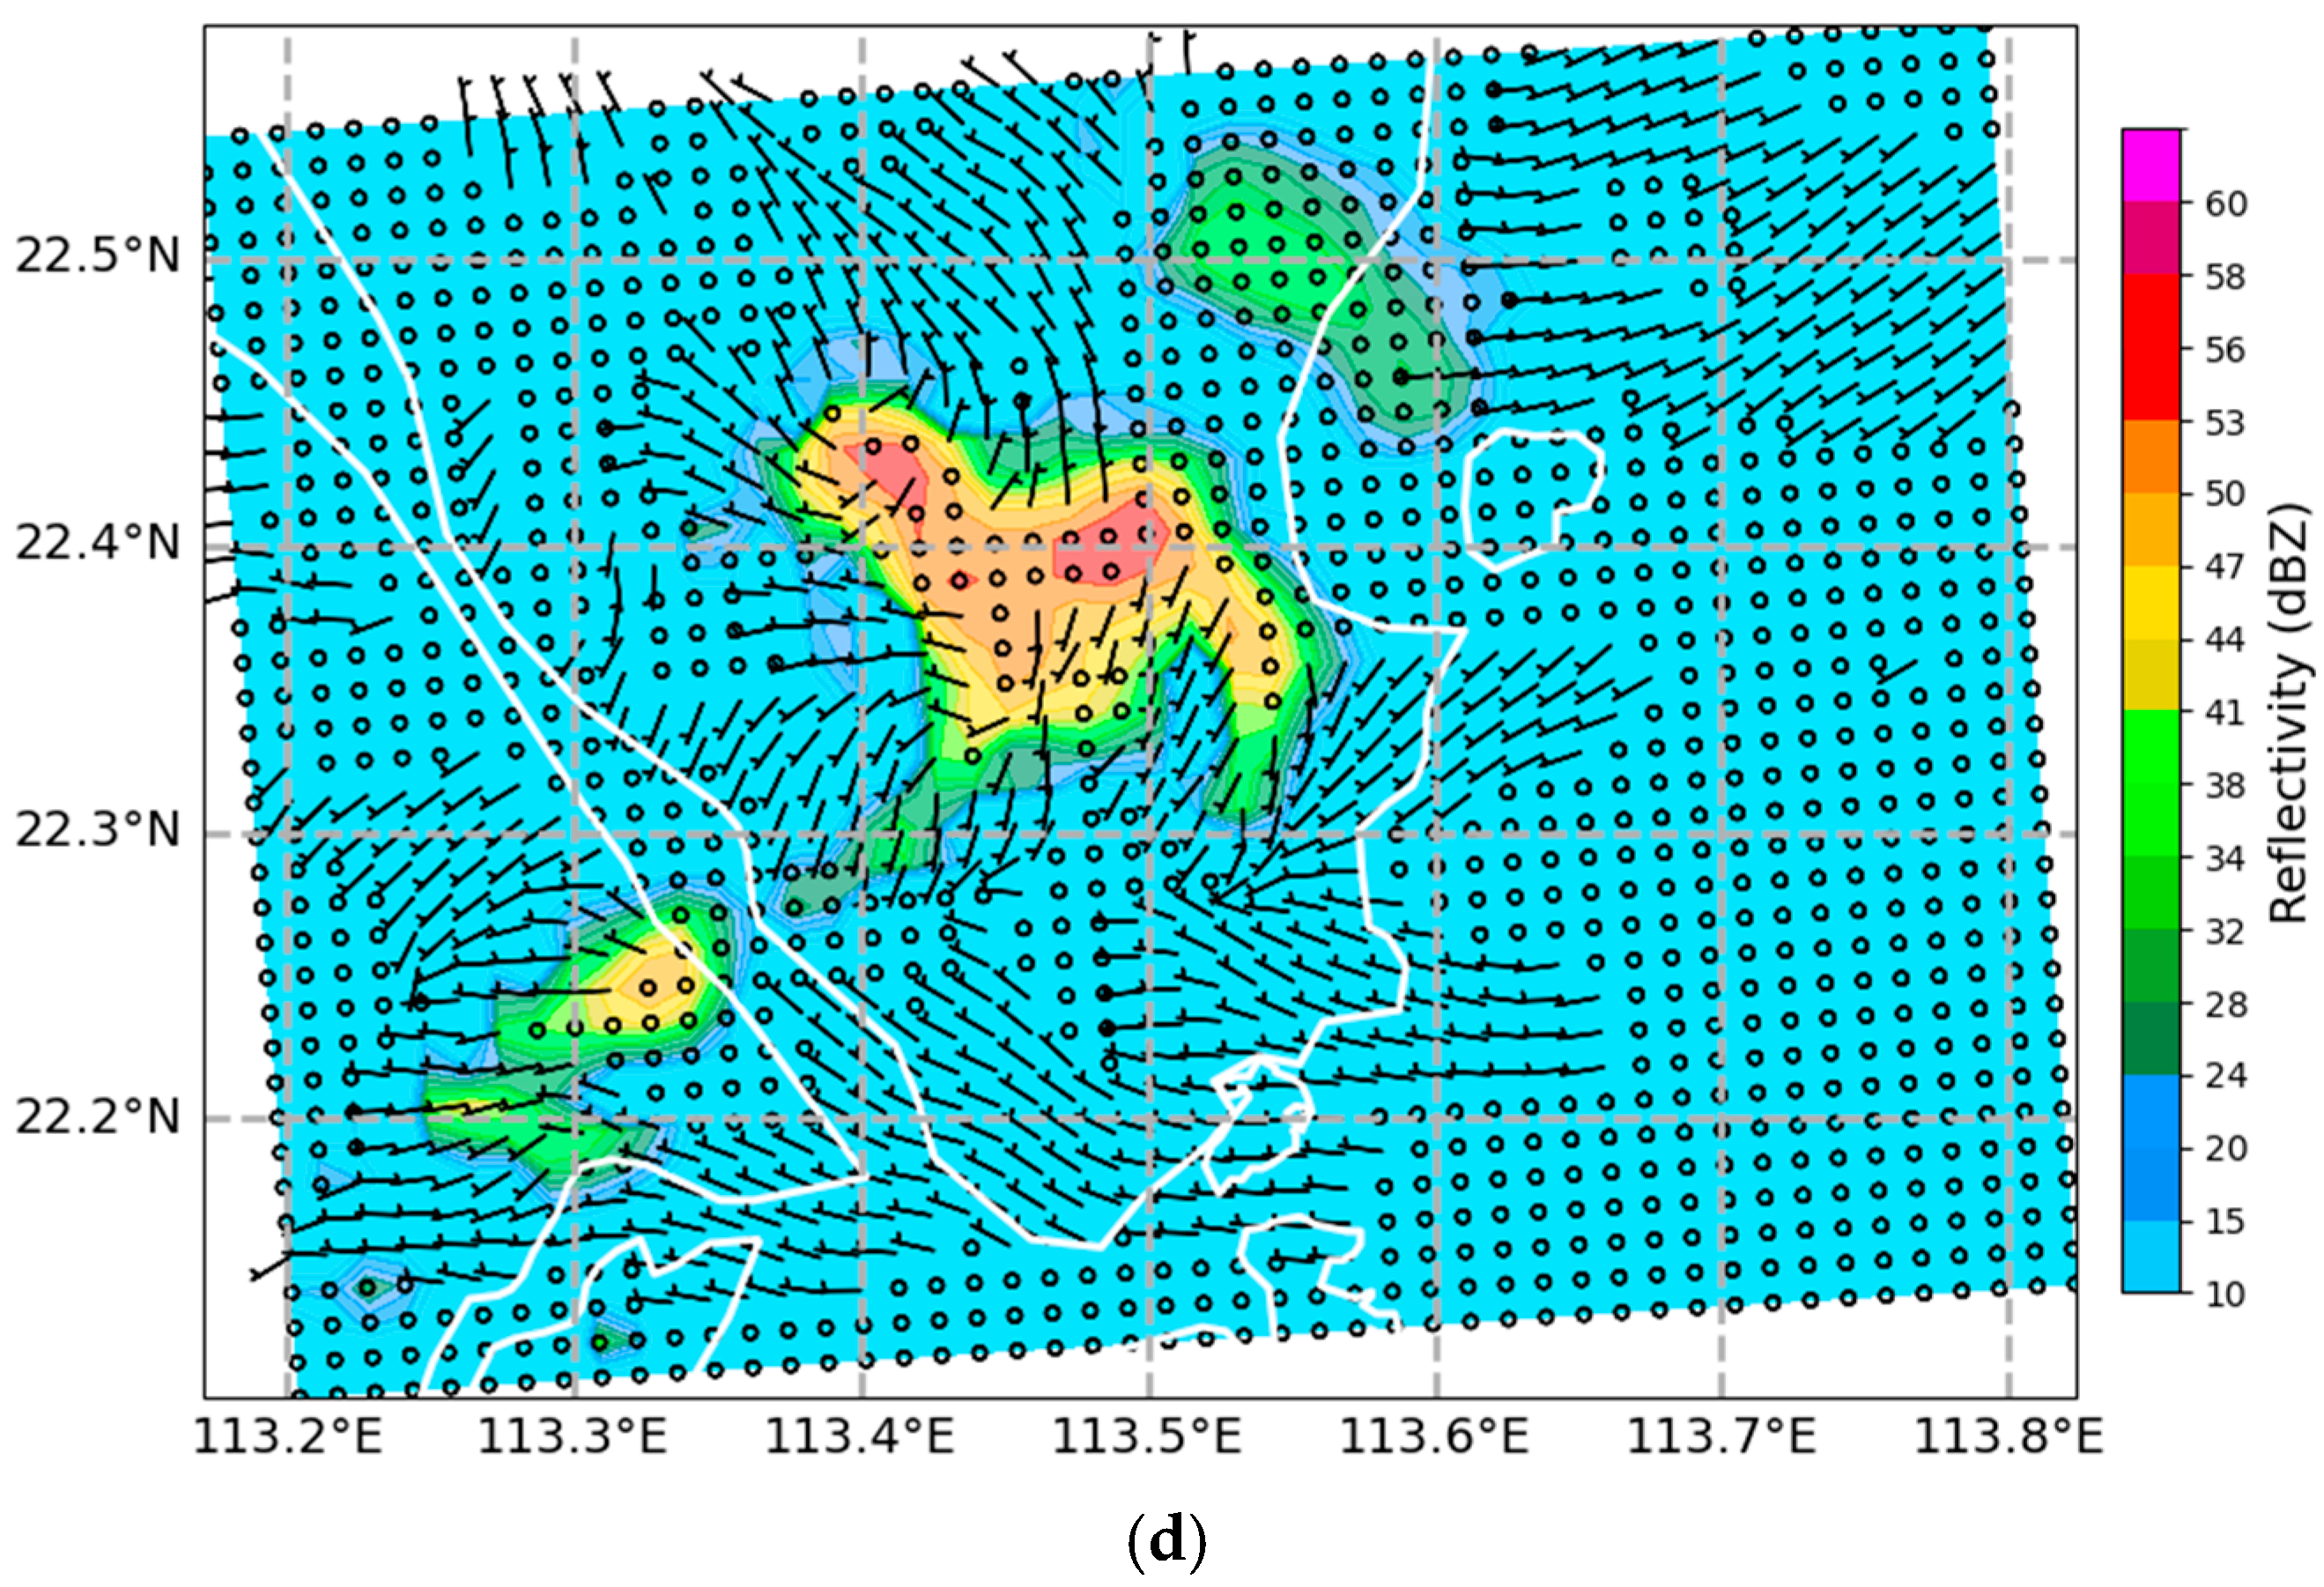
To study the simulated rain cell further, the horizontal cross-sections of the wind and the simulated reflectivity were extracted at various heights above ground levels, including near the surface (10 m, Figure 8a), 200 m (Figure 8b), 400 m (Figure 8c) and 1000 m (Figure 8d). The surface winds basically showed divergent wind flow associated with downdraft of rain. At heights of 200 m and 400 m, convergence of weak northerly winds to the north and southerly winds to the south showed up clearly, consistent with the surface winds, analyzed radar wind field and wind profiler data as described above. At heights of 1000 m and aloft, there appeared to be westerly winds of increasing wind strength. On the other hand, the major convection to the northeast of the rain cell under study still had significant convergence of low-level winds at a height of 1000 m (Figure 8d). As such, for the rain cell under consideration, the convection was shallow and the development was rather weak, which was consistent with the radar measurements discussed in the earlier section.
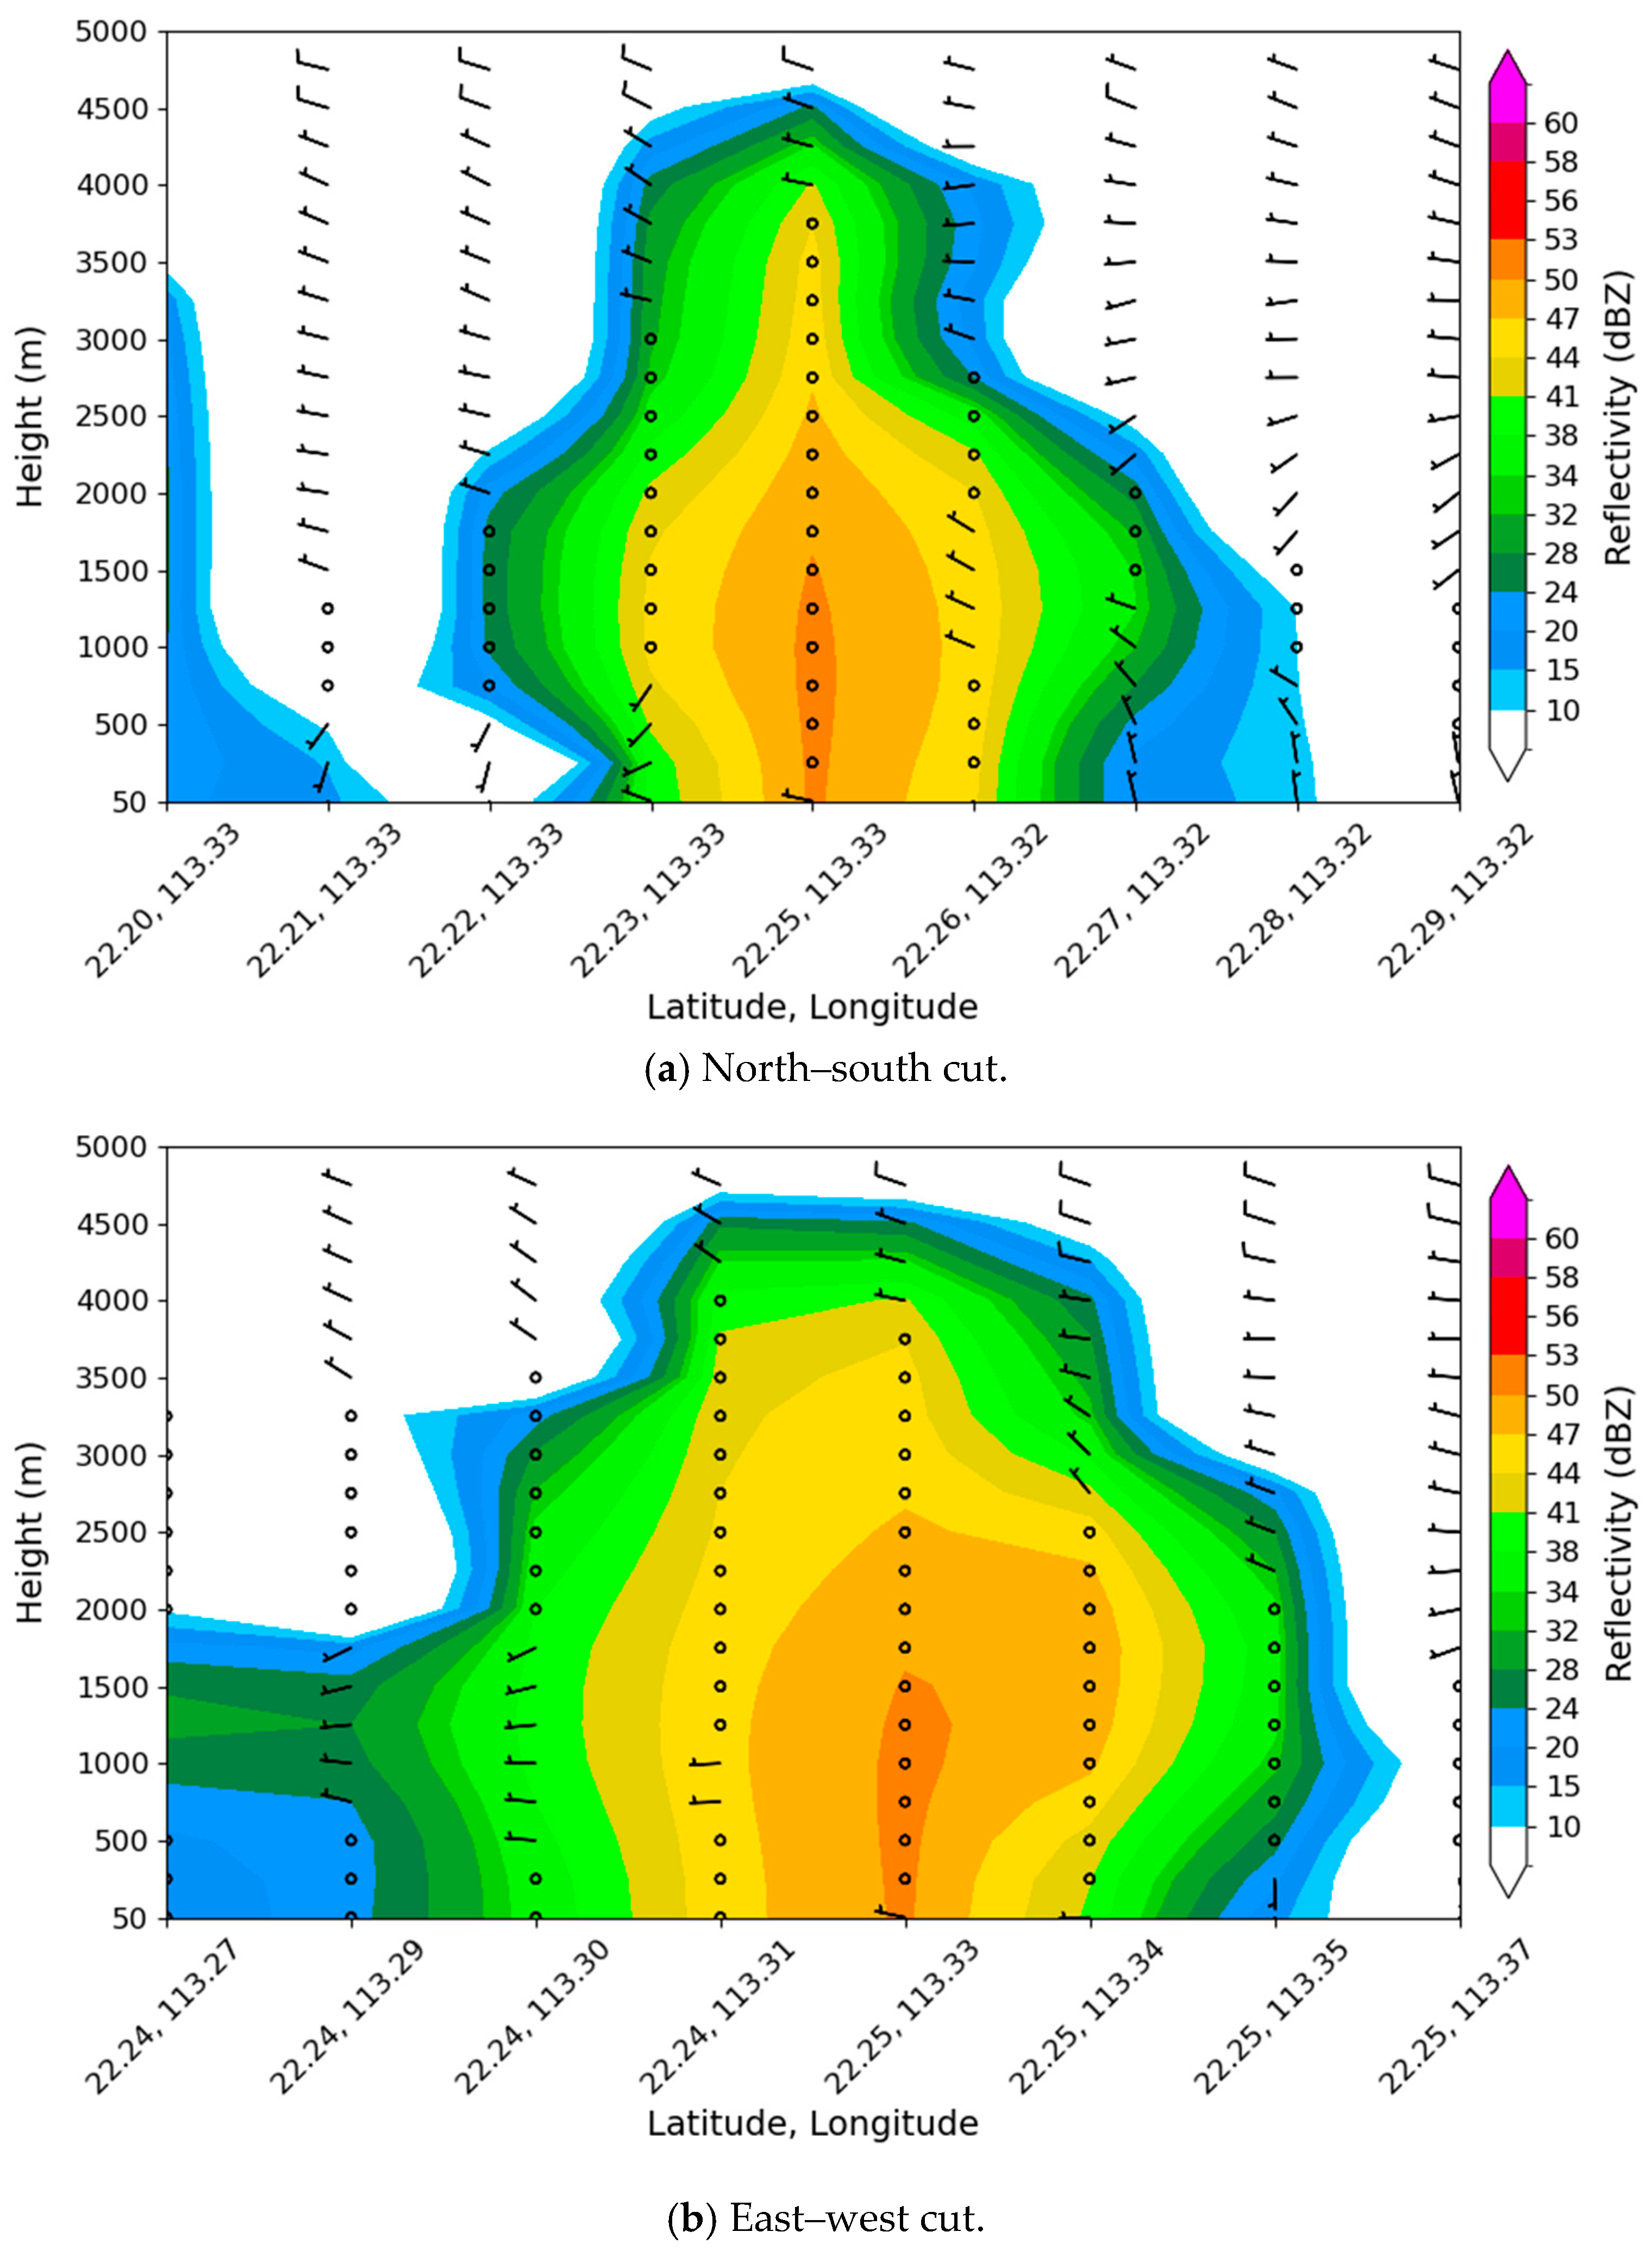
Two vertical cross-sections were made of the rain cell, with locations given in Figure 9. Figure 10 shows the vertical cross-sections of the radar reflectivity and the horizontal winds. Consistent with the weather radar observations, the simulated radar reflectivity core developed up to a height of about 5 km only. From the north–south oriented cross-section in Figure 10a, the convergence of the horizontal winds in the atmospheric boundary layer was not significant, and winds at a height of 1000 m and above were generally westerly winds carrying signature of a wave. For the east–west oriented cross-section in Figure 10b, again the signature of convergence in the atmospheric boundary layer was weak. The horizontal winds were mostly light within the radar reflectivity core. Both features explained the limited convective development of the rain cell.
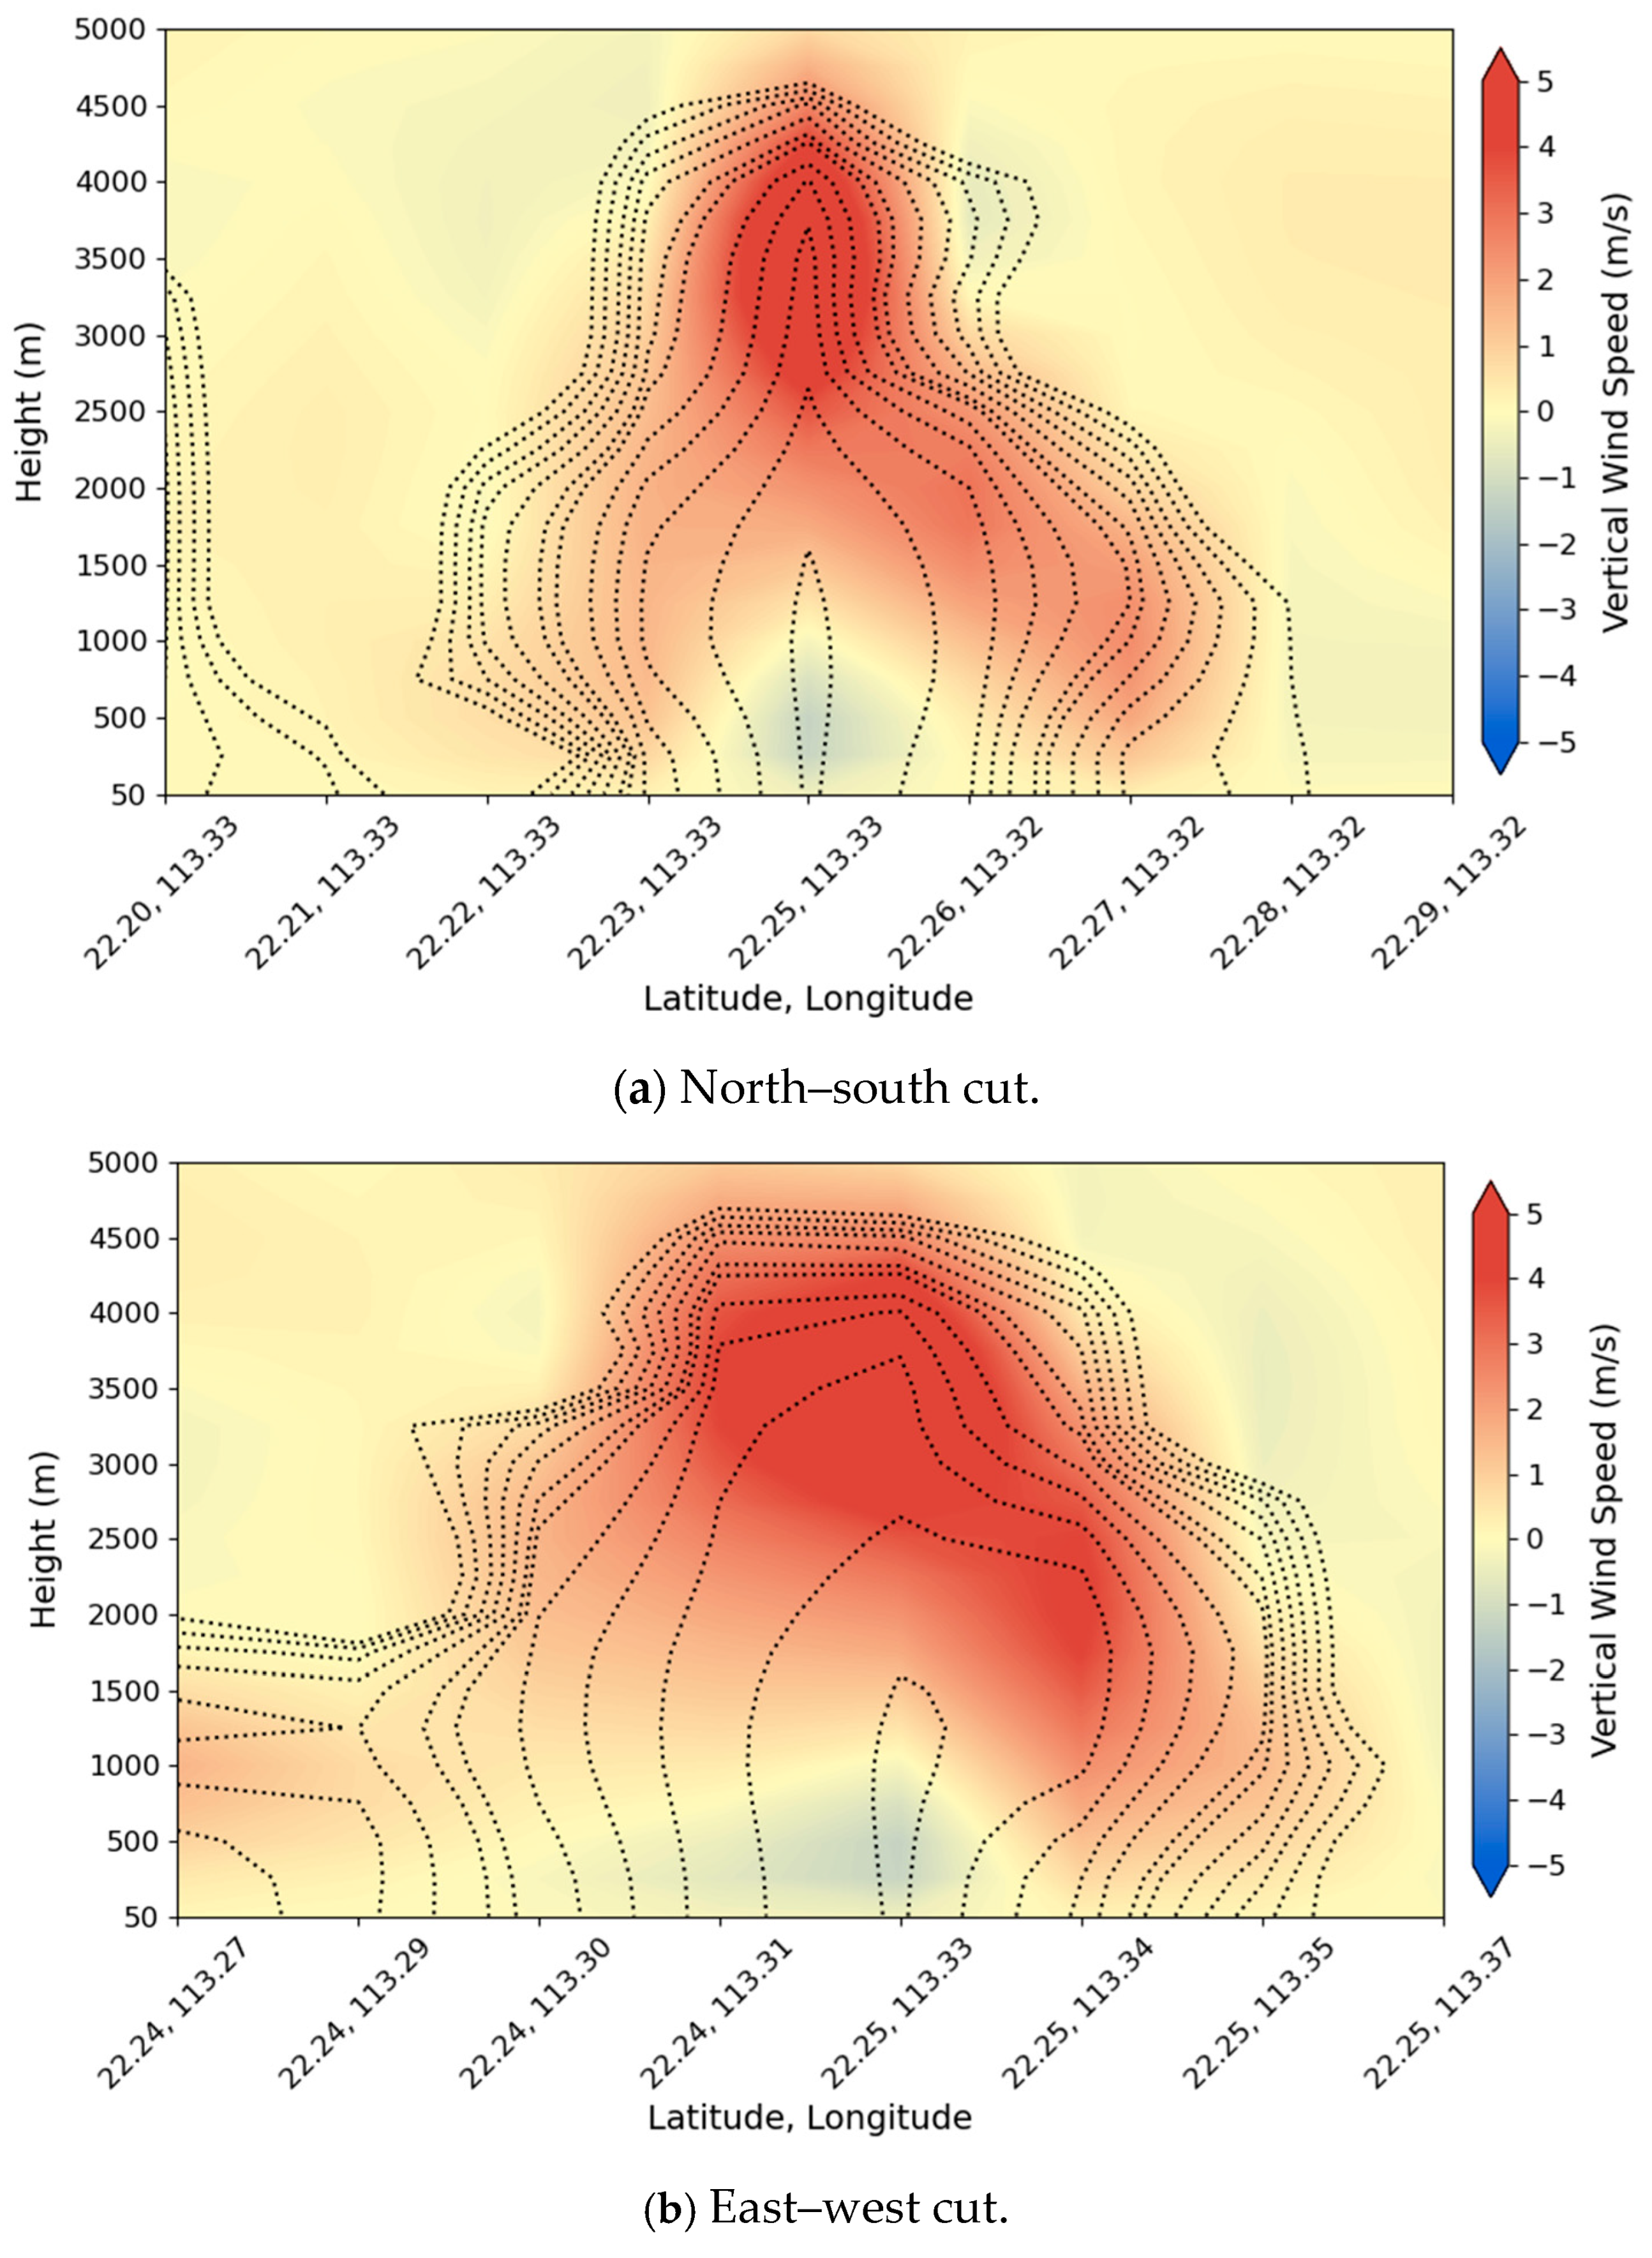
From the vertical velocity field (Figure 11), significant rising motion of the air (colour shading, with upward motion in warm colour) was indeed simulated inside the radar reflectivity core (shown as broken curves). The magnitude of the upward motion increased with height, reaching a value of nearly 5 m/s between heights of 3 km to 5 km above ground level. Downdraft was simulated at the centre of the radar reflectivity core below a height of 1 km above ground level. Unfortunately, due to limitation of the low elevation scanning of the weather radars in the vicinity of the rain cell, it was not possible to analyze the winds below a height of 1 km above ground level from the actual weather radar observations. It is also noted that the vertical velocity measurement of the wind profiler in Zhuhai shown in Figure 6b did not capture organized downward motion in the boundary layer which could be related to the small scale of the funnel cloud. As such, the occurrence of such downdraft at the reflectivity core was not substantiated by actual observations, but signature of downdraft was indeed captured by the vertical cross-section in Figure 3b.
As waterspouts or tornadoes typically have a horizontal diameter of only around 100 m [36,37], simulation from another NWP model running in real time at the HKO with a finer horizontal resolution, namely the Urban Model (refer to Section 2.2), was therefore explored.
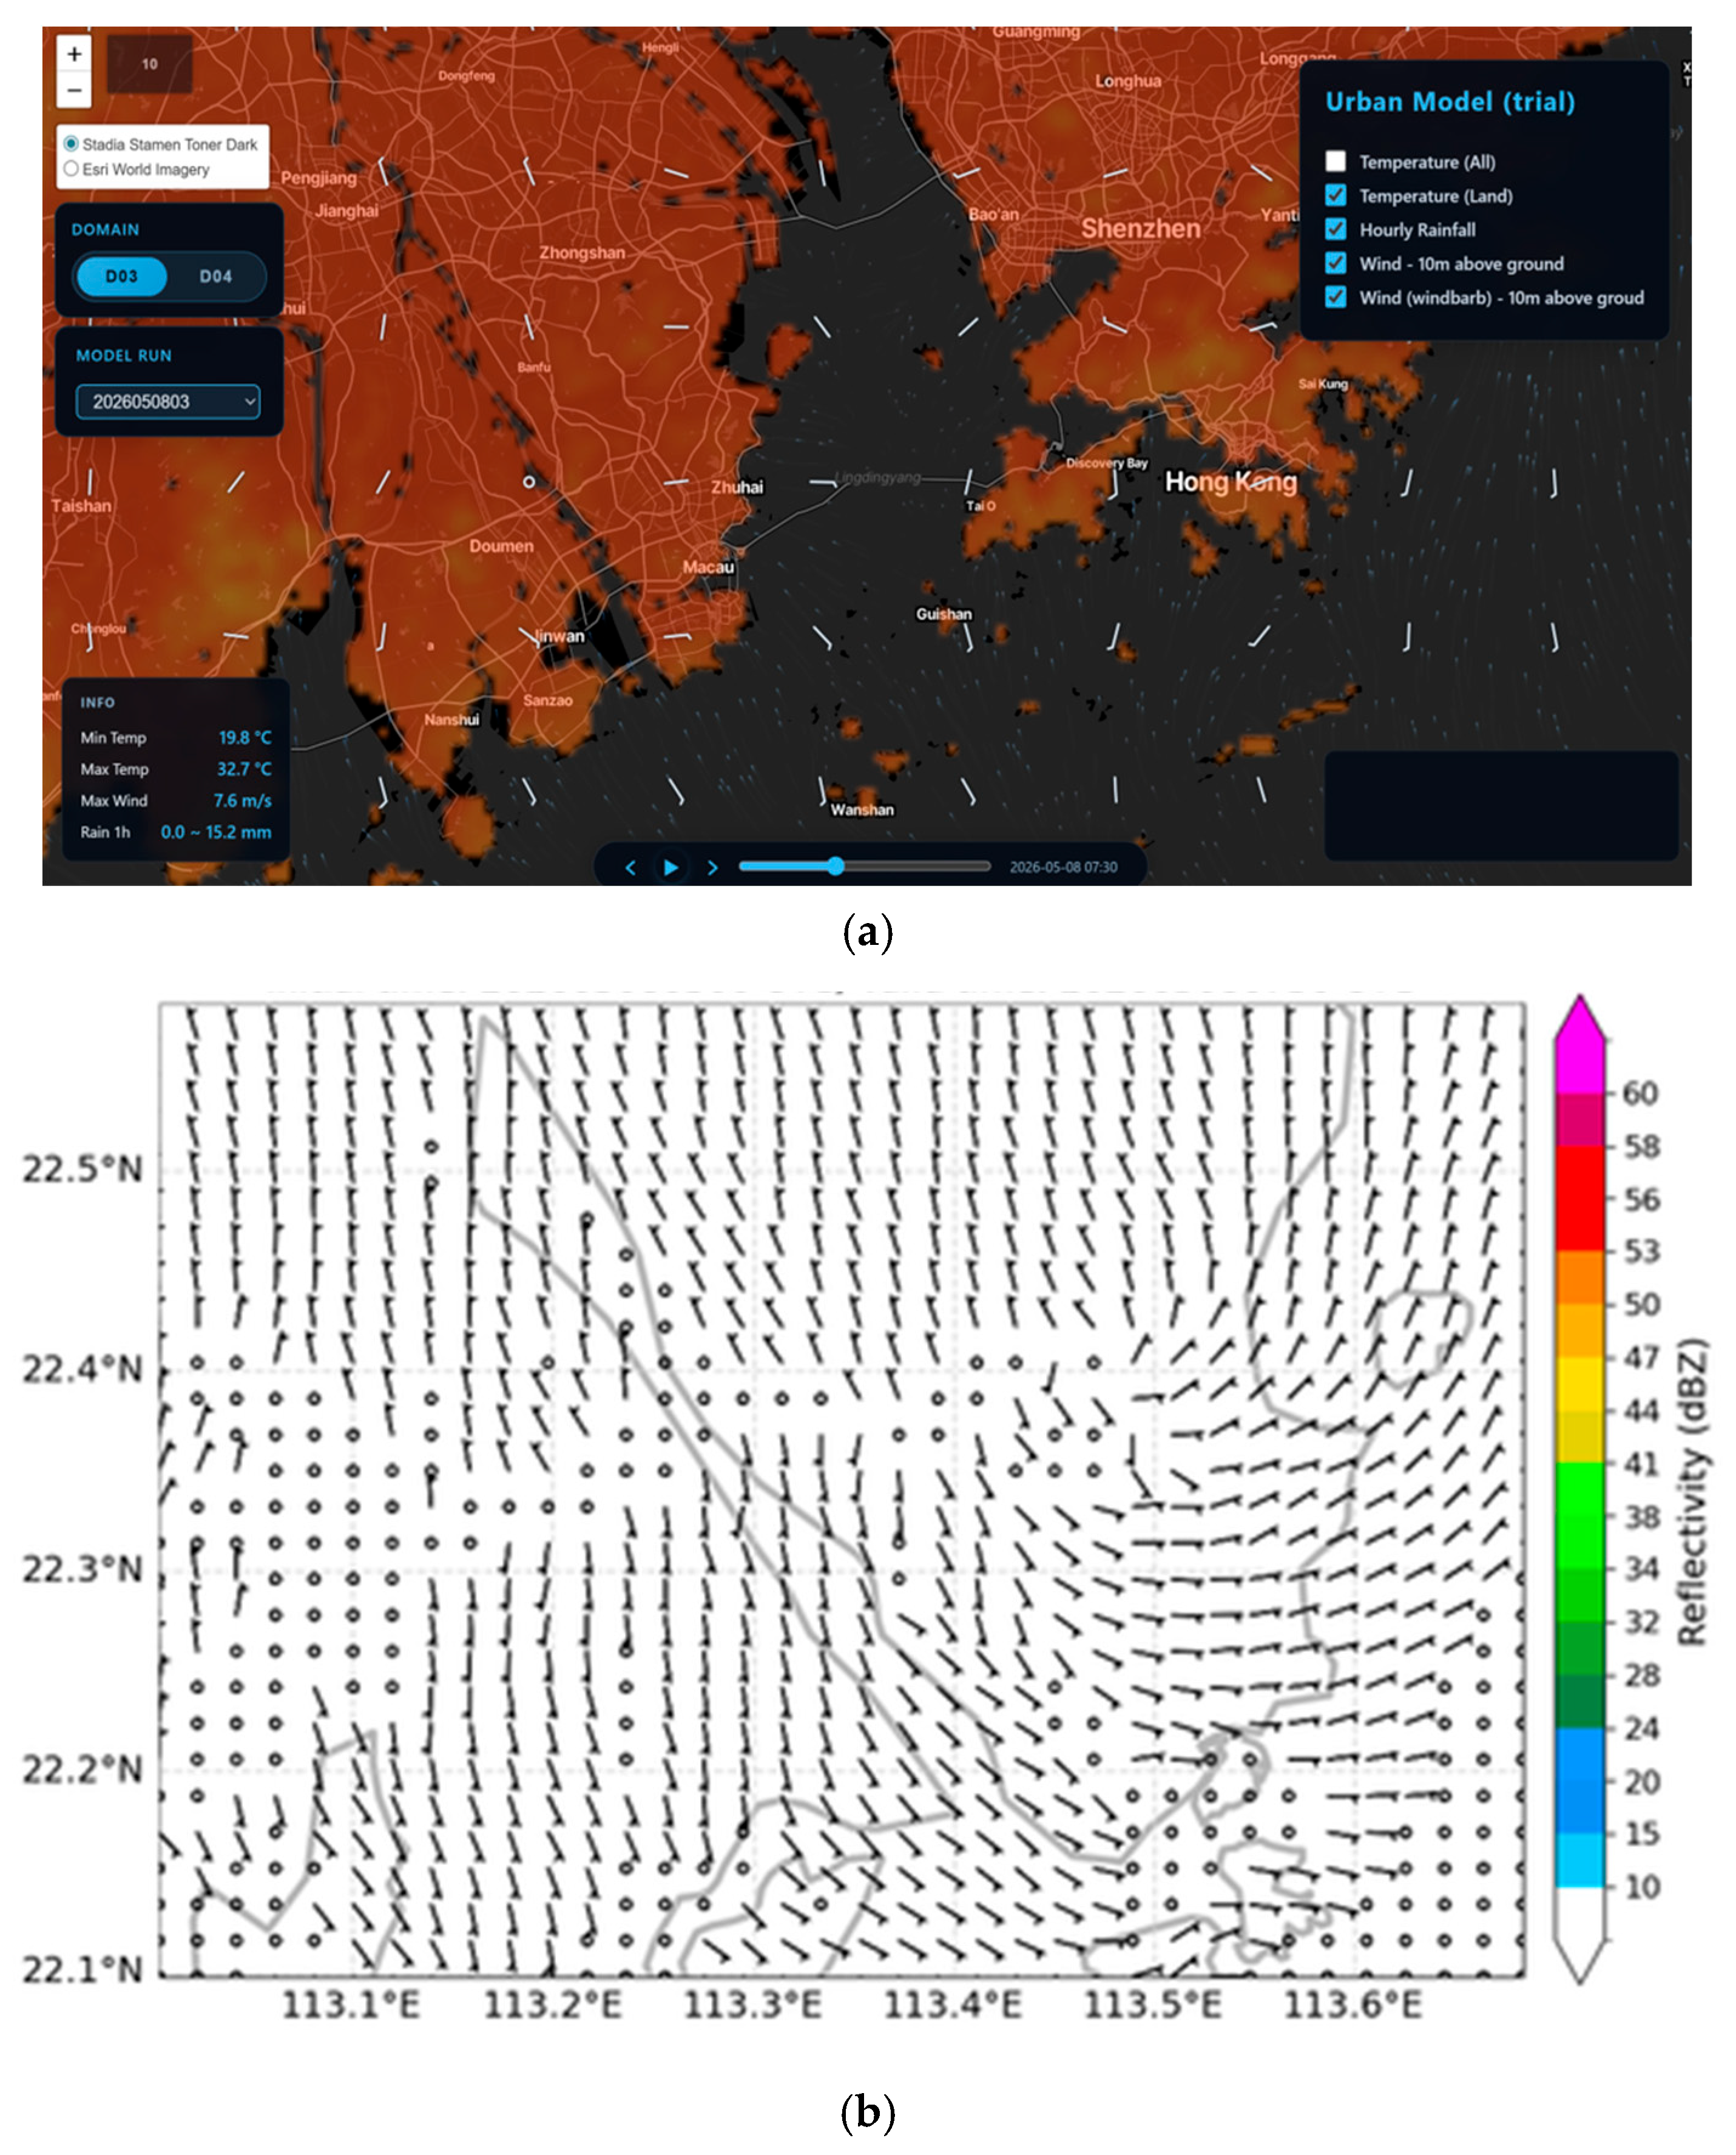
Results for the model initialized at 03 UTC on 8 May 2026 are shown in Figure 12. From Figure 12a, the convergence of surface wind associated with the low-level trough and sea breeze circulation was again reproduced. Upon zooming into the Zhuhai region as in Figure 12b, the model gave broad troughing flow at a height of 400 m above sea level. No relatively isolated cyclonic flow region could be analyzed. The result of null reflectivity can be related to model physics [38], DA settings [39], model run design [40], etc.; a massive amount of work is involved in arriving at a conclusion which can be a subject for separate study.

4. Conclusions

This work analyzed the observational aspects of a funnel cloud at Zhuhai, Guangdong, in a top-down approach. The synoptic pattern of the atmosphere was first presented, which showed that a surface trough situated near the coast of Guangdong around the time of occurrence and the middle troposphere was wavy, signifying a convective synoptic environment. Next, smaller-range observations, including Doppler radar, surface winds, wind profiler, radiometer, etc., were discussed. A velocity couplet was identified from Doppler radar, which provided evidence for the mesocyclone associated with the funnel cloud. Significant updraft was found within the mesocyclone from the wind field analysis of radar. Surface and upper-air wind analysis suggested that the funnel cloud occurred in a region of convergence in the lower troposphere and wavy flow in the mid-tropospheric westerlies, respectively. Although the atmosphere was unstable thermodynamically, the winds in the atmospheric boundary layer were generally weak, and the SRH was rather low. The convection was shallow and the updraft was weak (less than 1 m/s as given by the wind profiler). Nonetheless, under these modest environmental conditions, a substantial funnel cloud has developed.
Based on the above observations, the availability of vorticity associated with the surface trough of low pressure, as well as upward motion triggered by solar heating and mid-tropospheric westerly waves, played an important role in the formation of the funnel cloud and its associated mesocyclone.
Furthermore, it is shown that the atmosphere–ocean–wave coupled model UWIN-CM captured the mesocyclone with low-level cyclonic flow. Significant updraft associated with the convection that aligned with observation was also simulated.
It is noted that this work includes only a single case; more cases would need to be studied in the future in order to build up the climatology of the atmospheric conditions favourable for the occurrence of funnel clouds in Pearl River Estuary. It is also important to study and document the physical mechanisms under which they may appear in order to build up skills in the forecasting of funnel clouds, tornadoes and waterspouts.

Author Contributions

Conceptualization, S.K.L., S.N.C. and P.C.; methodology, S.K.L. and P.C.; software, T.K.L. and C.K.H.; validation, S.K.L.; formal analysis, S.K.L.; investigation, S.K.L. and S.N.C.; resources, P.C.; data curation, T.K.L. and C.K.H.; writing—original draft preparation, P.C.; writing—review and editing, S.K.L. and S.N.C.; visualization, C.K.H. and T.K.L.; supervision, P.C.; project administration, P.C. All authors have read and agreed to the published version of the manuscript.

Funding

This research received no external funding.

Data Availability Statement

The data presented in this study are available upon request from the corresponding author due to privacy concerns.

Acknowledgments

The authors would like to thank Guangdong Meteorological Service for providing surface and upper-air observations used in this study.

Conflicts of Interest

The authors declare no conflicts of interest.

References

  1. Hong Kong Observatory. 2009. Available online: https://www.hko.gov.hk/en/Press-Releases/100567/Waterspout-spotted-in-Hong-Kong-Waters (accessed on 19 June 2026).
  2. Bluestein, H.B. A Funnel Cloud in a Convective Cloud Line to the Rear of a Surface Cold Front. Mon. Weather Rev. 2008, 136, 2786–2795. [Google Scholar] [CrossRef] [Scilit]
  3. Honerkamp, R.; Yan, G.; Snyder, J.C. A review of the characteristics of tornadic wind fields through observations and simulations. J. Wind Eng. Ind. Aerodyn. 2020, 202, 104195. [Google Scholar] [CrossRef] [Scilit]
  4. Fang, G.; Zhang, Y.; Cao, J.; Pang, W.; Wang, J.; Cao, S.; Ge, Y.; Wen, Z. Development and application of a tornado database for the Chinese mainland. Adv. Wind Eng. 2024, 1, 100019. [Google Scholar] [CrossRef] [Scilit]
  5. Huang, X.; Yan, L.; Bai, L.; Zhi, J.; Zhang, J.; Li, Z. Spatio-Temporal Distribution of Guangdong Tornadoes and Characteristics of Radar Echoes of Parent Storms. Meteorol. Mon. 2024, 50, 804–816. [Google Scholar] [CrossRef]
  6. Huang, X.; Bai, L.; Yan, L.; Zhang, Z.; Cai, K.; Zhi, J. Climatic characteristics and environmental conditions of the tornado occurrences within tropical cyclones over Guangdong province, China. Acta Meteorol. Sin. 2024, 82, 319–339. [Google Scholar] [CrossRef]
  7. Sing Tao Online Newspaper. 2026. Available online: https://www.stheadline.com/realtime-china/3570673/%E7%8F%A0%E6%B5%B7%E9%A9%9A%E8%A6%8B%E9%BE%8D%E6%8D%B2%E9%A2%A8-%E6%B0%A3%E8%B1%A1%E5%B1%80%E6%8B%86%E8%A7%A3%E7%A9%BA%E4%B8%AD%E6%BC%8F%E6%96%97%E5%A5%87%E8%A7%80%E6%9C%89%E7%89%87 (accessed on 19 June 2026). (In Chinese)
  8. Pallauta Pérez, G.; Muñoz, R.C.; Arrué, P.; Zamora Zapata, M. The Role of Sea Breeze in the Coastal Stratocumulus Dissipation Transition in Antofagasta and San Diego. Atmosphere 2025, 16, 437. [Google Scholar] [CrossRef] [Scilit]
  9. Wang, S.; Min, J. Dynamical Analyses of a Supercell Tornado in Eastern China Based on a Real-Data Simulation. Atmosphere 2023, 14, 884. [Google Scholar] [CrossRef] [Scilit]
  10. Roberts, B.; Xue, M.; Dawson, D.T., II. The Effect of Surface Drag Strength on Mesocyclone Intensification and Tornadogenesis in Idealized Supercell Simulations. J. Atmos. Sci. 2020, 77, 1699–1721. [Google Scholar] [CrossRef] [Scilit]
  11. May, P.T.; Holland, G.J. The Role of Potential Vorticity Generation in Tropical Cyclone Rainbands. J. Atmos. Sci. 1999, 56, 1224–1228. [Google Scholar] [CrossRef] [Scilit]
  12. Lau, T.K.; Law, H.F.; Yeung, H.Y.; Tse, W.P.; Ho, C.K.; He, Y.-H.; Lai, S.K.; Chan, P.W. An Early-Season Episode of Rainstorms in Hong Kong—Observational and Forecasting Aspects. Atmosphere 2026, 17, 454. [Google Scholar] [CrossRef] [Scilit]
  13. Jackson, R.; Collis, S.; Lang, T.; Potvin, C.; Munson, T. PyDDA: A Pythonic Direct Data Assimilation Framework for Wind Retrievals. J. Open Res. Softw. 2020, 8, 20. [Google Scholar] [CrossRef] [Scilit]
  14. Chan, P.W.; Chan, Y.W.; Cheung, P.; Chong, M.L. An observational study of a severe squall line crossing Hong Kong on 15 March 2025 based on radar-retrieved three-dimensional winds and flight data. Appl. Sci. 2025, 15, 8562. [Google Scholar]
  15. Davies-Jones, R.P.; Burgess, D.; Foster, M. Test of helicity as a tornado forecast parameter. In Proceedings of the 16th Conference on Severe Local Storms; American Meteorological Society: Boston, MA, USA, 1990; pp. 588–592. [Google Scholar]
  16. Bunkers, M.J.; Klimowski, B.A.; Zeitler, J.W.; Thompson, R.L.; Weisman, M.L. Predicting Supercell Motion Using a New Hodograph Technique. Weather Forecast. 2000, 15, 61–79. [Google Scholar] [CrossRef] [Scilit]
  17. Doswell, C.A., III. A review for forecasters on the application of hodographs to forecasting severe thunderstorms. Natl. Weather Dig. 1991, 16, 2–16. [Google Scholar]
  18. Small, C.A.; Chen, S.S.; Kerns, B.W. Madden-Julian Oscillation and Atmosphere Rivers: New Insights on Water Source and Transport for Extreme Rainfall Over the Western US. J. Geophys. Res. Atmos. 2026, 131, e2025JD045573. [Google Scholar] [CrossRef] [Scilit]
  19. Kerns, B.W.; Chen, S.S. Inland Flooding and Rainfall from Hurricane Irene and Tropical Storm Lee (2011): Coupled Atmosphere–Wave–Ocean Model Simulations and Remote Sensing and In Situ Observations with a Machine Learning Tool. Weather Forecast. 2023, 38, 677–697. [Google Scholar]
  20. Lai, S.K.; Chan, P.W.; He, Y.; Chen, S.S.; Kerns, B.W.; Su, H.; Mo, H. Real-Time Operational Trial of Atmosphere–Ocean–Wave Coupled Model for Selected Tropical Cyclones in 2024. Atmosphere 2024, 15, 1509. [Google Scholar] [CrossRef] [Scilit]
  21. Lai, S.K.; He, Y.; Chan, P.W.; Kerns, B.W.; Chen, S.S.; Su, H. Towards skillful tropical cyclone forecasting by AI-model-driven high-resolution regional coupled model. Meteorol. Appl. 2025, 32, e70109. [Google Scholar]
  22. Pei, L.; Miao, S.-G.; Huang, X.-Y.; Yan, Z.-W.; Chen, D. Assessing the added value of convection-permitting modeling for urban climate research: A case study in eastern China. Adv. Clim. Change Res. 2025, 16, 1–11. [Google Scholar] [CrossRef] [Scilit]
  23. Barker, D.; Huang, X.-Y.; Liu, Z.; Auligné, T.; Zhang, X.; Rugg, S.; Ajjaji, R.; Bourgeois, A.; Bray, J.; Chen, Y.; et al. The Weather Research and Forecasting Model’s Community Variational/Ensemble Data Assimilation System: WRFDA. Bull. Am. Meteorol. Soc. 2012, 93, 831–843. [Google Scholar]
  24. Helmus, J.J.; Collis, S.M. The Python ARM Radar Toolkit (Py-ART), a Library for Working with Weather Radar Data in the Python Programming Language. J. Open Res. Softw. 2016, 4, e25. [Google Scholar] [CrossRef] [Scilit]
  25. Barlage, M.; Miao, S.; Chen, F. Impact of physics parameterizations on high-resolution weather prediction over complex urban areas. J. Geophys. Res. Atmos. 2016, 121, 4487–4498. [Google Scholar]
  26. Law, H.F.; Lai, K.K.; Chan, P.W.; Chau, H.C. Technical feasibility of simulating thunderstorm-related microbursts–case studies. Appl. Sci. 2026, 16, 3579. [Google Scholar]
  27. Wu, Y.; Chen, S.; Zhou, M.; Chen, Y.; Zhang, A.; Tu, C.; Li, W. Effects of Environmental Relative Vorticity and Seasonal Variation on Tropical Cyclones over the Western North Pacific. Atmosphere 2022, 13, 795. [Google Scholar] [CrossRef] [Scilit]
  28. Tajbakhsh, S.; Ghafarian, P.; Sahraian, F. Instability indices and forecasting thunderstorms: The case of 30 April 2009. Nat. Hazards Earth Syst. Sci. 2012, 12, 403–413. [Google Scholar] [CrossRef] [Scilit]
  29. Fernando, M.; Millangoda, M.; Premalal, S. Analyze and Comparison of the Atmospheric Instability Using K-Index, Lifted Index Total Totals Index Convective Availability Potential Energy (CAPE) and Convective Inhibition (CIN) in Development of Thunderstorms in Sri Lanka During Second Inter-Monsoon. In Multi-Hazard Early Warning and Disaster Risks; Springer International Publishing: Berlin/Heidelberg, Germany, 2021; pp. 603–614. [Google Scholar] [CrossRef] [Scilit]
  30. Xian, T.; Su, K.; Zhang, J.; Hu, H.; Wang, H. Precipitable Water Vapor Retrieval Based on GNSS Data and Its Application in Extreme Rainfall. Remote Sens. 2025, 17, 2301. [Google Scholar] [CrossRef] [Scilit]
  31. Kerr, B.W.; Darkow, G.L. Storm-Relative Winds and Helicity in the Tornadic Thunderstorm Environment. Weather Forecast. 1996, 11, 489–505. [Google Scholar] [CrossRef] [Scilit]
  32. Coffer, B.E.; Parker, M.D.; Thompson, R.L.; Smith, B.T.; Jewell, R.E. Using Near-Ground Storm Relative Helicity in Supercell Tornado Forecasting. Weather Forecast. 2019, 34, 1417–1435. [Google Scholar] [CrossRef] [Scilit]
  33. Cohn, S.A.; Grubišić, V.; Brown, W.O.J. Wind Profiler Observations of Mountain Waves and Rotors during T-REX. J. Appl. Meteorol. Climatol. 2011, 50, 826–843. [Google Scholar] [CrossRef] [Scilit]
  34. Drach, P.; Krüger, E.L.; Emmanuel, R. Effects of atmospheric stability and urban morphology on daytime intra-urban temperature variability for Glasgow, UK. Sci. Total Environ. 2018, 627, 782–791. [Google Scholar] [CrossRef] [Scilit] [PubMed]
  35. Fischer, J.; Dahl, J.M.L.; Coffer, B.; Houser, J.; Markowski, P.M.; Parker, M.D.; Weiss, C.C.; Schueth, A. Supercell Tornadogenesis: Recent Progress in Our State of Understanding. Bull. Am. Meteorol. Soc. 2024, 105, E1084–E1097. [Google Scholar] [CrossRef] [Scilit]
  36. Rahman, S. Tornado & its Shape, Size, Rotation, Sound & Seismology. Int. J. Empir. Educ. Res. 2017, 1, 1–18. [Google Scholar] [CrossRef] [Scilit]
  37. Davies-Jones, R.; Trapp, R.J.; Bluestein, H.B. Tornadoes and Tornadic Storms. In Severe Convective Storms; Doswell, C.A., Ed.; Meteorological Monographs; American Meteorological Society: Boston, MA, USA, 2001; pp. 213–259. [Google Scholar] [CrossRef] [Scilit]
  38. Zeyaeyan, S.; Fattahi, E.; Ranjbar, A.; Azadi, M.; Vazifedoust, M. Evaluating the Effect of Physics Schemes in WRF Simulations of Summer Rainfall in North West Iran. Climate 2017, 5, 48. [Google Scholar] [CrossRef] [Scilit]
  39. Zhai, W.; Shen, F.; Liu, J.; Fei, H.; Yi, L.; Wan, S.; Yuan, X. Impact of Background Error Length Scale Tuning in WRF-3DVAR System on High-Resolution Radar Data Assimilation for Typhoon Doksuri Simulation. Atmosphere 2025, 16, 679. [Google Scholar] [CrossRef] [Scilit]
  40. Liu, Y.; Zhuo, L.; Han, D. Developing Spin-Up Time Framework for WRF Extreme Precipitation Simulations. J. Hydrol. 2023, 620, 129443. [Google Scholar] [CrossRef] [Scilit]
Figure 1. (a) A photo of the funnel cloud at Zhuhai on 8 May 2026 (Courtesy: Sing Tao newspaper, 2026). (b) Surface isobaric chart at 06 UTC on 8 May 2026. The blue line is the surface trough of low pressure near the coast of Guangdong. (c) Upper-air analysis at 700 hPa at 12 UTC on 8 May 2026, showing a wavy middle troposphere in southern China.
Atmosphere 17 00640 g001
Figure 2. (a) Doppler velocity imagery (left) and reflectivity imagery (right) at 3:30 p.m. HKT of 8 May 2026 from a 0.8-degree PPI scan of Cheung Chau radar. Location of the mesoscale associated with the funnel cloud is encircled in a red dotted line. (b) Surface wind observations at that time. A surface trough of low pressure is analyzed with a blue line.
Atmosphere 17 00640 g002
Figure 3. The vertical cross-sections and the analyzed wind field (in insets): east–west cut (a); north–south cut (b); the background image of each sub-figure is the 0-degree PPI scan reflectivity image from Tai Mo Shan weather radar.
Atmosphere 17 00640 g003
Figure 4. The 1.4-degree PPI scan (a) and 2.4-degree PPI scan (b) from Cheung Chau weather radar—in each sub-figure, the left-hand side is the Doppler velocity imagery and the right-hand side is the reflectivity imagery.
Atmosphere 17 00640 g004
Figure 5. (a) The tephigram based on 07:30 UTC data of the microwave radiometer at the Hong Kong International Airport. (b) Hodograph at that time based on Zhuhai wind profiler.
Atmosphere 17 00640 g005
Figure 6. (a) The time–height plot of the horizontal wind from Zhuhai wind profiler located at 22.1° N, 113.2° E; time is local time; red dotted lines denote a couple of westerly waves that moved across Zhuhai near 3 p.m. on 8 May 2026. (b) The time–height plot of vertical velocity from this profiler.
Atmosphere 17 00640 g006
Figure 7. UWIN-CM forecast of surface wind and rainfall at 06 UTC of 8 May 2026, based on a model run initialized at 00 UTC on that day. The red arrow indicates the rain area associated with the simulated funnel cloud with a location close to that of the radar measurement in Figure 2.
Atmosphere 17 00640 g007
Figure 8. Simulated horizontal wind and reflectivity at 06 UTC of 8 May 2026 at various heights above ground levels, including (a) 10 m, (b) 200 m, (c) 400 m and (d) 1000 m, from UWIN-CM initialized at 00 UTC of 8 May 2026. The isolated convection under study is indicated by a red arrow in (a).
Atmosphere 17 00640 g008aAtmosphere 17 00640 g008b
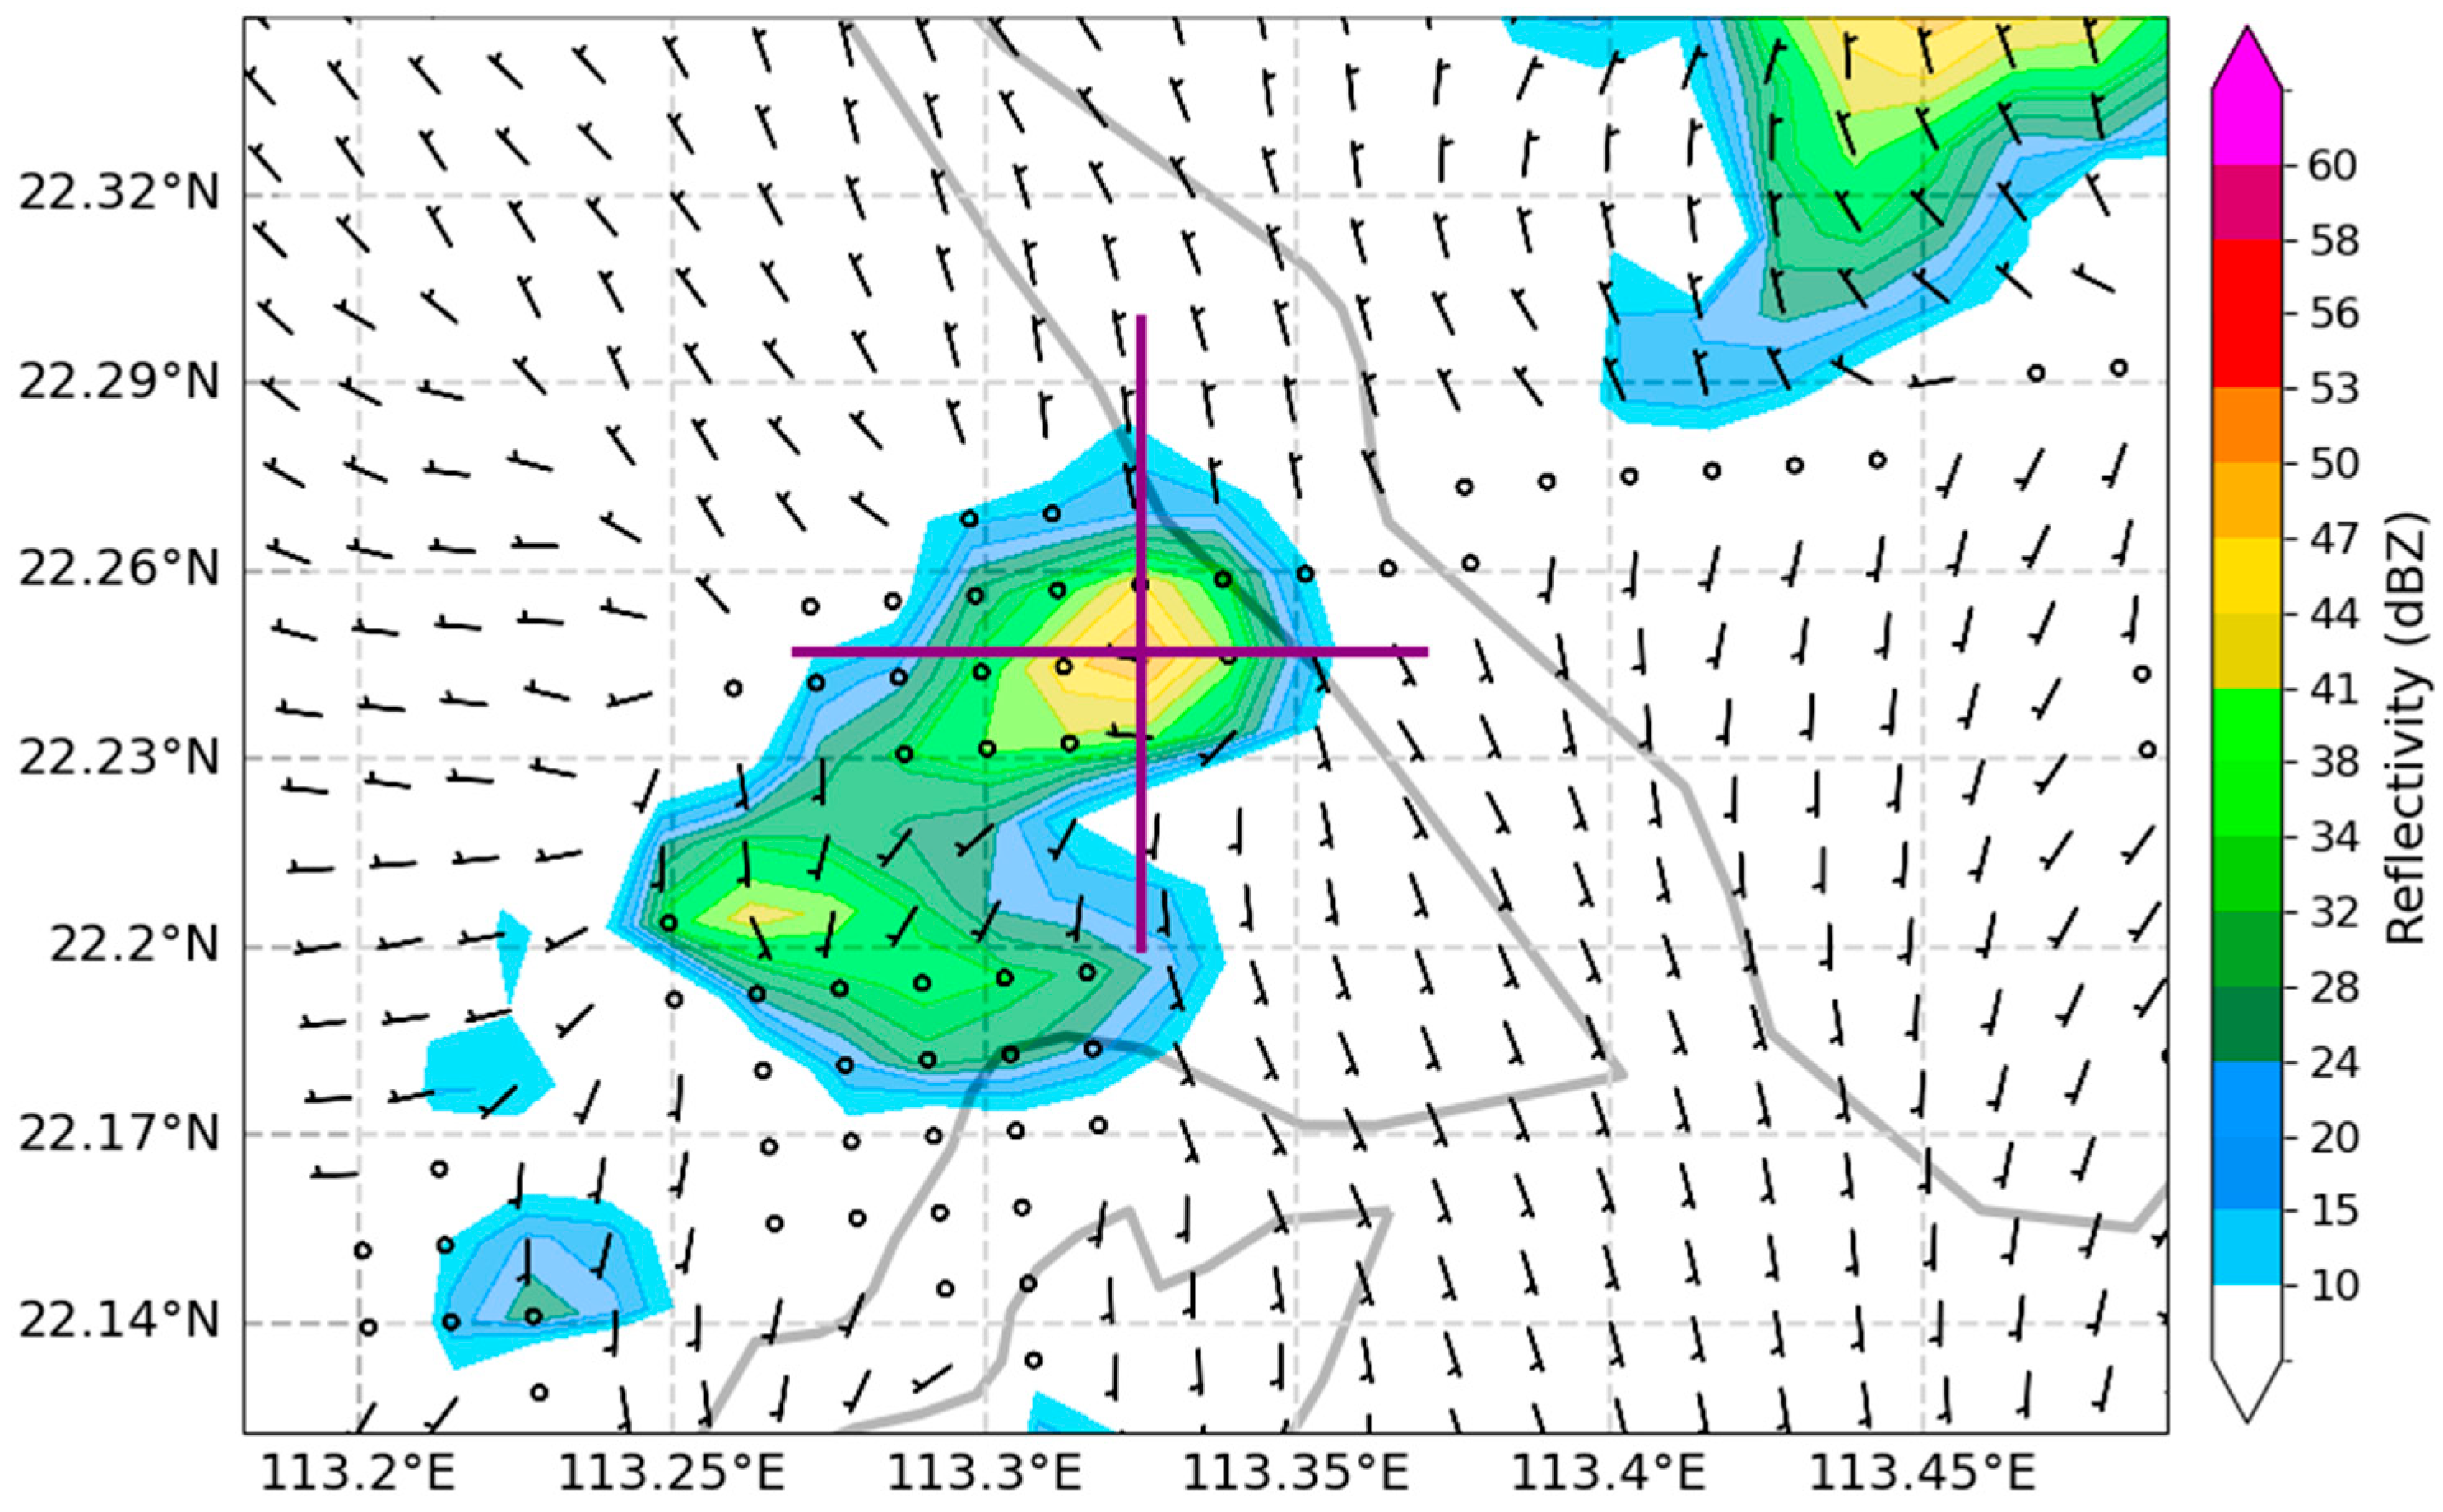
Figure 9. The N-S and E-W oriented lines (in purple) along which the two cross-sections of the isolated convection shown in Figure 10 are made.
Atmosphere 17 00640 g009
Figure 10. The two cross-sections across the isolated convection in the UWIN-CM simulation. The coloured contours are simulated reflectivity and wind barbs are horizontal winds.
Atmosphere 17 00640 g010
Figure 11. The vertical cross-sections across the isolated convection in the UWIN-CM simulation, showing the vertical velocity (in coloured contours) and reflectivity contours (in broken curves).
Atmosphere 17 00640 g011
Figure 12. (a) The simulated surface wind and (b) the simulated wind at a height of 400 m above ground level in the Zhuhai area at 7:30 UTC on 8 May 2026 by the Urban Model. The model initial time is 03 UTC on 8 May 2026.
Atmosphere 17 00640 g012
Disclaimer/Publisher’s Note: The statements, opinions and data contained in all publications are solely those of the individual author(s) and contributor(s) and not of MDPI and/or the editor(s). MDPI and/or the editor(s) disclaim responsibility for any injury to people or property resulting from any ideas, methods, instructions or products referred to in the content.