Article

Source Apportionment and Ozone Formation Potential Analysis of Atmospheric Unsaturated Hydrocarbon Volatile Organic Compounds in Beihai City During Summer


1
School of Ecological Environment Protection, Guangxi Eco-Engineering Vocational & Technical College, Liuzhou 545004, China
2
Guangxi Academy of Environmental Sciences, Nanning 530022, China
*
Author to whom correspondence should be addressed.
Atmosphere 2026, 17(6), 565; https://doi.org/10.3390/atmos17060565 (registering DOI)
Submission received: 13 April 2026 / Revised: 20 May 2026 / Accepted: 26 May 2026 / Published: 30 May 2026
(This article belongs to the Special Issue Advances in Air Quality Monitoring and Source Apportionment)

Abstract

Unsaturated hydrocarbons, including alkenes, alkynes, and aromatic hydrocarbons, are important components of atmospheric volatile organic compounds (VOCs) and serve as key precursors for ozone, a major photochemical pollutant. This study aimed to characterize the sources and ozone formation potential of 29 unsaturated hydrocarbon VOCs in Beihai, a coastal city in southern China, on the basis of continuous online monitoring conducted during the summer of 2022. Continuous monitoring of unsaturated hydrocarbon VOCs in the ambient air of Beihai city during summer was conducted using a rapid online monitoring system for atmospheric VOCs. The results revealed that the total daily average concentration of unsaturated hydrocarbon VOCs was 1.21 ppbv, with an average concentration of 0.026 ppbv. The order of abundance was alkenes > aromatic hydrocarbons > alkynes. Source apportionment using the positive matrix factorization (PMF) model revealed that vehicle exhaust emissions were the primary source of unsaturated hydrocarbon VOCs in the city of Beihai, contributing 36.02%. Secondary sources included combustion sources (26.15%), solvent usage (18.55%), fuel evaporation (10.17%), and biogenic sources (9.10%). The contribution of unsaturated hydrocarbon VOCs to ozone formation was estimated using the ozone formation potential (OFP). Aromatic hydrocarbons contributed the most (51.22%), followed by alkenes (41.8%). Analysis of the diurnal variation patterns of unsaturated hydrocarbons revealed that combustion sources occurred during the night (01:00–02:00), suggesting that enhanced supervision and control measures during nighttime hours are warranted.

1. Introduction

Since the implementation of the Air Pollution Prevention and Control Action Plan by the State Council in 2013, air quality across China has significantly improved, with marked reductions in the concentrations of PM10 and PM2.5. However, the concentration of ozone (O3) tends to increase, and ozone pollution frequently occurs [1,2,3] 17373−17378. In recent years, urban air quality in Guangxi Province has exhibited a consistent improvement, marked by a steady annual decline in PM2.5 concentrations and a generally increasing—albeit fluctuating—trend in ground-level ozone (O3) levels. For instance, in 2022, the annual mean PM2.5 concentration in Guangxi decreased by 6.4%, whereas O3 concentrations increased by 11.5%; in 2024, PM2.5 declined further by 3.8%, while O3 rose by 4.1%. Collectively, ozone pollution has emerged as a critical limiting factor impeding further progress in air quality improvement—highlighting the urgent need to implement targeted, science-informed prevention and control strategies.
Volatile organic compounds (VOCs), including alkanes, alkenes, alkynes, aromatic hydrocarbons, oxygenated volatile organic compounds (OVOCs), and halogenated hydrocarbons, are significant precursors of both tropospheric O3 and secondary organic aerosols (SOAs) [4,5,6]. VOCs have complex and variable compositions, with significant differences in reactivity and ozone formation potential among different species. Furthermore, the contributions of individual VOC species to SOA formation vary considerably [7,8,9,10]. Analyzing the diurnal variation patterns of specific VOC species can provide refined data support for improving model accuracy. An in-depth investigation into the emission characteristics and source apportionment of VOCs and their impact on ozone formation can help identify key emission sources and reactive species. This is crucial for determining priority control targets, formulating more precise emission reduction strategies, and effectively addressing ozone pollution.
Current research on VOCs focuses primarily on concentration characteristics, source apportionment, and ozone formation potential [11,12]. Owing to the vast number of VOC species, studies often categorize them into broad classes, such as alkanes, alkenes, aromatic hydrocarbons, and OVOCs, with limited analysis of the diurnal variation patterns of specific compounds. Consequently, the variation characteristics of certain organic species might be overlooked or averaged out when they are incorporated into overall analyses. Analyzing the diurnal profiles of specific VOCs can also help distinguish variations in dominant emission sources across different time periods, thereby aiding in achieving precise pollution prevention and control.
Unsaturated hydrocarbon VOCs, including alkenes, alkynes, and aromatic hydrocarbons, contain C=C or C≡C bonds. They are highly reactive and readily undergo chemical reactions with atmospheric oxidants such as ·OH radicals, O3, and NOx. Unsaturated hydrocarbons constitute one of the major components of VOCs in China’s ambient air. Observational studies in seven cities, including Beijing, Jinan, Ningbo, Nanning, Chengdu, Taiyuan and Zhengzhou, have shown that alkenes account for 5.8–31.0%, alkynes for 2.6–6.8%, and aromatic hydrocarbons for 2.6–44.2% of total VOCs [13,14,15,16,17,18,19]. Although their proportional concentration is often lower than that of alkanes, their high reactivity leads to a disproportionately larger contribution to ozone formation potential. For instance, two-year VOC observations in Jinan revealed that unsaturated hydrocarbons constituted 44% of the total concentration but contributed up to 79% of the ozone formation potential (OFP) [14]. Similarly, a one-year study conducted in Nanning from October 2020 to September 2021 revealed that unsaturated hydrocarbons composed 19.9% of the total VOC concentration, with their OFP contribution reaching 58.88% [19]. Therefore, conducting source apportionment and investigating the diurnal variation patterns of unsaturated hydrocarbon VOCs can help identify key species for ozone formation, providing a scientific basis for targeted control measures.
The positive matrix factorization (PMF) receptor model was first proposed and established by Paatero and Tapper [20] and later promoted by the U.S. Environmental Protection Agency (EPA). On the basis of the theory of a positive matrix and the use of a least-squares algorithm, the PMF model can identify major pollution sources and their contribution rates even in the absence of detailed source profiles. In 2002, Anderson et al. [21] compared the chemical mass balance model, PMF model, principal component analysis/absolute principal component score model, and graphical ratio model for analyzing indoor exposure to toxic VOCs in New Jersey and California (1980–1984). The pioneering application of the positive matrix factorization (PMF) model in China for source apportionment of ambient volatile organic compounds (VOCs) was conducted in Beijing using data from 2005 [22]. In 2024, the Ministry of Ecology and Environment officially issued the Technical Guideline for Source Apportionment of Ambient Particulate Matter using a positive matrix factorization model (HJ 1353—2024). Currently, the PMF model is widely used in source apportionment studies of pollutants such as VOCs and PM2.5.
Beihai city, located in Guangxi Province (108°50′45″–109°47′28″ E, 20°26′–21°55′34″ N), is an important city within the Guangxi Beibu Gulf Urban Agglomeration. With an annual average temperature of 23.2 °C, long sunshine duration, and high light intensity during summer, Beihai faces potential risks of ozone pollution. To date, no specific study has focused on unsaturated hydrocarbon VOCs in this area. In this study, observations of unsaturated hydrocarbon VOCs in the city of Beihai were conducted in July 2022. The compositional characteristics and diurnal variation patterns of the concentrations for these compounds were analyzed, source apportionment was performed using the PMF model, and the ozone formation potential of different groups was evaluated. These findings provide a scientific basis for VOC emission reduction and ozone pollution control strategies in the city of Beihai.

2. Materials and Methods

2.1. Monitoring Site and Sampling Period

The monitoring site was located on the rooftop of the passenger transport terminal (No. 18) in the Yinhai Tourist Area, Yinhai District, Beihai city, Guangxi Zhuang Autonomous Region (109°12′34.29″ E, 21°42′88.30″ N). Situated approximately 50 m from the coastline, the site lies within the coastal zone of Beihai city. It is characterized by an open terrain with no surrounding high-rise buildings, trees, or other topographical influences, and no significant local emission sources are present. This site reflects the overall air quality of the urban area of Beihai city and is considered a typical urban monitoring site. Sampling was conducted from 1 to 31 July 2022, which represents a typical summer period in Beihai.
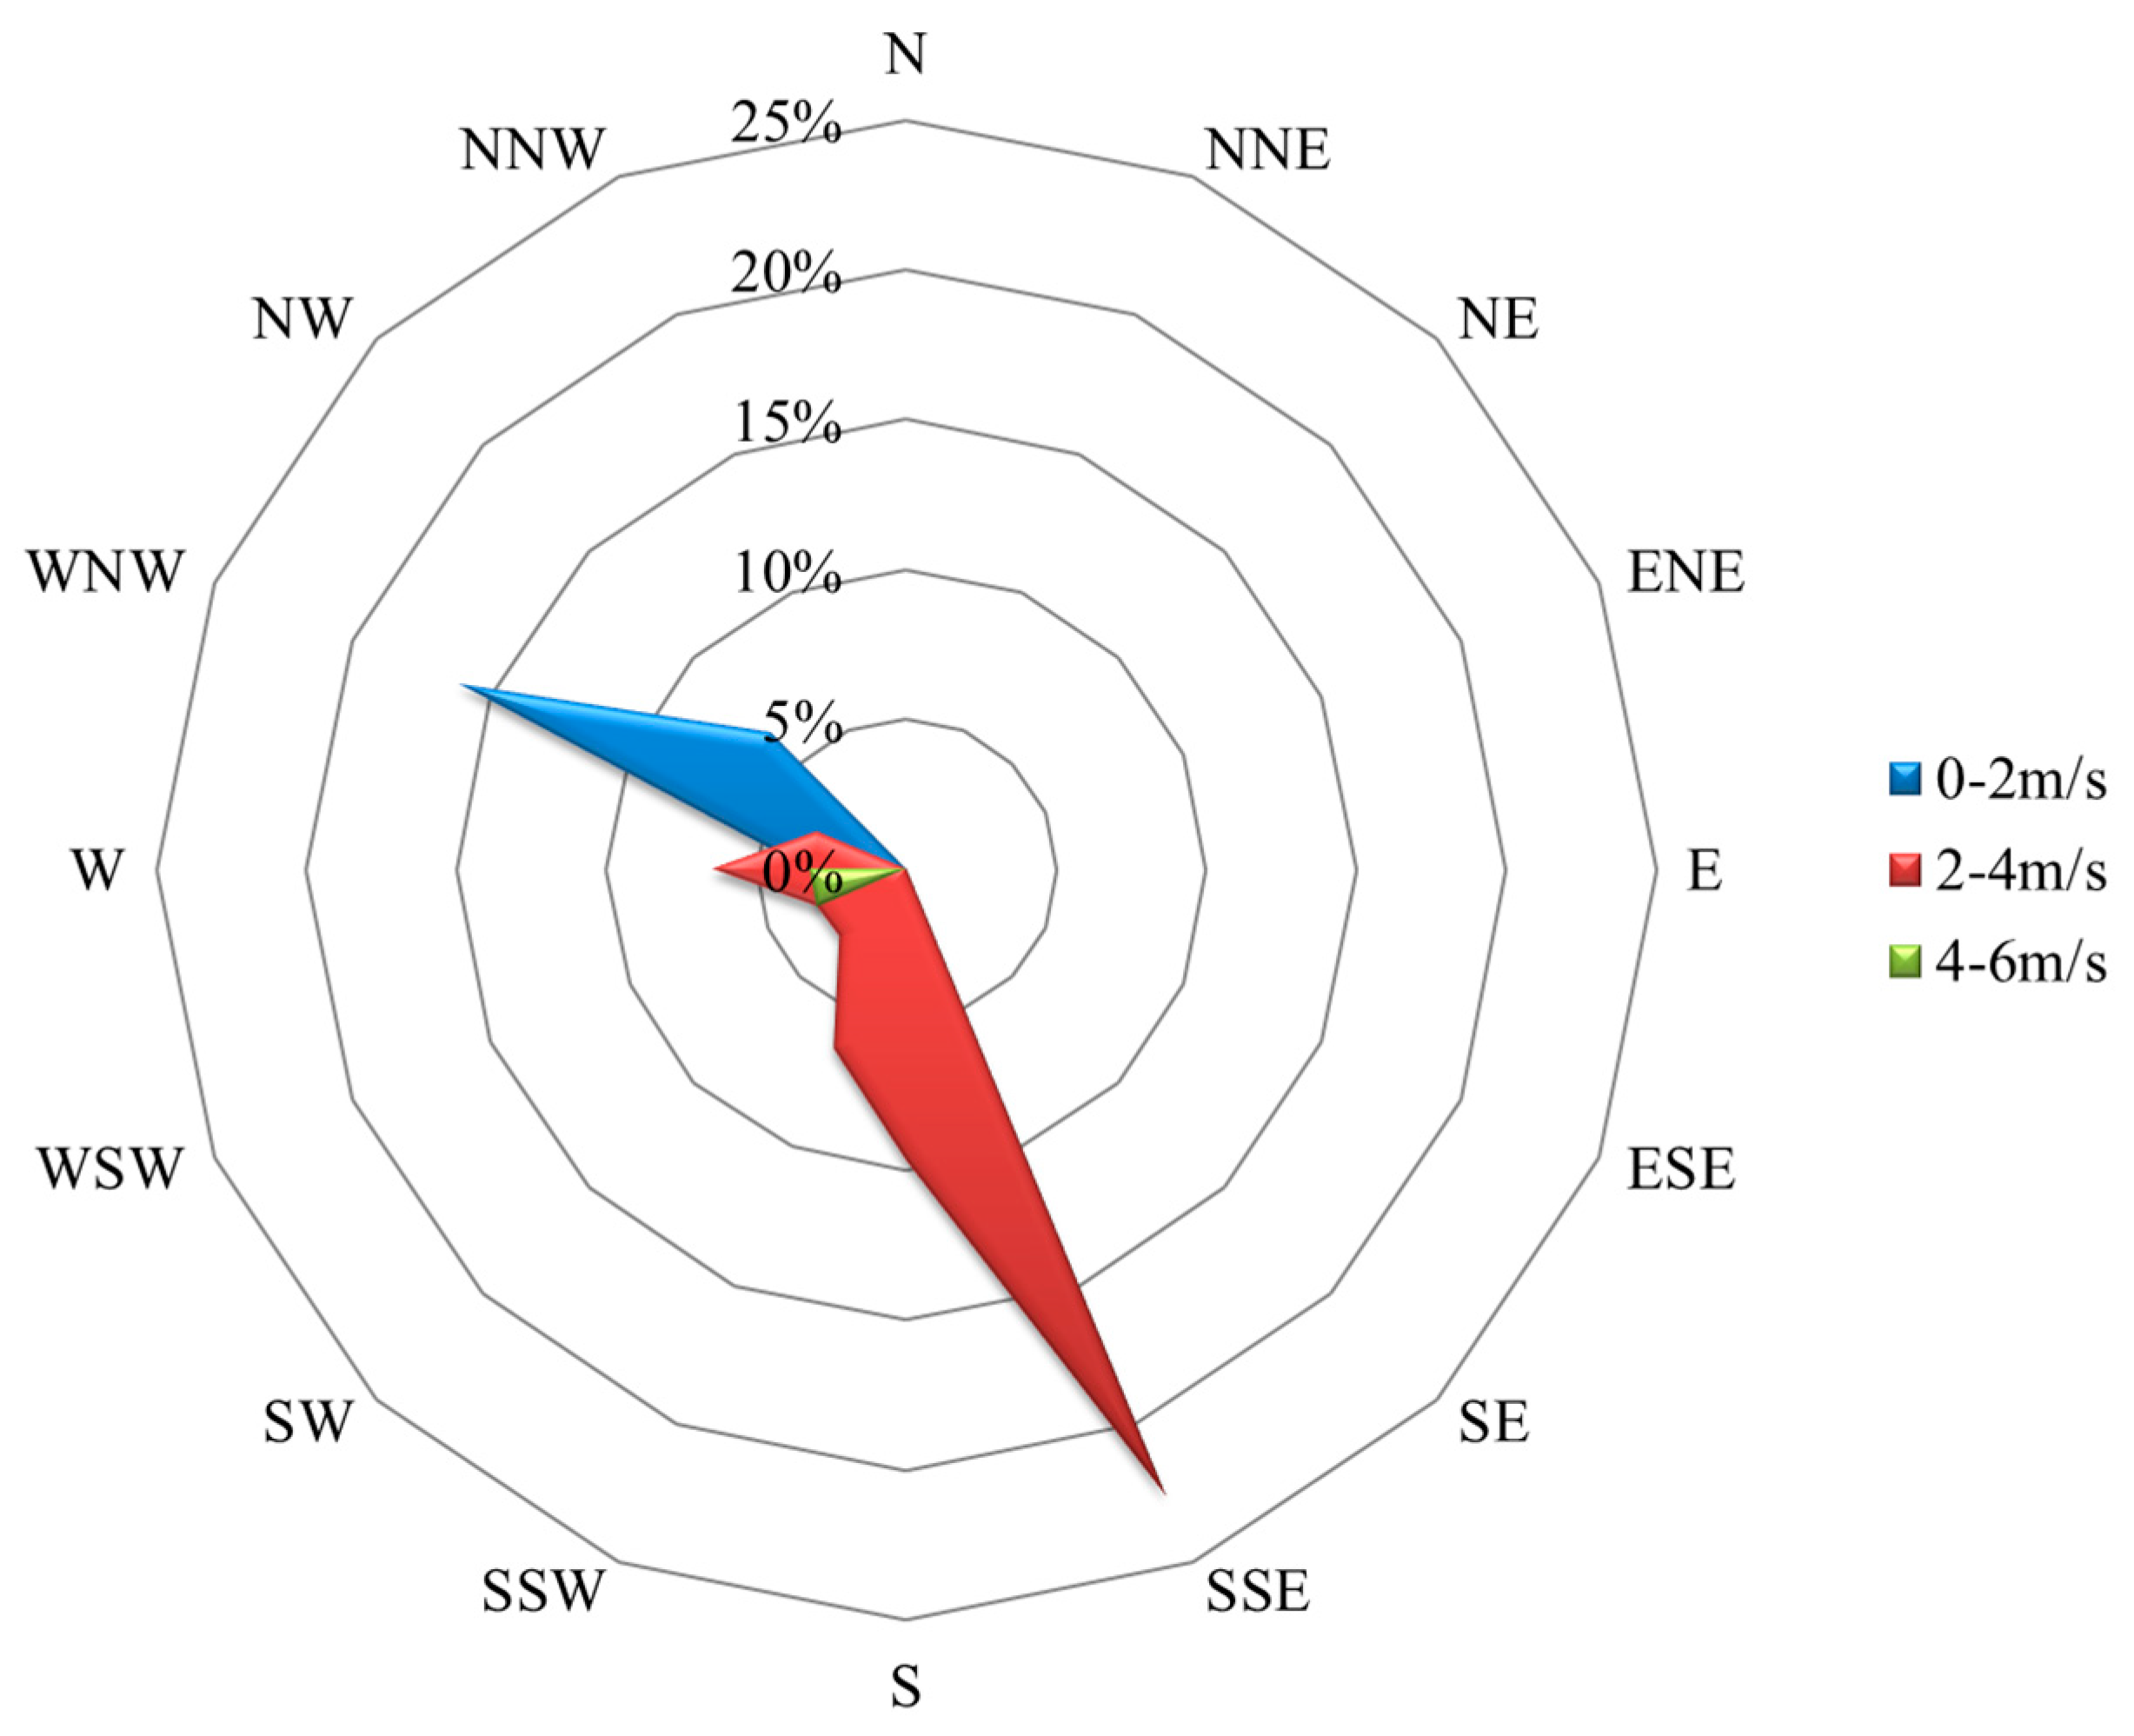
During the monitoring period, no precipitation was recorded. The mean air temperature was 30.5 °C—the highest among the three summer months (June, July, and August) of 2022—leading to the selection of July as the representative summer month for this study. The mean relative humidity was 89.7%. As shown in Figure 1, the dominant wind direction at the sampling site was south-southeast (SSE), with secondary prevailing directions from the west (W) and west-northwest (WNW). Wind direction exhibited high directional concentration, indicative of pronounced meteorological stability. The mean wind speed was 2.3 m/s—predominantly within the light-to-gentle breeze range (Beaufort scale 2–3)—thereby favoring near-surface accumulation of locally emitted pollutants and inhibiting rapid horizontal dispersion. During daytime, sea breezes from the south and south-southwest transported unsaturated hydrocarbons—emitted from urban and port areas—landward. At night, land breezes from the northwest and north-northeast advected pollutants originating from inland sources toward the coast, establishing a well-defined local land–sea breeze circulation. Consequently, the combined effects of this diurnal circulation and persistently stagnant meteorological conditions rendered local emissions the dominant source of pollutants, whereas long-range transport contributed only marginally.

2.2. Instrumentation and Quality Assurance/Quality Control

Atmospheric unsaturated hydrocarbon volatile organic compounds were continuously monitored online by a dedicated VOCs analyzer (Model ZF-PKU-VOC1007, Beijing Pengyuchangya, Beijing, China) [23,24,25], which was configured with gas chromatography–mass spectrometry and flame ionization detection (GC-MS/FID). This system was equipped with a Shimadzu QP-2010S GC-FID/MS combined analyzer (Shimadzu Corporation, Kyoto, Japan) for qualitative and quantitative analysis of VOCs. A total of 29 unsaturated hydrocarbon VOCs were quantitatively analyzed, as detailed in Table 1. The instrument employs a dual-channel sampling system. The collected samples are cryogenically enriched at −150 °C. It is equipped with a flame ionization detector (FID) and a mass spectrometer (MS), providing a temporal resolution of 1 h. To ensure the reliability of the unsaturated hydrocarbon VOC monitoring data, the instrument was calibrated using both internal and external standards during sampling. Standard gases, including the PAMS standard mixture and TO-15 mixture, which are certified by the United States Environmental Protection Agency (EPA), were used for external calibration.
The internal standard calibration substances included bromochloromethane, 1,4-difluorobenzene, chlorobenzene-D5, and 4-bromofluorobenzene. A six-point calibration method was employed to construct standard curves, with all linear correlation coefficients (R2) exceeding 0.990. Daily at 00:00, a mixed standard gas with a concentration of 2.0 ppbv was introduced for single-point calibration. This procedure corrected for potential concentration and peak window shifts in the daily data. The retention time drift was controlled to be within 0.5 min of the retention time recorded during the latest calibration curve verification.

2.3. Analytical Methods

2.3.1. Ozone Formation Potential

Ozone formation potential is employed to characterize the potential of different VOCs to generate ozone, serving as a comprehensive indicator that accounts for the reactivity of VOC species in ozone formation. OFP can be used to analyze the potential contribution of VOC species from various emission sources to ambient ozone, thereby identifying key VOC sources for control.
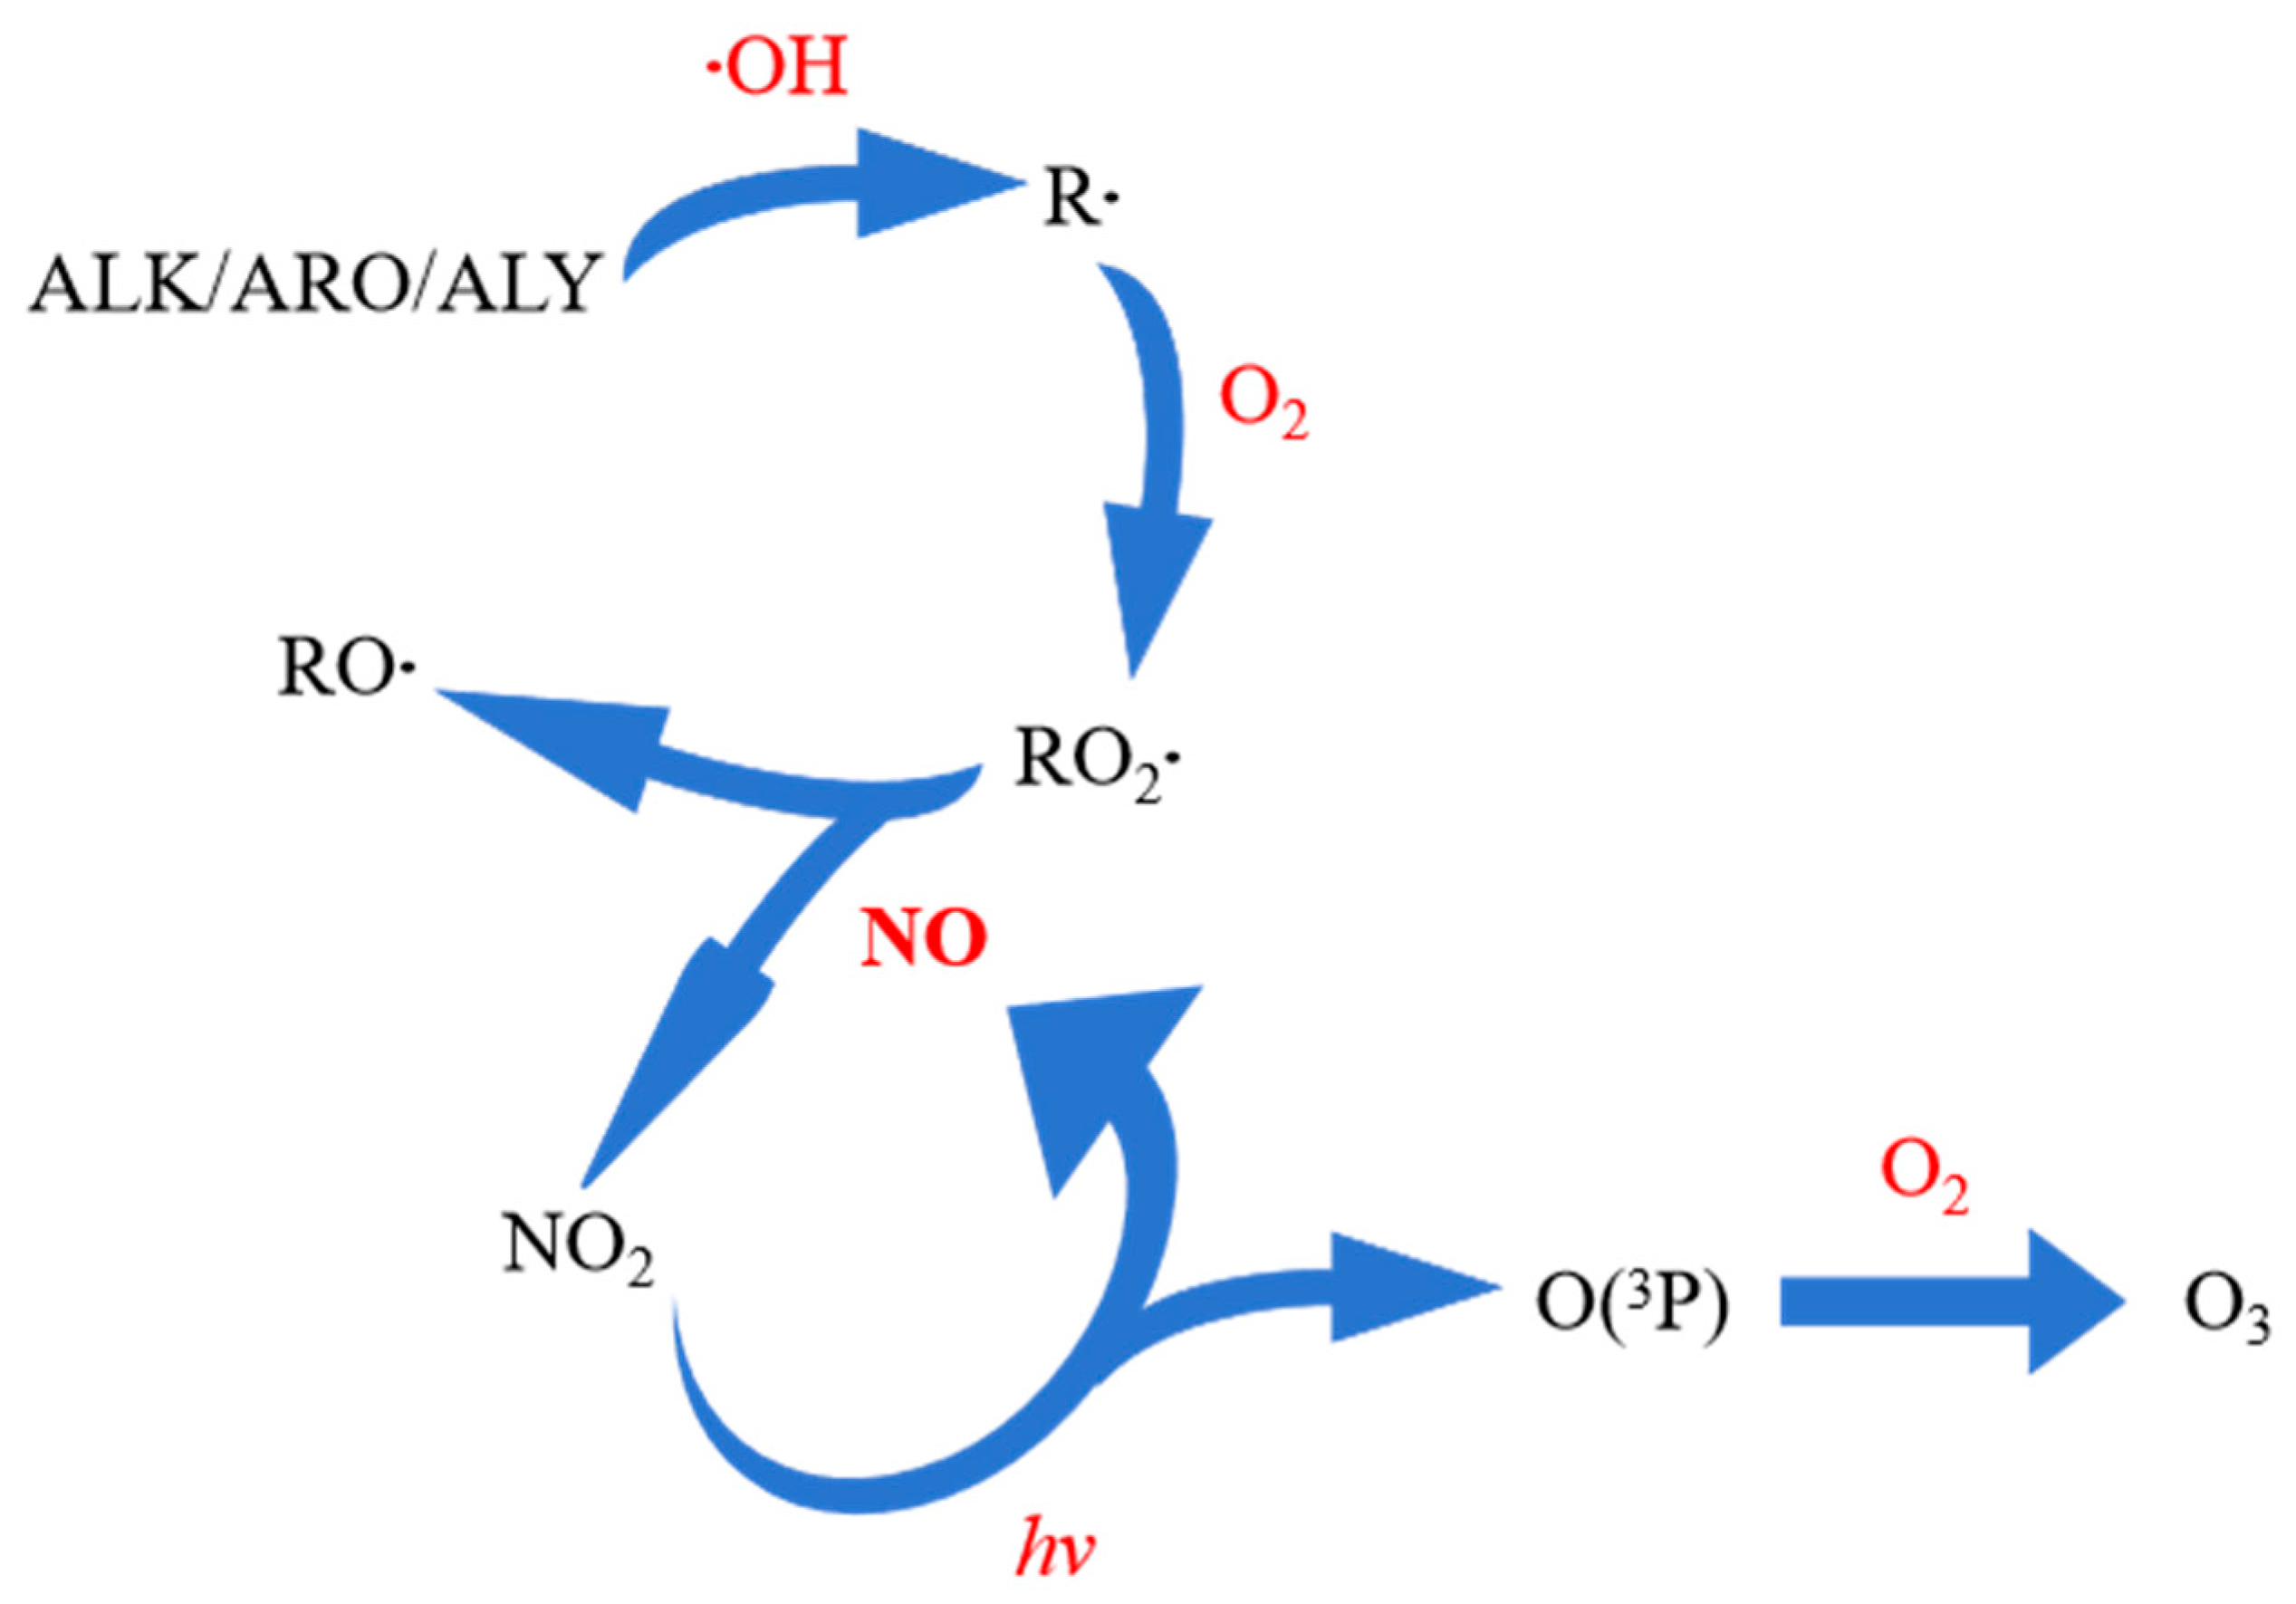
As illustrated in Figure 2, the photochemical formation of ozone from unsaturated hydrocarbons (alkenes, alkynes, and aromatics) proceeds via a simplified radical chain mechanism. These compounds react with hydroxyl radicals (·OH) to form alkyl radicals (R·), which rapidly add O2 to yield peroxy radicals (RO2·). The subsequent conversion of RO2· to alkoxy radicals (RO·) is accompanied by the oxidation of NO to NO2. Finally, NO2 undergoes photolysis (hv) to produce O(3P), which combines with O2 to generate ozone (O3).
The maximum incremental reactivity (MIR) method proposed by Carter [26] was adopted to estimate the ozone formation potential (POFP,i) of unsaturated hydrocarbon VOCs, as shown in Equation (1):
P OFP , i = i n φ VOC , i R MIR , i
where φVOC,i is the concentration of VOC species i and RMIR,i is the corresponding MIR value for VOC species i. This study utilized the latest research results from Carter’s laboratory [27] for the MIR values.

2.3.2. Source Apportionment of Unsaturated Hydrocarbon VOCs

The positive matrix factorization model (PMF 5.0) was applied to conduct source apportionment for the 29 unsaturated hydrocarbon VOCs measured in Beihai city during the summer of 2022. The PMF model uses weighting factors in the matrix analysis of unsaturated hydrocarbons, iteratively solving the problem by combining data uncertainties and minimizing the least-squares objective function. This process ultimately identifies the major pollution sources and quantifies their contributions to unsaturated hydrocarbon VOCs, as calculated by Equation (2):
x ij   = k = 1 p g ik   ×   f kj   +   e ij
where xij is the concentration of species j in sample i; p is the number of source factors; gik is the contribution of source k to sample i (%); fkj is the contribution of species j in the profile of source k (%); and eij is the residual for species j in sample i.
The PMF model derives factor contributions and profiles by minimizing the objective function Q, making Q a crucial indicator for assessing the model’s goodness-of-fit. The calculation of Q is given in Equation (3):
Q = i = 1 n j = 1 m x ij k = 1 p g ik f kj u ij 2
where xij is the concentration of species j in sample i; gik is the contribution of source k to sample i (%); fkj is the contribution of species j in the profile of source k (%); and uij is the uncertainty of species j in sample i.
Through multiple iterative runs of the model and consideration of the actual conditions in Beihai, five factors were ultimately determined. In the optimal model run, the QTrue was 69,453, the QRobust was 58,973.6, and their ratio (QTrue/QRobust) was 1.17, indicating convergence of the fitting results. Furthermore, the residual analysis for each unsaturated hydrocarbon VOC conformed to a normal distribution. To further assess the stability and uncertainty of the PMF solution, a bootstrap (BS) analysis comprising 100 resampling runs was conducted, followed by BS DISP analysis in accordance with the U.S. EPA PMF 5.0 guidelines. Bootstrap factor mapping—using a minimum correlation threshold of R = 0.6—demonstrated consistent reproduction of the five resolved source factors across all runs: Boot Factor 1 was unambiguously assigned to fuel evaporation (99%); Boot Factor 2 to solvent usage (100%); Boot Factor 3 primarily to combustion (78%), with minor contributions from solvent usage (20%) and vehicle exhaust (2%); Boot Factor 4 predominantly to vehicle exhaust (92%), with a minor contribution from solvent usage (7%); and Boot Factor 5 mainly to biogenic emissions (93%), with minor contributions from solvent usage (6%) and fuel evaporation (1%). The QRobust values obtained from the 100 bootstrap runs ranged from 42,826 to 63,400 (median = 56,839; 25th percentile = 54,120; 75th percentile = 58,765). The QRobust value of the base run (58,973.6) lies close to both the median and the 75th percentile, indicating strong model stability. Moreover, the 5th–95th percentile ranges of the dominant tracer species within each factor were narrow—e.g., acetylene in Factor 1 (0.0119–0.0639 ppbv), m,p-xylene in Factor 2 (0.0350–0.0495 ppbv), ethylene in Factor 3 (0.0688–0.1866 ppbv), acetylene in Factor 4 (0.0981–0.1702 ppbv), and isoprene in Factor 5 (0.0718–0.0863 ppbv)—further confirming the robustness of the factor profiles and the reliability of the source apportionment results.

3. Results and Discussion

3.1. Source Apportionment of Unsaturated Hydrocarbons

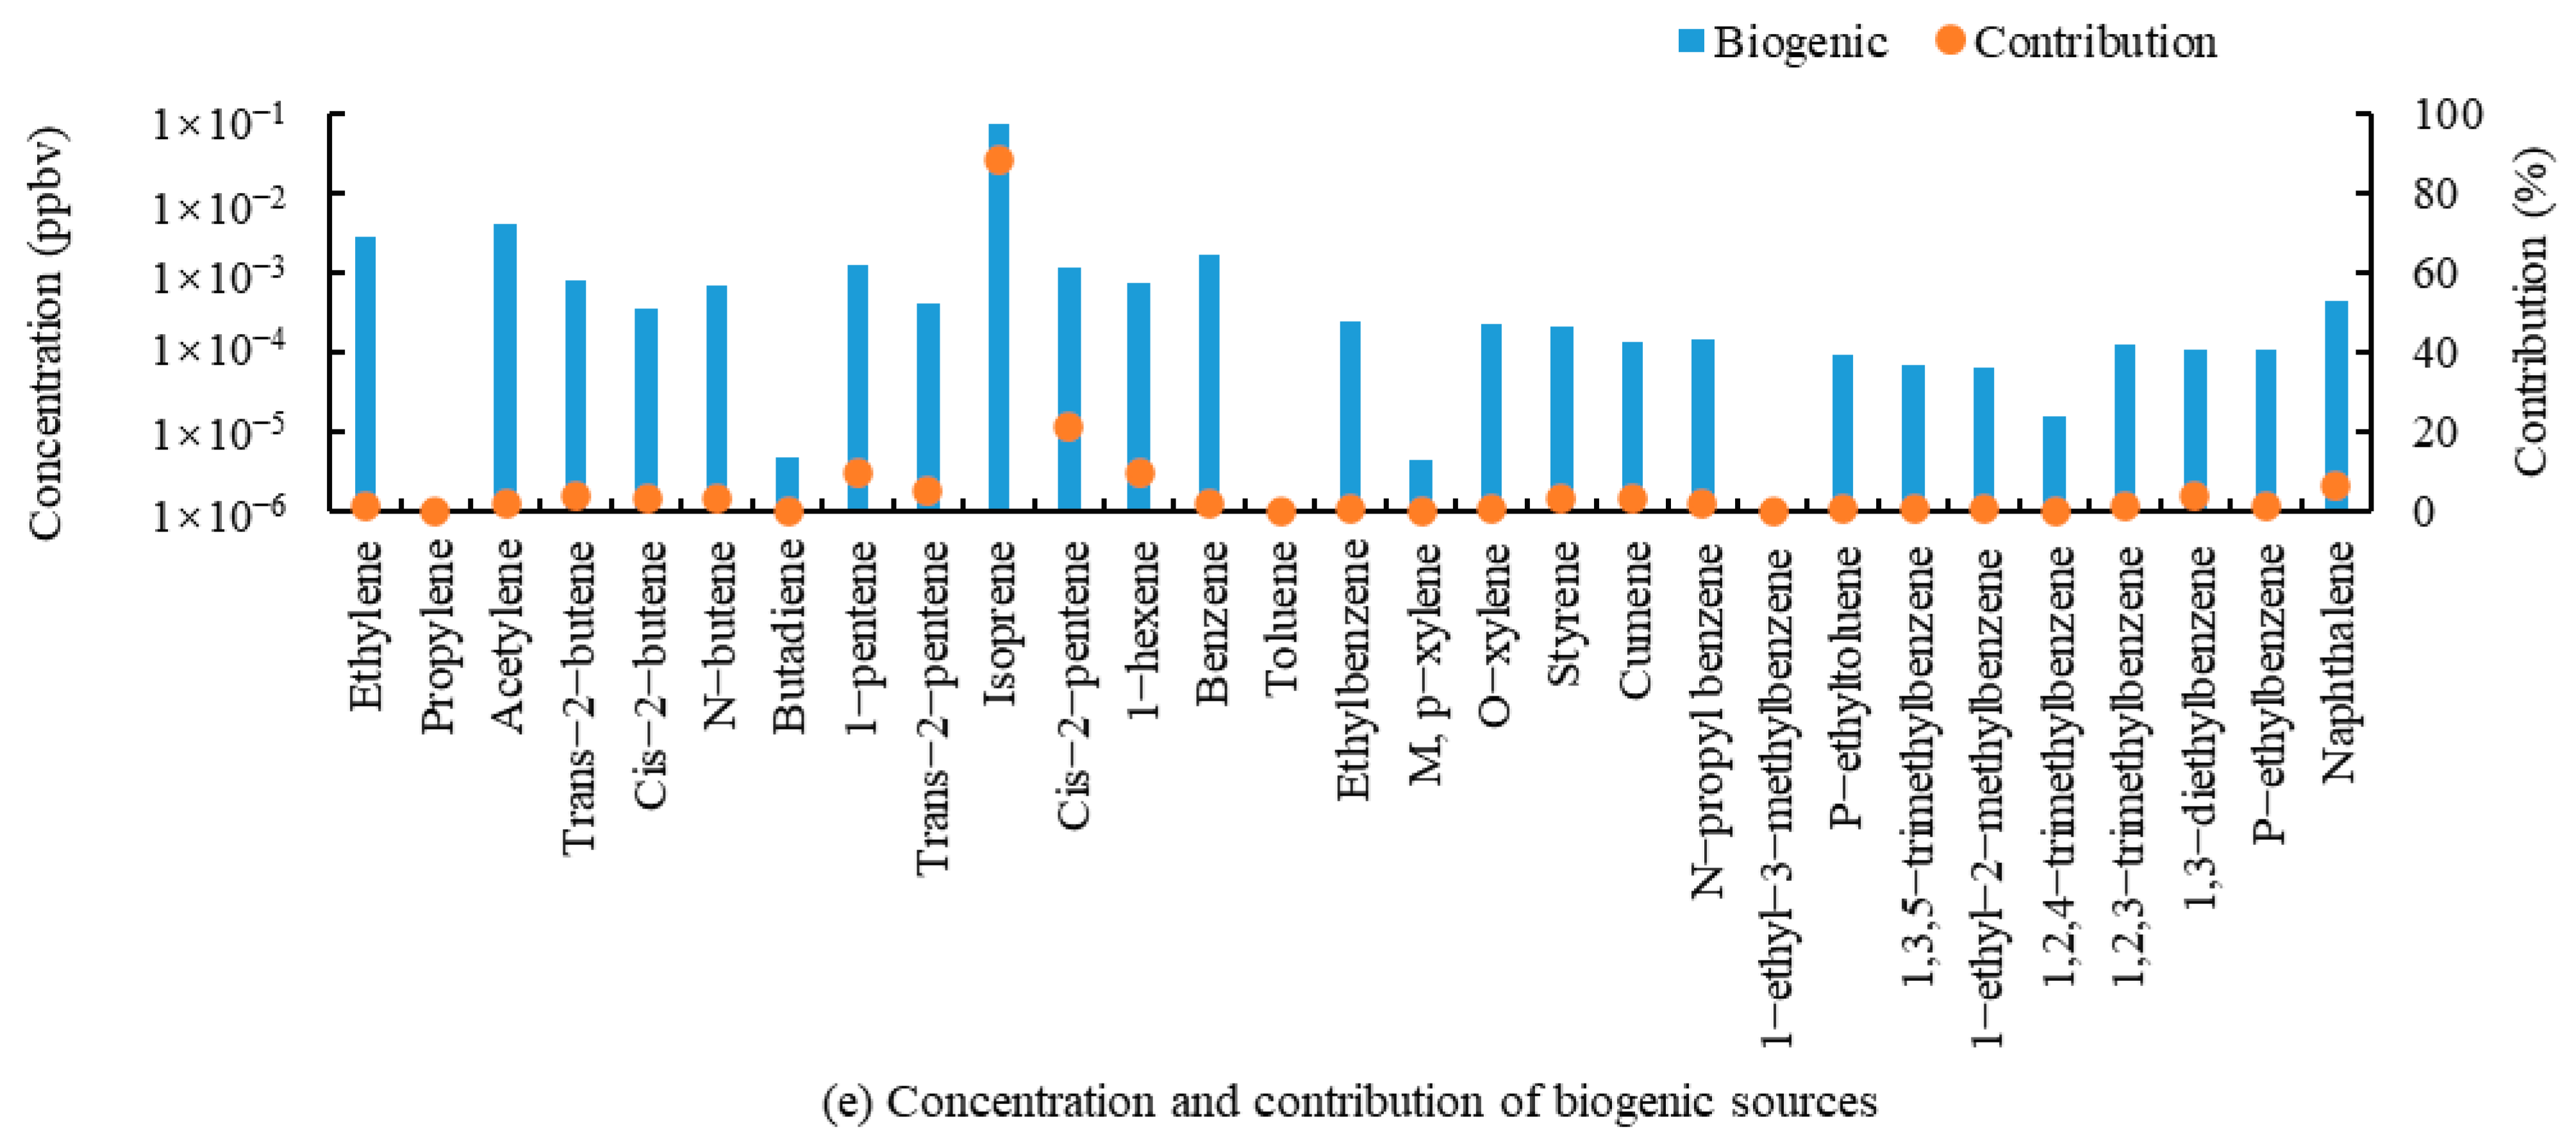
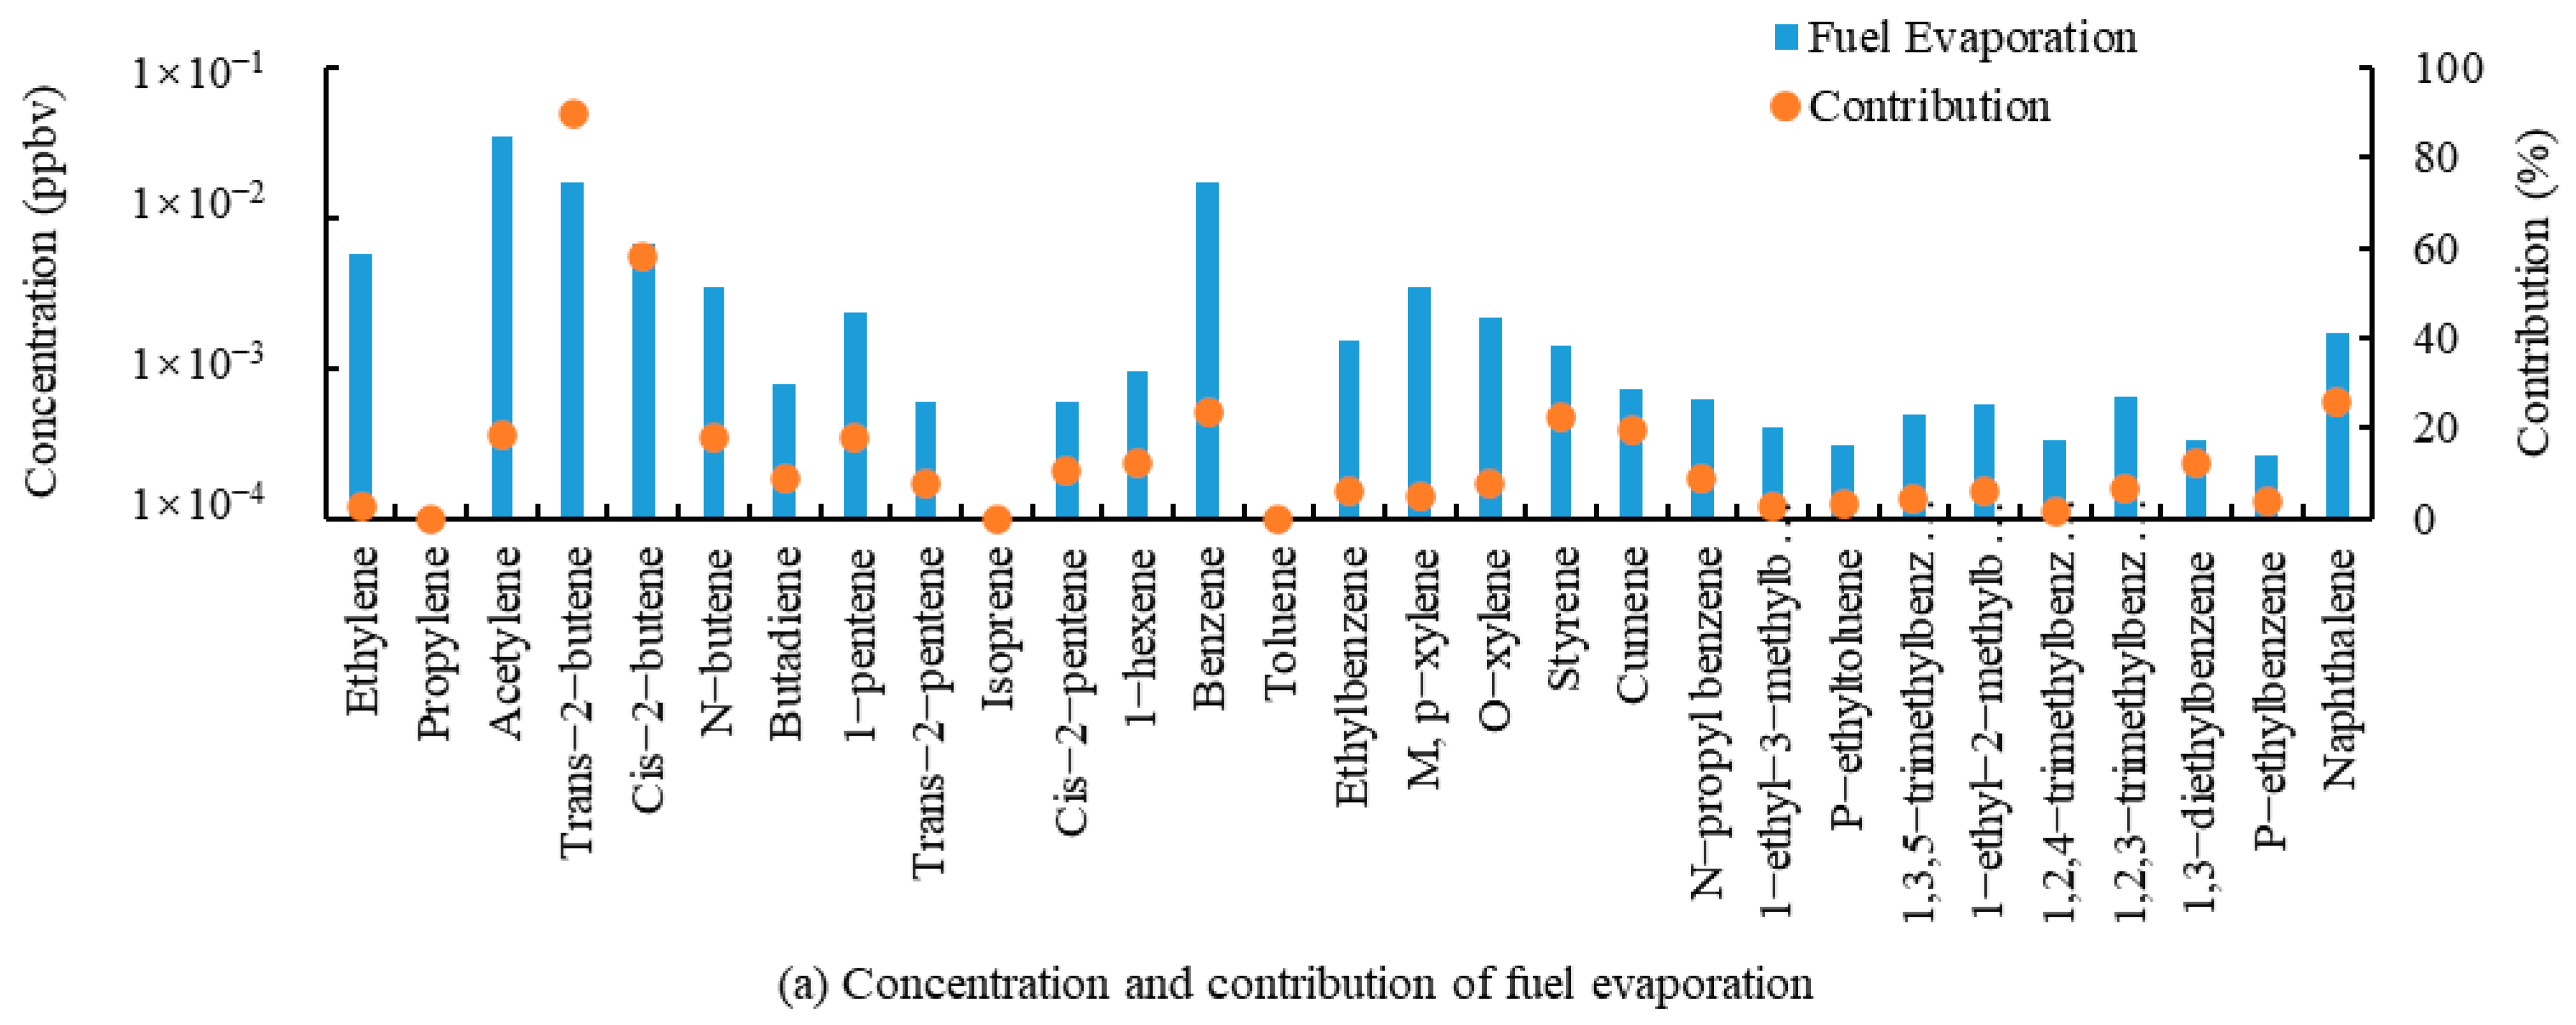
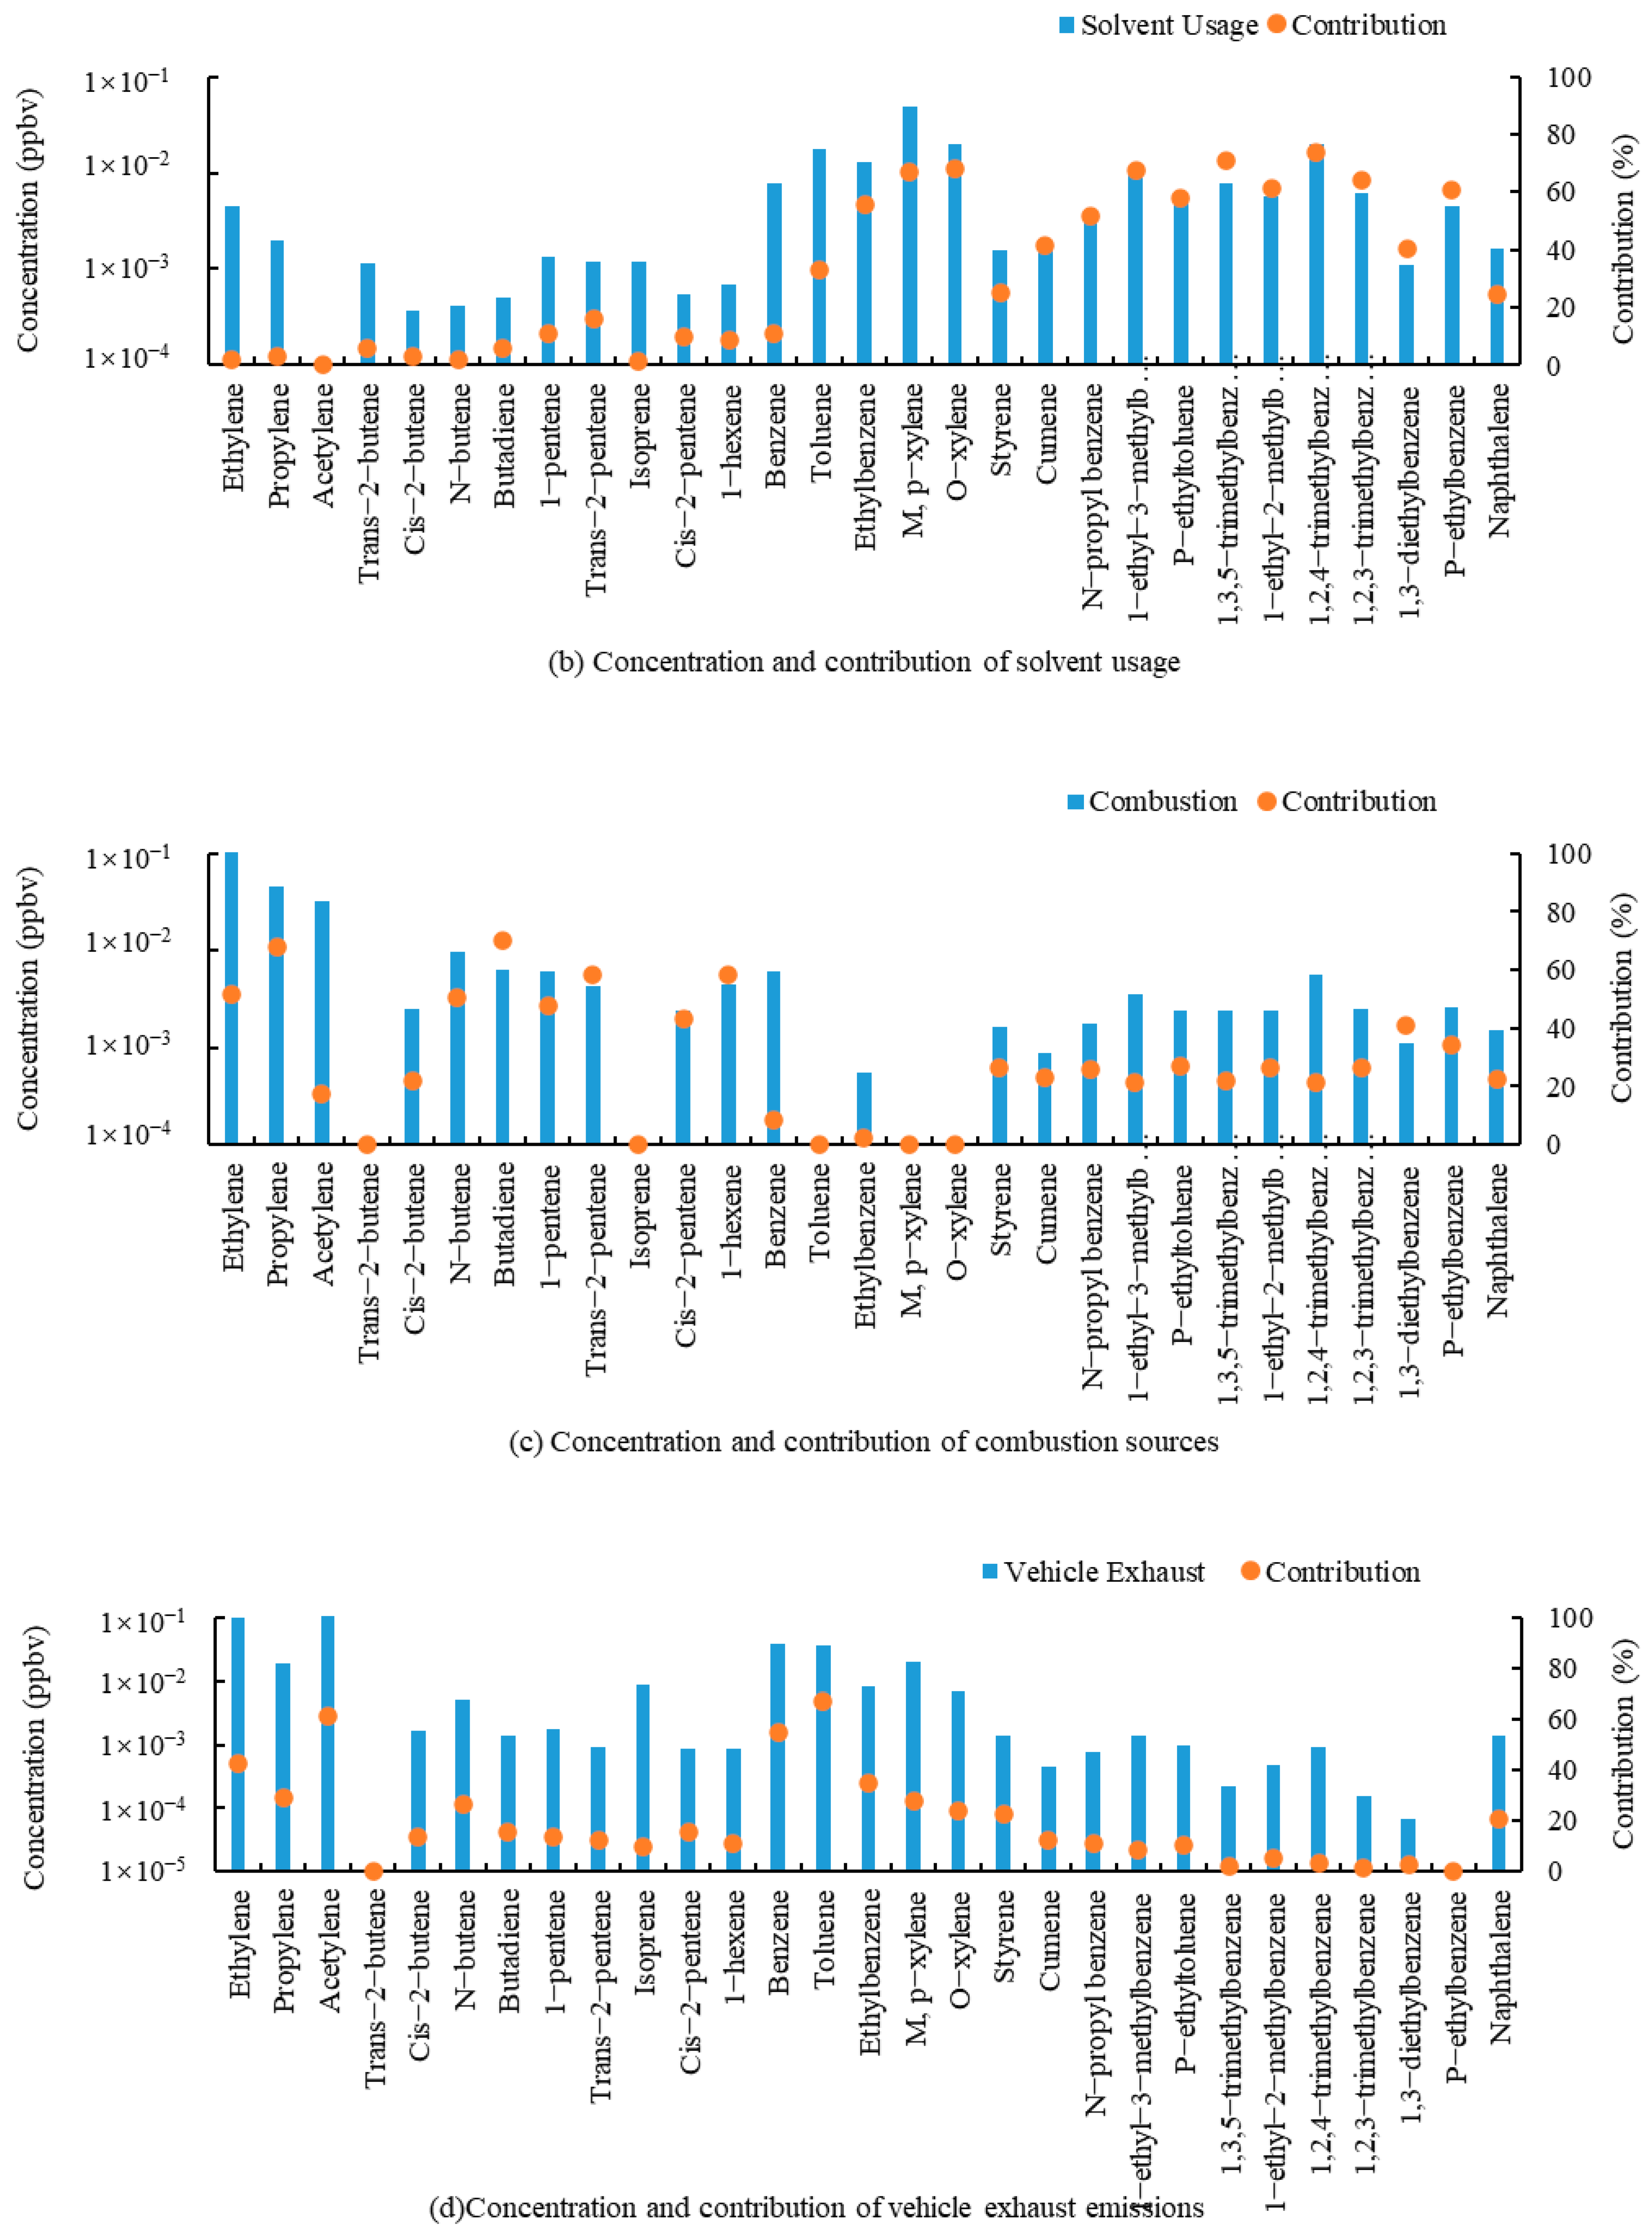
Source apportionment using the PMF model revealed five major sources contributing to unsaturated hydrocarbons in the ambient air of Beihai city during summer, as shown in Figure 3.
Factor 1 was characterized by the highest loading of acetylene (32.63%), followed by trans-2-butene (16.32%) and toluene (16.18%). Analysis of the source profiles indicated that Factor 1 was the predominant source of trans-2-butene, contributing 89.75%. Given that trans-2-butene is a major component associated with fuel evaporation [28], this factor was identified as a fuel evaporation source. Factor 2 was dominated by m,p-xylene (25.33%), followed by 1,2,4-trimethylbenzene (10.43%), o-xylene (10.42%), and toluene (9.22%). Since m,p-xylene, o-xylene, and toluene are commonly used in paints and coatings and serve as typical tracers for solvent usage [29,30,31], Factor 2 was designated as a solvent usage source. Factor 3 was dominated by ethylene (44.68%), with significant contributions from propylene (16.94%) and acetylene (11.90%). Ethylene is an indicator of incomplete combustion, and together with propylene and acetylene, it serves as a key tracer for combustion processes [22,32]. Therefore, Factor 3 was identified as a combustion source. Factor 4 exhibited the highest loading for acetylene (30.27%), followed by ethylene (26.71%), toluene (10.52%), and m,p-xylene (9.72%). Gasoline in China typically contains high levels of olefins and aromatic hydrocarbons, leading to elevated emission factors for these species [33]. Light hydrocarbons such as acetylene and ethylene are products of incomplete combustion and represent characteristic components of vehicle exhaust VOCs in China [33,34,35]. Studies on vehicle exhaust emissions have demonstrated that, although the composition of non-methane hydrocarbons in vehicular VOCs varies geographically, acetylene, ethylene, toluene, m,p-xylene, and propylene consistently constitute the dominant VOC species across diverse regions—fully aligning with the major contributors identified in Factor 4 [36,37,38,39]. Consequently, Factor 4 was attributed to vehicle exhaust emissions. Factor 5 was overwhelmingly dominated by isoprene, accounting for 82.84%. Isoprene is primarily emitted by vegetation [40]. Thus, Factor 5 was classified as a biogenic source.
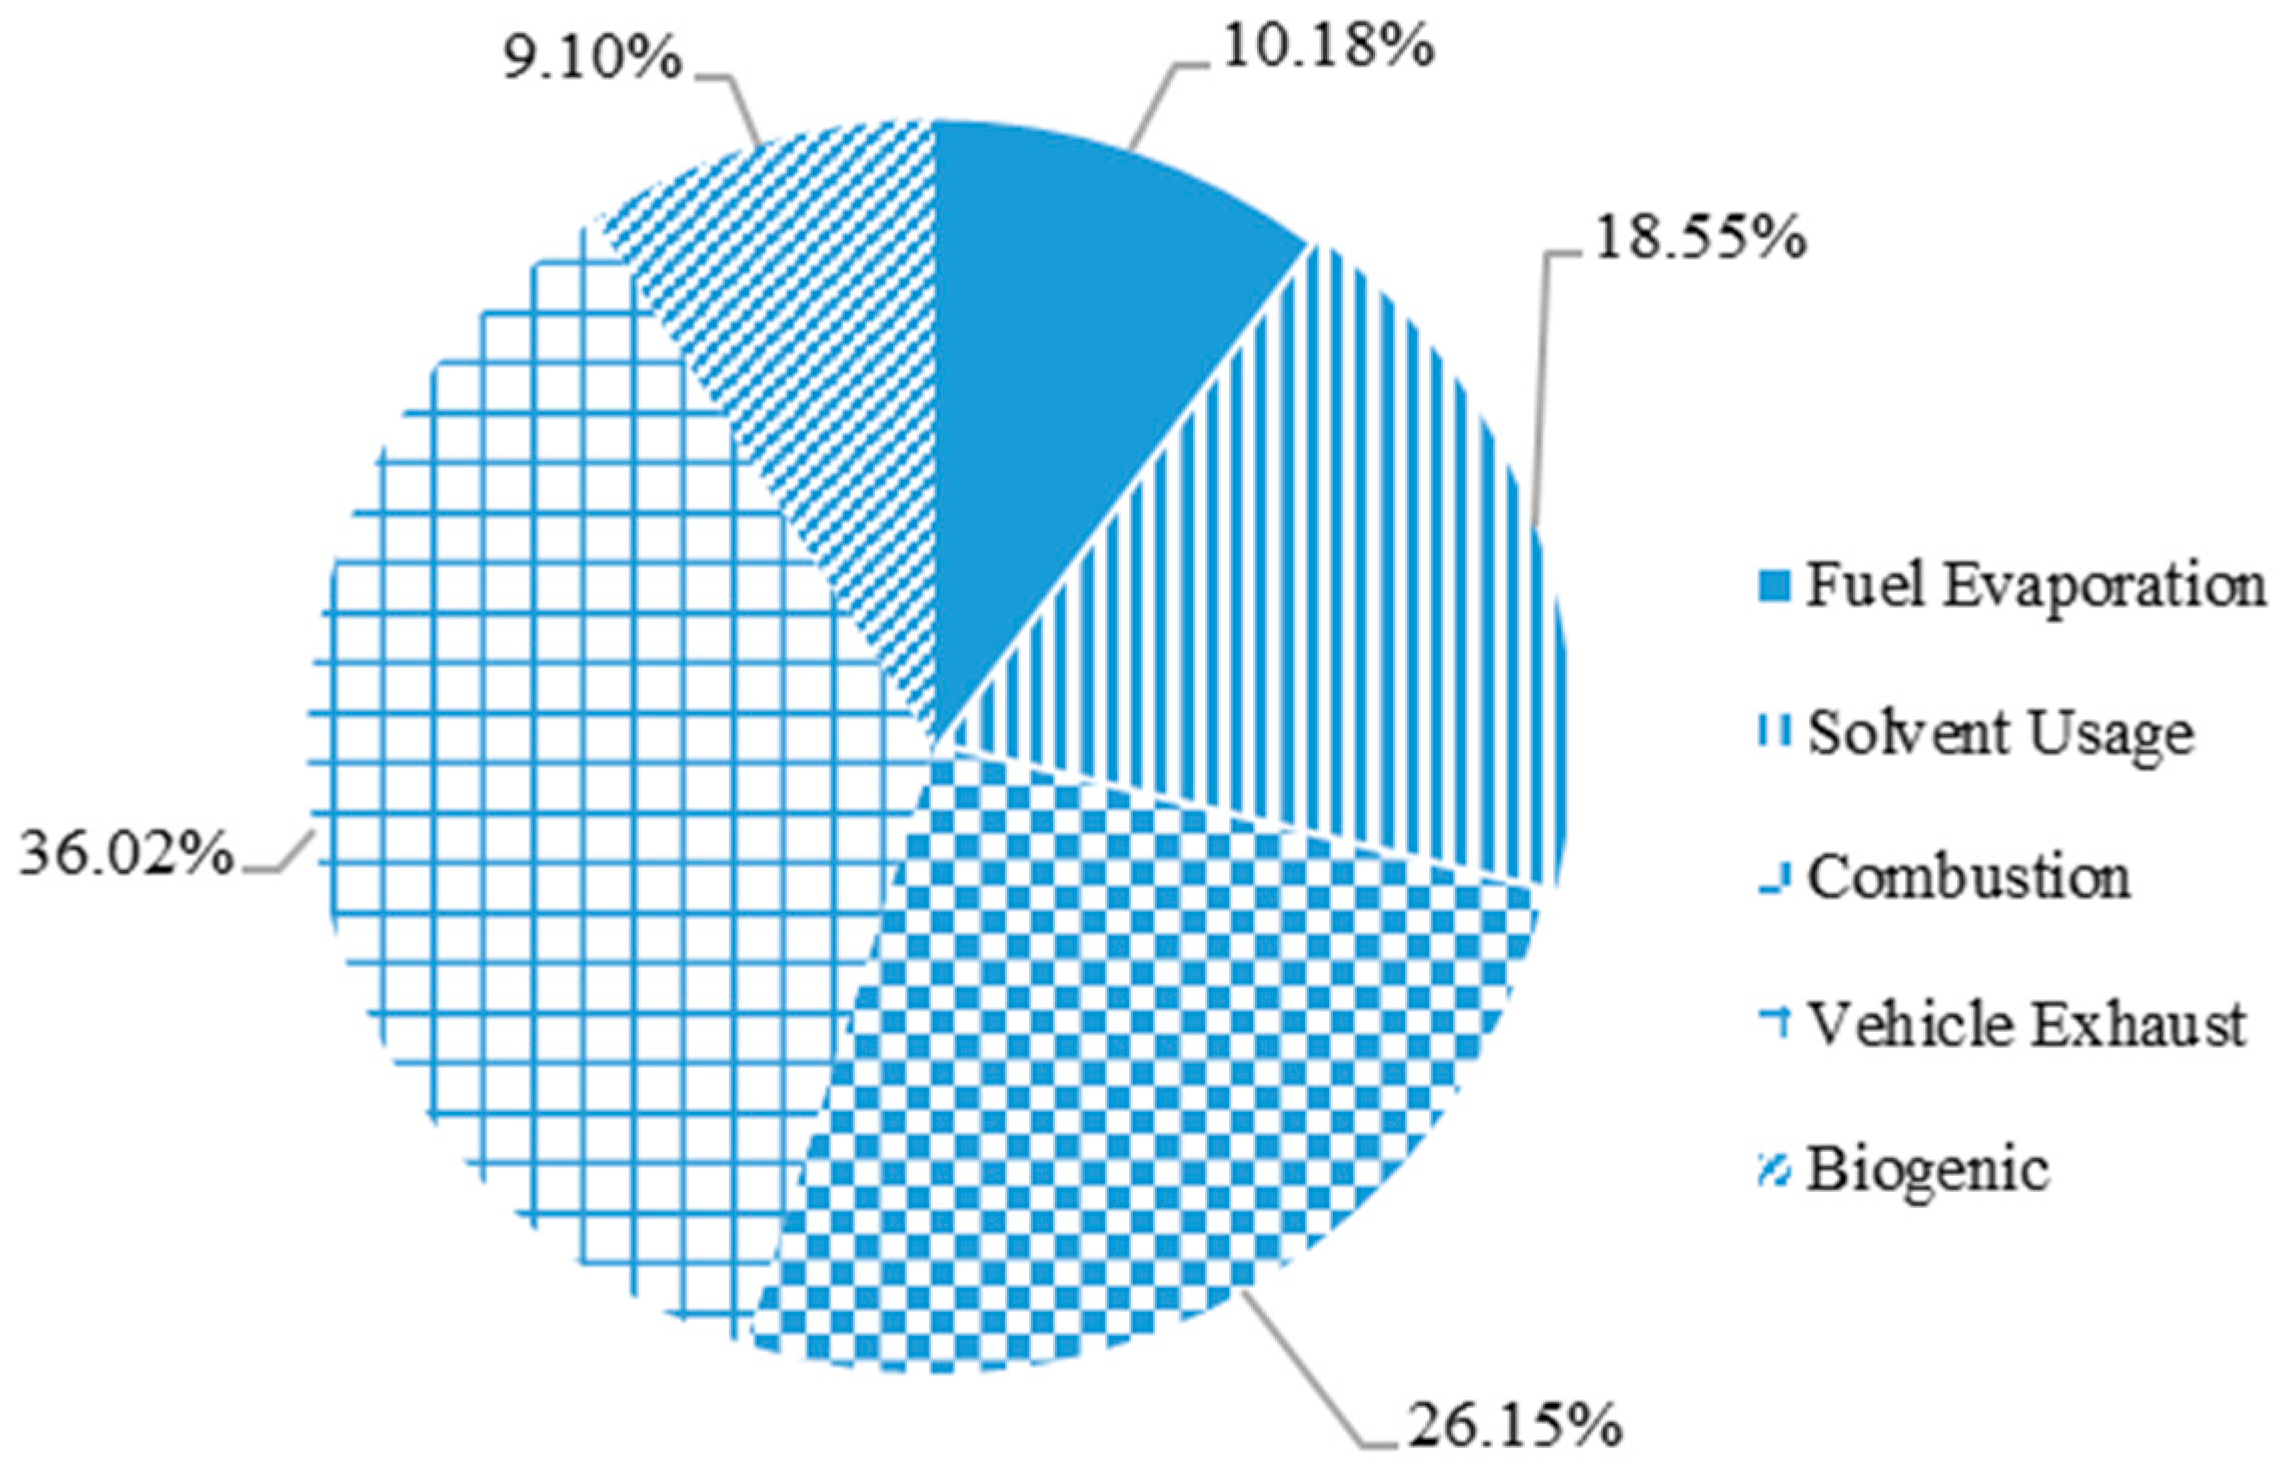
The contributions of each source to the unsaturated hydrocarbons are shown in Figure 4. During summer, the primary source of unsaturated hydrocarbons in Beihai city was vehicle exhaust emissions, accounting for 36.02% of the total. Secondary sources included combustion sources, solvent usage, fuel evaporation, and biogenic sources, contributing 26.15%, 18.55%, 10.18%, and 9.10%, respectively.
The contributions of the five major sources—fuel evaporation, solvent usage, combustion, vehicle exhaust emissions, and biogenic sources—to alkenes, alkynes, and aromatic hydrocarbons differed, as detailed in Table 2. Because isoprene is predominantly of biogenic origin and highly abundant, its exclusion from the total alkene pool facilitates a more robust quantification of anthropogenic contributions. Specifically, alkenes (excluding isoprene) were primarily attributable to combustion processes (51.41%), with vehicle exhaust emissions constituting the second-largest source (33.04%). Alkynes mainly originated from vehicle exhaust emissions, accounting for 61.52%, followed by fuel evaporation (18.73%) and combustion (17.55%). Aromatic hydrocarbons predominantly came from solvent usage, contributing 48.26%, with vehicle exhaust emissions being the secondary source at 32.35%.
The PMF analysis identified five major sources of unsaturated hydrocarbon VOCs in Beihai during summer, with vehicle exhaust (36.02%) and solvent usage (18.55%) emerging as the dominant contributors. This finding aligns with observations in Seoul [41], where vehicle exhaust and solvent usage were likewise identified as primary sources; however, combustion-related emissions exhibited a comparatively greater contribution during winter. In contrast, ozone formation sensitivity in Japan’s Kanto region displays marked spatial heterogeneity—VOC-limited in the urban core but NOx-limited in suburban areas [42]. As a medium-sized coastal city, Beihai experiences distinct summer meteorological conditions: a mean temperature of 30.5 °C, relative humidity of 89.7%, and mean wind speed of 2.3 m/s. These conditions critically influence atmospheric chemistry and pollutant dynamics: elevated temperature and humidity accelerate OH radical–mediated oxidation reactions, while the relatively low wind speed promotes local accumulation of pollutants. Collectively, these factors indicate that unsaturated hydrocarbon VOCs in Beihai during summer are predominantly attributable to local emissions, with only minor contributions from long-range transport. From a policy perspective, priority should be placed on mitigating vehicle exhaust emissions (36.02%)—for instance, by accelerating the transition to electric vehicles and implementing stricter evaporative emission standards—and on reducing solvent-related emissions (18.55%) through regulatory measures such as VOC content limits in architectural and industrial coatings, promotion of water-based alternatives, and deployment of closed-loop solvent recovery systems.
Compared with the one-year VOC source apportionment results for Nanning—the capital city of Guangxi Zhuang Autonomous Region [19]—the summer source contributions of unsaturated hydrocarbons in Beihai exhibit pronounced differences, which are closely linked to disparities in urban scale, industrial structure, and climatic conditions. Vehicular emissions accounted for 33% of total VOCs in Nanning, slightly lower than the 36.02% observed in Beihai. In contrast, combustion-related sources—including residential fuel burning and natural gas (NG)/liquefied petroleum gas (LPG) combustion—collectively contributed 36% in Nanning, exceeding the 26.15% contribution in Beihai. Notably, a distinct industrial emission source (10%) was resolved in Nanning but not identified in Beihai, reflecting Beihai’s comparatively lower level of industrialization. Moreover, the biogenic contribution in Beihai (9.10%) was substantially higher than that in Nanning (5.0%), a difference attributable to Beihai’s subtropical coastal setting, where elevated summer temperatures and intense solar radiation enhance isoprene emissions from vegetation. These comparisons underscore substantial intercity variation in VOC source profiles between a coastal tourist city and a provincial capital, highlighting the need for ozone mitigation strategies to be locally tailored rather than uncritically extrapolated from experiences in larger metropolitan areas.

3.2. Analysis of the Variation Characteristics of Unsaturated Hydrocarbons

A total of 29 unsaturated hydrocarbon VOCs were detected. The total daily average concentration was 1.21 ppbv, with an average concentration of 0.026 ppbv. The specific detection results are presented in Table 3. This included 11 alkene species, with a total daily average concentration of 0.56 ppbv, accounting for 46.28% of the total unsaturated hydrocarbon VOCs; one alkyne species, with an average concentration of 0.20 ppbv, accounting for 16.53%; and 17 aromatic hydrocarbon species, with a total daily average concentration of 0.45 ppbv, accounting for 37.19%.

3.2.1. Analysis of the Variation Characteristics of Alkenes

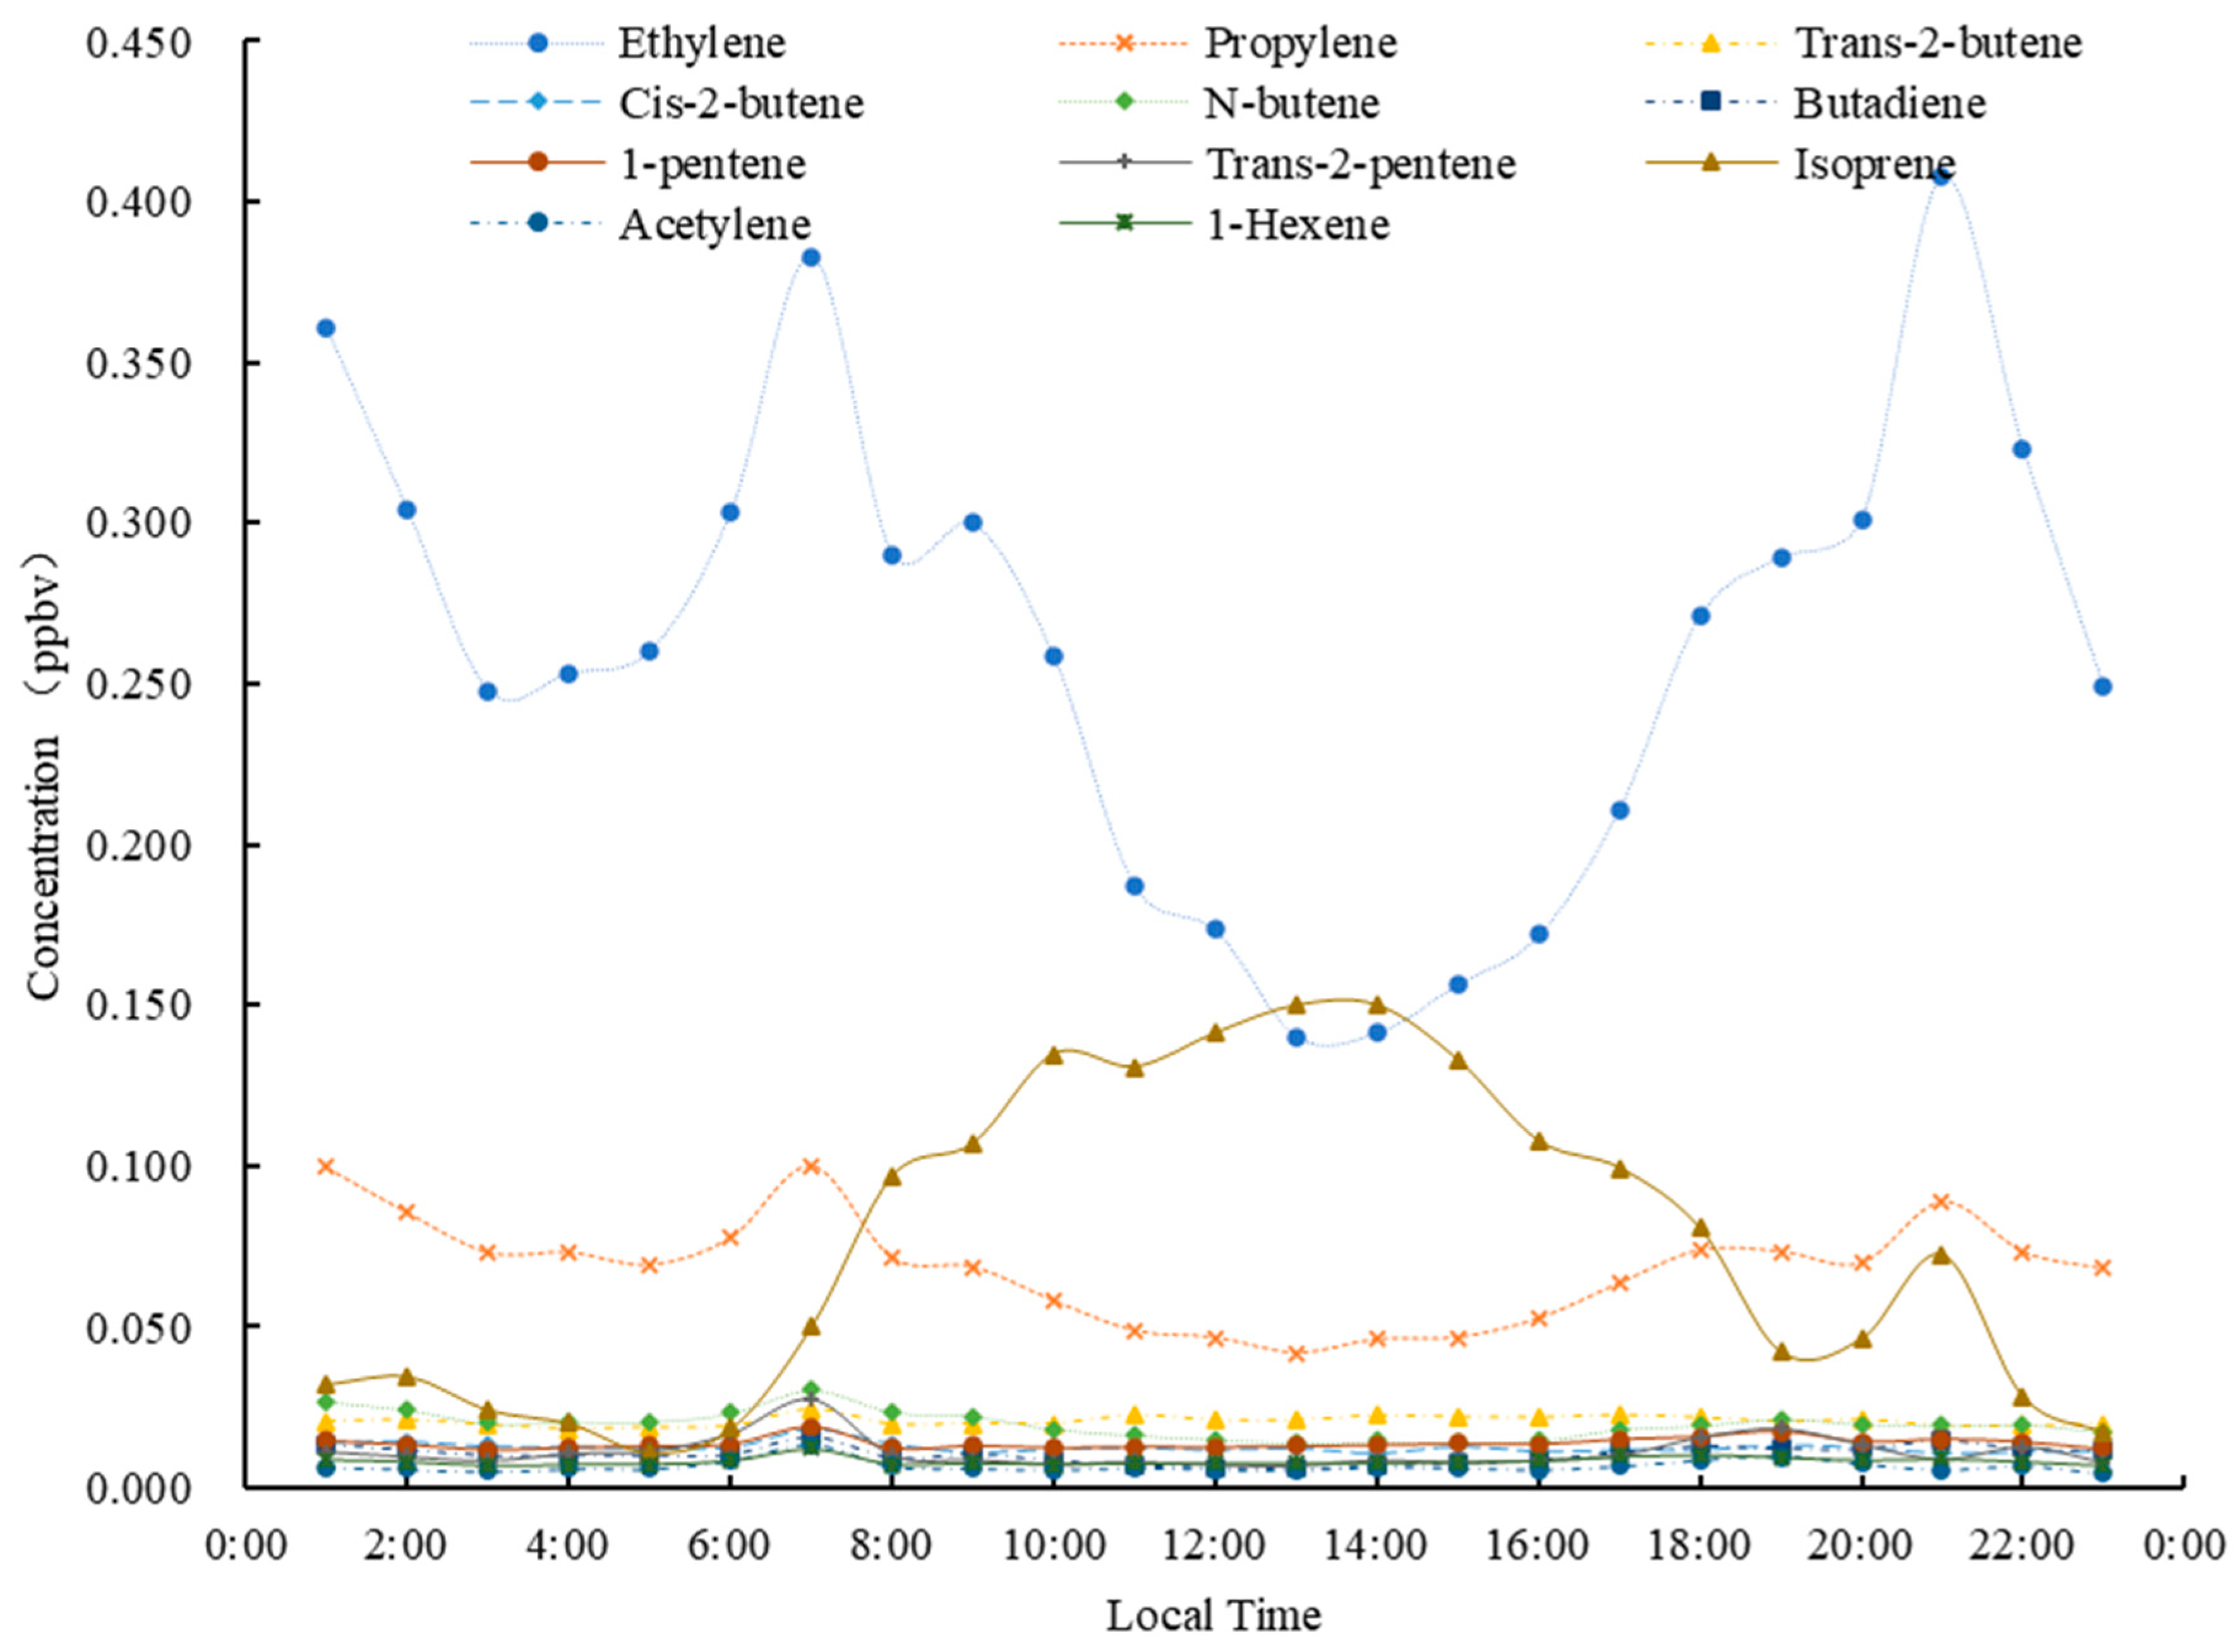
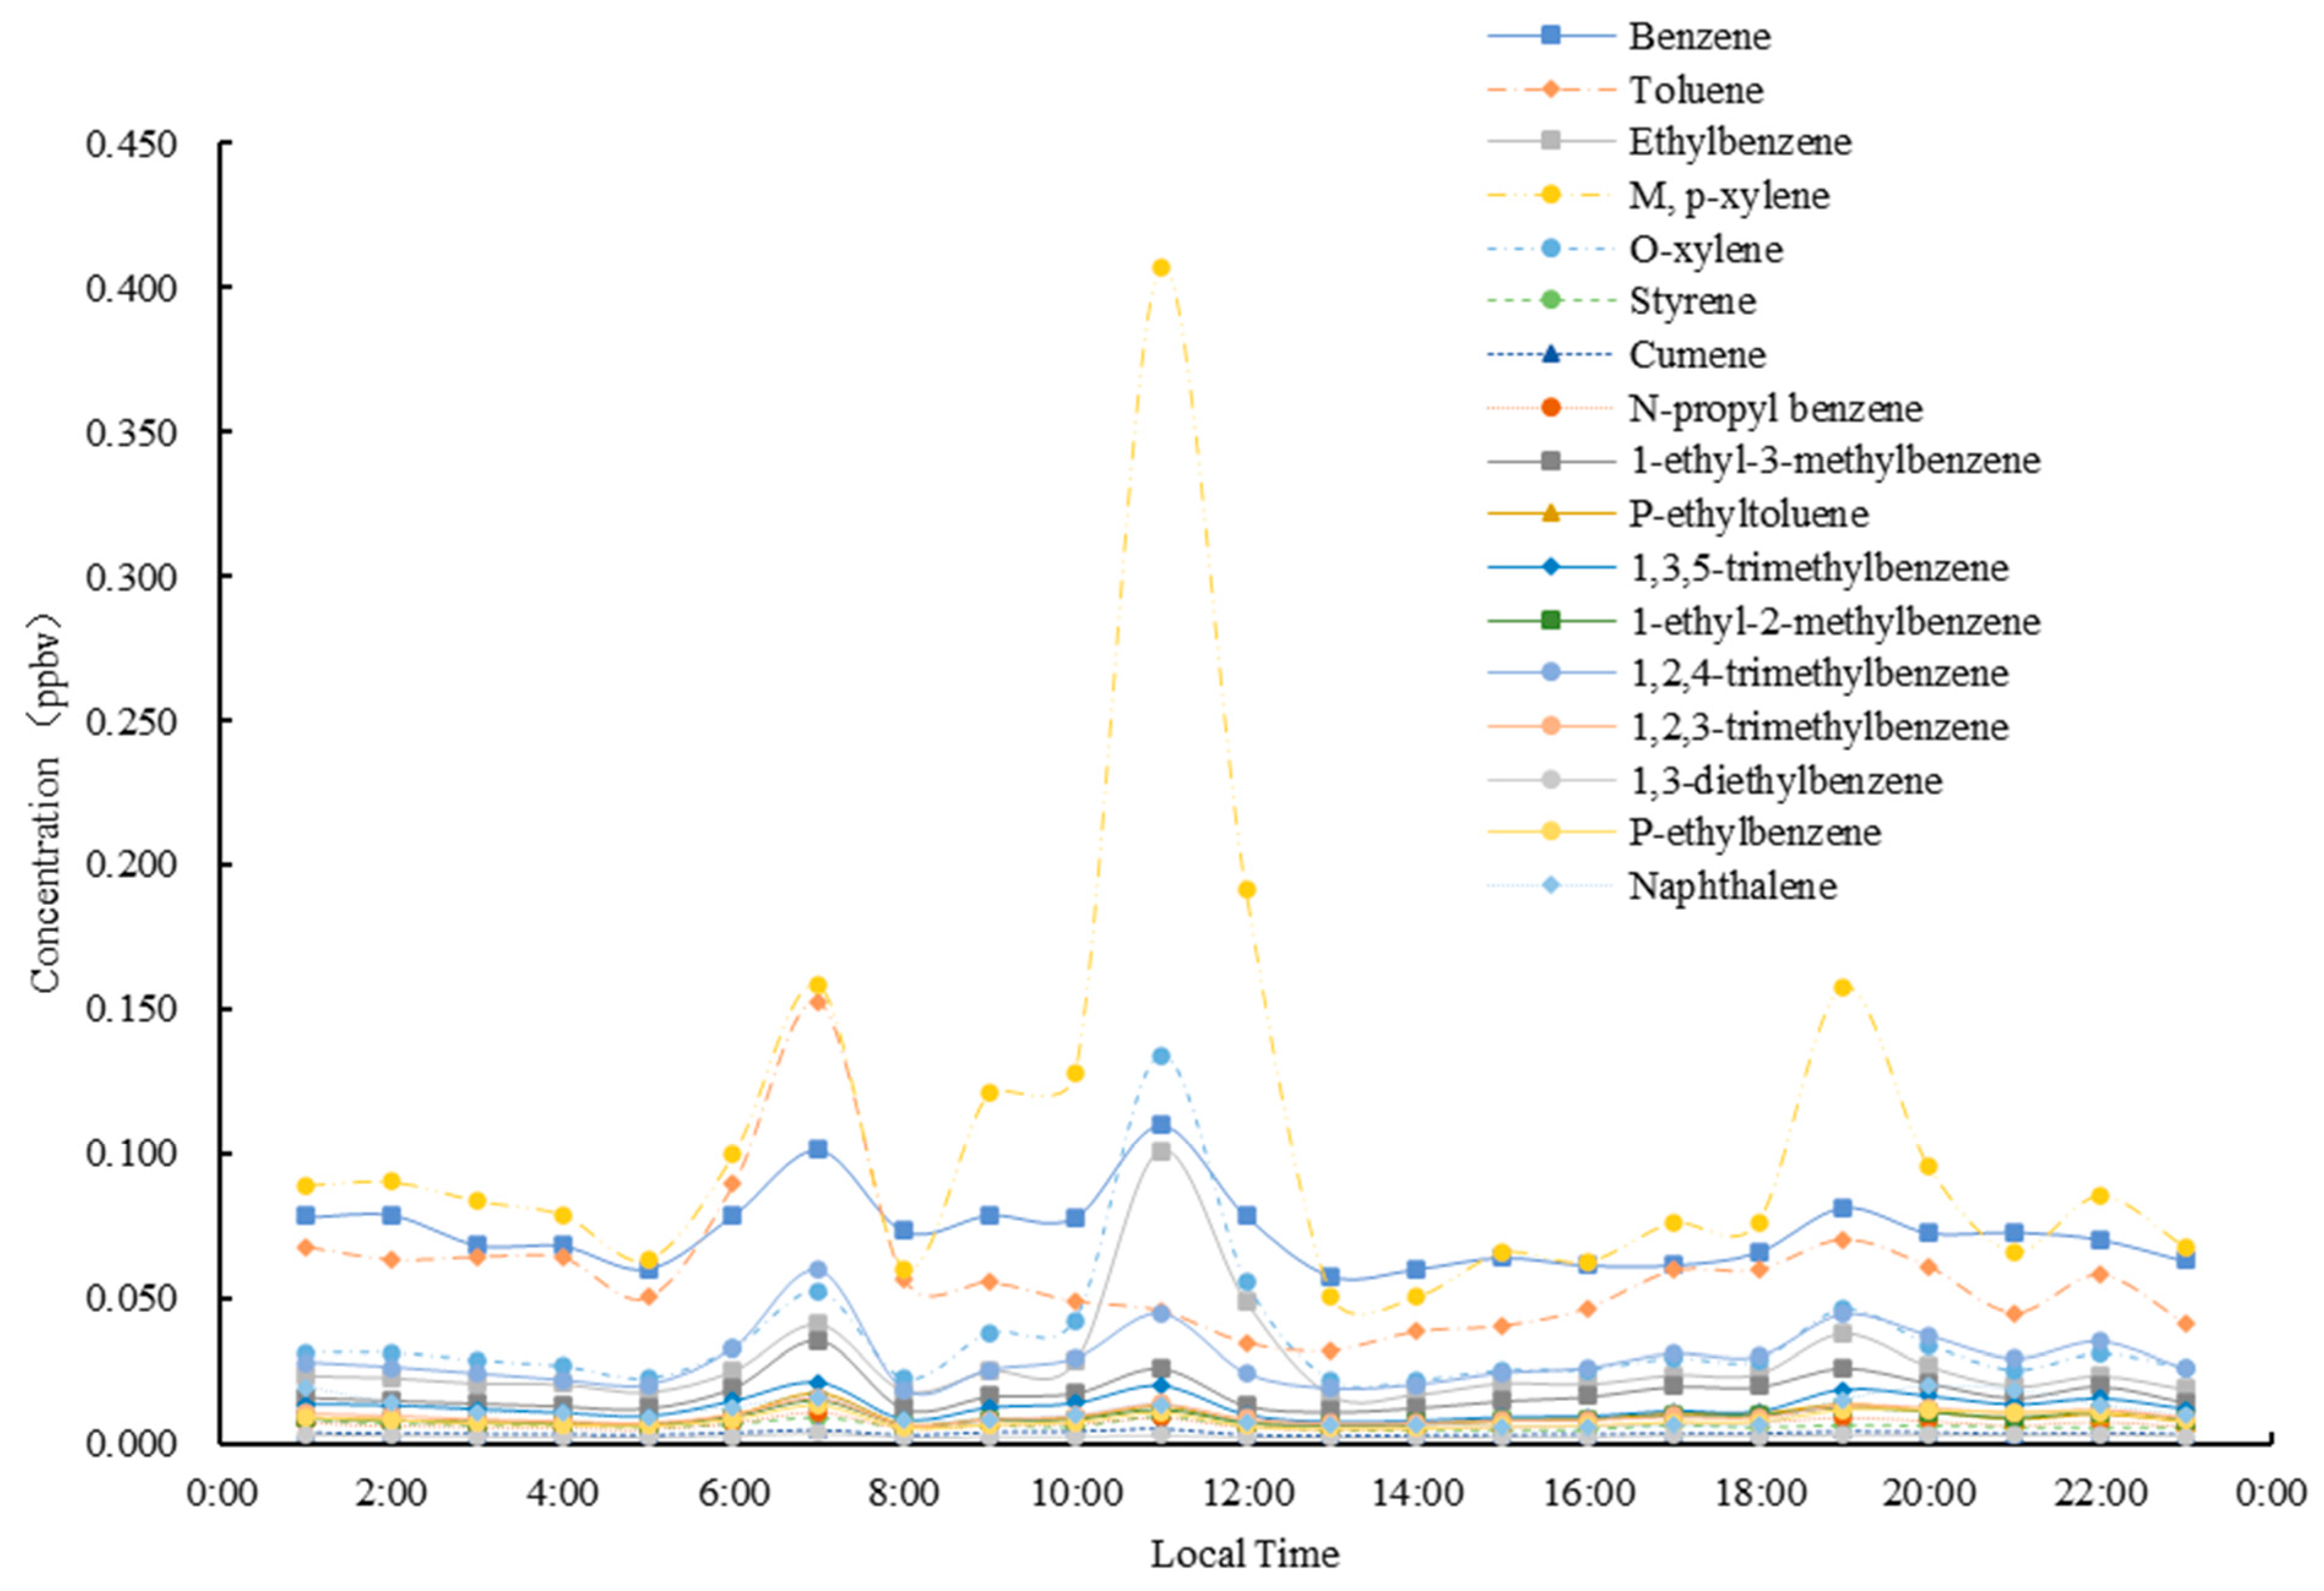
The diurnal variations in alkene volatile organic compounds are shown in Figure 5. On the basis of the number of daily peaks, the peaks can be categorized into four groups: propylene and isoprene exhibited three daily peaks; ethylene and n-butene exhibited four; butadiene, 1-pentene, and 1-hexene exhibited five; and trans-2-butene, cis-2-butene, trans-2-pentene, and cis-2-pentene exhibited six daily peaks. Isoprene, primarily originating from plant emissions (88.7%), reached its maximum peak concentration between 13:00 and 14:00, which is consistent with the characteristics of higher biogenic emission rates under high-temperature conditions. Analysis of peak occurrence times indicated that alkenes exhibited peaks during both 01:00–02:00 and 07:00–08:00. According to the PMF source apportionment results, alkenes mainly originated from combustion (51.41%) and vehicle exhaust (33.40%). This suggests the presence of significant combustion sources during the night in the city of Beihai during the summer. For instance, in summer in Beihai, propylene, a key tracer of combustion sources [22], primarily originated from combustion (67.8%) and vehicle exhaust (29.2%). Its maximum peak occurred at 01:00, indicating that open burning activities are highly likely at night, warranting strengthened supervision.

3.2.2. Analysis of the Variation Characteristics of Alkyne

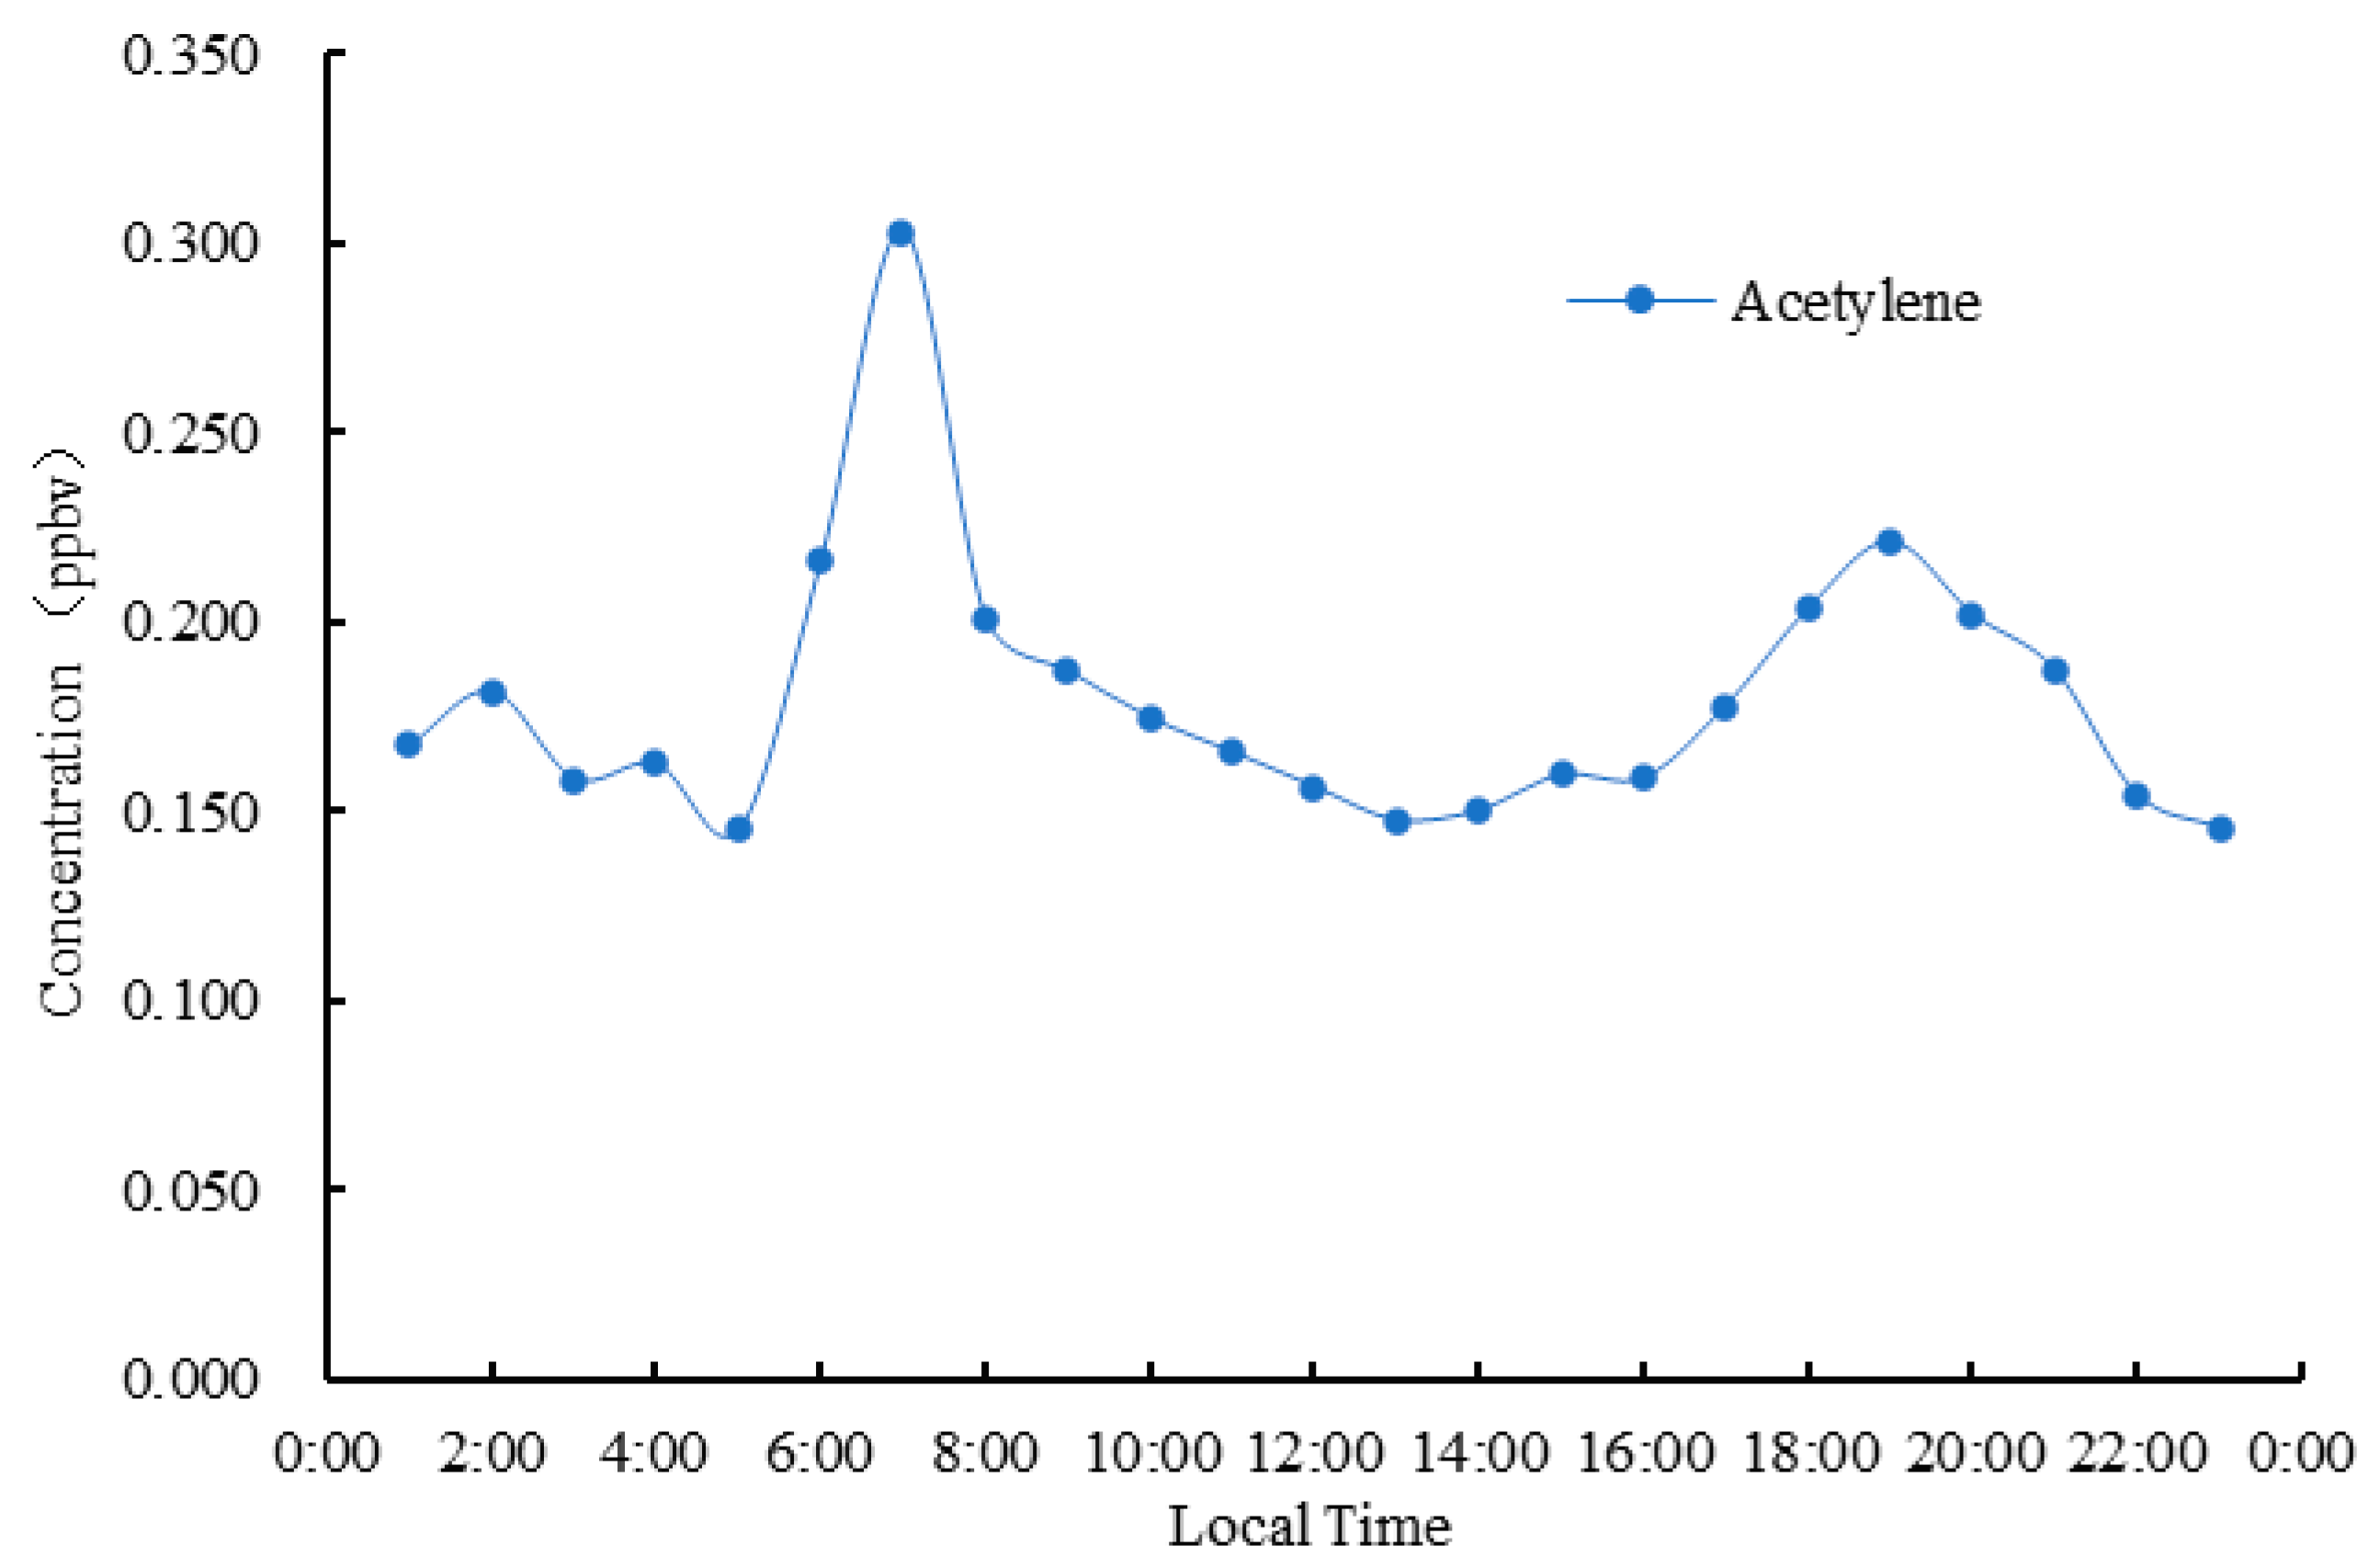
The diurnal variation pattern of acetylene is shown in Figure 6. It exhibited four daily peaks, with the maximum peak occurring at 07:00 and the second-largest peak occurring at 19:00. Combined with the PMF source apportionment results, which revealed that vehicle exhaust contributed 61.5% to acetylene, making it the dominant source; these peak times corresponded to morning and evening traffic rush hours.

3.2.3. Analysis of the Variation Characteristics of Aromatic Hydrocarbons

On the basis of their diurnal variation patterns, aromatic hydrocarbon VOCs can be divided into five groups, as shown in Figure 7. Specifically, toluene exhibited three daily peaks; ethylbenzene, o-xylene, naphthalene, and m,p-xylene exhibited four; toluene, cumene, n-propylbenzene, 1-ethyl-3-methylbenzene, 1-ethyl-2-methylbenzene, and p-ethyltoluene exhibited five; and p-ethyltoluene, 1,3,5-trimethylbenzene, 1,2,4-trimethylbenzene, 1,2,3-trimethylbenzene, and 1,3-diethylbenzene exhibited six; and styrene exhibited seven daily peaks.
Analysis of peak times revealed that aromatic hydrocarbons exhibited peaks during 07:00–08:00 and 19:00–20:00. Combined with the PMF results indicating that aromatic hydrocarbons primarily originate from solvent usage (48.26%) and vehicle exhaust (32.35%), these peaks coincide with morning and evening traffic peaks. With the exception of toluene, o-xylene, ethylbenzene, and m,p-xylene, all the aromatic hydrocarbons exhibited peaks from 01:00 to 02:00. This nighttime peak is associated with combustion sources, to which toluene, o-xylene, ethylbenzene, and m,p-xylene have negligible contributions, explaining their lack of a peak during this period. Furthermore, except for toluene, all the aromatic hydrocarbons exhibited a peak at approximately 11:00. According to the PMF results, toluene originates solely from vehicle exhaust (67.2%) and solvent usage (32.8%), while the other aromatic hydrocarbons contribute an additional 8.74% of the total energy from fuel evaporation. Therefore, the 11:00 peak is associated mainly with fuel evaporation processes.
The diurnal profiles of unsaturated hydrocarbons in Beihai exhibit broad similarities to those observed in Seoul [41] and Tokyo [42], yet also display distinctive features characteristic of coastal urban environments. Consistent with findings reported for Seoul, pronounced morning (07:00–08:00) and evening (19:00–20:00) concentration peaks are predominantly attributable to vehicular emissions. In contrast, a distinct nocturnal peak (01:00–02:00) observed for combustion-related species—including ethylene, propylene, and acetylene—is markedly less evident in prior studies conducted in Seoul and Tokyo. This suggests the influence of localized nighttime open burning or industrial combustion activities in the vicinity of Beihai.
The monitoring site is located approximately 50 m from the coastline, rendering it highly sensitive to sea–land breeze circulation. During the daytime, onshore sea breezes transport unsaturated hydrocarbons emitted from urban and port areas inland, thereby enhancing photochemical ozone production from the afternoon through the evening. At night, offshore land breezes originating from the northwest and north-northeast (Figure 1) advect combustion products directly from upwind industrial and residential sources toward the coast, accounting for the pronounced nocturnal peak. The relatively low mean summer wind speed in Beihai (2.3 m/s) impedes atmospheric dispersion, and the even lower nighttime wind speeds (<2 m/s) further suppress vertical mixing—thereby promoting the accumulation of locally emitted pollutants and enhancing their detectability.

3.3. Reactivity of Unsaturated Hydrocarbons and Their Contribution to Ozone Formation

The contribution of unsaturated hydrocarbon volatile organic compounds (VOCs) to ozone formation was evaluated using the ozone formation potential (OFP). As ozone is a photochemical pollutant that forms exclusively under solar irradiation, the OFP was calculated based on the mean daytime concentrations (06:00–19:00) of unsaturated hydrocarbons—aligned with local sunrise and sunset times in Beihai during July. The results are summarized in Table 4. Analysis by VOC category revealed that aromatic hydrocarbons contributed the most to ozone formation, accounting for 53.80%, followed by alkenes at 45.31%, while alkynes contributed only 0.89%. At the species level, m,p-xylene had the greatest individual OFP contribution among the unsaturated hydrocarbons, with an OFP value of 4.50 μg·m−3, accounting for 19.46% of the total. This was followed by isoprene, ethylene, o-xylene, 1,2,4-trimethylbenzene and propylene, with OFP values of 3.32 μg·m−3, 2.63 μg·m−3, 1.49 μg·m−3, 1.46 μg·m−3, and 1.36 μg·m−3, respectively, and contribution rates of 14.37%, 11.39%, 6.34%, 6.33%, and 5.88%, respectively.
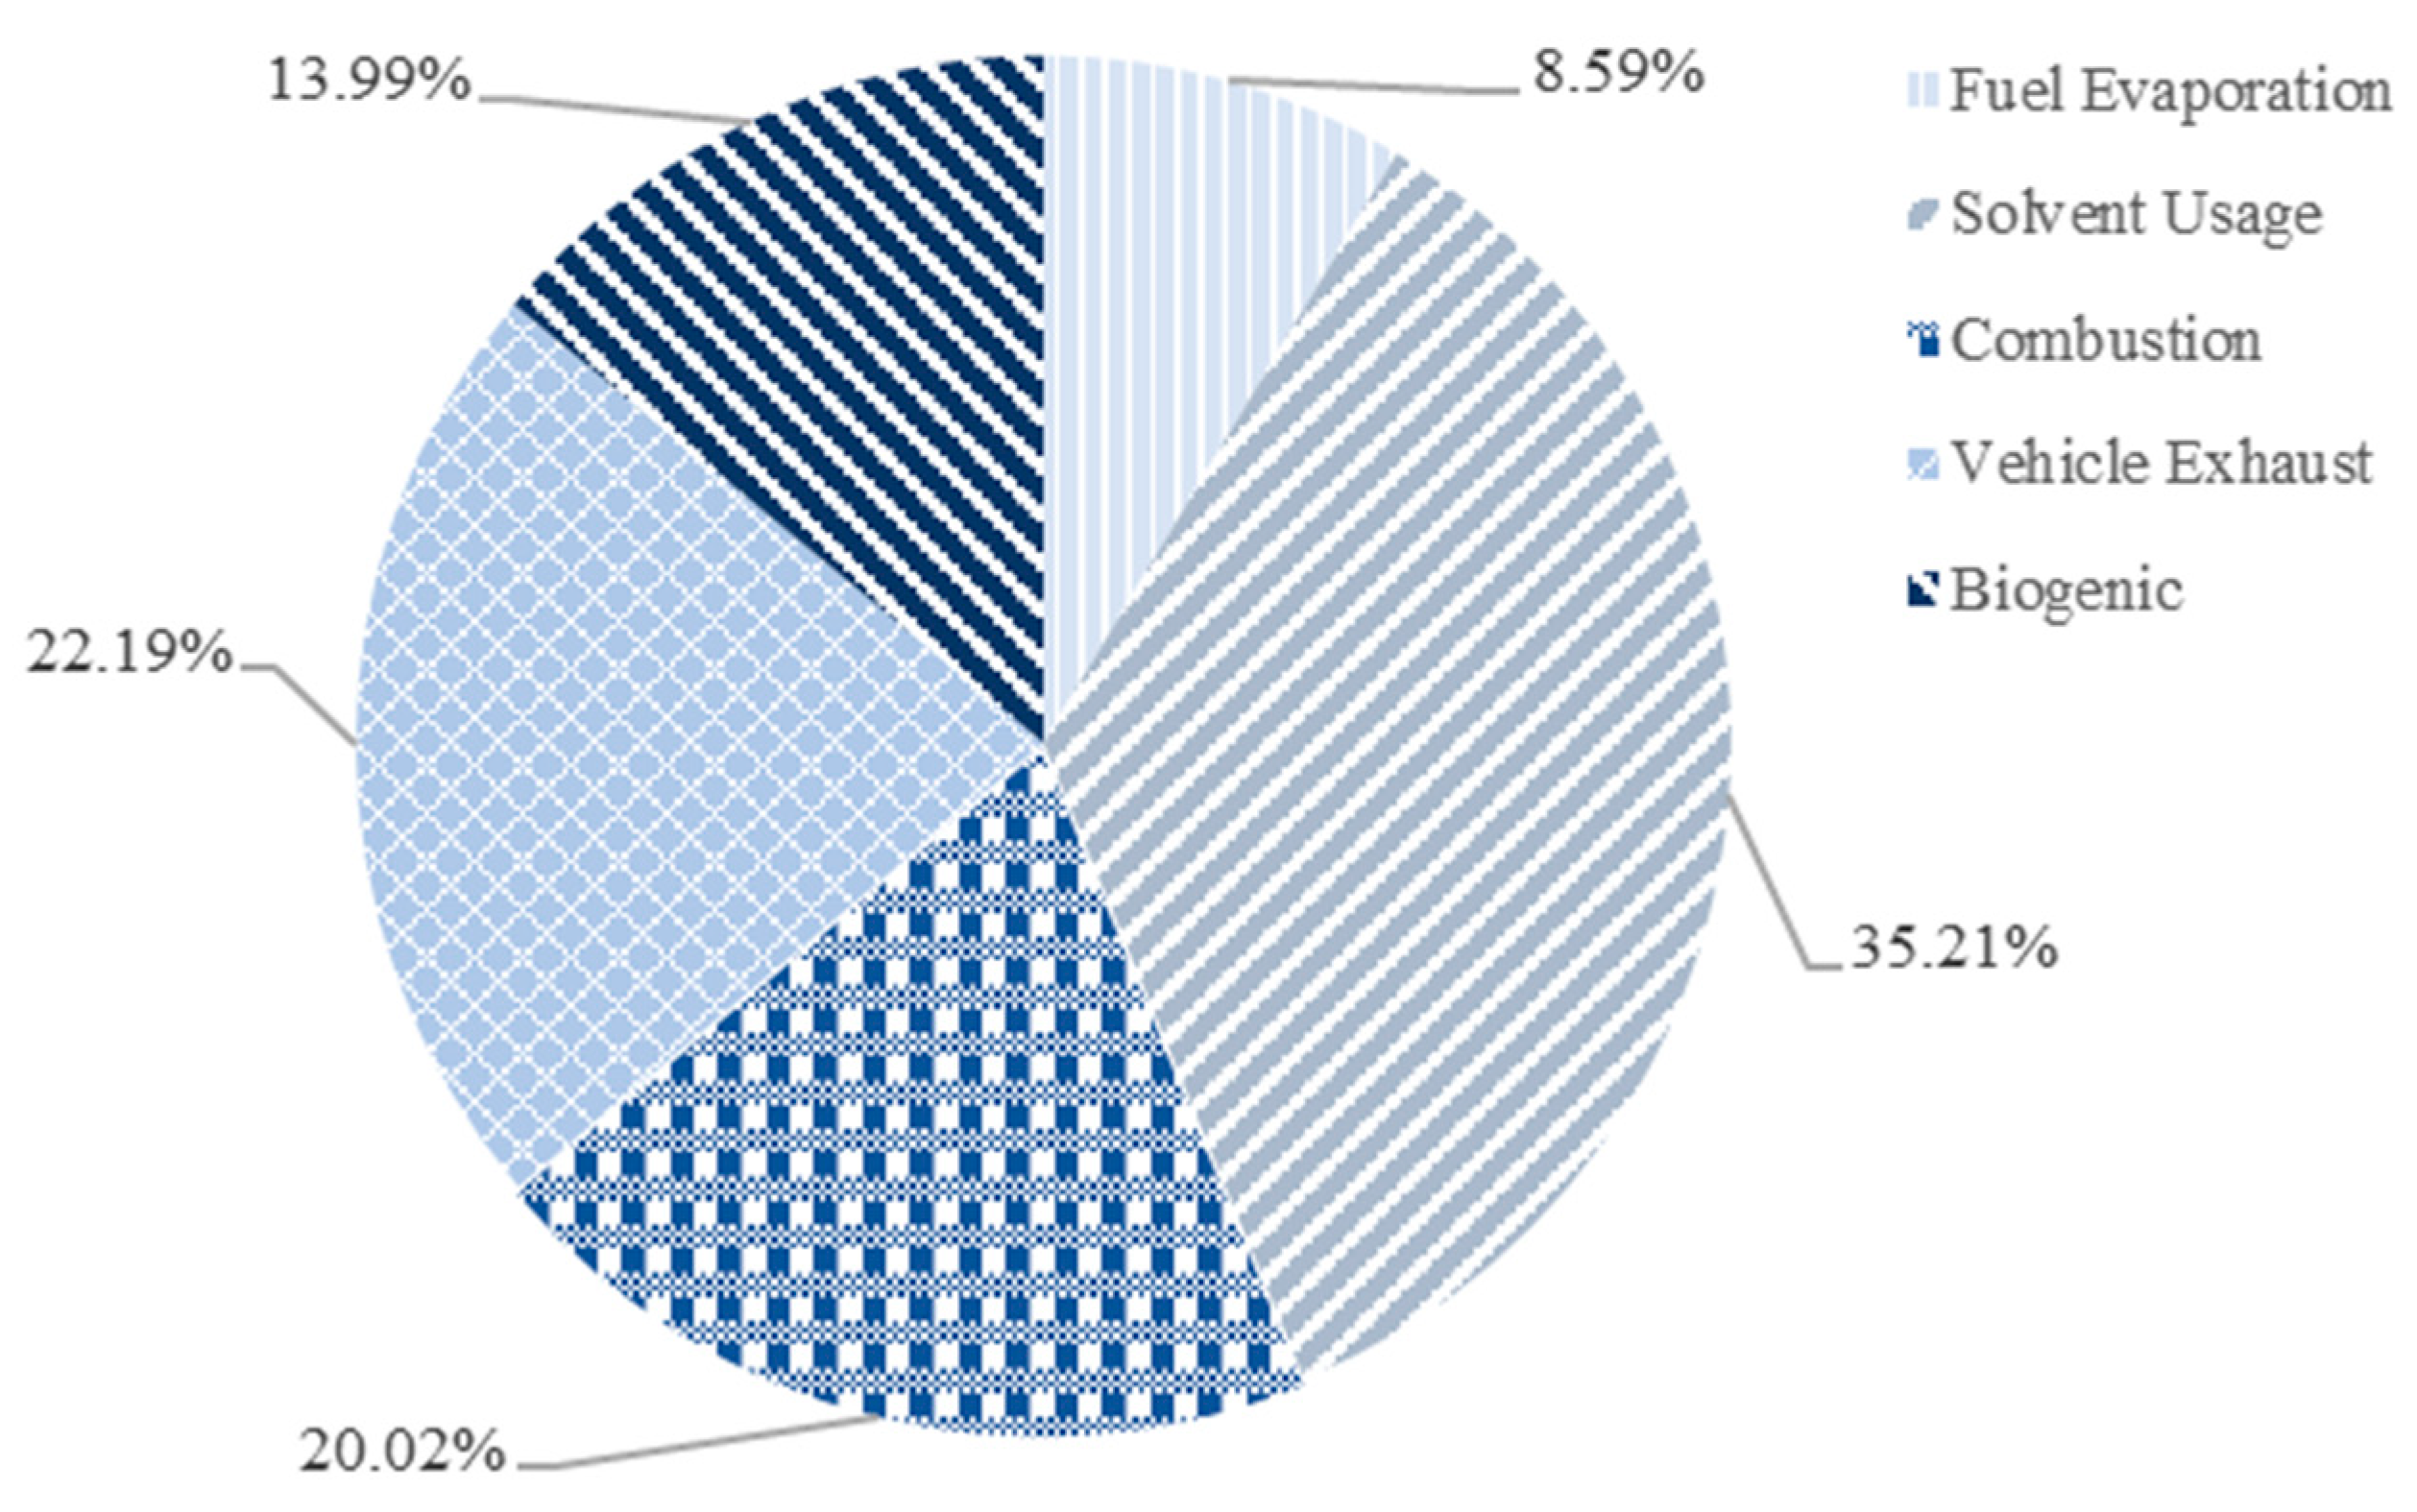
The contributions of different emission sources to ozone formation are shown in Figure 8. Notably, while solvent usage accounted for only 18.55% of the total source contribution to unsaturated hydrocarbons, it was the most significant source for ozone formation, contributing 35.21%. Secondary sources for ozone formation included vehicle exhaust emissions and combustion sources, contributing 20.02% and 22.19%, respectively.
The substantial discrepancy between the solvent usage contribution to VOC mass concentration (18.55%) and its corresponding contribution to ozone formation potential (OFP; 35.21%) can be quantitatively attributed to source-specific, mass-weighted average maximum incremental reactivity (MIR)—defined as the total OFP attributable to a given source divided by the total VOC mass emitted by that source (μg O3 per μg VOC). Solvent usage exhibits the highest weighted-average MIR (1.90), followed by biogenic emissions (1.54), fuel evaporation (0.84), combustion (0.77), and vehicle exhaust (0.62). Although individual alkenes—such as ethylene and isoprene—possess high MIR values, their dominant emission sources (combustion, vehicle exhaust, and biogenic processes) concurrently emit substantial quantities of low-MIR compounds (e.g., acetylene and benzene), thereby reducing the overall reactivity of the source-specific VOC mixture. In contrast, solvent usage is predominantly composed of aromatic hydrocarbons with consistently high MIR values—including m,p-xylene, 1,2,4-trimethylbenzene, and o-xylene—and contains negligible amounts of low-MIR diluents. Consequently, on a per-unit-mass basis, VOCs from solvent usage are nearly three times more efficient at ozone formation than those from vehicle exhaust. This finding underscores the critical importance of implementing reactivity-based control strategies—specifically targeting high-MIR species emitted from solvent use—rather than concentration-based approaches that regulate only total VOC mass.
A key limitation of the MIR method is that it quantifies the maximum ozone formation reactivity under VOC-limited, high-NOx conditions; in contrast, actual ozone production is governed by the ambient NOx/VOC regime [26,43]. During the July 2022 sampling campaign in Beihai, the average NOx concentration was 4.97 ± 2.58 μg/m3 (≈2.64 ppbv), whereas the total mixing ratio of unsaturated hydrocarbon VOCs was 1.21 ppbv—yielding an NOx/VOC volume ratio of approximately 2.18. This ratio is substantially higher than the widely reported threshold range (0.1–0.4) for the transition from VOC-limited to NOx-limited ozone chemistry, indicating that the local atmosphere during summer is predominantly VOC-limited. Under such conditions, the MIR method remains appropriate for evaluating the ozone formation potential of VOCs, as it explicitly assumes VOCs—not NOx—to be the rate-controlling precursor in photochemical ozone production.
The OFP analysis reveals that aromatic hydrocarbons account for 51.22% of the total ozone formation potential (OFP), with m,p-xylene (17.01%), ethylene (14.12%), and isoprene (12.61%) identified as the top three contributors. This dominance of aromatics in OFP—despite their relatively moderate ambient concentrations—is consistent with findings from urban studies in Seoul and Tokyo. In the Kanto region of Japan, Vazquez Santiago et al. [41] employed emission scenario simulations to demonstrate a critical dichotomy in ozone control efficacy: in VOC-limited regimes (e.g., urban cores), substantial reductions in VOC emissions—particularly aromatics—are more effective for mitigating ozone than NOx reductions; conversely, in NOx-limited regimes (e.g., suburban or rural areas), NOx mitigation yields greater ozone abatement benefits. As a mid-sized coastal city, Beihai’s urban core is likely VOC-limited or situated within a transitional regime. Consequently, controlling solvent-derived aromatic hydrocarbons should be the highest priority for ozone management. The low summer-mean wind speed in Beihai (2.3 m/s) promotes local accumulation of VOCs, while elevated temperature (30.5 °C) and high relative humidity (89.7%) accelerate OH-radical–initiated oxidation of aromatic compounds. Furthermore, sea–land breeze circulation may transport both ozone precursors and ozone itself, thereby complicating source–receptor relationships.

4. Conclusions

In this study, 29 unsaturated hydrocarbon VOCs were continuously monitored in Beihai, a subtropical coastal city in southern China, during summer. The total mixing ratio of these species was relatively low, with alkenes being the most abundant group, followed by aromatic hydrocarbons and acetylene. Source apportionment identified vehicle exhaust (36.02%) as the dominant contributor, followed by combustion (26.15%), solvent usage (18.55%), fuel evaporation (10.17%), and biogenic sources (9.10%). Compared with studies in Seoul and Tokyo, Beihai exhibits a higher biogenic contribution (9.10% vs. ~5–6% in Seoul), attributed to its abundant subtropical vegetation and high summer temperatures, while the solvent usage contribution (18.55%) is lower than that in Tokyo and Seoul (~25–30%), reflecting Beihai’s lower level of industrialization. The unique geographical and climatic characteristics of Beihai—its coastal location, frequent sea–land breezes, intense solar radiation, and high summer temperatures—significantly influence the results: sea breezes can transport pollutants inland, while strong daytime radiation accelerates photochemical reactions, enhancing the contribution of aromatic hydrocarbons and alkenes to ozone formation. In terms of ozone formation potential (OFP), aromatic hydrocarbons and alkenes were the dominant contributors; notably, solvent usage accounted for only 18.55% of the concentration but contributed 35.21% of the total OFP, highlighting its disproportionate impact. Diurnal variation analysis revealed a distinct nighttime peak (01:00–02:00) for combustion-related species, warranting enhanced nighttime supervision. Policy implications include: (i) prioritizing vehicle exhaust control through accelerated replacement of gasoline vehicles with electric alternatives and stricter evaporative emission standards; (ii) targeting solvent usage by enforcing VOC content limits in paints and coatings; (iii) enhancing nighttime surveillance of combustion activities using remote sensing or mobile monitoring; and (iv) integrating VOC reduction with NOx control to avoid ozone disbenefits in the coastal photochemical environment. This study provides a scientific basis for ozone pollution mitigation strategies in Beihai and other coastal cities with similar climatic and emission characteristics.

Author Contributions

Conceptualization, Q.W.; methodology, Y.W.; formal analysis, Q.W.; investigation, Y.W.; resources, Y.W.; data curation, Y.W.; writing—original draft preparation, Q.W.; writing—review and editing, Q.W.; funding acquisition, Q.W. All authors have read and agreed to the published version of the manuscript.

Funding

This research was funded by The Basic Ability Improvement Project for Young and Middle-aged Teachers in Guangxi Universities, grant number 2023KY1269.

Institutional Review Board Statement

Not applicable.

Informed Consent Statement

Not applicable.

Data Availability Statement

The data presented in this study are available on request from the corresponding author. The data are not publicly available due to privacy.

Conflicts of Interest

The authors declare no conflicts of interest.

References

  1. Shao, M.; Zhang, Y.; Zeng, L.; Tang, X.; Zhang, J.; Zhong, L.; Wang, B. Ground-level ozone in the Pearl River Delta and the roles of VOC and NOx in its production. J. Environ. Manag. 2009, 90, 512–518. [Google Scholar] [CrossRef]
  2. Xue, L.K.; Wang, T.; Gao, J.; Ding, A.J.; Zhou, X.H.; Blake, D.R.; Wang, X.F.; Saunders, S.M.; Fan, S.J.; Zuo, H.C.; et al. Ground-level ozone in four Chinese cities: Precursors, regional transport and heterogeneous processes. Atmos. Chem. Phys. 2014, 14, 13175–13188. [Google Scholar] [CrossRef]
  3. Guo, S.; Hu, M.; Zamora, M.L.; Peng, J.; Shang, D.; Zheng, J.; Du, Z.; Wu, Z.; Shao, M.; Zeng, L.; et al. Elucidating severe urban haze formation in China. Proc. Natl. Acad. Sci. USA 2014, 111, 17373–17378. [Google Scholar] [CrossRef]
  4. Zhao, P.; Dong, F.; Yang, Y.; He, D.; Zhao, X.; Zhang, W.; Yao, Q.; Liu, H. Characteristics of carbonaceous aerosol in the region of Beijing, Tianjin, and Hebei, China. Atmos. Environ. 2013, 71, 389–398. [Google Scholar] [CrossRef]
  5. Chen, S.; Wang, H.; Lu, K.; Zeng, L.; Hu, M.; Zhang, Y. The trend of surface ozone in Beijing from 2013 to 2019: Indications of the persisting strong atmospheric oxidation capacity. Atmos. Environ. 2020, 242, 117801. [Google Scholar] [CrossRef]
  6. Lewis, A.C.; Hopkins, J.R.; Carslaw, D.C.; Hamilton, J.F.; Nelson, B.S.; Stewart, G.; Dernie, J.; Passant, N.; Murrells, T. An increasing role for solvent emissions and implications for future measurements of volatile organic compounds. Philos. Trans. Ser. A Math. Phys. Eng. Sci. 2020, 378, 20190328. [Google Scholar] [CrossRef]
  7. Amin, H.S.; Hatfield, M.L.; Hartz, K.E.H. Characterization of secondary organic aerosol generated from ozonolysis of α-pinene mixtures. Atmos. Environ. 2013, 67, 323–330. [Google Scholar] [CrossRef]
  8. Ahlberg, E.; Falk, J.; Eriksson, A.; Holst, T.; Brune, W.H.; Kristensson, A.; Roldin, P.; Svenningsson, B. Secondary organic aerosol from VOC mixtures in an oxidation flow reactor. Atmos. Environ. 2017, 161, 210–220. [Google Scholar] [CrossRef]
  9. Henze, D.K.; Seinfeld, J.H.; Ng, N.L.; Kroll, J.H.; Fu, T.-M.; Jacob, D.J.; Heald, C.L. Global modeling of secondary organic aerosol formation from aromatic hydrocarbons: High- vs. low-yield pathways. Atmos. Chem. Phys. 2008, 8, 2405–2420. [Google Scholar] [CrossRef]
  10. Hodzic, A.; Jimenez, J.L.; Madronich, S.; Canagaratna, M.R.; DeCarlo, P.F.; Kleinman, L.; Fast, J. Modeling organic aerosols in a megacity: Potential contribution of semi-volatile and intermediate volatility primary organic compounds to secondary organic aerosol formation. Atmos. Chem. Phys. 2010, 10, 5491–5514. [Google Scholar] [CrossRef]
  11. Mozaffar, A.; Zhang, Y.-L. Atmospheric Volatile Organic Compounds (VOCs) in China: A Review. Curr. Pollut. Rep. 2020, 6, 250–263. [Google Scholar] [CrossRef]
  12. Guo, H.; Ling, Z.H.; Cheng, H.R.; Simpson, I.J.; Lyu, X.P.; Wang, X.M.; Shao, M.; Lu, H.X.; Ayoko, G.; Zhang, Y.L.; et al. Tropospheric volatile organic compounds in China. Sci. Total Environ. 2017, 574, 1021–1043. [Google Scholar] [CrossRef]
  13. Wang, G.; Cheng, S.; Wei, W.; Zhou, Y.; Yao, S.; Zhang, H. Characteristics and source apportionment of VOCs in the suburban area of Beijing, China. Atmos. Pollut. Res. 2016, 7, 711–724. [Google Scholar] [CrossRef]
  14. Wang, N.; Li, N.; Liu, Z.; Evans, E. Investigation of chemical reactivity and active components of ambient VOCs in Jinan, China. Air Qual. Atmos. Health 2016, 9, 785–793. [Google Scholar] [CrossRef]
  15. Mo, Z.; Shao, M.; Lu, S.; Niu, H.; Zhou, M.; Sun, J. Characterization of non-methane hydrocarbons and their sources in an industrialized coastal city, Yangtze River Delta, China. Sci. Total Environ. 2017, 593–594, 641–653. [Google Scholar] [CrossRef] [PubMed]
  16. Hui, L.; Liu, X.; Tan, Q.; Feng, M.; An, J.; Qu, Y.; Zhang, Y.; Jiang, M. Characteristics, source apportionment and contribution of VOCs to ozone formation in Wuhan, Central China. Atmos. Environ. 2018, 192, 55–71. [Google Scholar] [CrossRef]
  17. Song, M.; Tan, Q.; Feng, M.; Qu, Y.; Liu, X.; An, J.; Zhang, Y. Source Apportionment and Secondary Transformation of Atmospheric Nonmethane Hydrocarbons in Chengdu, Southwest China. J. Geophys. Res. Atmos. 2018, 123, 9741–9763. [Google Scholar] [CrossRef]
  18. Yu, S.; Wang, S.; Xu, R.; Zhang, D.; Zhang, M.; Su, F.; Lu, X.; Li, X.; Zhang, R.; Wang, L. Measurement report: Intra- and interannual variability and source apportionment of volatile organic compounds during 2018–2020 in Zhengzhou, central China. Atmos. Chem. Phys. 2022, 22, 14859–14878. [Google Scholar] [CrossRef]
  19. Wu, Y.; Mo, Z.; Wu, Q.; Fan, Y.; Chen, X.; Li, H.; Lin, H.; Huang, X.; Tang, H.; Liao, D.; et al. A Year-Long Measurement and Source Contributions of Volatile Organic Compounds in Nanning, South China. Atmosphere 2024, 15, 560. [Google Scholar] [CrossRef]
  20. Paatero, P.; Tapper, U. Analysis of different modes of factor analysis as least squares fit problems. Chemom. Intell. Lab. Syst. 1993, 18, 183–194. [Google Scholar] [CrossRef]
  21. Anderson, M.J.; Daly, E.P.; Miller, S.L.; Milford, J.B. Source apportionment of exposures to volatile organic compounds: II. Application of receptor models to TEAM study data. Atmos. Environ. 2002, 36, 3643–3658. [Google Scholar] [CrossRef]
  22. Song, Y.; Shao, M.; Liu, Y.; Lu, S.; Kuster, W.; Goldan, P.; Xie, S. Source Apportionment of Ambient Volatile Organic Compounds in Beijing. Environ. Sci. Technol. 2007, 41, 4348–4353. [Google Scholar] [CrossRef] [PubMed]
  23. Liu, X.; Zeng, L.; Lu, S.; Yu, X. Online monitoring system for volatile organic compounds in the atmosphere. Acta Sci. Circumstantiae 2009, 29, 2471–2477. [Google Scholar]
  24. Yuan, B.; Shao, M.; De Gouw, J.; Parrish, D.D.; Lu, S.; Wang, M.; Zeng, L.; Zhang, Q.; Song, Y.; Zhang, J.; et al. Volatile organic compounds (VOCs) in urban air: How chemistry affects the interpretation of positive matrix factorization (PMF) analysis. J. Geophys. Res. Atmos. 2012, 117, D24302. [Google Scholar] [CrossRef]
  25. Zhang, F.; Shang, X.; Chen, H.; Xie, G.; Fu, Y.; Wu, D.; Sun, W.; Liu, P.; Zhang, C.; Mu, Y.; et al. Significant impact of coal combustion on VOCs emissions in winter in a North China rural site. Sci. Total Environ. 2020, 720, 137617. [Google Scholar] [CrossRef]
  26. Carter, W.-P.L. Development of ozone reactivity scales for volatile organic compounds. J. Air Waste Manag. Assoc. 1994, 44, 881–899. [Google Scholar] [CrossRef]
  27. Carter, W.-P.L. SAPRC Atmospheric Chemical Mechanisms and VOC Reactivity Scales[EB/OL], 2024. Available online: https://intra.engr.ucr.edu/~carter/SAPRC/ (accessed on 7 July 2024).
  28. Liu, Y.; Shao, M.; Fu, L.; Lu, S.; Zeng, L.; Tang, D. Source profiles of volatile organic compounds (VOCs) measured in China: Part I. Atmos. Environ. 2008, 42, 6247–6260. [Google Scholar] [CrossRef]
  29. Guo, H.; Wang, T.; Louie, P. Source apportionment of ambient non-methane hydrocarbons in Hong Kong: Application of a principal component analysis/absolute principal component scores (PCA/APCS) receptor model. Environ. Pollut. 2004, 129, 489–498. [Google Scholar] [CrossRef]
  30. Yuan, B.; Shao, M.; Lu, S.; Wang, B. Source profiles of volatile organic compounds associated with solvent use in Beijing, China. Atmos. Environ. 2010, 44, 1919–1926. [Google Scholar] [CrossRef]
  31. Choi, E.; Choi, K.; Yi, S.-M. Non-methane hydrocarbons in the atmosphere of a metropolitan city and a background site in South Korea: Sources and health risk potentials. Atmos. Environ. 2011, 45, 7563–7573. [Google Scholar] [CrossRef]
  32. Vega, E.; Mugica, V.; Carmona, R.; Valencia, E. Hydrocarbon source apportionment in Mexico City using the chemical mass balance receptor model. Atmos. Environ. 2000, 34, 4121–4129. [Google Scholar] [CrossRef]
  33. Liu, T.; Wang, X.; Wang, B.; Ding, X.; Deng, W.; Lü, S.; Zhang, Y. Emission factor of ammonia (NH3) from on-road vehicles in China: Tunnel tests in urban Guangzhou. Environ. Res. Lett. 2014, 9, 064027. [Google Scholar] [CrossRef]
  34. Zhang, Y.; Wang, X.; Zhang, Z.; Lü, S.; Shao, M.; Lee, F.S.; Yu, J. Species profiles and normalized reactivity of volatile organic compounds from gasoline evaporation in China. Atmos. Environ. 2013, 79, 110–118. [Google Scholar] [CrossRef]
  35. Tang, G.; Sun, J.; Wu, F.; Sun, Y.; Zhu, X.; Geng, Y.; Wang, Y. Organic composition of gasoline and its potential effects on air pollution in North China. Sci. China Chem. 2015, 58, 1416–1425. [Google Scholar] [CrossRef]
  36. Gao, S.; Jin, L.; Shi, J.; Han, B.; Wang, X.; Peng, Y.; Zhao, L.; Bai, Z. VOCs emission characteristics and emission factors of light-duty gasoline vehicles with bench test. China Environ. Sci. 2012, 32, 397–405. [Google Scholar]
  37. Ou, J.; Feng, X.; Liu, C.; Gao, Z.; Yang, Y.; Zhang, Z.; Wang, X.; Zheng, J. Source characteristics of VOCs emissions from vehicular exhaust in the Pearl River Delta region. Acta Sci. Circumstantiae 2014, 34, 826–834. [Google Scholar]
  38. Lu, S.; Bai, Y.; Zhang, G.; Ma, J. Study on the Characteristics of VOCs Source Profiles of Vehicle Exhaust and Gasoline Emission. Acta Scicentiarum Nat. Univ. Pekinesis 2003, 39, 507–511. [Google Scholar]
  39. Nelson, P.F.; Quigley, S.M. The Hydrocarbon Composition of Exhaust Emitted from Gasoline Fuelled Vehicles. Atmos. Environ. (1967) 1984, 18, 79–87. [Google Scholar] [CrossRef]
  40. Sharkey, T.D.; Yeh, S. Isoprene emission from plants. Annu. Rev. Plant Biol. 2001, 52, 407–436. [Google Scholar] [CrossRef] [PubMed]
  41. Seo, J.H.; Cho, J.; Hong, E.; Cho, S.; Gil, J.; Joo, T.; Weon, S. Seasonally adaptive data-driven ozone prediction in megacity environments. Environ. Res. 2026, 293, 123741. [Google Scholar] [CrossRef]
  42. Santiago, J.V.; Inoue, K.; Tonokura, K. Modeling Ground Ozone Concentration Changes after Variations in Precursor Emissions and Assessing Their Benefits in the Kanto Region of Japan. Atmosphere 2022, 13, 1187. [Google Scholar] [CrossRef]
  43. Wang, Q.; Sheng, D.; Wu, C.; Zhao, J.; Li, F.; Yao, S.; Ou, X.; Li, W.; Chen, J. Exploring ozone formation rules and concentration response to the change of precursors based on artificial neural network simulation in a typical industrial park. Heliyon 2023, 9, e20125. [Google Scholar] [CrossRef] [PubMed]
Figure 1. Wind rose at the sampling site.
Atmosphere 17 00565 g001
Figure 2. Schematic of ozone formation from unsaturated hydrocarbon VOCs.
Atmosphere 17 00565 g002
Figure 3. Source apportionment of atmospheric unsaturated hydrocarbon volatile organic compounds in Beihai city during summer.
Atmosphere 17 00565 g003aAtmosphere 17 00565 g003bAtmosphere 17 00565 g003c
Figure 4. Contribution of each emission source to unsaturated hydrocarbon volatile organic compounds.
Atmosphere 17 00565 g004
Figure 5. Diurnal variation in alkene volatile organic compounds.
Atmosphere 17 00565 g005
Figure 6. Diurnal variation in acetylene.
Atmosphere 17 00565 g006
Figure 7. Diurnal variation in aromatic hydrocarbon volatile organic compounds.
Atmosphere 17 00565 g007
Figure 8. Contribution of each emission source to O3 formation.
Atmosphere 17 00565 g008
Table 1. Calibration curve linear correlation coefficients, method detection limits, and measurement precision of unsaturated hydrocarbons analyzed by the online monitoring system.
CompoundLinear Correlation Coefficient (R2)MDL (ppbv)Precision (%)CompoundLinear Correlation Coefficient (R2)MDL (ppbv)Precision (%)
Ethylene0.9990.0590.686M, p-xylene0.9980.0380.821
Propylene0.9980.0790.512O-xylene0.9970.0210.76
Acetylene0.9980.0440.595Styrene0.9970.0280.68
Trans-2-butene0.9980.040.531Cumene0.9970.0240.754
Cis-2-butene0.9980.080.546N-propylbenzene0.9970.0190.775
N-butene0.9980.0350.4591-ethyl-3-methylbenzene0.9970.0331.528
butadiene0.9990.0451.194P-ethyltoluene0.9970.0361.312
1-Pentene0.9990.0521.0751,3,5-trimethylbenzene0.9980.0220.68
Trans-2-pentene0.9980.0441.2261-ethyl-2-methylbenzene0.9970.0240.629
Isoprene0.9980.0581.5551,2,4-trimethylbenzene0.9970.0171.967
Cis-2-pentene0.9990.0381.161,2,3-trimethylbenzene0.9980.0220.612
1-hexene0.9970.0351.5141,3-diethylbenzene0.9980.0180.654
Benzene0.9970.0330.791P-ethylbenzene0.9980.0180.583
Toluene0.9970.0210.821Naphthalene0.9930.020.79
Ethylbenzene0.9970.0190.771
Table 2. Contribution of each source to the contents of alkenes, alkynes, and aromatic hydrocarbon volatile organic compounds.
SourceFuel EvaporationSolvent UsageCombustionVehicle ExhaustBiogenic
Alkenes (excluding isoprene)9.80%3.27%51.41%33.40%2.12%
Alkynes18.73%17.55%61.52%2.20%
Aromatic hydrocarbons8.74%48.26%9.62%32.35%1.02%
Table 3. Precision of unsaturated hydrocarbon detection by the online monitoring system and the average concentrations of unsaturated hydrocarbon volatile organic compounds.
CompoundAvg. Concentration (ppbv)Std. Dev. (ppbv)CompoundAvg. Concentration (ppbv)Std. Dev. (ppbv)
ethylene0.2880.296M, p-xylene0.1060.357
propylene0.0750.070O-xylene0.0370.106
acetylene0.2040.170styrene0.0070.006
Trans-2-butene0.0200.009Cumene0.0040.004
Cis-2-butene0.0130.006N-propylbenzene0.0070.008
N-butene0.0210.0141-ethyl-3-methylbenzene0.0180.029
butadiene0.0110.013P-ethyltoluene0.0100.014
1-Pentene0.0150.0121,3,5-trimethylbenzene0.0130.022
Trans-2-pentene0.0120.0211-ethyl-2-methylbenzene0.0090.011
isoprene0.0900.1361,2,4-trimethylbenzene0.0300.053
Cis-2-pentene0.0070.0091,2,3-trimethylbenzene0.0100.013
1-hexene0.0090.0081,3-diethylbenzene0.0030.002
benzene0.0790.065P-ethylbenzene0.0080.012
toluene0.0680.108naphthalene0.0110.021
ethylbenzene0.0290.086
Table 4. Contribution of unsaturated hydrocarbon volatile organic compounds to ozone formation.
CompoundOFP/(μg·m−3)OFP Contribution (%)CompoundOFP/(μg·m−3)OFP Contribution (%)
ethylene2.63 11.39%M, p-xylene4.50 19.46%
propylene1.36 5.88%O-xylene1.49 6.43%
acetylene0.21 0.89%styrene0.05 0.22%
Trans-2-butene0.81 3.51%Cumene0.05 0.23%
Cis-2-butene0.46 1.97%N-propylbenzene0.08 0.34%
N-butene0.47 2.02%1-ethyl-3-methylbenzene0.74 3.21%
butadiene0.30 1.29%P-ethyltoluene0.23 1.01%
1-Pentene0.32 1.40%1,3,5-trimethylbenzene0.79 3.41%
Trans-2-pentene0.39 1.68%1-ethyl-2-methylbenzene0.28 1.21%
isoprene3.32 14.37%1,2,4-trimethylbenzene1.46 6.33%
Cis-2-pentene0.24 1.03%1,2,3-trimethylbenzene0.63 2.74%
1-hexene0.18 0.77%1,3-diethylbenzene0.11 0.48%
benzene0.19 0.82%P-ethylbenzene0.21 0.91%
toluene0.98 4.23%naphthalene0.18 0.76%
ethylbenzene0.46 2.00%
Disclaimer/Publisher’s Note: The statements, opinions and data contained in all publications are solely those of the individual author(s) and contributor(s) and not of MDPI and/or the editor(s). MDPI and/or the editor(s) disclaim responsibility for any injury to people or property resulting from any ideas, methods, instructions or products referred to in the content.