Article

Threshold Effects of Vegetation Structure on Outdoor Thermal Comfort: Balancing Radiative Shading and Ventilation in Rural Environments


by
Peng Gao
1,2,
Zhuan Liu
2 and
Azmiah Abd Ghafar
1,*
1
Faculty of Design and Architecture, Universiti Putra Malaysia, Putrajaya 43400, Malaysia
2
School of Civil Engineering and Transportation, Anyang Institute of Technology, Anyang 455000, China
*
Author to whom correspondence should be addressed.
Atmosphere 2026, 17(6), 563; https://doi.org/10.3390/atmos17060563
Submission received: 5 May 2026 / Revised: 24 May 2026 / Accepted: 26 May 2026 / Published: 29 May 2026

Abstract

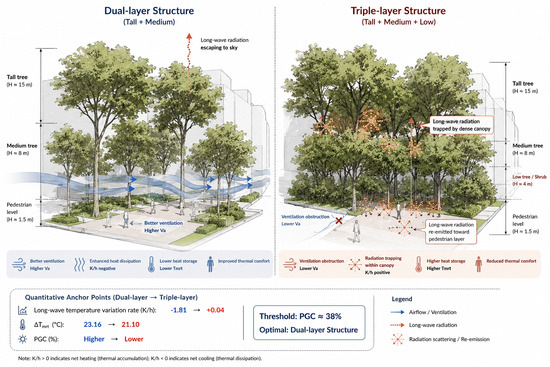
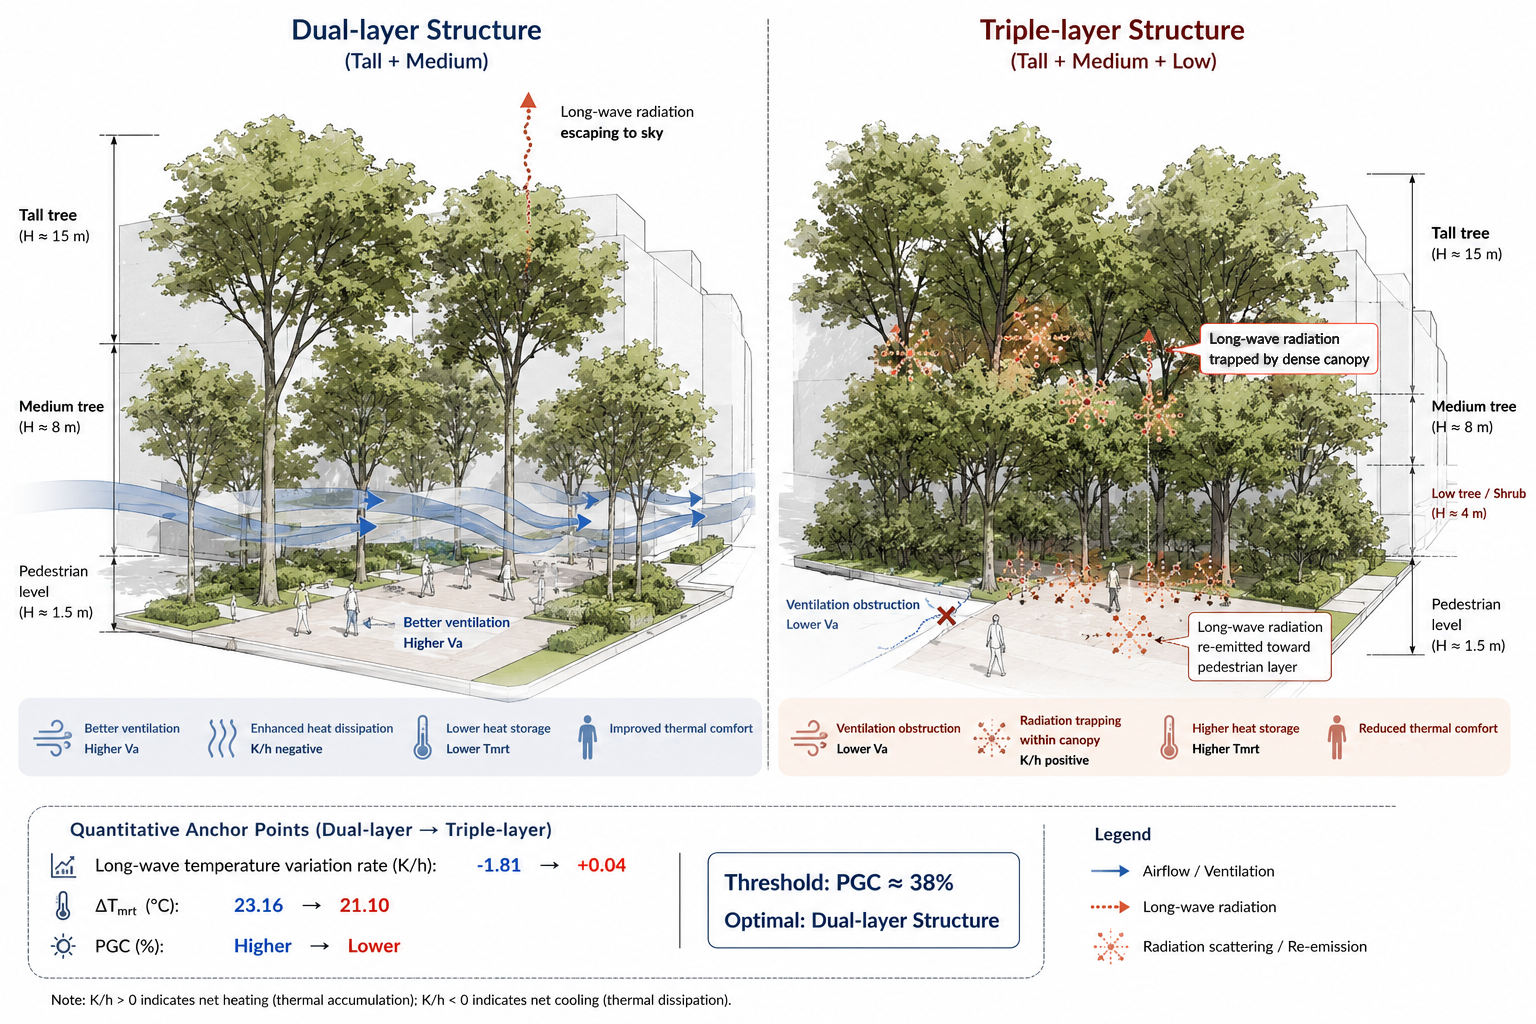
Outdoor open spaces are essential for daily activities in ageing rural environments, yet the thermal effectiveness of vegetation under varying structural configurations remains unclear. Most existing Outdoor Thermal Comfort studies focus on dense urban canyons; the present study addresses this gap by examining a complexity threshold in vegetation cooling under high-SVF rural conditions and the radiation–ventilation trade-off that underlies it. An ENVI-met model was calibrated using field data from a typical village on the North China Plain and 17 vegetation scenarios were simulated. The findings reveal a non-linear relationship between vegetation complexity and cooling efficiency. A threshold of complexity was observed: the cooling performance declined with an increase in stratification from a double-layer (Scenario 12) to a triple-layer (Scenario 14) structure, with the change in mean radiant temperature (∆Tmrt) dropping from 23.16 °C to 21.10 °C. This is due to a radiation–ventilation trade-off, in which denser vegetation increases shading but reduces near-surface ventilation. Dense arrangements exhibit a heat trap effect, with the long-wave radiation flux changing from a cooling (−3.42 K/h) to a heating (+2.11 K/h) state. The results show a threshold effect in vegetation cooling and that thermal comfort is not necessarily enhanced by increased complexity. A shaded-canopy and permeable-understory structure is found to be optimal. The findings inform vegetation design in climate-adaptive rural settings.

Graphical Abstract

1. Introduction

Open spaces are vital for rural residents’ daily social and productive activities [1]. In the era of global warming and urbanisation, China’s rural microclimate is becoming warmer [2]. Traditionally, rural microclimate adaptation has been based on urban experiences. But the rise in impervious surfaces and homogeneous landscape patterns has increased the fragility of rural ecosystems [3], leading to greater outdoor thermal stress and shorter outdoor activity times for rural residents [4,5]. With the lack of rural financial resources, affordable optimisation measures based on Nature-based Solutions (NbS) are needed [6]. As a result, tree planting has emerged as a key approach to enhance Outdoor Thermal Comfort (OTC) [7] through shading [8], wind regulation [9] and evaporative cooling [10].
The microclimate regulation by trees is multifaceted [9,11]. While trees shade and block sunlight, their resistance to airflow increases surface roughness and reduces ventilation, which may reduce the cooling effect [12]. Recent research has begun to recognise that this dual effect produces non-linear, threshold-dependent cooling behaviour rather than a monotonic relationship with greening volume [13,14]. Denser canopies can suppress pedestrian-level airflow and offset the radiative shading gains, producing localised feedbacks that complicate the assumed linearity between greening intensity and cooling performance. Numerical simulations (e.g., ENVI-met) have been extensively used in previous research to study tree morphology, leaf area density (LAD) and planting patterns in urban settings [15,16], with recent methodological advances refining the representation of vegetation aerodynamic and radiative interactions in microclimate models [17]. Studies show that proper tree placement can lower the Physiological Equivalent Temperature (PET) by 20% [9]. For instance, species selection considering street orientation and building distance balances seasonal temperature extremes [11]. However, the existing evidence for these threshold effects is overwhelmingly drawn from dense urban canyons, where low sky view factor (SVF) and high building density define the radiative regime [18]. But it remains unclear if increasing vegetation structural complexity always enhances thermal comfort in rural areas with large Sky View Factors (SVF), or if there is a threshold beyond which the cooling effect weakens due to a heat trap effect. This is largely due to the lack of research on the trade-off between radiative shading and ventilation under a dense canopy.
Moreover, current research mostly applies to high-density urban settings, which differ from rural settings in spatial structure, building typology and SVF [19,20,21,22]. A key difference in rural China is the vulnerability of the elderly population. Older people may have a lower thermoregulation ability [23,24], making them more sensitive to microclimate variations [25]. This vulnerability is amplified in rural settlements with high SVF and limited shading during the transitional month of April. Although average ambient air temperatures (Ta) are relatively benign during this time of year, high solar radiation can result in elevated mean radiant temperatures (Tmrt). For elderly residents who rely on natural ventilation [26,27], these radiative Tmrt increases are a major source of thermal stress. However, their vulnerability to cold drafts means that excessive vegetation, which can reduce wind speed Va at the pedestrian level, may cause cold discomfort or prevent heat loss from the ground [25,28]. As such, the design of rural NbS is a trade-off between two considerations: the need to reduce Tmrt through canopy shading and the need to ensure adequate ventilation for climate-sensitive residents [27,29,30].
This study seeks to answer the following questions: (1) Is there a threshold in vegetation structural complexity above which thermal benefits diminish or are reversed in high-SVF rural areas? (2) How do radiative shading and ventilation interact? (3) What are the implications of these thresholds for climate-adaptive vegetation design for rural elderly? In addressing these questions, this study contributes to rural OTC research in three respects. First, it identifies a complexity threshold in vegetation cooling under high-SVF rural conditions, where cooling efficiency declines beyond a dual-layer canopy structure and a corresponding greenery coverage of approximately 38%. Second, it links this threshold to a radiation–ventilation trade-off, in which long-wave radiation in dense multi-layer assemblages shifts from a net-cooling toward a net-heating regime, while the aerodynamic resistance of the added understory suppresses pedestrian-level ventilation. Third, by focusing on the rural radiative environment characterised by low building density and high sky exposure, this study extends current OTC research beyond the dense urban canyon settings that dominate the literature. Based on the thermal characteristics of rural settlements in cold regions of China, the findings further support a vegetation design approach that combines shaded tree canopies with a permeable understory for ageing villages.
This study focuses on the transitional month of April, rather than the extreme summer, when rural residents are more likely to spend time outdoors [31,32,33]. April in the North China Plain features moderate air temperatures combined with high solar radiation, making it a radiation-dominated regime particularly suited for examining the shading–ventilation trade-off central to this study. This research disentangles tree geometric factors (height and crown width) from distribution measures to examine the shading–ventilation balance. It seeks to improve the understanding of vegetation structural efficiency from linear to threshold effects in rural microclimate regulation.

2. Materials and Methods

2.1. Study Site and Experimental Typologies

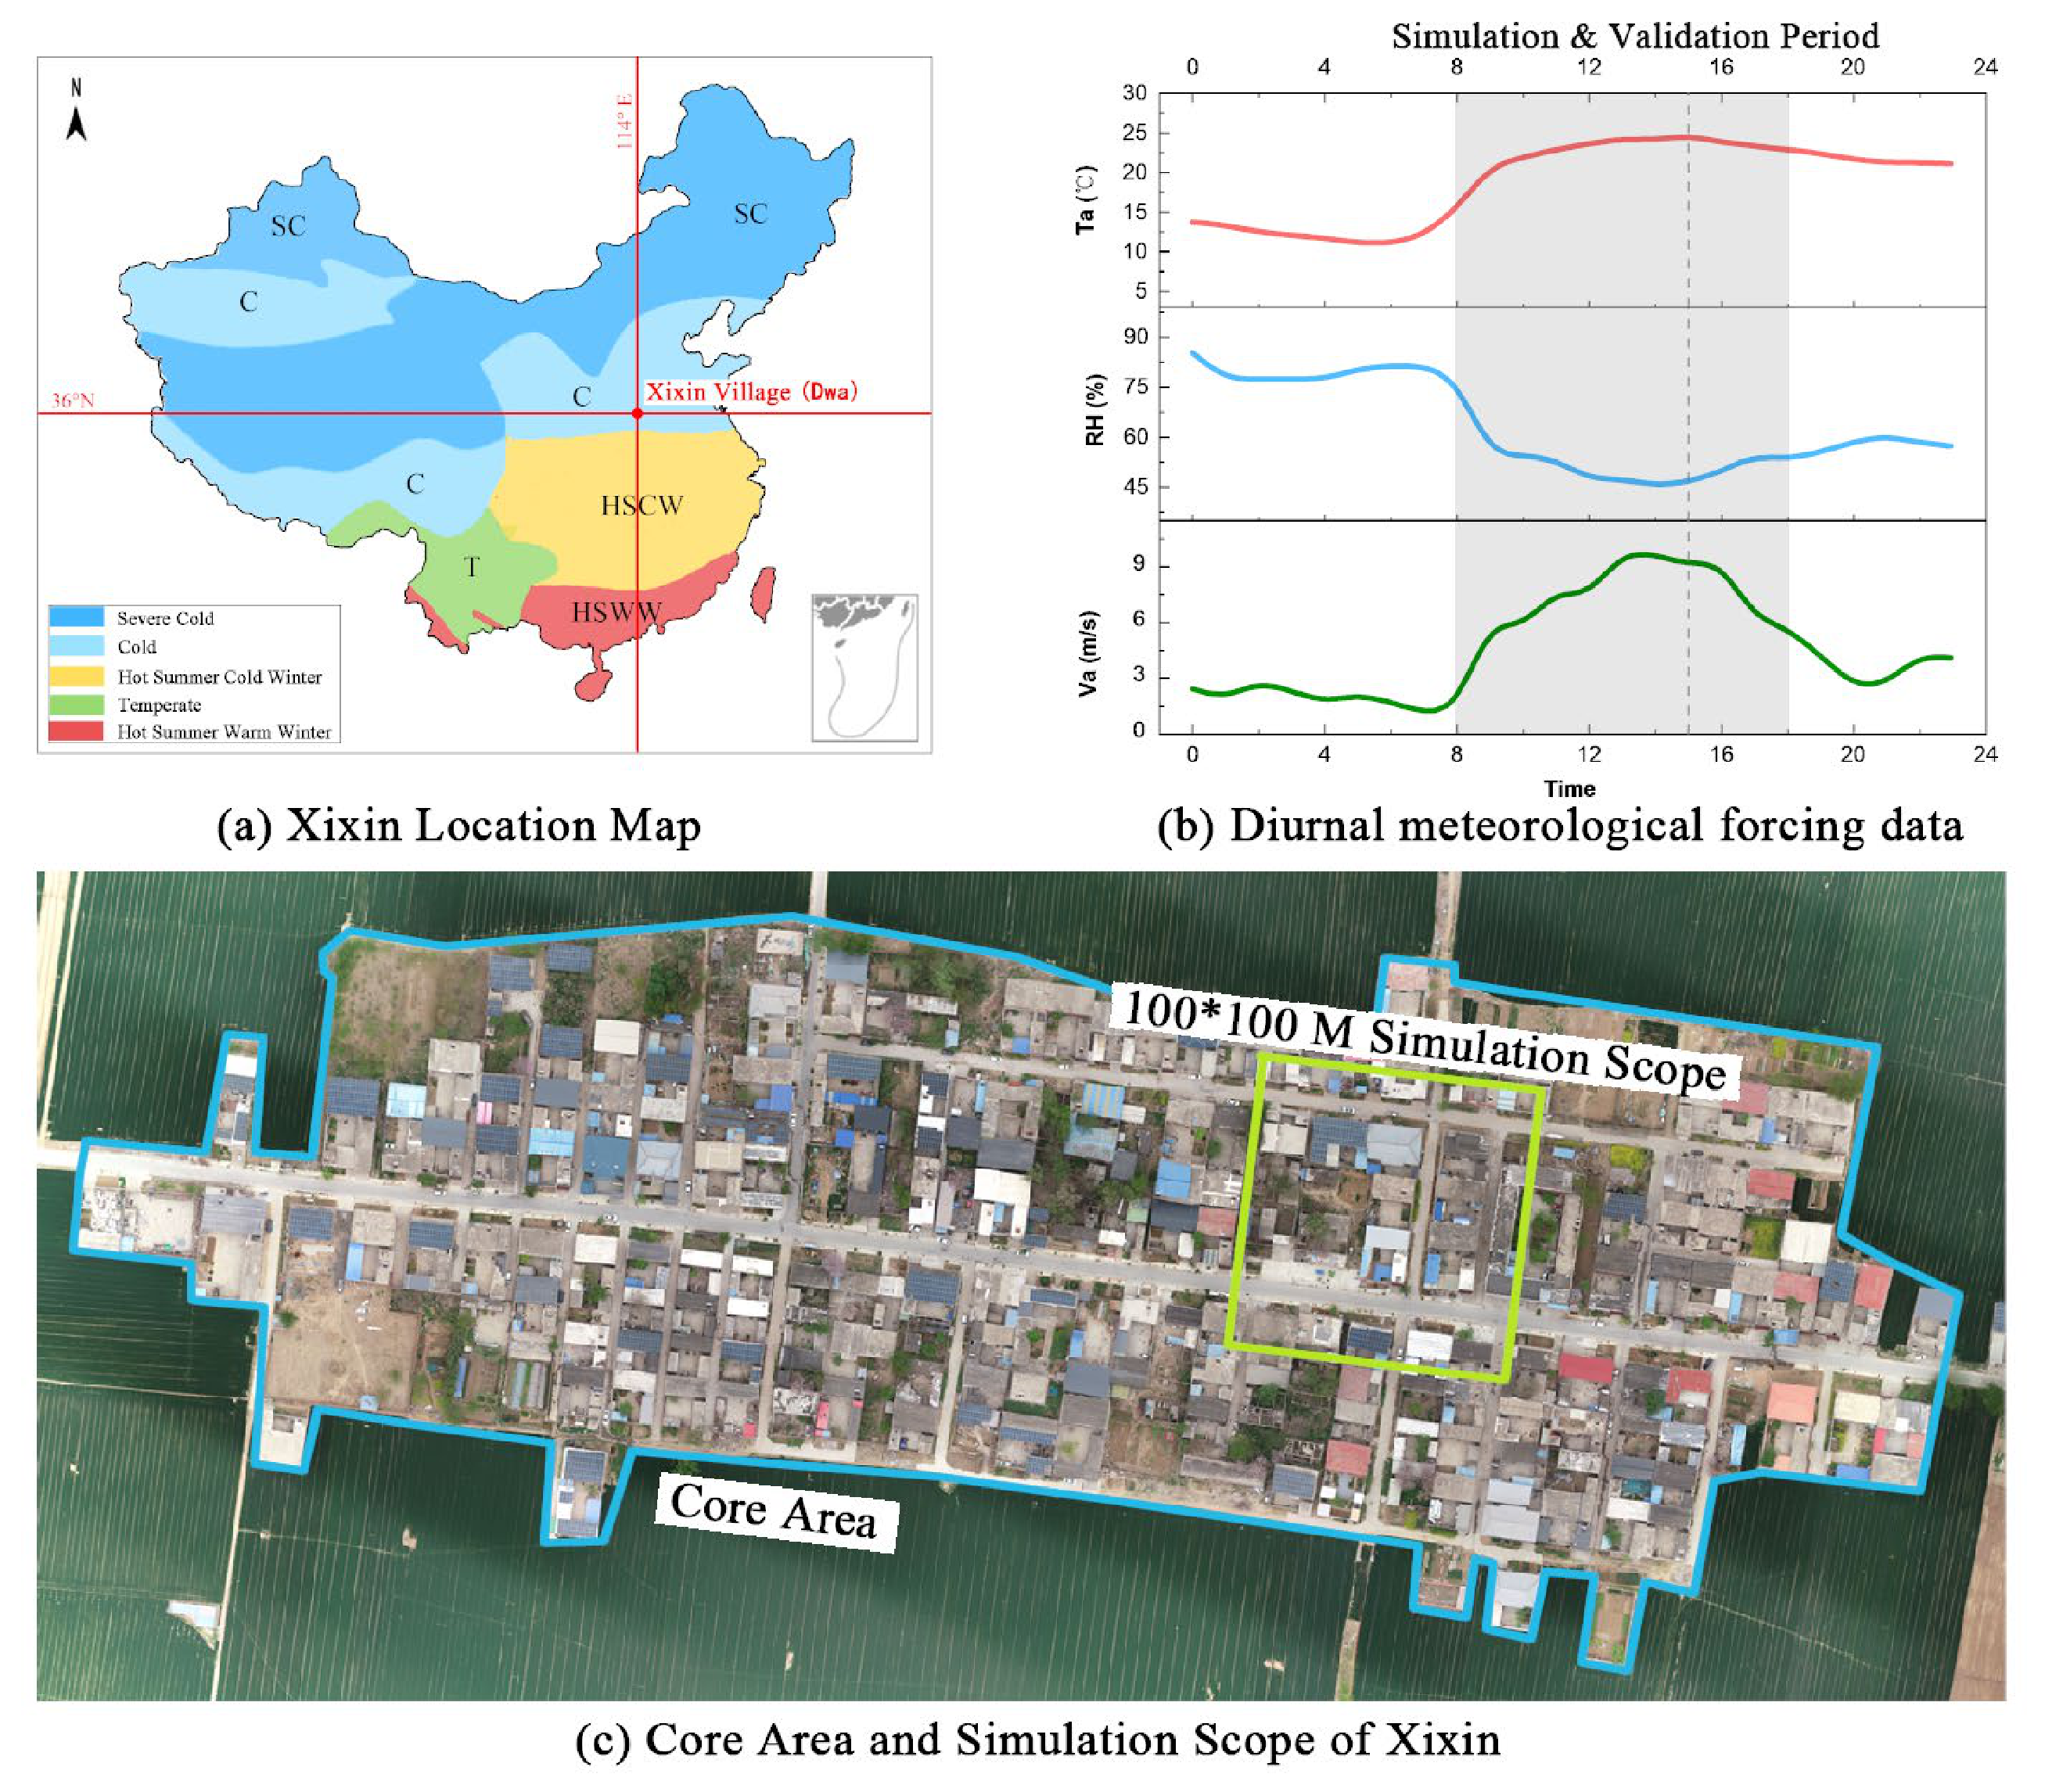
The research was carried out in Xixin Village (36° N, 114° E), which has an orthogonal grid pattern and brick-concrete structure typical of rural settlements on the North China Plain (Figure 1). The village is located in the northern part of Henan Province. The region experiences a temperate continental humid climate (Dwa) according to the Köppen climate classification and is categorised as a cold region in China. The Dwa climate is characterised by cold, dry winters and warm, humid summers. Over the past decade, the mean annual air temperature in the region has been approximately 16.5 °C, with summer (June–August) monthly means approaching 30 °C. The mean annual relative humidity is approximately 65%, and the mean annual wind speed is approximately 2.8 m/s. Atmospheric and meteorological data were obtained from the China Meteorological Information Center. The 12.1 ha village centre is dominated by low-rise buildings (3.5–7.0 m) and a low vegetation cover. To evaluate the thermal environment of various rural morphologies, four typical sites were chosen and classified by their SVF, measured with fisheye photos (Canon EF 8–15 mm f/4L Fisheye USM, Canon Inc., Tokyo, Japan) (Table 1). These locations have different degrees of solar exposure and spatial geometry: a north–south street (NS) (SVF = 0.77) as a narrow canyon with maximum building shading; an east–west street (EW) (SVF = 0.89) as a wide corridor among low-rise buildings; a fitness open square (SQ) (SVF = 0.90) as an exposed public space; and a green land (GL) (SVF = 0.85) with dispersed understory vegetation. These values defined the boundary conditions of the baseline thermal environment (Scenario 1), which is dominated by radiant heat.
Microclimatic modelling was conducted with ENVI-met V5.8 (Table 2), a three-dimensional non-hydrostatic microclimate model developed by Bruse and Fleer [34] and widely used for urban and vegetation–microclimate interaction studies [17,35,36]. The computational domain was divided into a 50 × 50 × 20 grid with a horizontal resolution of 2.0 m and five sub-grids. A geometric simplification approach at sub-grid scale was used to preserve aerodynamic continuity in narrow rural streets (3–5 m wide). Simulations were conducted for 24 h, from 20:00 on 19 April to 20:00 on 20 April 2025. The first 12 h (20:00–08:00) were used to spin up the model. The Full Forcing mode was used to apply hourly meteorological data from station 53899 near Xixin Village to ensure realistic diurnal forcing.
Table 2. Model Parameter Setting.
ItemParameters
Location Coordinates36 N, 114 E, Station height of 196 m
Climatic CharacteristicsDwa
Simulation Period20:00 (4.19)–20:00 (4.20)
Result Output Interval60 min
Number Of GridsX = 50 Y = 50 Z = 20
Grid Size∆X = 2, ∆Y = 2, ∆Z = 1
Number Of Nested Grids5 columns in each X/Y direction
Atmospheric Boundary ConditionsFull Forcing (Supplementary Materials (Atmospheric Boundary Conditions))
Interval Setting for Non-Stationary Calculations1 min
Subsurface/Soil Temp. and HumidityInitial temperature (2 m below ground) = 293 K
Relative humidity (2 m below ground) = 50%
Building SettingsIndoor air temperature = 293 K (constant)
Heat transfer coefficient of wall = 1.94 (W/m2·K)
Roof heat transfer coefficient = 3 (W/m2·K)
Wall reflectivity = 0.2
Roof reflectance = 0.3
Surface AlbedoConcrete = 0.30
Dutch brick pavement = 0.30
Grey stone paving = 0.20
Single Tree ParametersTable 3
Scenario ListTable 4
Table 3. Tree Parameter Settings in ENVI-met.
TypeItemLow-LevelMedium-LevelHigh-Level
SpeciesLatin NameJuglans regiaGinkgo bilobaStyphnolobium japonicum
Geometric shapes
of the canopy
Tree HeightShortMediumTall
Height (m)4815
Crown Diameter (m)2.24.59.0
Under-branch Height (m)1.82.53.5
Geometric shapes
of the root
Root Diameter (m)5610
Root Depth (m)456
Leaf
Characteristics
LAI (m2/m2)1.654.034.05
LAD (m2/m3)Absolute height-based
1 m000
2 m0.4300
3 m1.050.570.02
4 m0.430.840.42
5 m0.011.140.43
6 m0.890.73
7 m0.880.69
8 m0.140.74
9 m0.88
10 m0.73
11 m0.66
12 m0.73
13 m0.64
14 m0.59
15 m0.01
Table 4. Scenarios List.
NO.Tree Sizes *ARTGrids in ENVI-metSpacing (m)PGC (%)
1No trees
2Short0.75365
3Short1.5248
4Short2.51221
5Medium0.7551012
6Medium1.53619
7Medium2.52424
8Tall0.75102022
9Tall1.551038
10Tall2.53645
11Short + Medium1.536
12Medium + Tall1.536
13Short + Tall1.536
14Tall + Medium + Short1.536
15Medium + Grass1.536
16Medium + Shrubs1.536
17Medium + Shrubs + Grass1.536
* The specific parameters of the trees were derived from Table 3.

2.2. Representative Tree Species and Parameterisation

A comprehensive vegetation survey in Xixin Village revealed 11 major tree species. We chose three functional prototypes for local green infrastructure: short (Juglans regia), medium (Ginkgo biloba) and tall (Styphnolobium japonicum). The morphological parameters (tree height, crown diameter, leaf area index (LAI)) and vertical LAD profiles were obtained from literature on similar latitudes [37,38] and verified through field measurements (Table 3).
To disentangle the effects of morphology and spatial density, 17 scenarios were created (Table 4).
Aspect Ratio of Tree (ART), defined as the ratio of tree height (H) to the distance between two adjacent trees (W) (ART = H/W), is used to characterise both the planting density and the resulting spatial enclosure of the tree array. The use of a height-to-spacing ratio to describe tree-array spatial form has been applied in prior outdoor microclimate studies of residential tree arrangements [39]. In landscape design terms, ART encodes the perceived spatial typology of the planted environment—open (ART ≈ 0.75), semi-open (ART ≈ 1.5), and enclosed (ART ≈ 2.5)—providing a design-oriented descriptor of tree-array spatial form that complements, rather than replicates, species-level canopy attributes (crown width, crown shape, LAD). The latter are independently varied through the tree species selection and reported in Table 3 and Table 4.
The discrete nature of the ENVI-met grid (2.0 m) required a modification of the tree spacing in the models to the nearest grid size. As a result, the ART values shown in this study are rough estimates of the design scenarios. The different scenarios were grouped into four stages (Table 4): a bare ground scenario, a morphology-density matrix (ART = 0.75, 1.5, 2.5), vertical structural heterogeneity using mixed height planting, and community complexity using tree-shrub-grass combinations.
All microclimate variables were extracted at 1.5 m above ground, the pedestrian breathing-level height specified in ISO 7726 and consistently adopted in OTC research [17,35,39,40]. This measurement height reflects the research objective of quantifying the thermal environment experienced by people at standing height, rather than characterising radiative or aerodynamic processes within or above the canopy. The relative position of the 1.5 m sensor with respect to the canopy therefore varies by tree size category—within-canopy for short trees (UBH = 1.8 m) and below-canopy for tall trees (UBH = 3.5 m)—but this vertical offset reflects the actual pedestrian experience under each planting design rather than a measurement artefact.

2.3. Model Calibration and Validation

The model was validated against hourly air temperature (Ta) and mean radiant temperature (Tmrt) measured at 1.5 m (AZ87786, AZ Instrument Corp., Taichung, China) above ground at four typical locations: the east–west street (EW), north–south street (NS), green land (GL), and fitness open square (SQ). Tmrt was derived from in-situ globe temperature (Tg), relative humidity (RH), and wind velocity (Va) measurements following ISO 7726 [40]. Following established practice in ENVI-met validation studies [17,35,36], Ta and Tmrt were selected as the two principal validation targets because they integrate the dominant convective and radiative forcings, respectively, and have been most extensively benchmarked in the outdoor microclimate community. Tg, RH, and Va are inputs to the Tmrt calculation, and RH/Va are partially constrained by the Full Forcing boundary conditions used in this study; their measurement accuracy is therefore implicitly captured in the Tmrt validation. PET was subsequently computed using the BIO-met post-processing module of ENVI-met with elderly-specific physiological parameters (male, age = 80, weight = 65 kg, height = 1.65 m, outdoor clothing insulation = 0.5 clo) to represent the target rural population.
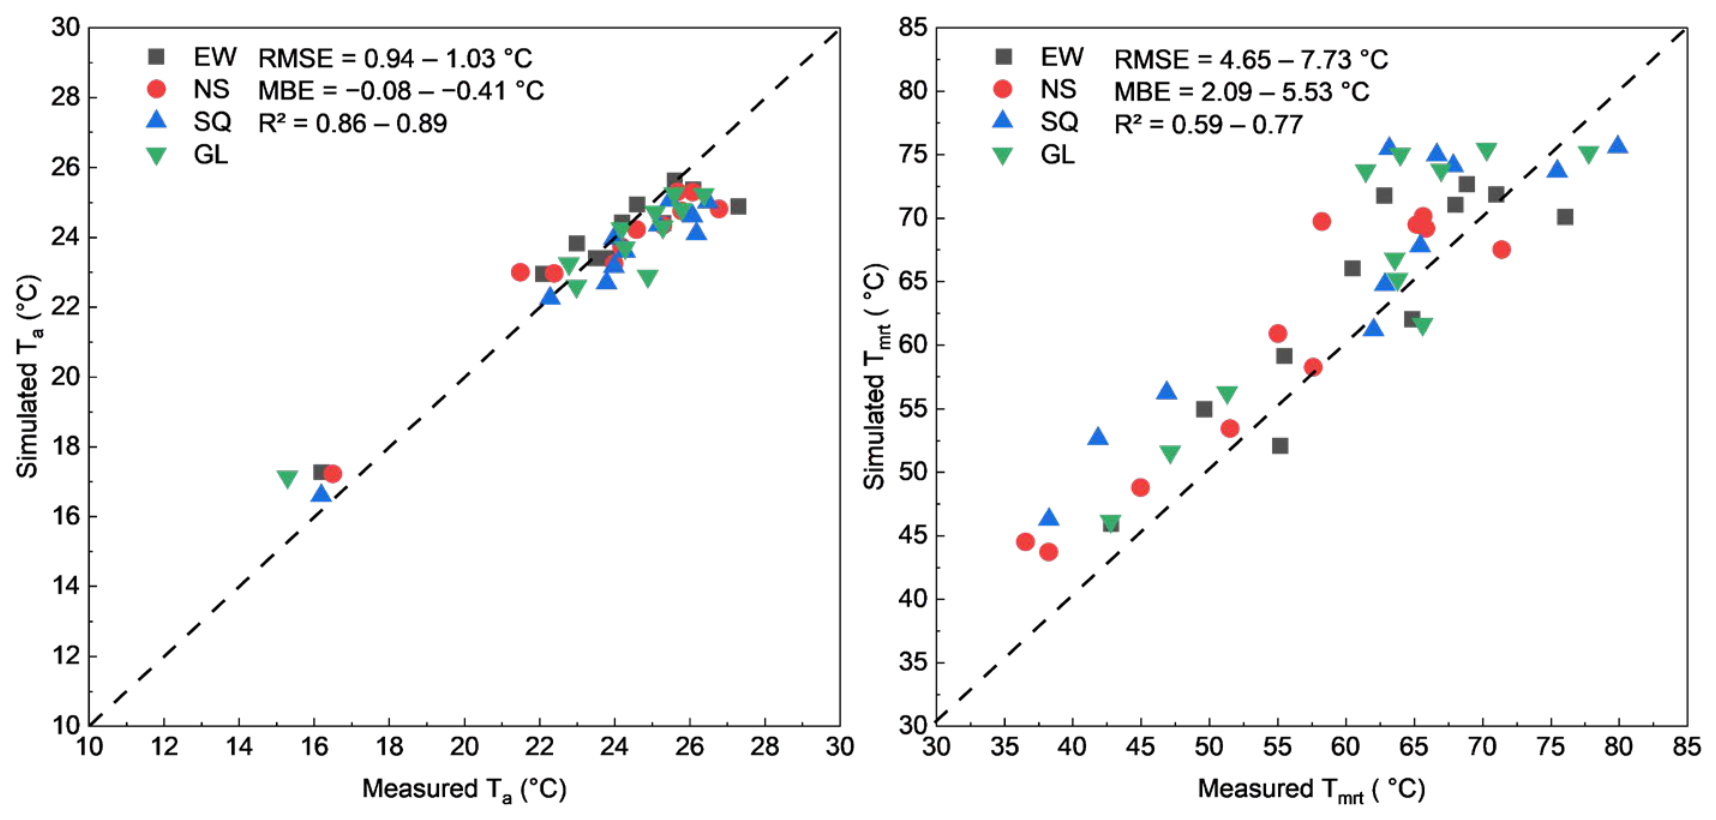
The model’s predictions are satisfactory, as shown in Figure 2. For Ta, R2 exceeded 0.86 with an RMSE of 0.94–1.03 °C. For Tmrt, the RMSE (4.65–7.73 °C) was less than the permissible 10 °C error for outdoor simulations [35]. Moreover, the R2 values for Tmrt (0.59–0.77) suggest that the model accurately simulates rural radiation patterns, making it suitable for the parametric simulations.

3. Results

3.1. Basic Scenario

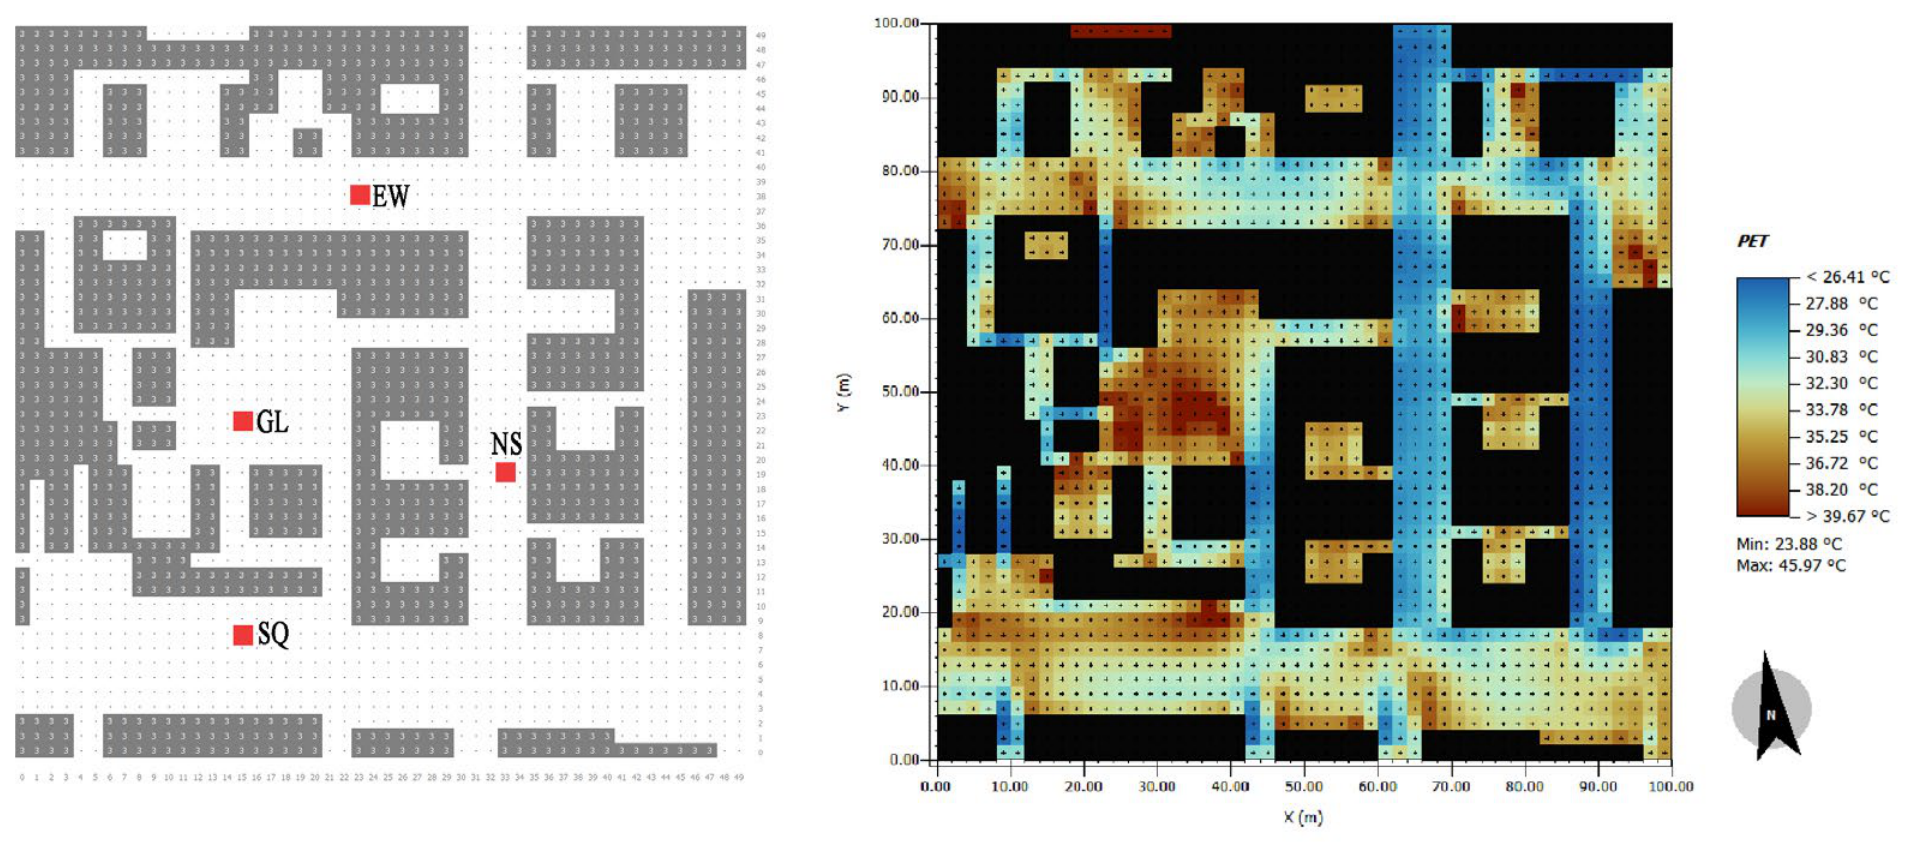
The baseline simulation (Scenario 1) reveals significant spatial variations in thermal stress, mainly influenced by building form and solar radiation (Figure 3). In the absence of vegetation, the GL was the hottest spot, with a maximum PET of 38.74 °C. This peak is a result of high solar radiation (Tmrt ≈ 56.3 °C) and low air velocity (Va = 0.65 m/s). In contrast, the NS Street, with a deep canyon geometry (H/W ≈ 2.33), exhibited the lowest PET (29.02 °C) due to shading, creating the lowest thermal stress level in the village (Table 5). Although Ta and RH exhibited little difference across the domain (<0.3 °C and <3.1%, respectively), Tmrt varied considerably (50.36 °C and 56.69 °C). This variation confirms that the radiative load is the most significant factor affecting the baseline OTC in the study domain. For the performance metrics, this study uses a consistent definition: ΔVa is defined as Vscenario-Vbaseline, where a positive value represents an increase in wind speed. On the other hand, the changes in air temperature (ΔTa), mean radiant temperature (ΔTmrt), and Physiological Equivalent Temperature (ΔPET) are defined as baseline-scenario, with positive values indicating cooling or thermal load reduction.

3.2. Single-Species Tree Arrangement

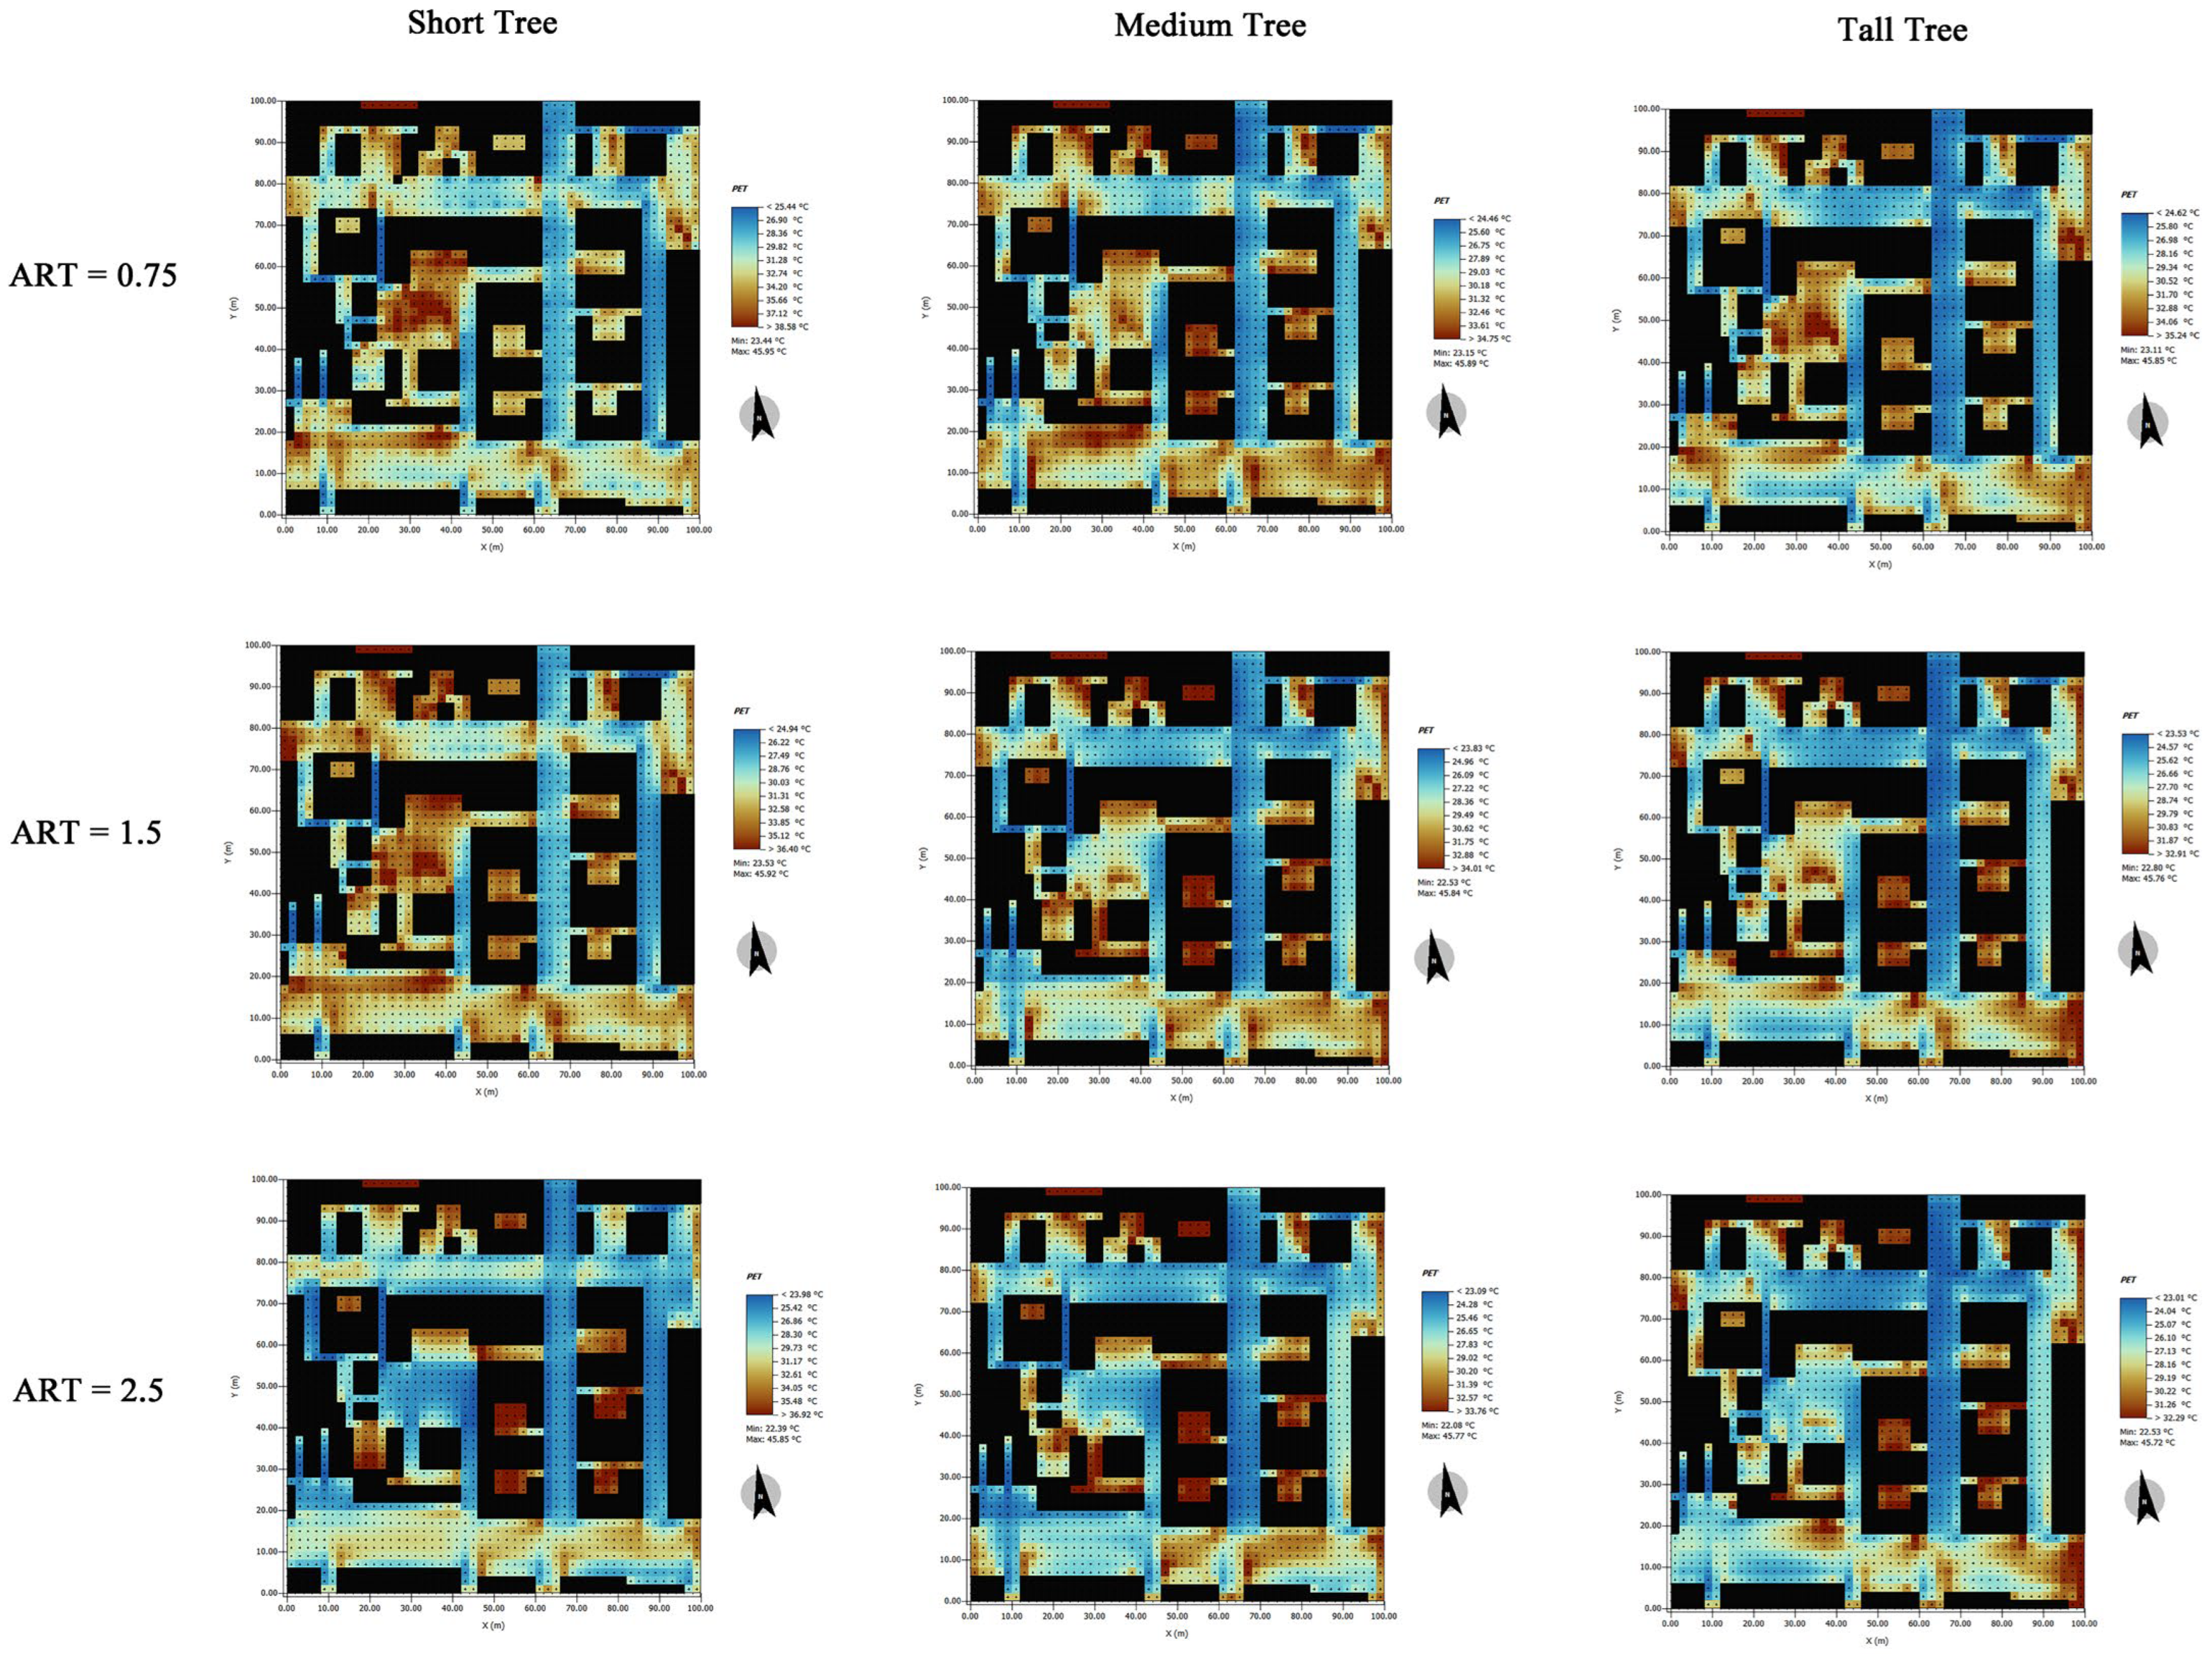
This subsection examines the cooling effects of nine single-species scenarios (Scenarios 2–10) to separate the effects of plant density, tree shape and site geometry (Figure 4). The findings show that while all vegetation scenarios improve OTC, they have different nonlinearities and threshold effects. The average microclimatic changes are presented in Table 6.

3.2.1. Non-Linear Impact of Planting Density

We found a positive relationship between the ART and the improvement in thermal comfort (∆PET), but the increase was not linear. The short trees were the most sensitive to densification, with the mean ∆PET increasing from 0.84 °C at ART = 0.75 to 5.52 °C at ART = 2.5, which is a more than six-fold increase. Conversely, for tall trees, the increase in cooling became saturated after ART = 1.5, suggesting that once a certain canopy coverage is achieved, the marginal gain in radiative shielding from increased canopy density is minimal. Additionally, medium-sized trees did not exhibit a plateau within the range of ART, implying that canopy density is the limiting factor below ART = 2.5.

3.2.2. Marginal Effects of Tree Morphology

Comparing tree sizes shows a diminishing return of tree height. The change from short to medium trees at ART = 2.5 led to a significant decrease in PET of 2.37 °C (from 5.52 °C to 7.89 °C). But further growth of tall trees (Scenario 10) only led to a marginal reduction of 0.15 °C. This implies that medium trees represent a threshold size for retrofitting rural areas in this region, providing adequate shading without the possible maintenance or ventilation issues caused by tall trees.
This threshold was further validated by a sensitivity analysis under April-representative LAI conditions (Juglans regia: LAI = 0.99, or 60% of peak; Ginkgo biloba: LAI = 1.21, or 30% of peak; Styphnolobium japonicum: LAI = 1.62, or 40% of peak). Under these field-realistic conditions, the cooling effects of tall trees (Scenario 10) were reduced, with mean ΔTmrt dropping from 15.87 °C to 10.99 °C and mean ΔPET from 8.04 °C to 7.35 °C, a 31% and 9% reduction, respectively. This suggests that the marginal benefit of tall trees over medium trees is sensitive to seasonal foliage growth and is significantly reduced during the transitional season, further confirming that medium-sized trees are a structurally and seasonally optimal choice for rural greening projects.

3.2.3. Spatial Sensitivity to Vegetation Shading

The cooling performance of identical tree arrangements was highly sensitive to the underlying spatial context. The most exposed GL site was the most responsive to all strategies, with maximum ΔPET values consistently above 12 °C for high-density configurations. This site is not initially shaded by buildings, and the addition of any canopy immediately reduces Tmrt. In contrast, the narrow NS street was the least responsive, with a maximum ΔPET of less than 5 °C. The NS site already has a high building-to-height ratio (H/W ≈ 2.33), which means it is already heavily shaded. In this case, the trees mainly obstruct residual airflow, rather than blocking radiative heat transfer, leading to the smallest cooling efficacy.

3.3. Tree Arrangement Parameters and Cooling Effect

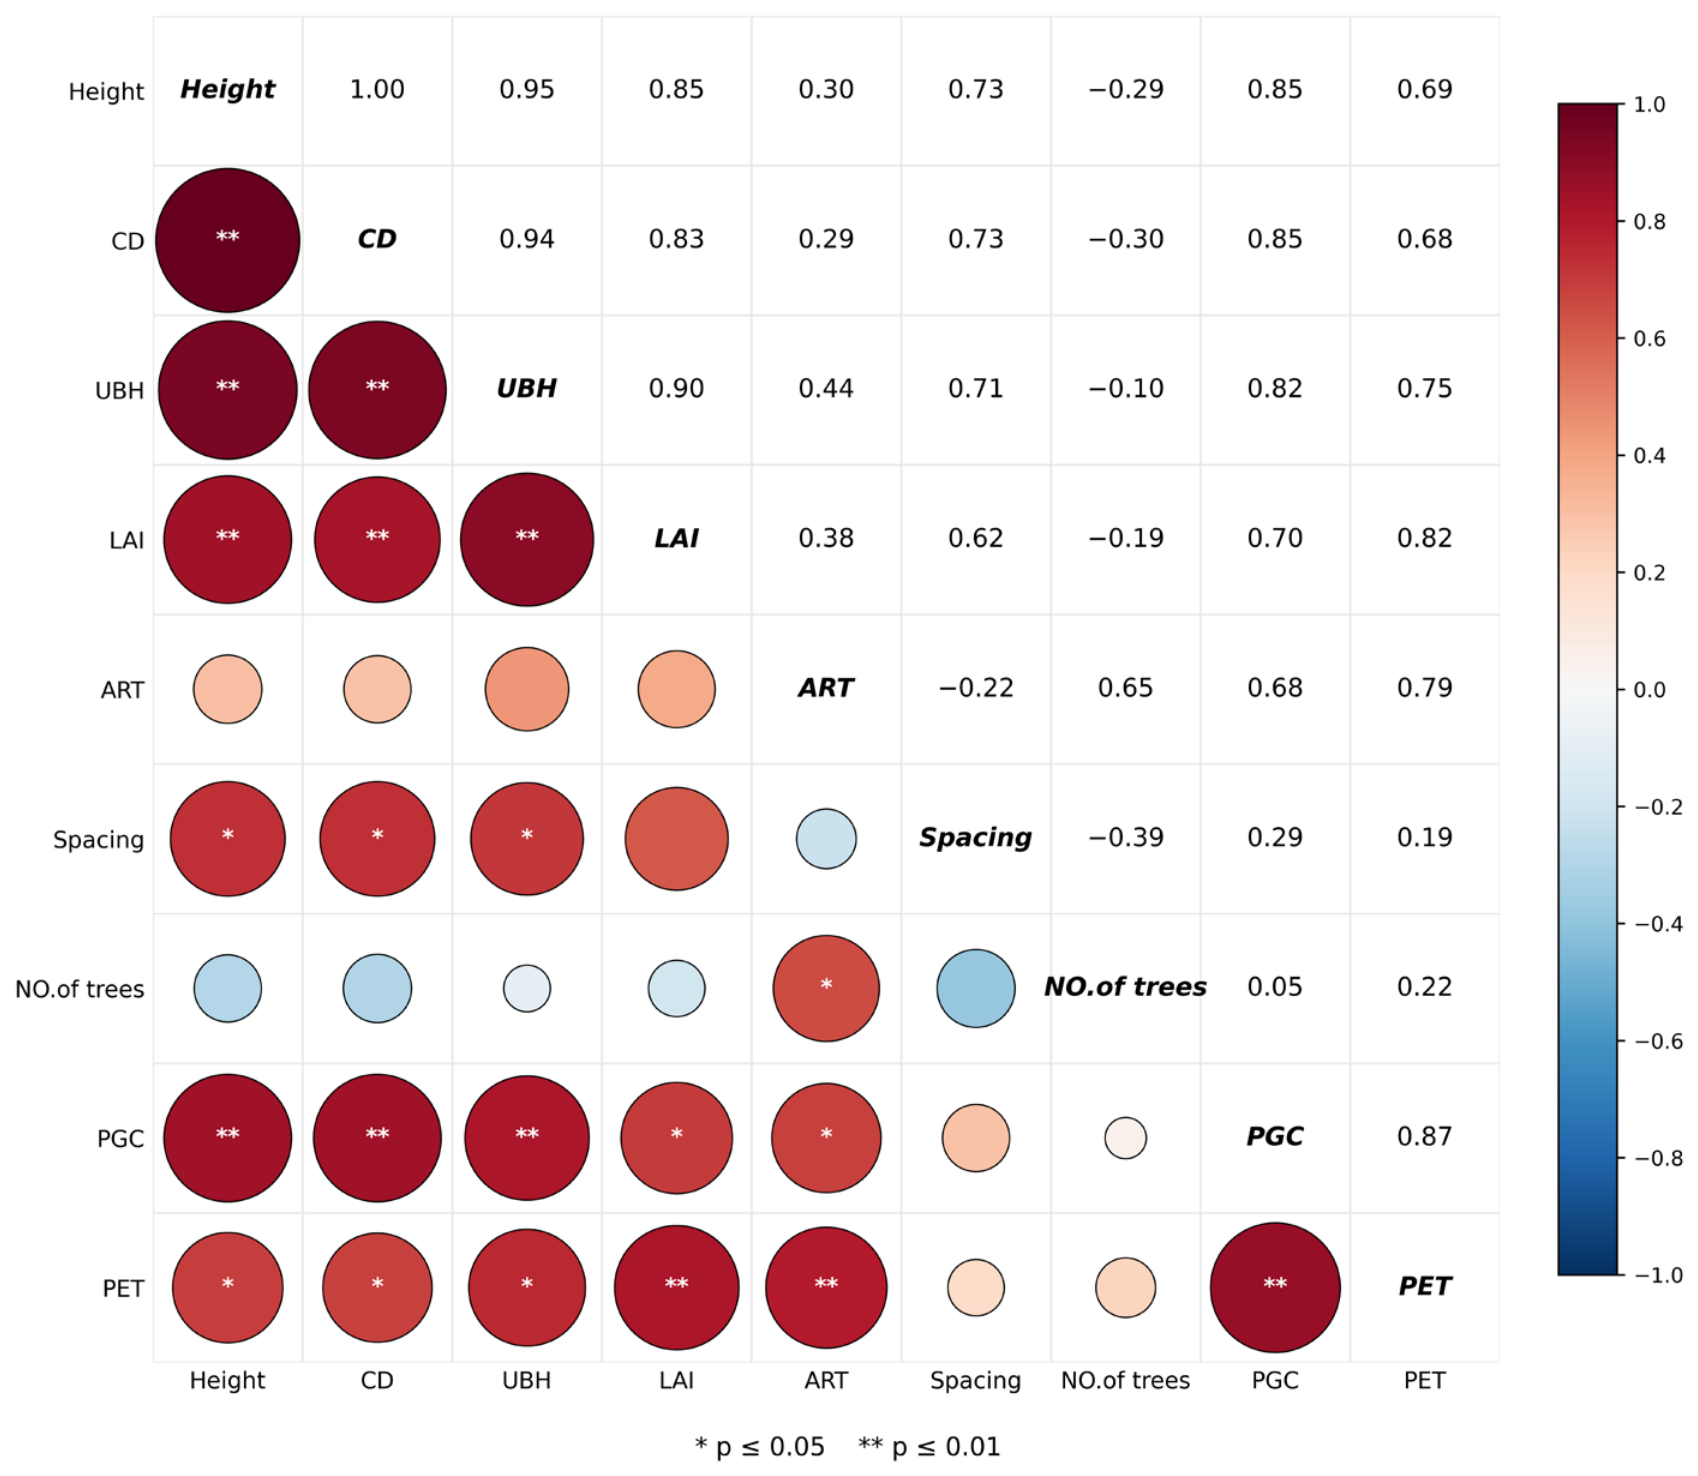
To determine the influence of vegetation configuration on thermal mitigation, this section uses ten parametric scenarios (Table 7) in a statistical analysis. The study assesses the impact of individual tree structure (height, crown diameter, and LAI) and tree spatial configuration (ART, spacing, tree number and PGC) on mean ∆PET.

3.3.1. Statistical Association Matrix: Individual Quality vs. Aggregate Quantity

The correlation matrix reveals that Percentage of Greenery Coverage (PGC) and ART are the main factors affecting thermal comfort (Figure 5). PGC was the most positively correlated with ΔPET (r = 0.87, p < 0.01), suggesting that the volume of greening is a primary driver of cooling performance. ART also showed a strong correlation (r = 0.79, p < 0.01), implying that enclosure and shading performance are important factors in PET reduction.
Among individual morphological parameters, LAI showed the strongest bivariate correlation with ΔPET (r = 0.82, p < 0.01), although this strong association is partly attributable to its collinearity with tree height and UBH (see Section 3.3.2). UBH (r = 0.75, p < 0.05), tree height (r = 0.69, p < 0.05) and crown diameter (r = 0.68, p < 0.05) followed. LAI represents the ability of the canopy to shade, while UBH controls the vertical decoupling of canopy resistance and pedestrian microclimate. This dual influence accounts for the fact that structural quality is more important for cooling than greening volume.
In contrast, spatial parameters, including planting distance (r = 0.19) and the number of trees (r = 0.22) were insignificant (p > 0.05). This suggests that in resource-limited rural areas, simply planting more trees is not enough. Instead, optimisation should focus on improving the morphological quality and spatial arrangement of trees to achieve optimal cooling effects.

3.3.2. Multiple Regression and Optimisation Pathways

Multicollinearity between vegetation morphological variables was diagnosed prior to regression. LAI was found to be highly correlated with tree height (r = 0.85) and under-branch height (r = 0.90) because the three tree categories (Short, Medium, Tall) have fixed species-specific LAI values. To avoid the resulting parameter identifiability problem, the multivariate regression of ΔPET adopted PGC and ART as predictors: PGC characterises the horizontal canopy coverage, determined jointly by crown diameter and planting density, while ART characterises the vertical-to-horizontal aspect of the tree array, determined jointly by tree height and planting spacing. PGC and ART together capture the horizontal-coverage and vertical-density dimensions of the planting design and exhibit only moderate intercorrelation (r = 0.68, VIF = 5.5), which is acceptable for regression inference. To prevent multicollinearity among morphological indices (VIF > 10), a stepwise OLS regression was used. PGC and ART were selected as the main independent variables (VIF < 5), resulting in a significant model:
P E T = 0.604 + 0.121 × P G C + 1.217 × A R T
The model is statistically significant (F = 17.1, p = 0.002) and explains 78% of the variance in ΔPET (R2 = 0.83, Adj R2 = 0.78), with PGC contributing the dominant linear effect (coefficient = 0.121, p = 0.024) and ART contributing the spatial-enclosure effect (coefficient = 1.217, p = 0.115). The regression coefficients suggest two key avenues for improving rural thermal comfort. While the p-value for ART (0.12) is due to the small sample size (n = 10), the large effect size (coefficient of 1.22) suggests that enhancing thermal comfort is very sensitive to spatial geometry. PGC, with a lower per-unit coefficient (0.12) but consistent significance (p < 0.05), is an accumulative factor. The cooling effect of the tree height-to-spacing ratio (ART) is significant, while increasing total canopy coverage (PGC) is still a critical strategy to enhance the cooling effect.
While the linear regression (R2 = 0.83) suggests a positive correlation between PGC and thermal comfort, it fails to capture the diminishing returns in high-density cases. To explore the complexity threshold, a quadratic regression was conducted on the radiative response (∆Tmrt):
T m r t = 0.29 + 0.78 × P G C 0.0103 × P G C 2
The first-order derivative of this function (R2 = 0.74, F = 9.87, p = 0.009; Shapiro–Wilk W = 0.99, Durbin-Watson = 2.01) reveals a key turning point at PGC ≈ 38.0%. To assess robustness, the quadratic model was refitted separately for each of the four sites, which together span an SVF range of 0.77–0.90 and a baseline wind speed range of 0.65–2.92 m/s. The site-specific thresholds (SQ: 34.4%, GL: 35.1%, NS: 42.5%, EW: 44.2%; mean 39.0%) all clustered within a narrow [34.4%, 44.2%] band, indicating that the threshold is robust across the SVF and ventilation conditions examined. This point marks a decrease in the cooling rate, confirming the heat trap effect mentioned in Section 3.4.

3.4. Synergistic Effects and Complexity Thresholds of Vegetation Groups

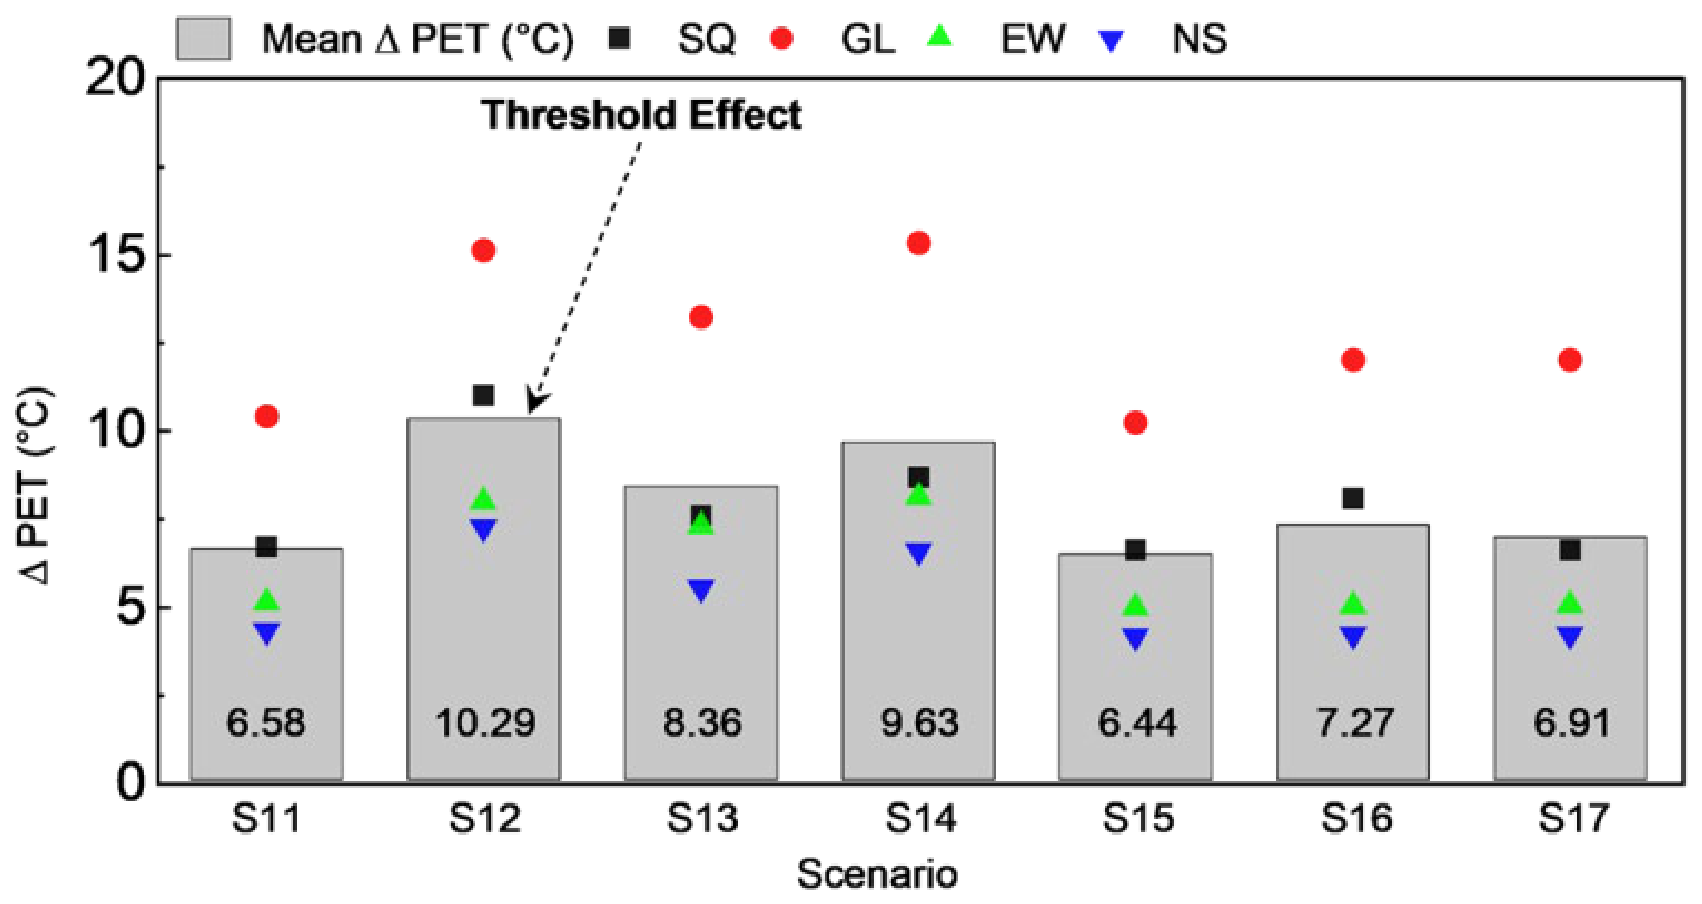
This section explores the microclimatic performance of multi-layered vegetation assemblages, such as tree groups of varying heights and tree-shrub-grass combinations. The microclimatic simulations reveal that the cooling effect of vegetation does not necessarily increase with increasing complexity. As shown in Table 8, the peak cooling effect of Scenario 12 is associated with the greatest reduction in Tmrt (23.16 °C). As shown in Figure 6, the two-layered tall and medium tree configuration (Scenario 12) resulted in the maximum mean cooling effect (∆PET = 10.29 °C), which is much greater than the triple-layered Scenario 14. These results suggest a critical level of vegetation complexity above which thermal comfort does not increase or even decreases.
Table 9 compares the peak-summer and April-representative LAI conditions for the two structurally critical scenarios and confirms the consistency of all thermal indicators across different parameterisation settings.

3.4.1. Optimal Tree Stratification: The Efficiency of Dual-Layer Groups

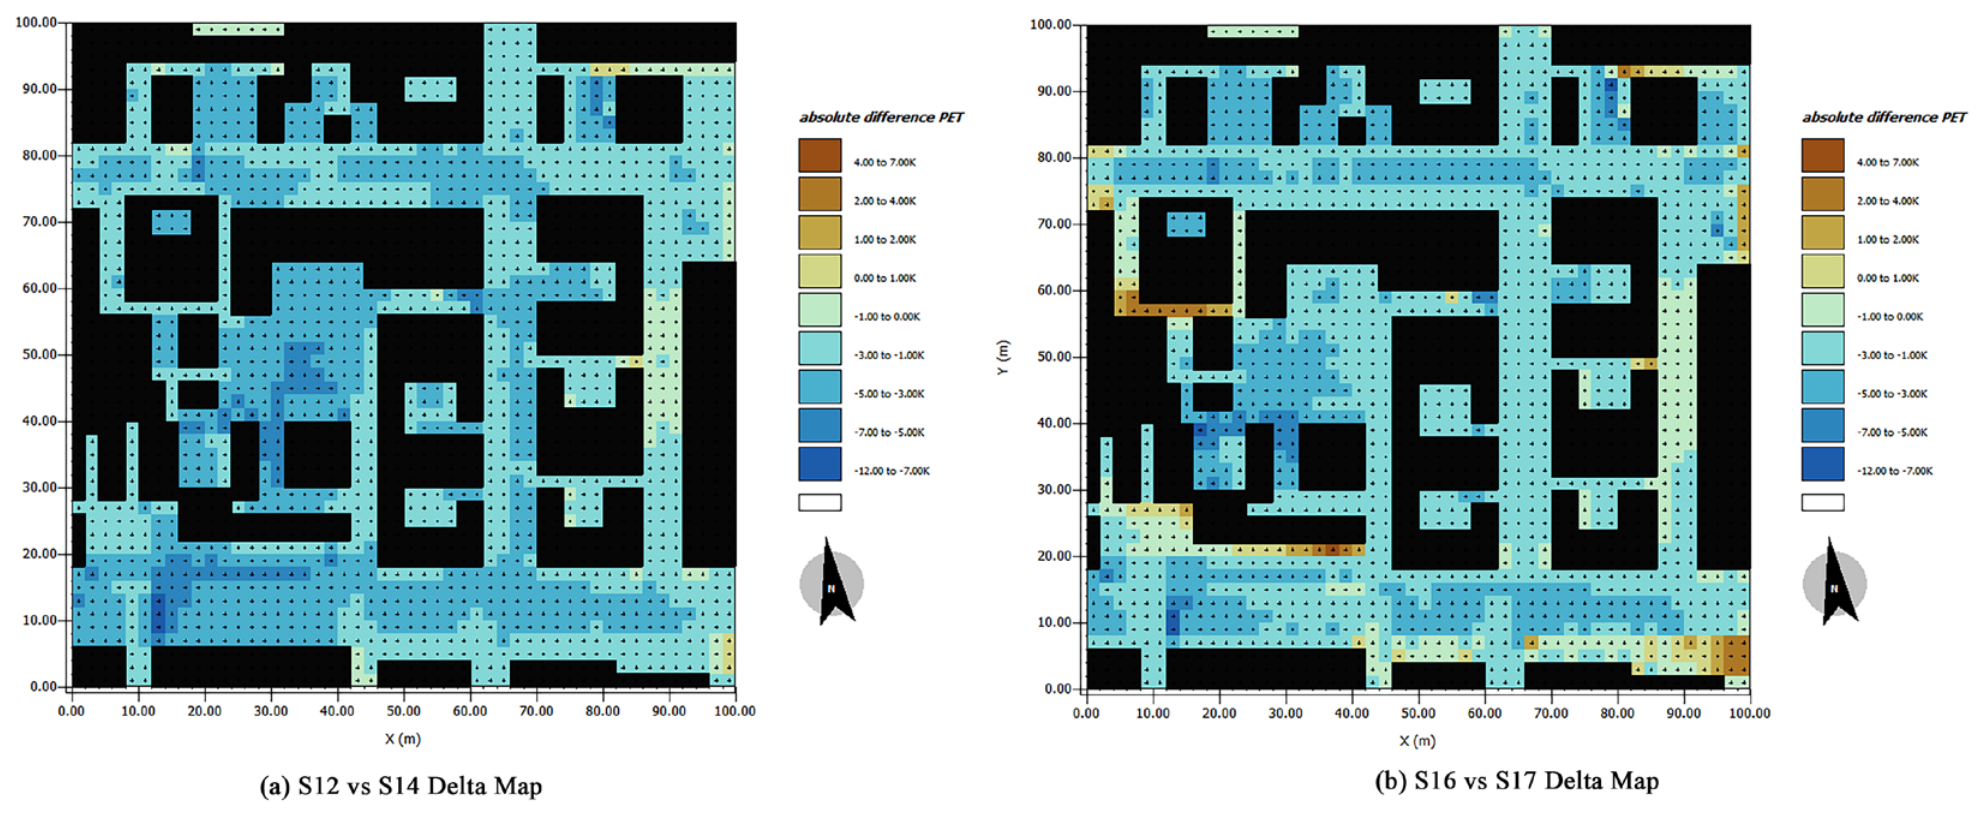
The most effective mixed height tree assembly is the two-layered tall and medium tree combination (Scenario 12), with a mean ∆PET of 10.29 °C. By comparison, the triple-layer tall, medium and short tree combination (Scenario 14) produced a smaller cooling effect of 9.63 °C. This efficiency drop is mainly attributed to the loss of radiative cooling, rather than ventilation blockage. This threshold effect is shown in Figure 7, where the extra understory layer in Scenario 14 is unable to increase the high-cooling areas relative to Scenario 12.
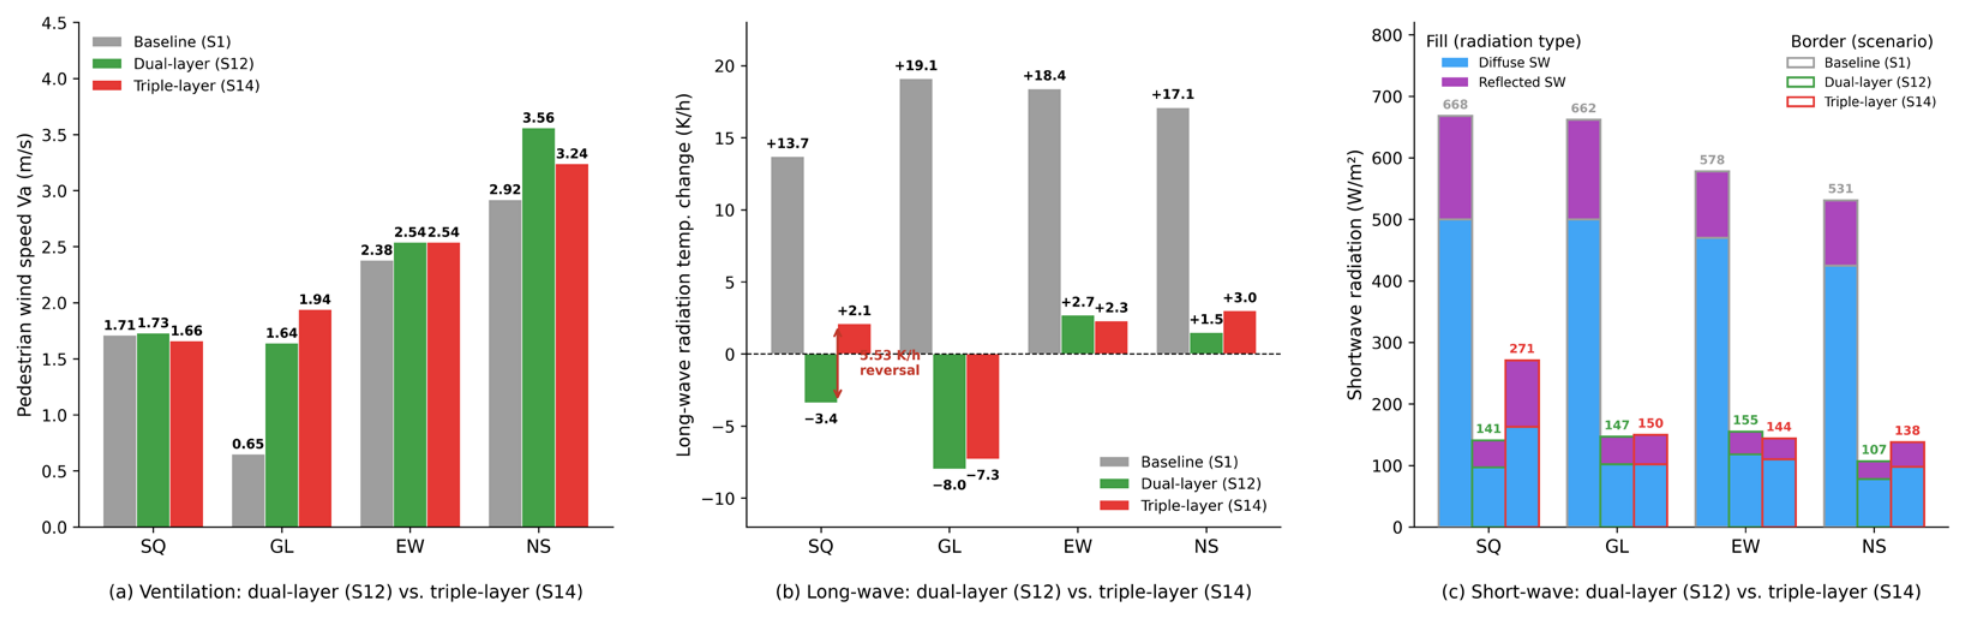
To examine the thermodynamic reason for this efficiency reduction, Figure 8 compares the ventilation (panel a), long-wave radiative regime (panel b), and shortwave radiation components (panel c) between the dual-layer (Scenario 12) and triple-layer (Scenario 14) configurations in the four representative sites. This analysis shows a clear heat-trapping effect of increased complexity. Figure 8a reveals that the dual-layer S12 consistently outperforms the triple-layer S14 in terms of ventilation. S12 has higher pedestrian-level wind speeds at SQ (1.73 vs. 1.66 m/s) and NS (3.56 vs. 3.24 m/s), is identical at EW (2.54 vs. 2.54 m/s), and is lower only at GL, where both configurations significantly outperform the calm baseline (1.64 vs. 1.94 m/s, compared to the baseline of 0.65 m/s). Across the four sites, S12 has a 0.02 m/s advantage.
Panel (b) reveals the main mechanism. At three of the four sites, S12 yields more long-wave cooling than S14, with the greatest effect at the very open SQ site, where the long-wave flux divergence flips from a net cooling state (−3.42 K/h) under S12 to a net heating state (+2.11 K/h) under S14. The site-averaged values (S12: −1.81 K/h; S14: +0.04 K/h) confirm that the extra short tree understory of the triple-layer configuration converts the mean radiative regime from cooling to near-neutral, thus offering quantitative evidence of the heat trap effect. Panels (a) and (b) show that the complexity threshold works primarily through long-wave radiative entrapment, and secondarily through ventilation suppression, which is site-dependent.
A decomposition of the shortwave radiation budget (Figure 8c) further reinforces this mechanism. Direct shortwave radiation was zero at all four sites at 15:00 due to geometric shading, indicating that the threshold is not driven by direct solar interception. Among the three non-zero components, both diffuse (SW_dif) and reflected (SW_ref) shortwave radiation increased in S14 relative to S12 (site-averaged ΔSW_dif = +21.1 W/m2; ΔSW_ref = +17.4 W/m2), reflecting the reduced effective shading of the triple-layer configuration. The magnitude of this degradation is again site-dependent: at the open SQ, all three components reached their peak unfavourable change (ΔSW_dif = +68.7 W/m2, ΔSW_ref = +61.4 W/m2, ΔLW_div = +5.53 K/h), driving a 6.77 °C Tmrt penalty. At the more shaded sites (EW, NS, GL), the differences between S12 and S14 across all components were small, and the resulting Tmrt differences were correspondingly minor. The long-wave heat trap effect therefore remains the most diagnostic signal of the threshold, but is now placed within a fuller radiative budget showing that all non-zero shortwave components also shift unfavourably at high-SVF open sites. Full radiation-component data for all 17 scenarios are provided in Supplementary Material (S1–S17).

3.4.2. Understory Optimisation: Shrubs and Grass

Likewise, the optimisation of understory combinations revealed the existence of this threshold. Maximum cooling (∆PET = 7.27 °C) was achieved with the tree and shrub combination (S16), which was much greater than the tree and grass combination (S15, 6.44 °C), adding dense grass to the tree and shrub mix (S17) decreased cooling to 6.91 °C, along with lower radiative regulation efficiency (Tmrt decreased from 17.28 °C to 16.19 °C) and increased aerodynamic resistance (∆Va ≈ −0.07 m/s). These findings suggest that although shrubs offer a useful secondary shading component, dense grass may reduce near-surface ventilation without significant radiative gains.

3.4.3. Spatial Heterogeneity and Design Implications

The effectiveness of multi-layered vegetation is site-dependent. At the GL site, the greatest benefit was consistently achieved with complex structures, with maximum ∆PET values of 15.32 °C in Scenario 14. This highlights the importance of multi-layered vegetation in open landscapes. On the other hand, in the NS street, the benefits of increasing understory vegetation were negligible. Overall, these results suggest a “shaded canopy, permeable understory” design approach. To achieve the best thermal performance in rural residential areas, landscape design should focus on two-layered structures (tall and medium trees) to intercept radiation without trapping heat in complex vertical structures.

4. Discussion

This research offers a key insight that challenges the traditional “more is better” maxim of “maximising greening”, showing that this is not always the case when it comes to OTC. The ENVI-met simulations in Xixin Village reveal a key insight: greening is not always the answer. There are limits to both the structural complexity and vegetation density; beyond these thresholds, thermal comfort improvement levels out or even worsens. This study combines physical simulations with field surveys to understand the effects of different tree species, morphological characteristics and pattern variations on the thermal comfort of the elderly in cold climates. This debate clarifies the role of vegetation structures in microclimate regulation through radiation and convection, thus guiding context-based approaches to improve rural public spaces. Additionally, this study discusses these results within the theoretical framework of non-urban OTC studies.

4.1. The Ventilation–Shading Trade-Off and Complexity Thresholds

In all of the scenarios, the mitigation of Tmrt was identified as the key mechanism through which trees improve OTC. This result is consistent with previous studies that have shown that the shading effect is the primary driver of OTC, often surpassing the effects of air temperature [41,42]. Additionally, radiation has been recognised as a major driver of thermal sensations in the cold climates of China [43]. As a result, canopy characteristics such as tree height, crown diameter and PGC were significantly associated with cooling effects.
However, this relationship is not purely linear. It is highly dependent on spatial arrangements. While radiative forcing is the major driver, Va variation had a significant impact on PET. Our findings suggest that the influence of vegetation on wind speed is non-linear. In rural areas with low building density, the high canopy closure (S12) obstructs the flow of air and provokes an acceleration at the pedestrian level, akin to a canyon effect, with the average Va increasing from 1.91 m/s to 2.37 m/s. A marked decrease in wind speed is observed only when the vegetation structure is extended downwards, such as S16 with the addition of shrubs, which adds considerable mechanical resistance [44]. This highlights a key ventilation–shading balance: high canopy closure blocks convective heat exchange, as also highlighted in particular tree arrangements [45]. The presence of dense understory vegetation that impedes airflow near the ground results in empirical evidence of a reduced decrease in Tmrt, implying that complex vertical structures can retain long-wave radiation. This results in heat build-up at the pedestrian level and confirms the presence of a specific ventilation–shading trade-off.
This trade-off can be linked to an architectural variable. The single-species results also show that the response of the wind speed at the pedestrian level is determined by the relative location of the UBH to the measurement plane (see Section 2.3 for the rationale for the fixed 1.5 m measurement height). If the UBH is much greater than 1.5 m, such as the tall trees with UBH = 3.5 m, the higher canopy places the pedestrian layer in the trunk space and creates a horizontal acceleration effect similar to a shaded corridor, with ΔVa ranging from +0.33 to +0.49 m/s. In contrast, for short and medium trees, the UBH is similar to the pedestrian level (UBH = 1.8–2.5 m). The lower canopy is at the same height as the human body, and provides mechanical resistance, leading to negative ΔVa. This process offers a physical basis for the design strategy of shading and ventilation. The UBH is more important than leaf density in breaking the shading–ventilation trade-off, also explaining why the tall and medium two-layer structure (S12) provides the greatest cooling and the largest wind speed gain.
This research clarifies the linear greening principle. The exploration of non-linear thresholds identified a key efficiency threshold at PGC ≈ 38%. The heat trap effect caused by extreme aerodynamic resistance of complex multi-layered assemblies, such as the triple-layer (Scenario 14) or tree, shrub, and grass (Scenario 17) arrangements, drives the total greenery coverage beyond this threshold, where the additional shading effect is outweighed by the heat trap effect. This threshold was demonstrated by the fact that the tall and medium tree combination (∆PET = 10.29 °C) was more effective than the structurally complex tree assembly, consisting of tall, medium, and short trees (∆PET = 9.63 °C). Likewise, the tree and shrub combination outperformed the triple-layer tree, shrub and grass combination. This suggests that rural OTCs should be optimised for structural efficiency rather than volume, confirming that the cooling efficiency is non-linearly related to structural features, not size [27,46]. An ideal vegetation system offers a shaded canopy and permeable understory. Large and medium trees create high crowns to shade the sun, while the lower part remains open, allowing air to flow through the tree system while keeping wind speed high.
To test the validity of this complexity threshold under realistic field conditions, a phenological sensitivity analysis was performed for the two structurally important scenarios (S12 and S14) using April-representative LAI values based on species-specific leaf-out curves in the North China Plain. Under these conditions, Scenario 12 again performed better than Scenario 14 in all thermal metrics: mean ΔTmrt (15.36 °C vs. 14.24 °C), mean ΔPET (8.30 °C vs. 7.55 °C), and mean ΔVa (+0.68 m/s vs. +0.46 m/s relative to baseline). Crucially, the ventilation difference between the two structures was enhanced, rather than reduced, under April LAI conditions: the two-layer structure (S12) produced a much larger increase in pedestrian-level wind speed than the three-layer structure (S14). This demonstrates that the penalty of excessive complexity in the aerodynamic performance is determined by branch architecture, not leaf area. This result confirms that the complexity threshold is not a byproduct of peak-summer LAI settings, but is driven by structural complexity and remains robust under seasonal LAI variability. Site-level analysis also confirmed that the difference was greatest at the open SQ site (ΔTmrt difference between S12 and S14: 6.77 °C), as discussed in Section 3.4.3.

4.2. Theoretical Implications for Rural Environments in China’s Cold Regions

This study improves understanding of rural thermal environments by identifying microclimatic regimes in rural areas of China’s cold regions, especially the North China Plain.
First, it defines a radiative-dominated rural regime, as opposed to dense urban areas with low SVF. The North China Plain villages have low building density and high sky visibility. Research on Chinese villages stresses that rural thermal environments are sensitive to specific spatial factors and require specific planning approaches, rather than generic urban models [47,48]. In rural areas with low building density and high sky visibility, radiative control through canopy shading is more dominant than convection and evaporation in thermal comfort.
Second, it defines a ventilation–shading threshold. This study establishes a quantitative threshold point, specific to the low-density spatial structure of plain villages. Through the description of the Tmrt-Va trade-off, the study defines an operational threshold where the shading–ventilation effect is maximised in terms of PET reduction.
Third, it defines optimal structural complexity. In North China’s rural context, a unimodal relationship is observed between vegetation complexity and thermal comfort. The optimal performance is achieved with moderate structural complexity, while simpler or denser structures perform worse.
From a landscape design perspective, the value of ART lies precisely in its ability to translate a microclimate result into a directly applicable spatial design parameter. Rather than asking designers to specify crown width or LAI—which depend on species availability and growth stage—ART offers a single, intuitive geometric variable that determines whether the resulting space feels open, semi-open or enclosed. Combined with the dual-layer canopy principle identified in this study, this spatial typology framing enables design recommendations that are simultaneously climate-adaptive and locally implementable.

4.3. Limitations and Future Research Directions

This study provides valuable insights, but is limited by several factors. While the main simulations used peak-summer LAI values to define the theoretical maximum of vegetation cooling potential under maximum biological load, targeted sensitivity tests under April-representative LAI values (Section 3.2.2 and Section 4.1) have shown that the complexity threshold and the superiority of the dual-layer structure are robust to seasonal LAI changes. This conservative approach to parameterisation is a stress test: if the radiation–ventilation trade-off and the consequent heat trap effect remain under maximum foliage load, the threshold mechanisms are likely to be more pronounced under realistic transitional-season LAI conditions. The LAI sensitivity tests thus partly extend the inference beyond the April window, although they do not substitute for full seasonal forcing. However, future research should include seasonally dynamic LAI profiles coupled with extreme summer and winter meteorological forcing to better quantify the threshold values across the full annual cycle.
Future studies should overcome these limitations in strategic ways. In particular, field measurements of PET and Tmrt at the pedestrian level should be performed for typical vegetation setups. In addition, future studies should incorporate dynamic phenological information to better understand the seasonal dynamics of thermal comfort. Finally, simulations should be extended to consider seasonal dynamics and growth, and should be coupled with Computational Fluid Dynamics (CFD) models to supplement the ENVI-met results. ART in this study functions both as a quantitative descriptor of tree planting density and as a qualitative descriptor of landscape spatial typology (open, semi-open or enclosed). It is therefore not intended as a comprehensive canopy-geometry index; crown-level attributes such as crown width and LAD are captured through species selection rather than through ART itself. Future work could develop composite descriptors that integrate ART-based spatial typology with canopy-level geometric attributes, which may improve predictive power in mixed-species rural settings. While this study focuses on pedestrian-height (1.5 m) thermal conditions in line with the OTC research paradigm, ecology-oriented vertical profile analyses of canopy-scale radiative and aerodynamic processes would complement the present analysis and are identified as a direction for future research.

4.4. Practical Design Implications

The integration of simulation results with behavioural findings offers the following recommendations for rural designers.
Vertical stratification should employ a two-tiered approach with tall and medium-sized trees. This approach adopts a shaded canopy and open understory approach, striking a balance between Tmrt and Va.
Planting density should be calibrated using variable ART values for different spatial forms. Dense planting (ART ≈ 2.0–2.5) should be applied in large open spaces. In contrast, lower planting densities (ART ≈ 1.0–1.5) should be adopted in linear streets to allow for free air movement.
In terms of species selection, preference should be afforded to trees with tall stature, high branching and a wide crown spread. This approach strikes a balance between shading and ventilation.

5. Conclusions

This study demonstrates that vegetation cooling efficiency in high-SVF rural environments follows a unimodal—rather than monotonic—relationship with structural complexity, with an inflection point near a greenery coverage of 38% and beyond a dual-layer canopy. Beyond this threshold, mean ΔTmrt declined from 23.16 °C (dual-layer, S12) to 21.10 °C (triple-layer, S14), as the long-wave radiation regime shifted from net cooling (−1.81 K/h) to near-neutral (+0.04 K/h) and the aerodynamic resistance of the added understory suppressed pedestrian ventilation.
Three findings emerge from this analysis. First, radiative regulation is the dominant cooling mechanism in rural high-SVF environments, with canopy coverage and spatial-enclosure metrics (PGC and ART) showing the strongest independent associations with ΔPET. Second, the complexity threshold is driven by a radiation–ventilation trade-off in which dense multi-layer assemblages convert the long-wave radiative regime from cooling toward heating while suppressing near-surface airflow. Third, the optimum is reached by a dual-layer “shaded canopy, permeable understory” structure, in which tall and medium trees intercept radiation aloft while the open understory preserves pedestrian-level ventilation.
These findings indicate that rural OTC optimisation is governed by structural efficiency rather than greening volume, refining the prevailing greening paradigm inherited from urban research. The resulting design strategy—vertically stratified canopies with permeable understories, calibrated planting density for spatial context, and species selection favouring tall stature with high under-branch height—provides an affordable, locally implementable approach to climate-adaptive renewal of ageing villages in China’s cold regions. The applicability of these recommendations is bounded by the climatic and morphological context examined: a temperate continental cold region (Köppen Dwa), the radiation-dominated transitional season, and low-density rural settlements with high SVF (0.77–0.90). Future research should test the transferability of this threshold under contrasting climates and seasons, and incorporate elderly-specific thermal perception metrics to refine the design recommendations.

Supplementary Materials

The following supporting information can be downloaded at: https://www.mdpi.com/article/10.3390/atmos17060563/s1, Atmospheric Boundary Conditions; S1–S17.

Author Contributions

Conceptualisation, P.G. and A.A.G.; methodology, P.G. and Z.L.; investigation, P.G.; writing—original draft preparation, P.G. and Z.L.; writing—review and editing, A.A.G.; supervision, A.A.G.; funding acquisition, P.G. All authors have read and agreed to the published version of the manuscript.

Funding

This research was supported by the Soft Science Research Project of Henan Province (Henan Provincial Department of Science and Technology Grant No. 262400411404), titled “Research on Multidimensional Value Mining and Digital Reproduction Path of Yin-Shang Cultural Heritage Empowered by AIGC Technology.”.

Institutional Review Board Statement

Not applicable.

Informed Consent Statement

Not applicable.

Data Availability Statement

The simulation data, ENVI-met model configurations, and analysis code that support the findings of this study are openly available on GitHub at https://github.com/gp-1010/20260501.git (accessed on 25 May 2026). The full microclimate dataset is also provided as Supplementary Material.

Acknowledgments

During the preparation of this manuscript, the authors used generative AI tools for the purposes of language refinement and format checking. The authors have reviewed and edited the output and take full responsibility for the content of this publication.

Conflicts of Interest

The authors declare no conflicts of interest.

Abbreviations

The following abbreviations are used in this manuscript:
NbSNature-based Solutions
OTCOutdoor Thermal Comfort
LADleaf area density
PETPhysiological Equivalent Temperature
EWeast–west street
NSnorth–south street
SQfitness open square
GLgreen land
SVFsky view factor
Tmrtmean radiant temperature
Tgglobe temperature
Vawind speed
Taair temperature
ARTaspect ratio of trees
LAIleaf area index
PGCpercentage of greenery coverage
UBHunder-branch height
CFDcomputational fluid dynamics

References

  1. Jin, Y.; Yoon, H. Evaluating Planting Strategies for Outdoor Thermal Comfort in High-Rise Residential Complexes: A Computational Fluid Dynamics Simulation Study. Environ. Sci. Pollut. Res. 2023, 30, 88641–88663. [Google Scholar] [CrossRef]
  2. Zhang, H.; Chen, Y.; Rui, J.; Yoshino, H.; Zhang, J.; Chen, X.; Liu, J. Effects of Thermal Environment on Elderly in Urban and Rural Houses during Heating Season in a Severe Cold Region of China. Energy Build. 2019, 198, 61–74. [Google Scholar] [CrossRef]
  3. Yin, J.; Wang, D.; Li, H. Spatial Optimization of Rural Settlements in Ecologically Fragile Regions: Insights from a Social-Ecological System. Habitat Int. 2023, 138, 102854. [Google Scholar] [CrossRef]
  4. Wang, H.; Shi, C.; Li, W.; Wang, L.; Wang, J.; Wang, G.; Hu, S. Field Investigation on Thermal Environment and Comfort of People in a Coastal Village of Qingdao (China) during Winter. Build. Environ. 2021, 191, 107585. [Google Scholar] [CrossRef]
  5. Yuan, T.; Hong, B.; Qu, H.; Liu, A.; Zheng, Y. Outdoor Thermal Comfort in Urban and Rural Open Spaces: A Comparative Study in China’s Cold Region. Urban Clim. 2023, 49, 101501. [Google Scholar] [CrossRef]
  6. Seddon, N.; Smith, A.; Smith, P.; Key, I.; Chausson, A.; Girardin, C.; House, J.; Srivastava, S.; Turner, B. Getting the Message Right on Nature-Based Solutions to Climate Change. Glob. Change Biol. 2021, 27, 1518–1546. [Google Scholar] [CrossRef]
  7. Fung, C.K.W.; Jim, C.Y. Assessing the Cooling Effects of Different Vegetation Settings in a Hong Kong Golf Course. Procedia Environ. Sci. 2017, 37, 626–636. [Google Scholar] [CrossRef]
  8. Kántor, N.; Chen, L.; Gál, C.V. Human-Biometeorological Significance of Shading in Urban Public Spaces—Summertime Measurements in Pécs, Hungary. Landsc. Urban Plan. 2018, 170, 241–255. [Google Scholar] [CrossRef]
  9. Morakinyo, T.E.; Ouyang, W.; Lau, K.K.-L.; Ren, C.; Ng, E. Right Tree, Right Place (Urban Canyon): Tree Species Selection Approach for Optimum Urban Heat Mitigation—Development and Evaluation. Sci. Total Environ. 2020, 719, 137461. [Google Scholar] [CrossRef]
  10. Moss, J.L.; Doick, K.J.; Smith, S.; Shahrestani, M. Influence of Evaporative Cooling by Urban Forests on Cooling Demand in Cities. Urban For. Urban Green. 2019, 37, 65–73. [Google Scholar] [CrossRef]
  11. Yang, Y.; Zhou, D.; Gao, W.; Zhang, Z.; Chen, W.; Peng, W. Simulation on the Impacts of the Street Tree Pattern on Built Summer Thermal Comfort in Cold Region of China. Sustain. Cities Soc. 2018, 37, 563–580. [Google Scholar] [CrossRef]
  12. Lai, D.; Liu, W.; Gan, T.; Liu, K.; Chen, Q. A Review of Mitigating Strategies to Improve the Thermal Environment and Thermal Comfort in Urban Outdoor Spaces. Sci. Total Environ. 2019, 661, 337–353. [Google Scholar] [CrossRef]
  13. Ding, Z.; Gu, J. From Coverage to Shadows: How Nonlinear Vegetation-Building Synergy Reshape Urban Cooling. Urban Clim. 2025, 63, 102573. [Google Scholar] [CrossRef]
  14. Gai, Z.; Yin, H.; Kong, F.; Su, J.; Shen, Z.; Sun, H.; Yang, S.; Liu, H.; Middel, A. How Does Shade Infrastructure Affect Outdoor Thermal Comfort during Hot, Humid Summers? Evidence from Nanjing, China. Build. Environ. 2025, 267, 112320. [Google Scholar] [CrossRef]
  15. Potchter, O.; Cohen, P.; Lin, T.-P.; Matzarakis, A. Outdoor Human Thermal Perception in Various Climates: A Comprehensive Review of Approaches, Methods and Quantification. Sci. Total Environ. 2018, 631–632, 390–406. [Google Scholar] [CrossRef] [PubMed]
  16. Roy, T.B.; Middey, A.; Krupadam, R.J. Unveiling the Microclimate: A Comprehensive Review of Tools, Techniques, and Future Directions for Sustainable Cities. Build. Environ. 2025, 274, 112726. [Google Scholar] [CrossRef]
  17. Liu, Z.; Cheng, K.Y.; Sinsel, T.; Simon, H.; Jim, C.Y.; Morakinyo, T.E.; He, Y.; Yin, S.; Ouyang, W.; Shi, Y.; et al. Modeling Microclimatic Effects of Trees and Green Roofs/Façades in ENVI-Met: Sensitivity Tests and Proposed Model Library. Build. Environ. 2023, 244, 110759. [Google Scholar] [CrossRef]
  18. Gomaa, M.M.; Nabil, J.; Berkouk, D.; Ragab, A. A Comparative Study of Vegetation Strategies for Outdoor Thermal Comfort in High- and Low-Density Urban Areas. Urban Sci. 2025, 9, 416. [Google Scholar] [CrossRef]
  19. Dong, J.; Lin, M.; Zuo, J.; Lin, T.; Liu, J.; Sun, C.; Luo, J. Quantitative Study on the Cooling Effect of Green Roofs in a High-Density Urban Area—A Case Study of Xiamen, China. J. Clean. Prod. 2020, 255, 120152. [Google Scholar] [CrossRef]
  20. Kim, J.; Lee, D.-K.; Brown, R.D.; Kim, S.; Kim, J.-H.; Sung, S. The Effect of Extremely Low Sky View Factor on Land Surface Temperatures in Urban Residential Areas. Sustain. Cities Soc. 2022, 80, 103799. [Google Scholar] [CrossRef]
  21. Tousi, E.; Mela, A.; Tseliou, A. Nature-Based Urbanism for Enhancing Senior Citizens’ Outdoor Thermal Comfort in High-Density Mediterranean Cities: ENVI-Met Findings. Urban Sci. 2025, 9, 152. [Google Scholar] [CrossRef]
  22. Wai, C.Y.; Tariq, M.A.U.R.; Muttil, N.; Wai, C.Y.; Tariq, M.A.U.R.; Muttil, N. A Systematic Review on the Existing Research, Practices, and Prospects Regarding Urban Green Infrastructure for Thermal Comfort in a High-Density Urban Context. Water 2022, 14, 2496. [Google Scholar] [CrossRef]
  23. Aghamolaei, R.; Lak, A. Outdoor Thermal Comfort for Active Ageing in Urban Open Spaces: Reviewing the Concepts and Parameters. Ageing Int. 2023, 48, 438–451. [Google Scholar] [CrossRef]
  24. Ma, X.; Tian, Y.; Du, M.; Hong, B.; Lin, B. How to Design Comfortable Open Spaces for the Elderly? Implications of Their Thermal Perceptions in an Urban Park. Sci. Total Environ. 2021, 768, 144985. [Google Scholar] [CrossRef]
  25. Xiong, Y.; Liu, J.; Kim, J. Understanding Differences in Thermal Comfort between Urban and Rural Residents in Hot Summer and Cold Winter Climate. Build. Environ. 2019, 165, 106393. [Google Scholar] [CrossRef]
  26. He, X.; Shao, L.; Tang, Y.; Hao, L.; He, X.; Shao, L.; Tang, Y.; Hao, L. Understanding Outdoor Cold Stress and Thermal Perception of the Elderly in Severely Cold Climates: A Case Study in Harbin. Land 2024, 13, 864. [Google Scholar] [CrossRef]
  27. Qin, H.; Zhou, B. Optimizing Vegetation Configurations for Seasonal Thermal Comfort in Campus Courtyards: An ENVI-Met Study in Hot Summer and Cold Winter Climates. Plants 2025, 14, 1670. [Google Scholar] [CrossRef]
  28. Jiao, Y.; Yu, H.; Yu, Y.; Wang, Z.; Wei, Q. Adaptive Thermal Comfort Models for Homes for Older People in Shanghai, China. Energy Build. 2020, 215, 109918. [Google Scholar] [CrossRef]
  29. Chow, W.T.L.; Akbar, S.N.A.B.A.; Heng, S.L.; Roth, M. Assessment of Measured and Perceived Microclimates within a Tropical Urban Forest. Urban For. Urban Green. 2016, 16, 62–75. [Google Scholar] [CrossRef]
  30. Kato-Huerta, J.; Geneletti, D. Environmental Justice Implications of Nature-Based Solutions in Urban Areas: A Systematic Review of Approaches, Indicators, and Outcomes. Environ. Sci. Policy 2022, 138, 122–133. [Google Scholar] [CrossRef]
  31. Guo, F.; Wang, Z.; Dong, J.; Zhang, H.; Lu, X.; Lau, S.S.Y.; Miao, Y. Spatial Differences in Outdoor Thermal Comfort during the Transition Season in Cold Regions of China. Buildings 2022, 12, 720. [Google Scholar] [CrossRef]
  32. Zhang, H.; Wang, Y.; Guo, F.; Zhao, J.; Dong, J.; Zhu, P. Factors Influencing Outdoor Thermal Comfort in a Coastal Park during the Transition Seasons in Cold Regions of China. Urban Clim. 2024, 55, 101856. [Google Scholar] [CrossRef]
  33. Zheng, W.; Shao, T.; Lin, Y.; Wang, Y.; Dong, C.; Liu, J. A Field Study on Seasonal Adaptive Thermal Comfort of the Elderly in Nursing Homes in Xi’an, China. Build. Environ. 2022, 208, 108623. [Google Scholar] [CrossRef]
  34. Bruse, M.; Fleer, H. Simulating Surface–Plant–Air Interactions inside Urban Environments with a Three Dimensional Numerical Model. Environ. Model. Softw. 1998, 13, 373–384. [Google Scholar] [CrossRef]
  35. Tsoka, S.; Tsikaloudaki, A.; Theodosiou, T. Analyzing the ENVI-Met Microclimate Model’s Performance and Assessing Cool Materials and Urban Vegetation Applications—A Review. Sustain. Cities Soc. 2018, 43, 55–76. [Google Scholar] [CrossRef]
  36. Liu, S.; Middel, A.; Fang, X.; Wu, R. ENVI-Met Model Performance Evaluation for Courtyard Simulations in Hot-Humid Climates. Urban Clim. 2024, 55, 101909. [Google Scholar] [CrossRef]
  37. Paronetto, J.S.; Díaz Villa, M.V.E.; Cagnone, M.F.; Carrizo, S.R.; Madanes, N.; Goldstein, G.; Lacoretz, M.V.; Cristiano, P.M. Impact of Ligustrum Lucidum Invasion on the Structure and Functioning of Coastal Dry Forests: A Case Study from Argentina. Can. J. For. Res. 2025, 55, 1–12. [Google Scholar] [CrossRef]
  38. Yang, B.; Lee, D.K.; Heo, H.K.; Biging, G. The Effects of Tree Characteristics on Rainfall Interception in Urban Areas. Landsc. Ecol. Eng. 2019, 15, 289–296. [Google Scholar] [CrossRef]
  39. Zhang, L.; Zhan, Q.; Lan, Y. Effects of the Tree Distribution and Species on Outdoor Environment Conditions in a Hot Summer and Cold Winter Zone: A Case Study in Wuhan Residential Quarters. Build. Environ. 2018, 130, 27–39. [Google Scholar] [CrossRef]
  40. ISO 7726; Ergonomics of the Thermal Environment—Instruments for Measuring and Monitoring Physical Quantities. International Organization for Standardization: Geneva, Switzerland, 2025.
  41. Ali-Toudert, F.; Mayer, H. Effects of Asymmetry, Galleries, Overhanging Façades and Vegetation on Thermal Comfort in Urban Street Canyons. Sol. Energy 2007, 81, 742–754. [Google Scholar] [CrossRef]
  42. Cohen, P.; Potchter, O.; Matzarakis, A. Daily and Seasonal Climatic Conditions of Green Urban Open Spaces in the Mediterranean Climate and Their Impact on Human Comfort. Build. Environ. 2012, 51, 285–295. [Google Scholar] [CrossRef]
  43. Xu, M.; Hong, B.; Mi, J.; Yan, S. Outdoor Thermal Comfort in an Urban Park during Winter in Cold Regions of China. Sustain. Cities Soc. 2018, 43, 208–220. [Google Scholar] [CrossRef]
  44. Chen, T.; Yang, H.; Chen, G.; Lam, C.K.C.; Hang, J.; Wang, X.; Liu, Y.; Ling, H. Integrated Impacts of Tree Planting and Aspect Ratios on Thermal Environment in Street Canyons by Scaled Outdoor Experiments. Sci. Total Environ. 2021, 764, 142920. [Google Scholar] [CrossRef]
  45. Hong, B.; Lin, B. Numerical Studies of the Outdoor Wind Environment and Thermal Comfort at Pedestrian Level in Housing Blocks with Different Building Layout Patterns and Trees Arrangement. Renew. Energy 2015, 73, 18–27. [Google Scholar] [CrossRef]
  46. Jaganmohan, M.; Knapp, S.; Buchmann, C.M.; Schwarz, N. The Bigger, the Better? The Influence of Urban Green Space Design on Cooling Effects for Residential Areas. J. Environ. Qual. 2016, 45, 134–145. [Google Scholar] [CrossRef] [PubMed]
  47. Fan, Q.; Du, F.; Li, H.; Zhang, C. Thermal-Comfort Evaluation of and Plan for Public Space of Maling Village, Henan, China. PLoS ONE 2021, 16, e0256439. [Google Scholar] [CrossRef] [PubMed]
  48. Cheng, Y.; Liu, X.; Zeng, Z.; Liu, S.; Wang, Z.; Tang, X.; He, B.-J. Impacts of Water Bodies on Microclimates and Outdoor Thermal Comfort: Implications for Sustainable Rural Revitalization. Front. Environ. Sci. 2022, 10, 940482. [Google Scholar] [CrossRef]
Figure 1. Geographical location, meteorological forcing, and simulation domain of Xixin Village.
Atmosphere 17 00563 g001
Figure 2. Model Calibration and Validation.
Atmosphere 17 00563 g002
Figure 3. Scenario 1 Model and Simulation Results (PET).
Atmosphere 17 00563 g003
Figure 4. Scenario 2–10 Simulation Results (PET).
Atmosphere 17 00563 g004
Figure 5. Tree Arrangement Parameters and OTC Heat Map.
Atmosphere 17 00563 g005
Figure 6. Quantitative Evaluation of Multi-layered Vegetation Performance.
Atmosphere 17 00563 g006
Figure 7. Spatial Visualisation of Structural Complexity Thresholds.
Atmosphere 17 00563 g007
Figure 8. Thermodynamic mechanism analysis of vegetation structural complexity.
Atmosphere 17 00563 g008
Table 1. Morphological characteristics and SVF of the four representative sample sites.
SiteSite PhotosSVFSite Characteristic
EW StreetAtmosphere 17 00563 i001Atmosphere 17 00563 i002
SVF = 0.89
East–west orientation, width 5 m, building height 3.5 m, low height-to-width ratio (H/W ≈ 0.7); concrete base surface (Albedo = 0.30); extremely low building shading effectiveness.
NS StreetAtmosphere 17 00563 i003Atmosphere 17 00563 i004
SVF = 0.77
North–south orientation, width 3 m, building height 7 m, height-to-width ratio (H/W ≈ 2.33); concrete base surface (Albedo = 0.30); significant geometric shading effect.
Fitness Open SQAtmosphere 17 00563 i005Atmosphere 17 00563 i006
SVF = 0.90
Open irregular plaza with concrete and Dutch brick paving (Albedo = 0.30); surrounding buildings 3.5–7 m; extremely high radiation exposure intensity.
Green LandAtmosphere 17 00563 i007Atmosphere 17 00563 i008
SVF = 0.85
Open layout dominated by groundcover plants and shrubs, with scattered trees; well-ventilated but lacking continuous shade.
Table 5. Scenario 1 Simulation Results Detailed Data.
ScenarioSitePET (°C)Va (m/s)Ta (°C)Tmrt (°C)RH (%)
S1SQ34.511.7125.4156.6943.89
GL38.740.6525.5056.3043.77
EW31.102.3825.7152.5243.10
NS29.022.9225.6950.3643.17
Mean33.341.91525.5853.9743.48
Table 6. Summary of microclimatic regulation performance for single-species scenarios (Mean values).
ScenarioTree TypeDensity
(ART)
ΔPET
(°C)
ΔTmrt
(°C)
ΔVa
(m/s)
ΔTa
(°C)
Efficiency Note
S2Short TreeLow (0.75)0.843.43−0.210.08Minimal impact
S3Short TreeMed (1.5)2.445.46−0.170.14
S4Short TreeHigh (2.5)5.528.98+0.490.28Density dependent
S5Medium TreeLow (0.75)4.7710.22−0.120.22
S6Medium TreeMed (1.5)6.2414.24−0.20.37Balanced
S7Medium TreeHigh (2.5)7.8918.23−0.20.51High efficiency
S8Tall TreeLow (0.75)4.377.73+0.330.27
S9Tall TreeMed (1.5)6.6912.93+0.390.46
S10Tall TreeHigh (2.5)8.0415.87+0.490.56High shading
Table 7. Tree Arrangement Parameters in the Model.
NOTree SizeHeight
(m)
Crown Diameter
(m)
UBH
(m)
LAI
(m2/m2)
ARTSpacing
(m)
No. of TreesPGC
(%)
Mean ΔPET
(°C)
1No000000000
2Short42.21.81.650.75611950.84
3Short42.21.81.651.5418082.44
4Short42.21.81.652.52458215.52
5Medium84.52.54.030.751078124.77
6Medium84.52.54.031.56111196.24
7Medium84.52.54.032.54172247.89
8Tall159.03.54.050.752037224.37
9Tall159.03.54.051.51064386.69
10Tall159.03.54.052.5696458.04
Table 8. Performance Summary of Vegetation Combinations (Mean values).
ScenarioCompositionΔPET
(°C)
ΔTmrt
(°C)
ΔVa
(m/s)
ΔTa
(°C)
S11Short + Medium6.5815.13−0.240.4
S12Tall + Medium10.2923.160.450.78
S13Tall + Short8.3616.910.460.58
S14Tall + Med + Short9.6321.100.430.7
S15Tree + Grass6.4414.91−0.250.39
S16Tree + Shrub7.2717.28−0.350.46
S17Tree + Shrub + Grass6.9116.19−0.310.44
Table 9. Sensitivity analysis of Scenarios S12 and S14.
ScenarioLAI ConditionΔPET (°C)ΔTmrt (°C)ΔVa (m/s)
S12Peak-summer LAI10.2923.16+0.45
S12April LAI (sensitivity)8.3015.36+0.68
S14Peak-summer LAI9.6321.10+0.43
S14April LAI (sensitivity)7.5514.24+0.46
Note: April LAI values: Juglans regia = 0.99 (60% of peak); Ginkgo biloba = 1.21 (30% of peak); Styphnolobium japonicum = 1.62 (40% of peak). Positive ΔVa indicates wind speed increase relative to baseline.
Disclaimer/Publisher’s Note: The statements, opinions and data contained in all publications are solely those of the individual author(s) and contributor(s) and not of MDPI and/or the editor(s). MDPI and/or the editor(s) disclaim responsibility for any injury to people or property resulting from any ideas, methods, instructions or products referred to in the content.