Article

A Decadal Risk Assessment of Tourism Meteorological Disasters in Major Scenic Areas of Dayi County, Sichuan Province, China

1
School of Atmospheric Sciences, Plateau Atmosphere and Environment Key Laboratory of Sichuan Province, Chengdu Plain Urban Meteorology and Environment Observation and Research Station of Sichuan Province, Sichuan Province Meteorological Disaster Prediction and Early Warning Engineering Laboratory, Chengdu University of Information Technology, Chengdu 610225, China
2
Dayi County Meteorological Bureau, Dayi 611330, China
*
Authors to whom correspondence should be addressed.
Atmosphere 2026, 17(6), 551; https://doi.org/10.3390/atmos17060551
Submission received: 6 April 2026 / Revised: 25 May 2026 / Accepted: 26 May 2026 / Published: 28 May 2026
(This article belongs to the Special Issue Holocene Climate and Environmental Change in Arid Central Asia)

Abstract

With the rapid growth of tourism in Dayi County over the past decade, this study develops a meteorological disaster risk assessment framework for major tourist attractions in this region. Drawing upon daily precipitation and temperature records from 25 meteorological stations (2014–2023) alongside multi-source geospatial data, we evaluate six primary attractions: Xiling Snow Mountain, Huashuiwan, Anren Ancient Town, Xinchang Ancient Town, Tianfu Huaxigu Valley, and Shujiu Cultural Park. The evaluation model integrates four core dimensions: hazard, environmental sensitivity, asset vulnerability, and disaster mitigation capacity. Indicator weights are determined through the Analytic Hierarchy Process, and GIS-based spatial analysis is employed for risk zonation. Additionally, the 45-year ChinaMet dataset provides independent validation for the long-term stability of the hazard assessment. Results reveal a distinct west-low, east-high composite risk gradient. High-altitude mountainous regions in the west exhibit a lower overall risk. Despite frequent extreme weather events, extensive vegetation coverage and low visitor density effectively buffer the negative impacts of physical hazards. Conversely, tourist attractions on the eastern plains fall within high-risk zones. Concentrated visitor populations, dense built environments, and low-lying terrain collectively amplify exposure to severe rainstorms and extreme heatwaves. These findings demonstrate that meteorological disaster risk in tourism destinations fundamentally arises from the deep coupling of natural and human systems. Thus, this study provides a scientific basis for implementing differentiated disaster prevention, mitigation, and localized emergency management strategies.

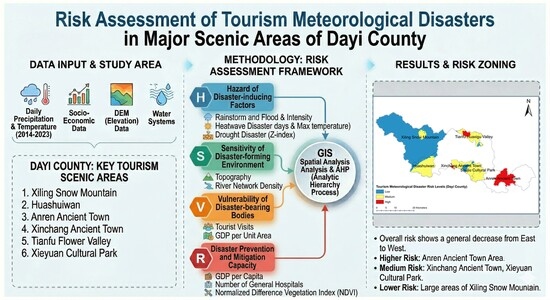
Graphical Abstract

1. Introduction

Climate change stands at the forefront of global scientific and policy agendas. The Sixth Assessment Report of the Intergovernmental Panel on Climate Change (IPCC) indicates a marked global warming trend, significantly increasing both the frequency and intensity of extreme meteorological events [1]. As one of the world’s largest economic sectors, tourism is widely recognized as a highly climate-sensitive industry [2,3]. It confronts heightened exposure to both environmental disruptions and socioeconomic fluctuations driven by shifting climate patterns. Quantitative analyses demonstrate a substantial gap in resilience, showing that tourism’s vulnerability to frequent extreme weather events exceeds the vulnerability of the macroeconomy as a whole [4]. Sudden-onset natural disasters cause severe damage to tourism infrastructure and substantial asset losses [5]. Concurrently, these events negatively affect travel decisions, safety perceptions, and the overall visitor experience [6]. Recent studies have successfully incorporated extreme weather probabilities into tourism climate indices, thereby improving the seasonal alignment between climatic factors and demand fluctuations [7]. This evolution reflects a growing scholarly emphasis on integrating vulnerability and risk mechanisms into tourism geography, safely moving beyond traditional, narrow assessments of climatic suitability alone [8].
Drawing on Regional Disaster System Theory, researchers widely adopt GIS techniques and multi-source data fusion to build region-specific meteorological disaster risk assessment models [9,10]. At the theoretical level, the place-based model addresses spatial uncertainty in community resilience assessments, successfully enhancing local adaptivity [11]. In response to increasingly complex compound disasters, the international research paradigm has shifted from single-hazard evaluation toward coupled multi-hazard assessment grounded in consistent physical drivers. This advanced approach effectively simulates interactions among different hazards and post-disaster recovery processes, thereby preventing fragmented risk estimation [12,13]. Furthermore, integrating social vulnerability with physical exposure represents a mainstream strategy in constructing contemporary disaster risk assessment frameworks [14,15,16]. The IPCC risk-centered framework now serves as a key academic pathway for evaluating climate resilience in tourism systems, offering systematic theoretical support for identifying climate risks and developing adaptive strategies at diverse tourist destinations [17,18].
These theoretical advances have gradually extended into tourism research. Early studies employed GIS techniques mainly to evaluate ecological sensitivity and identify resource suitability in tourism areas, thereby providing quantitative evidence for spatial planning [19,20,21]. Recently, scholars have broadened disaster risk assessment perspectives within tourism systems by integrating exposure, sensitivity, and adaptive capacity. Such updated frameworks successfully address multiple hazards, including coastal flooding [22], mountain landslides [23], and vulnerability in mountain tourism landscapes [24]. For example, Mitrică et al. assessed tourism climate vulnerability at the local administrative unit scale in Romania, effectively delineating climate-sensitive tourism zones [25]. Manisha et al. utilized remote sensing and GIS to examine tourism vulnerability in Himachal Pradesh, India [26,27]. Their findings indicate that vulnerability patterns arise from the complex interaction of exposure, sensitivity, and adaptive capacity rather than from individual hazards. Agulles et al. similarly observed a strong buffering mechanism in Mediterranean destinations, showing that exposure and vulnerability moderate tourism risk more strongly than changes in physical hazard drivers [28].
Collectively, these previous studies furnish critical methodological references. However, three primary gaps remain in the current literature. First, most existing work comprises single-hazard assessments or general vulnerability evaluations, leaving integrated multi-hazard assessments of rainstorms, extreme heat, and drought within individual tourism regions highly limited. Second, conventional assessment units typically correspond to broad administrative divisions or natural geographic zones. Thus, risk zoning studies focusing directly on specific scenic areas to serve management decisions remain inadequate. Third, multi-hazard meteorological risk assessments at the county scale across mountain-plain transition zones are rare, particularly in areas characterized by extreme elevation gradients and high spatial heterogeneity in meteorological conditions.
Addressing these limitations, this study selects Dayi County, Chengdu, Sichuan Province, China, as a representative case for a county-level tourism meteorological disaster risk assessment. Designated as a “Tianfu Famous Tourism County,” Dayi was established during the Tang Dynasty over 1300 years ago and retains a profound cultural heritage. Its terrain is exceptionally complex with a steep elevation gradient, rising sharply from approximately 475 m in the eastern plains to 5310 m at Daxuetang Peak in the west. This massive vertical relief produces marked localized climate characteristics, leading to the coexistence of severe rainstorms, flash floods, landslides, and extreme heatwaves. As a county utilizing cultural tourism as an economic pillar, Dayi relies heavily on this sector. In 2023, the county hosted 12.4575 million visitors and generated tourism revenue of approximately US$1.124 billion, contributing 23.67% of the local gross domestic product. Over the past decade, the county’s comprehensive tourism master plan has driven sustained industry growth. Notably, the Xiling Snow Mountain-Huashuiwan Tourism Resort was designated a provincial resort in 2013 and successfully attained national resort status in 2024. However, expanding tourism operations and concentrated cultural assets have significantly amplified local risk exposure. The previous absence of fine-scale assessments means that multi-hazard compound risks in the county remain scientifically unquantified. Therefore, this study draws upon observed meteorological station data (2014–2023) and relevant socioeconomic data to construct a tailored meteorological disaster risk assessment system for the tourism areas of Dayi County. A GIS-based spatial model performs the calculation to produce a risk zonation map for the current phase of rapid tourism development. Ultimately, the findings aim to provide solid scientific evidence and decision-making support for local authorities to enhance disaster prevention capacity and strengthen infrastructure resilience across major scenic areas.

2. Data and Methods

2.1. Overview of the Study Area

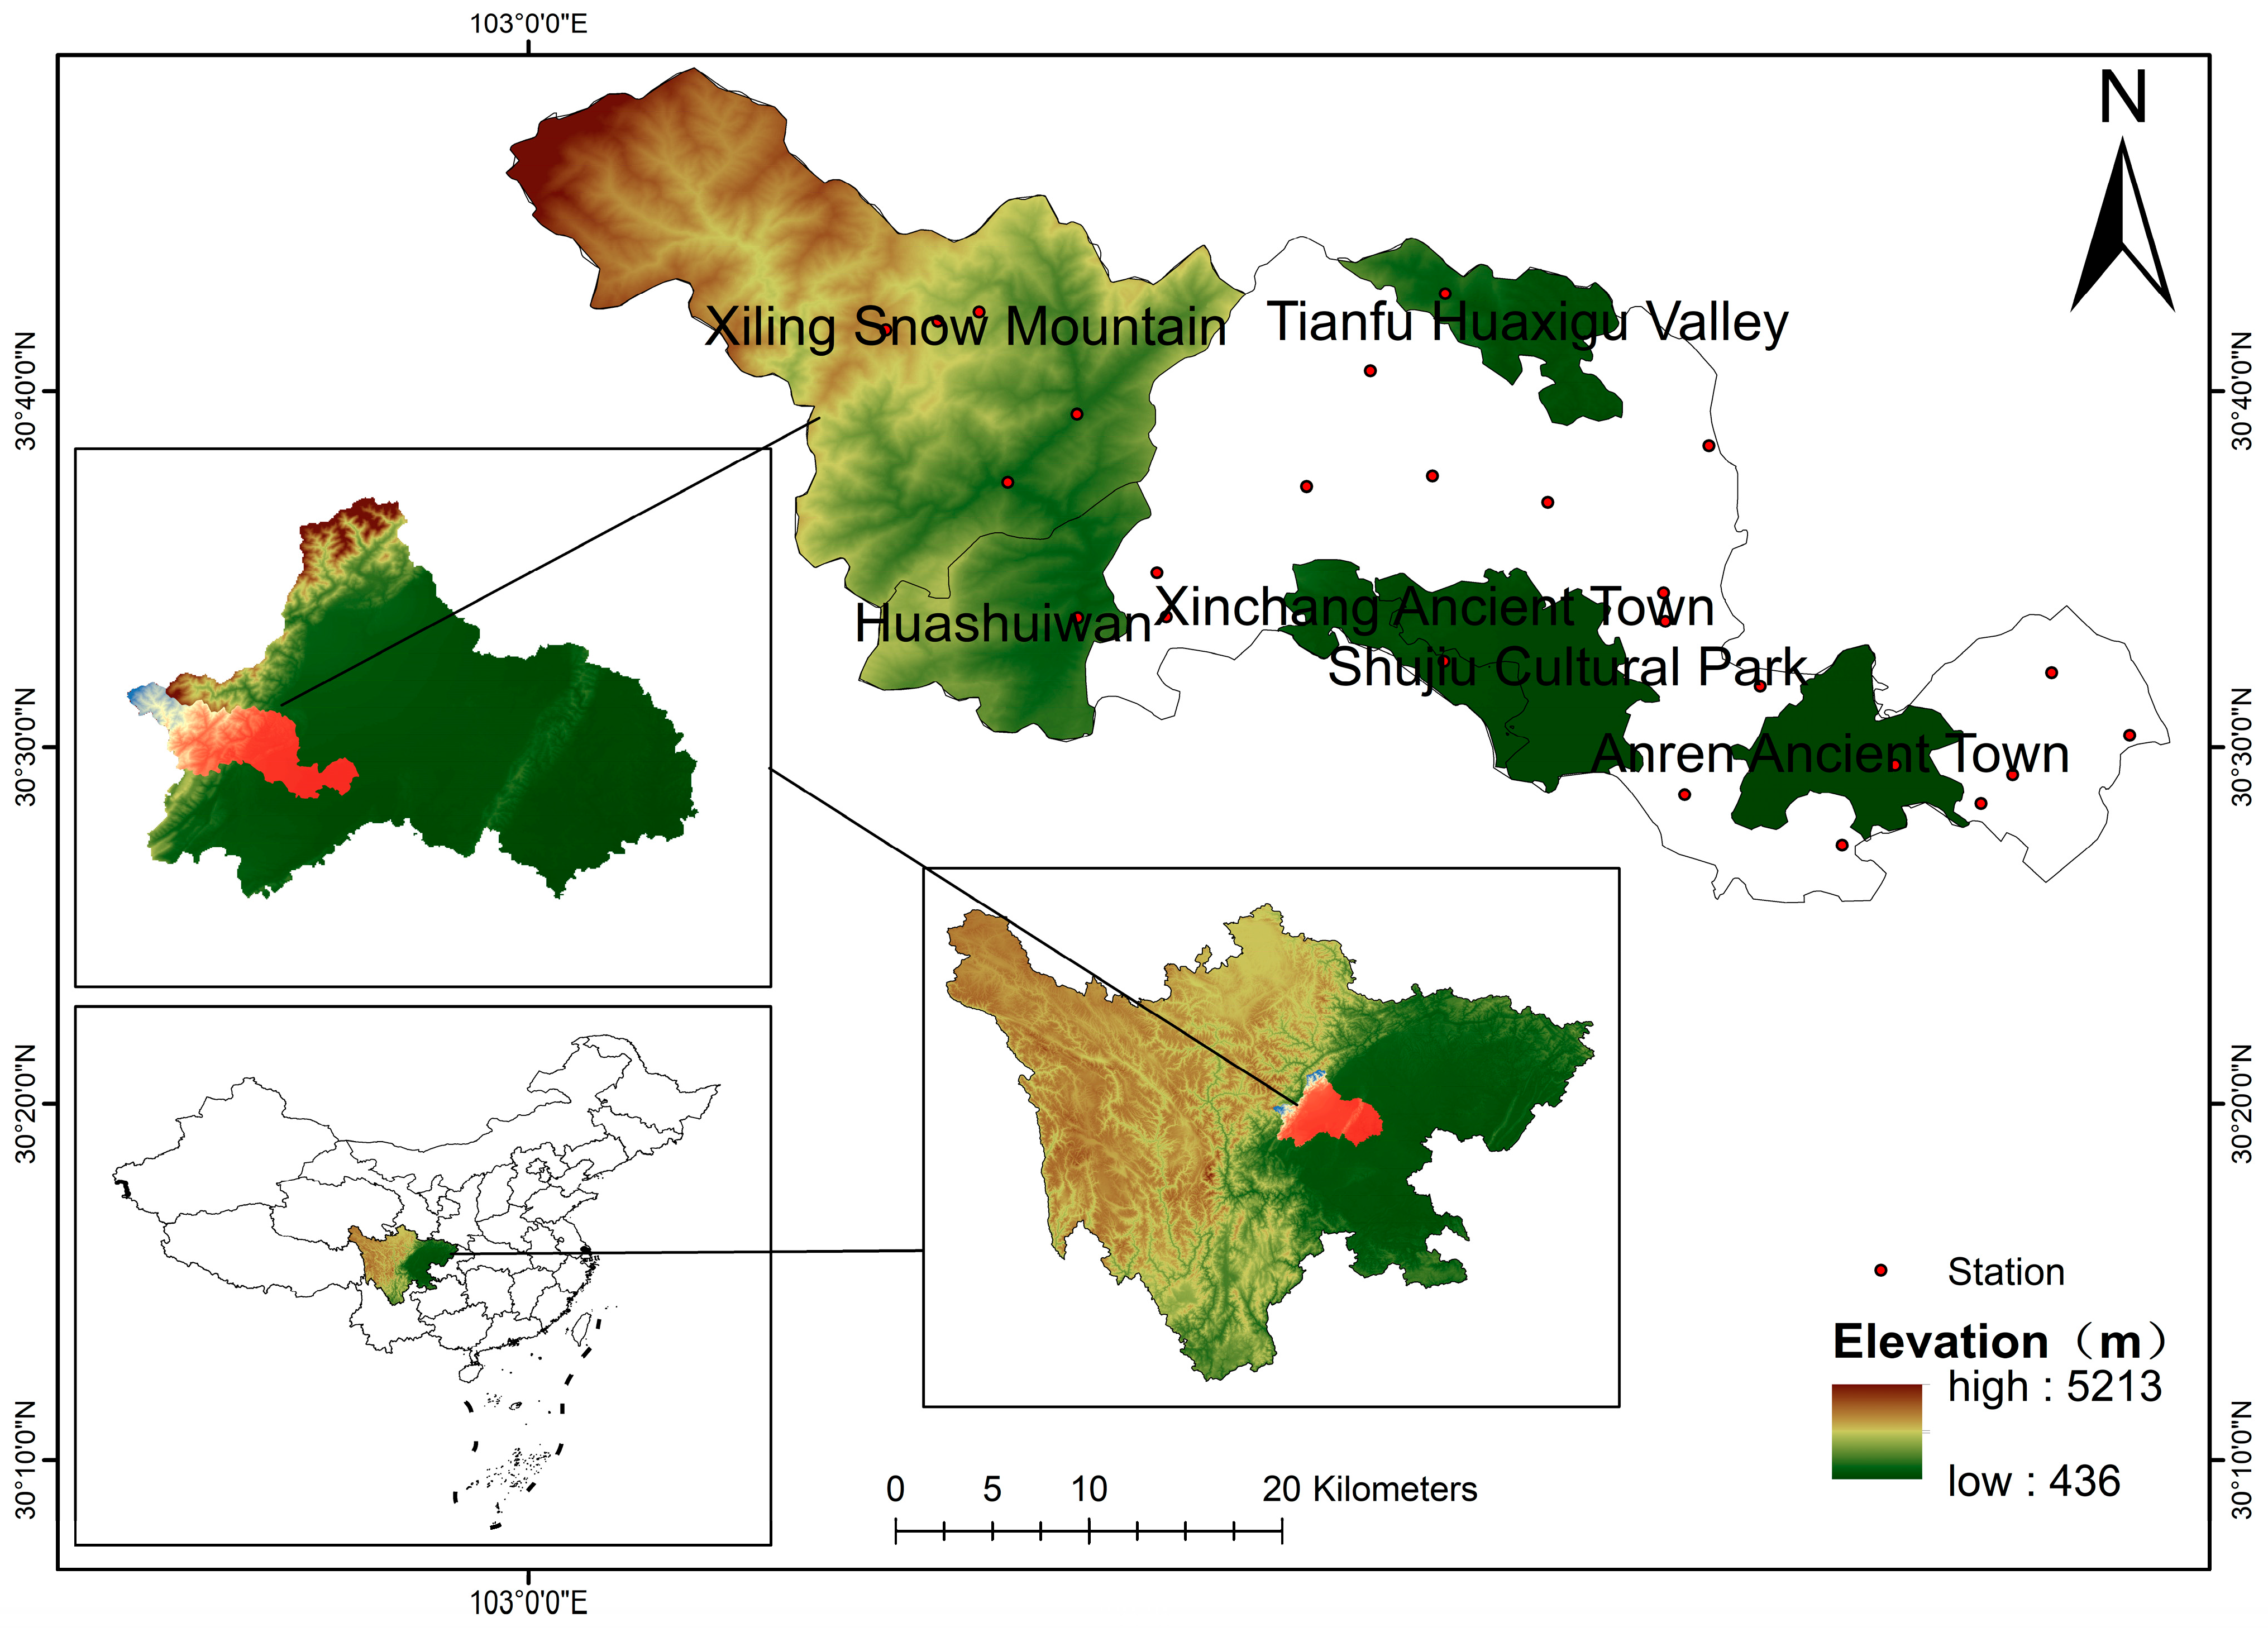
Dayi County (102°59′–103°45′ E, 30°25′–30°49′ N) is situated on the western margin of the Sichuan Basin (Figure 1). Its terrain slopes downward from the northwest to the southeast. Under a subtropical humid climate, the region receives an average annual precipitation of approximately 1500 mm, mostly concentrated from June to September. Topographic features drive significant climate variations across altitudes. In low-mountain areas (1000–2000 m), the annual mean temperature ranges from 7.5 °C to 12.0 °C with an extreme minimum of −5 °C. In mid-mountain areas (2000–3000 m), snow cover persists for two to three months. In high-mountain zones (above 3500 m), the annual mean temperature drops below 0 °C. with year-round snow cover. Furthermore, topographic uplift causes frequent fog and high humidity. Consequently, the average relative humidity stays above 83% from July to October, but the annual sunshine duration is short at about 648.8 h. The county holds 990 million cubic meters of water resources. This abundant drainage system flows from west to east, and together with the distinct vertical climate variations, these factors collectively sustain the local tourism resources.
This study focuses on six major tourist attractions within the county: Xiling Snow Mountain, Huashuiwan, Anren Ancient Town, Xinchang Ancient Town, Tianfu Huaxigu, and Shujiu Cultural Park. For tourism meteorological disaster risk zonation, township boundaries serve as the assessment units in place of scenic area perimeters. This choice reflects three considerations. First, several scenic areas are too small to support standalone grid-based spatial analysis, which risks edge effects. Townships border these attractions closely, and local climate and topographic conditions within townships mirror those of the scenic areas. Meteorological disaster impacts thus exhibit regional consistency. Second, tourist activities including accommodation, dining, transport, and recreation demonstrate significant spatial spillover effects, often extending into surrounding townships. Township units therefore capture the actual exposure range of affected elements more accurately. Third, township-level analysis facilitates the collection and processing of both meteorological and socioeconomic data. This approach enables a more comprehensive evaluation of disaster impacts on tourism areas and supports targeted recommendations for disaster prevention and tourism development by local government and tourism management authorities.

2.2. Data Sources

The meteorological data used in this study include daily precipitation and temperature observation data from 2014 to 2023, collected from 25 meteorological observation stations within Dayi County and provided by the Dayi County Meteorological Bureau (Figure 1). Given that the meteorological stations are distributed across the various scenic areas within the county, the data were extracted from each station and converted into continuous spatial raster surfaces using spatial interpolation algorithms in ArcGIS 10.8 (ESRI, Redlands, CA, USA), thereby accurately characterizing the spatial distribution features of the meteorological elements. To reflect the tourism carrying pressure under normal conditions, statistical data from the pre-COVID-19 period (2019) were selected for evaluation. The tourist arrivals and land area for each township were obtained from the Dayi County Statistical Yearbook. Additionally, the DEM (digital elevation model) elevation data, gross domestic product (GDP) per unit area, river network data, number of general hospitals, and Normalized Difference Vegetation Index (NDVI) for Dayi County were acquired from the Earth Resource Data Cloud (http://gis5g.com).
Additionally, this study incorporates the China High-resolution Multi-element Meteorological Driving Dataset (ChinaMet) [29,30], provided by the National Cryosphere Desert Data Center (http://www.ncdc.ac.cn). This dataset features a spatial resolution of 0.01° and covers the period 1980–2024. It was developed through the fusion of satellite precipitation products—including IMERG, SM2RAIN-ASCAT, and CMORPH—along with ERA5-Land reanalysis data and observations from over 2000 meteorological stations across China. Machine learning algorithms and spatial downscaling techniques underpin its construction. This study extracts daily precipitation and temperature variables from ChinaMet. Using identical indicators and weights to those applied in the station-based analysis, we independently compute the hazard of disaster-causing factors for three hazard types: rainstorms, drought, and extreme heat. These results are then compared against those derived from station data (2014–2023) to evaluate the reliability of the hazard zonation outputs.

2.3. Methodology

Considering both the natural attributes of local meteorological hazards and their social impacts on the tourism industry, a meteorological disaster risk assessment system was constructed for major tourist attractions in Dayi County, comprising four components: Hazard (H), Environmental Sensitivity (S), Vulnerability (V), and Disaster Prevention and Mitigation Capacity (C) (Table 1). To determine indicator weights, the Analytic Hierarchy Process (AHP) was applied to construct judgment matrices through pairwise comparisons. All weight coefficients subsequently underwent a consistency check [31]. The consistency ratios (CR) for the criterion layer, hazard dimension, environmental sensitivity, asset vulnerability, and mitigation capacity were 0.0026, 0.0000, 0.0009, 0.0000, and 0.0000, respectively. These values remain well below the critical threshold of 0.10, confirming the validity of the weight assignments. Accordingly, a weighted evaluation model for the meteorological disaster risk at major tourist attractions in Dayi County was constructed as follows:
R = 0.44 · H + 0.23 · S + 0.22 · V + 0.11 · ( 1 C )
To eliminate the dimensional and magnitude differences among the various evaluation indicators, a data standardization method was used to de-dimensionalize the original data. For positive indicators, where higher values indicate higher risks, the standardization formula is x = ( x x m i n ) / ( x m a x x m i n ) . For negative indicators, where higher values indicate lower risks (such as disaster prevention and mitigation capacity), the inverse standardization formula x = ( x m a x x ) / ( x m a x x m i n ) was applied. In these formulas, x represents the original value of the indicator; x m a x and x m i n are the minimum and maximum values of the corresponding data series, respectively; and x is the standardized value mapped to the range [0, 1].
In the calculation of specific evaluation components, the Hazard indicator primarily focuses on the frequent rainstorms and floods, heatwaves, and droughts in Dayi County. The hazard of rainstorms and floods is mainly determined by precipitation intensity and frequency [32]. According to the rainstorm standards of the Sichuan Provincial Meteorological Bureau, a precipitation event with a daily rainfall of ≥50 mm (≥30 mm for the Western Sichuan Plateau region) is identified as a rainstorm event. The percentile method is used to classify the intensity of these events into 5 grades. Based on the principle of a positive correlation between rainstorm intensity and disaster risk, grades 1–5 are assigned weights of 1/15, 2/15, 3/15, 4/15, and 5/15, respectively, to highlight the risk orientation of high-intensity extreme events [33]. The indicators for high temperatures include the annual maximum temperature and the number of high-temperature days [34]. The annual maximum temperature refers to the highest temperature recorded in a region within a given year, serving as a critical indicator of high-temperature hazards. High-temperature days refer to the number of days in a year with a daily maximum temperature ≥35 °C. To integrate the combined effects of these indicators, weight coefficients of 0.5 and 0.5 are assigned to the annual maximum temperature and high-temperature days, respectively. The drought hazard is determined by calculating the monthly single-station drought Z-index for each year from 2014 to 2023 in Dayi County, extracting the minimum Z-index value from representative stations to reflect the drought severity for that year [35] (Table 2). Based on the drought classifications in Table 2, the percentage of stations experiencing each drought or flood grade annually is calculated as P = n k / n × 100 % , where n is the total number of stations and n k is the number of stations at the k-th level. Generally, a more severe drought level indicates a higher level of damage. In the GIS, using the raster calculator function, drought and flood levels 1 to 4 are assigned weights of 1/10, 2/10, 3/10, and 4/10, respectively. The drought hazard index is obtained through raster overlay analysis.
Environmental sensitivity integrates three sub-indicators comprising the topographic influence index, river network density, and the Normalized Difference Vegetation Index (NDVI) [35]. The scenic areas of Dayi County exhibit pronounced topographic variations. Low-lying terrain and river valleys substantially increase the probability of rainstorm-induced flooding. Conversely, steep slopes readily trigger secondary disasters, including landslides and debris flows. This study uses the topographic influence index to characterize the role of terrain in shaping disaster susceptibility. This index combines baseline elevation with the standard deviation of elevation. Mechanistically, lower elevation values and smaller elevation standard deviations produce higher index values. This spatial pattern indicates that gently sloping, low-lying areas more readily concentrate surface runoff under gravity. The resulting shortened convergence time substantially increases the risks of localized waterlogging and surface ponding. For the calculation, we first extract baseline elevation data from the Digital Elevation Model (DEM). A neighborhood analysis tool then computes the standard deviation of elevation. The weighting parameters for combining these two variables are calibrated according to the complex terrain of the Sichuan Basin [35]. To characterize the influence of the river system on disaster sensitivity, we extract river network density from Dayi County hydrographic data. GIS buffer zones capture the proximity effect of water bodies. Specifically, primary buffer zones around first-order rivers and large water bodies receive the highest sensitivity values. In contrast, secondary buffer zones around second-order rivers and small water bodies receive the lowest values. Following standardization, the results are classified into four levels to reflect the spatial density of rivers within a given catchment area. Lastly, the NDVI, derived from satellite remote sensing, quantifies vegetation cover. Higher vegetation coverage enhances surface runoff regulation and expands the capacity for soil and water conservation. Therefore, NDVI enters the model as a negative indicator, meaning higher values correspond to lower environmental sensitivity. All three indicators are normalized and then combined through weighted summation to yield the composite environmental sensitivity index.
Vulnerability (V) includes two indicators: tourist reception intensity and GDP per unit area. Normalization of tourist reception intensity utilizes the ratio of tourist arrivals to the permanent resident population in each township, accurately reflecting the tourism pressure borne by the baseline population. A higher ratio indicates a greater overlap of external tourist exposure with local exposed assets, directly resulting in higher vulnerability [36]. Concurrently, GDP per unit area measures the economic density per unit of space at the attractions. Areas with a higher concentration of economic activities naturally present a higher risk of direct economic losses under disaster impacts.
Disaster prevention and mitigation capacity comprises two indicators: GDP per capita and the number of general hospitals. GDP per capita represents the regional economic development level, serving as the material foundation for post-disaster recovery. Simultaneously, the number of general hospitals reflects the allocation level of regional medical rescue resources. Mechanistically, disaster prevention and mitigation capacity suppresses comprehensive risk. Therefore, both indicators undergo a reversal process after normalization to participate in the weighted overlay analysis. Through this mathematical inversion, a stronger capacity directly corresponds to a lower contribution to the overall risk level.
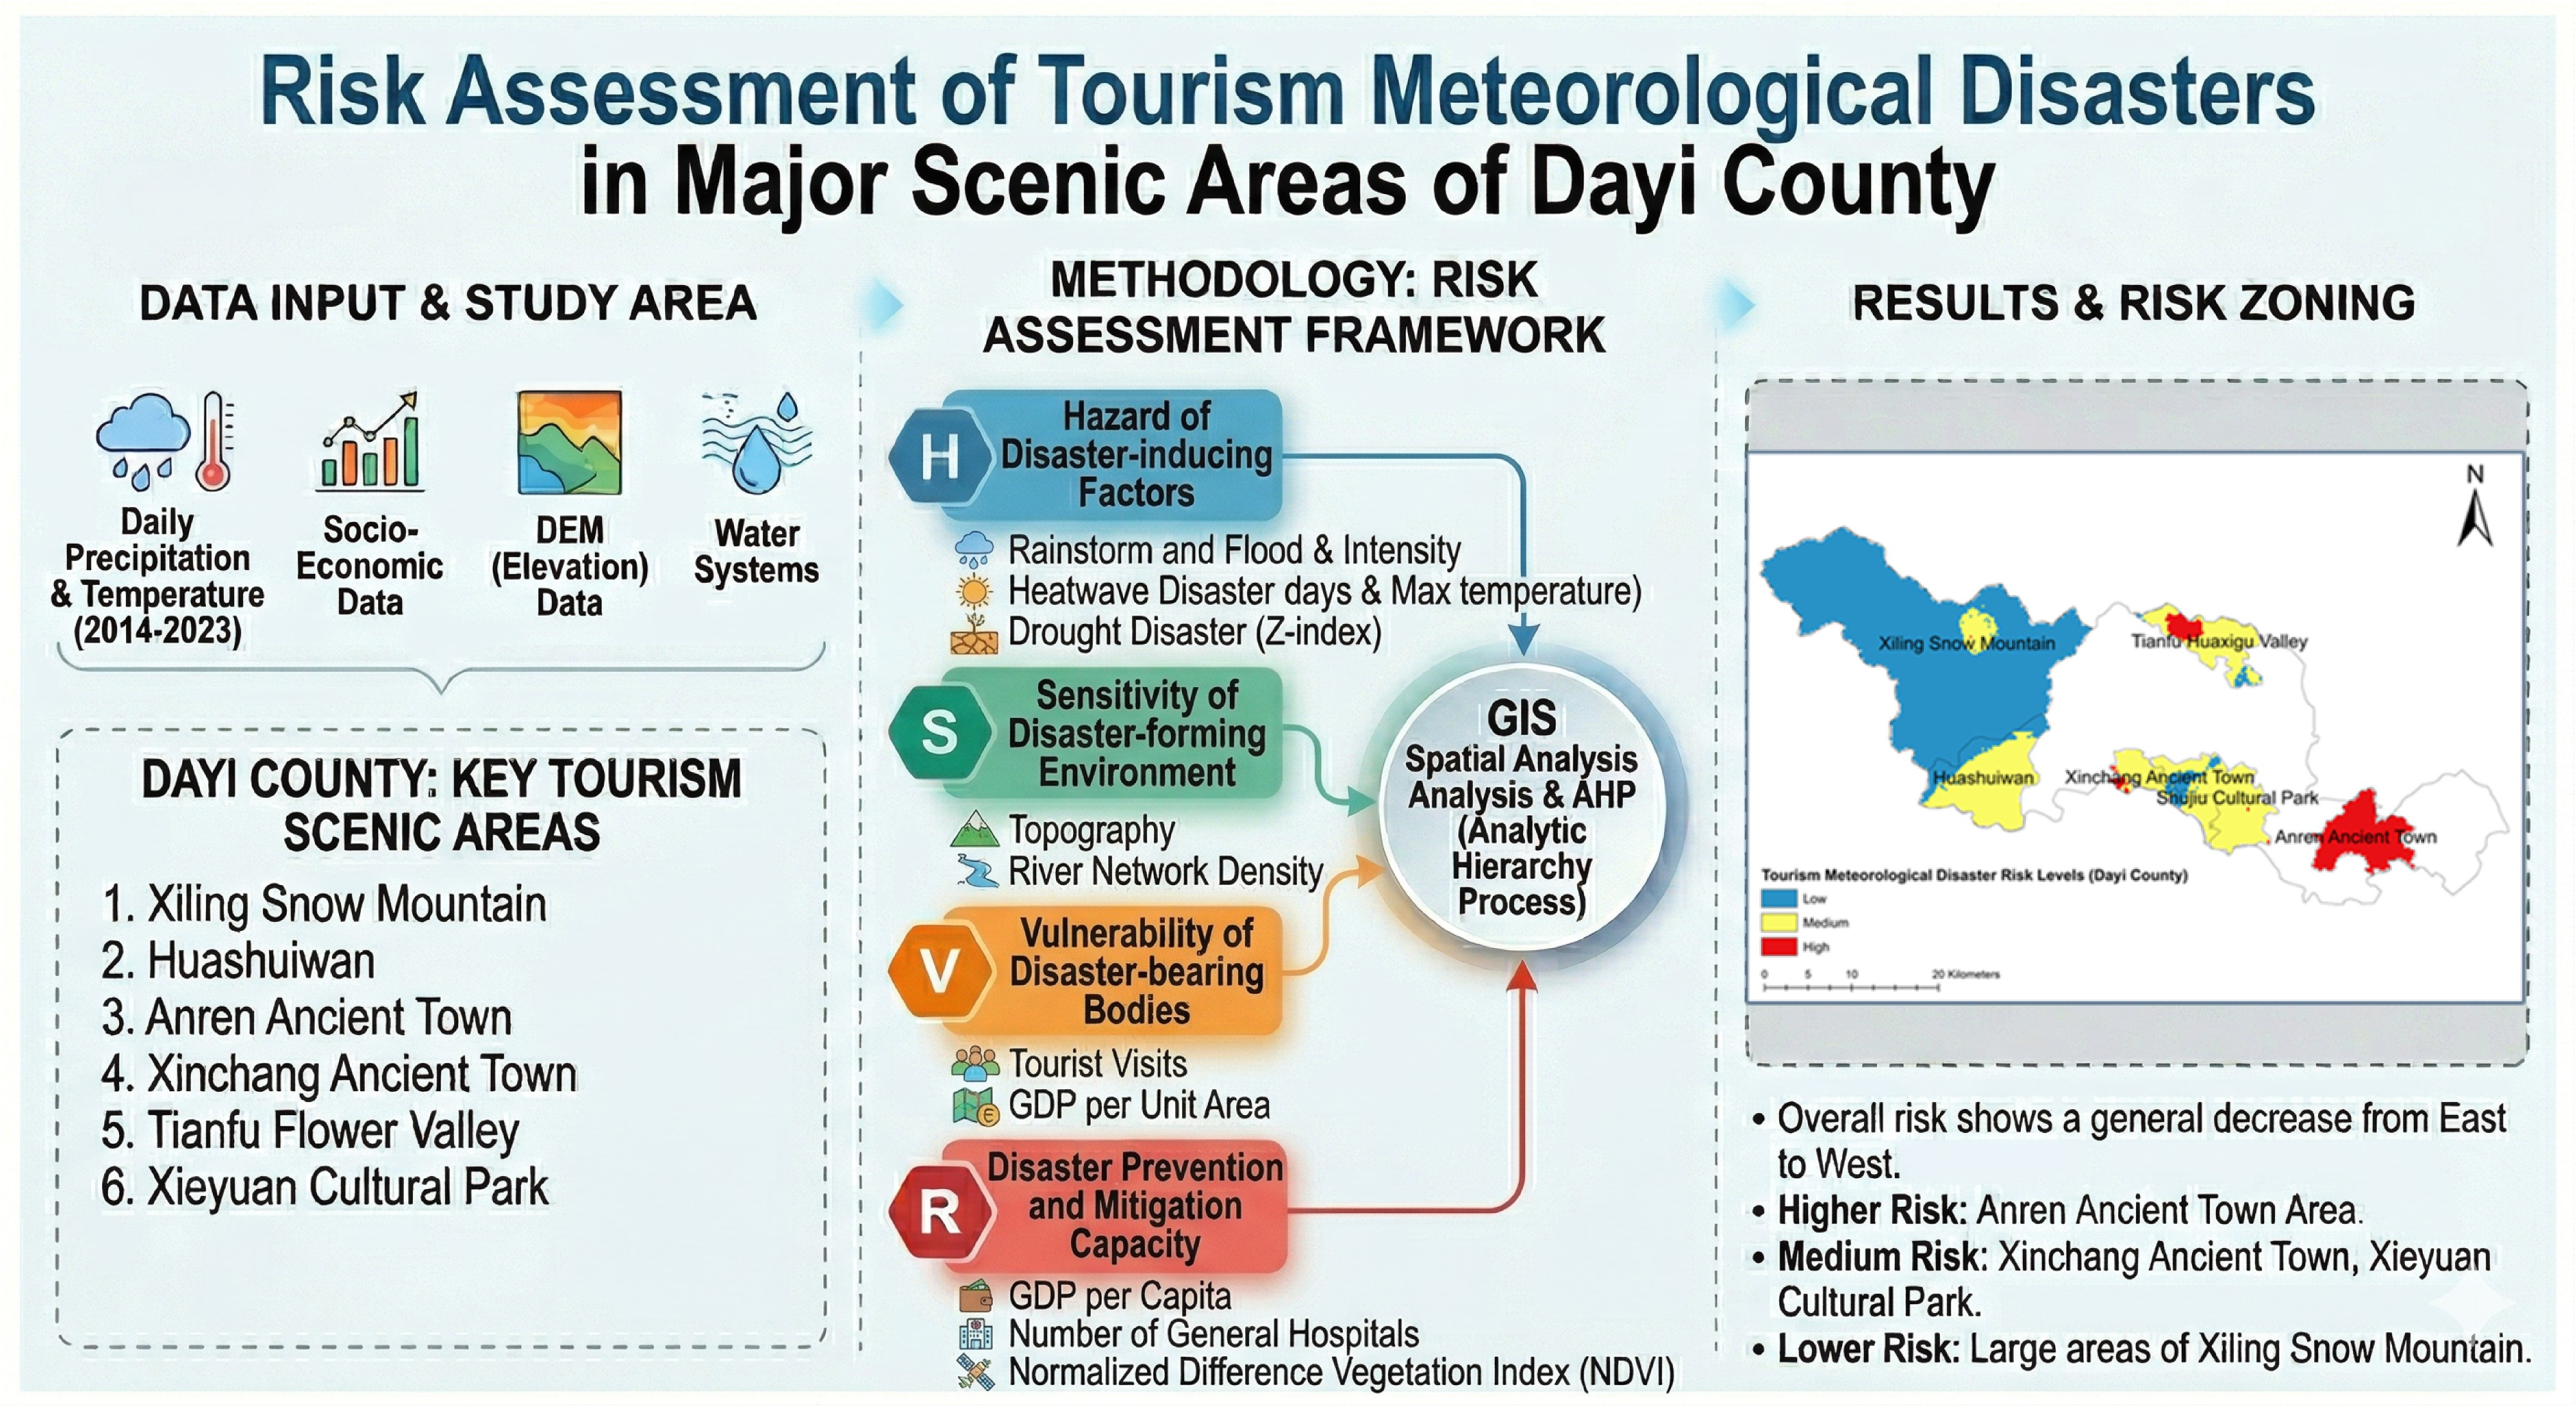
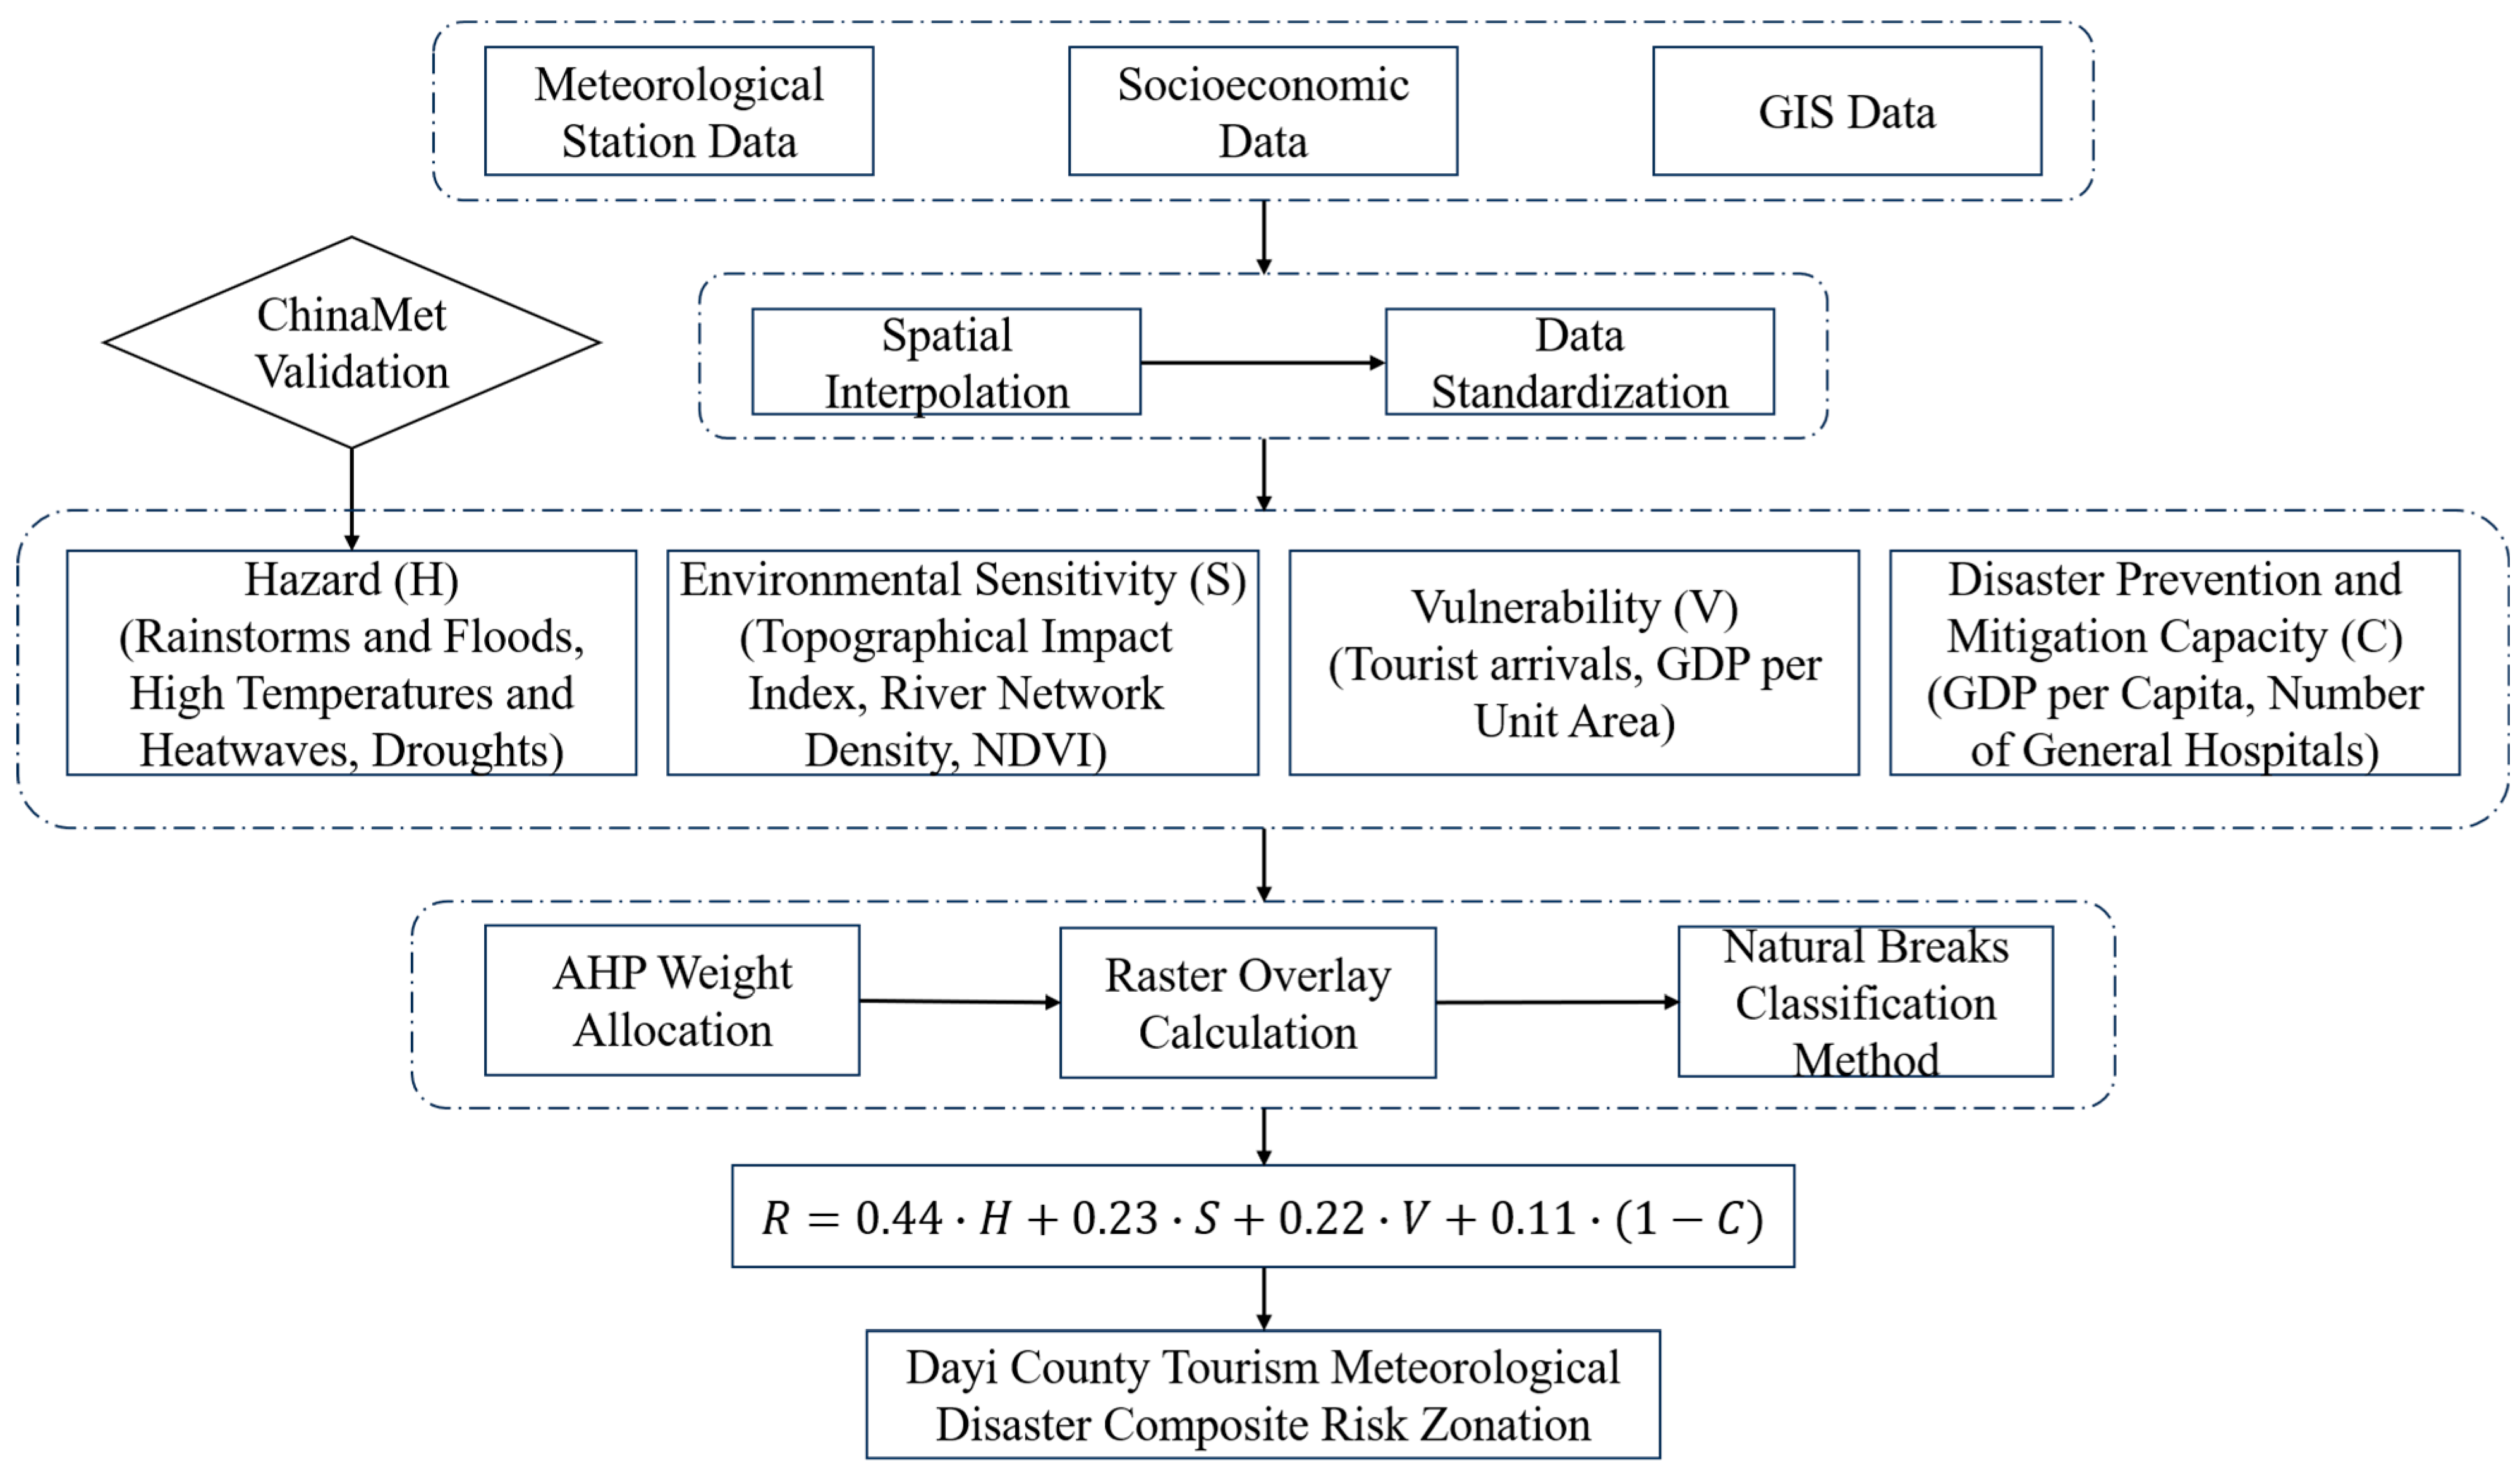
A comprehensive methodological framework for tourism meteorological disaster risk assessment in Dayi County is established through the calculation logic and spatial processing of the aforementioned indicators. To systematically visualize this evaluation logic and technical framework, a detailed methodological workflow is presented in Figure 2. The processes of data collection, AHP-based weight allocation, GIS-based raster overlay calculation, and natural breaks classification are explicitly illustrated. These procedures are conducted to generate the final disaster risk zonation map. Furthermore, an independent validation pathway is delineated. The long-term ChinaMet dataset is utilized to evaluate the reliability of the hazard zonation.

3. Results

3.1. Hazard (H) of Meteorological Disasters for Major Tourist Attractions in Dayi County

Hazard refers to the degree of anomaly of meteorological disasters, primarily determined by the intensity and frequency of hazard-inducing factors. Given the complex terrain and frequent meteorological disturbances in Dayi County, severe rainstorms, extreme heatwaves, and droughts enter the model as evaluation units based on their direct impacts on the tourism industry. The damage from rainstorms stems from intense precipitation, frequently inducing sudden torrential runoff. These events destroy attraction infrastructure and trigger secondary disasters, including debris flows, landslides, and water pollution. In contrast, droughts cause excessively dry air and severe soil moisture deficits, endangering vegetation growth and hindering tourism resource development. Lastly, extreme heatwaves directly threaten tourist health and exacerbate local electricity supply–demand conflicts during the peak travel months of July and August.
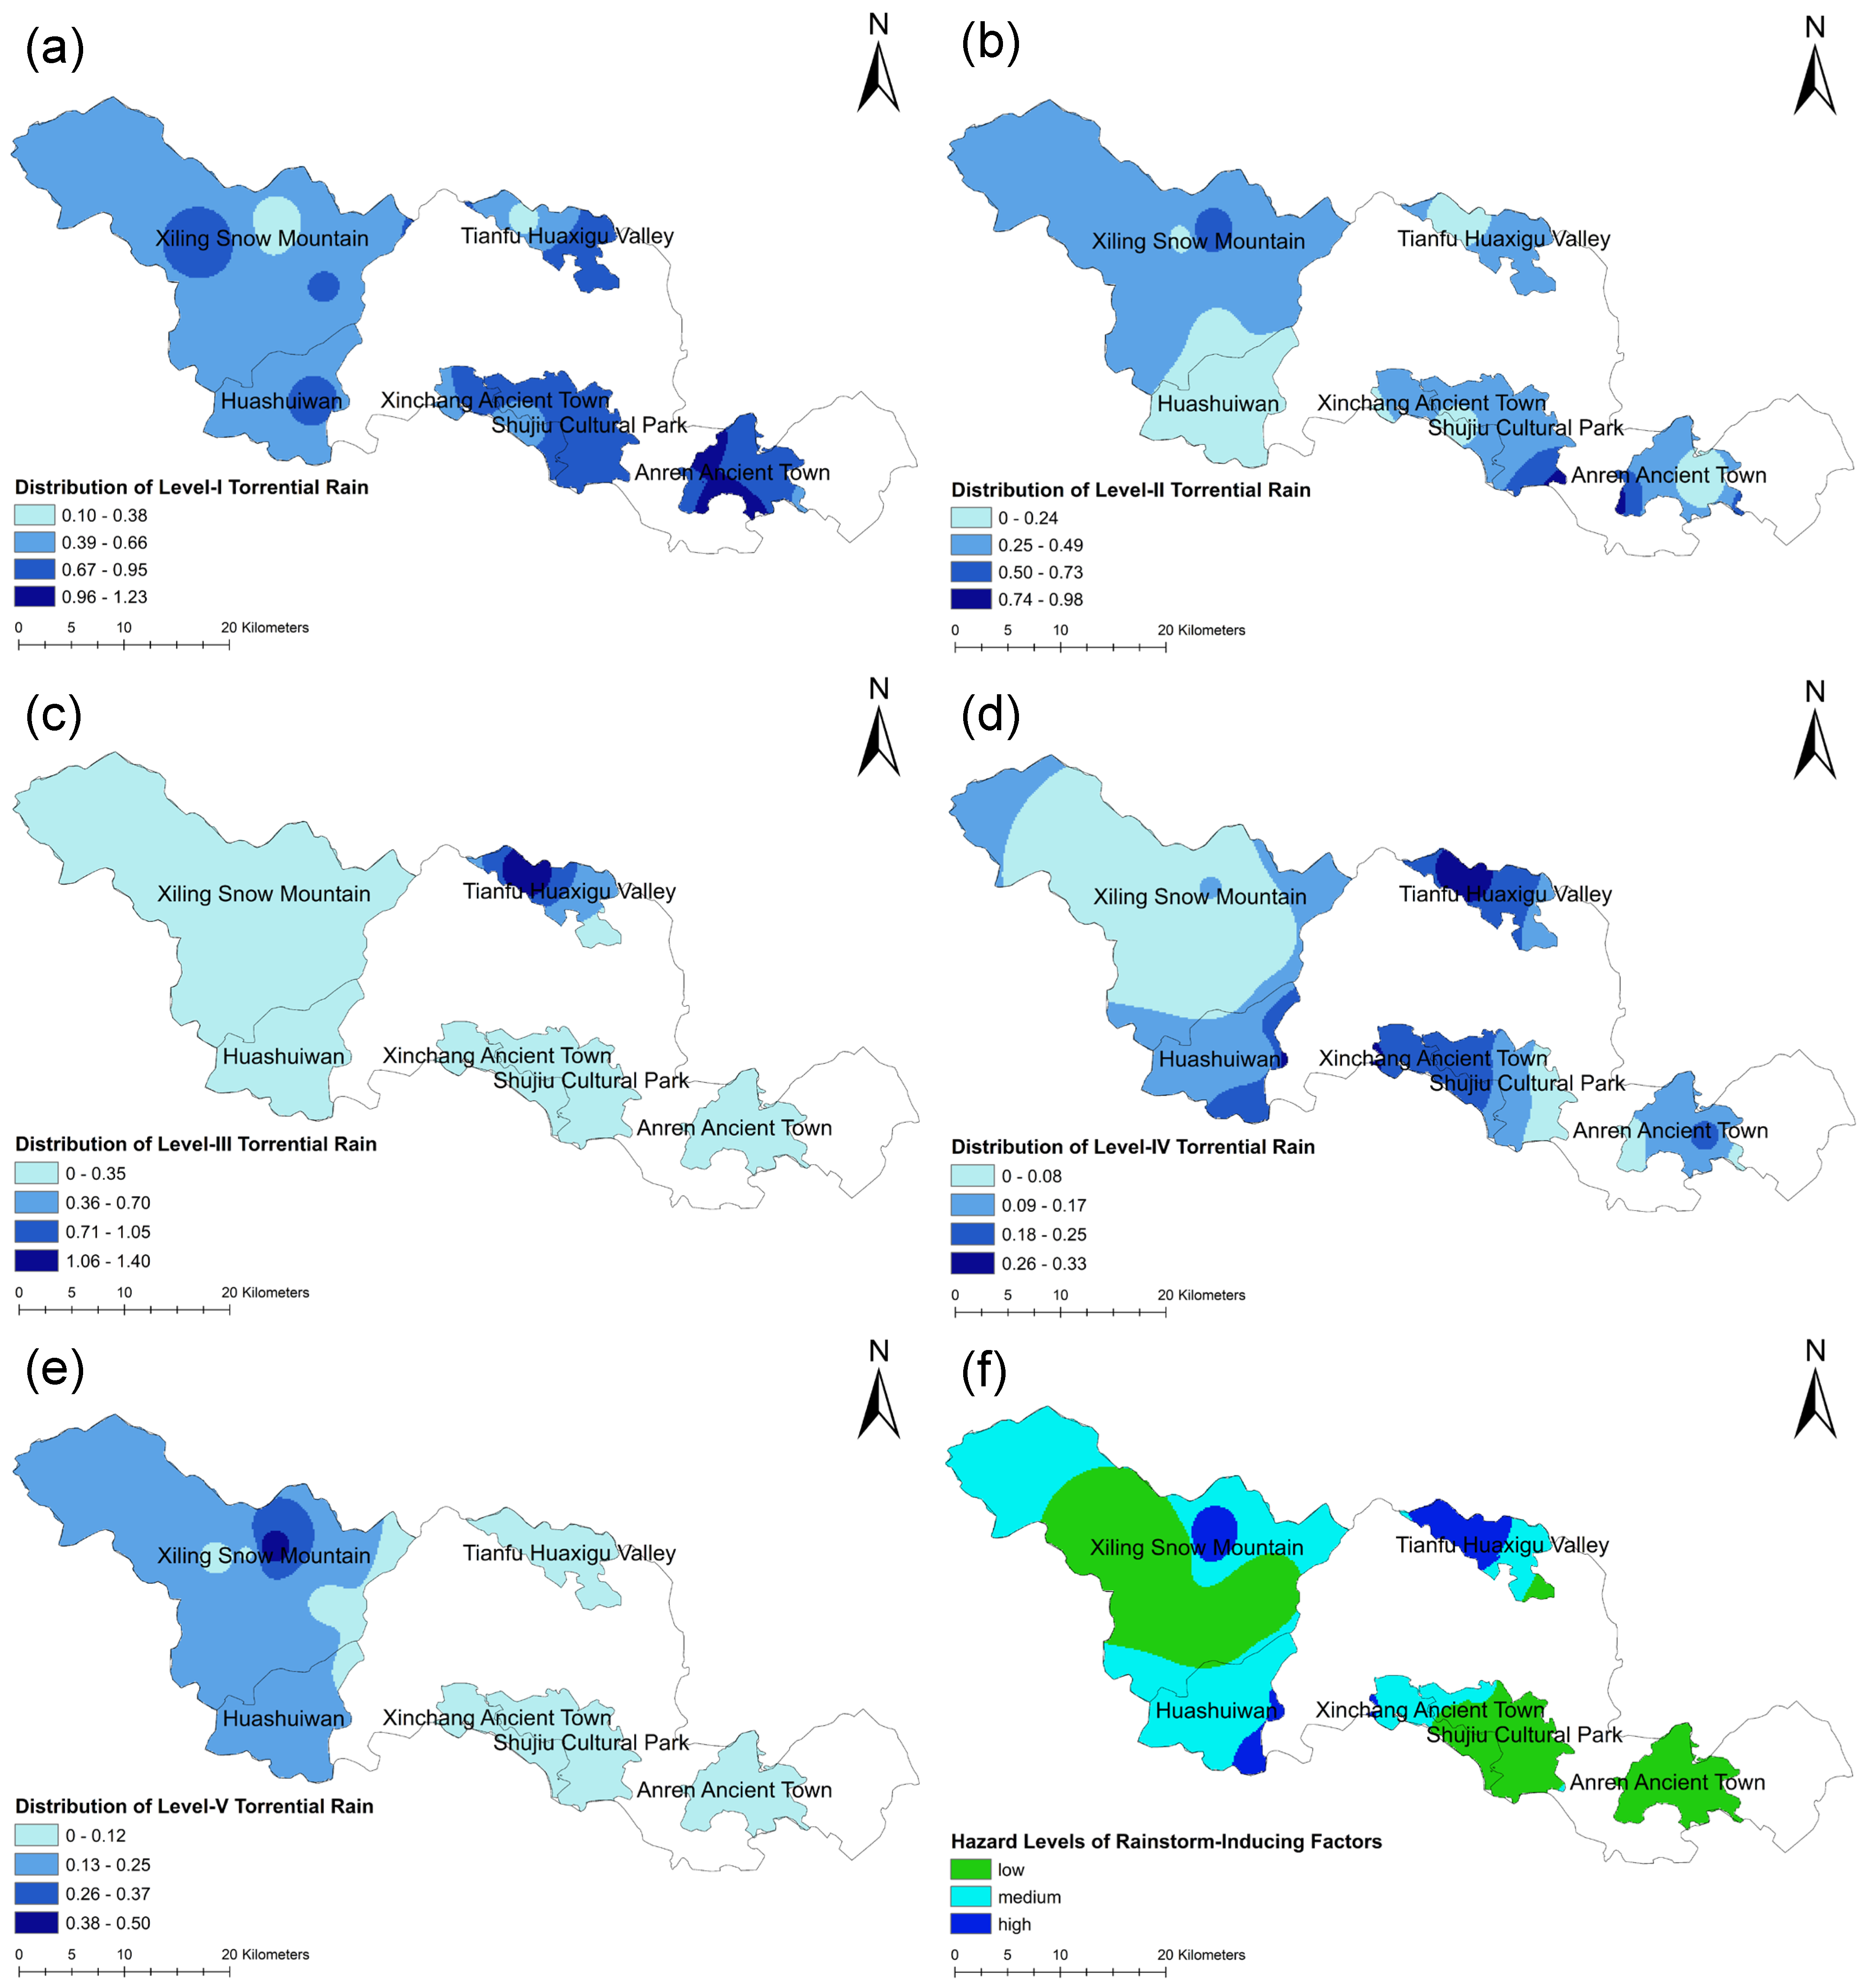
The rainstorm hazard is determined primarily by precipitation intensity and frequency. According to the rainstorm standards of the Sichuan Provincial Meteorological Bureau, the percentile method classifies rainstorm intensity into five grades. The Inverse Distance Weighting interpolation method generates frequency distribution maps for each grade (Figure 3a–e). Given the relatively small county area, the hazard index was categorized into three levels via GIS-based weighted overlay and the Natural Breaks method. This approach avoids spatial fragmentation, enhances management applicability, and yields the rainstorm hazard zoning map (Figure 3f). The results indicate that Tianfu Huaxigu Valley falls within a higher-risk area. Xiling Snow Mountain, Huashuiwan, and Xinchang Ancient Town are moderate-risk areas. Shujiu Cultural Park and Anren Ancient Town in the east exhibit the lowest risk levels. The lowest risk levels are found in Shujiu Cultural Park and Anren Ancient Town in the east. Tianfu Huaxigu Valley is located in the transition zone from mountains to plains. Rapid stormwater accumulation in this area is likely facilitated by orographic lift and topographic convergence. A relatively elevated flood hazard is therefore indicated. By contrast, the eastern plain is characterized by relatively stable airflow conditions. The hazard of sudden localized rainstorms in this area appears to be reduced.
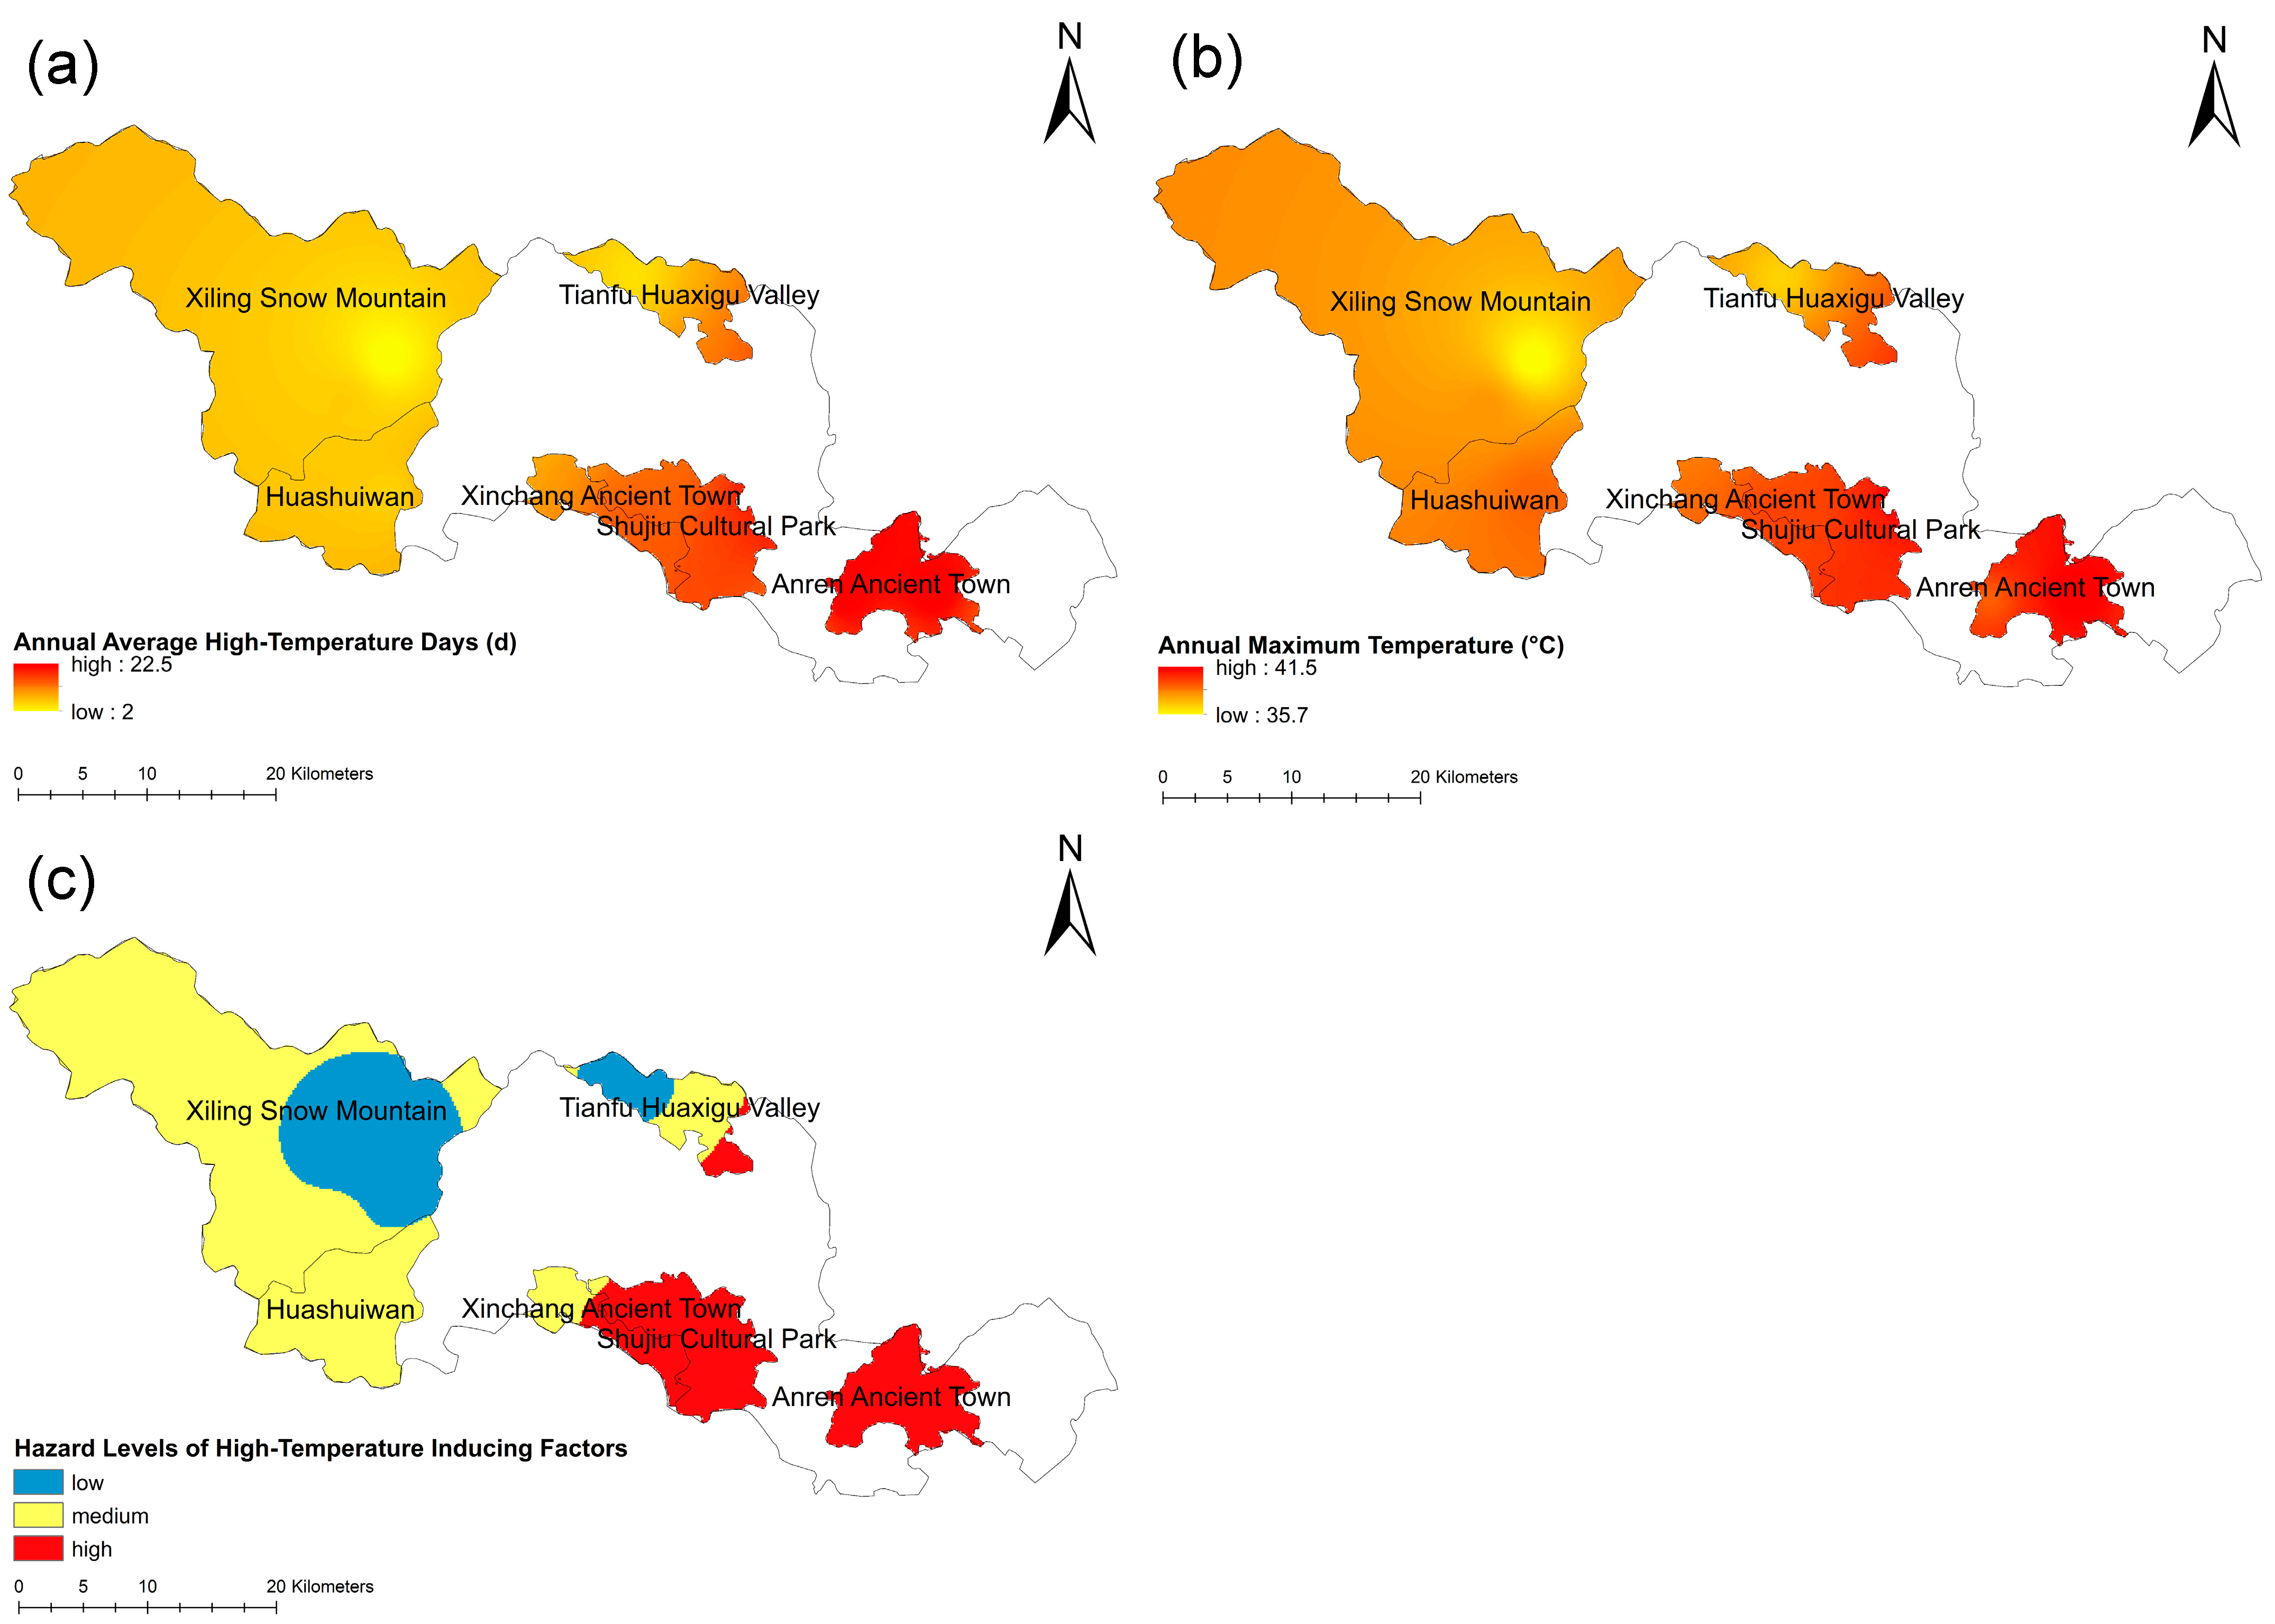
According to the China Meteorological Administration, a day with a maximum temperature of 35 °C or higher is defined as a high-temperature day, and extreme heat lasting three or more consecutive days constitutes a heatwave. Located in the subtropical humid monsoon climate zone, Dayi County often comes under the influence of the subtropical high. This atmospheric persistent system may lead to prolonged sunny and rain-free periods. These conditions can elevate surface temperatures and potentially trigger extreme heat events. Furthermore, snowmelt dynamics on the Qinghai–Tibet Plateau are thought to influence regional climate patterns, and this influence becomes more pronounced under global warming. Finally, the diverse terrain of the county features a mix of mountains, hills, and plains. This topography likely modifies local airflow and subsequent temperature distributions, ultimately inducing extremely high temperatures. Two major indicators of high-temperature hazards exhibit consistent spatial distribution patterns. These indicators are the annual number of high-temperature days (Figure 4a) and the annual maximum temperature (Figure 4b). Analysis of the high-temperature hazard zoning map (Figure 4c) reveals a close link between hazard distribution and topography. The terrain slopes downward from west to east. Anren Ancient Town, Shujiu Cultural Park, and Xinchang Ancient Town are located in the low-altitude plains. The concentration of cultural heritage sites and commercial buildings in these areas appears to create a pronounced urban heat island effect. This effect is likely contributing to the observed high hazard levels. Conversely, most areas of Huashuiwan, Tianfu Huaxigu Valley, and Xiling Snow Mountain exhibit moderate hazard levels. Meanwhile, the mountainous zones of Xiling Snow Mountain and parts of Tianfu Huaxigu Valley represent lower-hazard areas. The low elevation and dense built environments of Anren Ancient Town, Shujiu Cultural Park, and Xinchang Ancient Town tend to impede thermal dissipation. This impedance may facilitate localized heat island effects. In contrast, the high altitude and extensive forest cover of the Xiling Snow Mountain region are likely to provide effective shading and canopy scattering. These natural features appear to reduce the accumulation of extreme heat.
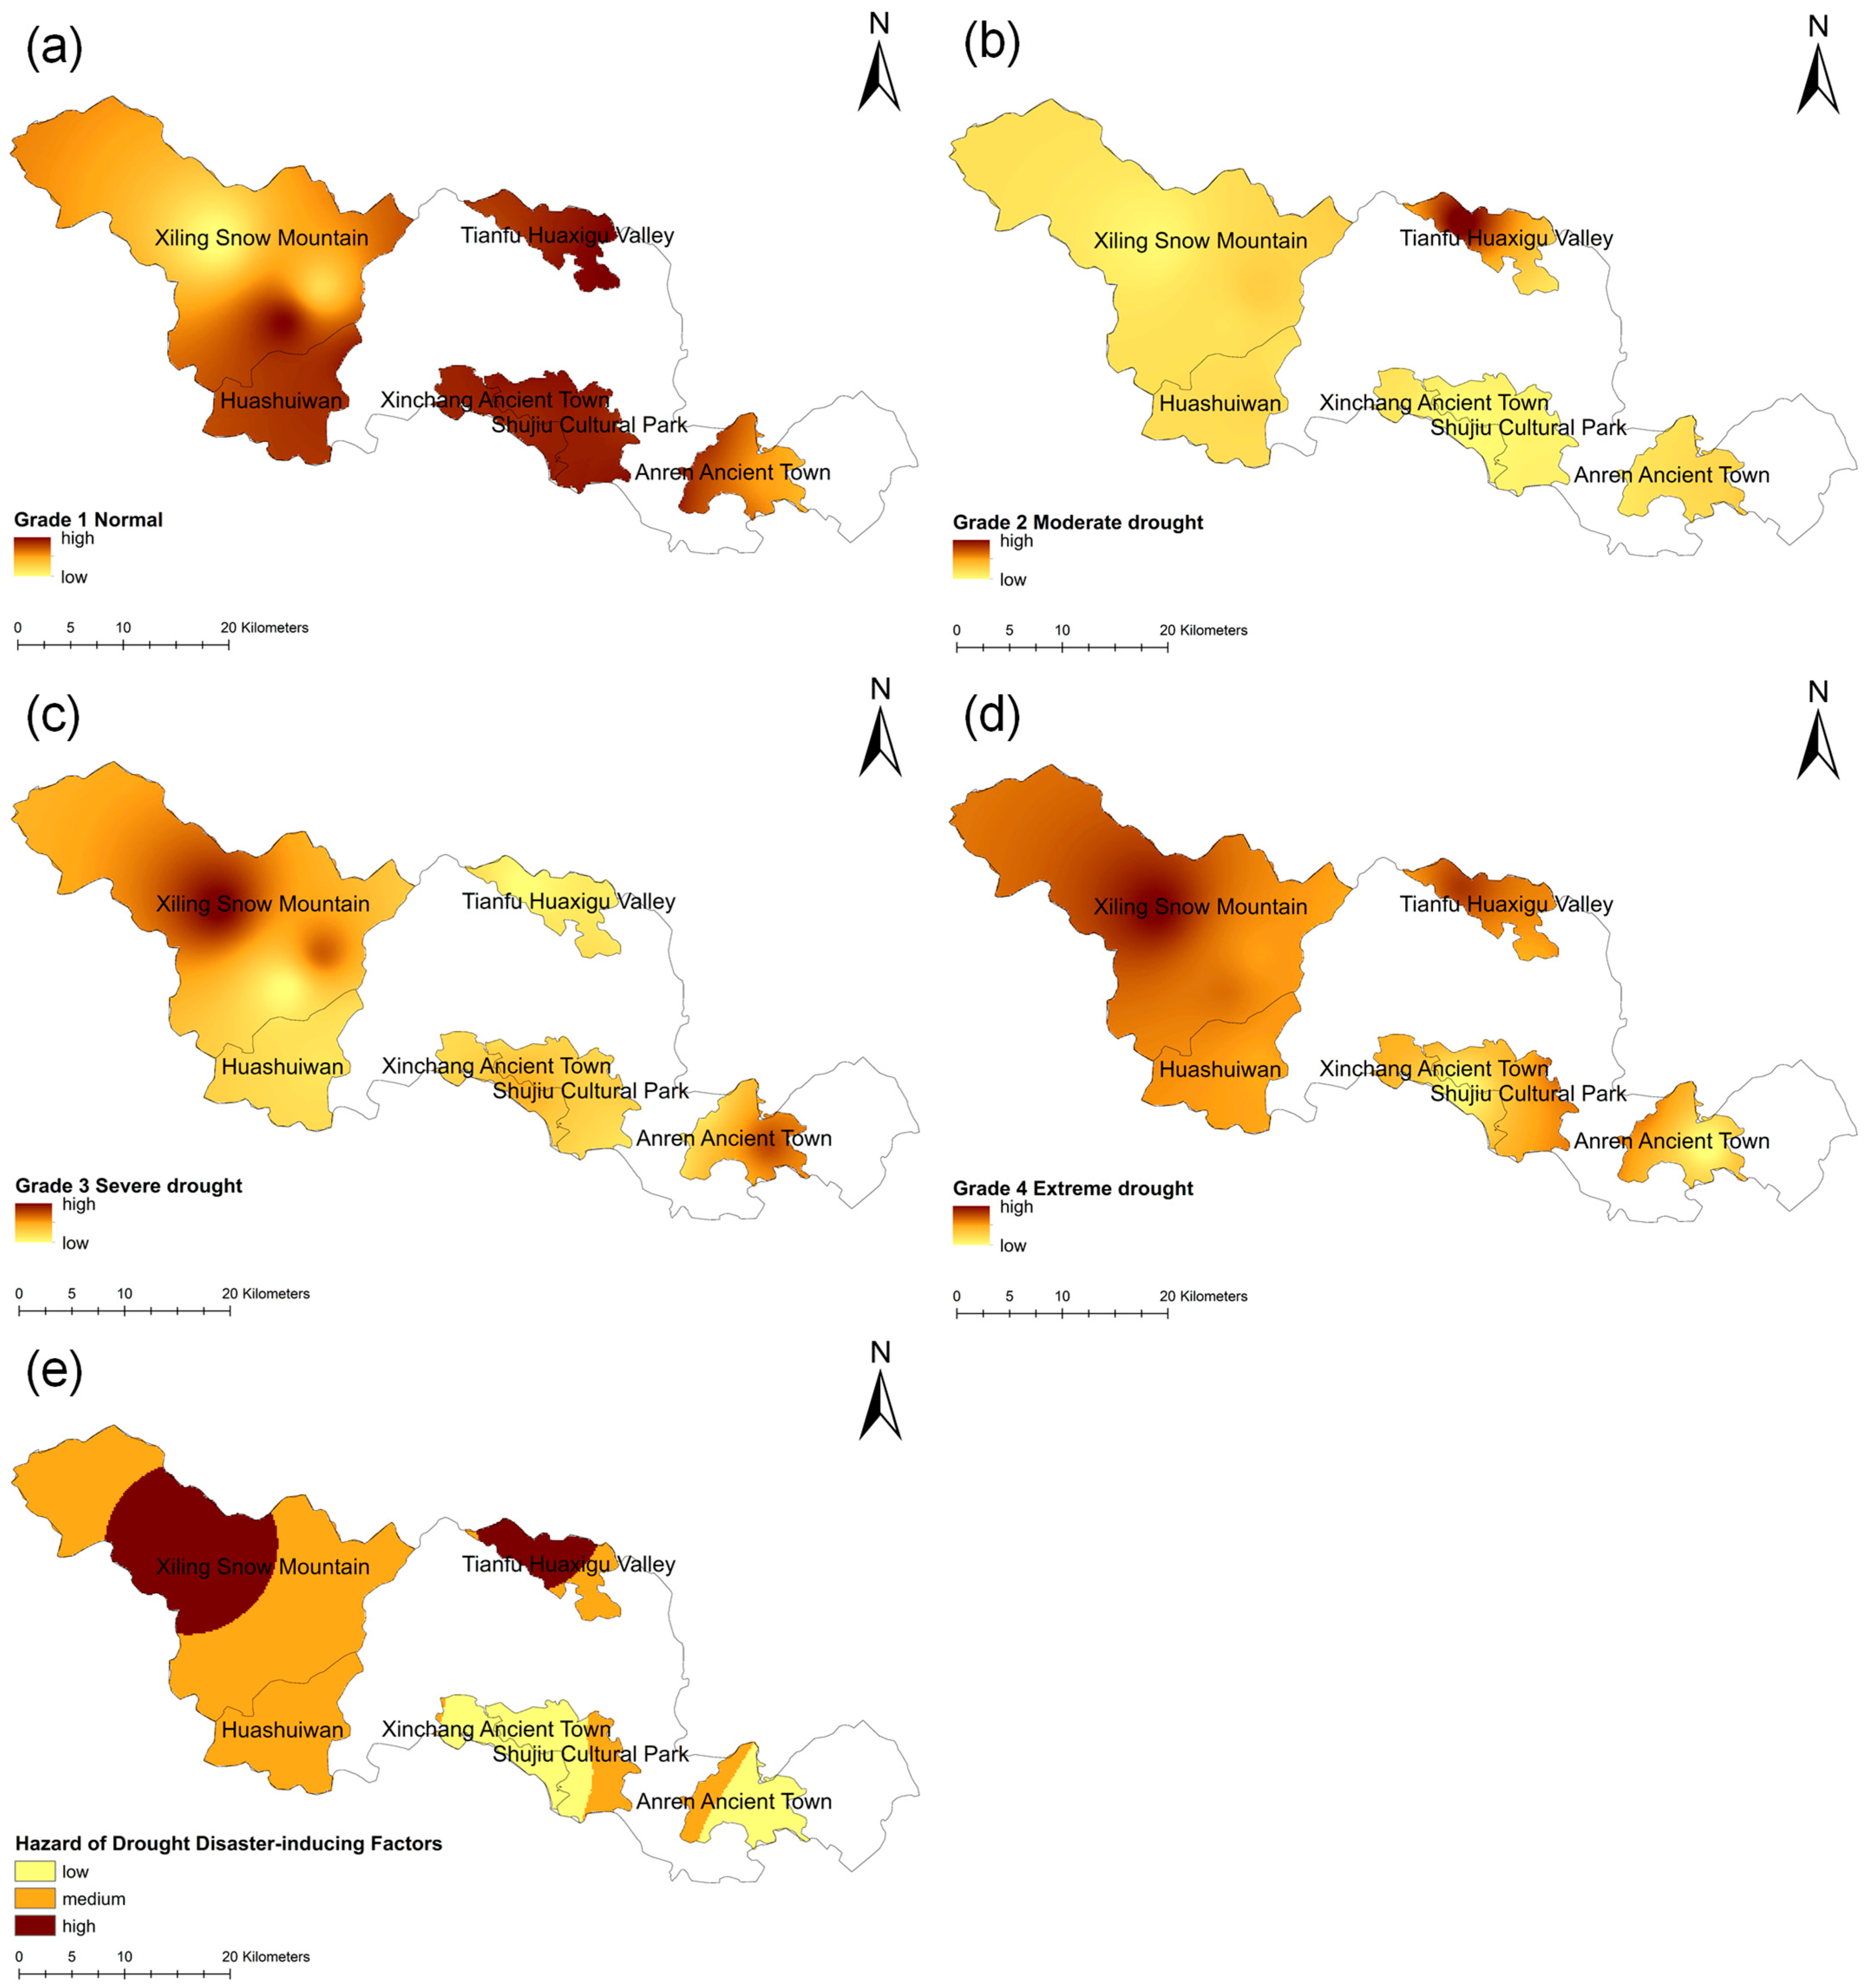
Drought hazard refers to the natural variability factors and their anomaly levels that cause drought conditions. According to relevant authorities, Dayi County experienced droughts in 29 of the years between 1991 and 2020, predominantly as winter, spring, and summer droughts. Analysis of the drought hazard zoning map (Figure 5) indicates that Tianfu Huaxigu Valley has a higher drought hazard level. Portions of Xiling Snow Mountain and Shujiu Cultural Park exhibit moderate hazard levels. The drought hazard levels in Huashuiwan, Xinchang Ancient Town, and Anren Ancient Town are lower. The higher drought hazard in Tianfu Huaxigu Valley stems from the large interannual precipitation variability in the piedmont zone. Furthermore, the limited soil water-retention capacity likely contributes to moisture deficits. In contrast, more abundant surface water and groundwater resources are located in the eastern plains. This hydrological advantage appears to reduce the frequency of drought events.
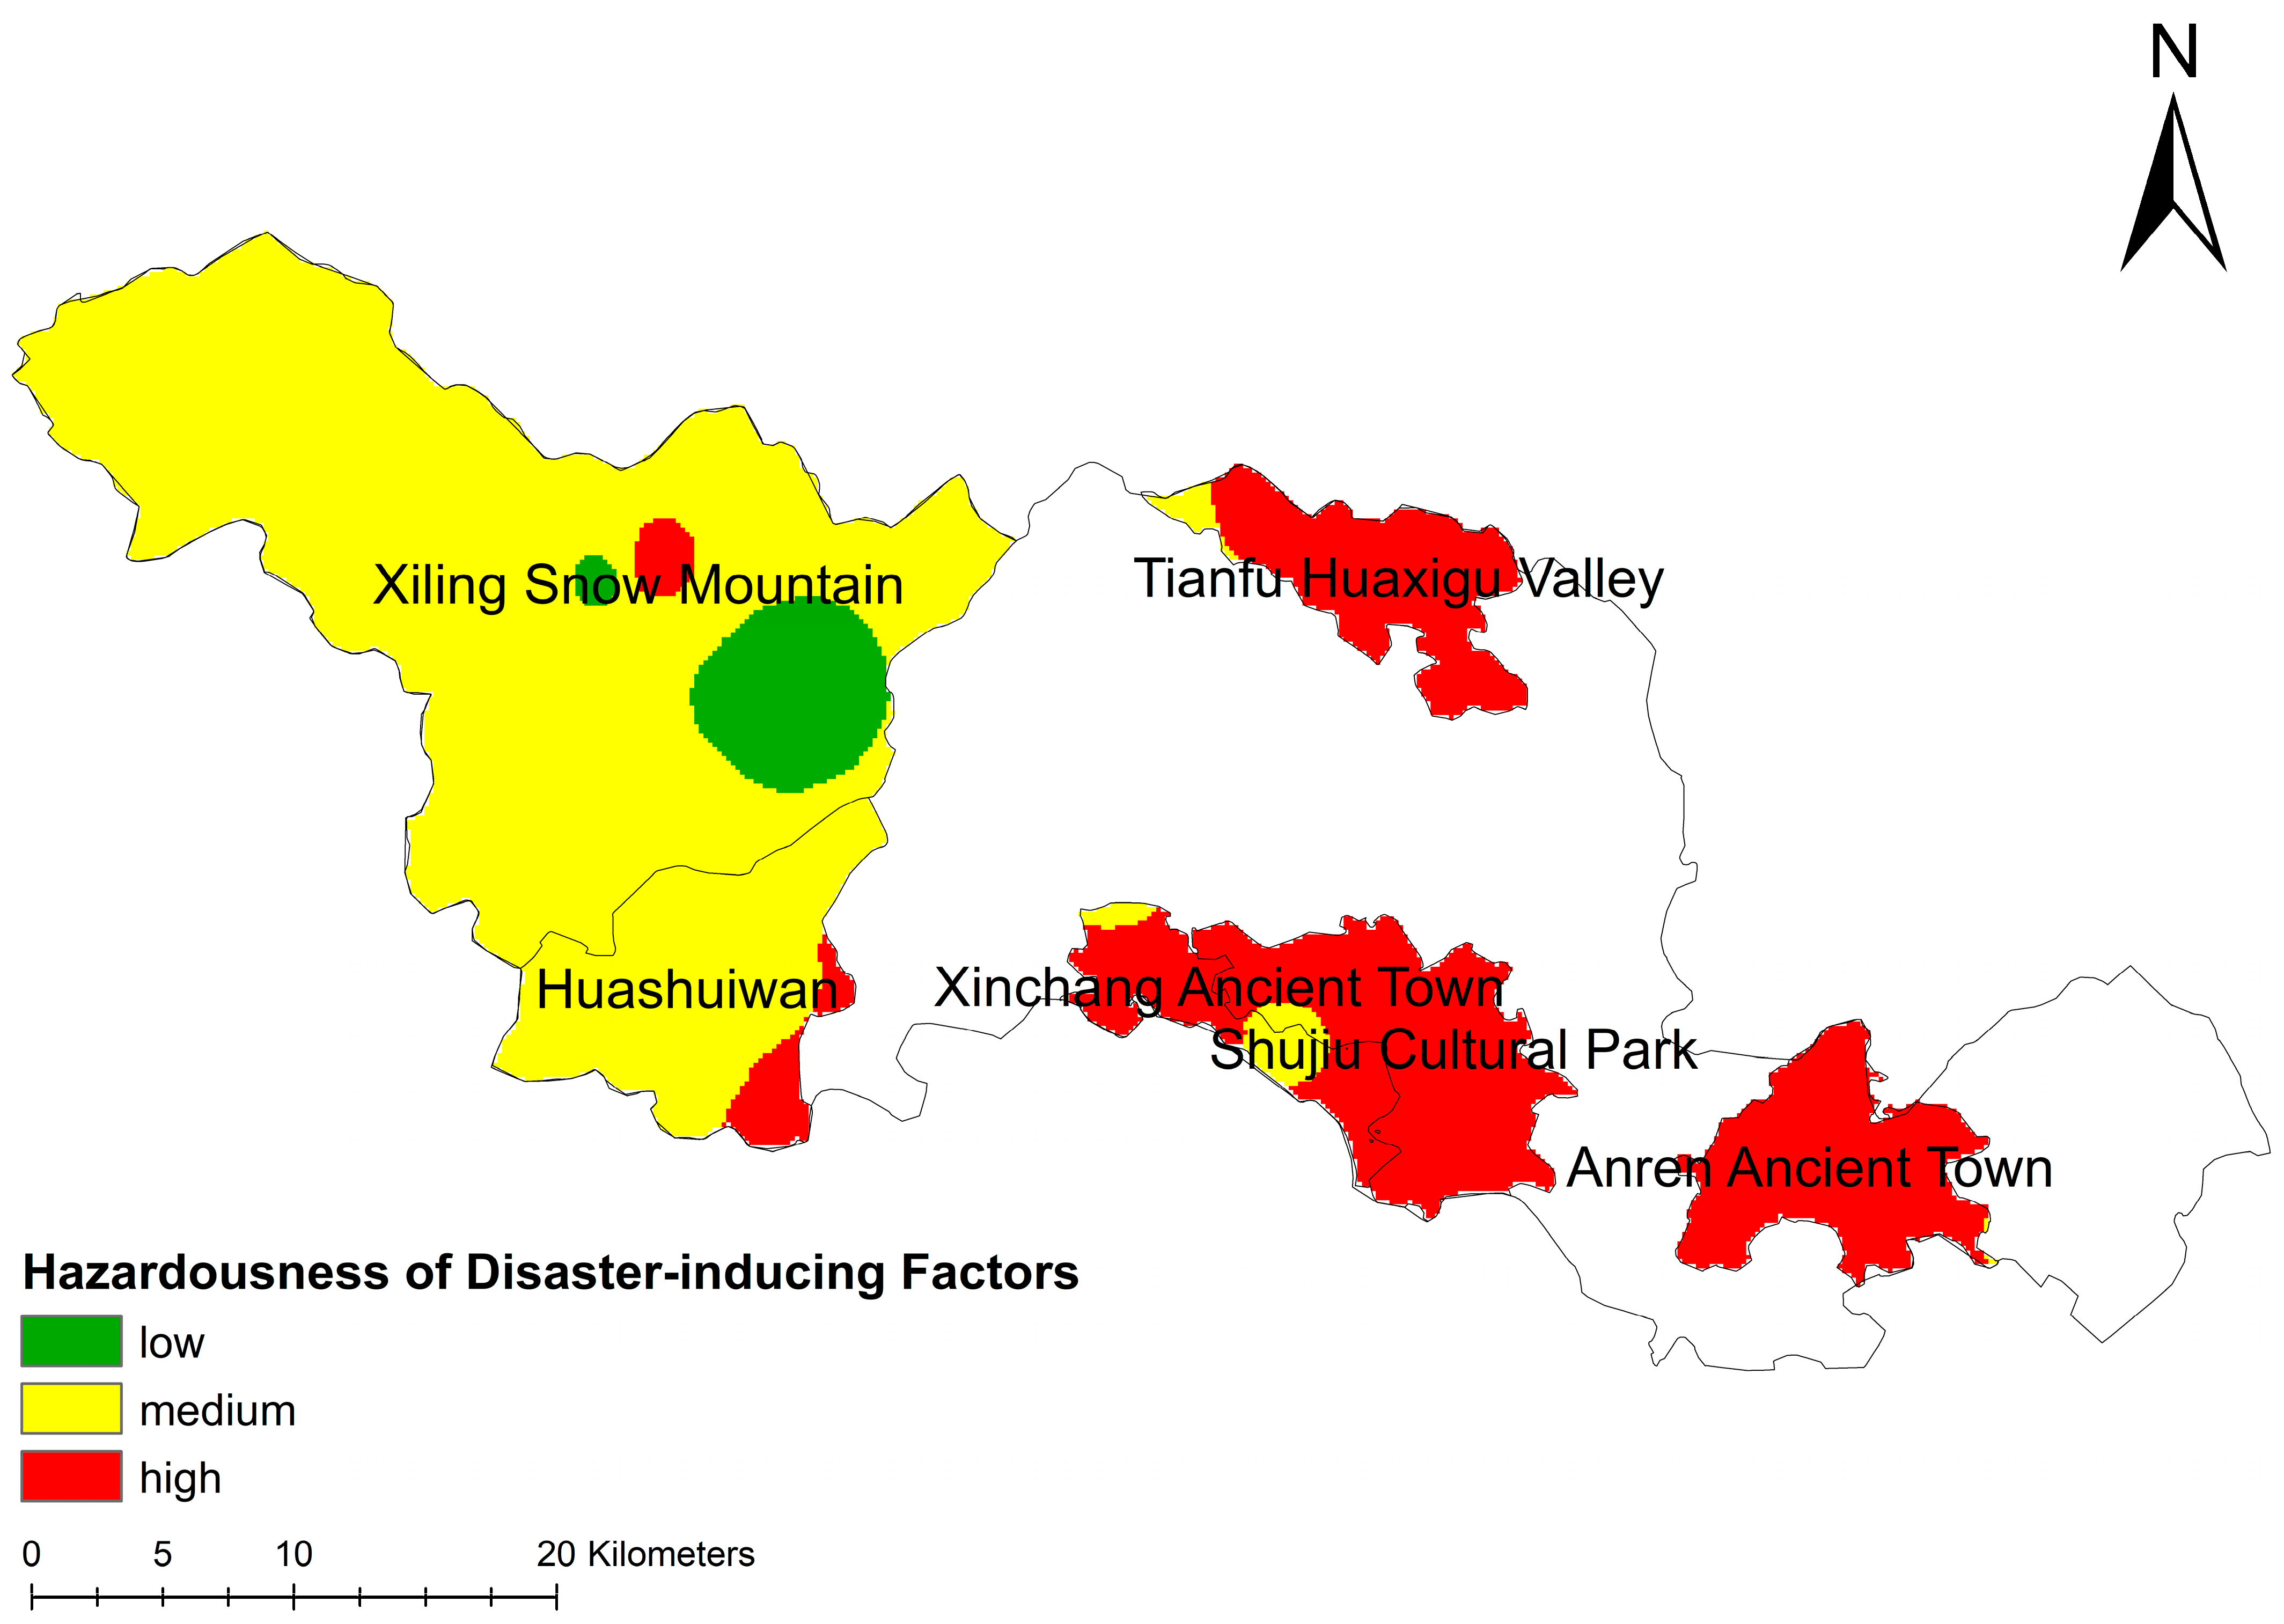
To comprehensively evaluate the composite hazard of meteorological disasters, this study integrated the actual impacts and occurrence frequencies of rainstorms, heatwaves, and droughts across major attractions in Dayi County. Based on the weights from the Analytic Hierarchy Process, a raster overlay analysis was conducted in ArcGIS 10.8. The natural breaks method classified these results to generate the composite meteorological disaster hazard zoning map (Figure 6). The analysis reveals high-hazard zones in Anren Ancient Town, Xinchang Ancient Town, Shujiu Cultural Park, and Tianfu Huaxigu Valley. Meanwhile, Huashuiwan and Xiling Snow Mountain exhibit moderate hazard levels. Overall, the composite hazard level across the county increases progressively from west to east. Tianfu Huaxigu Valley faces high individual hazard levels for both rainstorms and droughts, resulting in a high composite hazard after spatial overlay. Anren Ancient Town and Shujiu Cultural Park exhibit low-to-moderate hazard levels for rainstorms and droughts individually. Nevertheless, the extreme heatwave dimension presents a high hazard level for these two attractions. This specific weighted contribution appears to significantly elevate their overall composite hazard level.

3.2. Validation of Hazard (H) Assessment

To validate the robustness and spatio-temporal representativeness of the assessment results, we introduce the long-term high-resolution meteorological forcing product ChinaMet (1980–2024) as an independent validation source. We conduct a point-to-point comparison between daily observations at 25 meteorological stations and the corresponding ChinaMet grid values for the same period (2014–2023). This comparison quantitatively evaluates the dataset’s applicability in the study area.
Results indicate that the Mean Absolute Error (MAE) of ChinaMet temperature relative to station observations is 1.31 °C. The Root Mean Square Error (RMSE) is 1.84 °C, and the Bias is only 0.61 °C. The correlation coefficient between ChinaMet annual precipitation and station observations is 0.68, effectively capturing interannual precipitation variability in the region. For spatial pattern validation, the ChinaMet temperature lapse rate is −3.79 °C/km. This value aligns with the station-observed trend (−5.63 °C/km), and the coefficient of determination (R2) reaches 0.96. These statistics demonstrate that ChinaMet reliably reproduces the west-high, east-low topographic characteristics of Dayi County and the spatial distribution of meteorological elements. The dataset thus provides a sound basis for independent validation.
Building upon this confirmation, we apply the same indicator system and weights used in the station-based analysis. Using 45 years of ChinaMet data, we generate hazard maps for rainstorms (Figure S1a), extreme heat (Figure S1b), and drought (Figure S1c), along with a composite zonation map (Figure S1d).
Regarding spatial agreement among individual hazard factors, the extreme heat validation shows the strongest consistency. Both datasets accurately identify high-hazard zones in the eastern plains, including Anren Ancient Town and Shujiu Cultural Park, and low-hazard zones in the western mountainous areas. This finding confirms that the spatial pattern of heat hazard is governed primarily by elevation-dependent thermal contrasts associated with vertical lapse rates and land surface properties. The pattern exhibits strong temporal stability. For rainstorm hazard, the ChinaMet dataset likewise identifies the high-hazard characteristics of Tianfu Huaxigu. However, compared with station data, ChinaMet assigns higher hazard levels to certain localities in the eastern plains, such as Anren Ancient Town. It thereby produces a more pronounced east–west contrast than the observation-based interpolation results. The drought hazard map shows localized adjustments under validation. Xiling Snow Mountain shifts from a high-hazard to a medium-hazard classification, whereas Anren Ancient Town in the east shifts from low to medium hazard. Relative to the spatial consistency observed for extreme heat, rainstorm and drought hazards exhibit certain discrepancies. These stem primarily from the pronounced spatial heterogeneity of precipitation, along with differences in data record length, sampling density, and processing methodologies.
This observed divergence does not alter the core spatial pattern of the composite hazard. The composite hazard assessment results are presented in Figure 6. Both data sources consistently reveal a spatial characteristic of lower hazard levels in the west and higher levels in the east across major attractions in Dayi County. The long-term ChinaMet dataset serves as an independent validation. This validation appears to confirm the robustness and scientific validity of the station-based hazard zonation. This confirmed reliability establishes a solid data foundation for subsequent risk model construction.

3.3. Environmental Sensitivity (S) of Meteorological Disasters for Major Tourist Attractions in Dayi County

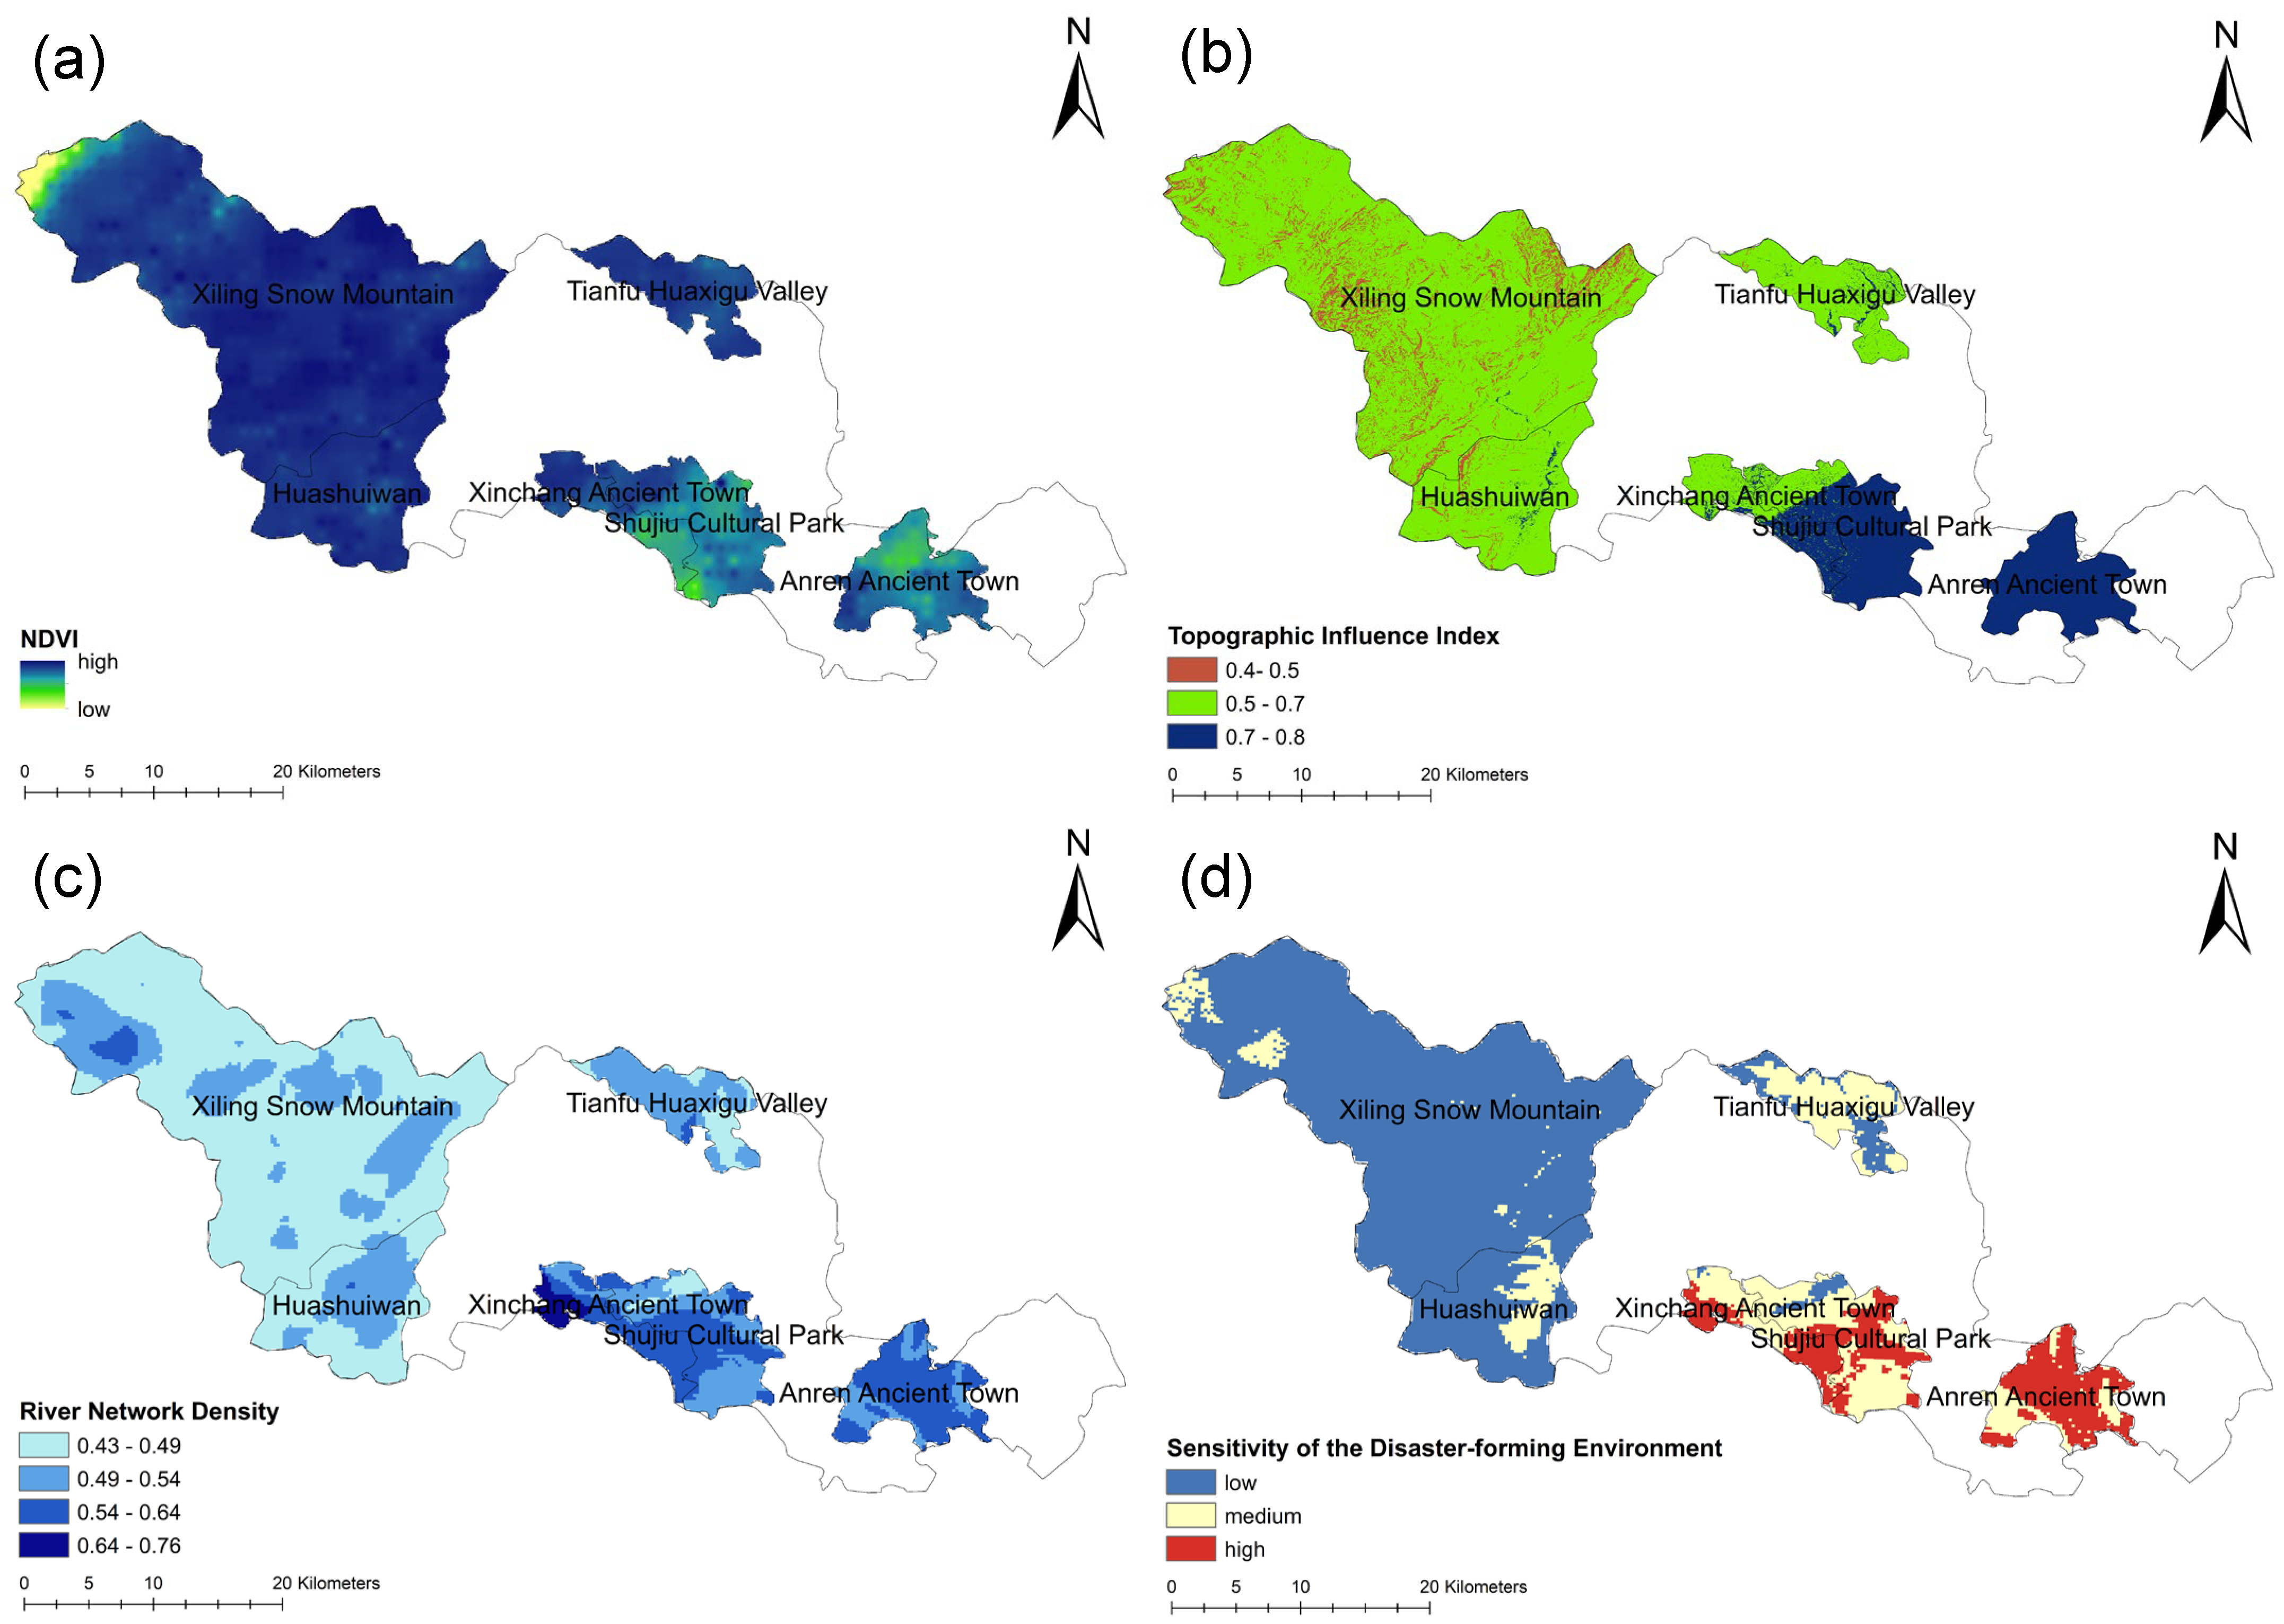
Environmental sensitivity refers to the environmental conditions and their characteristics in areas of disaster formation or impact. For this evaluation, NDVI (Figure 7a), the topographic influence index (Figure 7b), and river network density (Figure 7c) were selected as sensitivity indicators. These three sub-indicators were standardized and combined through a weighted overlay calculation in a GIS. This process generated the environmental sensitivity zoning map for meteorological disasters at major tourist attractions in Dayi County (Figure 7d). Overall, sensitivity gradually increases from west to east. Xiling Snow Mountain and Huashuiwan are lower-sensitivity areas. Tianfu Huaxigu Valley and Xinchang Ancient Town are moderate-sensitivity areas. Shujiu Cultural Park and Anren Ancient Town are higher-sensitivity areas. This west-low and east-high distribution reflects differing climate buffering capacities across diverse natural ecosystems. Geographically, the western mountainous areas are characterized by dense vegetation cover and steep slopes. These natural features appear to foster a high capacity for soil and water conservation. This conservation capacity is likely to lower surface environmental sensitivity. Conversely, the eastern plains feature low-lying topography and dense river networks. This specific terrain may facilitate rapid surface water accumulation after rainfall events. Such accumulation appears to significantly increase localized waterlogging risks.

3.4. Vulnerability (V) of Meteorological Disasters for Major Tourist Attractions in Dayi County

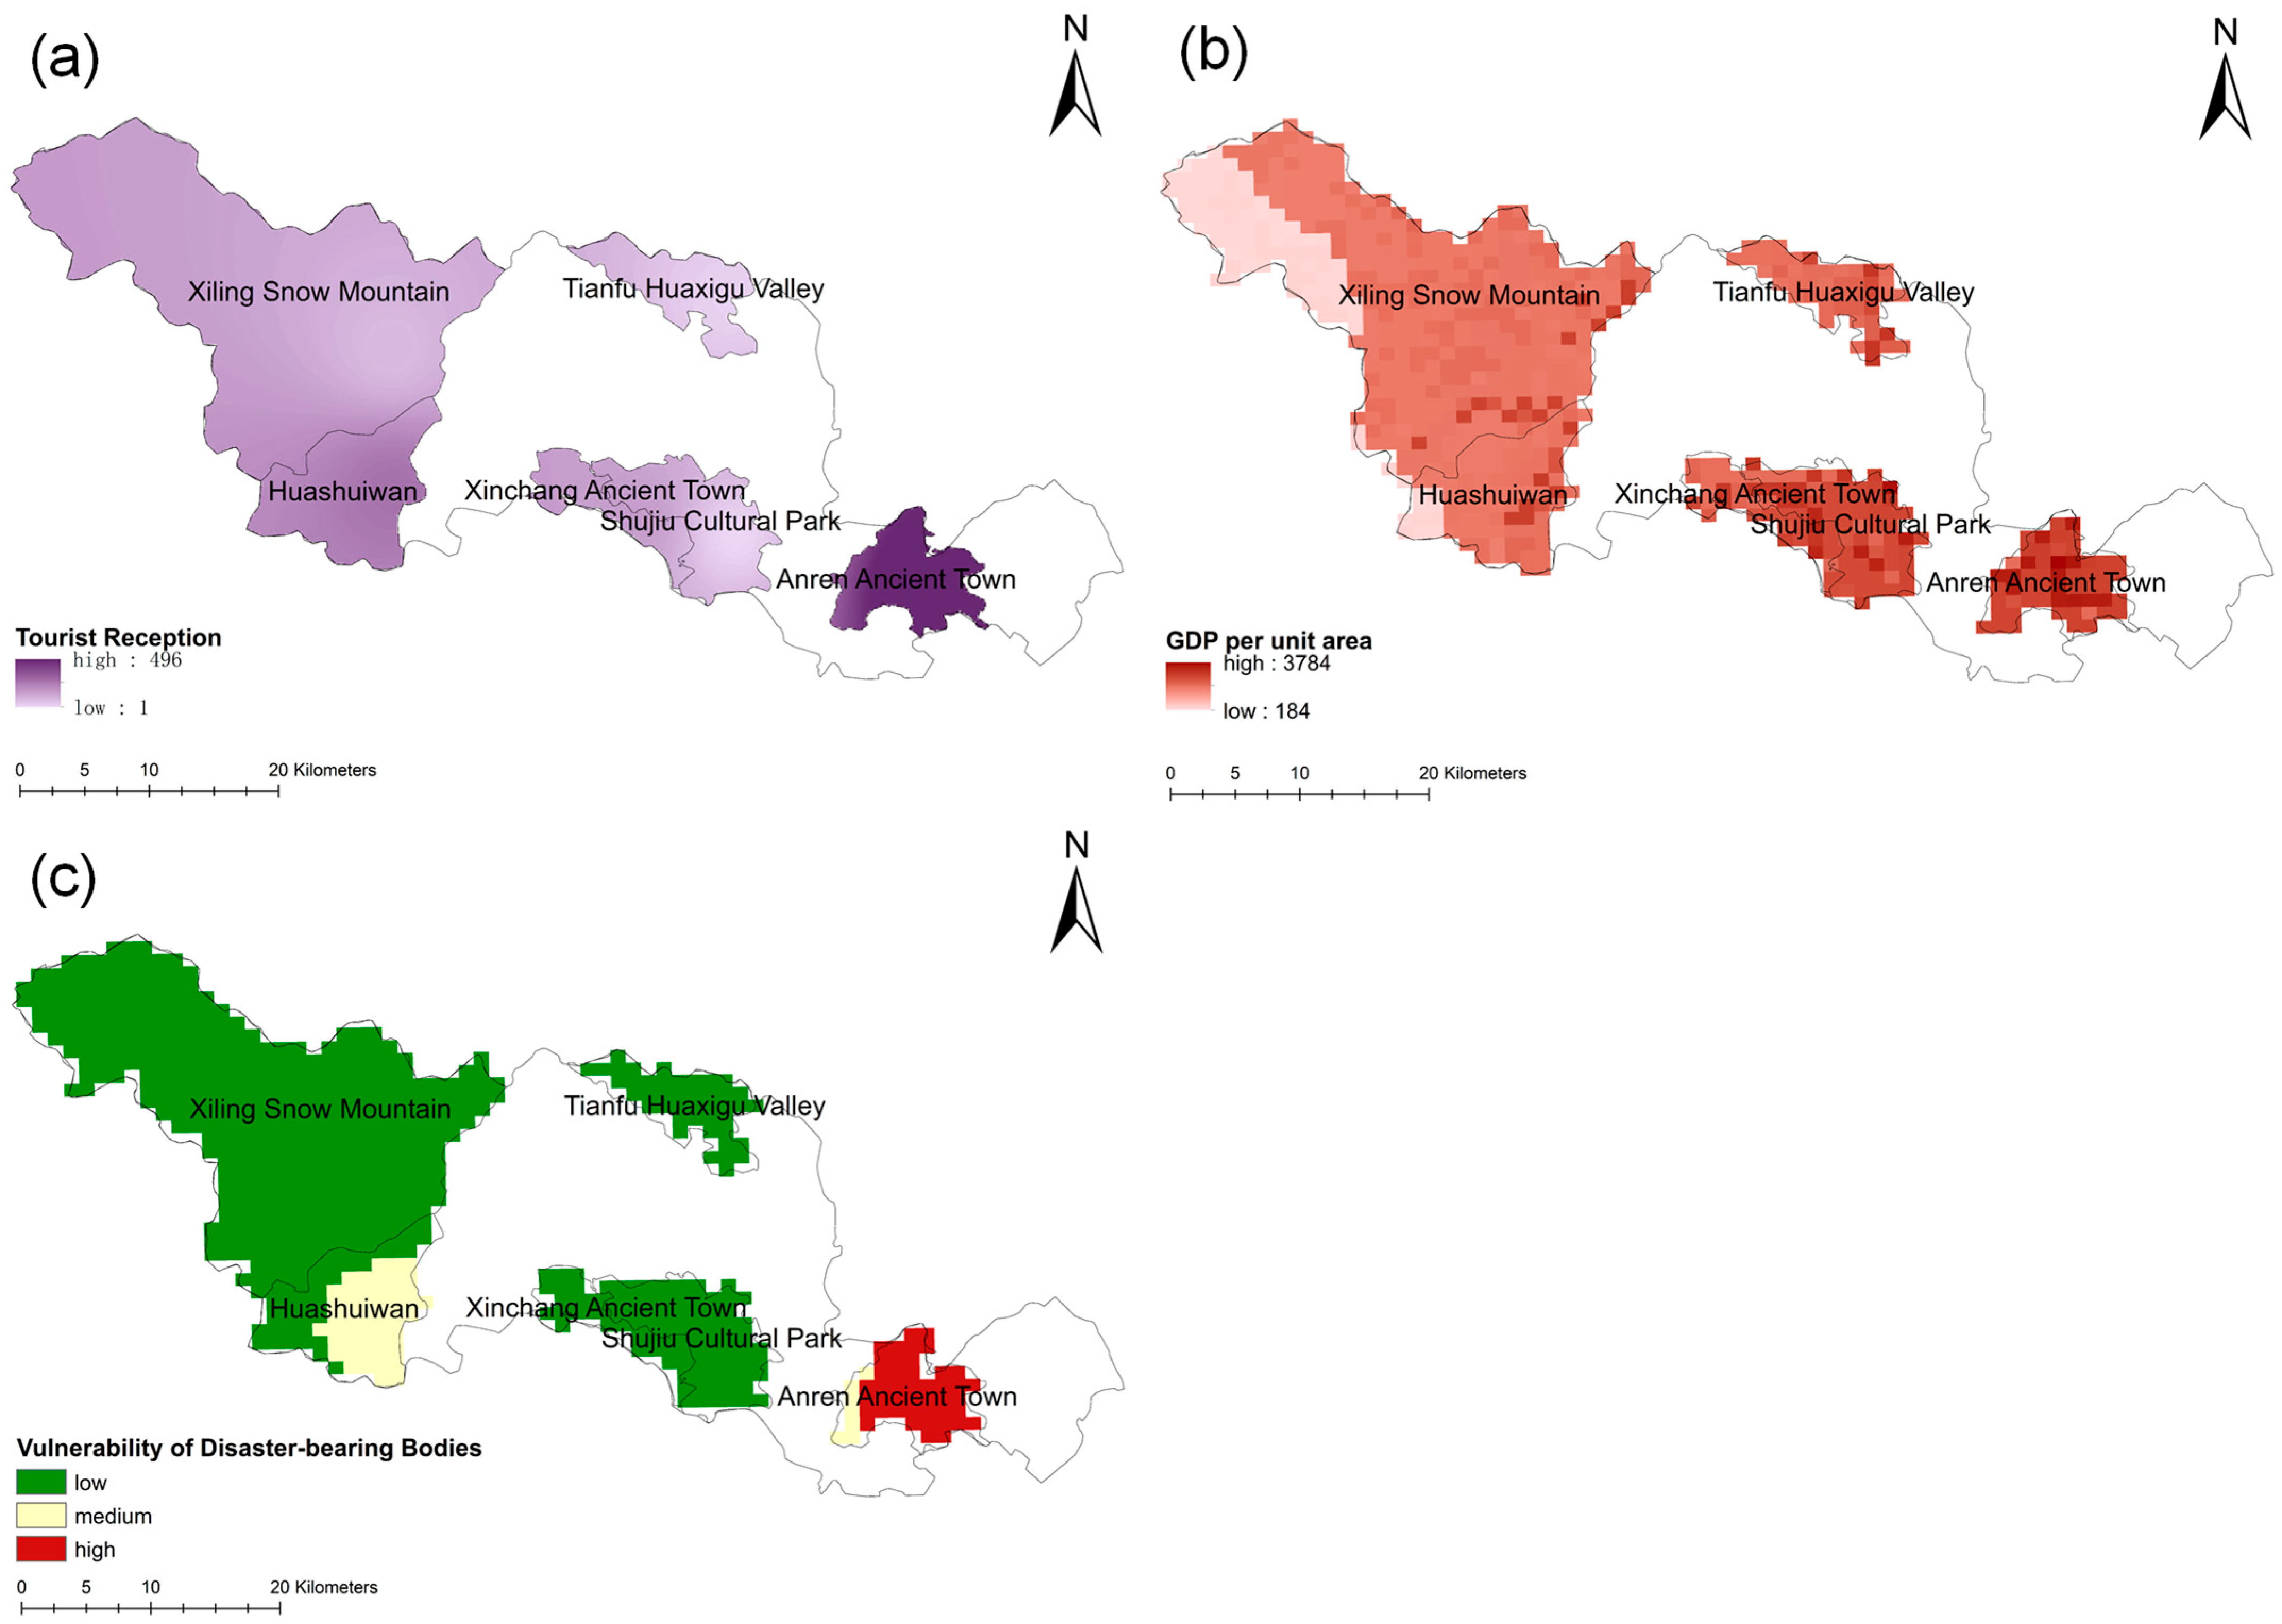
For tourist attractions, vulnerability refers to the likelihood and potential magnitude of losses under meteorological disasters, encompassing tourist casualties, economic damage, and resource degradation. Tourist receptions (Figure 8a) and GDP per unit area (Figure 8b) were assigned corresponding weights. An overlay calculation was performed to generate the vulnerability zoning map of meteorological disasters at major tourist attractions in Dayi County (Figure 8c). Analysis of Figure 8 indicates a high vulnerability level in Anren Ancient Town. Huashuiwan exhibits a moderate level. Xinchang Ancient Town, Shujiu Cultural Park, Tianfu Huaxigu Valley, and most areas of Xiling Snow Mountain exhibit lower vulnerability levels. The economic density remains comparable across these surrounding attractions. Anren Ancient Town accommodates a substantially larger volume of tourists. This specific demographic factor likely contributes to a heightened vulnerability to disaster impacts [37].

3.5. Disaster Prevention and Mitigation Capacity (C) of Meteorological Disasters for Major Tourist Attractions in Dayi County

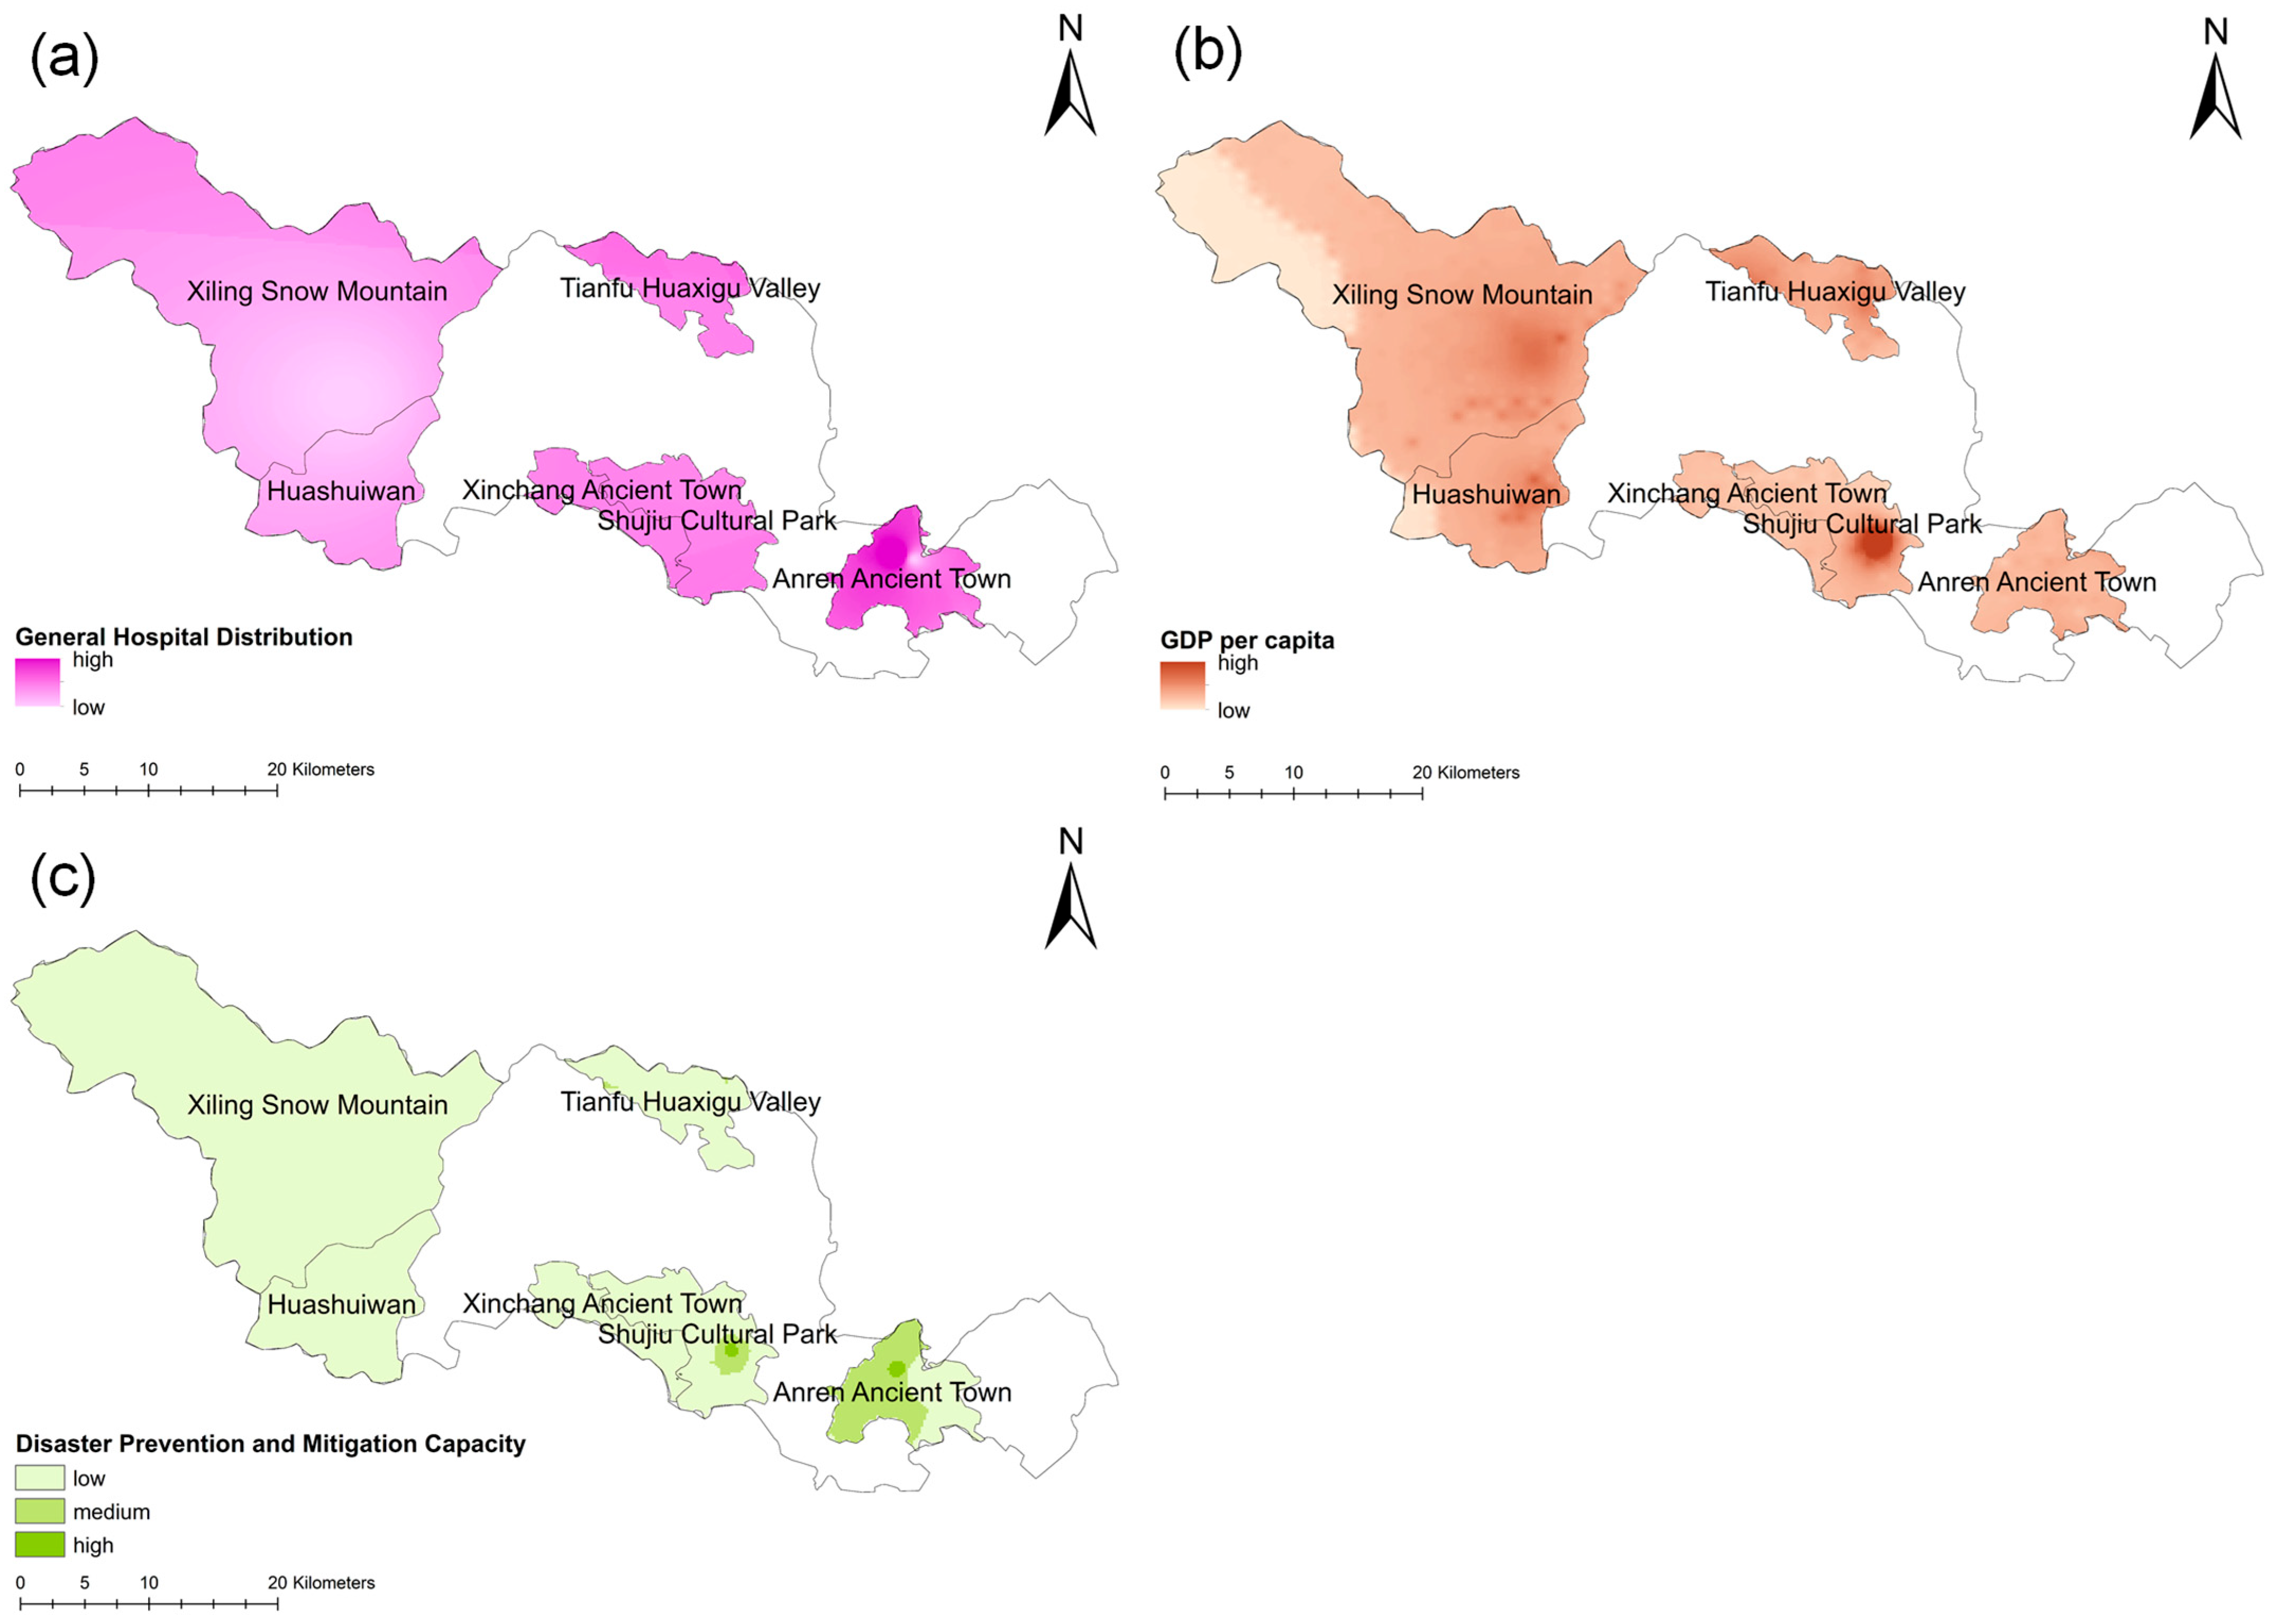
Disaster prevention and mitigation capacity refers to the ability of affected areas to resist meteorological hazards. In this study, the number of general hospitals (Figure 9a) and GDP per capita (Figure 9b) are used to characterize disaster prevention, emergency medical rescue, and recovery capabilities at the attractions in Dayi County. Based on the assigned weights for each factor layer, raster overlay analysis and the natural breaks method were applied to generate the disaster prevention and mitigation capacity zoning map of meteorological disasters at major tourist attractions in Dayi County (Figure 9c). Results indicate that attractions across Dayi County possess a solid foundation for disaster prevention and mitigation. Anren Ancient Town and Shujiu Cultural Park exhibit a stronger capacity. Xiling Snow Mountain and Huashuiwan demonstrate moderate capacity. The areas hosting Anren Ancient Town and Shujiu Cultural Park benefit from relatively advanced economic development and a high concentration of medical resources, fostering a robust disaster prevention infrastructure. Complex topographic constraints restrict the distribution of emergency medical facilities in the Xiling Snow Mountain and Huashuiwan regions. These geographic barriers prolong emergency response times. Such physical obstacles also complicate transport rescue operations. These combined logistical challenges appear to reduce the overall disaster mitigation capacity. Accordingly, these vulnerable mountainous areas represent critical priorities for future safety management and policy interventions.

3.6. Comprehensive Risk Assessment of Meteorological Disasters for Major Tourist Attractions in Dayi County

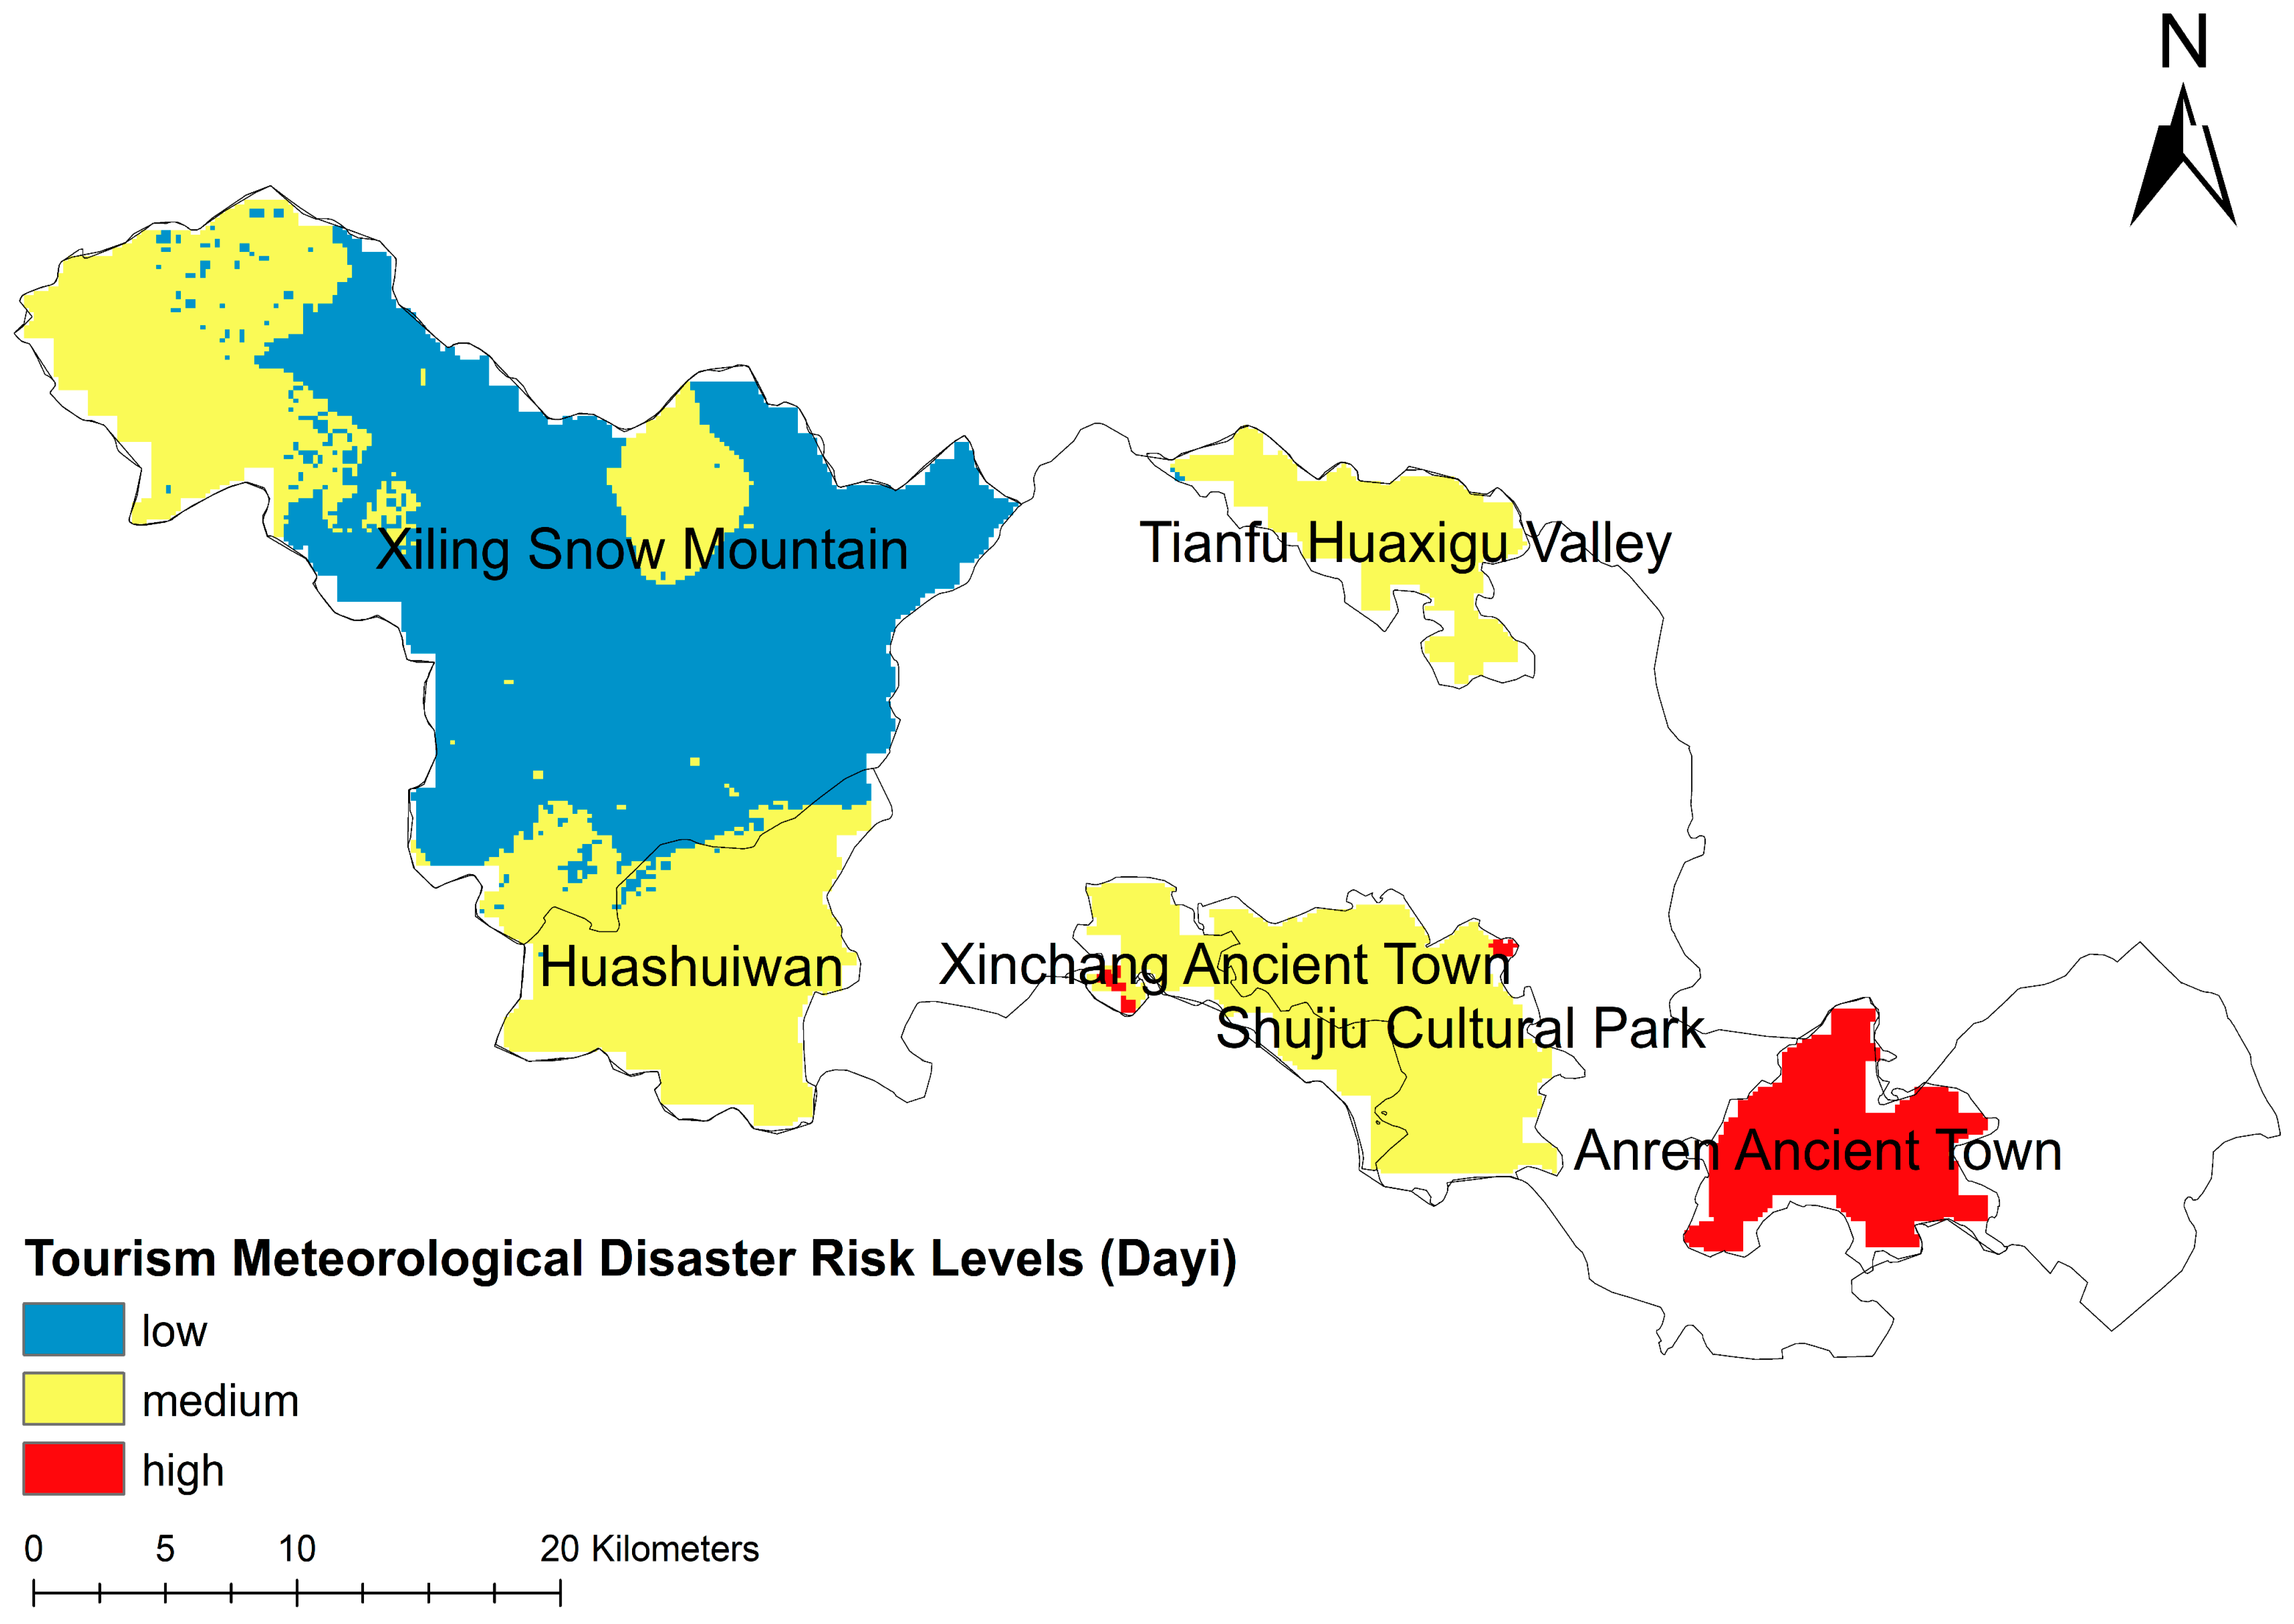
Using the zoning maps of the four evaluation units—hazard, environmental sensitivity, vulnerability, and disaster prevention and mitigation capacity—local climate factors and the specific conditions of tourist attractions in Dayi County were considered. The four components were integrated in ArcGIS according to their assigned weights. The resulting composite values were classified into three levels using the natural breaks method: lower, moderate, and higher risk. This produced the comprehensive risk assessment zoning map of meteorological disasters at major tourist attractions in Dayi County (Figure 10). Disaster risk across the county increases gradually from west to east. Anren Ancient Town is classified as a higher-risk zone. Shujiu Cultural Park, Xinchang Ancient Town, Tianfu Huaxigu Valley, and Huashuiwan in the central region are moderate-risk zones. Most areas of Xiling Snow Mountain are lower-risk zones. In particular, Anren Ancient Town faces high extreme heat hazards, low-lying environmental sensitivity, and a dense concentration of tourists, creating an elevated vulnerability. These three factors co-amplify. This synergistic effect likely contributes to a high-risk spatial pattern. This pattern is primarily driven by intense human activities. The western mountainous regions experience a high frequency of multi-hazard events, such as severe rainstorms. Despite these threats, a robust ecological barrier and sparse tourist density characterize these areas. These mitigating conditions effectively buffer the composite risk. An overall lower risk level is thereby maintained.

4. Discussion and Conclusions

4.1. Discussion

This study focuses on the county scenic-area scale, aiming to scientifically quantify the exposure characteristics and potential economic loss risks in the cultural tourism industry of Dayi County. Meteorological data from 25 stations over the past decade (2014–2023) and socioeconomic data were utilized. A comprehensive meteorological disaster risk assessment was conducted for six major tourist attractions in Dayi County, Chengdu, Sichuan Province, China. These sites include Xiling Snow Mountain, Huashuiwan, Anren Ancient Town, Xinchang Ancient Town, Tianfu Huaxigu Valley, and Shujiu Cultural Park. The evaluation model integrates four dimensions: hazard, environmental sensitivity, asset vulnerability, and disaster mitigation capacity. Spatial interpolation and overlay analysis were performed in ArcGIS. These spatial procedures generated a meteorological disaster risk zoning map for the major attractions. The analysis reveals a distinct “east-high, west-low” spatial risk pattern. Spatially, Anren Ancient Town falls within the high-risk zone, Xiling Snow Mountain occupies the low-risk zone, and the central attractions form a moderate-risk cluster.
The high risk in Anren Ancient Town appears to stem from the spatial overlap of multiple adverse conditions. Cultural tourism activities interact with urbanized underlying surfaces and low-lying terrain. This interaction may facilitate pluvial flooding during severe rainstorms. Additionally, dense artificial structures generate a pronounced urban heat island effect, likely amplifying extreme high-temperature hazards. This attraction also holds substantial cultural tourism assets and hosts large visitor volumes. These socioeconomic factors appear to elevate spatial exposure. Conversely, most areas of Xiling Snow Mountain in the western high-altitude mountains fall within the lower-risk category. This finding deviates from the intuitive assumption of higher risk in rugged mountain terrain with frequent disasters. The western mountainous region experiences frequent rainstorms and active physical hazards. Despite these active drivers, dense vegetation cover is likely to intercept surface runoff. Simultaneously, the steep topography may facilitate rapid drainage. A low visitor density also appears to reduce the potential loss equivalents of physical hazards. These results align with previous findings. The regulatory effects of exposure and vulnerability on composite risk often outweigh variations in physical hazard drivers [28]. The vulnerability landscape essentially reflects the complex interaction among exposure, sensitivity, and adaptive capacity [26,27].
Statistical uncertainties may arise from the short time series of station data. The 45-year ChinaMet dataset was introduced for hazard zonation. This extensive dataset verified the long-term stability of the “west-low, east-high” spatial hazard pattern in Dayi County. This verification process provides reliable hazard inputs for the subsequent composite risk integration.
Risk assessments based on indicator weighting and spatial interpolation inherently contain certain uncertainties. These uncertainties require careful consideration during interpretation. The Analytic Hierarchy Process (AHP) was utilized in the indicator weighting phase. This method successfully passed the consistency check. Despite this validation, the valuation of the judgment matrix still involves subjective cognitive limitations. The topography of Dayi County is characterized by high elevations in the west and low elevations in the east. This specific terrain exhibits significant vertical climate differences. Meteorological stations are relatively sparse in the complex western high-altitude mountainous areas. This sparse distribution may fail to capture climate extremes accurately. Additionally, the application of Inverse Distance Weighting (IDW) interpolation inevitably generates a spatial smoothing effect. The Natural Breaks classification method is highly sensitive to data distribution patterns. This sensitivity is likely to shift the absolute risk levels of individual townships across different classification tiers.
External spatiotemporal data and scale constraints point toward relevant directions for future in-depth research. Regarding the spatial scale, township units were used as substitutes for scenic area boundaries. This substitution introduces a certain degree of spatial error. Future research could integrate high-resolution satellite imagery with precise scenic boundaries. This integration would advance refined assessments at the micro-scale [38]. At the local level, detailed historical meteorological disaster records and tourist casualty statistics are lacking. This data deficiency currently prevents the cross-validation of risk zonation results against actual disaster loss data. Relevant disaster databases will gradually be established and improved in the future. These future databases should be utilized to verify risk assessment results using actual disaster loss data. This subsequent verification would enhance the external validity and loss prediction accuracy of the risk zonation. Future climate change scenarios were not considered in this study. The concurrent increase in the frequency and intensity of extreme meteorological events under global warming is likely to reshape the long-term risk landscape of tourist attractions in Dayi County. Prospective risk estimation based on CMIP6 and other climate scenario data represents an essential direction for future research [39,40].

4.2. Conclusions

By constructing a comprehensive risk assessment model, this study systematically decoded the spatial distribution of meteorological disaster risks across county-level scenic areas in Dayi County. The findings suggest that composite meteorological disaster risk in tourism destinations is not determined solely by natural hazard conditions. Asset exposure and vulnerability also serve as critical drivers of the spatial risk pattern. Disaster risk in tourism destinations is fundamentally a product of the deep coupling between natural and social systems. Consequently, any single-dimension assessment may fail to accurately capture the true risk profile of scenic areas [41,42].
This study provides a township-scale case example for disaster research in high-elevation gradient transition zones, offering practical value for tourism development and safety governance in Dayi County. Based on the hazard levels of individual attractions, differentiated mitigation and management strategies are suggested. For the eastern plain areas with higher composite risk, spatial planning should incorporate micro-scale flood prevention standards and heat island response mechanisms. Emergency evacuation networks for high-density visitor flows during peak periods should be improved. For the central and western mountain scenic areas, the disaster prevention focus might shift toward eliminating meteorological monitoring blind spots, enhancing geological hazard inspections, and strengthening communication security capabilities during extreme events.

Supplementary Materials

The following supporting information can be downloaded at: https://www.mdpi.com/article/10.3390/atmos17060551/s1. Figure S1: Validation of hazard (H) zoning using ChinaMet (1980–2024) for major tourist attractions in Dayi County.

Author Contributions

Conceptualization, S.G. and J.L.; methodology, S.G. and J.L.; software, S.G.; validation, S.G. and J.L.; formal analysis, S.G.; investigation, S.G., J.X., Q.J. and R.O.; resources, J.X., Q.J. and R.O.; data curation, S.G., J.X., Q.J. and R.O.; writing—original draft preparation, S.G.; writing—review and editing, J.L., J.X., Q.J. and R.O.; visualization, S.G.; supervision, J.L.; project administration, J.L.; funding acquisition, J.L. All authors have read and agreed to the published version of the manuscript.

Funding

This research was funded by the Science and Technology Planning Project of Sichuan Province (grant number 2024NSFSC1986) and the Open Research Fund of the Sichuan Key Laboratory of Plateau Atmosphere and Environment (grant number PAEKL-2024-K09).

Institutional Review Board Statement

Not applicable.

Informed Consent Statement

Not applicable.

Data Availability Statement

The data presented in this study are available on request from the corresponding author due to privacy.

Acknowledgments

The authors would like to thank the Dayi County Meteorological Bureau for providing the meteorological data used in this study.

Conflicts of Interest

The authors declare no conflicts of interest.

References

  1. IPCC. Climate Change 2023: Synthesis Report; IPCC: Geneva, Switzerland, 2023. [Google Scholar]
  2. Scott, D.; Gössling, S.; Hall, C.M. International tourism and climate change. WIREs Clim. Change 2012, 3, 213–232. [Google Scholar]
  3. Pang, S.F.H.; McKercher, B.; Prideaux, B. Climate Change and Tourism: An Overview. Asia Pac. J. Tour. Res. 2013, 18, 4–20. [Google Scholar] [CrossRef]
  4. Dogru, T.; Marchio, E.A.; Bulut, U.; Suess, C. Climate change: Vulnerability and resilience of tourism and the entire economy. Tour. Manag. 2018, 72, 292–305. [Google Scholar] [CrossRef]
  5. Sun, Y.; Yang, Q.; Chen, P. A Study of Spatial Evolution Patterns of Tourist Destinations Disaster Risks. J. Risk Anal. Crisis Response 2018, 8, 35–42. [Google Scholar] [CrossRef][Green Version]
  6. Ma, H.; Chiu, Y.H.; Tian, X.; Zhang, J.; Guo, Q. Safety or Travel: Which Is More Important? The Impact of Disaster Events on Tourism. Sustainability 2020, 12, 3038. [Google Scholar] [CrossRef]
  7. Cárdenas-Hernández, V.; Melo-Aguilar, C.; Rosselló-Nadal, J. Extreme weather events in tourism climate indices. Tour. Econ. 2026, 32, 387–407. [Google Scholar] [CrossRef]
  8. Kelman, I. Tourism geographies and disaster risk: A state-of-the-art review and agenda. Curr. Issues Tour. 2024, 28, 810–818. [Google Scholar] [CrossRef]
  9. Shi, P.J. Theory and practice on disaster system research in a fourth time. J. Nat. Disasters 2005, 14, 1–7. (In Chinese) [Google Scholar]
  10. Shi, P.J. Disaster Risk Science; Springer: Singapore, 2019. [Google Scholar]
  11. Cutter, S.L.; Barnes, L.; Berry, M.; Burton, C.; Evans, E.; Tate, E.; Webb, J. A place-based model for understanding community resilience to natural disasters. Glob. Environ. Change 2008, 18, 598–606. [Google Scholar] [CrossRef]
  12. Kappes, M.S.; Keiler, M.; von Elverfeldt, K.; Glade, T. Challenges of analyzing multi-hazard risk: A review. Nat. Hazards 2012, 64, 1925–1958. [Google Scholar] [CrossRef]
  13. Stalhandske, Z.; Steinmann, C.B.; Meiler, S.; Sauer, I.J.; Vogt, T.; Bresch, D.N.; Kropf, C.M. Global multi-hazard risk assessment in a changing climate. Sci. Rep. 2024, 14, 5875. [Google Scholar] [CrossRef] [PubMed]
  14. Yang, W.; Olsson, J.; Berg, P.; Simonsson, L. Weather warning archives reveal spatio-temporal hot spots of compound natural hazards. Sci. Rep. 2025, 15, 13330. [Google Scholar] [CrossRef]
  15. Chen, Y.; Ye, Z.; Liu, H.; Chen, R.; Liu, Z.; Liu, H. A GIS-Based Approach for Flood Risk Zoning by Combining Social Vulnerability and Flood Susceptibility: A Case Study of Nanjing, China. Int. J. Environ. Res. Public Health 2021, 18, 11597. [Google Scholar] [CrossRef]
  16. Gao, C.; Zhang, B.; Shao, S.; Hao, M.; Zhang, Y.; Xu, Y.; Kuang, Y.; Dong, L.; Wang, Z. Risk assessment and zoning of flood disaster in Wuchengxiyu Region, China. Urban Clim. 2023, 49, 101562. [Google Scholar] [CrossRef]
  17. Zovko, M.; Marković Vukadin, I.; Zovko, D. Understanding the IPCC Climate Risk-Centered Framework and Its Applications to Assessing Tourism Resilience. Geographies 2025, 5, 45. [Google Scholar] [CrossRef]
  18. Sharma, G.D.; Taheri, B.; Chopra, R.; Parihar, J.S. Relationship between climate change and tourism: An integrative review. Serv. Ind. J. 2025, 45, 426–453. [Google Scholar] [CrossRef]
  19. Ólafsdóttir, R.; Runnström, M.C. A GIS approach to evaluating ecological sensitivity for tourism development in fragile environments. Scand. J. Hosp. Tour. 2009, 9, 22–38. [Google Scholar] [CrossRef]
  20. Ghorbanzadeh, O.; Pourmoradian, S.; Blaschke, T.; Feizizadeh, B. Mapping potential nature-based tourism areas by applying GIS-decision making systems in East Azerbaijan Province, Iran. J. Ecotour. 2019, 18, 261–283. [Google Scholar] [CrossRef]
  21. Suhono, H.A.R.; Pratiwi, R.A.; Kurniadhi, A. GIS-based environmental assessment of selected prioritized tourist attractions on Lombok Island. IOP Conf. Ser. Earth Environ. Sci. 2020, 592, 012014. [Google Scholar] [CrossRef]
  22. Tran, T.A.; Le, N.H.; Saizen, I.; Truong, P.M.; Vo, V.M.; Nguyen, T.K.T.; Nguyen, V.L. GIS-based assessment of coastal tourism vulnerability to climate change—Case study in Danang City, Vietnam. In Proceedings of the 42nd Asian Conference on Remote Sensing (ACRS 2021), Hanoi, Vietnam, 22–26 November 2021. [Google Scholar]
  23. Sadeghi, H.; Javan, F. Vulnerability of Iranian tourism villages in terms of Landslide hazard using GIS. Geography 2025, 23, 153–170. [Google Scholar]
  24. Kasiyanchuk, D.; Atamaniuk, Y.; Deputat, M.; Gavdey, S.; Horishevskyi, P. From suitability to vulnerability: A GIS-based framework for assessing environmental sensitivity of mountain tourism landscapes in the Ukrainian Carpathians. J. Bulg. Geogr. Soc. 2026, 54, 59–92. [Google Scholar] [CrossRef]
  25. Mitrică, B.; Șerban, P.R.; Roznoviețchi, I.; Micu, D.; Persu, M.; Grigorescu, I.; Amihăesei, V.; Dumitrașcu, M.; Damian, N. The Tourism Sector’s Vulnerability to Climate Change-Related Phenomena. Case Study: Romania. Int. J. Disaster Risk Reduct. 2025, 118, 105248. [Google Scholar] [CrossRef]
  26. Manisha, K.; Singh, I.; Jain, M. Assessing and Mapping Tourism Vulnerability Using Remote Sensing and Spatial Analysis Techniques: A Case of Shimla District in Himachal Pradesh, India. In Geoinformatics for Hilly Regions; Chettry, V., Kaur, H., Praharaj, S., Dahiya, B., Eds.; Springer: Singapore, 2025; pp. 165–188. [Google Scholar] [CrossRef]
  27. Manisha, K. Methodological approach to assess tourism vulnerability in Himachal Pradesh, India using RS and GIS. Nat. Hazards 2026, 122, 377. [Google Scholar] [CrossRef]
  28. Agulles, M.; Melo-Aguilar, C.; Jordà, G. Risk of loss of tourism attractiveness in the Western Mediterranean under climate change. Front. Clim. 2022, 4, 1019892. [Google Scholar] [CrossRef]
  29. Zhang, L.; Li, X.; Zheng, D.; Zhang, K.; Ma, Q.; Zhao, Y.; Ge, Y. Merging multiple satellite-based precipitation products and gauge observations using a novel double machine learning approach. J. Hydrol. 2021, 594, 125969. [Google Scholar] [CrossRef]
  30. Hu, Y.; Zhang, L. Added value of merging techniques in precipitation estimates relative to gauge-interpolation algorithms of varying complexity. J. Hydrol. 2024, 645, 132214. [Google Scholar] [CrossRef]
  31. Saaty, T.L. How to make a decision: The analytic hierarchy process. Eur. J. Oper. Res. 1990, 48, 9–26. [Google Scholar] [CrossRef]
  32. Wang, X.K.; Li, Z.; Yang, H.; Wang, J.Y.; Wang, X.F. Study on the spatial-temporal characteristics of heavy rain and the disaster risk zoning on Henan Power Grid. Torrential Rain Disasters 2018, 37, 534–542. (In Chinese) [Google Scholar]
  33. Wen, X.; Zhang, P.; Dai, E. High Temperature Risk Assessment at the Municipal Scale in China. J. Resour. Ecol. 2023, 14, 399–409. [Google Scholar] [CrossRef]
  34. Wu, Z.; Xu, H.; Li, Y.; Wen, L.; Li, J.; Lu, G.; Li, X. Climate and drought risk regionalisation in China based on probabilistic aridity and drought index. Sci. Total Environ. 2018, 612, 513–521. [Google Scholar] [CrossRef] [PubMed]
  35. DB51/T 2829-2021; Technical Specifications for Risk Assessment of Heavy Rainfall and Flood Disasters. Sichuan Provincial Market Supervision Administration: Chengdu, China, 2021. (In Chinese)
  36. Ruan, D.C.; Yuan, S.J.; Huang, P.; Yang, S.; Jin, L. Tourism risk assessment of rainstorm disasters in the Longmenshan region of Sichuan Province. Plateau Mt. Meteorol. Res. 2023, 43, 134–142. (In Chinese) [Google Scholar]
  37. Yan, B.; Li, S.; Wang, J.; Ge, Z.; Zhang, L. Socio-Economic Vulnerability of the Megacity of Shanghai (China) to Sea-Level Rise and Associated Storm Surges. Reg. Environ. Change 2016, 16, 1443–1456. [Google Scholar] [CrossRef]
  38. Chalazas, T.; Chatzistratis, D.; Stamatiadou, V.; Monioudi, I.N.; Katsanevakis, S.; Velegrakis, A.F. Integrated Coastal Zone Management in the Face of Climate Change: A Geospatial Framework for Erosion and Flood Risk Assessment. Water 2026, 18, 284. [Google Scholar] [CrossRef]
  39. Try, S.; Qin, X. Evaluation of Future Changes in Climate Extremes over Southeast Asia Using Downscaled CMIP6 GCM Projections. Water 2024, 16, 2207. [Google Scholar] [CrossRef]
  40. Babaousmail, H.; Ayugi, B.; Rajasekar, A.; Zhu, H.; Oduro, C.; Mumo, R.; Ongoma, V. Projection of Extreme Temperature Events over the Mediterranean and Sahara Using Bias-Corrected CMIP6 Models. Atmosphere 2022, 13, 741. [Google Scholar] [CrossRef]
  41. Szlafsztein, C.; Sterr, H. A GIS-based vulnerability assessment of coastal natural hazards, state of Pará, Brazil. J. Coast. Conserv. 2007, 11, 53–66. [Google Scholar] [CrossRef]
  42. Birkmann, J.; Cardona, O.D.; Carreño, M.L.; Barbat, A.H.; Pelling, M.; Schneiderbauer, S.; Kienberger, S.; Keiler, M.; Alexander, D.; Zeil, P.; et al. Framing vulnerability, risk and societal responses: The MOVE framework. Nat. Hazards 2013, 67, 193–211. [Google Scholar] [CrossRef]
Figure 1. DEM and spatial distribution of meteorological stations for major tourist attractions in Dayi County.
Atmosphere 17 00551 g001
Figure 2. Methodological workflow for tourism meteorological disaster risk assessment at major scenic areas in Dayi County.
Atmosphere 17 00551 g002
Figure 3. Hazard (H) zoning of rainstorm disasters for major tourist attractions in Dayi County. (a) Distribution of level 1 rainstorms, (b) Distribution of level 2 rainstorms, (c) Distribution of level 3 rainstorms, (d) Distribution of level 4 rainstorms, (e) Distribution of level 5 rainstorms, and (f) Hazard zoning of rainstorms and floods.
Atmosphere 17 00551 g003
Figure 4. Hazard (H) zoning of high temperature and heatwave disasters for major tourist attractions in Dayi County. (a) Annual number of high-temperature days, (b) Annual maximum temperature, (c) Hazard zoning of high temperatures and heatwaves.
Atmosphere 17 00551 g004
Figure 5. Hazard (H) zoning of drought disasters for major tourist attractions in Dayi County. (a) Grade 1: normal, (b) Grade 2: moderate drought, (c) Grade 3: severe drought, (d) Grade 4: extreme drought, and (e) Hazard zoning of drought disasters.
Atmosphere 17 00551 g005
Figure 6. Comprehensive hazard (H) zoning of meteorological disasters for major tourist attractions in Dayi County.
Atmosphere 17 00551 g006
Figure 7. Environmental sensitivity (S) zoning of meteorological disasters for major tourist attractions in Dayi County. (a) NDVI, (b) Topographical Impact Index, (c) River network density, and (d) Environmental sensitivity zoning.
Atmosphere 17 00551 g007
Figure 8. Vulnerability (V) zoning of meteorological disasters for major tourist attractions in Dayi County. (a) Tourist reception, (b) GDP per unit area, and (c) Vulnerability zoning.
Atmosphere 17 00551 g008
Figure 9. Disaster prevention and mitigation capacity (C) zoning of meteorological disasters for major tourist attractions in Dayi County. (a) Number of general hospitals, (b) Per capita GDP, and (c) Disaster prevention and mitigation capacity.
Atmosphere 17 00551 g009
Figure 10. Comprehensive risk assessment zoning of meteorological disasters for major tourist attractions in Dayi County.
Atmosphere 17 00551 g010
Table 1. Weight distribution of the meteorological disaster risk assessment system for major tourist attractions in Dayi County.
Target LayerEvaluation UnitWeightIndicator LayerWeightSub-Indicator Layer
Meteorological disaster risk assessment for major tourist attractions in Dayi County, ChinaHazard (H)0.44Rainstorms and Floods0.62Frequency of rainstorm events
Intensity of rainstorm events
High Temperatures and Heatwaves0.19Annual high-temperature days
Annual maximum temperature
Droughts0.19Z-index
Environmental Sensitivity (S)0.23Topographical Impact Index0.41
River Network Density0.37
NDVI0.22
Vulnerability (V)0.22Tourist arrivals0.76
GDP per Unit Area0.24
Disaster Prevention and Mitigation Capacity (C)0.11GDP per Capita0.76
Number of General Hospitals0.24
Table 2. Drought grades based on the Z-value index.
GradeZType
1−0.842 ≤ Z ≤ 0.842Normal
2−1.037 ≤ Z < −0.842Moderate drought
3−1.645 ≤ Z < −1.037Severe drought
4Z ≤ −1.645Exceptional drought
Disclaimer/Publisher’s Note: The statements, opinions and data contained in all publications are solely those of the individual author(s) and contributor(s) and not of MDPI and/or the editor(s). MDPI and/or the editor(s) disclaim responsibility for any injury to people or property resulting from any ideas, methods, instructions or products referred to in the content.