Article

A More Detailed Analysis of a Microscale Vortex near Hong Kong During the Passage of a Cold Front on the Evening of 2 March 2026


1
Hong Kong Observatory, Hong Kong, China
2
Department of Computer Science and Engineering, The Hong Kong University of Science and Technology, Hong Kong, China
*
Author to whom correspondence should be addressed.
Atmosphere 2026, 17(6), 548; https://doi.org/10.3390/atmos17060548
Submission received: 17 April 2026 / Revised: 24 May 2026 / Accepted: 26 May 2026 / Published: 27 May 2026
(This article belongs to the Section Meteorology)

Abstract

A microscale vortex embedded in a cold front over the Pearl River Estuary was observed by weather radars in Hong Kong on the evening of 2 March 2026. This paper presents an observational and simulation study of this vortex. In addition to the reflectivity and Doppler velocity data, the three-dimensional wind field associated with this vortex was analyzed using two radar-based analysis methods. Updrafts were present within the vortex, and the formation of the vortex appears to be related to the horizontal wind shear within the frontal zone and vertical motion triggered by a mid-tropospheric wave. Three commercial aircraft flew across the vortex at low altitude southwest of Lantau Island. Flight data showed marked fluctuations in vertical velocity, including both upward and downward air motions, together with severe turbulence within the vortex. The vortex is therefore of both meteorological interest and operational significance for aviation safety. The event was also simulated using the Weather Research and Forecasting (WRF) model with 200 m resolution. The model reproduced the observed vertical motions and turbulence intensity reasonably well in comparison with aircraft observations. Sensitivity tests with varying sea surface temperature and local terrain over Hong Kong showed no significant impact on the formation of the vortex, confirming that the event was primarily driven by horizontal wind shear in the frontal zone and vertical motion triggered by mid-tropospheric waves.

1. Introduction

From winter to spring over southern China, there can be occasional outbreaks of cooler continental air from the north, reaching the south China coastal region with the leading edge taking the form of a cold front [1,2]. The cold front may bring about significant convective weather, such as heavy rain and thunderstorms, along or south of the frontal zone [3,4,5], before cooler northerly flow spreads southward and becomes established. Along the cold frontal zone, the occurrence of mesoscale to microscale vortices is possible. Such vortices have long been observed along cold fronts in the mid-latitude areas. Earlier studies in the United States date back to the 1980s [6]. There is also documentation of such vortices for cold fronts in the UK, such as Smart and Browning [7]. A more recent study could be found in Clark et al. [8], which examined tornadogenesis along the cold front. Over southern China, microscale vortices can also develop along cold fronts, and under conditions of strong deep-layered vertical wind shear and high instability, supercells may even form [9,10]. When these vortices are associated with intense updrafts and vigorous convection, they can bring hazards to aviation safety. If they further extend downward to the surface, they may trigger waterspouts or tornadoes, posing threats to surface operations.
During the passage of a cold front on 2 March 2026 across southern China, a microscale vortex was observed to move over the Pearl River Estuary from west to east, and it was successfully captured by a mesoscale model (Weather Forecasting and Research model, WRF) with a spatial resolution of 200 m [11]. Only a brief overview of this vortex was given in that paper. In the present study, a more detailed analysis of this vortex is conducted:
(a)
on the observational side, some structures of the vortex are analyzed using the available data from some aircraft (commercial jets) flying through the vortex as well as three-dimensional wind field analysis based on weather radar following the method of Chan et al. [12] and Variational Doppler Radar Analysis System (VDRAS) [13,14];
(b)
in addition to the operational 200 m WRF model, some sensitivity tests are conducted for the occurrence of this vortex using WRF with a spatial resolution of 1 km, including the sensitivity of vortex formation to sea surface temperature and local terrain.
The present paper aims to improve the understanding of vortex formation along the cold fronts over southern China and could be useful for convective diagnosis and nowcasting in this region.

2. Three-Dimensional Wind Field from Weather Radars

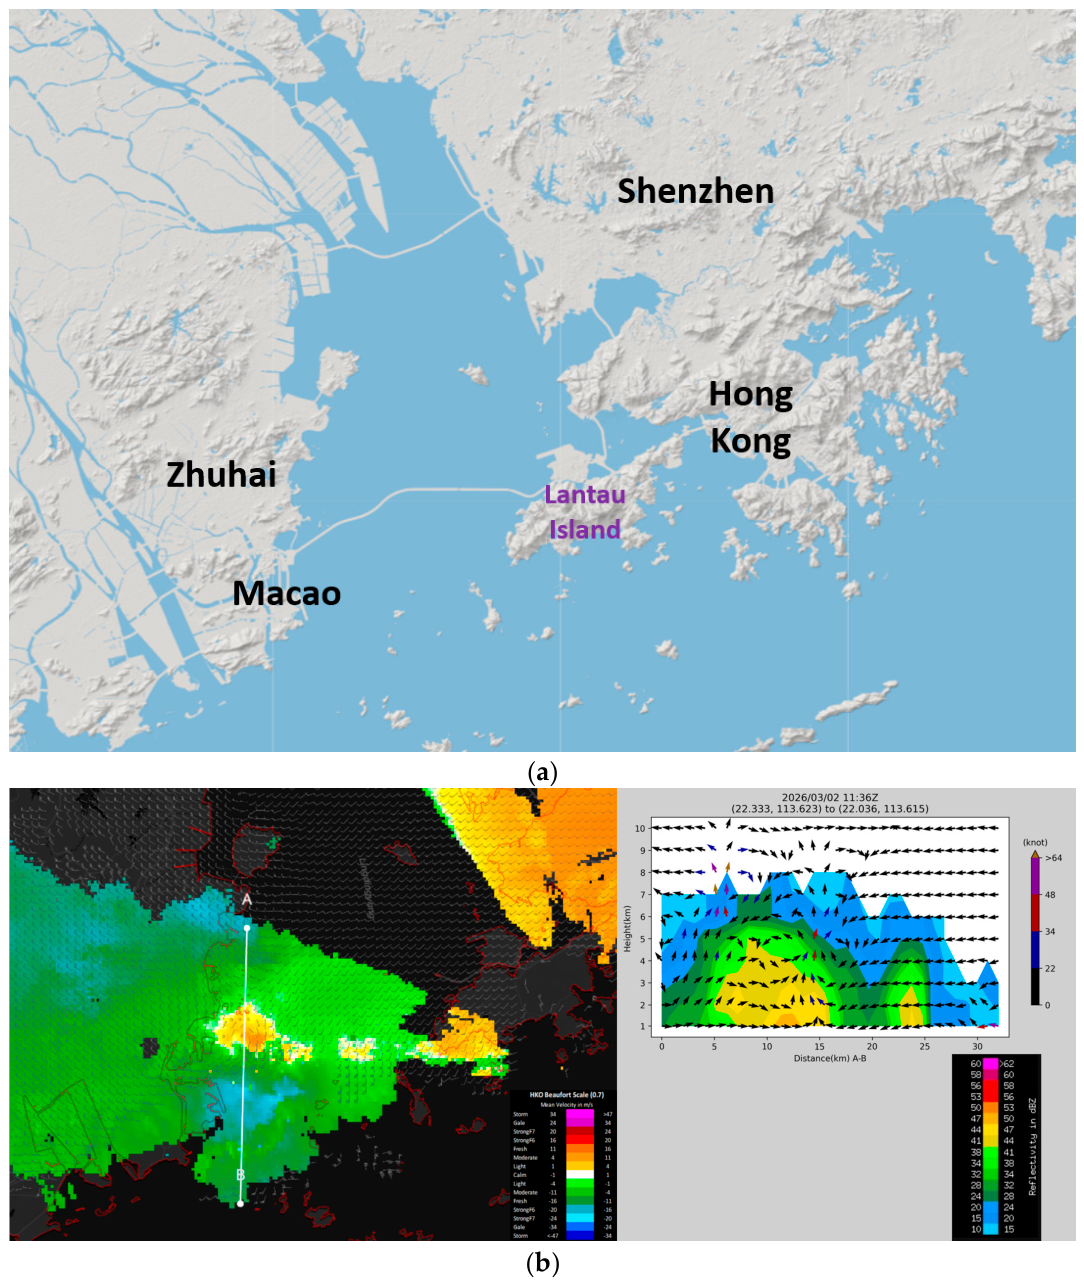
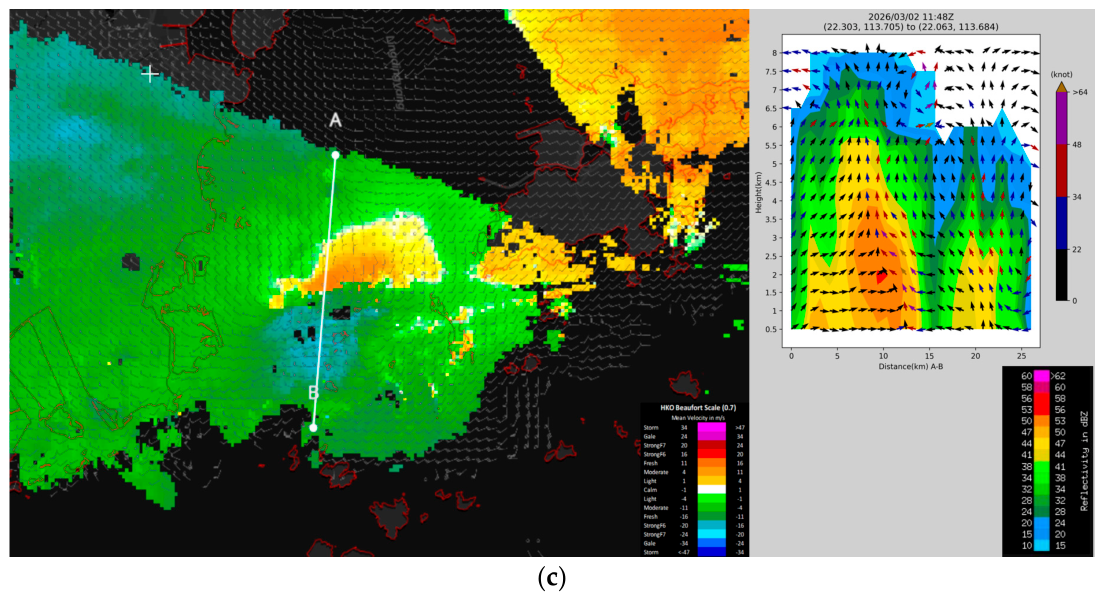
As shown in Lau et al. [11], the microscale vortex with a diameter of several kilometers was first observed over Macao from Doppler velocity imagery of weather radars. It then moved generally eastward, skirting the western coast of Lantau Island of Hong Kong and eventually reached the seas south of Hong Kong, and gradually dissipated. Following the method of Chan et al. [12] with a radar-based wind retrieval method based on a pythonic library (PyDDA) [15,16,17], the three-dimensional wind field of this vortex is analyzed based on the weather radars of Hong Kong, Shenzhen, and Zhuhai, whose spatial coverage forms a triangle with the vortex located roughly at the center. Two vertical cross sections are made (with north–south orientation) across the vortex when it is located over the Pearl River Estuary, as in Figure 1b,c.
At an earlier time, when the vortex had just left Macao (Figure 1b), the vertical cross section showed higher reflectivity together with a significant updraft in the primary circulation of the vortex, with weaker reflectivity near the center. The updraft reached as high as about 7 km above sea level. This significant updraft shows that the vortex was in a development stage. About 12 min later (Figure 1c), the reflectivity value at the core of the vortex has increased to above 50 dBZ from 1 to 4 km above sea level. The updraft remained significant for the reflectivity core at the northern part of the vortex (closer to point A), reaching a height of about 9 km above sea level. On the other hand, the reflectivity decreased in the convection at the southern part of the vortex (closer to point B), and the reflectivity core over there was mostly associated with a downdraft. Subsequently, only the northern part of the vortex remained as the southern part gradually weakened, and the system eventually evolved into a troughing flow (a sequence of radar pictures is given in Lau et al. [11]).

3. Aircraft Data

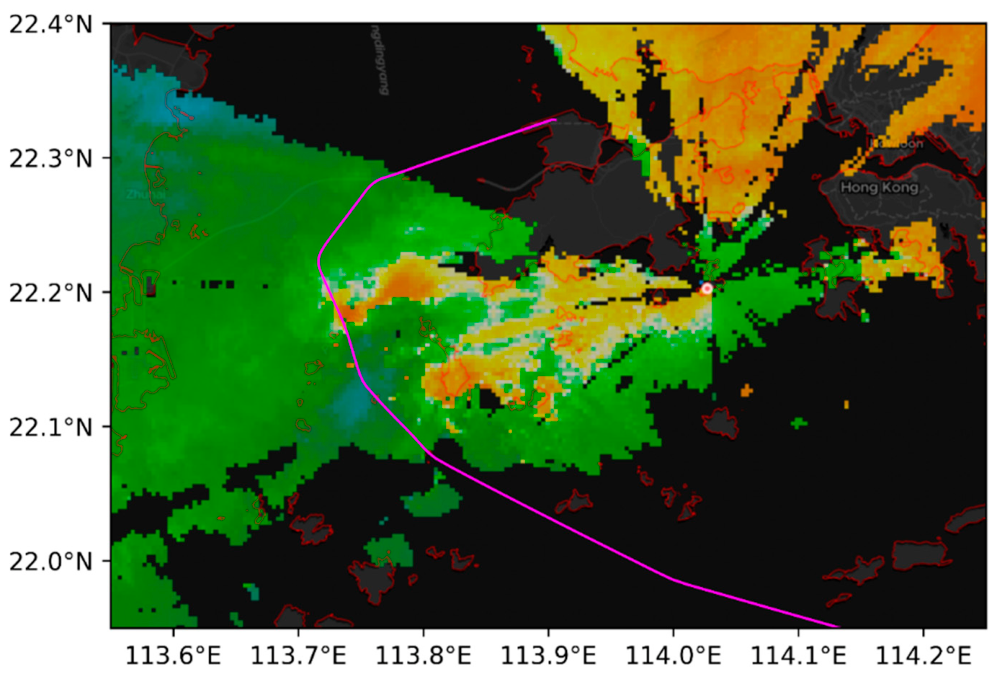
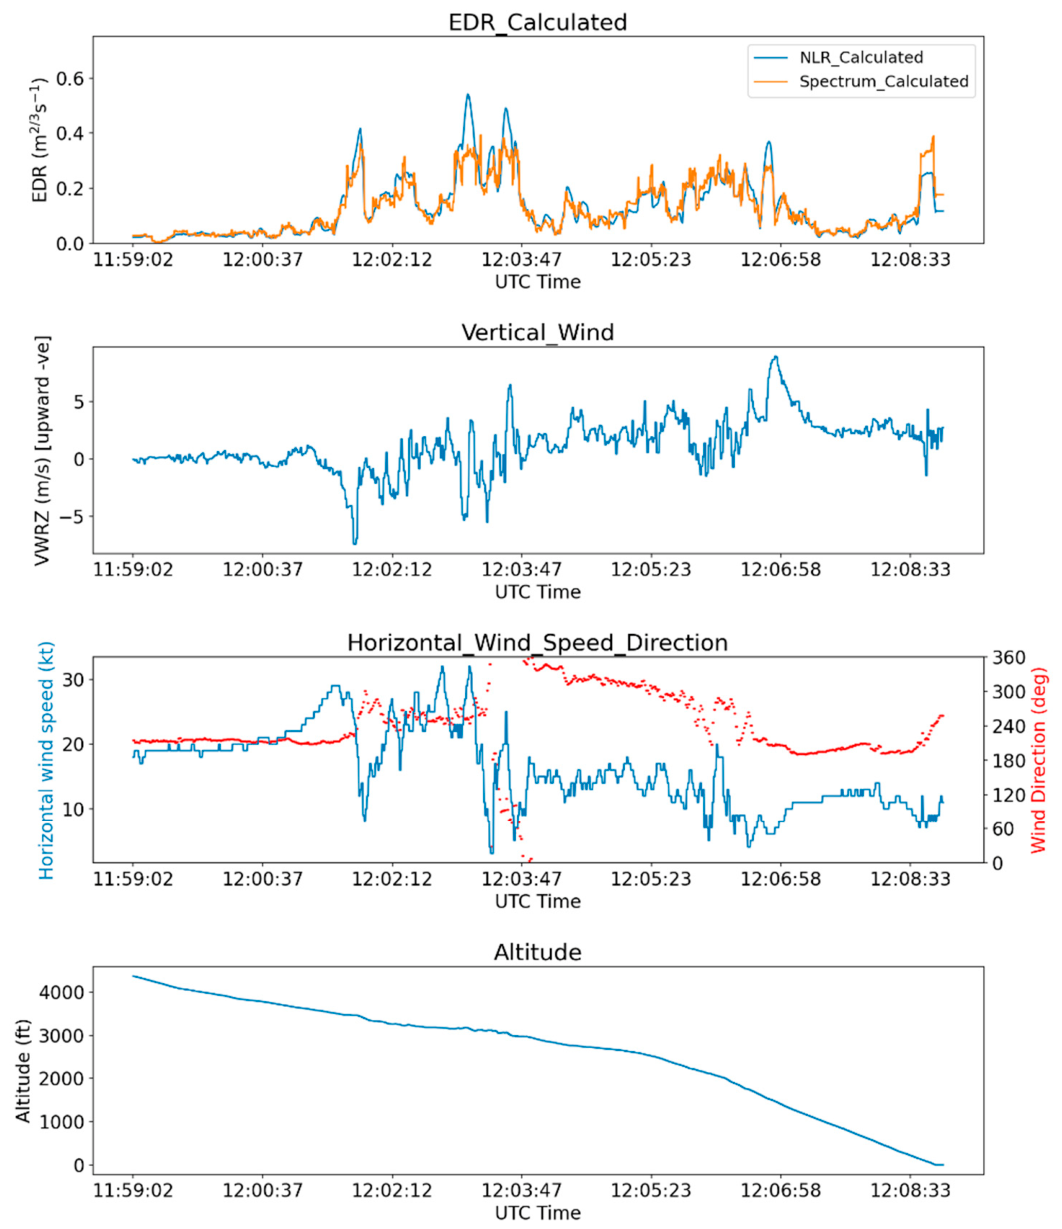
When the vortex traversed the seas to the west of Lantau Island of Hong Kong, it was located at the common descent path for aircraft arriving at the Hong Kong International Airport. Data is available from three descending flights to illustrate the internal structure of the vortex at around 12 UTC. A typical descent path of the aircraft is shown in Figure 2 for aircraft A, which travels through the core of the vortex located between 22.1 and 22.2 degrees North in latitude. The data from aircraft A is shown in Figure 3, including the eddy dissipation rate (EDR) as a metric of turbulence, vertical velocity (negative values indicate updraft), horizontal wind speed and direction, and the altitude of the aircraft. The vertical velocity is derived from Huang et al. [18], and the EDR is calculated by the algorithms of Haverdings and Chan [19] and EDR2W of Kim et al. [20], labeled as NLR and Spectrum methods in the subsequent Figure 3, Figure 4 and Figure 5, respectively, both requiring true air speed and vertical velocity for calculation. The EDR, being the cube root of the turbulent kinetic energy (TKE) dissipation rate, takes the unit of m2/3 s−1. The TKE dissipation rate is the energy per mass (m2 s−2) divided by time (s). 1 Hz flight data is used for the calculation of EDR. From the time series of horizontal wind direction and the trajectory of the aircraft A, the flight traveled through the vortex at about 12:03 UTC, during which the horizontal wind direction rotated through a full circle. Within that time interval, there were two peaks (instantaneous velocities reaching about 25 to 30 knots, consistent with radar observations of Doppler velocity of around 20 knots in Figure 1) and two dips in the horizontal wind speeds (about 5 knots or less), significant fluctuations of vertical velocity (about +/−5 m/s), and rather high values of EDR (reaching 0.6 to 0.8 m2/3 s−1, i.e., severe low-level turbulence based on ICAO [21]). From the aircraft data, the aircraft likely experienced some degree of buffeting while traversing the vortex.
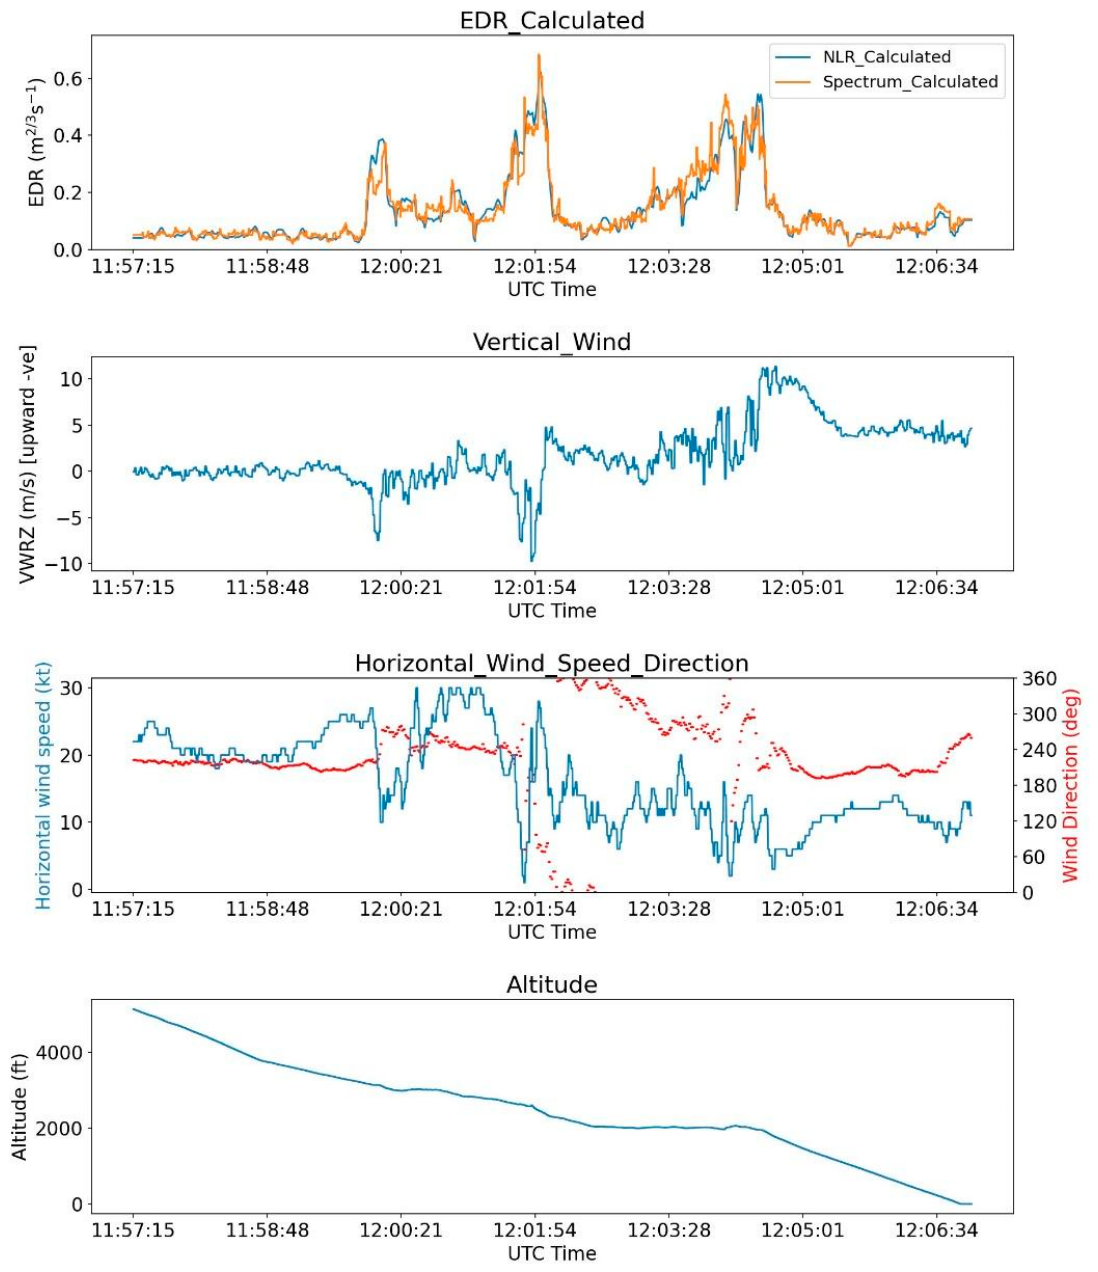
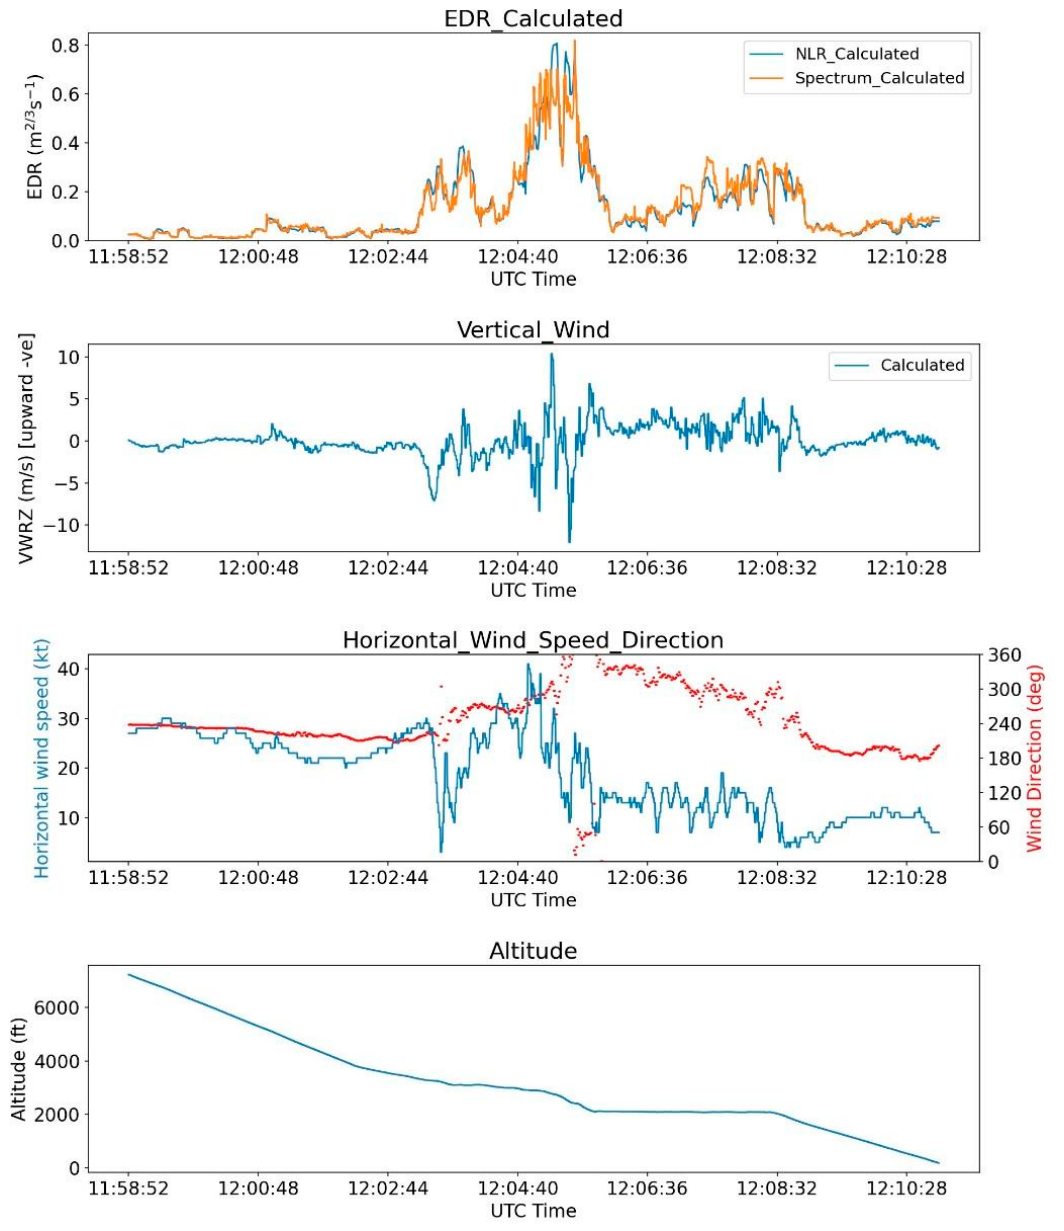
Subsequently, two other aircraft also traveled across the vortex, i.e., aircraft B (data in Figure 4) and aircraft C (data in Figure 5) at times of around 12:04 UTC and 12:05 UTC, respectively (based on the location of the flight and time intervals when there were circulating wind directions). Observations of horizontal wind speed and vertical velocity of aircraft C are similar to those of aircraft A during the passage of the vortex, whereas the horizontal wind speed is lower with less fluctuation of the vertical velocity in aircraft B. Nonetheless, all three aircraft experienced severe turbulence (EDR of 0.5 to 0.8 m2/3 s−1) while passing through the vortex. They provide valuable, first-hand observations of this microscale vortex on the cold front.

4. VDRAS Analysis

VDRAS is a four-dimensional variational data assimilation system that integrates data from one or more Doppler radars into a first-guess background WRF model field, providing a diagnosis of thermodynamic processes in convective weather [13]. It can also optionally incorporate observations from surface-based automatic weather stations (AWS) to enhance the analysis of surface processes, such as cold pools in convective systems [22].
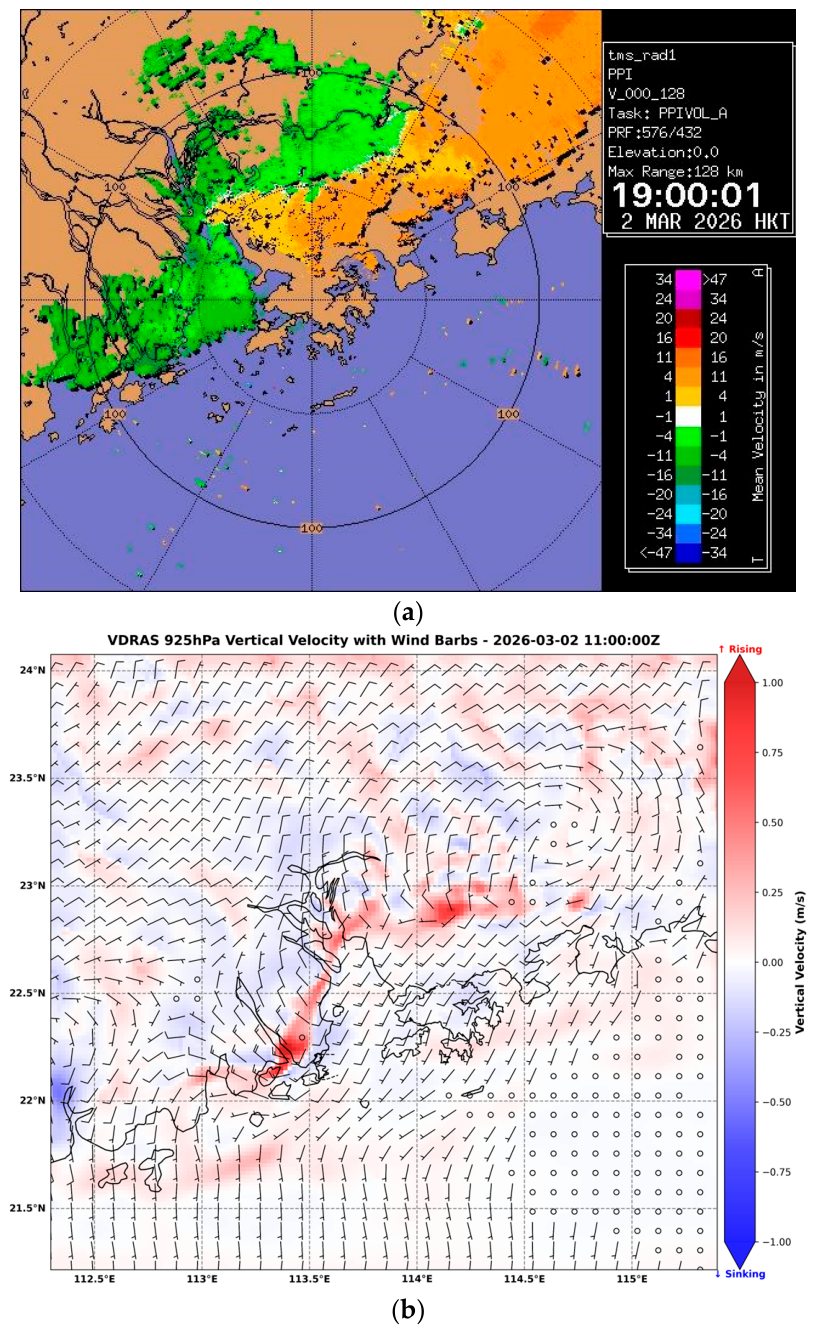
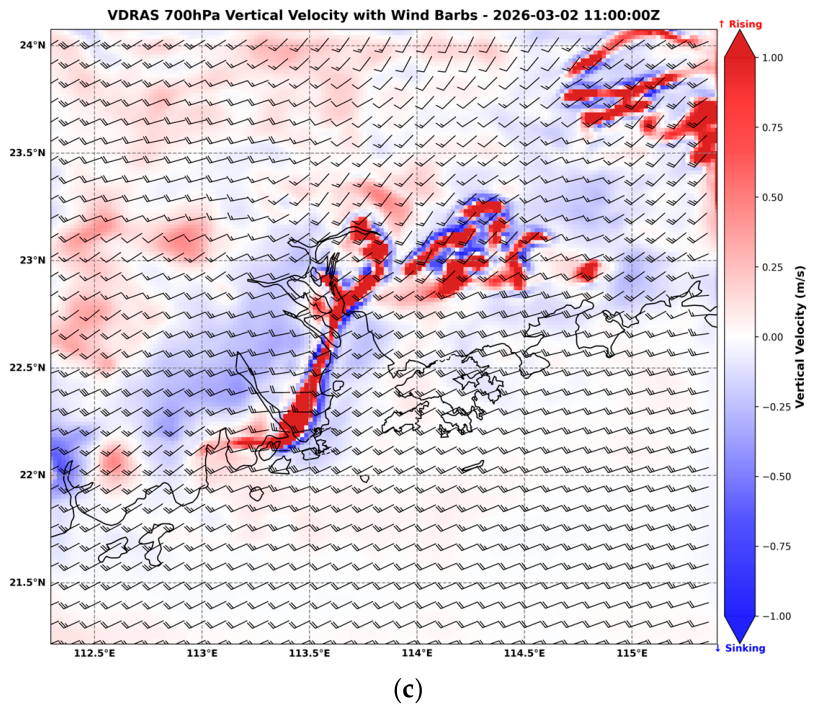
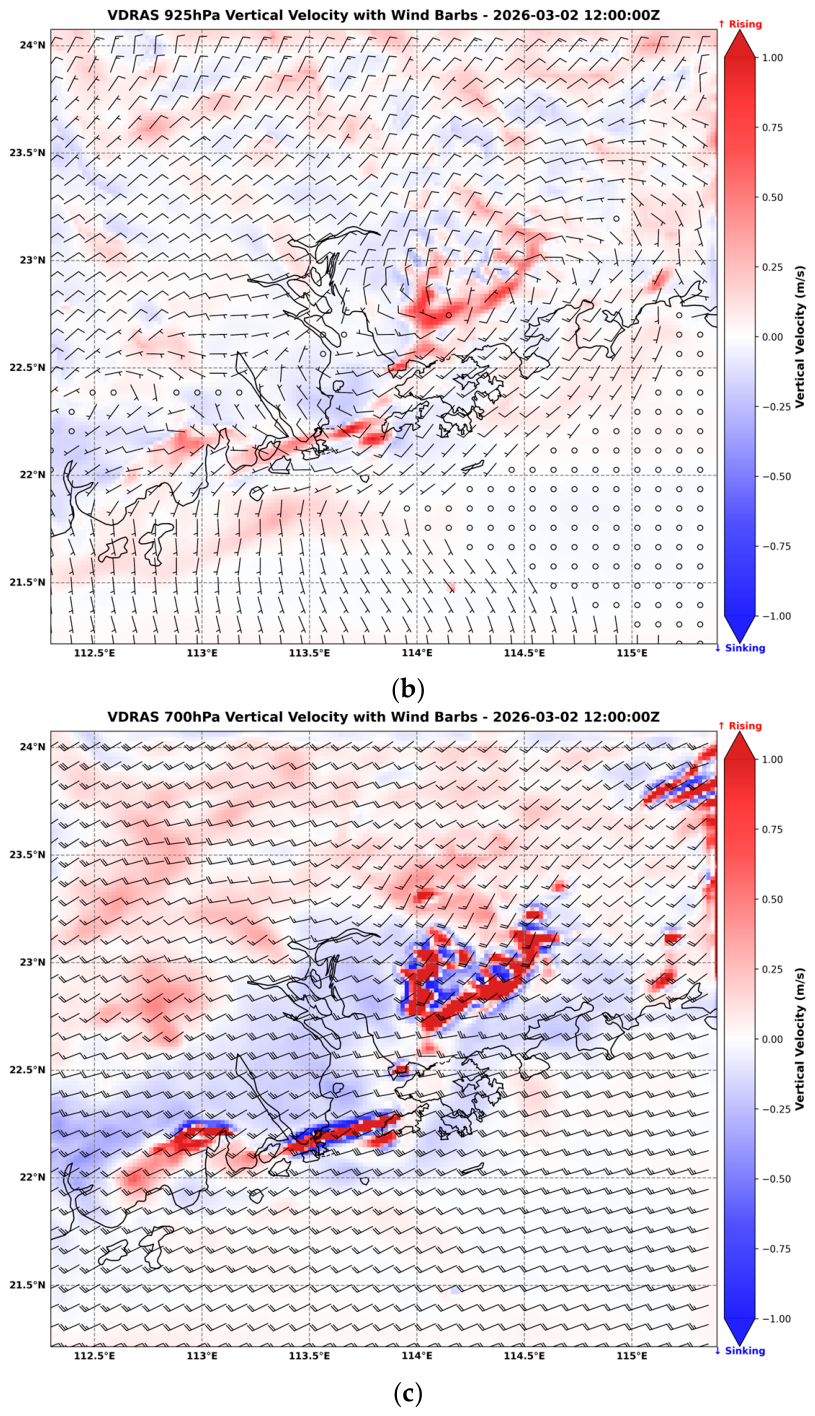
VDRAS was applied in the post-analysis of many significant convective weather episodes over southern China (e.g., Zhou et al. [23]; Wu et al. [24]), one of which involved a bow echo caused by a low-level mesovortex (Liu et al. [25]). The VDRAS analysis for the 2 March 2026 mesovortex case in this paper is based on (1) a 2 km resolution WRF configured based on Chan et al. [26], (2) reflectivity and velocity fields based on four S-band Doppler radars over Tate’s Cairn, Tai Mo Shan of Hong Kong, Qiu Yu Tan radar over Shenzhen, and Zhu’ao radar over Zhuhai; and (3) surface observations from AWS over Guangdong, Hong Kong, and Macao. The analysis had a horizontal resolution of 2 km and a vertical resolution of 300 m. It was initialized at 10 UTC on that day and focused on the Pearl River Estuary and adjacent areas, with analysis outputs available every 6 min. At about 11 UTC on 2 March 2026 (19H local time, with Hong Kong time = UTC + 8 h), the cold front was mainly located over inland areas (Figure 6a), and a low-level vortex could be found at the northern tip of the estuary at the 925 hPa level (Figure 6b). There was a narrow and well-defined lifting zone, with vertical velocities of about 1 m/s along the vortex, which was in the development stage. At the same time, a short wave trough was passing through the Pearl River Estuary in the middle troposphere (e.g., as shown in the 700 hPa level analysis in Figure 6c) with significant updraft ahead of the wave. As postulated in Lau et al. [11], the microscale vortex is believed to arise from (a) low-level circulation between the cooler air from the north and the southwesterly maritime airstream from the south and (b) triggering motion ahead of a mid-tropospheric trough (as shown in the wind profiler data, discussed in Lau et al. [11]). The hypothesis is supported by the VDRAS analysis when compared with a single weather radar.
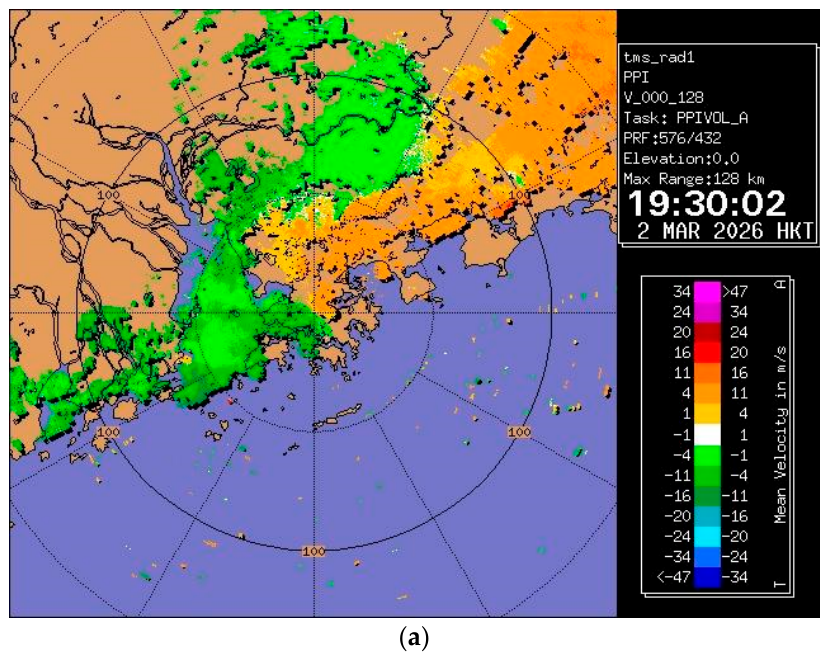
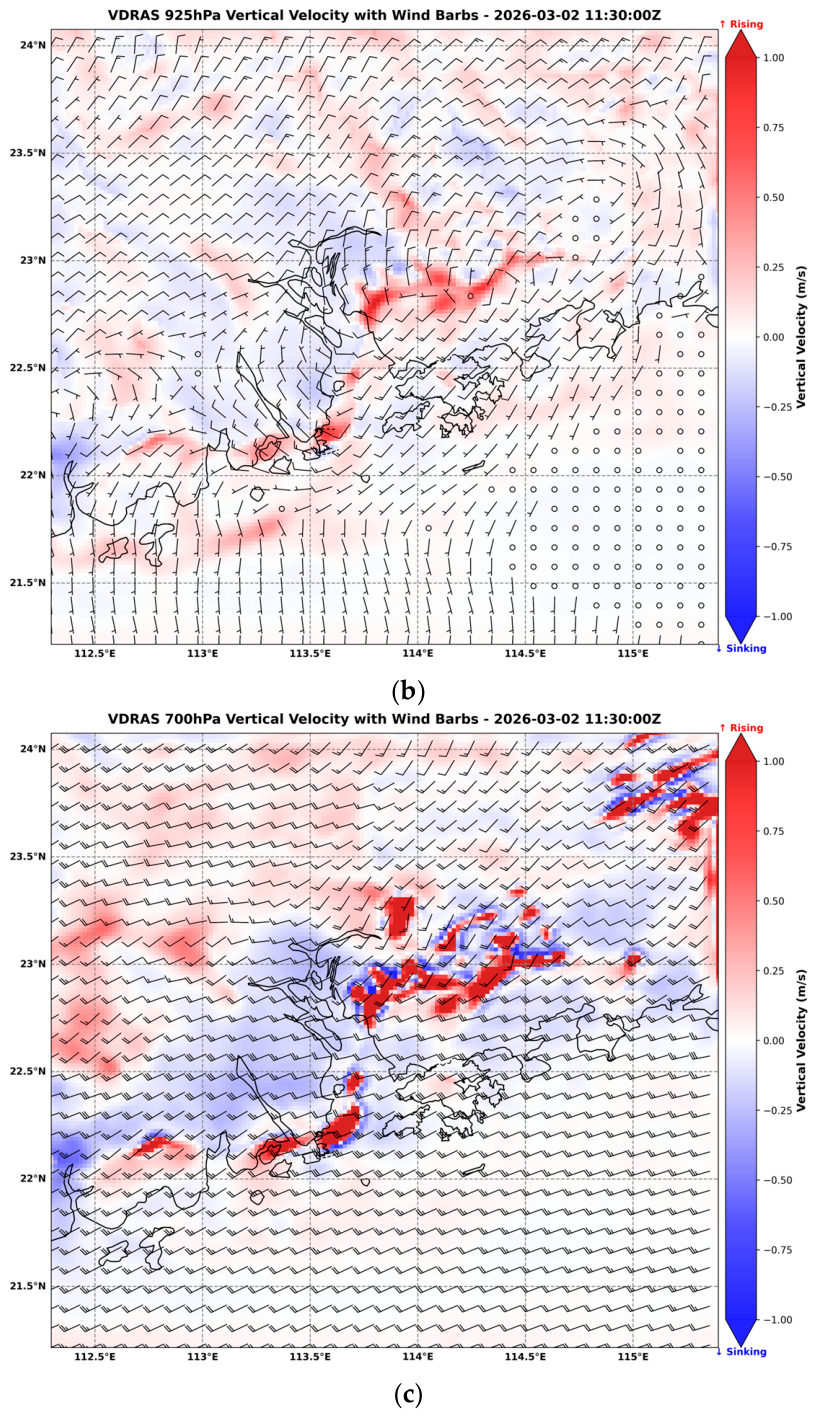
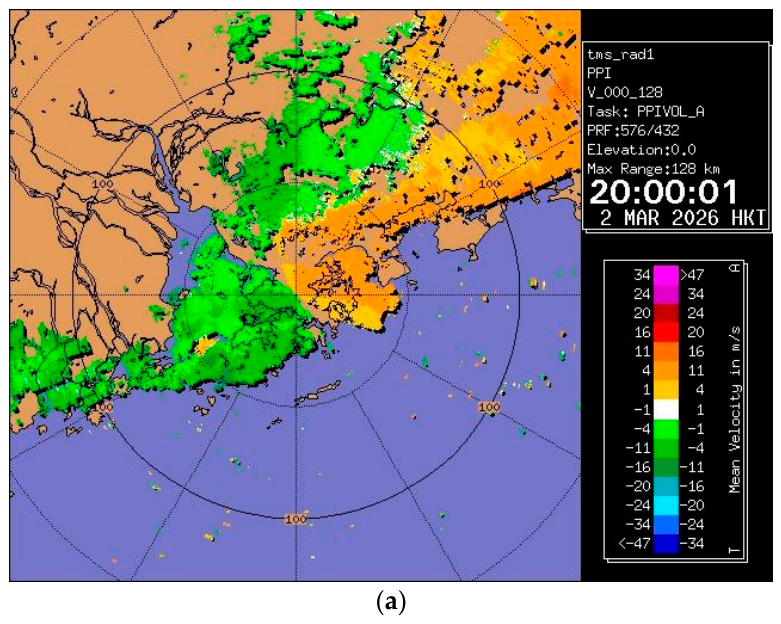
After around 30 min, the cold front advanced further southwards towards the coast (Figure 7a), and the microscale vortex (the subject of the present study) became weakly discernible in the weather radar data just to the east of Macau, associated with significant upward motion at 925 hPa level (Figure 7b) as enhanced by the short wave in the middle troposphere (Figure 7c). At 12 UTC, the microscale vortex was observed between Macao and Lantau Island of Hong Kong in the weather radar picture (Figure 8a). At the 925 hPa, cyclonic circulation and upward motion were evident in the same area (Figure 8b), while the updraft associated with the mid-tropospheric short-wave disturbance was passing over the vortex (Figure 8c). Still, the feature at 925 hPa appeared more as a wave-like disturbance with ascent than as a fully closed vortex. This is likely related to its small spatial scale relative to the 2 km resolution of VDRAS. The VDRAS analysis confirms the formation mechanism of this microscale vortex, pointing to the importance of the rising motion of the air in association with the mid-tropospheric waves.

5. WRF Forecast at 200 m Resolution

In Lau et al. [11], the real-time run of the 200 m resolution WRF was able to capture the microscale vortex. The present paper provides additional analysis of the meteorological parameters associated with this vortex. The setup of WRF has been described in Law et al. [27], though no assimilation of weather radar data has been implemented. As such, the development of the vortex is mainly based on dynamic downscaling together with the assimilation of limited datasets such as surface weather observations and wind profiler data.
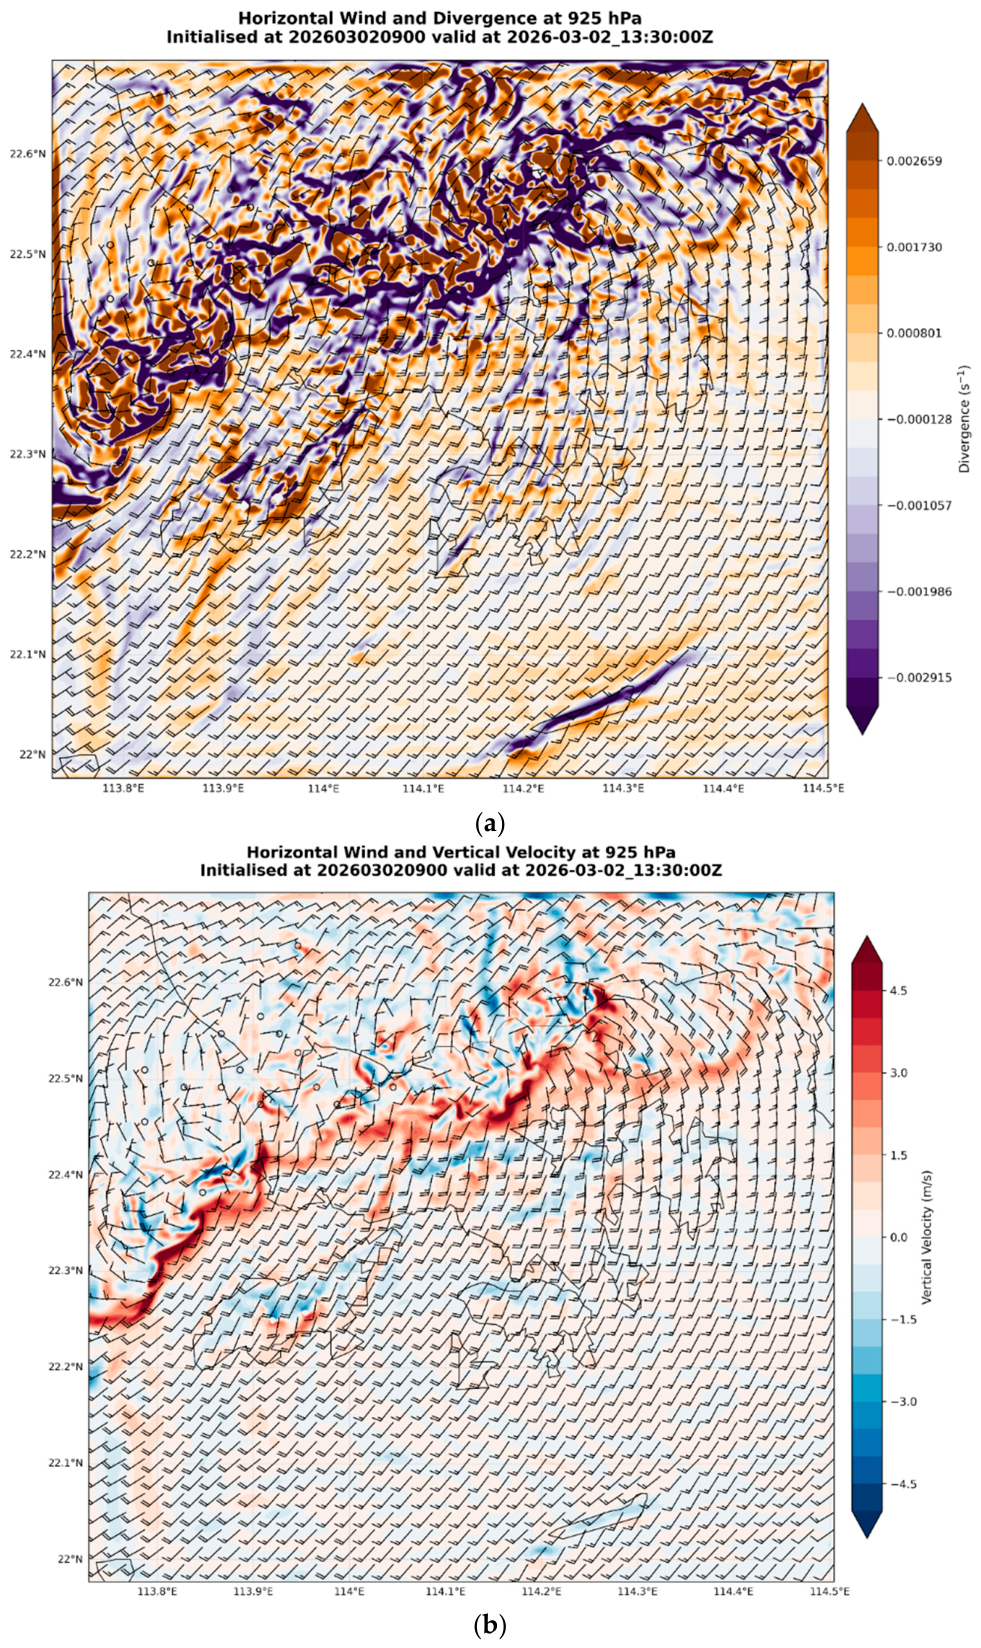
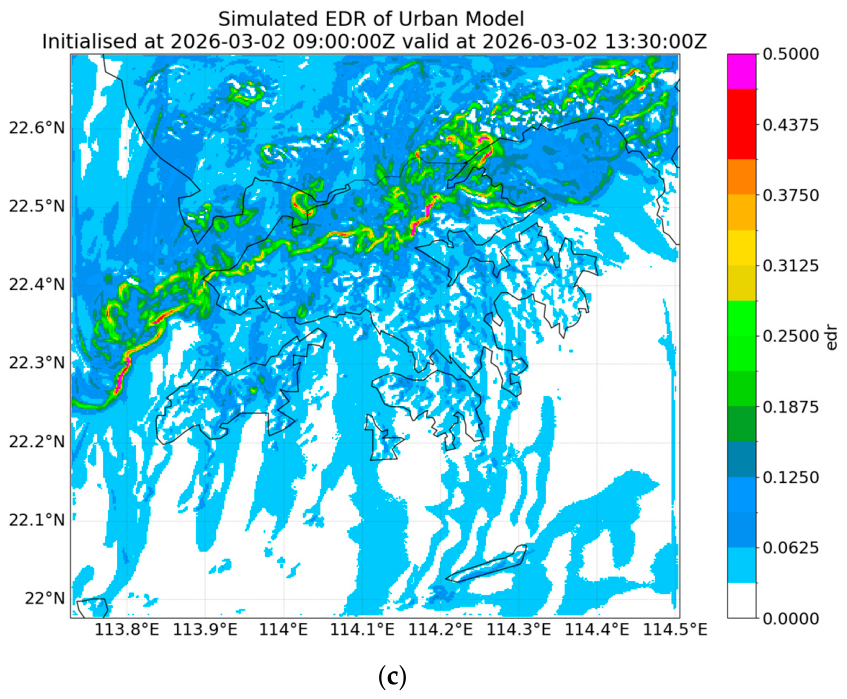
The model is initialized at 09 UTC on 2 March 2026, and the results at 13:30 UTC of that day are shown in Figure 9. The EDR value in the figure is derived by the Sub-Filter-Scale Reconstruction method of Chen et al. [28], making use of three-dimensional wind output in the specified and neighboring layers. From Figure 9a, a cyclonic flow can be identified to the north of Lantau Island. Low-level convergence (negative divergence at 925 hPa, in blue in Figure 9a) is found in that region with cyclonic flow. Along the frontal zone, including the low-level vortex, there was significant upward motion of the air reaching 5 m/s (Figure 9b) and higher EDR values (severe turbulence with EDR reaching 0.5 m2/3 s−1 in red, Figure 9c). The EDR values are largely consistent with the data from the three aircraft flying through the vortex (Figure 3, Figure 4 and Figure 5), even though the timing did not match exactly.
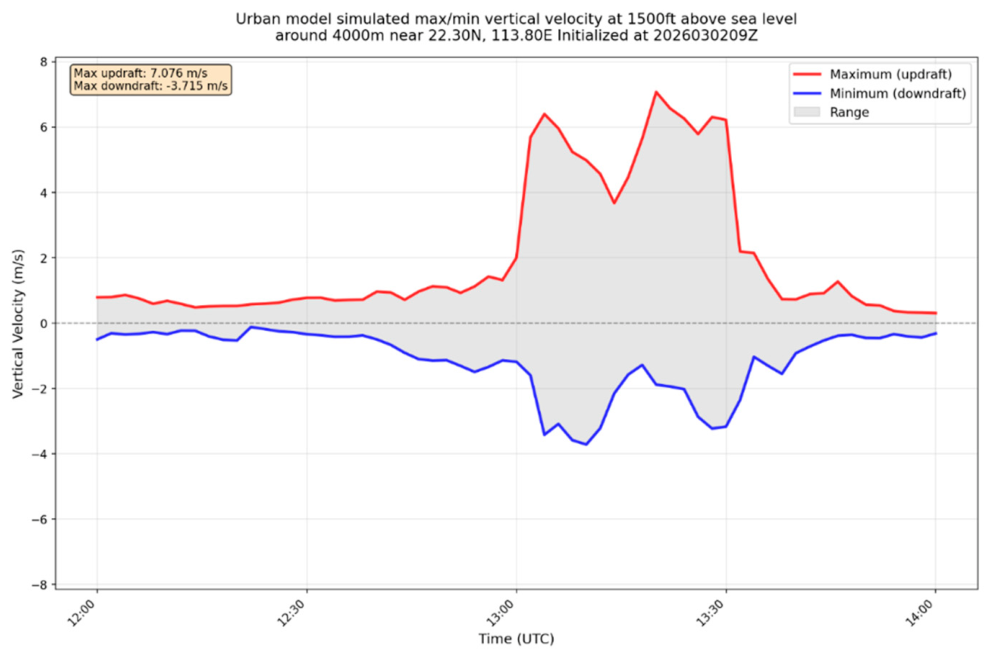
The time series of model-simulated maximum (the highest positive, i.e., upward motion) and minimum (the lowest negative, i.e., downward motion) vertical velocity around the vortex (within 4000 m from the location of 22.3 degrees North, 113.8 degrees East) at a height of 1500 feet above sea level is shown in Figure 10 for the model run initialized at 09 UTC of 2 March 2026. The highest positive value is about 7 m/s, and the lowest negative value is about −4 m/s. These values are generally consistent with the values from the three aircraft when they flew through the vortex (Figure 3, Figure 4 and Figure 5).
From the above results, the 200 m WRF not only captured the vortex (though the location and the time may be different from the actual observations) but also successfully simulated the order of magnitude of vertical velocity and EDR in association with the vortex core. The results of the real-time WRF run at this spatial resolution appear to be useful for practical applications, e.g., advance alerting of significant updraft/downdraft and turbulent flow along the cold front that lies across the common descent path of the aircraft (Figure 2).

6. Sensitivity Tests

In this section, sensitivity tests have been conducted on the formation of the microscale vortex. Due to the substantial computational power required for the 200 m WRF following the configuration of Law et al. [27], only 1 km resolution runs are performed, i.e., the domain 3 (d03) of that paper. Four simulations have been performed:
(a)
the original configuration;
(b)
SST-2degC: sea surface temperature (SST) over Pearl River Estuary and the northern part of the South China Sea to be decreased by 2 degrees Celsius, from the observed values of 18 to 20 degrees Celsius to the “artificial” values of 16 to 18 degrees Celsius, the terrain remaining unchanged;
(c)
Same as (a) but with Hong Kong terrain to be removed and replaced by a piece of land with a height of 1 m above sea level;
(d)
Same as (a) but with Hong Kong filled with water.
The objective for the sensitivity tests is to examine whether microscale features affected the formation of the vortex, namely, the impact of SST and the impact of the local terrain in Hong Kong.
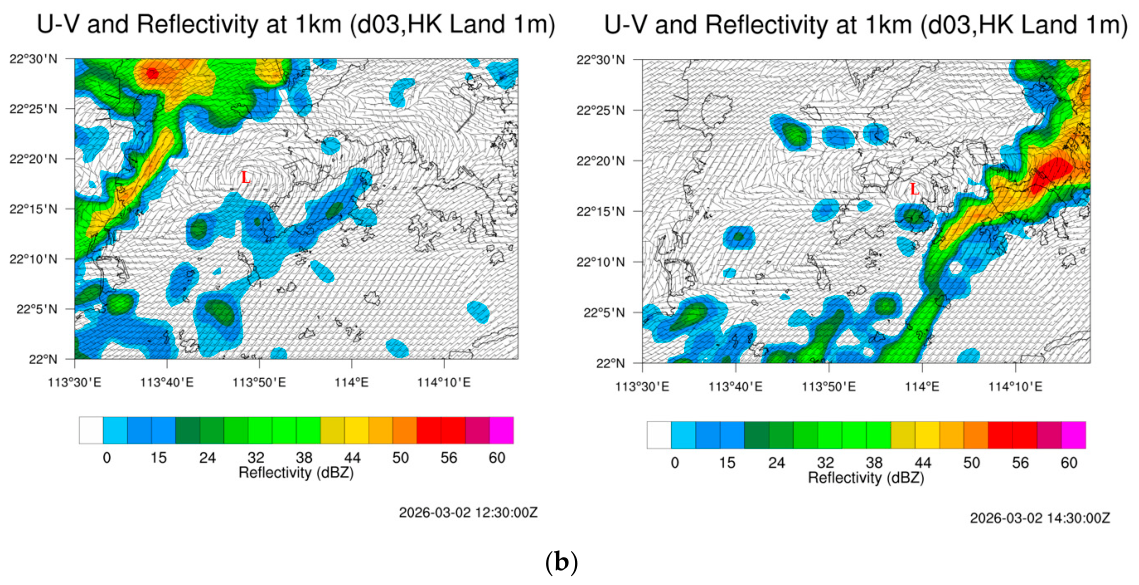
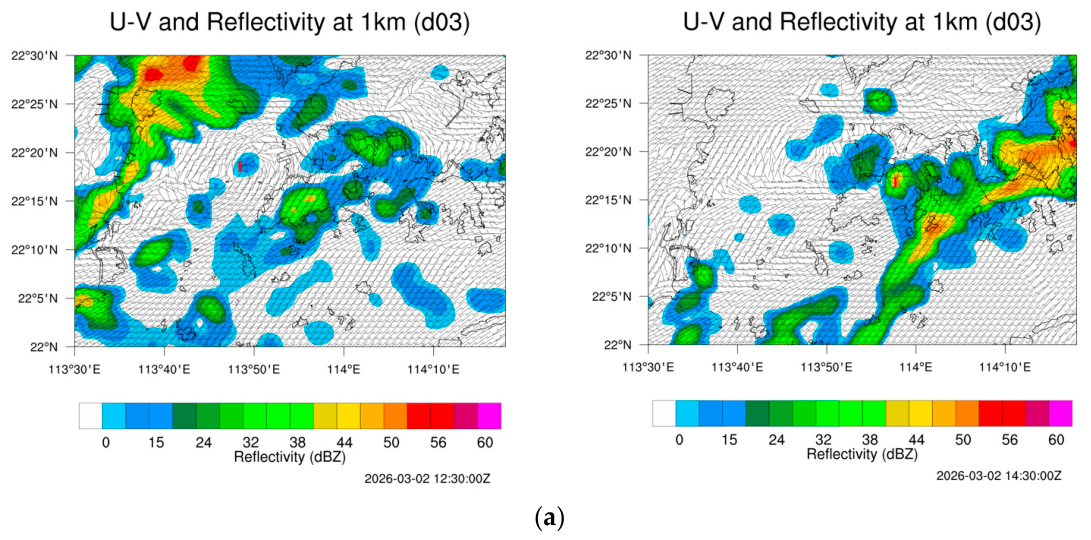
Some selected results of simulation (a) are given in Figure 11a. By considering d03 only, there is a delay in the occurrence of the vortex. Moreover, the vortex is located more to the east, i.e., passing over the eastern part of Lantau Island. However, even with this coarser spatial resolution, the vortex still appears in the simulation. For simulation (b), the results are largely the same as those of (a), so their plots are not included in this paper. As such, the impact of SST appears to be insignificant, probably because it remains at a rather low value (18 to 20 degrees Celsius) to have a significant impact on convective development for southern China.
The selected results of simulation (c) are shown in Figure 11b. They also appear to be rather similar to those of (a), i.e., apart from some differences in the reflectivity field. The formation and movement of the vortex appear to remain the same. Simulation (d) also gives similar results, and their plots are not included here. The terrain of Hong Kong does not appear to have much impact on the formation and movement of the low-level vortex.
Results of the above experiments confirm that the vortex was primarily associated with synoptic and mesoscale processes, particularly the horizontal wind shear in the frontal zone and the vertical motion induced by mid-tropospheric waves. In contrast, near-surface factors, such as the sea surface temperature over the northern South China Sea and the local terrain of Hong Kong, are not found to play a significant role.

7. Conclusions

This paper presents an observational and forecasting study of a vortex along a cold front over southern China. Apart from weather radar observations that have been reported before, flight data were obtained from three aircraft that flew through the vortex, providing unique observations about the vertical velocity and turbulence intensity associated with this vortex. Although the horizontal winds associated with the vortex were not particularly strong (in the order of 25 to 30 knots), the turbulence intensity is rather high, and severe turbulence was encountered as aircraft flew through it with an EDR reaching about 0.6 to 0.8 m2/3 s−1. Thus, the study of this vortex is not only of meteorological interest but also of practical significance.
VDRAS analysis confirmed that the formation mechanism of this microscale vortex was associated with low-level horizontal shear and upward motion ahead of a mid-tropospheric trough. Simulation of the vortex is reviewed based on the operational 200 m WRF model, which generally reproduces the order of magnitude of the vertical velocity and EDR in association with this vortex; however, the vortex formed later than actual observations. The spinning up of this vortex appears to be related to the horizontal wind shear and vertical motion as triggered by mid-tropospheric waves. To find out the possible impact of microscale features on the formation of this vortex, hypothetical simulations have been conducted using revised SST and the removal of Hong Kong terrain. The effects of SST and terrain were found to be generally small, again suggesting that the vortex was mainly driven by synoptic to mesoscale features, including the cold frontal zone and mid-tropospheric waves.
Microscale vortices of this kind along cold fronts in southern China during early spring are relatively uncommon. Further observations and analyses in future years will provide valuable opportunities to build a climatology of such events, including common features of their formation mechanisms.

Author Contributions

Conceptualization, M.-L.C. and P.-W.C.; methodology, H.-F.L. and P.-W.C.; software, H.-Y.F., T.-K.L. and K.-K.L.; validation, M.-L.C. and H.-F.L.; formal analysis, M.-L.C. and H.-F.L.; investigation, H.-Y.F. and K.-K.L.; resources, T.-K.L. and P.-W.C.; data curation, M.-L.C., H.-Y.F., and K.-K.L.; writing—original draft preparation, P.-W.C.; writing—review and editing, M.-L.C.; visualization, M.-L.C., H.-F.L., H.-Y.F., and T.-K.L.; supervision, M.-L.C. and P.-W.C.; project administration, P.-W.C. All authors have read and agreed to the published version of the manuscript.

Funding

This research received no external funding.

Institutional Review Board Statement

Not applicable.

Informed Consent Statement

Not applicable.

Data Availability Statement

The data presented in this study are available on request from the corresponding author due to privacy concerns.

Conflicts of Interest

The authors declare no conflicts of interest.

References

  1. Chang, C.P.; Erickson, J.E.; Lau, K.M. Northeasterly cold surges and near-equatorial disturbances over the Winter MONEX area during December 1974. Part I: Synoptic aspects. Mon. Weather. Rev. 1979, 107, 812–829. [Google Scholar] [CrossRef]
  2. Ding, Y. The winter monsoon in East Asia. In Monsoons over China; Springer Science & Business Media: Dordrecht, The Netherlands, 1994; pp. 91–173. [Google Scholar]
  3. Wu, N.; Ding, X.; Wen, Z.; Chen, G.; Meng, Z.; Lin, L.; Min, J. Contrasting frontal and warm-sector heavy rainfalls over South China during the early-summer rainy season. Atmos. Res. 2020, 235, 104693. [Google Scholar] [CrossRef]
  4. Fu, Y.; Sun, J.; Fu, S.; Zhang, Y. Comparison between warm-sector and frontal heavy rainfall events in South China and the objective classification of warm-sector heavy rainfall events. Meteorol. Atmos. Phys. 2023, 135, 11. [Google Scholar] [CrossRef]
  5. Zuo, H.; Chen, Y.; Liu, T.; Zhang, A.; Chen, S.; Li, W. Frontal structure effects on precipitation microphysics in South China rain cells. J. Geophys. Res. Atmos. 2025, 130, e2024JD043270. [Google Scholar] [CrossRef]
  6. Young, G.S.; Johnson, R.H. Meso- and microscale features of a Colorado cold front. J. Clim. Appl. Meteorol. 1984, 23, 1315–1325. [Google Scholar] [CrossRef][Green Version]
  7. Smart, D.J.; Browning, K.A. Morphology and evolution of cold-frontal misocyclones. Q. J. R. Meteorol. Soc. 2009, 135, 381–393. [Google Scholar] [CrossRef]
  8. Clark, M.R.; Parker, D.J.; Hanley, K.E. Synoptic-scale and mesoscale controls for tornadogenesis on cold fronts: Shear-zone vortex-genesis in a developing frontal wave. Q. J. R. Meteorol. Soc. 2021, 147, 3979–4009. [Google Scholar] [CrossRef]
  9. Zhi, J.; Huang, X.; Gu, B.; Cai, K.; Li, C.; Zhang, J.; Li, Z. A comparative study on two different types of gale events caused by supercell in Guangdong. Meteorol. Mon. 2022, 48, 813–825. [Google Scholar] [CrossRef]
  10. Zhi, J.; Bai, L.; Huang, X.; Cheng, Y.; Li, C. Supercell outbreak evolving along a cold front in coastal southern China. J. Meteorol. Res. 2025, 39, 1264–1282. [Google Scholar] [CrossRef]
  11. Lau, T.K.; Law, H.F.; Yeung, H.Y.; Tse, W.P.; Ho, C.K.; He, Y.H.; Lai, S.K.; Chan, P.W. An early-season episode of rainstorms in Hong Kong—Observational and forecasting aspects. Atmosphere 2026, 17, 454. [Google Scholar] [CrossRef]
  12. Chan, P.W.; Chan, Y.W.; Cheung, P.; Chong, M.L. An observational study of a severe squall line crossing Hong Kong on 15 March 2025 based on radar-retrieved three-dimensional winds and flight data. Appl. Sci. 2025, 15, 8562. [Google Scholar] [CrossRef]
  13. Sun, J.; Crook, N.A. Real-time low-level wind and temperature analysis using single WSR-88D data. Weather. Forecast. 2001, 16, 117–132. [Google Scholar] [CrossRef]
  14. Sun, J.; Chen, M.; Wang, Y. A frequent-updating analysis system based on radar, surface, and mesoscale model data for the Beijing 2008 Forecast Demonstration Project. Weather. Forecast. 2010, 25, 1715–1735. [Google Scholar] [CrossRef]
  15. Jackson, R.; Collis, S.; Lang, T.; Potvin, C.; Munson, T. PyDDA: A Pythonic direct data assimilation framework for wind retrievals. J. Open Res. Softw. 2020, 8, 20. [Google Scholar] [CrossRef]
  16. Gao, J.D.; Xue, M.; Brewster, K.; Droegemeier, K.K. A three-dimensional variational data analysis method with recursive filter for Doppler radars. J. Atmos. Ocean. Technol. 2004, 21, 457–469. [Google Scholar] [CrossRef]
  17. Potvin, C.K.; Shapiro, A.; Xue, M. Impact of a vertical vorticity constraint in variational dual-Doppler wind analysis: Tests with real and simulated supercell data. J. Atmos. Ocean. Technol. 2012, 29, 32–49. [Google Scholar] [CrossRef]
  18. Huang, R.; Sun, H.; Wu, C.; Wang, C.; Lu, B. Estimating eddy dissipation rate with QAR flight big data. Appl. Sci. 2019, 9, 5192. [Google Scholar] [CrossRef]
  19. Haverdings, H.; Chan, P.W. Quick Access Recorder Data Analysis Software for Windshear and Turbulence Studies. J. Aircr. 2010, 47, 1443–1447. [Google Scholar] [CrossRef]
  20. Kim, S.H.; Kim, J.; Kim, J.H.; Chun, H.Y. Characteristics of the derived energy dissipation rate using the 1 Hz commercial aircraft quick access recorder (QAR) data. Atmos. Meas. Tech. 2022, 15, 2277–2298. [Google Scholar] [CrossRef]
  21. International Civil Aviation Organization (ICAO). Annex 3 to the Convention on International Civil Aviation: Meteorological Service for International Air Navigation, 20th ed.; ICAO: Montreal, QC, Canada, 2018. [Google Scholar]
  22. Chen, M.; Gao, F.; Sun, J.; Xiao, X.; Liu, L.; Wang, Y. An analysis system using rapid-updating 4D variational radar data assimilation based on VDRAS. J. Appl. Meteorol. Sci. 2016, 27, 257–272. [Google Scholar] [CrossRef]
  23. Zhou, A.; Zhao, K.; Lee, W.C.; Huang, H.; Hu, D.; Fu, P. VDRAS and polarimetric radar investigation of a bow echo formation after a squall line merged with a preline convective cell. J. Geophys. Res. Atmos. 2020, 125, e2019JD031719. [Google Scholar] [CrossRef]
  24. Wu, Y.; Sun, J.; Ying, Z.; Xue, L.; Chen, D.; Lin, W. Effects of local-scale orography and urban heat island on the initiation of a record-breaking rainfall event. J. Geophys. Res. Atmos. 2021, 126, e2021JD034839. [Google Scholar] [CrossRef]
  25. Liu, Q.; Xu, X.; Zhao, K.; Zhou, A. A merger-formation bow echo caused by low-level mesovortex in South China. J. Geophys. Res. Atmos. 2023, 128, e2022JD037954. [Google Scholar] [CrossRef]
  26. Chan, P.W.; Hon, K.K.; Robinson, P.; Kosiba, K.; Wurman, J.; Li, Q.S. Analysis and numerical simulation of a supercell tornado at the Hong Kong adjacent waters. Meteorol. Appl. 2022, 29, e2056. [Google Scholar] [CrossRef]
  27. Law, H.F.; Lai, K.K.; Chan, P.W.; Chau, H.C. Technical feasibility of simulating thunderstorm-related microbursts: Case studies. Appl. Sci. 2026, 16, 3579. [Google Scholar] [CrossRef]
  28. Chen, H.; Leung, C.Y.Y.; Cheung, P.; Liu, H.; Chan, S.T.; Shi, X. Predicting convectively induced turbulence with regionally convection-permitting simulations. Asia-Pac. J. Atmos. Sci. 2025, 61, 16. [Google Scholar] [CrossRef]
Figure 1. Major locations over the Pearl River Estuary (a); and the horizontal wind field at a height of 1 km above sea level overlaid with 0.8 degrees PPI Doppler velocity of Cheung Chau weather radar (green or blue: towards the radar; orange: away from radar), and the vertical circulation in the cross section with reflectivity across the vortex at two time instances: (b) 11:36 UTC and (c) 11:48 UTC of 2 March 2026.
Atmosphere 17 00548 g001aAtmosphere 17 00548 g001b
Figure 2. A sample flight route (in purple) of the three aircraft flying through the vortex at around 12 UTC of 2 March 2026—the background is the Doppler velocity field from the 0.8 degrees PPI Doppler velocity of Cheung Chau weather radar at 12:02 UTC.
Atmosphere 17 00548 g002
Figure 3. Flight data from aircraft A, including EDR, three components of wind, and altitude.
Atmosphere 17 00548 g003
Figure 4. Flight data from aircraft B, including EDR, three components of wind, and altitude.
Atmosphere 17 00548 g004
Figure 5. Flight data from aircraft C, including EDR, three components of the wind, and altitude.
Atmosphere 17 00548 g005
Figure 6. Weather radar picture at 3 km above sea level at 19:00 H of 2 March 2026 (a); VDRAS analysis of 925 hPa (b) and 700 hPa (c) horizontal wind and vertical velocity.
Atmosphere 17 00548 g006aAtmosphere 17 00548 g006b
Figure 7. Same as Figure 6 but for 19:30 H of 2 March 2026.
Atmosphere 17 00548 g007aAtmosphere 17 00548 g007b
Figure 8. Same as Figure 6 but for 20:00 H of 2 March 2026.
Atmosphere 17 00548 g008aAtmosphere 17 00548 g008b
Figure 9. Results from a 200 m WRF real-time run as initialized at 09 UTC of 2 March 2026. The forecast fields are based on 13:30 UTC of that day, i.e., a 4.5 h forecast: (a) 925 hPa horizontal wind and divergence; (b) 925 hPa horizontal wind and vertical velocity; and (c) EDR.
Atmosphere 17 00548 g009aAtmosphere 17 00548 g009b
Figure 10. Time series of maximum vertical velocity (most positive upward motion and most negative downward motion) for 200 m WRF model initialized at 09 UTC of 2 March 2026.
Atmosphere 17 00548 g010
Figure 11. The simulated reflectivity and horizontal wind at 1 km above sea level for (a) 1 km WRF simulation (d03) and (b) 1 km WRF simulation (d03) without the Hong Kong terrain (which is just a piece of land with a height of 1 m above sea level), both initialized at 09 UTC on 2 March with forecasts at 12:30 UTC and 14:30 UTC. “L” is the location of the vortex.
Atmosphere 17 00548 g011aAtmosphere 17 00548 g011b
Disclaimer/Publisher’s Note: The statements, opinions and data contained in all publications are solely those of the individual author(s) and contributor(s) and not of MDPI and/or the editor(s). MDPI and/or the editor(s) disclaim responsibility for any injury to people or property resulting from any ideas, methods, instructions or products referred to in the content.