Article

Nonlinear Responses of Marathon Performance to Heat Stress: Evidence from 18 U.S. Cities (2011–2019)

1
College of Aviation Physical Education, Civil Aviation Flight University of China, Guanghan 618307, China
2
Institute for Disaster Management and Reconstruction, Sichuan University, Chengdu 610207, China
*
Author to whom correspondence should be addressed.
Atmosphere 2026, 17(6), 547; https://doi.org/10.3390/atmos17060547
Submission received: 15 April 2026 / Revised: 26 May 2026 / Accepted: 26 May 2026 / Published: 27 May 2026
(This article belongs to the Section Biometeorology and Bioclimatology)

Abstract

Marathon heat stress is an increasing public health concern under climate change, particularly for mass participation endurance events. Using 967,878 runners from 18 U.S. marathon events between 2011 and 2019, this study examined the nonlinear association between race-day thermal exposure and marathon performance. A two-way fixed effects framework was used to account for race- and year-specific heterogeneity, demographic characteristics, race-day maximum air temperature, relative humidity, their interaction, and non-stationary exposure proxies. The results identified a humidity-dependent thermal optimal zone (TOZ). At the sample mean humidity level of 77.7%, the estimated the TOZ based on the race-day maximum air temperature was 13.0 °C, with a low-penalty range of 8.5–17.4 °C for predicted losses below 60 s. In the main specification, the temperature–humidity interaction was positive, suggesting that humidity-related penalties may increase under warmer conditions; however, race-year-level sensitivity analyses indicated that this interaction should be interpreted cautiously. Under 28.0 °C and 80% relative humidity, the model predicted a finish-time penalty of approximately 737.5 s. Stratified analyses showed that mass participation runners experienced larger high-temperature penalties than elite runners, and male runners aged 35–49 years showed the highest estimated thermal sensitivity at 28.0 °C. The UTCI modestly improved model calibration but produced unstable optimum estimates, supporting its use as a complementary biometeorological benchmark rather than as the primary basis for defining a marathon-specific TOZ. These findings suggest that a marathon heat-risk assessment should jointly consider air temperature, humidity, integrated biometeorological exposure, and subgroup-specific vulnerability.

1. Introduction

Against the backdrop of global climate change and rising temperatures worldwide, extreme heat has become a major environmental challenge facing outdoor sports [1]. The adverse effects of heat exposure on human performance have been widely documented, with air temperature and humidity consistently identified as key risk factors during exercise. Beyond performance decline, severe heat stress may increase cardiovascular and thermoregulatory strain and contribute to exercise withdrawal or heat-related illness risk [2,3]. Although heat adaptation can partially mitigate these effects, its effectiveness depends on multiple factors, including the duration of exposure, the environmental conditions (e.g., dry versus humid heat), and the training intensity and frequency [4,5].
As a classic outdoor endurance event, marathon running is highly sensitive to environmental conditions [6,7,8]. Air temperature, humidity, wind, and radiative heat exchange jointly shape thermoregulatory responses during prolonged exertion, influencing heat dissipation and overall physiological strain [9]. Numerous studies have found that higher air temperatures are associated with slower finishing times for both elite and amateur runners [10,11,12]. However, the existing studies have largely focused on the linear effects of air temperature on marathon performance, often treating environmental variables in isolation, despite evidence that temperature–performance relationships may follow complex nonlinear patterns [13,14].
In outdoor endurance events, however, heat stress is not determined by air temperature alone. Solar shortwave radiation, longwave radiation from surrounding heated surfaces, wind speed, humidity, and air temperature jointly shape the human heat balance. The mean radiant temperature (MRT) is therefore an important descriptor of radiative heat load in outdoor environments. Nevertheless, retrospective multi-city marathon datasets rarely contain direct on-course measurements of the MRT, globe temperature, or solar radiation, which creates methodological challenges for a historical heat-performance analysis. This study therefore distinguishes between the race-day maximum air temperature as the primary interpretable exposure variable and the UTCI as a complementary biometeorological benchmark that partially incorporates radiative and wind-related effects through reanalysis-derived outdoor thermal exposure estimates.
Previous linear approaches often overlook interactions among multiple atmospheric factors, particularly air temperature, humidity, wind, and radiative exposure, which jointly influence thermoregulatory stress and endurance performance [11]. Recent studies have further examined the temporal variations in key meteorological variables—such as air temperature, humidity, air quality, and wind speed—and demonstrated that changing climatic conditions can affect the runners’ perceived exertion and race performance [15,16,17]. In addition, most previous research has primarily focused on either elite or recreational runners in isolation, with limited attention to heterogeneous responses across performance groups, even though the emerging evidence suggests that thermal sensitivity varies systematically among runners with different performance levels [18,19].
Although the existing studies have documented the negative effects of high air temperature exposure across a range of sports, a systematic understanding of heat vulnerability remains limited for the broader population of recreational runners. Previous research has largely focused on elite athletes or case analyses of single races, limiting the ability to capture the heterogeneous response patterns among amateur participants under varying atmospheric conditions [11,14,15,19]. To address this research gap, the present study conducts a multi-city, multi-year analysis of marathon performance and race-day environmental exposure. We establish a large-sample empirical framework to quantify the nonlinear associations between atmospheric conditions and marathon finish time, with particular attention to humidity-dependent air temperature effects and subgroup-specific vulnerability.
Departing from conventional linear approaches, this study adopts a quadratic nonlinear model to estimate the thermal optimal zone (TOZ) for marathon performance based on the race-day maximum air temperature. A key methodological contribution is the incorporation of temperature–humidity interaction terms and non-stationary exposure proxies, together with the UTCI-based validation, to examine whether the main thermal exposure–performance relationship remains stable under richer representations of outdoor heat exposure. Furthermore, stratified analyses by performance level, age, and sex are used to evaluate population heterogeneity in thermal sensitivity. These findings aim to support an evidence-based heat-risk assessment and event planning for increasingly diverse mass participation running populations.

2. Materials and Methods

2.1. Data Sources and Preprocessing

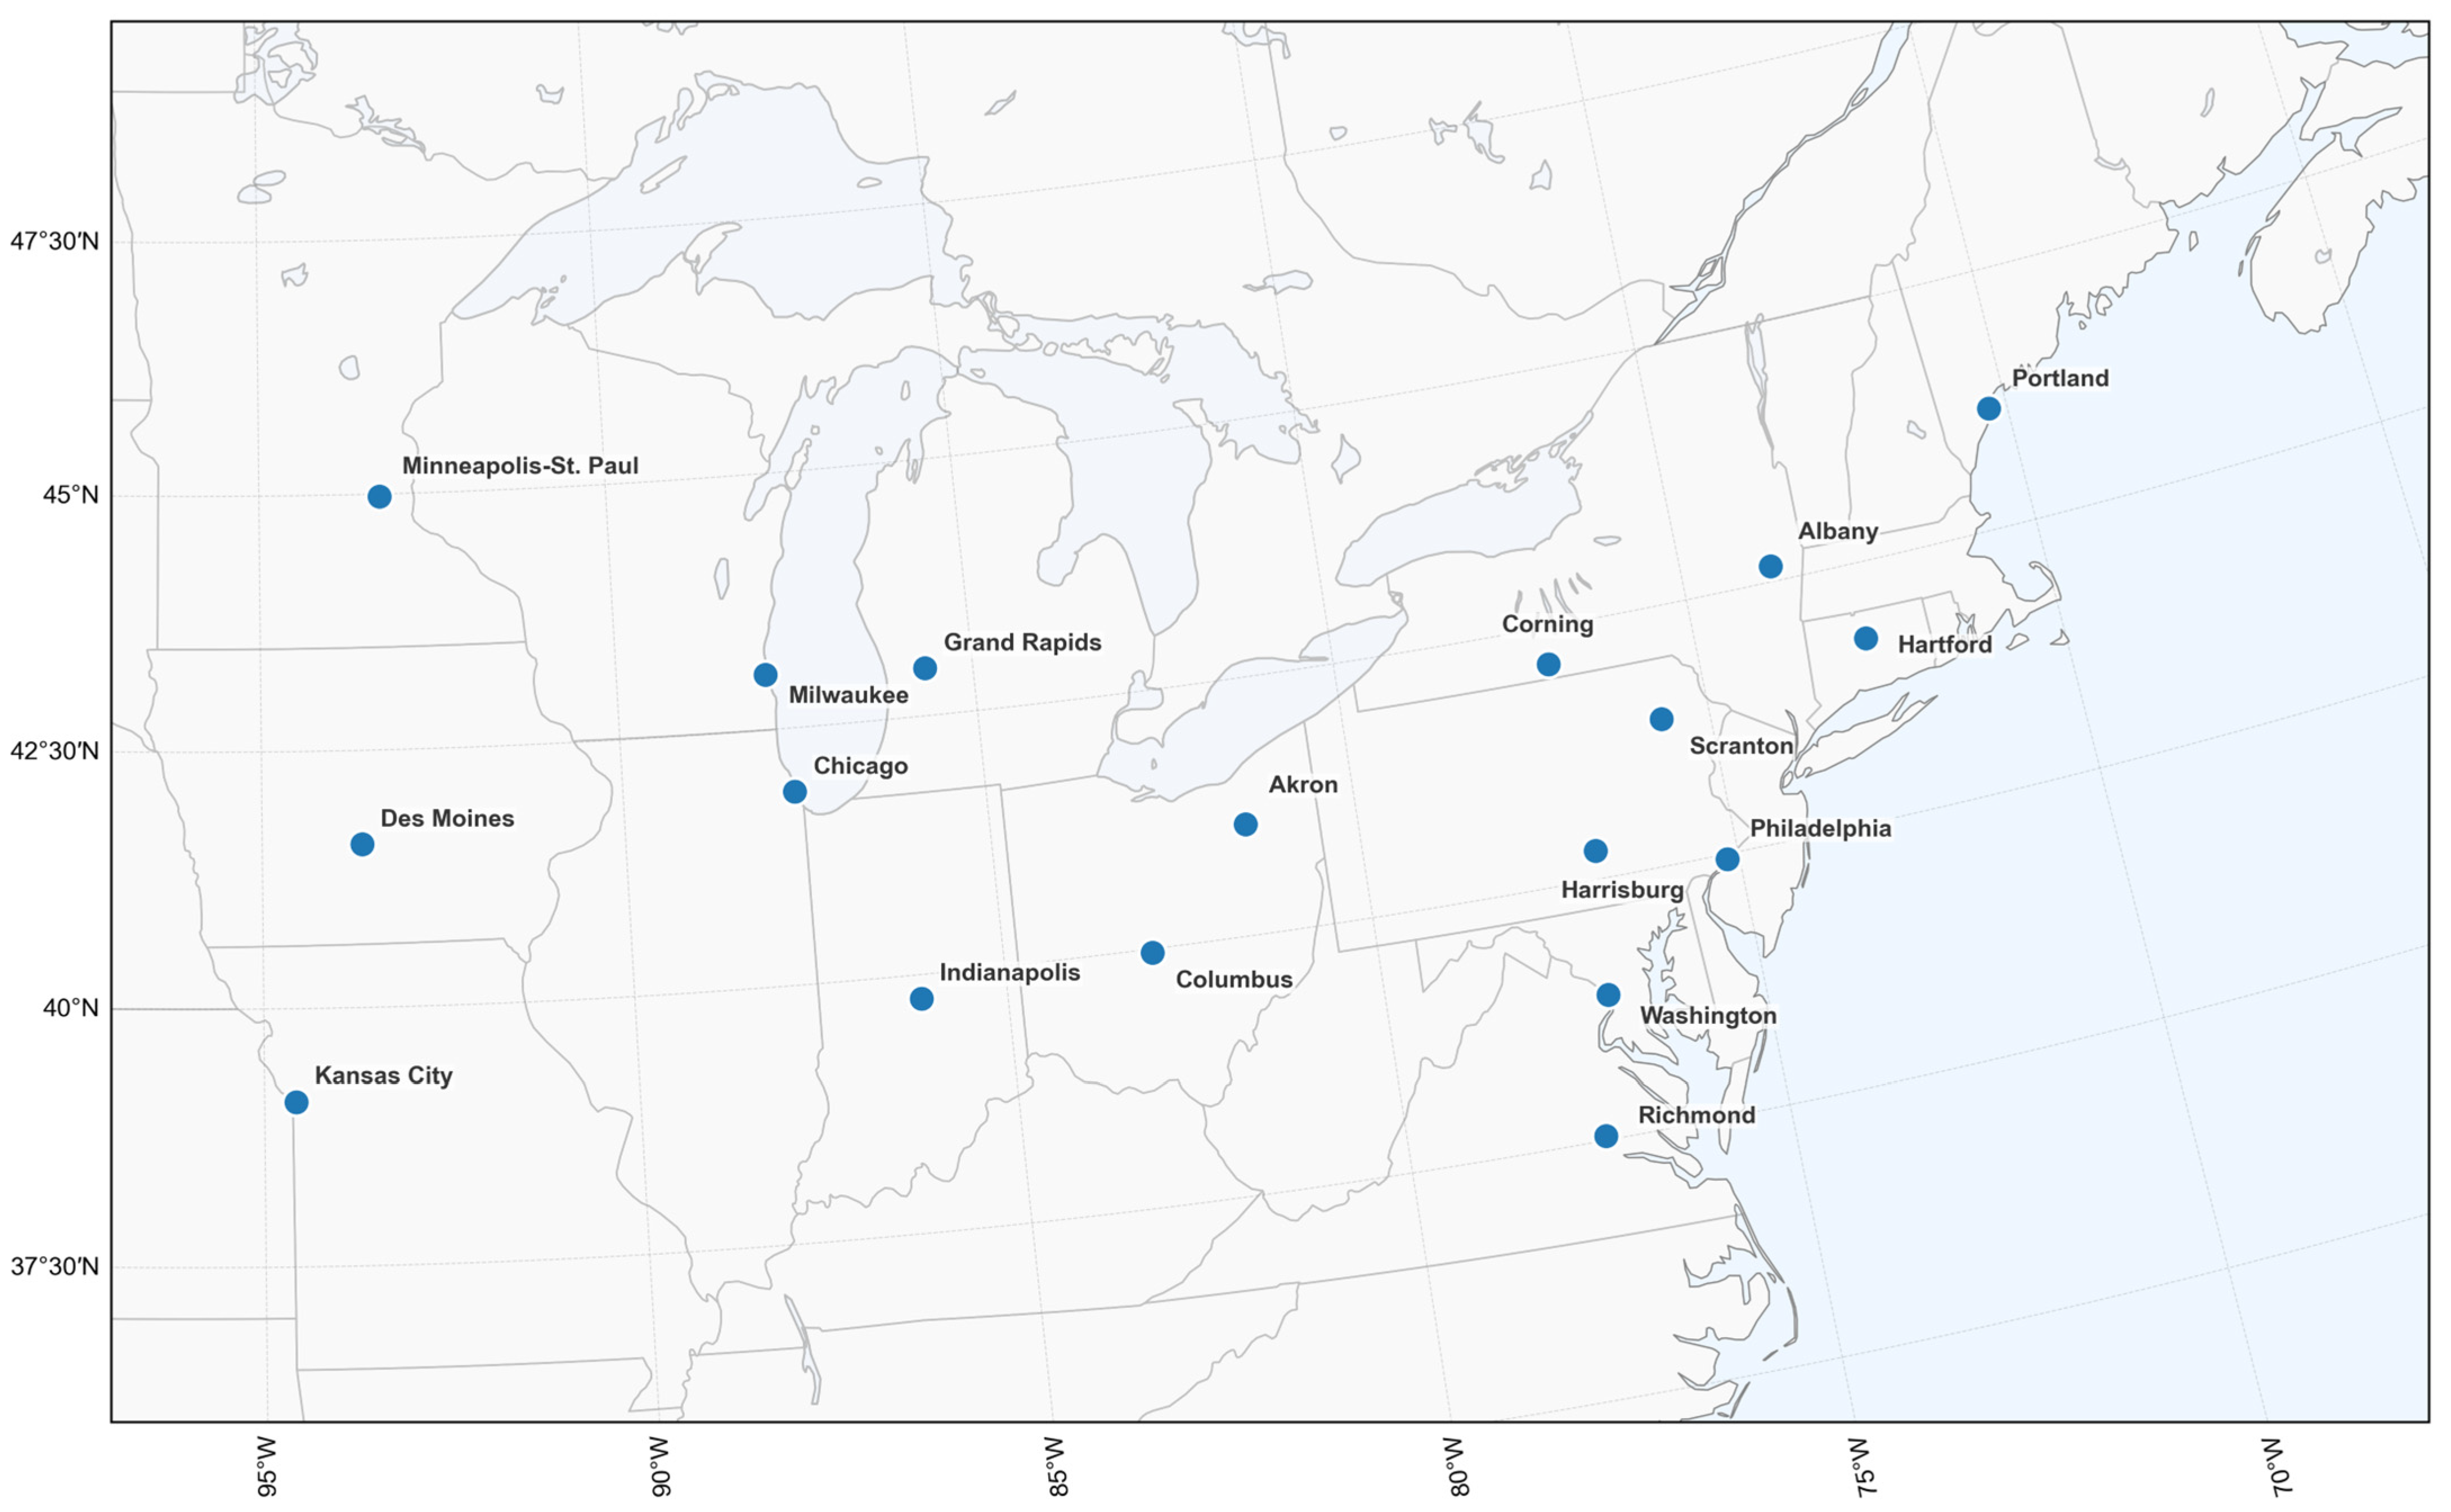
The analytical framework of this study is grounded in a large-scale longitudinal sample of mass participation runners across 18 major United States marathon events, spanning the period from 2011 to 2019 (Figure 1). This multi-city research design was specifically developed to encompass diverse geographic and climatic profiles across the northeastern and midwestern United States, ranging from the humid coastal environments of Maine to the continental climates of the Midwest. Raw performance records were retrieved from the Kaggle “2010–2019 Fall Marathons” database (https://www.kaggle.com/datasets/runningwithrock/2010-2019-fall-marathons, accessed on 10 April 2026), which provided standardized participant metrics including finishing times, sex, and chronological age. By incorporating 18 distinct urban locations, this study effectively mitigates the potential biases associated with specific course topographies or local race conditions.
To provide an empirical foundation for examining performance responses under dynamic thermal exposure, the environmental data were integrated through a multi-tier protocol. Precise race dates were first obtained from the FindMyMarathon database to establish the event timeline for each race-year observation and were manually cross-checked for consistency across all 162 race-year combinations. The primary meteorological variables included race-day maximum air temperature, relative humidity, daily high–low temperature information, and start-condition descriptions. The race-day maximum air temperature was used as the primary thermal predictor, while the start-condition air temperature was extracted to construct the intra-day temperature swing variable. Weather observations were matched to each race-year record to ensure that the performance outcomes and environmental exposure variables referred to the same event date.
A critical enhancement to this data infrastructure is the integration of the Universal Thermal Climate Index (UTCI), derived from the ERA5-HEAT reanalysis dataset provided by the European Centre for Medium-Range Weather Forecasts (ECMWF) via the Copernicus Climate Change Service (C3S). ERA5-HEAT provides gridded historical estimates of the mean radiant temperature (MRT) and the UTCI calculated from the ERA5 air temperature, humidity, wind speed, and radiation fields [20]. Previous studies have described ERA5-HEAT as a global historical dataset for human thermal comfort assessment and have examined the feasibility of reanalysis-based heat-stress products for outdoor thermal exposure assessment [21]. The UTCI was used as a complementary human-biometeorological benchmark because it integrates air temperature, humidity, wind speed, and radiative heat exchange into a standardized estimate of outdoor thermal stress. For this analysis, the UTCI values were temporally aligned to local noontime, which approximately corresponds to the late-race period for many recreational runners in morning-start marathons, when accumulated fatigue and environmental warming may jointly increase the thermal burden. However, because the MRT estimation from meteorological and radiative inputs remains methodologically complex, the UTCI was treated as a complementary biometeorological benchmark rather than a direct course-level field measurement.
It should be noted that this study did not conduct direct on-course measurements of the mean radiant temperature (MRT), globe temperature, solar radiation, or air velocity. Therefore, the MRT was not independently measured or calculated from field instruments, and no information is available for the instrument type, installation height, or sensor positioning along the marathon courses. Instead, radiative and wind-related effects were incorporated indirectly through the ERA5-HEAT UTCI benchmark. The primary regression framework used the race-day maximum air temperature and relative humidity as the main interpretable exposure variables, while the UTCI was used for robustness validation rather than as a complete physiological heat-balance model.
The preprocessing phase involved a screening protocol to transform the initial 1,099,041 raw participant records into a validated analytical dataset. Professional invited athletes, defined as runners with finishing times below 2:10:00 for men and below 2:25:00 for women, were excluded to focus the investigation on mass participation amateur runners. Finishing times were converted into a continuous second-based variable to improve estimation precision, followed by a 1% Winsorization procedure to reduce the influence of extreme outliers. Records from 2010 were excluded because the ERA5-HEAT dataset begins in 2011. Furthermore, only race-year observations with complete and synchronized performance, meteorological, and UTCI records were retained for the final analysis.
Following data cleaning and multi-source matching, the final analytical sample consisted of 967,878 valid observations, representing an 88.07% matching rate between performance records and environmental data. The baseline demographic characteristics and environmental distributions for this population are detailed in Table 1, while the core variables and performance indicators used in the subsequent regression framework are defined in Table 2.

2.2. Statistical Modeling: Two-Way Fixed Effects

To rigorously estimate the marginal association between thermal exposure and marathon performance, we employed a two-way fixed effects (TWFE) regression framework. This approach controls for unobserved spatial and temporal heterogeneity, reducing potential confounding from course-specific baselines, such as elevation profiles, and year-specific shocks, including changes in footwear technology or race organization. The primary benchmark specification used the race-day maximum air temperature as the core thermal predictor and was formulated as follows:
F i n i s h i , r , t = α + β 1 T r , t + β 2 T r , t 2 + β 3 T s w i n g , r , t + β 4 ( T r , t × H r , t ) + Z i θ + γ r + δ t + ϵ i , r , t
where F i n i s h i , r , t is the completion time in seconds for runner i in race r and year t, the term T r , t represents the race-day maximum air temperature, and T r , t 2 captures the nonlinear association between thermal exposure and marathon performance. The estimated thermal optimal zone (TOZ) was derived from the vertex of the fitted quadratic temperature–performance function. In specifications without the interaction term, this vertex is given by T O Z = β 1 / ( 2 β 2 ) . In the interaction specification, the temperature optimum is humidity-dependent and can be expressed as follows:
T O Z ( H ) = β 1 + β 4 H 2 β 2
To move beyond a purely stationary exposure specification, we incorporated T s w i n g , r , t , defined as the difference between the race-day maximum air temperature and the start-condition air temperature ( T m a x , r , t T s t a r t , r , t ) . This term was used as a proxy for intra-day thermal exposure accumulation during the race window. Unlike a single race-day temperature measure, T s w i n g , r , t reflects the extent to which runners may experience progressively warmer conditions as the race unfolds. This is particularly relevant for recreational runners, who typically spend a longer time on the course and are therefore more likely to encounter late-race warming. Accordingly, T s w i n g , r , t provides a practical non-stationary exposure term within the fixed-effects framework.
The interaction term T r , t × H r , t was included to evaluate whether temperature-related performance penalties vary across humidity levels, reflecting the potential restriction of evaporative cooling under humid–warm conditions. Individual controls ( Z i ) incorporated biological sex and a quadratic specification for centered age. The terms γ r and δ t denote race-specific and year-fixed effects, respectively.
The main specification reports the HC3 heteroscedasticity-robust standard errors to address potential heterogeneity in residual variance. Because environmental exposure variables were assigned at the race-year level, while the finish time was observed at the individual-runner level, we additionally conducted sensitivity analyses using standard errors clustered at the race-year level and race-year aggregated robustness models. These analyses were used to assess whether the main findings remained stable after accounting for shared race-year environmental exposure; the results are reported in Appendix A Table A2. As a supplementary robustness verification, the race-day maximum air temperature was replaced by the Universal Thermal Climate Index (UTCI) in secondary specifications. The UTCI was used as a complementary human-biometeorological benchmark because it integrates air temperature, humidity, wind speed, and radiative heat exchange into a standardized measure of outdoor thermal exposure. However, the UTCI was not treated as a complete physiological model of marathon running because it does not explicitly account for exercise-induced metabolic heat production, hydration status, pacing behavior, or individual thermoregulatory adaptation. Therefore, the UTCI was used to validate the robustness of the estimated thermal exposure–performance relationship rather than to define the primary TOZ.

2.3. Hierarchical and Non-Stationary Validation Framework

To evaluate the incremental explanatory power of nonlinear thermal effects, thermo-hygrometric interactions, and non-stationary exposure terms, this study adopted a hierarchical nested-regression framework within the TWFE setting. These specifications were designed to assess whether the estimated thermal exposure–performance relationship remained stable across progressively richer representations of environmental exposure.
(1)
Baseline Linear Model: This model established first-order associations between marathon performance and fundamental meteorological drivers, specifically the race-day maximum air temperature and relative humidity.
(2)
Core Nonlinear Interaction Model: This specification expanded the baseline by incorporating the quadratic temperature term ( T 2 ) and the temperature–humidity interaction ( T × H ) . This model characterized the nonlinear performance curve and evaluated whether temperature-related performance penalties were modified by the humidity. The quadratic temperature term was used to estimate the TOZ, while the interaction specification allowed the estimated optimum to vary with the humidity.
(3)
Integrated and Non-Stationary Robustness Stage: This stage introduced the UTCI-based biometeorological exposure and the non-stationary exposure proxy ( T s w i n g ) for cross-model validation. The purpose was to examine whether the conclusions derived from the race-day maximum air temperature remained consistent after accounting for integrated outdoor thermal exposure and intra-day thermal exposure variation. Because the UTCI is not a complete physiological model of marathon running, it was treated as a complementary benchmark rather than as a replacement for the main air temperature–humidity framework. The incremental contribution of each specification was evaluated using the adjusted R 2 , the Akaike information criterion (AIC), and the root mean square error (RMSE).

2.4. Stratified Analysis and Vulnerability Index

While the aggregate two-way fixed effects model identifies the average association between thermal exposure and marathon performance, responses may vary across demographic and athletic cohorts. To examine such heterogeneity, we employed a stratified analysis framework and constructed a derivative-based thermal vulnerability index (TVI).
The stratification strategy partitioned the dataset along three dimensions. First, athletic proficiency was defined using race-year-specific standardized performance. Runners whose finishing times ranked within the fastest 5% of their race-year distribution were classified as the ’elite’ cohort, while the remaining runners were classified as the ’mass’ cohort. This distinction was used to compare thermal sensitivity between faster and slower runners. Second, the sample was stratified by biological sex. Third, participants were categorized into three age brackets: 18–34, 35–49, and ≥50 years, to examine age-related differences in thermal sensitivity. Equation (1) was re-estimated independently for each sub-cohort to obtain the group-specific coefficient β g .
To quantify cohort-specific sensitivity to increasing air temperature, we defined the TVI as the first partial derivative of the estimated performance function with respect to air temperature T. Based on the nonlinear and interaction terms in Equation (1), the index for a specific cohort g is formulated as follows:
T V I g = F i n i s h T = β 1 , g + 2 β 2 , g T + β 4 , g H  
Expressed in seconds per degree Celsius ( s / ° C ) , this metric summarizes three components of temperature sensitivity: the baseline temperature response ( β 1 , g ) , the nonlinear change in sensitivity as temperature increases ( 2 β 2 , g T ) , and the humidity-dependent amplification term ( β 4 , g H ) . A higher TVI indicates a steeper predicted increase in finish time for a given increase in air temperature under specified humidity conditions. This index provides a standardized way to compare thermal sensitivity and vulnerability across subgroups while retaining the interpretability of the temperature–humidity interaction framework.

3. Results

3.1. Climatic Background and Descriptive Statistics

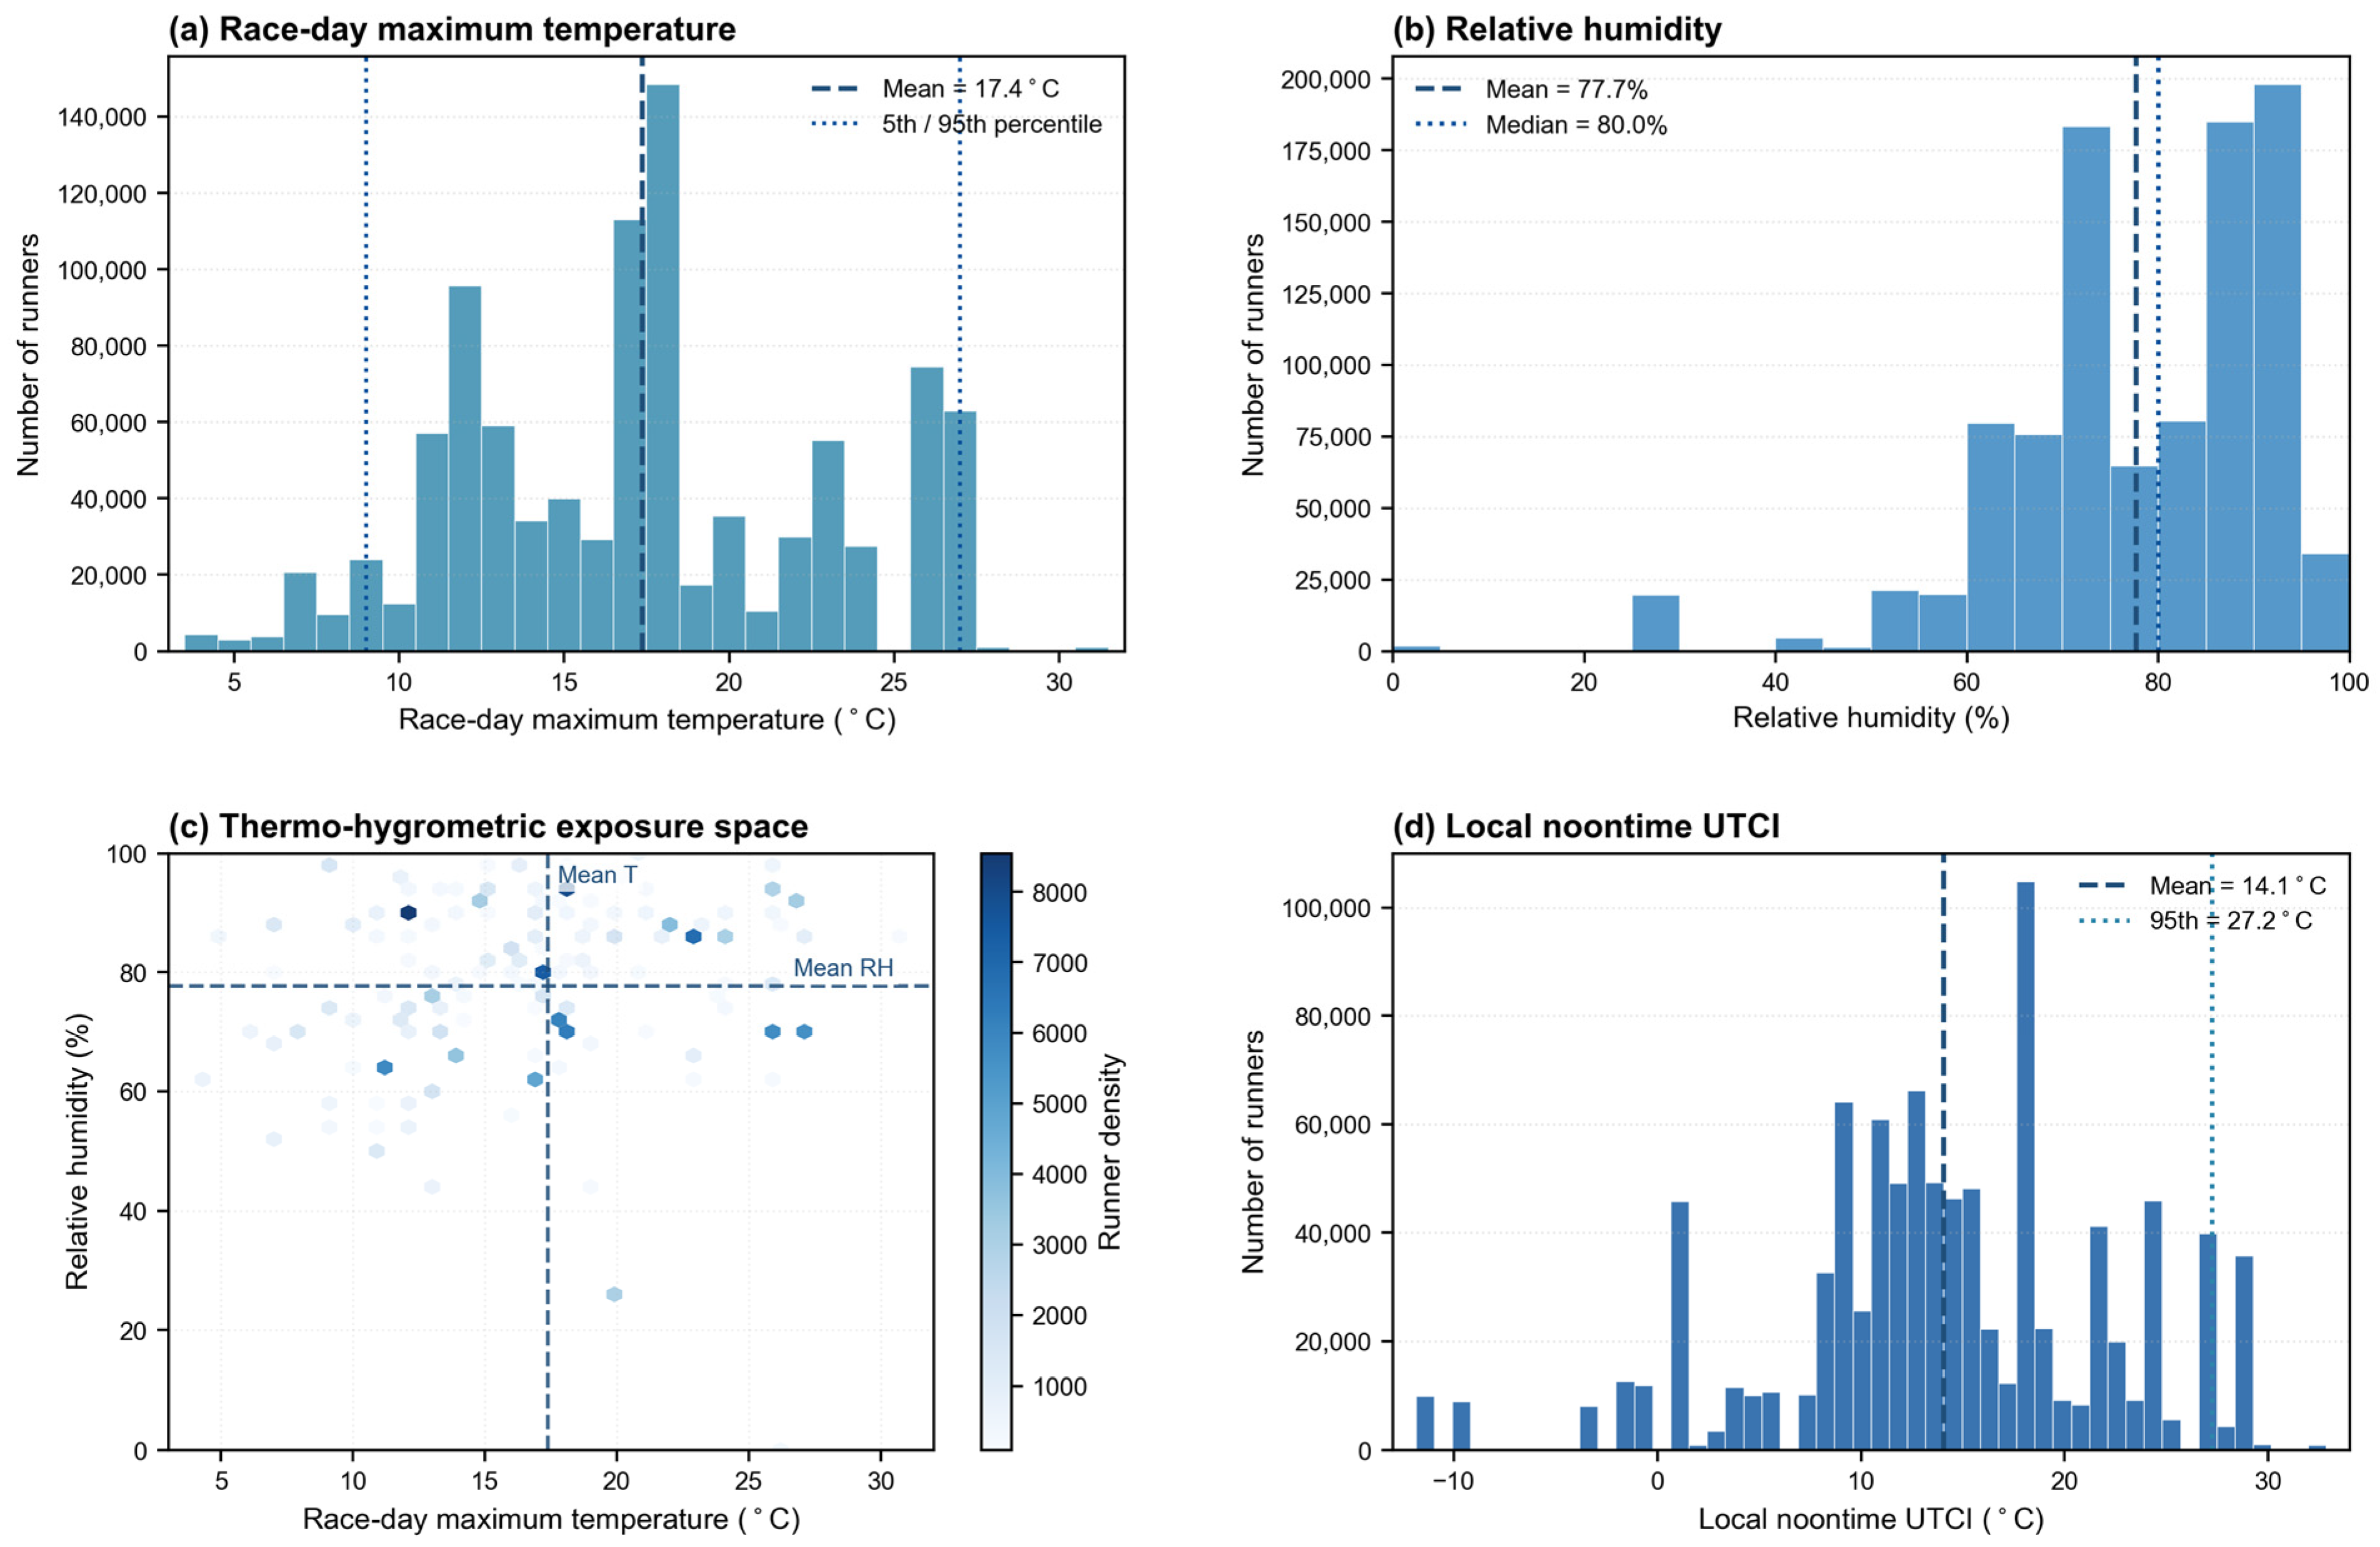
The environmental conditions across the 18 study locations from 2011 to 2019 covered a broad range of thermal exposure, providing an empirical gradient for analyzing marathon performance variation. The distribution and coupling of the primary meteorological variables are illustrated in Figure 2.
The race-day maximum air temperature averaged 17.4 ± 5.5   ° C , ranging from 4.0   ° C   t o   31.0   ° C . As shown in Figure 2a, the distribution was slightly right-skewed, with the 5th and 95th percentiles at 9.0   ° C   a n d   27.0   ° C , respectively. This range indicates substantial inter-annual and inter-city variability among U.S. fall marathons. The relative humidity remained generally high throughout the study period, with a mean of 77.7 ± 14.3 % and a median of 80.0 % (Figure 2b).
The thermo-hygrometric space shown in Figure 2c reveals a dense concentration of observations under moderate temperature and high-humidity conditions. This coupling is relevant for endurance running because high humidity can reduce the vapor pressure gradient between the skin and surrounding air, thereby limiting evaporative heat loss. Thus, even under moderate air temperatures, runners may experience less favorable cooling conditions when relative humidity is high.
The Universal Thermal Climate Index (UTCI) provided a complementary description of the integrated outdoor thermal exposure. At local noontime, the UTCI averaged 14.1 ± 8.1   ° C (Figure 2d), with values ranging from 11.9   ° C to 32.9   ° C . Compared with the race-day maximum air temperature, the noontime UTCI showed a wider distribution, reflecting the combined influence of air temperature, humidity, wind speed, and radiative heat exchange. The distinction between the race-day maximum air temperature, the start-condition air temperature, and the noontime UTCI highlights the non-stationary nature of race-day thermal exposure, supporting the use of intra-day exposure proxies in the subsequent analysis.

3.2. Exploration of Thermal Effects and Performance

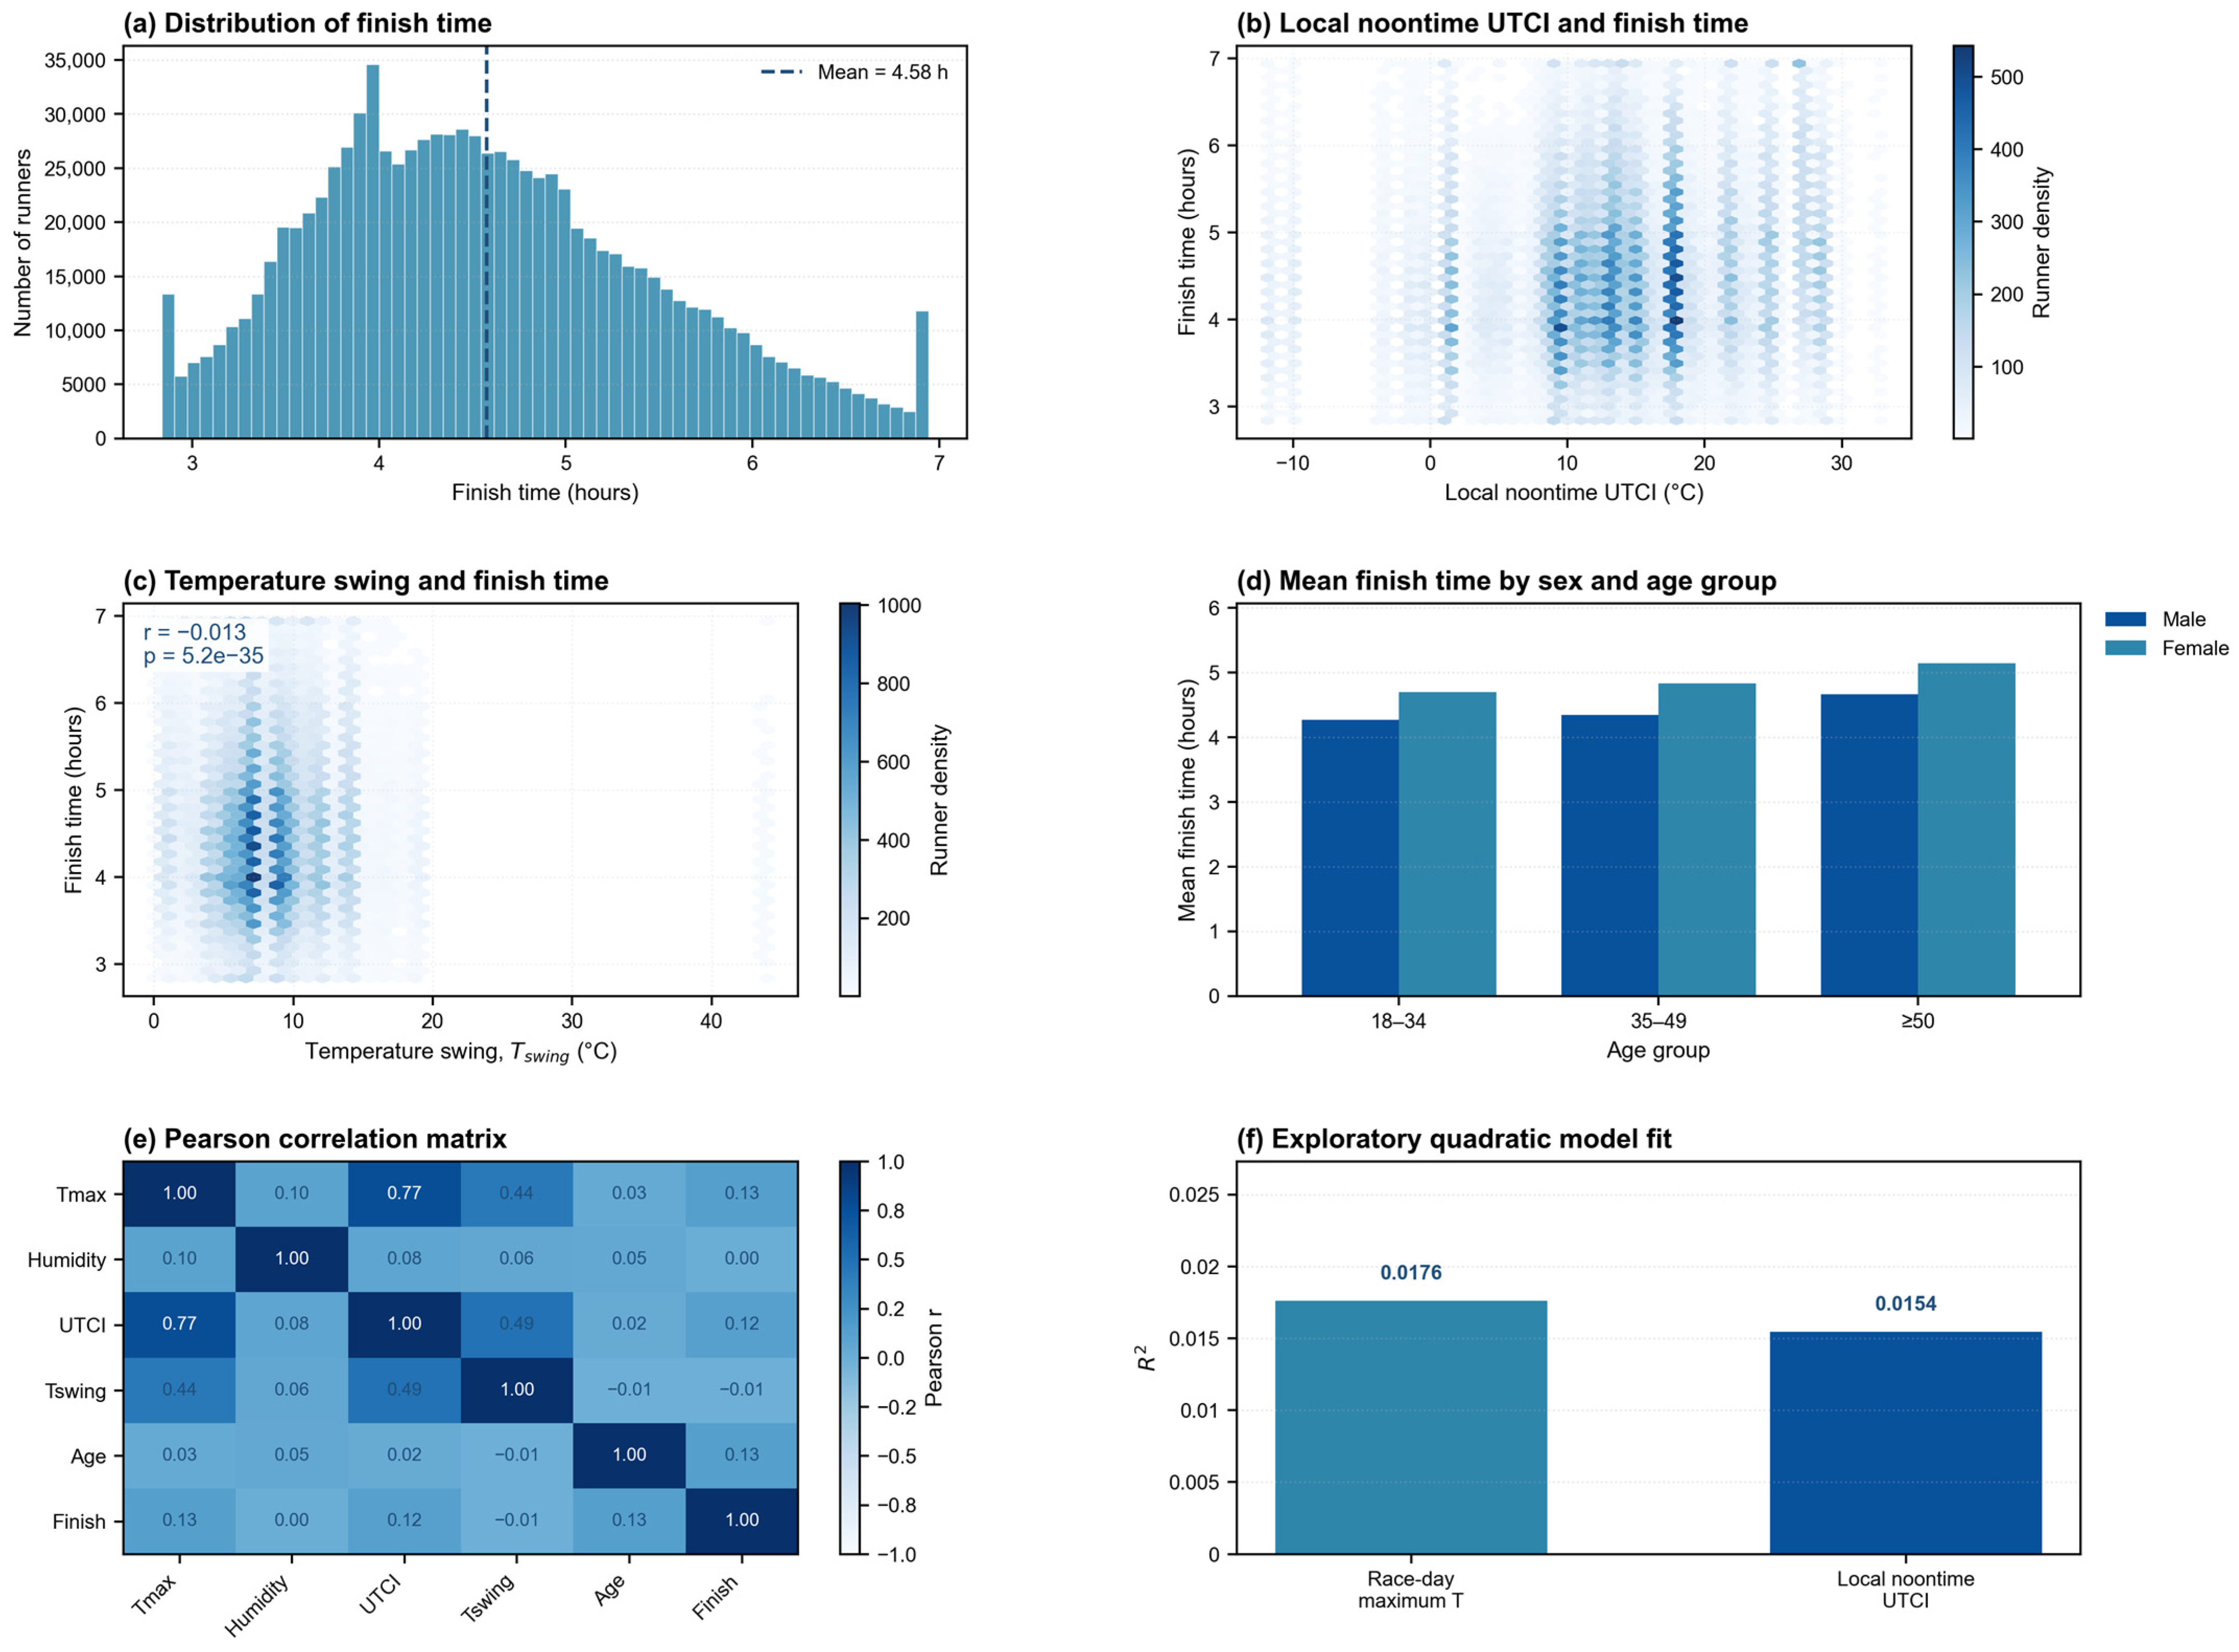
The exploratory analysis of the standardized dataset (Figure 3) revealed visible associations between thermal exposure and marathon performance, although most bivariate relationships were modest in magnitude. As illustrated in the distribution of the finish time (Figure 3a), the average completion time for mass participation runners was 4.58 h ( 16,470.1 ± 3291.3   s ) , with a median of 16,124 s and an interquartile range of 14,026–18,597 s. The right-skewed distribution indicates that, while many runners finished near the 4-h range, a substantial proportion required more than 5.5 h, implying a longer exposure duration during race-day thermal conditions.
Figure 3b presents the bivariate relationship between the local noontime UTCI and the finish time. The hexbin density plot suggests that the finish times tended to increase under warmer integrated thermal exposure, but the association remained modest at the bivariate level ( r = 0.1210 , p < 0.001 ) . Because the UTCI was used here as a complementary indicator of integrated outdoor thermal exposure, this pattern provides exploratory support for considering biometeorological exposure in addition to the primary race-day temperature measure.
Figure 3c further illustrates the relationship between intra-day temperature swings and the finish time. The term T s w i n g , defined as the difference between the race-day maximum air temperature and the start-condition air temperature, showed only a weak bivariate association with the finish time ( r = 0.013 ,   p < 0.001 ) . Although statistically significant due to the large sample size, the magnitude of the association was negligible. Therefore, T s w i n g was treated as a non-stationary exposure proxy for validation rather than as evidence of an independent performance penalty.
The exploratory model comparison in Figure 3f further indicates that neither the race-day maximum air temperature nor the local noontime UTCI alone explained a large share of the finish-time variation. A simple quadratic model using the race-day maximum air temperature yielded R 2 = 0.0176 , while the corresponding local noontime UTCI model yielded R 2 = 0.0154 . This similarity suggests that the UTCI should be interpreted as a complementary benchmark rather than as a clearly superior replacement for the main air temperature-based specification.
The cohort-specific performance patterns shown in Figure 3d highlight consistent differences across the sex and age groups. Male runners across all age brackets had shorter average finish times ( 4.27 4.66   h ) than female runners ( 4.70 5.14   h ) . Older runners (≥50 years) recorded the longest average completion times, particularly among females ( 5.14   h ) . The Pearson correlation matrix (Figure 3e) further indicates that age and integrated thermal exposure, represented by the UTCI, were positively associated with finish time. These exploratory patterns motivate the stratified regression and thermal vulnerability index analyses presented below.

3.3. Main Model Results: Nonlinear Air Temperature Response and Thermo-Hygrometric Interaction

The results of the two-way fixed effects regression are summarized in Table 3. The model controlled for race-specific baselines and year-specific shocks, while also adjusting for age, age squared, biological sex, relative humidity, the temperature–humidity interaction, and intra-day temperature swings. Overall, the model explained a meaningful proportion of the finish time variation for a large-scale observational dataset ( R 2 = 0.1641 ) , although a substantial share of individual-level variation likely reflects unobserved training status, pacing strategy, and race-day behavior.
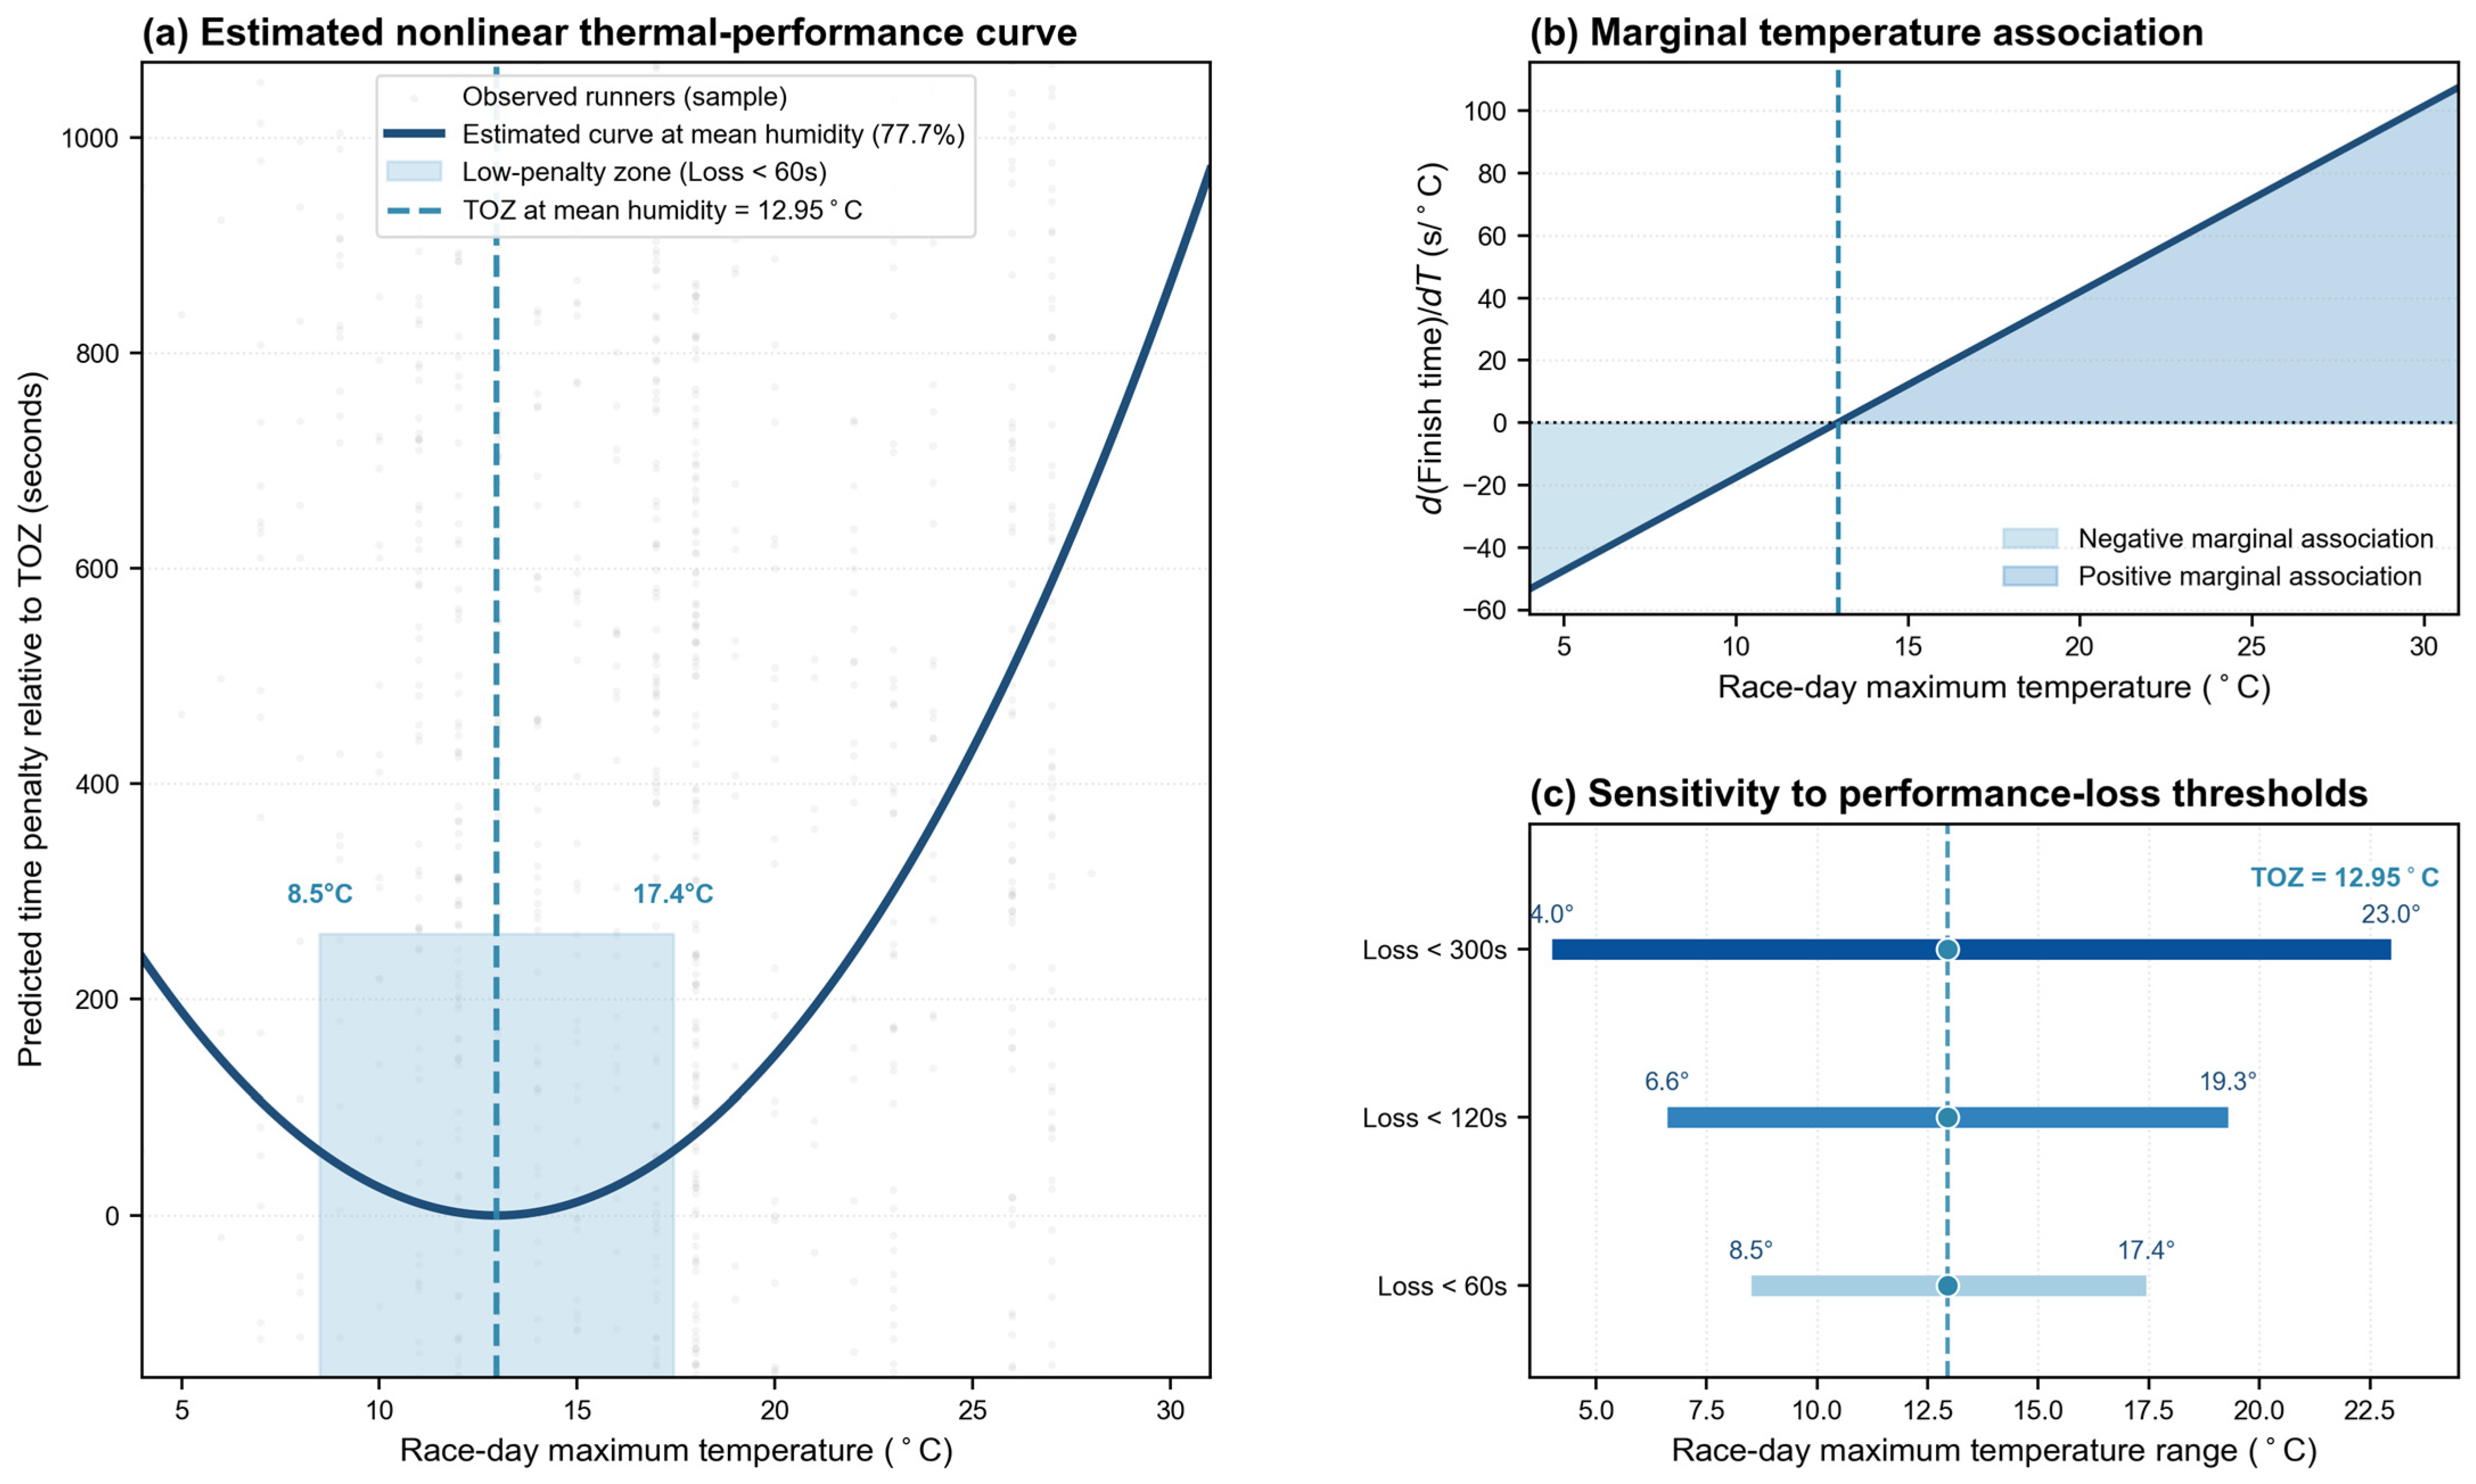
The estimated coefficients for the race-day maximum air temperature and its quadratic term indicate a nonlinear association between thermal exposure and marathon performance. In the HC3 specification, the negative linear coefficient for the race-day maximum air temperature ( β = 114.55 ,   p < 0.001 ) and the positive quadratic coefficient ( β = 2.98 , p < 0.001 ) suggest a U-shaped temperature–performance curve. At the sample mean humidity level ( 77.7 % ) , the estimated thermal optimal zone (TOZ) was 13.0   ° C , representing the race-day maximum air temperature at which the predicted finish-time penalties were minimized under average humidity conditions. This nonlinear relationship is visualized in Figure 4a.
The marginal air temperature association shown in Figure 4b further indicates that the association between air temperature and finish time changes across the thermal range. Below the mean-humidity TOZ, the marginal association remains negative or close to zero; whereas, above the TOZ, it becomes increasingly positive. This pattern suggests that warmer race-day maximum air temperatures are associated with progressively longer completion times once the conditions exceed the estimated low-penalty range.
Figure 4c summarizes the sensitivity of the estimated low-penalty air temperature range to alternative performance-loss thresholds. At the sample mean humidity level, the range associated with a predicted loss of less than 60 s relative to the TOZ extended from 8.5   ° C to 17.4   ° C . Under broader thresholds, the corresponding ranges were 6.6 19.3   ° C for a loss below 120 s and 4.0 23.0   ° C for a loss below 300 s. These ranges provide empirical reference intervals for interpreting the air temperature-related performance variation in mass participation marathon settings.
In the HC3 specification, the temperature–humidity interaction was positive and statistically significant ( β = 0.481 ,   p < 0.001 ) , suggesting that humidity-related penalties may increase as the race-day maximum air temperature rises. However, sensitivity analyses using race-year clustered standard errors showed that the interaction remained positive but was no longer statistically significant ( β = 0.481 ,   c l u s t e r e d   S E = 0.371 ,   p = 0.194 ) . Race-year aggregated models also produced directionally positive but imprecisely estimated interaction coefficients. Therefore, the humidity-dependent penalty estimates should be interpreted as model-based exploratory evidence rather than as fully robust inferential evidence. The humidity-dependent shifts in the TOZ and predicted penalties are examined in greater detail in Section 3.4.
The coefficient for temperature swings, the proxy for intra-day non-stationary thermal exposure, was small and not statistically significant ( β = 0.97 ,   p = 0.326 ) . This suggests that intra-day warming did not independently explain the finish-time variation after accounting for the race-day maximum air temperature, humidity, their interaction, demographic controls, and fixed effects. Therefore, T s w i n g is best interpreted as a validation-oriented non-stationary exposure proxy rather than as a dominant standalone predictor.
Demographic controls showed consistent associations with marathon performance. Female runners had longer predicted finish times than male runners under otherwise similar model conditions ( β = 1677.76 ,   p < 0.001 ) , corresponding to approximately 28.0 min. The centered age terms indicated a nonlinear age–performance association: finish time increased with age ( β = 39.59 ,   p < 0.001 ) , and the positive quadratic age term ( β = 1.94 ,   p < 0.001 ) suggests that this increase became steeper at older ages. These demographic patterns provide the basis for the stratified vulnerability analysis reported in Section 3.5.

3.4. Synergistic Penalties: The Thermo-Hygrometric Interaction (T × H)

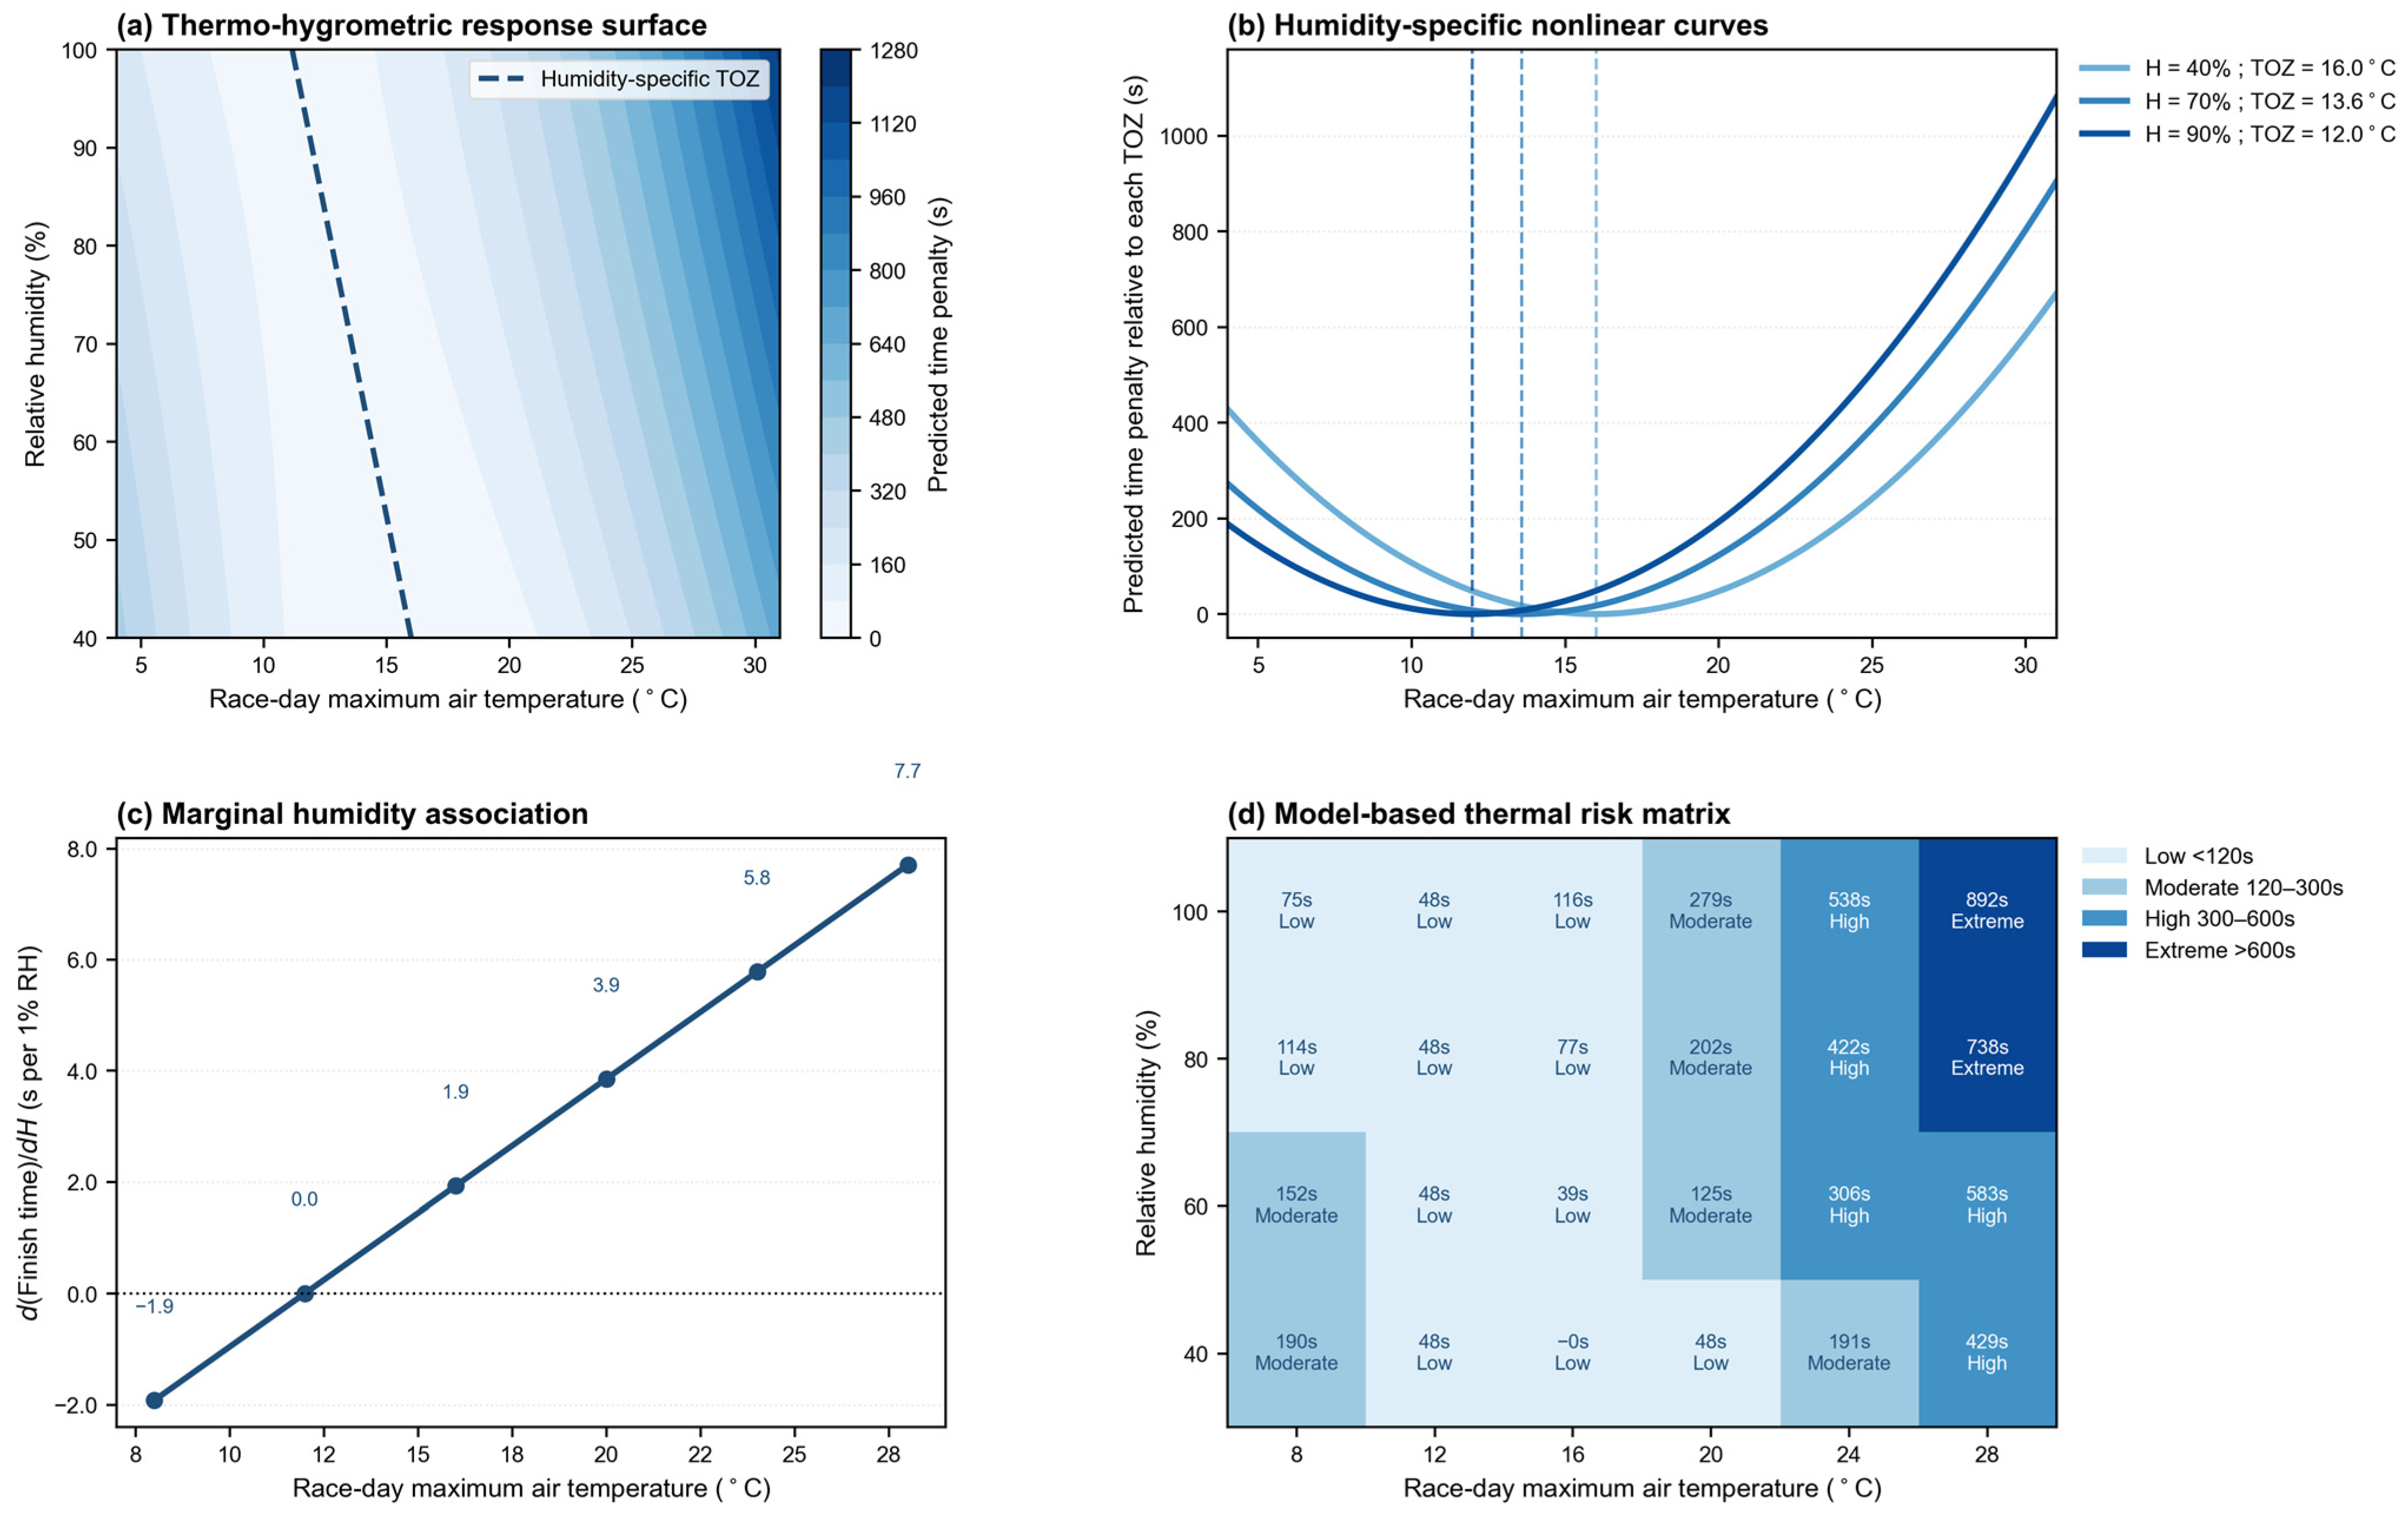
The estimated temperature–humidity interaction was positive in the main specification, suggesting that humidity-related penalties may increase under warmer conditions. However, because the interaction was no longer statistically significant after the race-year clustered inference and was imprecisely estimated in the race-year aggregated models, the following response surfaces should be interpreted as model-based exploratory estimates rather than definitive inferential thresholds. This thermo-hygrometric pattern is illustrated in Figure 5.
Figure 5a displays the predicted response surface across the race-day maximum air temperature and relative humidity. The predicted finish-time penalties were lowest under moderate air temperature conditions and increased most clearly when high air temperature coincided with high humidity. Consistent with the interaction model, the estimated thermal optimal zone (TOZ) shifted downward as the humidity increased, declining from 16.0 °C at 40% relative humidity to 13.6 °C and 12.0 °C at 70% and 90% relative humidity, respectively.
Figure 5b further illustrates the humidity-specific nonlinear performance curves. Under lower humidity, the predicted performance curve remained flatter across a wider air temperature range. Under higher humidity, the curve became steeper at warmer air temperatures, indicating that temperature-related performance penalties were amplified when evaporative cooling conditions were less favorable.
Figure 5c shows the marginal humidity association, calculated as F i n i s h / H = β H + β T × H T . The estimated humidity effect was negligible or slightly negative under cooler conditions, with a 10-percentage-point increase in the relative humidity corresponding to −19.2 s at 8.0 °C and 0.1 s at 12.0 °C. However, the humidity-related penalty increased steadily as the air temperature rose, reaching 19.3 s at 16.0 °C, 38.6 s at 20.0 °C, 57.8 s at 24.0 °C, and 77.1 s at 28.0 °C for each 10-percentage-point humidity increase. This pattern suggests that humidity may become more consequential when combined with elevated race-day air temperatures.
Based on the predicted time penalties relative to the model-implied minimum, Figure 5d classifies thermal exposure into the following four empirical risk categories: low (<120 s), moderate (120–300 s), high (300–600 s), and extreme (>600 s). For example, the model predicted a penalty of approximately 737.5 s under 28.0 °C and 80% relative humidity, placing this condition in the extreme-risk category. These categories should be interpreted as model-based reference ranges rather than universal physiological thresholds. Overall, the results suggest that warm and humid race-day environments may be associated with larger predicted performance penalties, supporting the need to consider both air temperature and humidity in marathon scheduling and heat-risk management.

3.5. Stratified Analysis: Heterogeneity in Thermal Vulnerability

3.5.1. Elite vs. Mass Runners

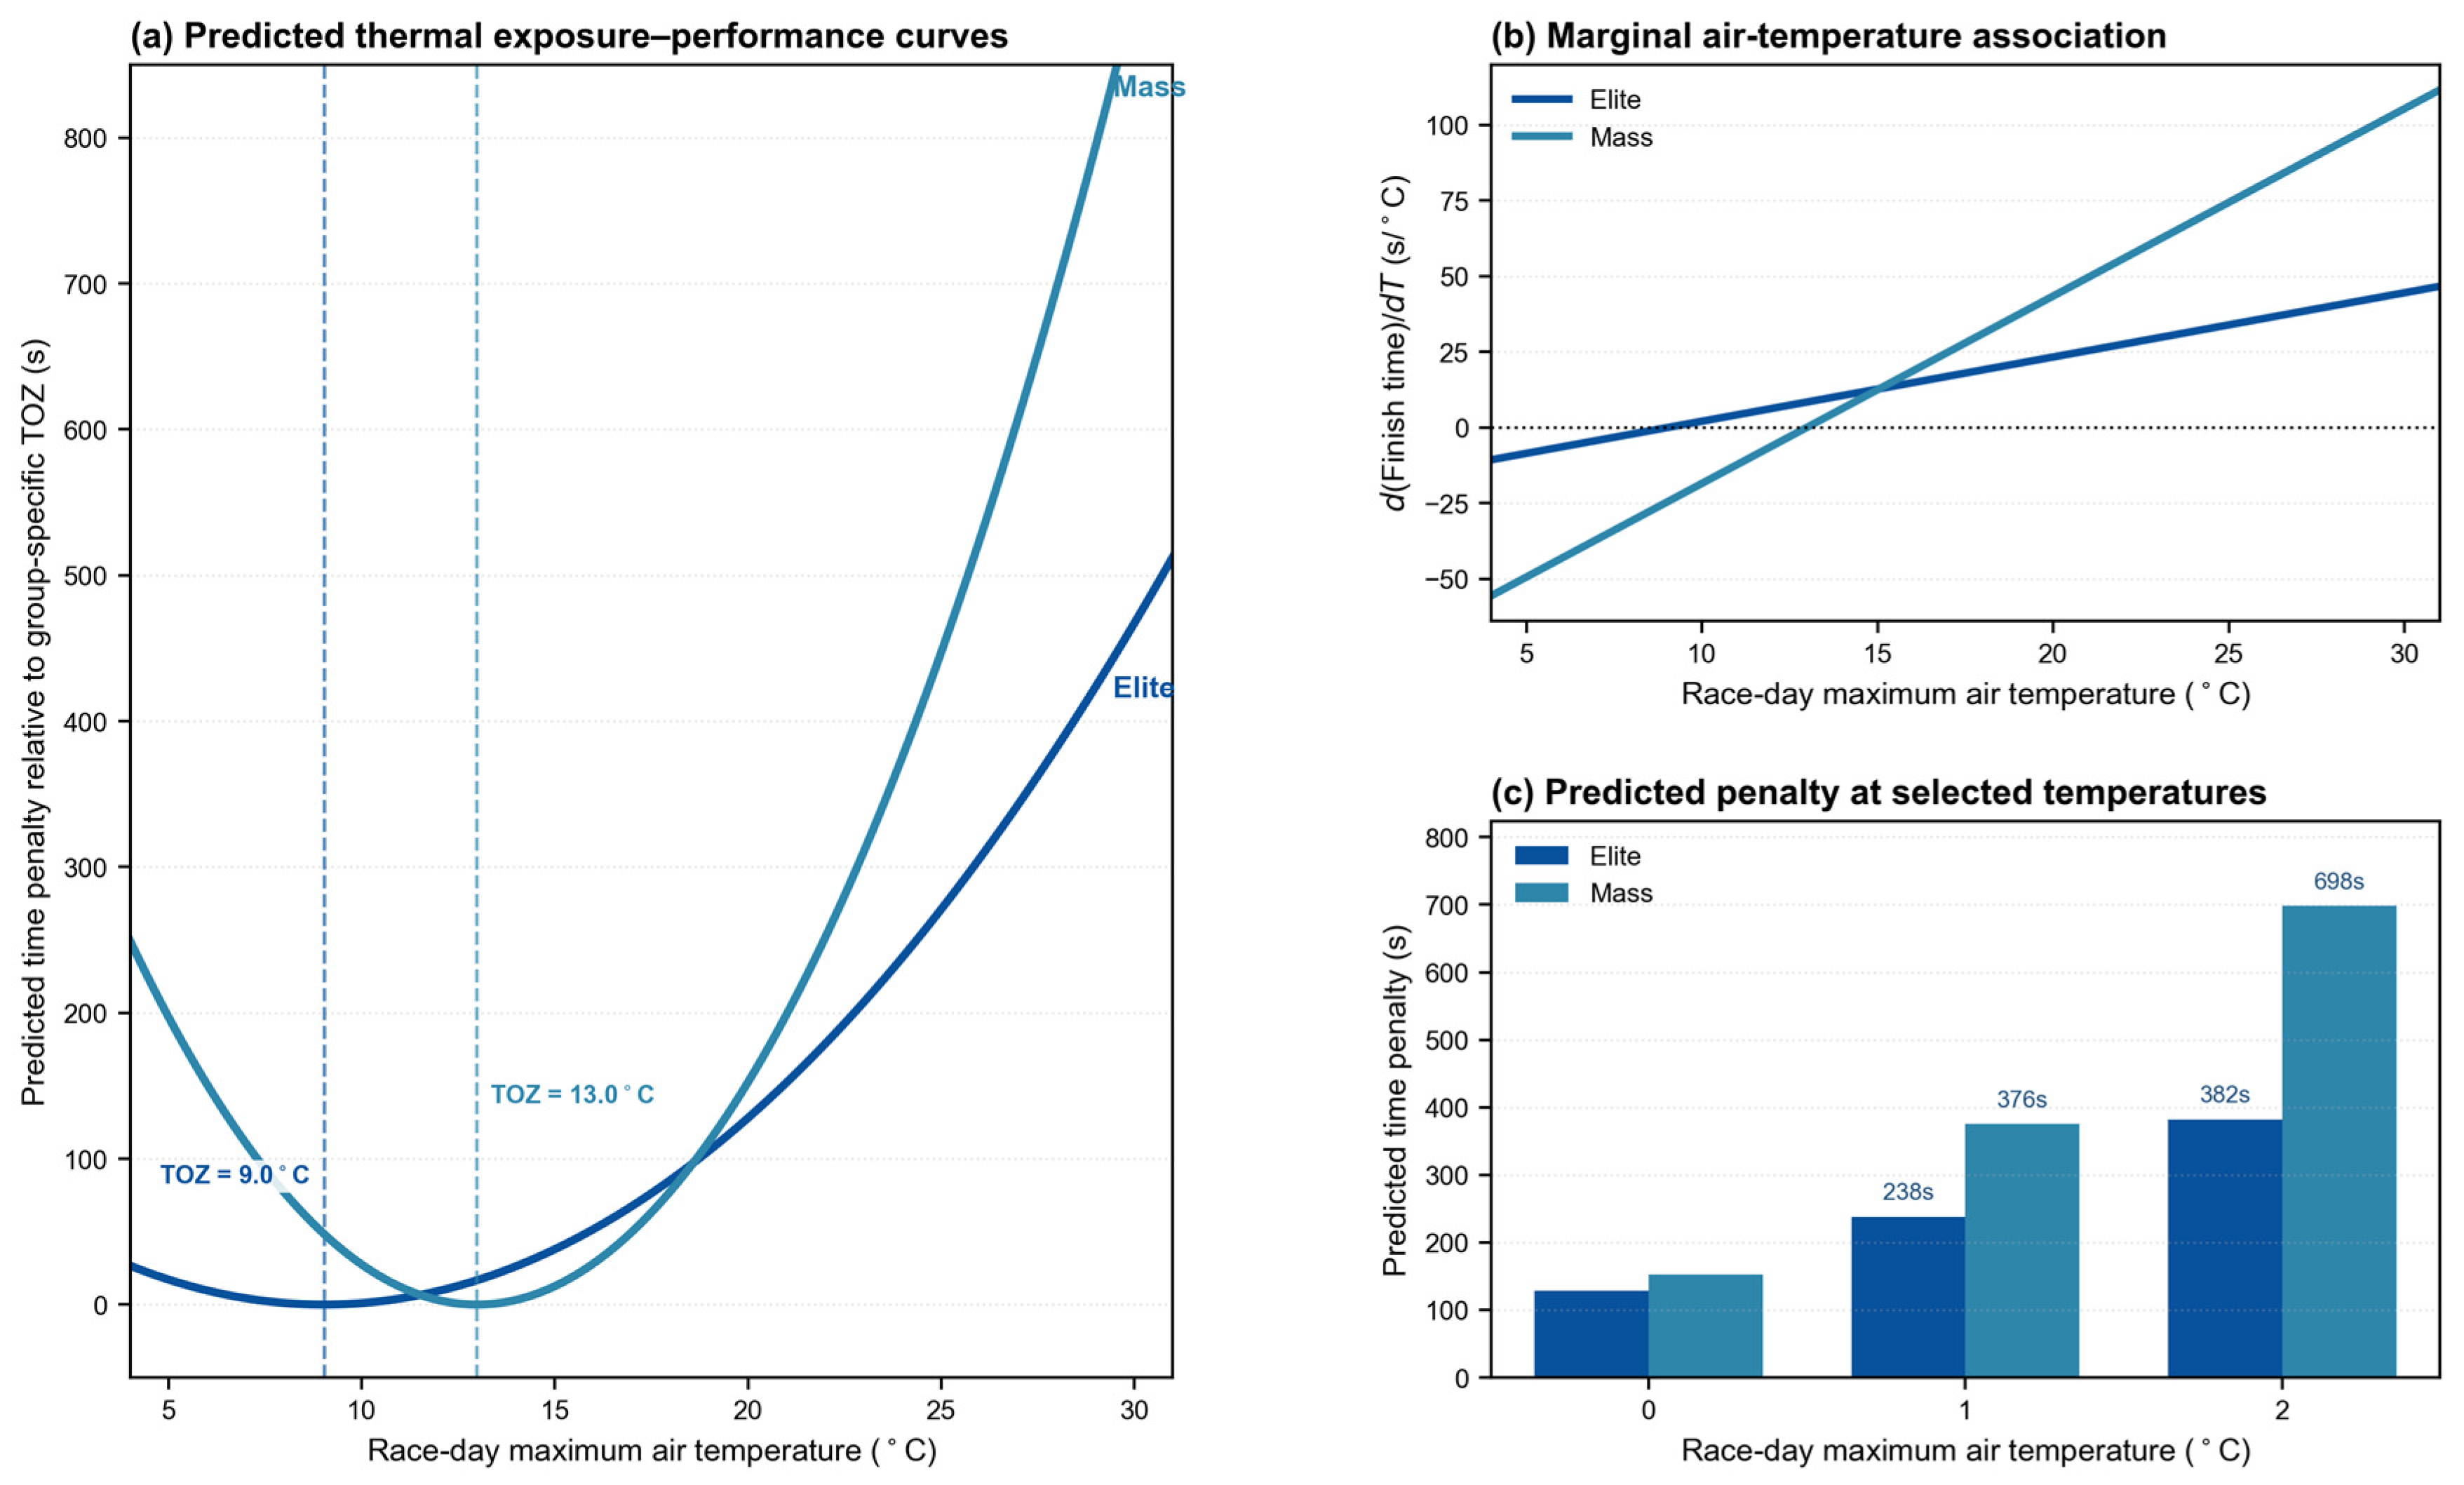
Figure 6 compares the estimated air temperature–performance responses of elite runners and mass participation runners at the sample mean humidity level. Elite runners were defined as the top 5% of finishers within each race-year cohort, while the remaining runners were classified as the mass cohort. The stratified TWFE models explained a larger share of finish-time variation among elite runners ( R 2 = 0.4679 ,   N = 48,313 ) than among mass runners ( R 2 = 0.1553 ,   N = 919,565 ) , likely reflecting the more homogeneous performance profile of the elite group.
The estimated TOZ differed between the two cohorts. Elite runners showed a lower TOZ (9.0 °C), while mass runners showed a higher TOZ (13.0 °C). This difference suggests that the air temperature range associated with the minimum predicted finish-time penalties may vary by performance level. However, the more important divergence occurred under warmer conditions. At 20.0 °C, the predicted penalty was similar between the two cohorts, with 128.0 s for elite runners and 152.4 s for mass runners. As the race-day maximum air temperature increased further, the mass cohort exhibited steeper predicted penalties: at 24.0 °C, the penalty reached 375.7 s for mass runners compared with 238.2 s for elite runners; at 28.0 °C, the penalty increased to 697.9 s for mass runners compared with 382.3 s for elite runners.
The marginal air temperature curves further indicate that the mass runners became more sensitive to additional warming at high air temperatures. At 28.0 °C, the predicted penalty for mass runners exceeded that for elite runners by approximately 315.6 s. This pattern is consistent with the expectation that slower runners may face greater cumulative exposure under warm race-day conditions because they spend longer time on the course. Therefore, the elite runner–mass runner comparison suggests that performance level modifies thermal vulnerability, particularly under high air temperature conditions.

3.5.2. Thermal Vulnerability Across Age and Sex Groups

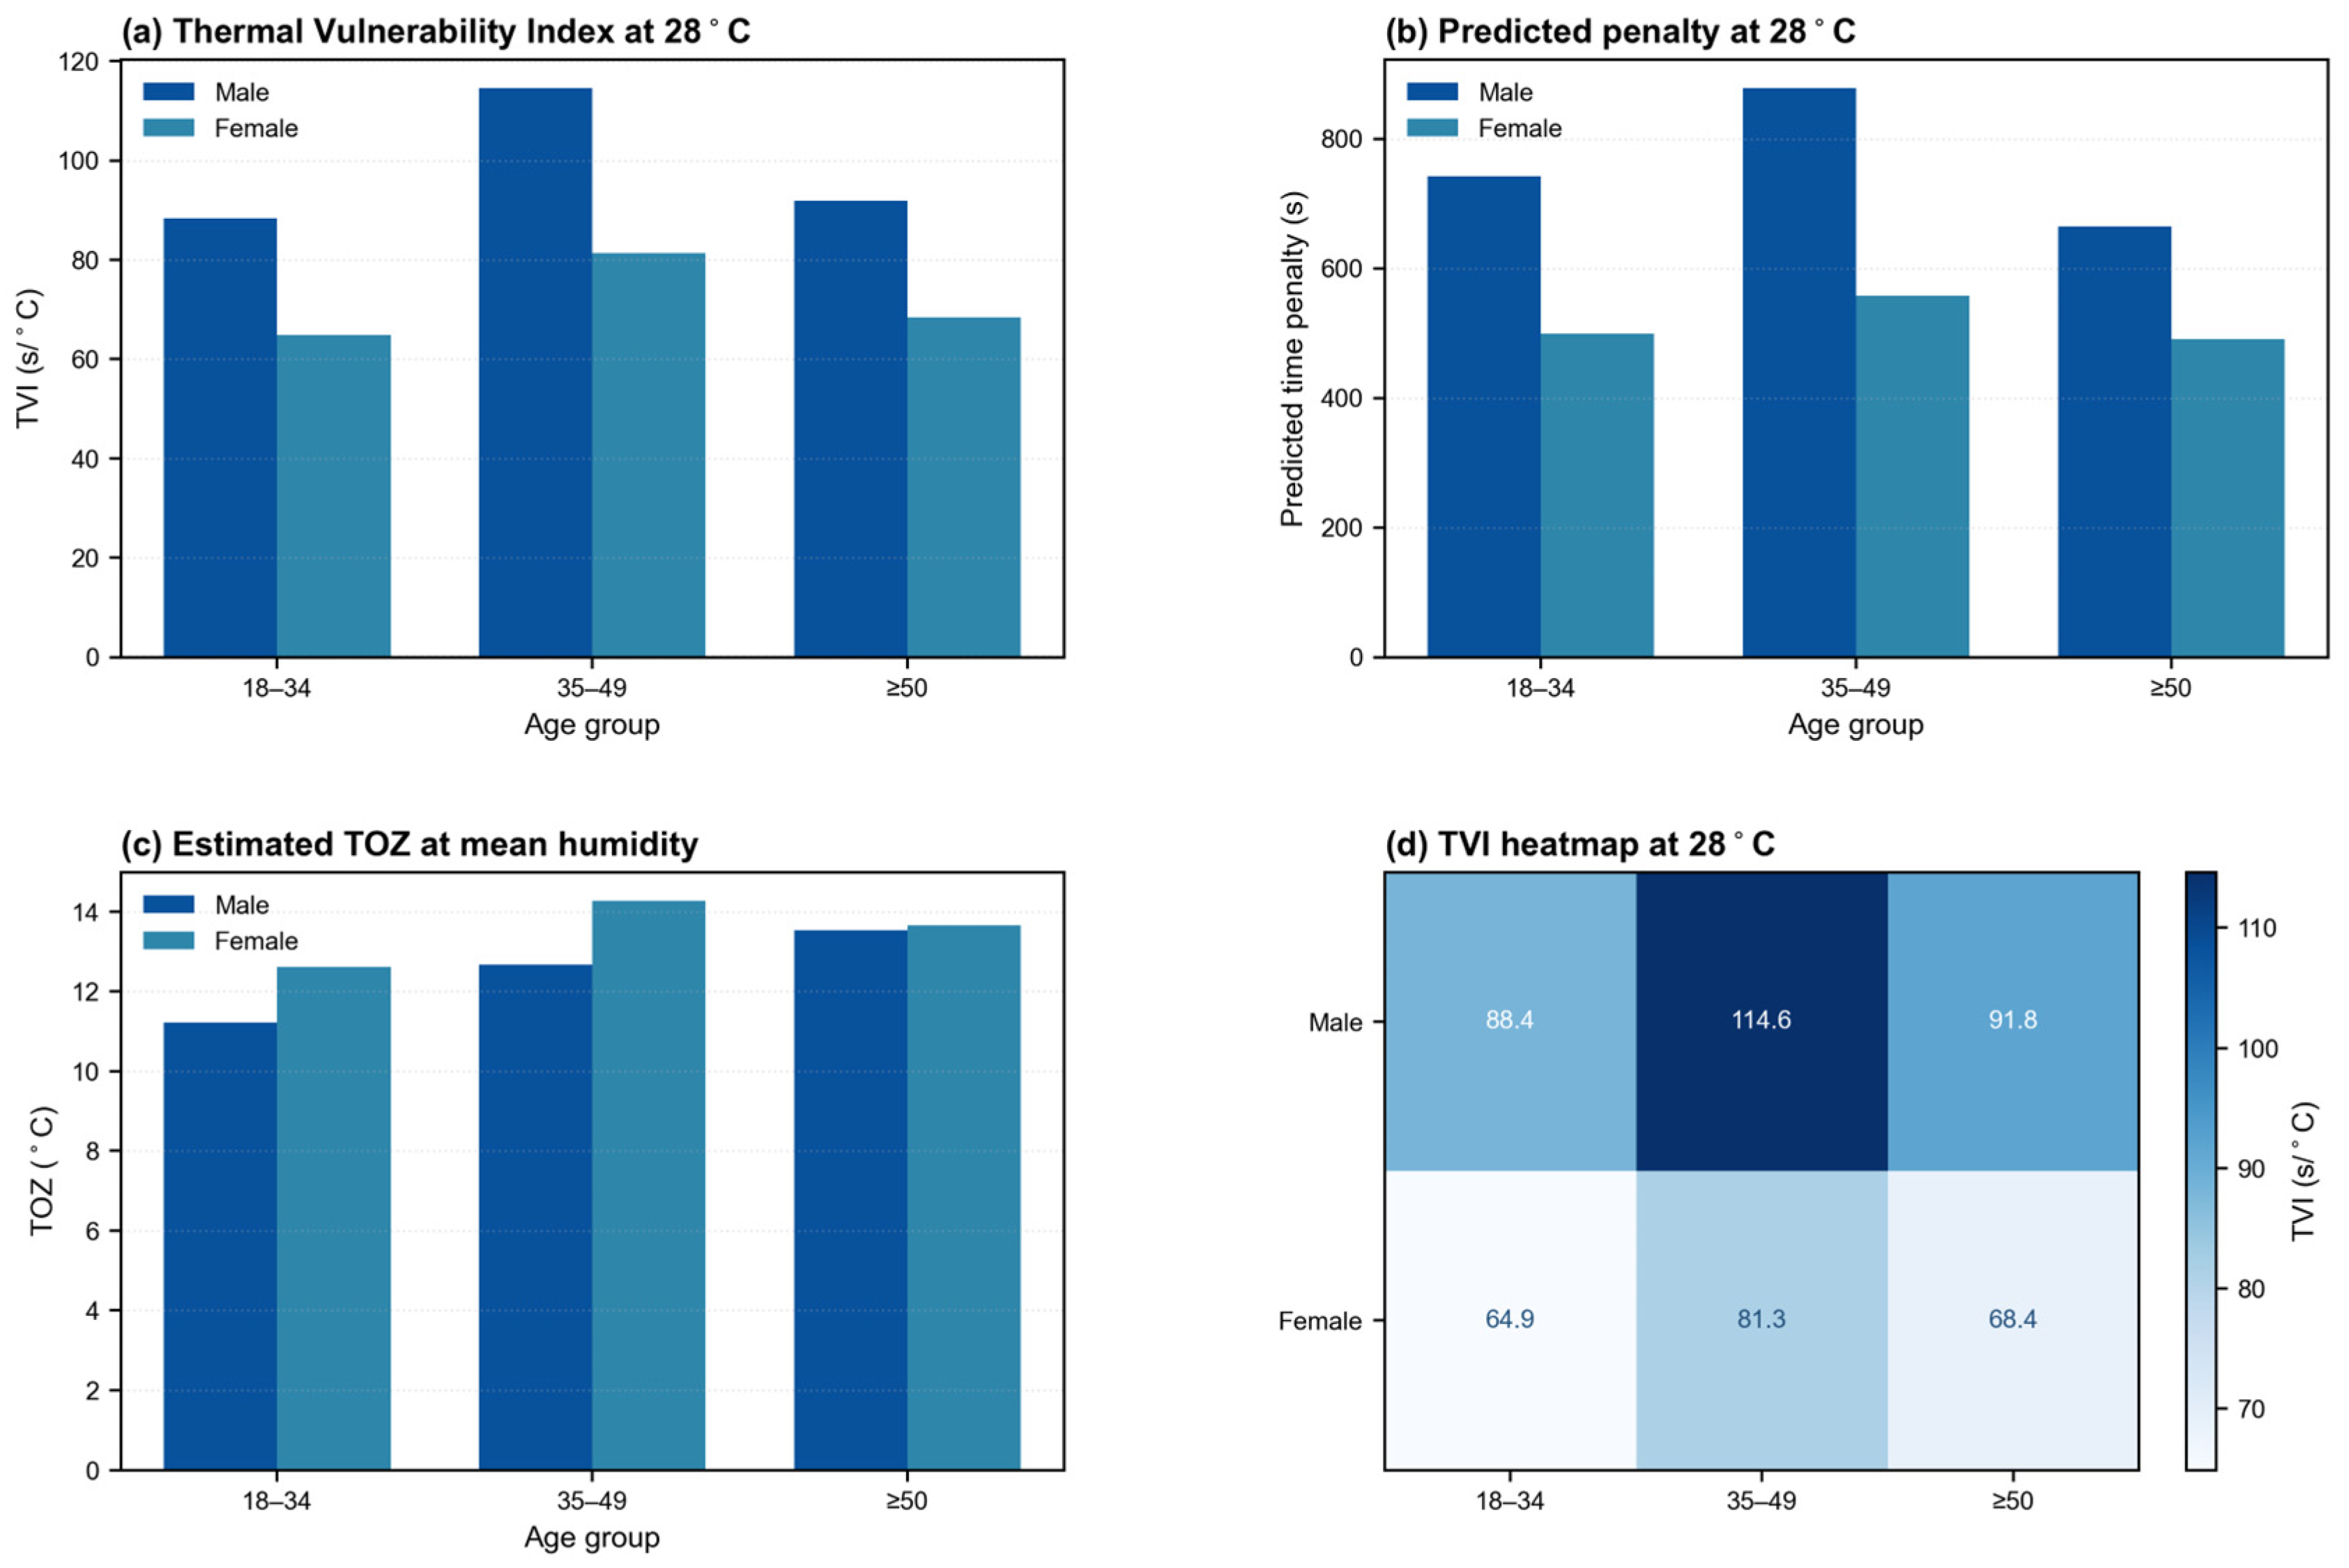
Figure 7 further decomposes thermal vulnerability across the biological sex and age cohorts. The stratified TWFE models revealed clear heterogeneity in air temperature sensitivity, although the patterns were not strictly monotonic with age. At 28.0 °C, the highest thermal vulnerability index (TVI) was observed among male runners aged 35–49 years (114.6 s/°C), followed by males aged ≥50 years (91.8 s/°C) and males aged 18–34 years (88.4 s/°C). Female runners exhibited lower TVI values across all age groups, with 64.9 s/°C, 81.3 s/°C, and 68.4 s/°C for the 18–34, 35–49, and ≥50 groups, respectively.
The predicted high air temperature penalties showed a similar sex-specific pattern. At 28.0 °C, the predicted penalty was highest among male runners aged 35–49 years (878.6 s), followed by males aged 18–34 years (741.4 s) and males aged ≥50 years (664.1 s). By comparison, female runners showed lower predicted penalties: 499.3 s for ages 18–34, 558.1 s for ages 35–49, and 490.9 s for ages ≥50. These results suggest that male runners, particularly those in the middle-age cohort, were more sensitive to high air temperature race-day conditions in the present dataset.
The estimated TOZ also varied across the cohorts. Among male runners, the TOZ increased from 11.2 °C in the 18–34 group to 12.7 °C in the 35–49 group and 13.5 °C in the ≥50 group. Among female runners, the estimated TOZ was 12.6 °C, 14.3 °C, and 13.7 °C across the corresponding 18–34, 35–49, and ≥50 age groups. These differences indicate that subgroup-specific thermal response curves may vary not only in slope but in their estimated low-penalty air temperature range.
Overall, the stratified results suggest that thermal vulnerability is shaped jointly by sex, age, and performance characteristics, rather than by age alone. The consistently higher TVI values among male runners may reflect differences in running speed, body size, pacing strategy, or exposure dynamics, although these mechanisms cannot be directly verified with the available observational data. Therefore, the subgroup patterns should be interpreted as empirical heterogeneity in air temperature–performance associations rather than direct evidence of physiological mechanisms.

3.6. Model Calibration and Non-Stationary Validation

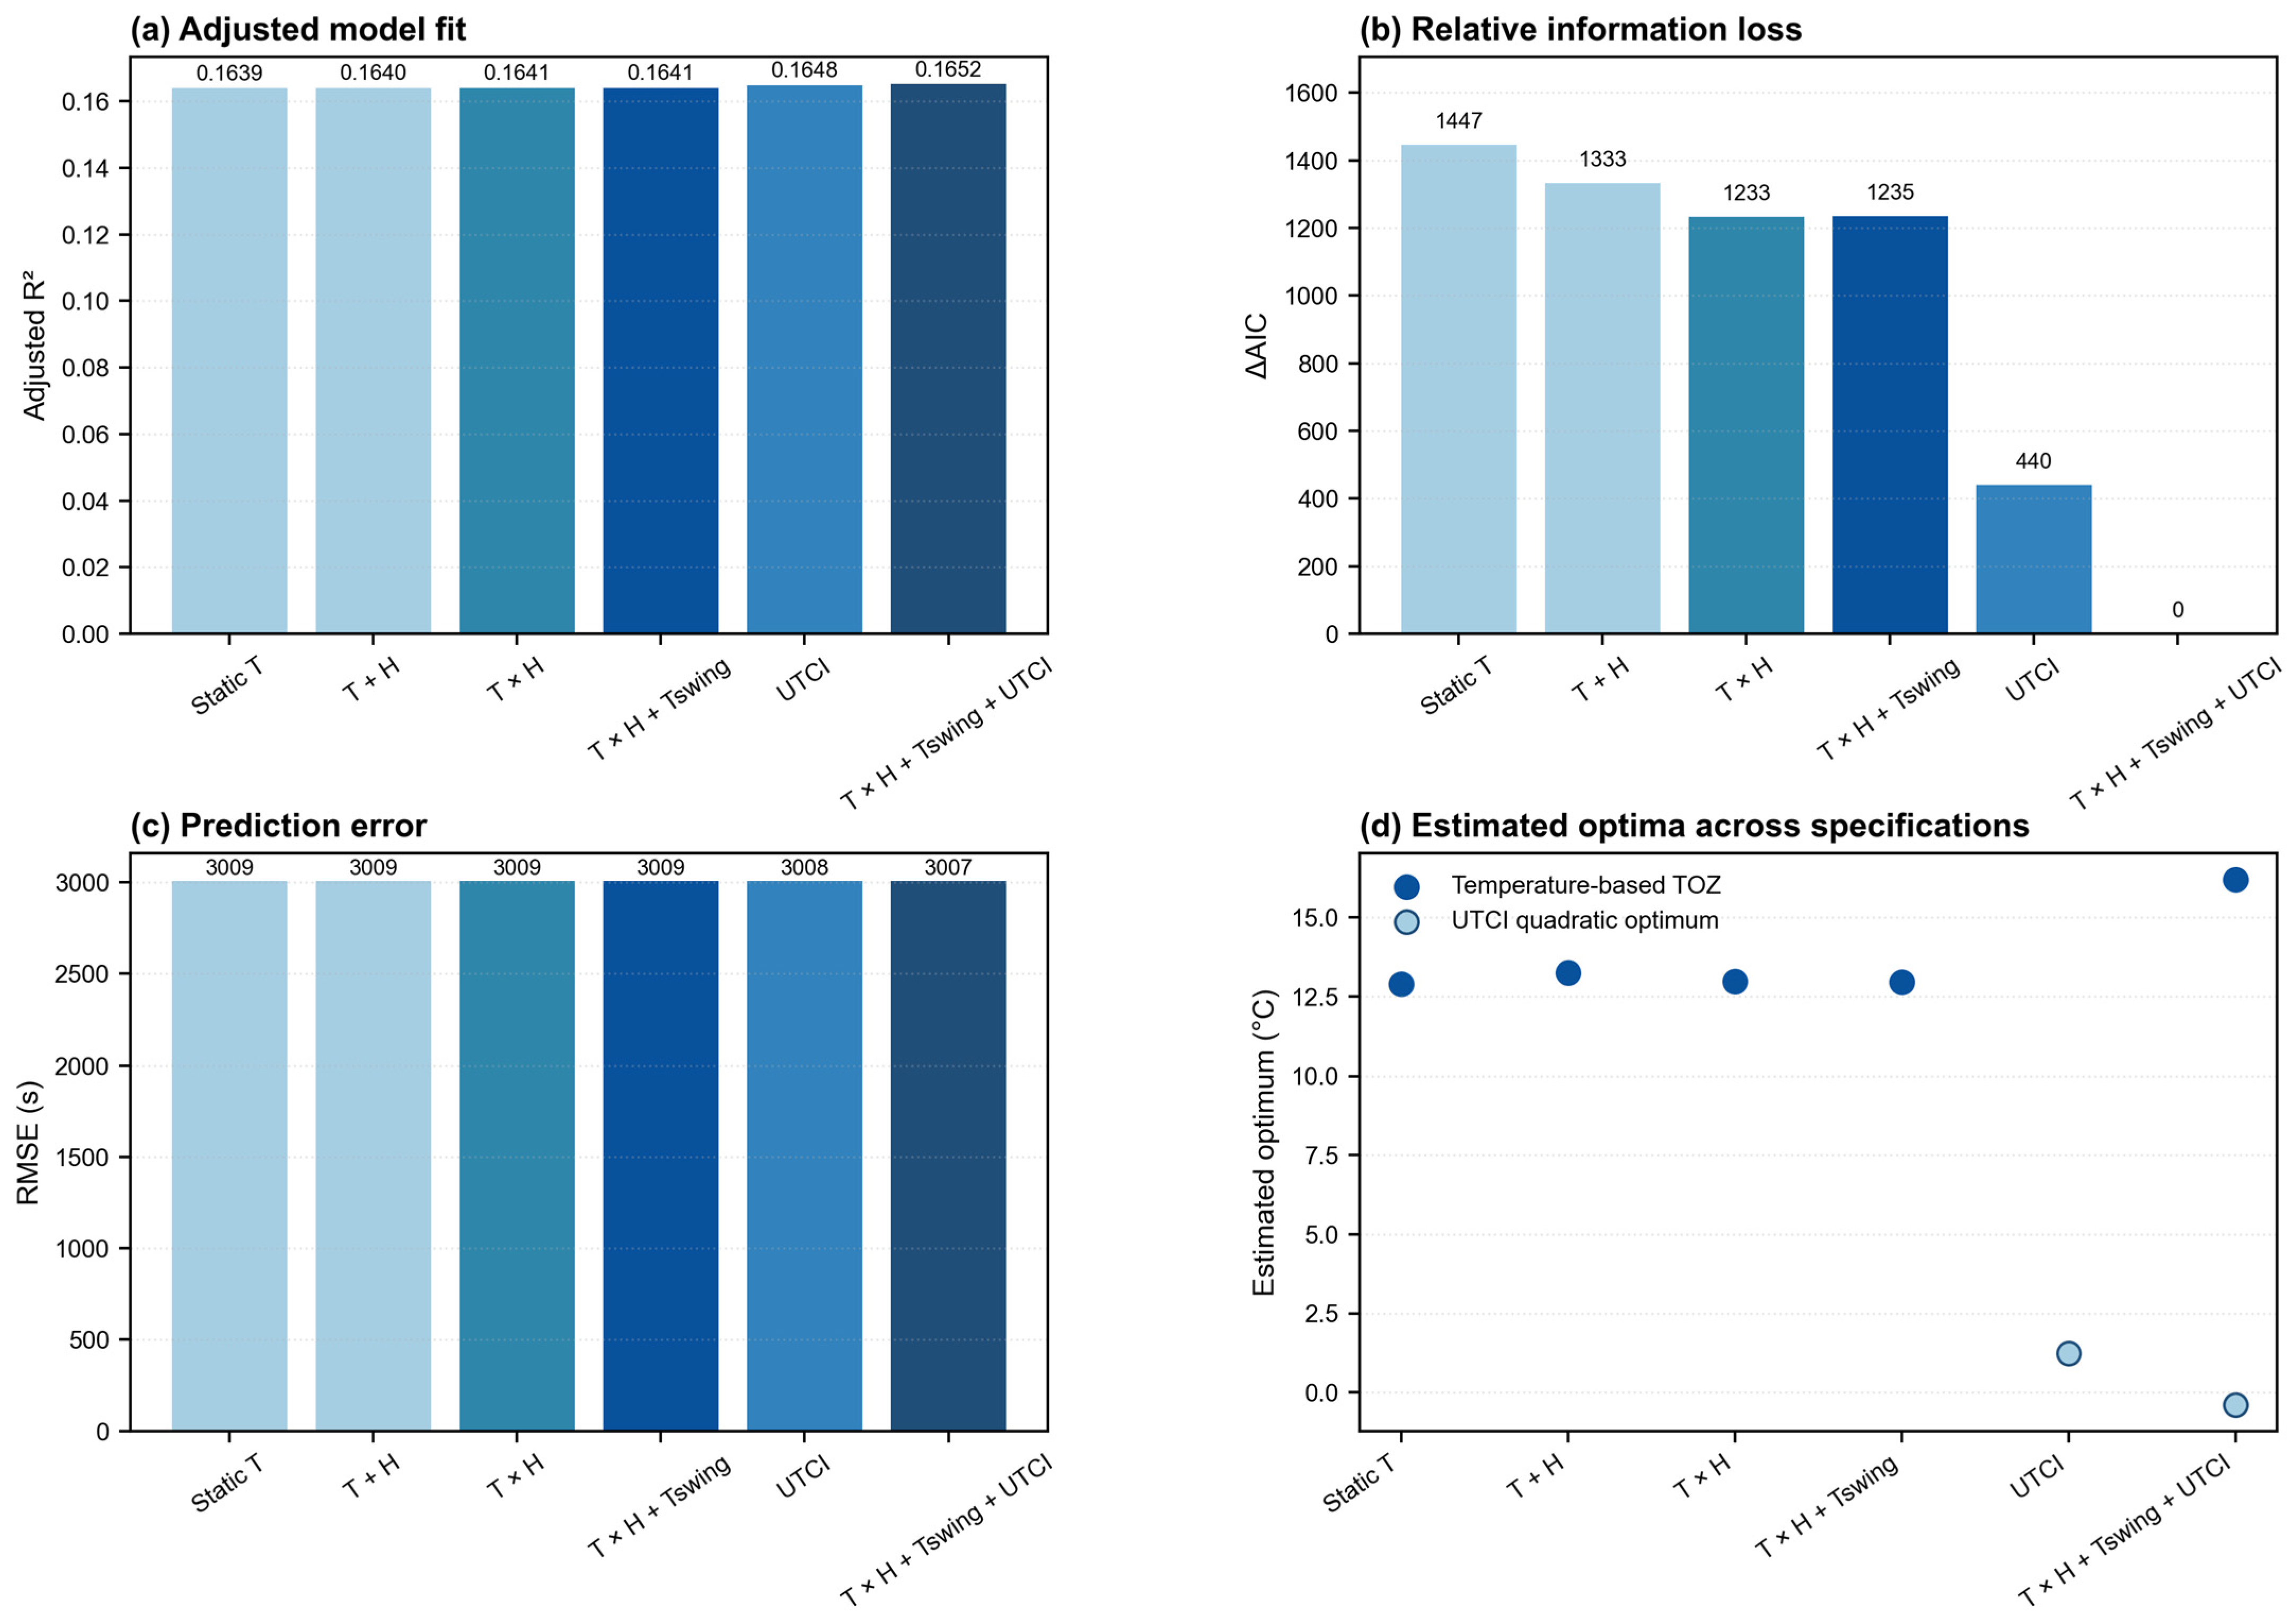
To evaluate the robustness of the main air temperature–humidity framework and to address the role of non-stationary exposure terms, we compared six nested and benchmark specifications (Figure 8). These models progressively introduced the race-day maximum air temperature, the relative humidity, the temperature–humidity interaction, the intra-day temperature swings ( T s w i n g ) , and the UTCI-based biometeorological exposure. Although direct course-level measurements of mean radiant temperature, solar radiation, and air velocity were unavailable, the UTCI-based benchmark was included to provide a complementary representation of integrated outdoor thermal exposure beyond air temperature and humidity alone. We did not treat WBGT as a gold-standard comparator because direct globe-temperature measurements using standard-compliant instrumentation were unavailable. ISO 7243 defines WBGT as an index based on the thermal environment to which an individual is exposed and relies on appropriate measurement of its component variables [22]. Previous methodological studies have emphasized uncertainties in indirect WBGT estimation from standard meteorological variables and in the use of non-standard globe thermometers, particularly under strong radiative loads [23]. Therefore, indirectly derived WBGT values may introduce additional uncertainty in retrospective outdoor studies.
The baseline static air temperature model ( T + T 2 ) explained a substantial share of finish-time variation after demographic controls and fixed effects ( R 2 = 0.1639 ,   R M S E = 3009.43   s ) . Adding relative humidity slightly improved the model fit (R2 = 0.1640), while the temperature–humidity interaction further improved the specification ( R 2 = 0.1641 ,   R M S E = 3009.10   s ) . The resulting TOZ estimates remained stable across the air temperature-based models, ranging from 12.9   ° C in the static air temperature model to 13.0   ° C in the interaction model.
The inclusion of T s w i n g as a non-stationary exposure proxy produced almost no additional improvement when added to the temperature–humidity interaction model ( R 2 = 0.1641 , R M S E = 3009.09   s ) . In this specification, T s w i n g was not statistically significant ( β = 0.97 ,   p = 0.326 ) , suggesting that intra-day temperature swings alone did not independently explain finish-time variation after accounting for the race-day maximum air temperature, humidity, their interaction, demographic controls, and fixed effects. This supports the interpretation of T s w i n g as a validation-oriented exposure proxy rather than a dominant standalone predictor.
The UTCI benchmark model modestly improved the model calibration ( R 2 = 0.1648 , R M S E = 3007.87   s ) , indicating that integrated biometeorological exposure captured some additional environmental information beyond the air temperature-only representation. However, the estimated UTCI quadratic optimum was very low ( 1.2   ° C ) , and shifted further to 0.4   ° C in the combined model. This instability supports the decision not to use the UTCI as the primary basis for defining a marathon-specific TOZ. Instead, the UTCI was treated as a complementary biometeorological benchmark because it does not explicitly represent running-specific metabolic heat production, hydration status, pacing strategy, or individual thermoregulatory adaptation.
The combined specification including the temperature–humidity interaction, T s w i n g , and the UTCI achieved the best overall calibration among the tested models ( R 2 = 0.1652 ,   R M S E = 3007.17   s ,   Δ A I C = 0 ) . In this model, the temperature–humidity interaction remained positive and statistically significant ( β = 0.481 , p < 0.001 ) , while T s w i n g became statistically significant ( β = 10.57 ,   p < 0.001 ) . Nevertheless, because the sign of T s w i n g was negative and its interpretation changed after introducing the UTCI, this term should be interpreted cautiously as an indicator of non-stationary exposure structure rather than direct evidence that intra-day warming independently worsens performance.
In the HC3-based combined specification, the temperature–humidity interaction remained positive and statistically significant ( β = 0.481 ,   p < 0.001 ) , while ( T s w i n g ) became statistically significant ( β = 10.57 ,   p < 0.001 ) . Nevertheless, because the sign of ( T s w i n g ) was negative and its interpretation changed after introducing the UTCI, this term should be interpreted cautiously as an indicator of non-stationary exposure structure rather than direct evidence that intra-day warming independently worsens performance. As an additional sensitivity analysis addressing shared race-year exposure, we re-estimated the main specification using race-year clustered standard errors and race-year aggregated models. The nonlinear air temperature pattern remained directionally stable, and the quadratic air temperature term remained positive and statistically significant in the clustered model and in both weighted and unweighted race-year aggregate models. However, the temperature–humidity interaction, although positive in direction, was no longer statistically significant under race-year clustered inference and was imprecisely estimated in the aggregate models. These results suggest that the nonlinear air temperature response is the most robust component of the empirical framework, whereas humidity-dependent interaction patterns should be interpreted more cautiously.
Overall, the validation analysis supports three conclusions. First, the nonlinear air temperature response is the most stable component across specifications and sensitivity analyses. Second, the UTCI improves model calibration modestly but produces unstable optimum estimates, confirming its role as a complementary benchmark rather than a replacement for the main air temperature–humidity framework. Third, non-stationary exposure terms and humidity-dependent interaction patterns provide useful validation context, but their coefficients should not be overinterpreted as direct physiological effects.

4. Discussion

4.1. Biophysical Interpretation of Nonlinear Thermal Responses

The present study identified a nonlinear association between the race-day maximum air temperature and marathon finish time, with an estimated thermal optimal zone (TOZ) of approximately 13.0 °C under the sample mean humidity level (77.7%). This value should be interpreted as an empirical performance-minimizing air temperature within the observed race environment rather than as a fixed physiological threshold. The humidity-dependent formulation further showed that the estimated TOZ shifted downward as relative humidity increased, suggesting that favorable marathon conditions depend jointly on air temperature and moisture conditions [24].
This nonlinear pattern is consistent with the basic principles of human heat exchange during endurance exercise. Marathon running generates substantial metabolic heat, and performance is partly constrained by the body’s ability to dissipate this heat to the environment [25]. Under cool-to-moderate conditions, dry heat exchange and evaporative cooling can help maintain thermal balance. As air temperature rises, however, dry heat loss becomes less effective, increasing reliance on sweat evaporation [26].
The positive T × H interaction in the main specification suggests that evaporative cooling constraints may contribute to humidity-dependent performance penalties, although this interaction should be interpreted cautiously because it was less precise in race-year-level sensitivity analyses. Humidity did not appear to act as a uniform additive penalty; instead, its estimated effect became stronger at higher air temperatures. At 28.0 °C, each 10-percentage-point increase in relative humidity was associated with an additional predicted finish-time penalty of approximately 77.1 s in the main model. This pattern is consistent with the interpretation that humid heat may be unfavorable for marathon performance because high moisture levels reduce the vapor pressure gradient and limit evaporative heat loss [27,28,29].
The stratified analyses suggest that thermal vulnerability differs across runner groups. Mass participation runners showed larger predicted penalties than elite runners under high air temperature conditions, particularly at 24.0 °C and 28.0 °C. Models stratified by age and sex further showed that male runners, especially those aged 35–49 years, had higher estimated thermal sensitivity at 28.0 °C. These subgroup differences may reflect variations in exposure duration, pacing, body size, metabolic heat production, or training status, although these mechanisms cannot be directly verified with the available observational data [30,31,32].
The validation analysis also clarifies the role of the UTCI. The UTCI modestly improved model calibration, suggesting that integrated biometeorological indices can capture additional environmental information beyond air temperature alone. However, the UTCI-derived optimum was unstable and unrealistically low in the quadratic benchmark models. Therefore, the UTCI is better treated as a complementary exposure benchmark rather than as the primary basis for defining the marathon TOZ, especially because standard thermal indices do not fully account for running-specific metabolic heat production, hydration status, pacing behavior, and individual adaptation [33].
Finally, T s w i n g provided useful non-stationary validation context but was not a dominant standalone predictor in the main model. Overall, the findings suggest that marathon heat-related performance loss is best understood as the joint result of nonlinear air temperature effects, humidity-dependent evaporative constraints, and subgroup-specific vulnerability, rather than the effect of a single meteorological variable.

4.2. Population Heterogeneity in Thermal Vulnerability

The stratified analyses showed that thermal vulnerability varied across performance level, age, and sex. Elite runners exhibited a lower estimated TOZ (9.0 °C) than mass participation runners (13.0 °C), suggesting that performance level modifies the air temperature range associated with the minimum predicted finish-time penalties. This difference may partly reflect variation in running intensity, metabolic heat production, exposure duration, and pacing behavior. Faster runners generate higher rates of metabolic heat production but spend less time on the course, whereas slower runners experience longer exposure to race-day thermal conditions [34,35].
At high air temperatures, mass participation runners showed larger predicted penalties than elite runners. At 28.0 °C, the predicted penalty was approximately 697.9 s for mass runners compared with 382.3 s for elite runners. This pattern suggests that slower runners may be more vulnerable under warm conditions, likely because prolonged race duration increases cumulative exposure to heat stress. However, this interpretation should remain cautious because the available dataset does not directly measure hydration behavior, pacing strategy, acclimatization, or individual physiological capacity.
Models stratified by age and sex further indicated that thermal sensitivity was not distributed uniformly across demographic groups. Male runners generally showed higher TVI values than female runners at 28.0 °C, with the highest estimated sensitivity observed among males aged 35–49 years (114.6 s/°C). Female runners showed lower TVI values across all age groups, ranging from 64.9 to 81.3 s/°C. These subgroup differences may reflect a combination of physiological, behavioral, and performance-related factors, including body size, running speed, metabolic heat production, and pacing decisions [36,37].
Although previous physiological studies have linked aging to reduced sweating capacity, altered cutaneous blood flow, and diminished thermoregulatory reserve [38], our results do not support a simple monotonic “aging penalty” across all groups. Instead, the age pattern differed by sex and performance context. Therefore, subgroup differences in this study should be interpreted as empirical heterogeneity in air temperature–performance associations rather than direct evidence of specific physiological mechanisms.

4.3. Behavioral Adaptations and Methodological Implications

Methodologically, the validation analysis supports the use of a nonlinear air temperature–humidity framework for a retrospective marathon heat-risk assessment. The nonlinear air temperature response was the most stable component across model specifications and race-year-level sensitivity analyses. The T × H interaction remained positive in direction, but was less precise under conservative race-year-level inferences. Therefore, the humidity-dependent response surfaces should be interpreted as model-based exploratory evidence rather than definitive inferential thresholds.
The comparison with the UTCI provides an important methodological clarification. The UTCI modestly improved model calibration, but the UTCI-derived optimum was unstable and unrealistically low in the quadratic benchmark models. This finding supports the use of the UTCI as a complementary biometeorological benchmark rather than as the primary basis for defining a marathon-specific TOZ. Standard heat stress indices are valuable for characterizing the outdoor thermal environments, but their direct application to marathon performance requires caution because they do not fully incorporate running-specific metabolic heat production, hydration status, pacing behavior, and individual adaptation [39,40].
The non-stationary exposure proxy T s w i n g also provides a useful validation context. In the main interaction model, T s w i n g did not independently explain finish-time variation, whereas it became significant only in the combined specification that also included the UTCI. This model dependence suggests that T s w i n g may capture part of the broader race-day exposure structure, but it should not be interpreted as direct evidence that intra-day warming alone worsens performance. This distinction is important for avoiding an overinterpretation of proxy-based non-stationary terms.
For race organizers, the results suggest that heat-risk management should consider the combined effects of air temperature and humidity rather than relying on a single temperature cutoff. The model-based exploratory risk matrix showed that the predicted penalties increased under warm and humid conditions; for example, 28.0 °C combined with 80% relative humidity was associated with a predicted penalty of approximately 737.5 s. These estimates should be interpreted as empirical risk references rather than universal physiological thresholds. In practical terms, event scheduling, start-time decisions, hydration planning, cooling resources, and medical preparedness should account for both expected maximum air temperature and humidity, especially for slower and more vulnerable runner groups [41,42,43].

5. Conclusions

This study examined the nonlinear relationship between race-day thermal exposure and marathon performance using a large-scale dataset of mass participation runners across 18 U.S. marathon events from 2011 to 2019. The results identified a humidity-dependent thermal optimal zone (TOZ), with the estimated optimum at approximately 13.0 °C based on the race-day maximum air temperature under the sample mean humidity level (77.7%). Rather than representing a universal physiological threshold, this TOZ should be interpreted as an empirical performance-minimizing air temperature within the observed race environment.
The findings show that marathon performance is shaped by the joint effects of air temperature and humidity. In the main specification, the positive T × H interaction suggested that humidity-related penalties may become stronger as the race-day maximum air temperature rises, although race-year-level sensitivity analyses indicated that this interaction should be interpreted cautiously. Under warm and humid conditions, the predicted finish-time penalties increased substantially; for example, 28.0 °C combined with 80% relative humidity was associated with a model-based penalty of approximately 737.5 s. These results suggest that a heat-risk assessment for marathons should consider air temperature and humidity together rather than relying on a single temperature cutoff.
Stratified analyses further showed that thermal vulnerability varied across runner groups. Mass participation runners experienced larger predicted penalties than elite runners at high air temperatures, particularly at 24.0 °C and 28.0 °C. Models stratified by age and sex also revealed heterogeneous responses, with male runners, especially those aged 35–49 years, showing higher estimated thermal sensitivity at 28.0 °C. These patterns highlight the need to consider subgroup-specific vulnerability when designing heat-risk management strategies for mass participation endurance events.
Methodologically, the validation analysis supports the interpretability of the nonlinear air temperature–humidity framework, while indicating that the nonlinear air temperature response is the most robust component across specifications and race-year-level sensitivity analyses. The UTCI modestly improved model calibration, but its estimated optimum was unstable and therefore less suitable as the primary basis for defining a marathon-specific TOZ. Similarly, T s w i n g provided a useful non-stationary validation context but should not be interpreted as a dominant standalone predictor. Overall, the results support using the UTCI and non-stationary exposure terms as complementary validation tools while retaining the air temperature–humidity framework as the primary interpretable empirical structure.
Because this study is based on retrospective race and environmental records, several methodological boundaries should be acknowledged. Mean radiant temperature, globe temperature, solar radiation, and air velocity at runner height were not directly measured along the marathon courses. Radiative and wind-related effects were incorporated indirectly through the ERA5-HEAT UTCI benchmark. Therefore, the main air temperature–humidity framework should be interpreted as an empirical performance model based on the available historical meteorological variables rather than as a complete human heat-balance model.
Although this study is based on historical race data, its implications are increasingly relevant under climate warming. As thermal exposure intensifies, race organizers should adopt evidence-based mitigation strategies that jointly consider the race-day maximum air temperature, humidity, event timing, hydration and cooling resources, medical preparedness, and the vulnerability of slower or demographically sensitive runner groups. Future research should further integrate course-level sensors, direct MRT or globe-temperature measurements, high-resolution radiation and wind data, pacing records, individual physiological measurements, and projected climate scenarios to improve heat-risk prediction and to support the long-term sustainability of mass participation endurance sports [44].

Author Contributions

Conceptualization, L.Y. and C.Z.; methodology, L.Y.; software, L.Y.; validation, L.Y. and C.Z.; formal analysis, L.Y.; investigation, L.Y.; resources, C.Z.; data curation, L.Y.; writing—original draft preparation, L.Y.; writing—review and editing, C.Z.; visualization, L.Y.; supervision, C.Z.; project administration, C.Z.; funding acquisition, C.Z. All authors have read and agreed to the published version of the manuscript.

Funding

This research received no external funding. The APC was funded by the authors.

Informed Consent Statement

Not applicable.

Data Availability Statement

The original contributions presented in this study are included in the article. Further inquiries can be directed to the corresponding author.

Acknowledgments

Declaration of generative AI and AI-assisted technologies in the writing process: during the preparation of this work, the authors used ChatGPT 5.4 in order to improve their language use. After using this tool, the authors reviewed and edited the content as needed, and take full responsibility for the content of the publication.

Conflicts of Interest

The authors declare no conflicts of interest.

Appendix A

Table A1. Cohort-specific coefficients used to calculate the Thermal Vulnerability Index.
Group TypeCohortN β T ( S E ) β T 2 (SE) β T × H (SE)TOZ at Mean Humidity (°C)TVI at 28 °C (s/°C)
Performance groupElite48,313−37.860 (3.891)1.060 (0.072)0.241 (0.037)940.3
Performance groupMass919,565−121.113 (4.742)3.093 (0.100)0.525 (0.047)1392.9
Age–sex cohortMale 18–34182,187−98.377 (11.607)2.632 (0.238)0.506 (0.114)11.288.4
Age–sex cohortMale 35–49238,445−128.361 (9.781)3.738 (0.205)0.433 (0.096)12.7114.6
Age–sex cohortMale ≥50114,028−99.662 (13.597)3.176 (0.290)0.176 (0.135)13.591.8
Age–sex cohortFemale 18–34195,782−93.633 (10.901)2.108 (0.226)0.521 (0.108)12.664.9
Age–sex cohortFemale 35–49184,282−136.055 (10.966)2.962 (0.237)0.663 (0.110)14.381.3
Age–sex cohortFemale ≥5053,154−83.366 (20.163)2.385 (0.431)0.235 (0.201)13.768.4
Table A2. Sensitivity analyses accounting for shared race-year environmental exposure.
ModelVariableCoefficientSEp Value95% CI Lower95% CI Upper
Individual TWFE with race-year clustered SERace-day Maximum Air Temperature−114.54938.1010.003−189.226−39.872
Individual TWFE with race-year clustered SERace-day Maximum Air Temperature Squared2.9790.71<0.0011.5884.369
Individual TWFE with race-year clustered SERelative Humidity−5.7686.6950.389−18.8917.354
Individual TWFE with race-year clustered SETemperature × Humidity0.4810.3710.194−0.2451.208
Individual TWFE with race-year clustered SETemperature Swing−0.9668.3520.908−17.33615.404
Weighted race-year aggregate modelRace-day Maximum Air Temperature−108.88271.1780.126−248.38830.624
Weighted race-year aggregate modelRace-day Maximum Air Temperature Squared2.9151.3810.0350.2075.622
Weighted race-year aggregate modelRelative Humidity−5.40813.1630.681−31.20720.392
Weighted race-year aggregate modelTemperature × Humidity0.4320.7550.567−1.0471.911
Weighted race-year aggregate modelTemperature Swing−2.03315.6890.897−32.78328.716
Unweighted race-year aggregate modelRace-day Maximum Air Temperature−54.50936.3960.134−125.84416.827
Unweighted race-year aggregate modelRace-day Maximum Air Temperature Squared2.2870.641<0.0011.033.543
Unweighted race-year aggregate modelRelative Humidity−0.6777.1220.924−14.63713.283
Unweighted race-year aggregate modelTemperature × Humidity0.1090.5090.831−0.891.107
Unweighted race-year aggregate modelTemperature Swing−14.8768.6130.084−31.7562.004

References

  1. Wang, S.; Gao, M.; Xiao, X.; Jiang, X.; Luo, J. Wasted efforts of elite Marathon runners under a warming climate primarily due to atmospheric oxygen reduction. npj Clim. Atmos. Sci. 2024, 7, 97. [Google Scholar] [CrossRef]
  2. Coris, E.E.; Ramirez, A.M.; Van Durme, D.J. Heat illness in athletes: The dangerous combination of heat, humidity and exercise. Sports Med. 2004, 34, 9–16. [Google Scholar] [CrossRef]
  3. Armstrong, L.E.; Casa, D.J.; Millard-Stafford, M.; Moran, D.S.; Pyne, S.W.; Roberts, W.O. Exertional heat illness during training and competition. Med. Sci. Sports Exerc. 2007, 39, 556–572. [Google Scholar] [CrossRef]
  4. Tyler, C.J.; Reeve, T.; Hodges, G.J.; Cheung, S.S. The effects of heat adaptation on physiology, perception and exercise performance in the heat: A meta-analysis. Sports Med. 2016, 46, 1699–1724. [Google Scholar] [CrossRef]
  5. Périard, J.D.; Racinais, S.; Sawka, M.N. Adaptations and mechanisms of human heat acclimation: Applications for competitive athletes and sports. Scand. J. Med. Sci. Sports 2015, 25, 20–38. [Google Scholar] [CrossRef]
  6. Arcelli, E.; Molteni, G. Heat balance in marathon running. Med. Lav. 1976, 67, 183–195. [Google Scholar] [PubMed]
  7. Mantzios, K.; Ioannou, L.G.; Panagiotaki, Z.; Ziaka, S.; Périard, J.D.; Racinais, S.; Nybo, L.; Flouris, A.D. Effects of Weather Parameters on Endurance Running Performance: Discipline-specific Analysis of 1258 Races. Med. Sci. Sports Exerc. 2022, 54, 153–161. [Google Scholar] [CrossRef]
  8. Ren, Z.; Zuo, Y.; Ma, Y.; Zhang, M.; Smith, L.; Yang, L.; Loprinzi, P.D.; Yu, Q.; Zou, L. The Natural Environmental Factors Influencing the Spatial Distribution of Marathon Event: A Case Study from China. Int. J. Environ. Res. Public Health 2020, 17, 2238. [Google Scholar] [CrossRef]
  9. Che Muhamed, A.M.; Atkins, K.; Stannard, S.R.; Mündel, T.; Thompson, M.W. The effects of a systematic increase in relative humidity on thermoregulatory and circulatory responses during prolonged running exercise in the heat. Temperature 2016, 3, 455–464. [Google Scholar] [CrossRef]
  10. Maffetone, P.B.; Malcata, R.; Rivera, I.; Laursen, P.B. The Boston marathon versus the world marathon majors. PLoS ONE 2017, 12, e0184024. [Google Scholar] [CrossRef]
  11. Knechtle, B.; McGrath, C.; Goncerz, O.; Villiger, E.; Nikolaidis, P.T.; Marcin, T.; Sousa, C.V. The role of environmental conditions on master marathon running performance in 1,280,557 finishers the ‘New York City marathon’ from 1970 to 2019. Front. Physiol. 2021, 12, 665761. [Google Scholar] [CrossRef] [PubMed]
  12. Nikolaidis, P.T.; Di Gangi, S.; Chtourou, H.; Rüst, C.A.; Rosemann, T.; Knechtle, B. The role of environmental conditions on marathon running performance in men competing in Boston marathon from 1897 to 2018. Int. J. Environ. Res. Public Health 2019, 16, 614. [Google Scholar] [CrossRef]
  13. El Helou, N.; Tafflet, M.; Berthelot, G.; Tolaini, J.; Marc, A.; Guillaume, M.; Hausswirth, C.; Toussaint, J.F. Impact of environmental parameters on marathon running performance. PLoS ONE 2012, 7, e37407. [Google Scholar] [CrossRef]
  14. Knechtle, B.; Di Gangi, S.; Rüst, C.A.; Villiger, E.; Rosemann, T.; Nikolaidis, P.T. The role of weather conditions on running performance in the Boston Marathon from 1972 to 2018. PLoS ONE 2019, 14, e0212797. [Google Scholar] [CrossRef]
  15. Vanos, J.K.; Kosaka, E.; Iida, A.; Yokohari, M.; Middel, A.; Scott-Fleming, I.; Brown, R.D. Planning for spectator thermal comfort and health in the face of extreme heat: The Tokyo 2020 Olympic marathons. Sci. Total Environ. 2019, 657, 904–917. [Google Scholar] [CrossRef]
  16. Kosaka, E.; Iida, A.; Vanos, J.; Middel, A.; Yokohari, M.; Brown, R. Microclimate Variation and Estimated Heat Stress of Runners in the 2020 Tokyo Olympic Marathon. Atmosphere 2018, 9, 192. [Google Scholar] [CrossRef]
  17. Zhang, S.; Meng, G.; Wang, Y.; Li, J. Study of the relationships between weather conditions and the marathon race, and of meteorotropic effects on distance runners. Int. J. Biometeorol. 1992, 36, 63–68. [Google Scholar] [CrossRef] [PubMed]
  18. Weiss, K.; Valero, D.; Villiger, E.; Scheer, V.; Thuany, M.; Aidar, F.J.; de Souza, R.F.; Cuk, I.; Nikolaidis, P.T.; Rosemann, T.; et al. Associations between environmental factors and running performance: An observational study of the Berlin Marathon. PLoS ONE 2024, 19, e0312097. [Google Scholar] [CrossRef]
  19. Gasparetto, T.; Nesseler, C. Diverse Effects of Thermal Conditions on Performance of Marathon Runners. Front. Psychol. 2020, 11, 1438. [Google Scholar] [CrossRef] [PubMed]
  20. Di Napoli, C.; Barnard, C.; Prudhomme, C.; Cloke, H.L.; Pappenberger, F. ERA5-HEAT: A global gridded historical dataset of human thermal comfort indices from climate reanalysis. Geosci. Data J. 2021, 8, 2–10. [Google Scholar] [CrossRef]
  21. Jian, H.; Yan, Z.; Fan, X.; Zhan, Q.; Xu, C.; Bei, W.; Xu, J.; Huang, M.; Du, X.; Zhu, J.; et al. A high temporal resolution global gridded dataset of heat stress indicators for outdoor thermal comfort and human health. Sci. Data 2024, 11, 1051. [Google Scholar] [CrossRef]
  22. ISO 7243:2017; Ergonomics of the Thermal Environment—Assessment of Heat Stress Using the WBGT (Wet Bulb Globe Temperature) Index. International Organization for Standardization (ISO): Geneva, Switzerland, 2017.
  23. d’Ambrosio Alfano, F.R.; Dell’Isola, M.; Ficco, G.; Palella, B.I.; Riccio, G. Small globes and pocket heat stress meters for WBGT and PHS evaluations: A critical analysis under controlled conditions. Build. Environ. 2022, 226, 109781. [Google Scholar] [CrossRef]
  24. Cramer, M.N.; Gagnon, D.; Laitano, O.; Crandall, C.G. Human temperature regulation under heat stress in health, disease, and injury. Physiol. Rev. 2022, 102, 1907–1989. [Google Scholar] [CrossRef]
  25. Ji, T.; Zhang, Y.; Ouyang, W.; Cao, L.; Tian, X. Hypothermia risk assessment for a mountain marathon in extreme weather using a simplified thermoregulation model. Int. J. Therm. Sci. 2026, 221, 110471. [Google Scholar] [CrossRef]
  26. Travers, G.; Kippelen, P.; Trangmar, S.J.; González-Alonso, J. Physiological Function during Exercise and Environmental Stress in Humans—An Integrative View of Body Systems and Homeostasis. Cells 2022, 11, 383. [Google Scholar] [CrossRef]
  27. Cheung, S.S.; Ainslie, P.N. Advanced Environmental Exercise Physiology; Human Kinetics: Champaign, IL, USA, 2022. [Google Scholar]
  28. Tan, G.C.W.; Zheng, K.; Cheong, W.K.; Byrne, C.; Iversen, J.N.; Lee, J.K.W. Small changes in thermal conditions hinder marathon running performance in the tropics. Temperature 2022, 9, 373–388. [Google Scholar] [CrossRef]
  29. Longman, D.P.; Murray, A.M.; Roberts, R.; Oakley, S.; Wells, J.C.; Stock, J.T. Ultra-endurance athletic performance suggests that energetics drive human morphological thermal adaptation. Evol. Hum. Sci. 2019, 1, e16. [Google Scholar] [CrossRef] [PubMed]
  30. McGuirk, E.; Snyder, E.; Betker, M.; Rourk, Z.; Uithoven, K.; Lee, E.; Lundstrom, C. The relationship between climatic condition, sex, and degree of slowing in the marathon. Sci. Sports 2023, 38, 616–623. [Google Scholar] [CrossRef]
  31. Périard, J.D.; Eijsvogels, T.M.H.; Daanen, H.A.M. Exercise under heat stress: Thermoregulation, hydration, performance implications, and mitigation strategies. Physiol. Rev. 2021, 101, 1873–1979. [Google Scholar] [CrossRef]
  32. Havenga, H.; Coetzee, B.; Burger, R.P.; Piketh, S.J. Response to Simpson (2024): Standard heat stress indices may not be appropriate for assessing marathons. S. Afr. J. Sci. 2024, 120, 17474. [Google Scholar] [CrossRef] [PubMed]
  33. Costa, J.G.; Locatelli, J.C.; Wigati, K.W.; Criddle, J.L.; Xu, X.; Collis, J.J.; Naylor, L.H.; Haynes, A.; Maloney, S.K.; Carter, H.H.; et al. Sex differences in the thermoregulatory and cardiovascular response to exercise in hot environmental conditions. Am. J. Physiol.-Regul. Integr. Comp. Physiol. 2025, 329, R651–R660. [Google Scholar] [CrossRef]
  34. Wickham, K.A.; Wallace, P.J.; Cheung, S.S. Sex differences in the physiological adaptations to heat acclimation: A state-of-the-art review. Eur. J. Appl. Physiol. 2021, 121, 353–367. [Google Scholar] [CrossRef]
  35. Yanovich, R.; Ketko, I.; Charkoudian, N. Sex differences in human thermoregulation: Relevance for 2020 and beyond. Physiology 2020, 35, 177–184. [Google Scholar] [CrossRef]
  36. Besson, T.; Macchi, R.; Rossi, J.; Morio, C.Y.M.; Kunimasa, Y.; Nicol, C.; Vercruyssen, F.; Millet, G.Y. Sex differences in endurance running. Sports Med. 2022, 52, 1235–1257. [Google Scholar] [CrossRef]
  37. Hodges, G.J.; Mallette, M.M.; Tew, G.A.; Saxton, J.M.; Moss, J.; Ruddock, A.D.; Klonizakis, M. Effect of age on cutaneous vasomotor responses during local skin heating. Microvasc. Res. 2017, 112, 47–52. [Google Scholar] [CrossRef]
  38. Trangmar, S.J.; González-Alonso, J. Heat, Hydration and the Human Brain, Heart and Skeletal Muscles. Sports Med. 2019, 49, 69–85. [Google Scholar] [CrossRef] [PubMed]
  39. Khorram-Manesh, A.; Löf, T.; Börjesson, M.; Nilson, F.; Thorsson, S.; Lindberg, F.; Carlström, E. Profiling Collapsing Half Marathon Runners—Emerging Risk Factors: Results from Gothenburg Half Marathon. Sports 2020, 8, 2. [Google Scholar] [CrossRef] [PubMed]
  40. Grivas, G.V. The physiology and psychology of negative splits: Insights into optimal marathon pacing strategies. Front. Physiol. 2025, 16, 1639816. [Google Scholar] [CrossRef] [PubMed]
  41. Kong, Q.; Huber, M. Explicit calculations of wet-bulb globe temperature compared with approximations and why it matters for labor productivity. Earth’s Future 2022, 10, e2021EF002334. [Google Scholar] [CrossRef]
  42. Seo, Y.; Powell, J.; Strauch, A.; Roberge, R.; Kenny, G.P.; Kim, J.-H. Heat stress assessment during intermittent work under different environmental conditions and clothing combinations of effective wet bulb globe temperature (WBGT). J. Occup. Environ. Hyg. 2019, 16, 467–476. [Google Scholar] [CrossRef]
  43. Racinais, S.; Hosokawa, Y.; Akama, T.; Bermon, S.; Bigard, X.; Casa, D.J.; Grundstein, A.; Jay, O.; Massey, A.; Migliorini, S.; et al. IOC consensus statement on recommendations and regulations for sport events in the heat. Br. J. Sports Med. 2023, 57, 8–25. [Google Scholar] [CrossRef]
  44. Oyama, T.; Takakura, J.; Fujii, M.; Nakajima, K.; Hijioka, Y. Feasibility of the Olympic marathon under climatic and socioeconomic change. Sci. Rep. 2022, 12, 4010. [Google Scholar] [CrossRef]
Figure 1. Study locations of the 18 marathon events included in the final analytical sample, 2011–2019.
Atmosphere 17 00547 g001
Figure 2. Climatological distribution and thermo-hygrometric characteristics of the marathon race environments.
Atmosphere 17 00547 g002
Figure 3. Exploratory associations between thermal exposure and marathon finish times.
Atmosphere 17 00547 g003
Figure 4. Nonlinear association between race-day maximum air temperature and marathon finish time at the sample mean humidity level. In panel (c), colors indicate different predicted performance-loss thresholds relative to the model-implied optimum.
Atmosphere 17 00547 g004
Figure 5. Model-based thermo-hygrometric performance penalties derived from the temperature–humidity interaction model.
Atmosphere 17 00547 g005
Figure 6. Stratified temperature–performance responses among elite and mass participation runners.
Atmosphere 17 00547 g006
Figure 7. Estimated Thermal Vulnerability Index and high-temperature penalties by age and sex group.
Atmosphere 17 00547 g007
Figure 8. Model calibration and non-stationary validation across alternative thermal exposure specifications.
Atmosphere 17 00547 g008
Table 1. Baseline characteristics of participants and environmental conditions.
CharacteristicOverallMaleFemalep-Value
Total Observations, N (%)967,878534,660433,218
1. Environmental Conditions
    Race-day maximum air temperature (°C)17.4 ± 5.517.4 ± 5.517.4 ± 5.50.011
    Humidity (%)77.7 ± 14.377.5 ± 14.377.8 ± 14.3<0.001
2. Performance Outcomes
    Finish Time (seconds)16,124 [14,026–18,597]15,373 [13,404–17,814]16,975 [14,927–19,425]<0.001
3. Age Groups
    Young (18–34)377,969 (39.1%)182,187 (34.1%)195,782 (45.2%)<0.001
    Middle (35–49)422,727 (43.7%)238,445 (44.6%)184,282 (42.5%)
    Older (>=50)167,182 (17.3%)114,028 (21.3%)53,154 (12.3%)
4. Runner Categories
    Mass (Remaining 95%)919,565 (95.0%)492,489 (92.1%)427,076 (98.6%)<0.001
    Elite (Race-year 5%)48,313 (5.0%)42,171 (7.9%)6142 (1.4%)
Table 2. Core meteorological variables and performance indicators utilized in the marathon analysis.
CategoryVariable NameSymbolUnitSample ValueDescription
1. Primary Thermal PredictorRace-day Maximum Air TemperatureT°C12Daily maximum air temperature reported for each race date; core predictor for estimating the thermal optimal zone (TOZ).
Race-day Maximum air Temperature Squared T 2 °C2144Quadratic term of Race-day Maximum Air Temperature, used to capture the nonlinear association between thermal exposure and marathon performance.
2. Raw Meteorological VariablesRelative HumidityH%58Relative humidity reported for each race date; influences evaporative cooling capacity.
Start-condition air Temperature T s t a r t °C6Air temperature extracted from start-condition descriptions; used to construct the intra-day temperature swing variable.
3. Derived Meteorological IndicesTemperature Swing T s w i n g °C6Proxy for intra-day non-stationary air temperature exposure during the race window, calculated as the race-day maximum air temperature minus the start-condition air temperature.
Temperature–Humidity Interaction T × H 696Interaction term used to evaluate whether temperature-related performance penalties vary across humidity levels.
Universal Thermal Climate IndexUTCI°C14.1Integrated human-biometeorological index derived from ERA5-HEAT, approximating integrated outdoor thermal exposure at local noontime; used as a complementary biometeorological benchmark rather than for a primary TOZ estimation.
UTCI SquaredUTCI2°C2198.8Quadratic term of the UTCI, used to test nonlinear associations between integrated thermal exposure and performance in supplementary models.
4. Performance OutcomesFinish TimeFinishs16,494Total elapsed time from start to finish, expressed in seconds.
Winsorized Finish Time F i n i s h w s16,470Finish time after 1% Winsorization; used in robustness or regression specifications to reduce the influence of extreme outliers.
Standardized Performance Z p e r f 0.45Finish time standardized relative to the race-year cohort; used to classify elite and mass participation runners.
5. Demographic Control VariablesChronological AgeAgeyears38Participant age; included as a demographic control.
Centered Age A g e c years−1.5Age centered around the sample mean; used to improve interpretability of the age–performance association.
Centered Age Squared A g e c 2 years22.25Quadratic term of centered age, used to capture nonlinear age–performance associations.
Biological SexSexcategoryMBinary indicator for biological sex (Female = 1, Male = 0).
Table 3. Two-way fixed effects model of nonlinear thermal exposure and marathon finish time.
VariableCoefficientHC3 SEt Valuep Value95% CI Lower95% CI Upper
Intercept15,974.99780.36198.792<0.00115,817.49416,132.501
Race-day Maximum Air Temperature−114.5494.844−23.649<0.001−124.042−105.055
Race-day Maximum Air Temperature Squared2.9790.10229.198<0.0012.7793.179
Relative Humidity−5.7680.933−6.18<0.001−7.597−3.939
Temperature × Humidity0.4810.04810.056<0.0010.3870.575
Temperature Swing−0.9660.983−0.9820.326−2.8930.961
Centered Age39.5870.302131.077<0.00138.99540.178
Centered Age Squared1.9380.02191.171<0.0011.8971.98
Is_Female1677.7596.233269.159<0.0011665.5421689.976
N = 967,878; R 2 = 0.1641 ; adjusted R 2 = 0.1641 ; RMSE = 3009.09 s. Race and year fixed effects were included. HC3 robust standard errors are reported in the main specification. Sensitivity analyses using race-year clustered standard errors and race-year aggregated models are reported in Appendix A Table A2.
Disclaimer/Publisher’s Note: The statements, opinions and data contained in all publications are solely those of the individual author(s) and contributor(s) and not of MDPI and/or the editor(s). MDPI and/or the editor(s) disclaim responsibility for any injury to people or property resulting from any ideas, methods, instructions or products referred to in the content.