Article

Quantifying the Synergistic Effects of Environmental Drivers and Irrigation on Evapotranspiration in Shijin Irrigation District Using Projection Pursuit

1
Department of Water Resources, China Institute of Water Resources and Hydropower Research, Beijing 100048, China
2
Key Laboratory of River Basin Digital Twinning of Ministry of Water Resources, Beijing 100048, China
3
Hebei Provincial Water Resources Research and Water Conservancy Technology Experiment and Promotion Center (Hebei Provincial Irrigation Center Experiment Station), Shijiazhuang 050061, China
*
Author to whom correspondence should be addressed.
Atmosphere 2026, 17(6), 540; https://doi.org/10.3390/atmos17060540
Submission received: 22 March 2026 / Revised: 11 May 2026 / Accepted: 20 May 2026 / Published: 24 May 2026
(This article belongs to the Section Biosphere/Hydrosphere/Land–Atmosphere Interactions)

Abstract

Actual evapotranspiration is a primary pathway for crop water consumption in irrigation districts, including the Shijin irrigation district, where understanding the impacts of irrigation is crucial for managing water resources in this large-scale, water-scarce region. However, existing studies on evapotranspiration driving mechanisms often overlook irrigation activities and lack an analysis of synergistic effects among different environmental factors, with such research remaining particularly limited for this area. This study investigates the synergistic impact mechanisms of multiple drivers on evapotranspiration. Using data from 2003 to 2017, a projection pursuit model was employed to quantitatively assess the contributions of meteorological factors, Leaf Area Index, and irrigation to evapotranspiration evolution. The results indicate a significant structural shift in evapotranspiration, and the reduction in soil evaporation plays an important role in driving the variation of total evapotranspiration. Among the various factors, Leaf Area Index and irrigation exhibited the highest contribution rates to evapotranspiration. Furthermore, irrigation primarily acts in synergy with crop growth to enhance evapotranspiration. This study provides critical scientific insights for evidence-based water resource management and policy optimization in the Shijin irrigation district.

1. Introduction

As a fundamental process of water exchange within the soil-plant-atmosphere continuum [1], actual evapotranspiration (AET) is a key driver of ecosystem dynamics, the hydrological cycle, and global change. It plays a critical role in regulating water and energy balances [2]. Consequently, monitoring and simulating AET to characterize its evolutionary patterns are essential for elucidating its influence on hydrological mechanisms and optimizing water resource management.
Conventional AET monitoring techniques, such as lysimetry, eddy covariance, and water balance methods, are predominantly point-based, making them ideal for small-scale observations [3] but difficult to use in large scale regions. The evolution of remote sensing has revolutionized regional scale AET monitoring, fostering the development of various estimation methods [4], ranging from statistical and semi-empirical [5] to physical and numerical models [6]. Consequently, a suite of global AET datasets, such as MOD16, GLDAS, and PML_V2, has been developed [7]. These products offer a solid data foundation for characterizing AET dynamics and informing strategic water resource management.
AET is a comprehensive indicator of actual crop water demand and represents a major channel of water dissipation, which also deeply impacts regional sustainability. Consequently, exploring the evolutionary trends and underlying drivers of AET in irrigation areas are essential for optimizing water allocation. The researchers have done a lot of studies which can provide a wealth of insight into AET dynamics and their drivers. Regarding the AET data source, available methods encompass station-based flux measurements as well as simulations derived from AET and hydrological models. While site scale observations facilitate the analysis of AET variability at hourly, monthly, and growing-season scales, model-derived datasets are instrumental in characterizing AET evolution at regional scales [8].
Existing studies have primarily focused on meteorological elements, land use, topography, vegetation indices, and groundwater levels [9] to conduct driving force analysis. Various methodologies have been proposed to analyze these driving mechanisms, including the water balance method [10], regression analysis [11], Geographical Detector method [12], and Principal Component Analysis method [13]. While these studies provide effective references for revealing AET evolution and its drivers, two aspects require further optimization to support the needs of refined water resource management in irrigation areas. First, irrigation practices are insufficiently considered in the analysis of AET driving mechanisms. Irrigation districts are areas of intense human activity, where irrigation water serves as a crucial source for vegetation water dissipation. Currently, most research concentrates on meteorological and land use conditions. However, Zi et al. [14] demonstrated that in arid regions of China, irrigation significantly impacts surface temperature, AET, vegetation indices, and crop yields. Second, regarding the analysis of AET driving mechanisms, most studies fail to reveal the synergistic interactions among diverse environmental factors under irrigation conditions [15]. This limitation restricts the scientific support for water demand consumption management in irrigation area. Therefore, it is crucial to introduce a more comprehensive attribution analysis method to analyze the underlying drivers of AET.
The projection pursuit model is a robust statistical approach specifically designed for high-dimensional and non-linear data. By seeking the optimal projection direction that best reveals the inherent structural features of the data, this method enables a comprehensive evaluation of multi-dimensional indicators and identifies synergistic or antagonistic effects among environmental factors through the consistency of projection vector signs [16]. While this method has been extensively applied in hydropower impact assessment [17], crop planning optimization [18], and snow water equivalent retrieval [19], its application in analyzing the driving mechanisms of AET within irrigated agricultural systems remains limited. Existing studies have predominantly focused on meteorological variables and land-use changes, often overlooking the direct contribution of human irrigation activities. Although the AET response to irrigation has been explored at the point scale [20], systematic analysis at the large scale is still lacking. Consequently, this study integrates irrigation information into the AET driving factor system and employs the projection pursuit model to quantitatively evaluate the contribution of large-scale irrigation to AET variations, while deciphering the multi-factor synergistic driving mechanisms under irrigated conditions.
The Shijin irrigation district is one of the largest irrigation districts in China, serving as a representative area for the conjunctive use of surface water and groundwater in North China and a vital grain production region. Simultaneously, it is a key region for groundwater over-exploitation mitigation [21]. Therefore, investigating the relationship between irrigation water use and AET, alongside a scientific analysis of their spatiotemporal evolution, is of great significance for the efficient utilization and refined management of water resources. It is hypothesized that the evolution of AET is not determined by a single factor, but driven by the coupled effects of irrigation, climatic variability and vegetation growth, among various other environmental drivers. Taking the Shijin irrigation district as the study area, this research systematically analyzes AET evolution patterns for this region. It conducts a driving force analysis by integrating multiple factors, including meteorological elements, land use conditions, and irrigation practices, while quantifying the specific impact of irrigation on AET variations. Furthermore, various analytical methods are employed to comprehensively identify the dominant factors of AET change from diverse perspectives. This work may provide new insights into the evolution of AET under the influence of irrigation and offer a valuable reference for advancing the refined management of water resources in irrigation districts.

2. Methodology

2.1. Overview of the Study Area

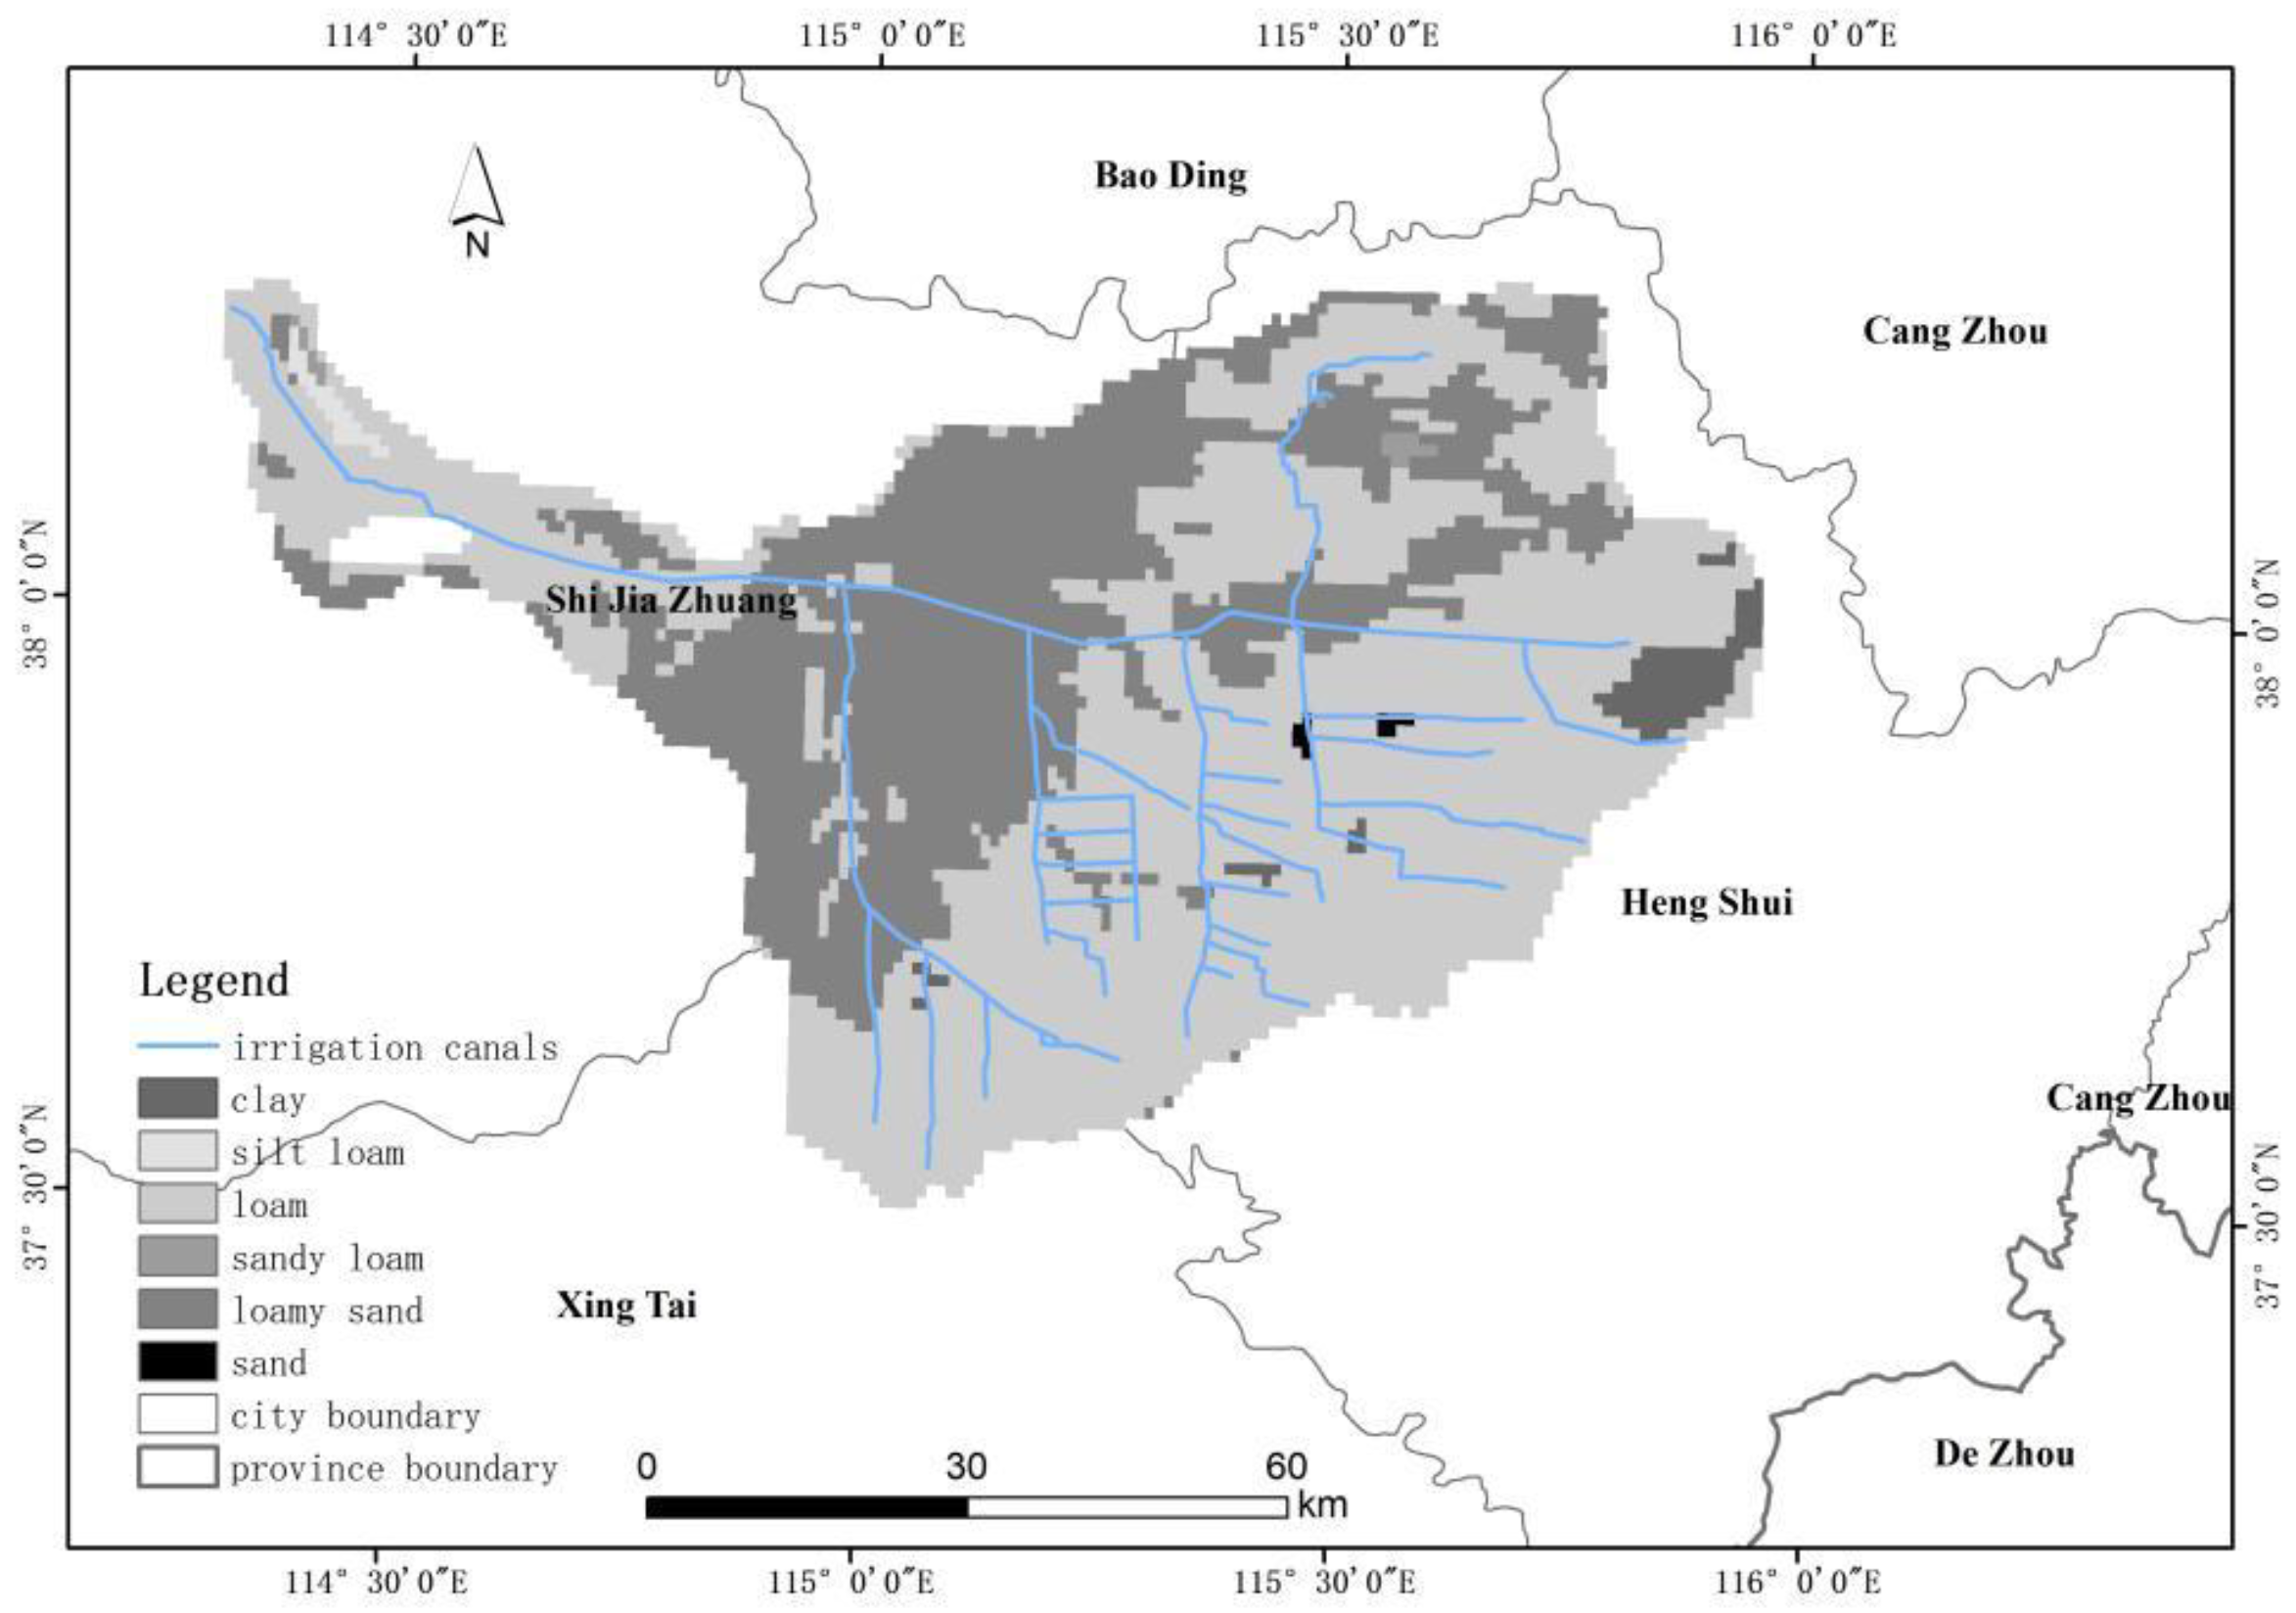
The Shijin irrigation district, which is located in the Haihe River Basin, is situated in the heart of the North China Plain, bordered by the Taihang Mountains to the west. It encompasses a cultivated area of approximately 4 million mu. The district is characterized by a temperate monsoon climate, with a multi-year average temperature of 13 °C and an average annual precipitation of near 500 mm, primarily concentrated in the summer months. The predominant soil types are loam and loamy sand (Figure 1). Irrigation water is primarily sourced from the Gangnan and Huangbizhuang Reservoirs as well as the south-to-north water diversion project, supplemented by groundwater extraction. The major cropping pattern consists of a winter wheat and summer maize rotation. Given the high crop water consumption in the district, irrigation practices are inextricably linked to regional water resource management and the mitigation of groundwater over exploitation. Therefore, analyzing the response relationship between AET and irrigation is of great value.

2.2. Datasets

2.2.1. Irrigation Data

In this study, actual irrigation area data for Shijin irrigation district were utilized to analyze the response differences of AET under varying water supply conditions. The IrriMap-CN irrigation product [22] is used in this study, the data quality of which has been ensured through pixel-level ground sample validation and inter-comparisons with other irrigation products. The data span from 2000 to 2019 with a spatial resolution of 500 m, providing the spatial distribution of the actual irrigated areas on an annual scale. Based on this dataset, the annual irrigation areas for the study area from 2003 to 2017 were clipped and resampled to a spatial resolution of 0.005°. This process was conducted to capture the spatiotemporal evolution of the actual irrigation extent within the district at an annual scale.

2.2.2. AET Data

This study utilizes the PML_V2 AET product [23,24,25,26], which evolved from the remote sensing based Penman-Monteith-Leuning (PML) model. The dataset provides national daily terrestrial AET information from 2000 to 2020 at a spatial resolution of 500 m, encompassing five AET components. Building upon the original PML model, PML_V2 further couples a Gross Primary Productivity calculation module and has been validated using flux tower data, thereby significantly optimizing AET estimation accuracy. In this research, the evapotranspiration was selected and resampled to 0.005° for analysis during the study period from 2003 to 2017. For comparison, MODIS evapotranspiration data (MOD16) for the same period were also incorporated as an alternative data source. The composite data were aggregated to an annual scale and resampled to the same spatial resolution for the driving factors analysis of AET.

2.2.3. Remote Sensing Data

In this study, MODIS Land Cover (MCD12Q1) and Leaf Area Index (LAI, MOD15A2H) data were selected to collectively perform the driving force analysis of AET variations. The MCD12Q1 product provides annual land use classification data at a 500 m spatial resolution. The MOD15A2H product offers 8-day composite LAI data, also with a 500 m spatial resolution. Both datasets were acquired for the period from 2003 to 2017 and consistently resampled to 0.005° to maintain spatial uniformity with other variables.

2.2.4. Climatic Data

Meteorological data from 2003 to 2017 were obtained from the ground-based monitoring stations and released by the national meteorological department to ensure data quality. The recorded variables include precipitation, air temperature, pressure, wind speed, and sunshine duration. The study used meteorological monitoring data from stations located in Hebei province, where Shijin irrigation district is situated. A total of six stations within and surrounding the irrigation district as well as neighboring national stations were used for the analysis. To generate the spatial distribution of these meteorological variables across the Shijin irrigation district at a 0.005° resolution, the station-based data were interpolated with inverse distance weighting (IDW) method, showing high fitting accuracy through resubstitution validation at the six stations. The temporal coverage of the meteorological dataset remains consistent with the aforementioned variables. The spatial data pre-processing was performed with python 2.7. The bilinear method was used for the resampling of the spatial data.

2.3. Methods

2.3.1. Trend Analysis

In this study, trend analysis and significance testing were employed to examine the long-term evolutionary characteristics of AET in Shijin irrigation district. For the trend analysis, the Theil-Sen Median estimator was selected. This method focuses on the median of the slopes, which effectively minimizes the influence of data noise and outliers. The calculation procedure is as follows [27]:
b = M e d i a n ( x j x i j i )   i < j
where x represents the AET; j and i denote the time indices; and b indicates the variation trend of the data sequence.
The Mann-Kendall (M-K) test was employed to analyze the significance of AET trends in the Shijin irrigation district. Furthermore, it is resilient to missing values and outliers, leading to its widespread application in the trend detection of hydrometeorological time series. For the detailed calculation procedure, please refer to the study by Gui et al. [27].

2.3.2. Driving Force Analysis

The projection pursuit model achieves the projection of high-dimensional data features through dimensionality reduction. By projecting n-dimensional data onto a unit vector a in a specific direction, the projection value of sample i in this direction can be expressed as:
z ( i ) = j = 1 p a ( j ) x ( i , j )
where a ( j ) is the projection direction, x ( i , j ) is the sample indicator set. Prior to modeling, all factors were processed using min-max normalization to eliminate the influence of different dimensions.
The projection index function can be described as follows:
Q ( a ) = S z D z
where S z represents the standard deviation of the projection values, and D z denotes the local density of these values. For the detailed calculation procedure, please refer to the research by Guan et al. [28]. The determination of the optimal projection direction depends critically on the objective function. Considering the non-linear interactions between AET and its drivers, we employed the projection pursuit model to analyze the contribution of different environmental factors and the spearman rank correlation was employed for the synergistic effects analysis. To improve the optimization efficiency, a strategy combining statistical foundations and heuristic initialization was employed. Furthermore, the optimization algorithm was applied to derive the optimal weights that best explain the spatiotemporal evolution of AET.
After identifying the optimal projection direction, the synergy between environmental factors was analyzed. If two factors carry substantial weights in the projection vector and show a significant positive Spearman correlation, it indicates a synergistic effect in driving AET variations. The construction and optimization of the projection pursuit model were implemented via MATLAB R2023a.

2.3.3. Quantifying Irrigation Variation

In this study, a Sankey diagram [29] was employed to analyze the spatiotemporal variations in irrigation extent within the Shijin Irrigation District. Based on the study period, three representative snapshots, namely, 2003, 2010, and 2017, were selected for analysis. The land surface was classified into three distinct categories: irrigated cropland, rain-fed cropland, and non-cropland. By quantifying the area of each category and the categorical conversions between these time nodes, we evaluated the trajectory of irrigation expansion and contraction across the study area.

2.3.4. Quantifying Irrigation Effects on AET

The irrigation effect in the Shijin irrigation district was assessed by quantifying the difference in growing season AET between irrigated and rain-fed crops [14]. It was assumed that within the irrigation district, where topography and climatic conditions are similar, the variations in AET are primarily driven by irrigation practices. Based on irrigation distribution and land use data, the spatial extents of irrigated and rain-fed crops for the year 2003 were extracted. In accordance with previous research, a sliding window sized by 9 × 9 pixels [14] was applied to each irrigated crop pixel to calculate the mean AET difference between the central irrigated pixel and the rain-fed pixels within the window. These differences were then averaged and upscaled to the entire district for further analysis. Furthermore, the Harmonized World Soil Database (HWSD) soil data was resampled to 0.005° to facilitate a comparative analysis. By categorizing the study area into loam and loamy sand zones, we calculated the AET for irrigated and rain-fed croplands respectively, thereby identifying the influence of soil types on AET differences.

3. Results

3.1. The Spatial and Temporal Characteristics of AET

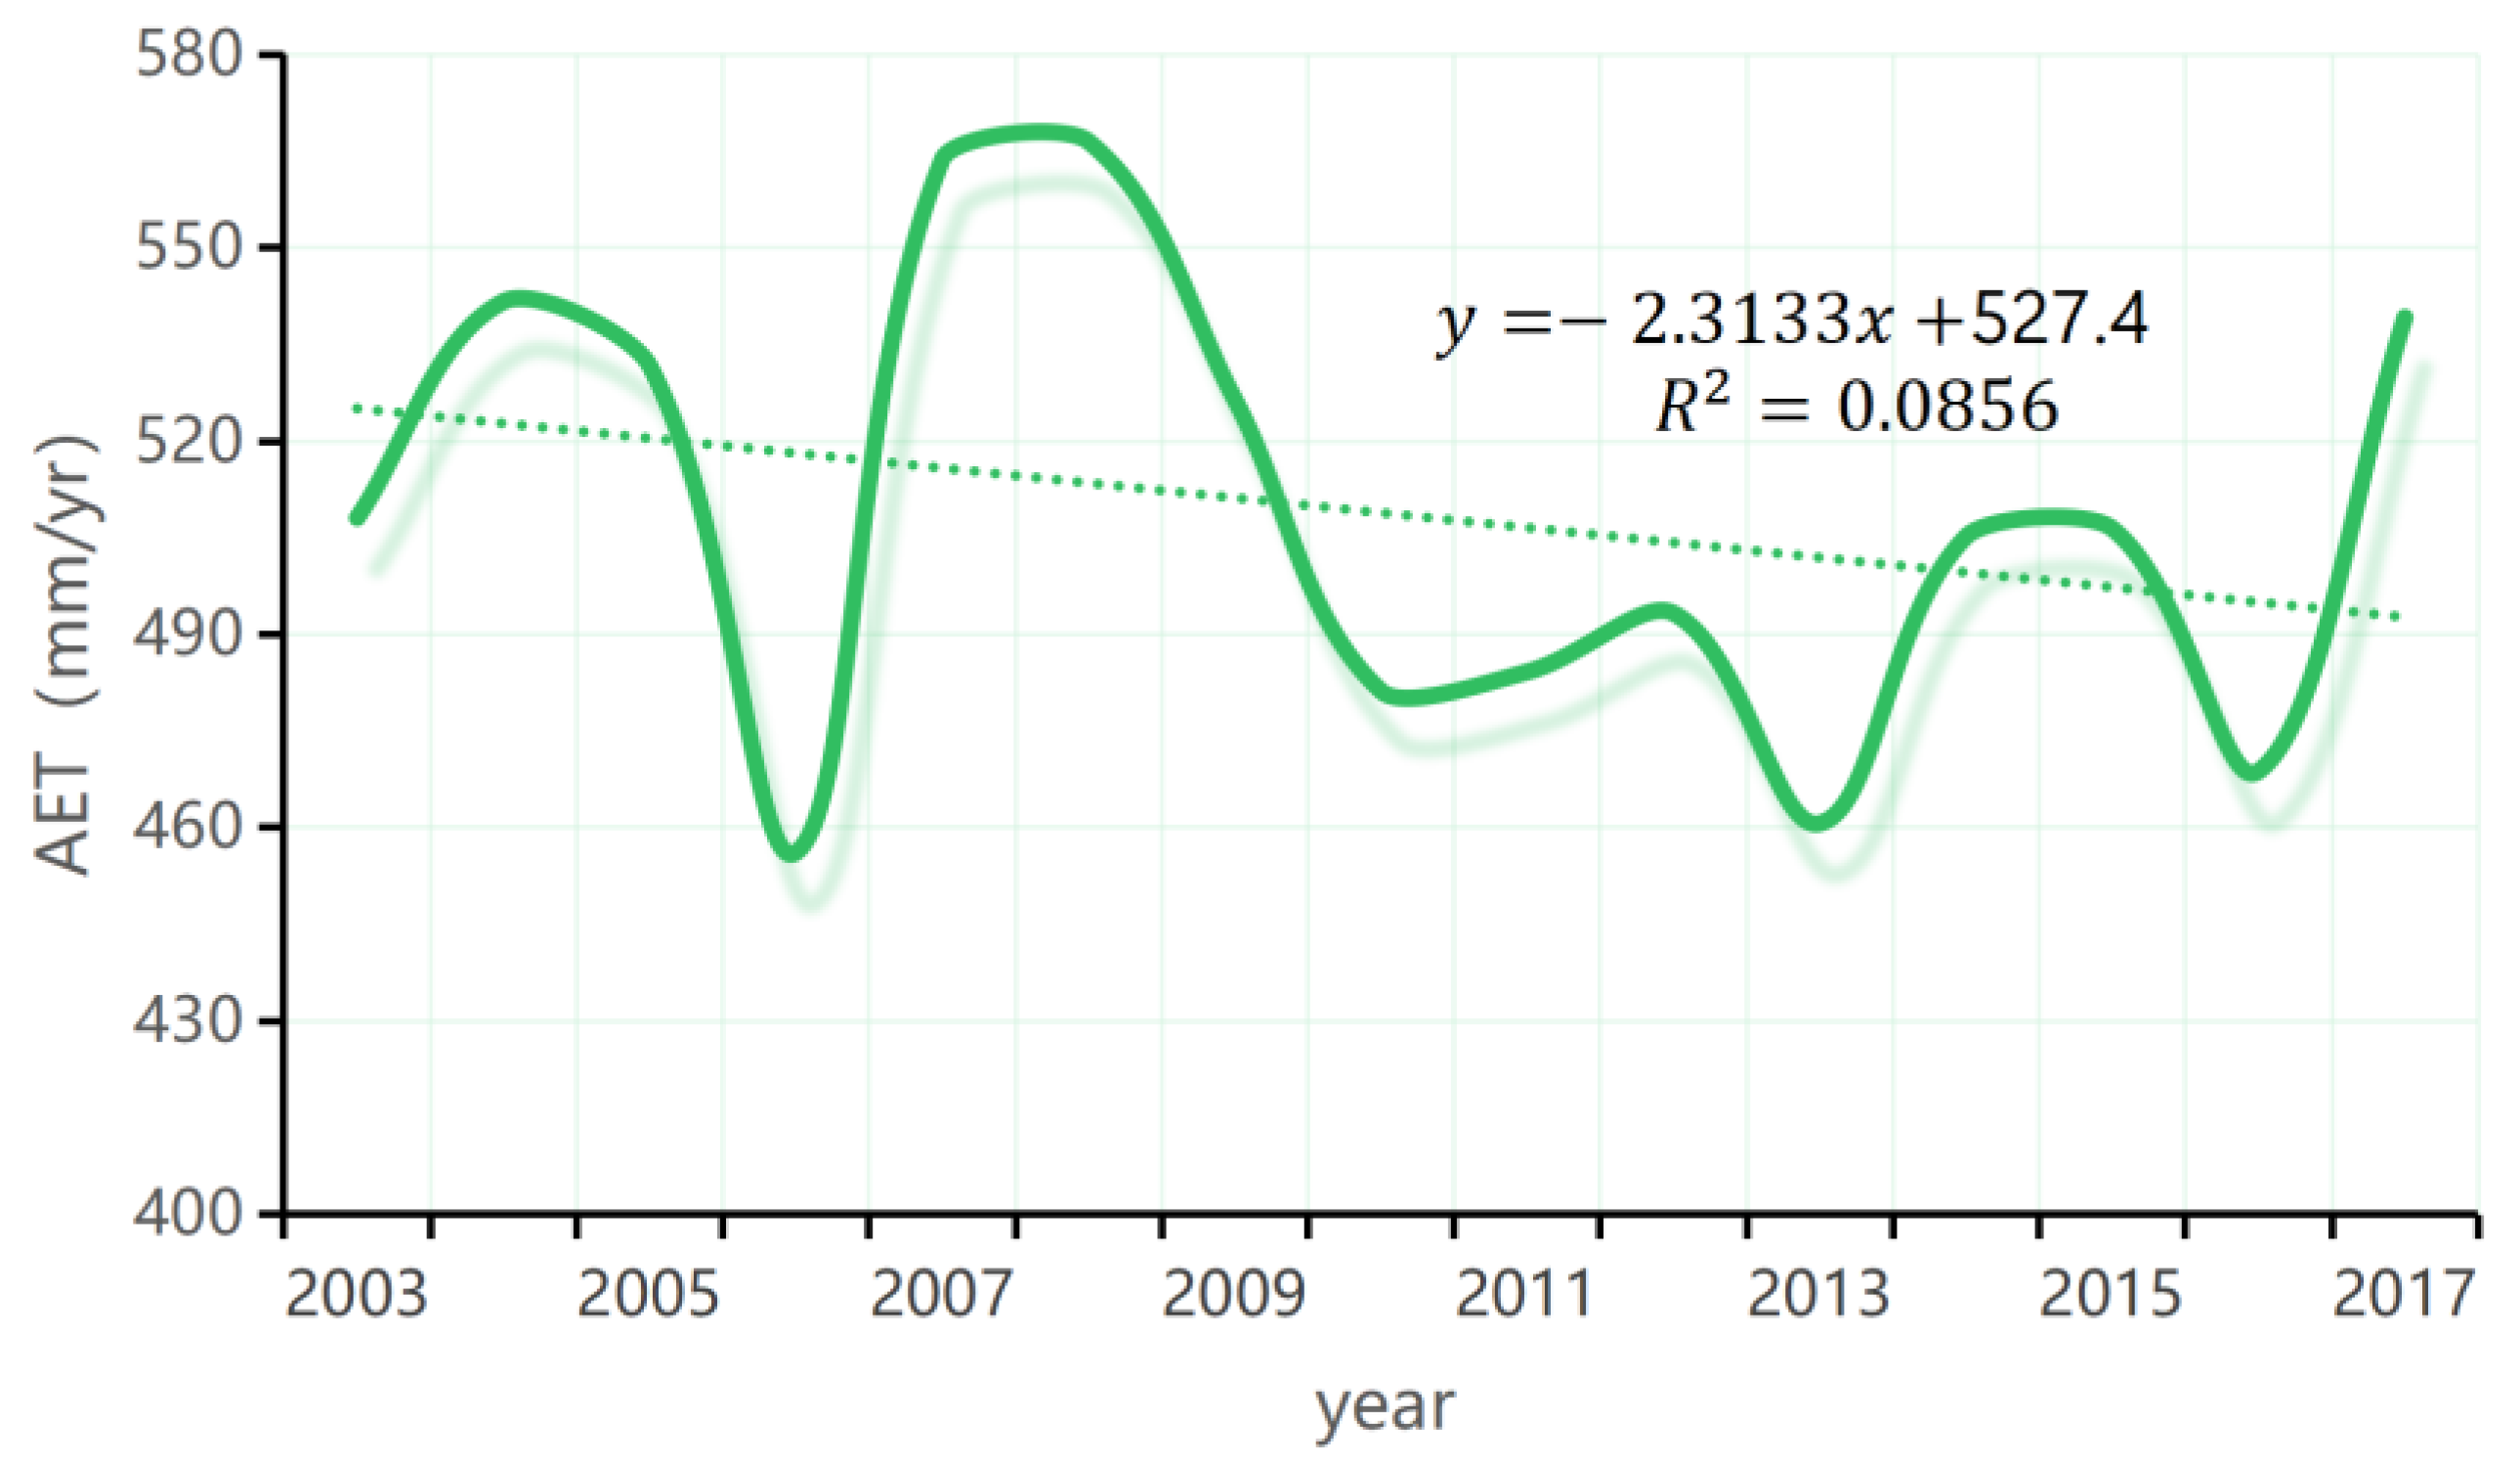
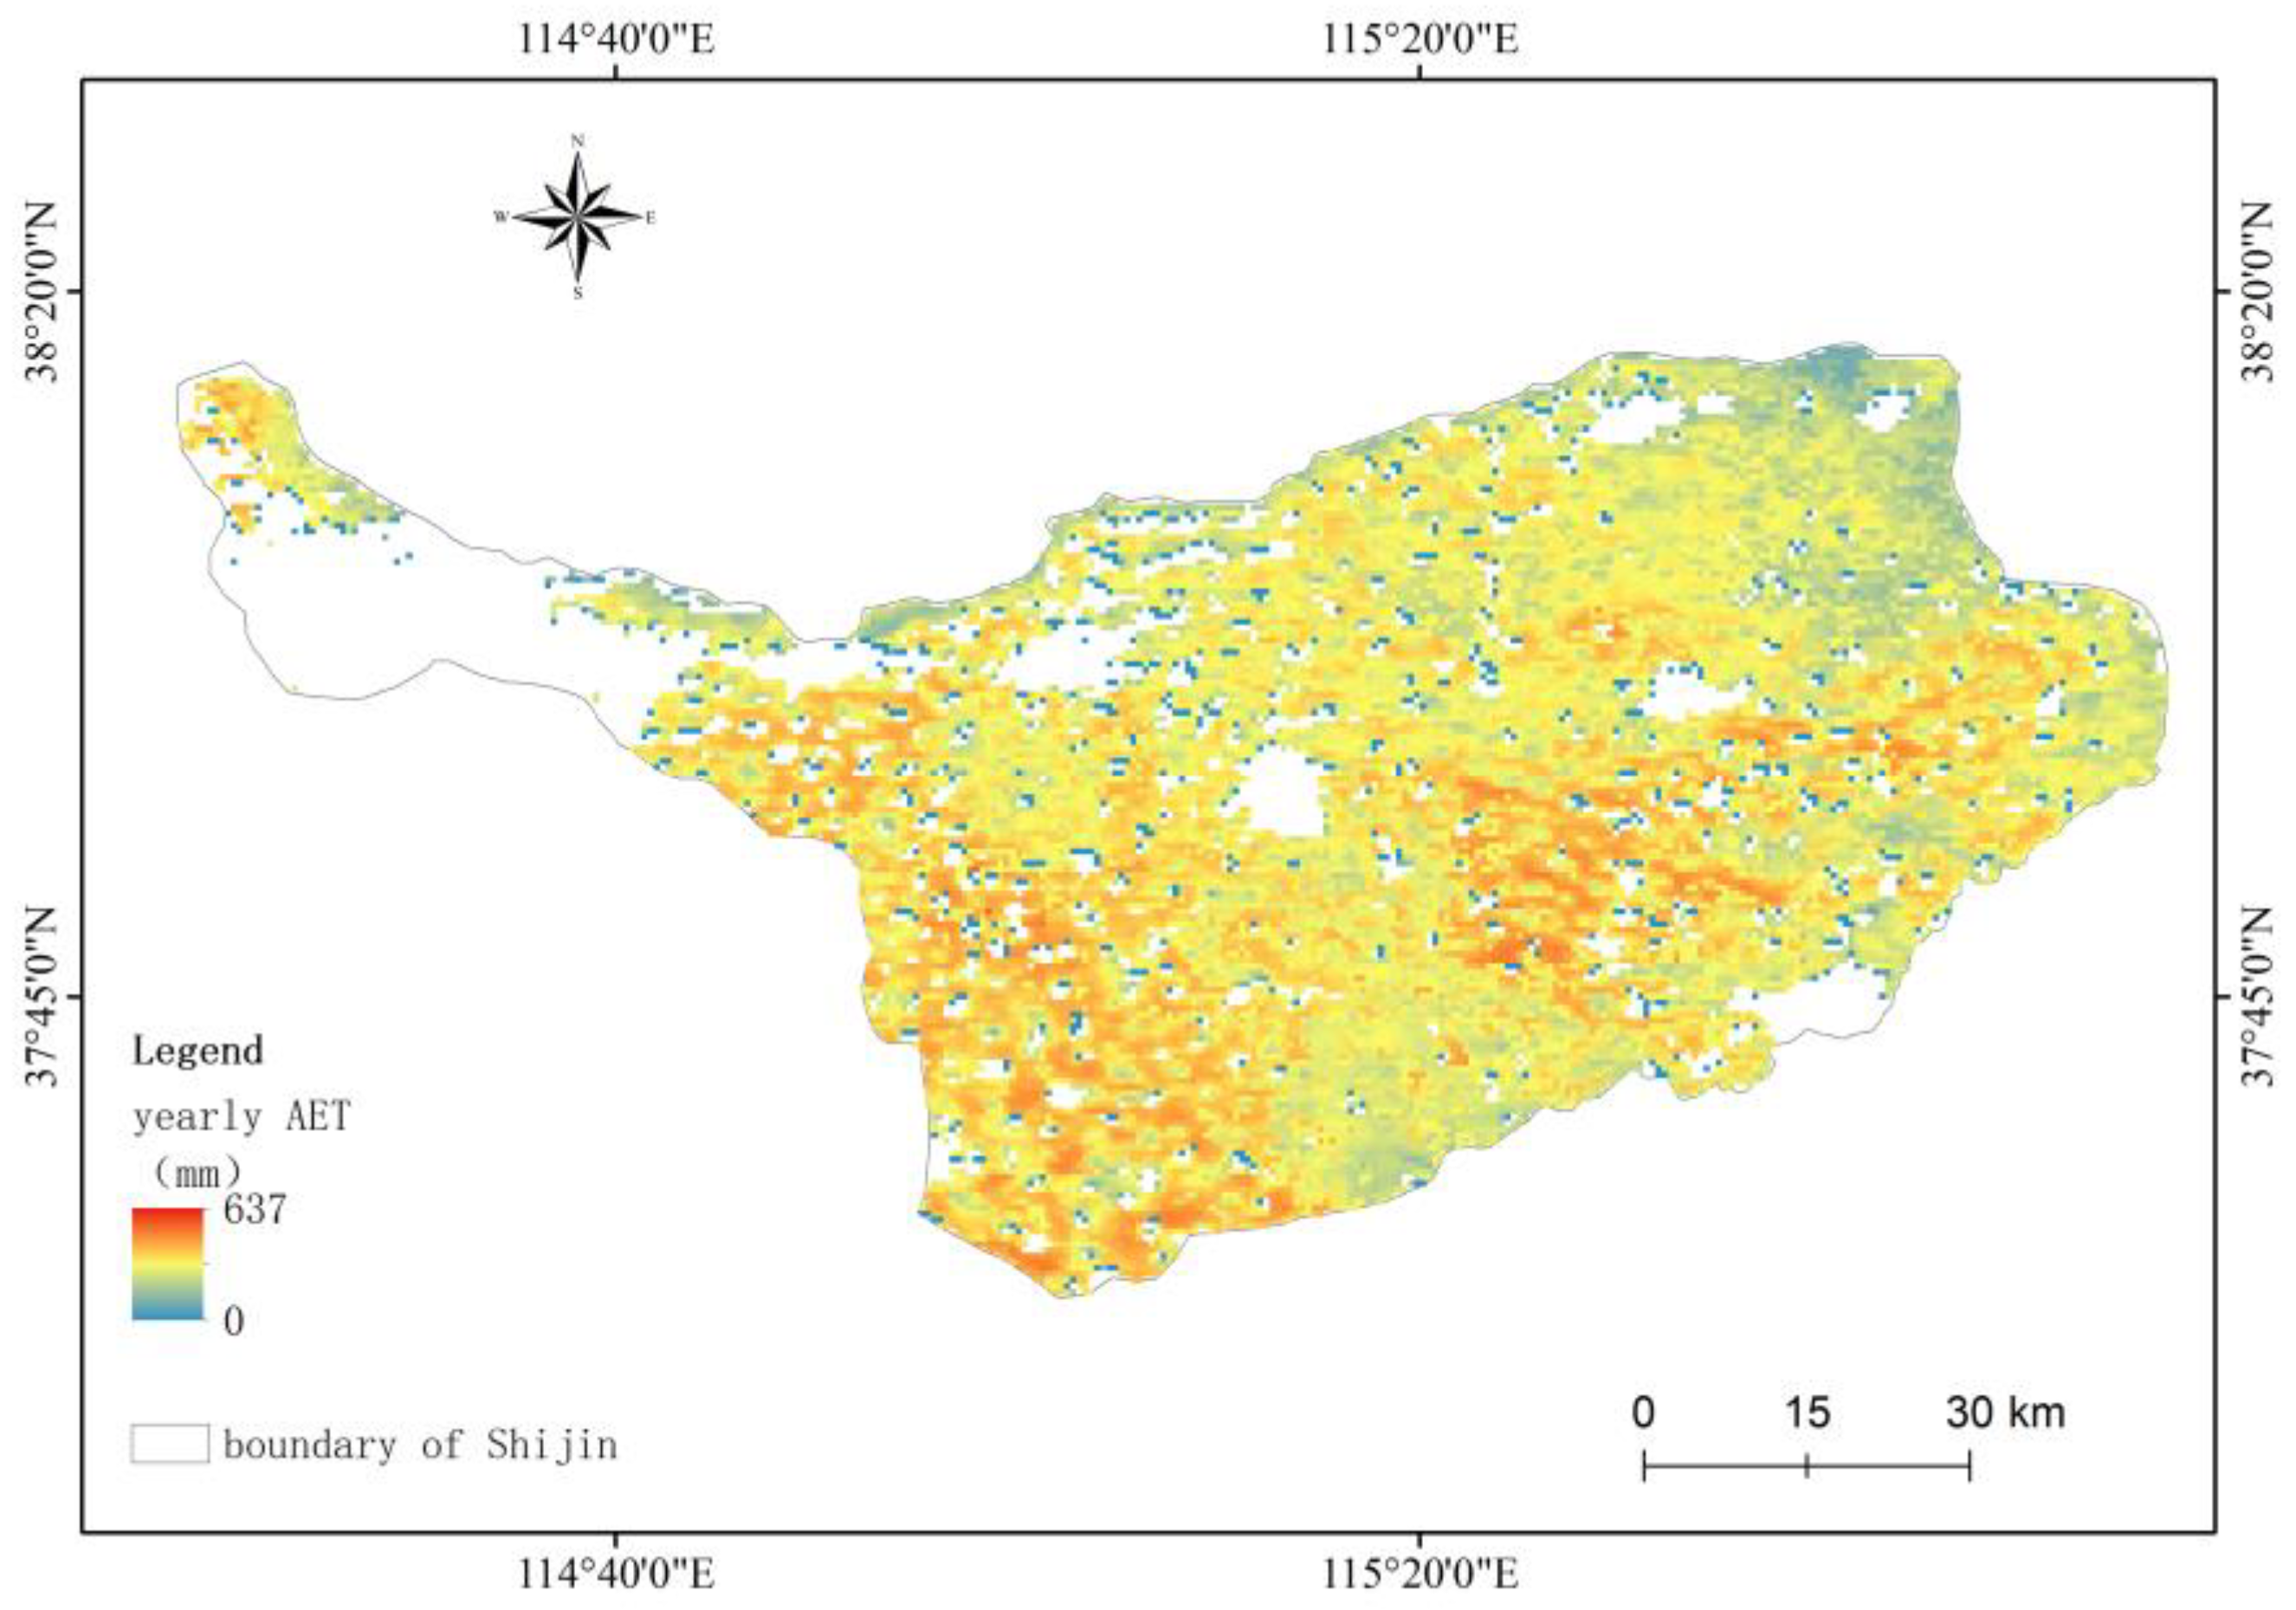
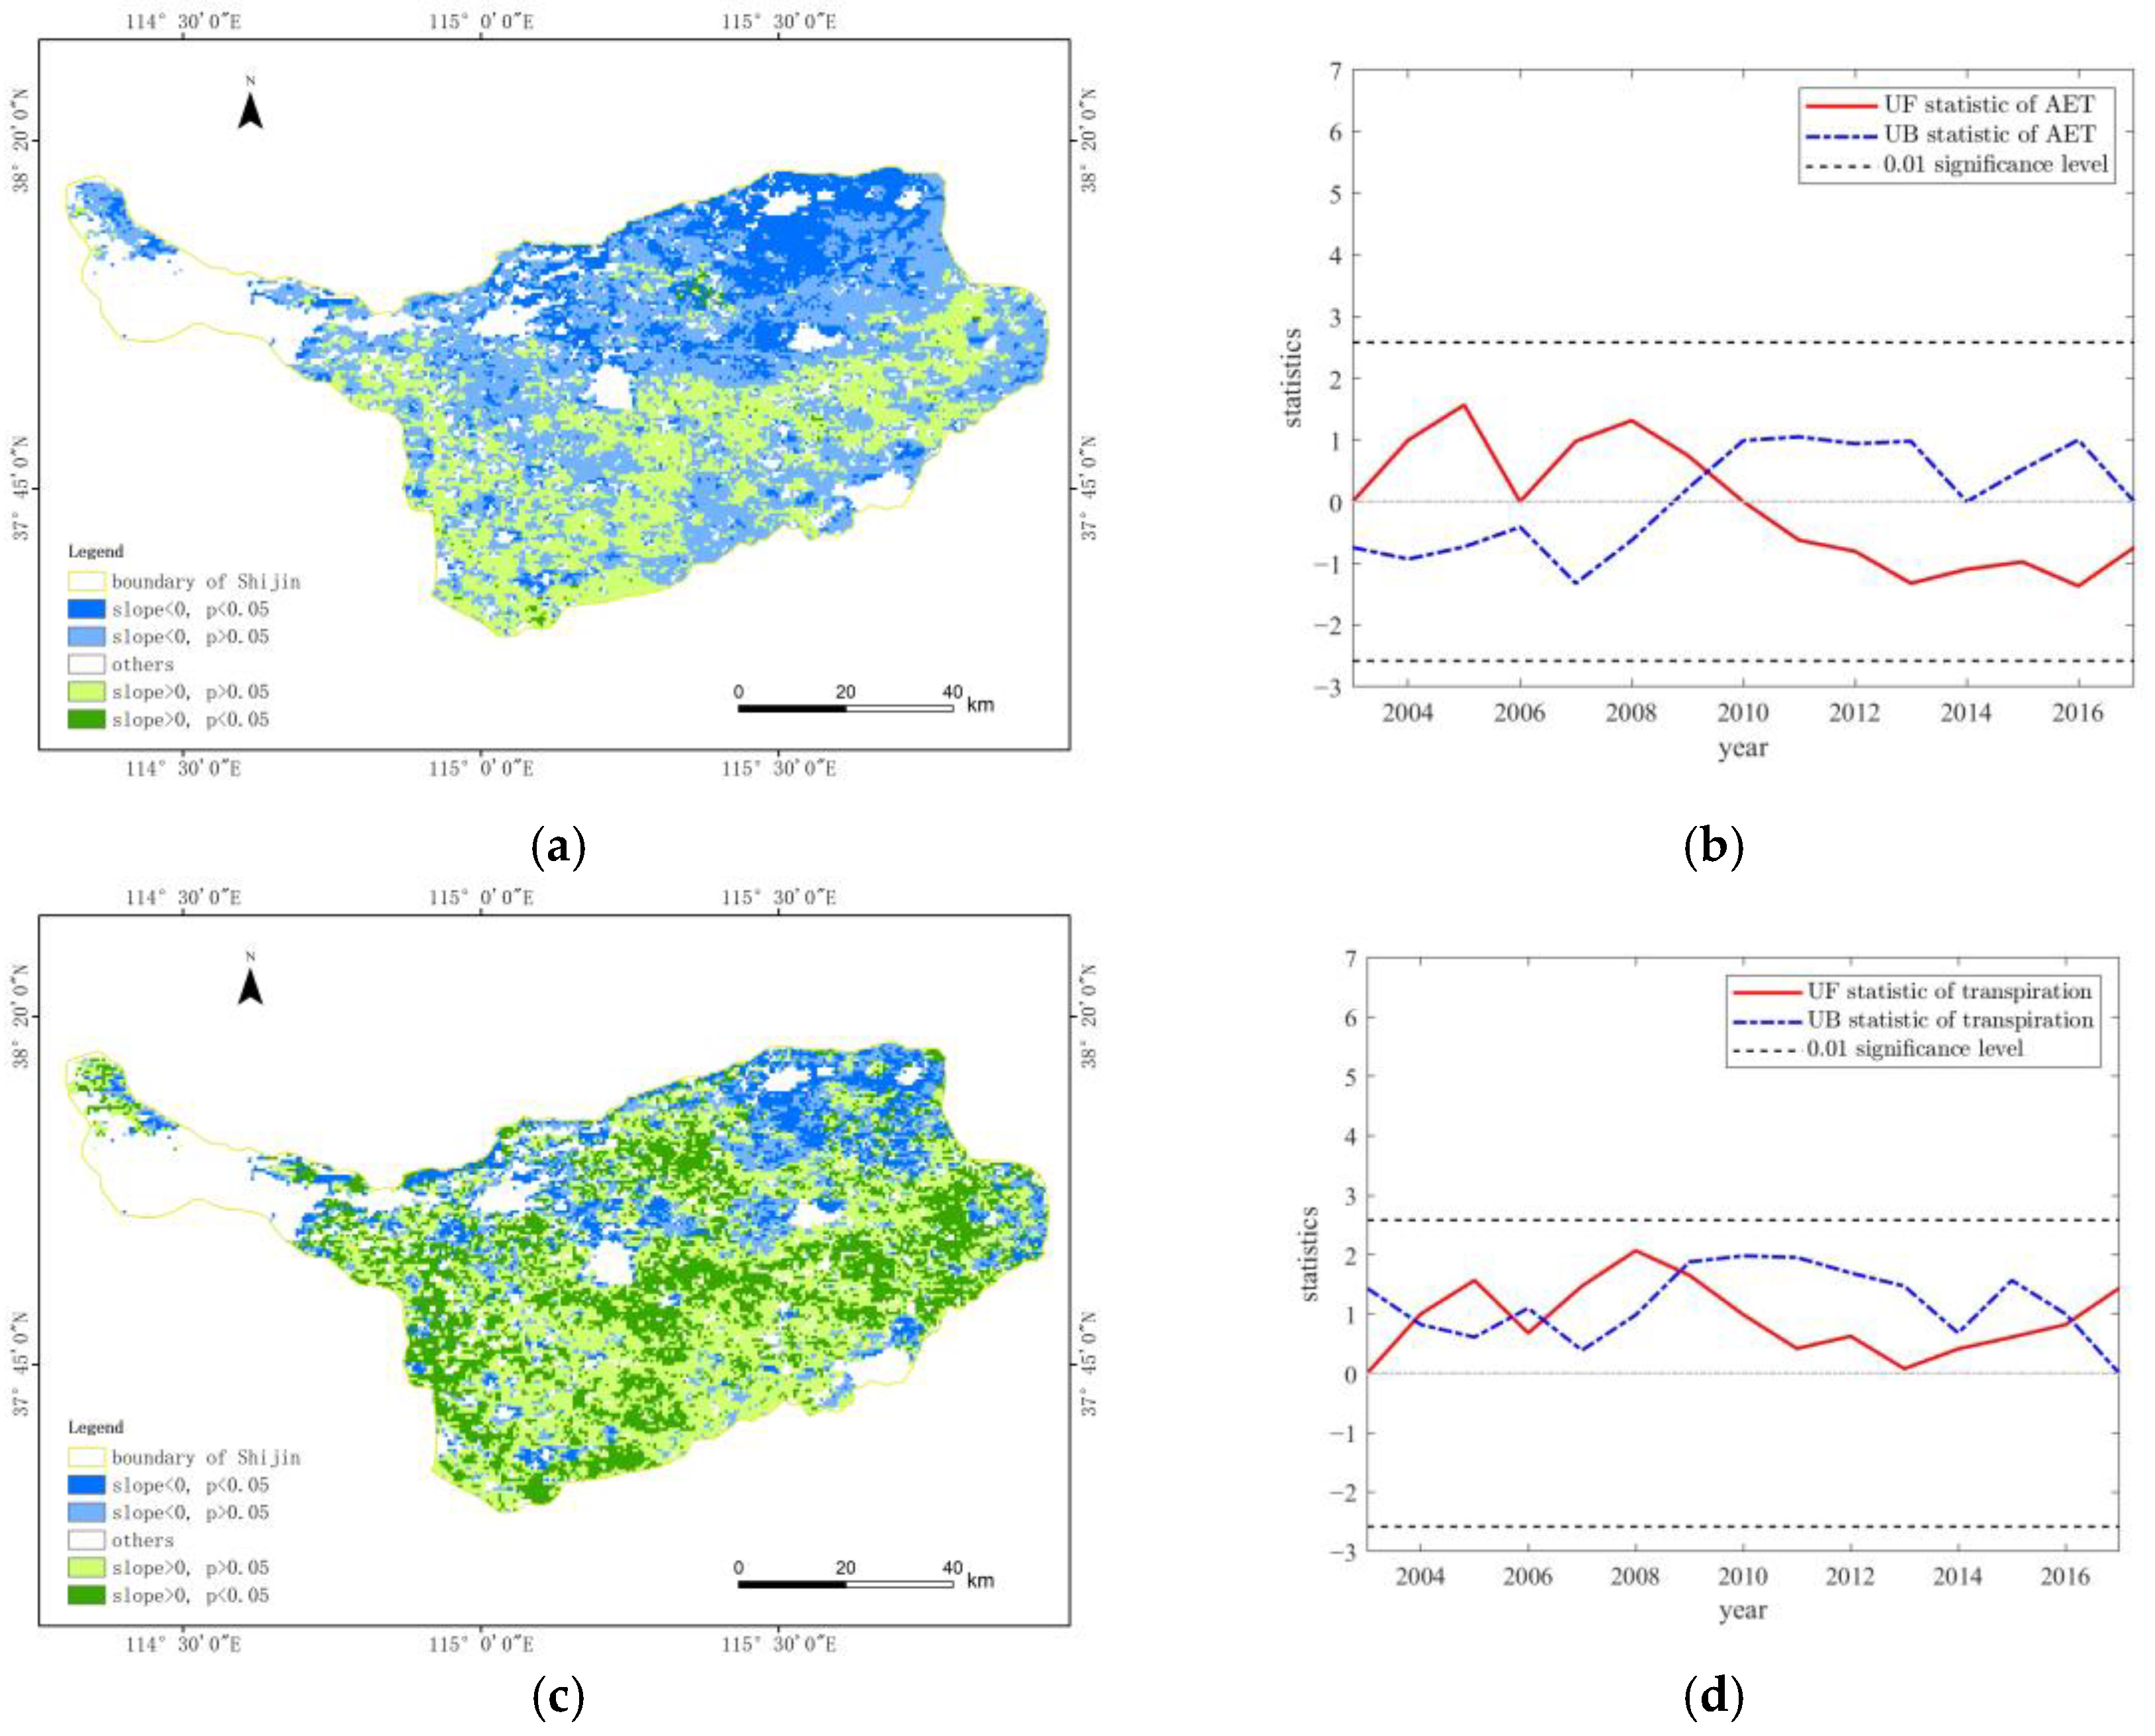
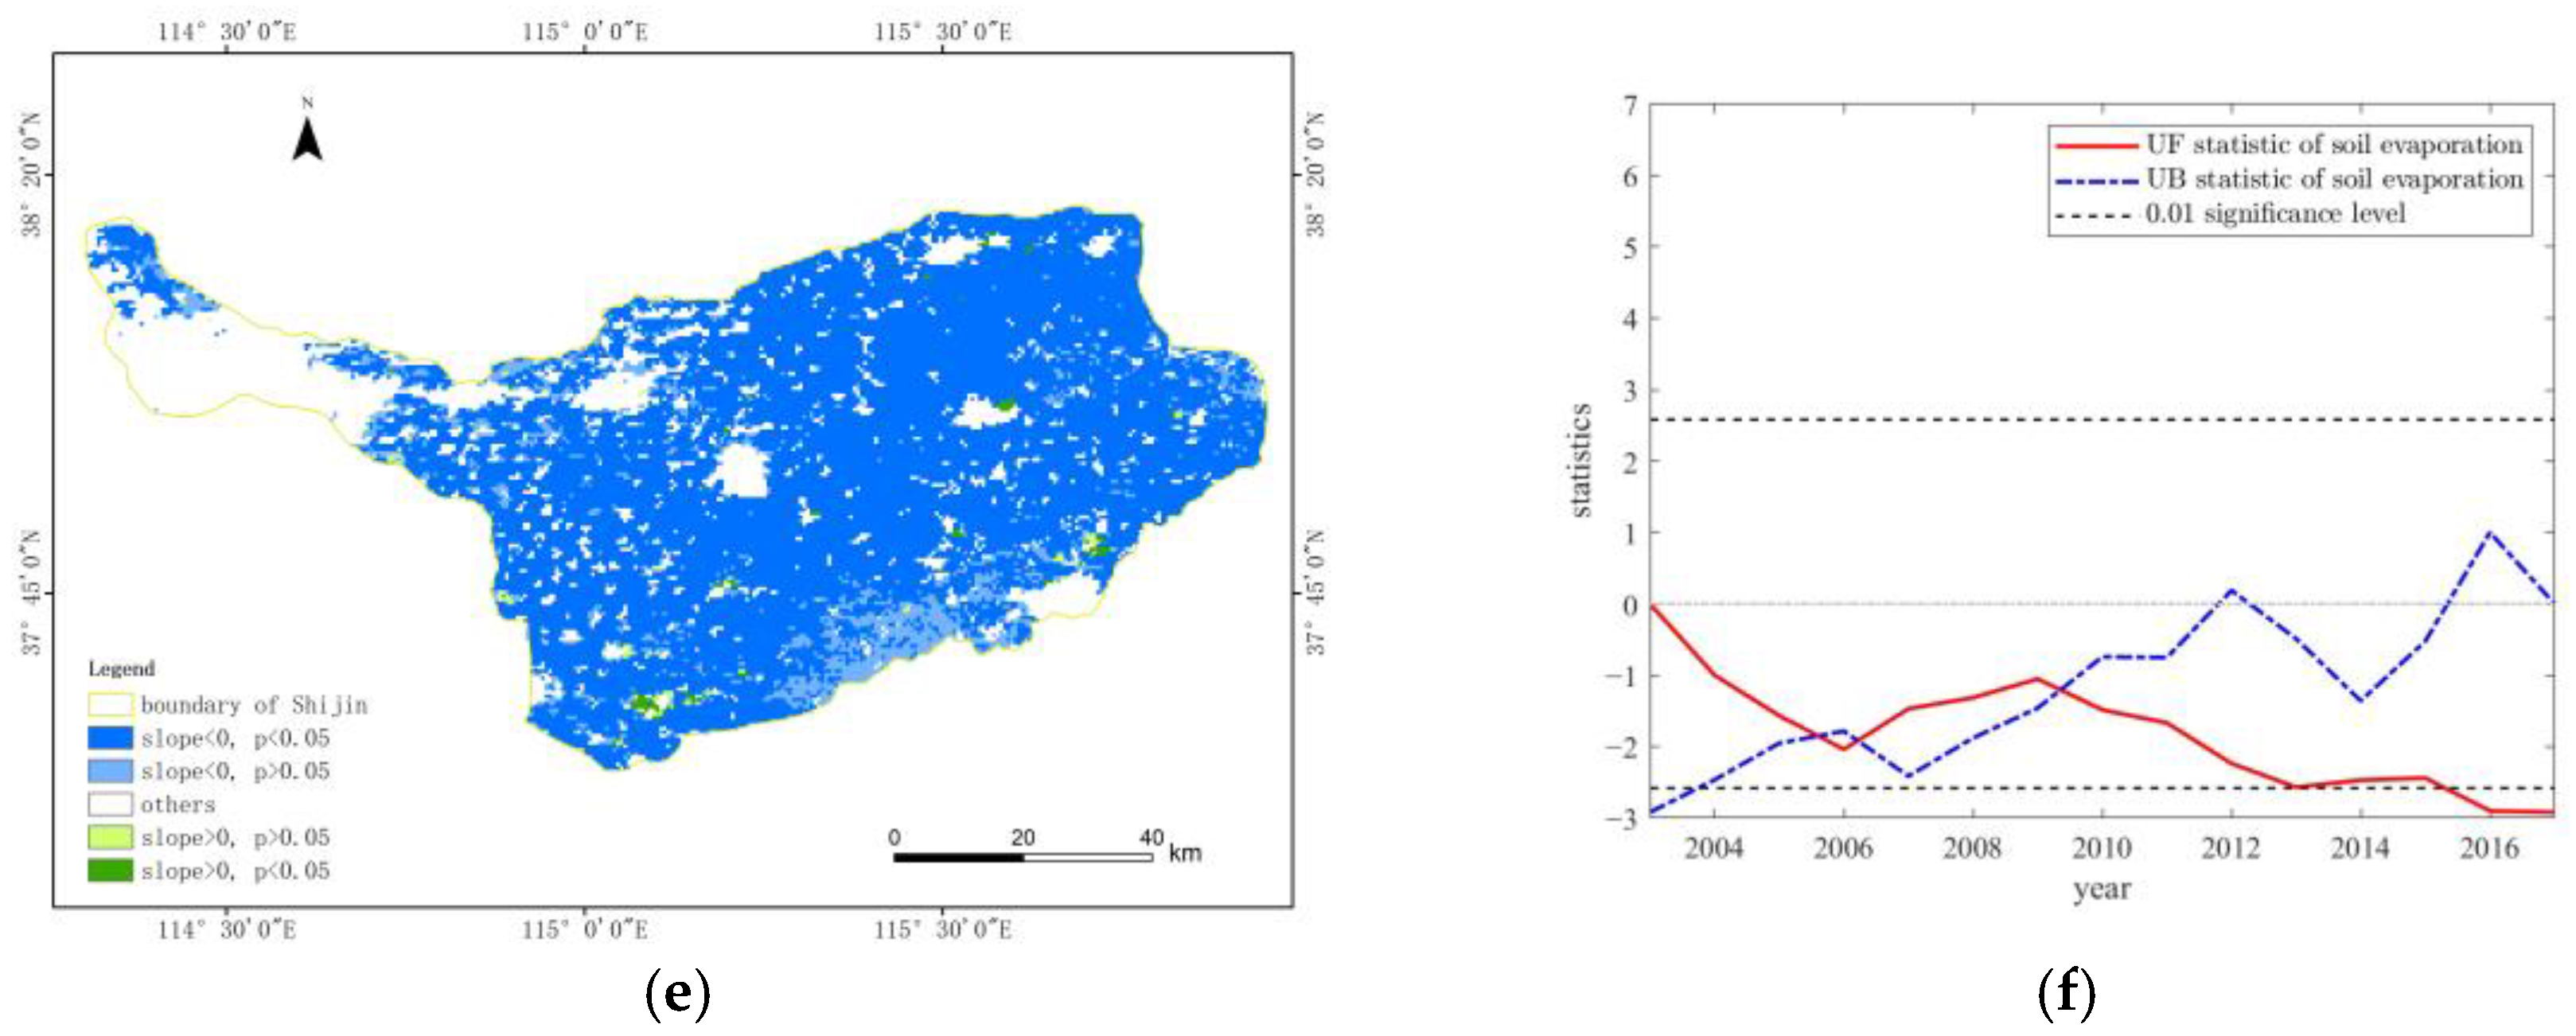
Overall, the interannual AET of PML_V2 in the Shijin irrigation district exhibited a downward trend from 2003 to 2017 (Figure 2). Multi-year average data reveals that AET in the central and southern regions were significantly higher than those in the northern and eastern areas (Figure 3). Concurrently, this study performed trend analysis and M-K tests on the total AET, transpiration, and soil evaporation, which can be seen in Figure 4. A distinct abrupt change in the total AET occurred around 2009, shifting from an earlier upward trend to a subsequent downward trend, but the decline was statistically non-significant. Analysis of the AET components shows that the overall decrease in AET was characterized by a gradual reduction in soil evaporation. Prior to 2009, the increase in transpiration (Figure 4d) coincided with a slight rise in total AET. However, the growth of transpiration subsequently leveled off, and the variation of AET in the irrigation district mirrored the progressive decline of soil evaporation (Figure 4f).

3.2. Spatiotemporal Change of Irrigation

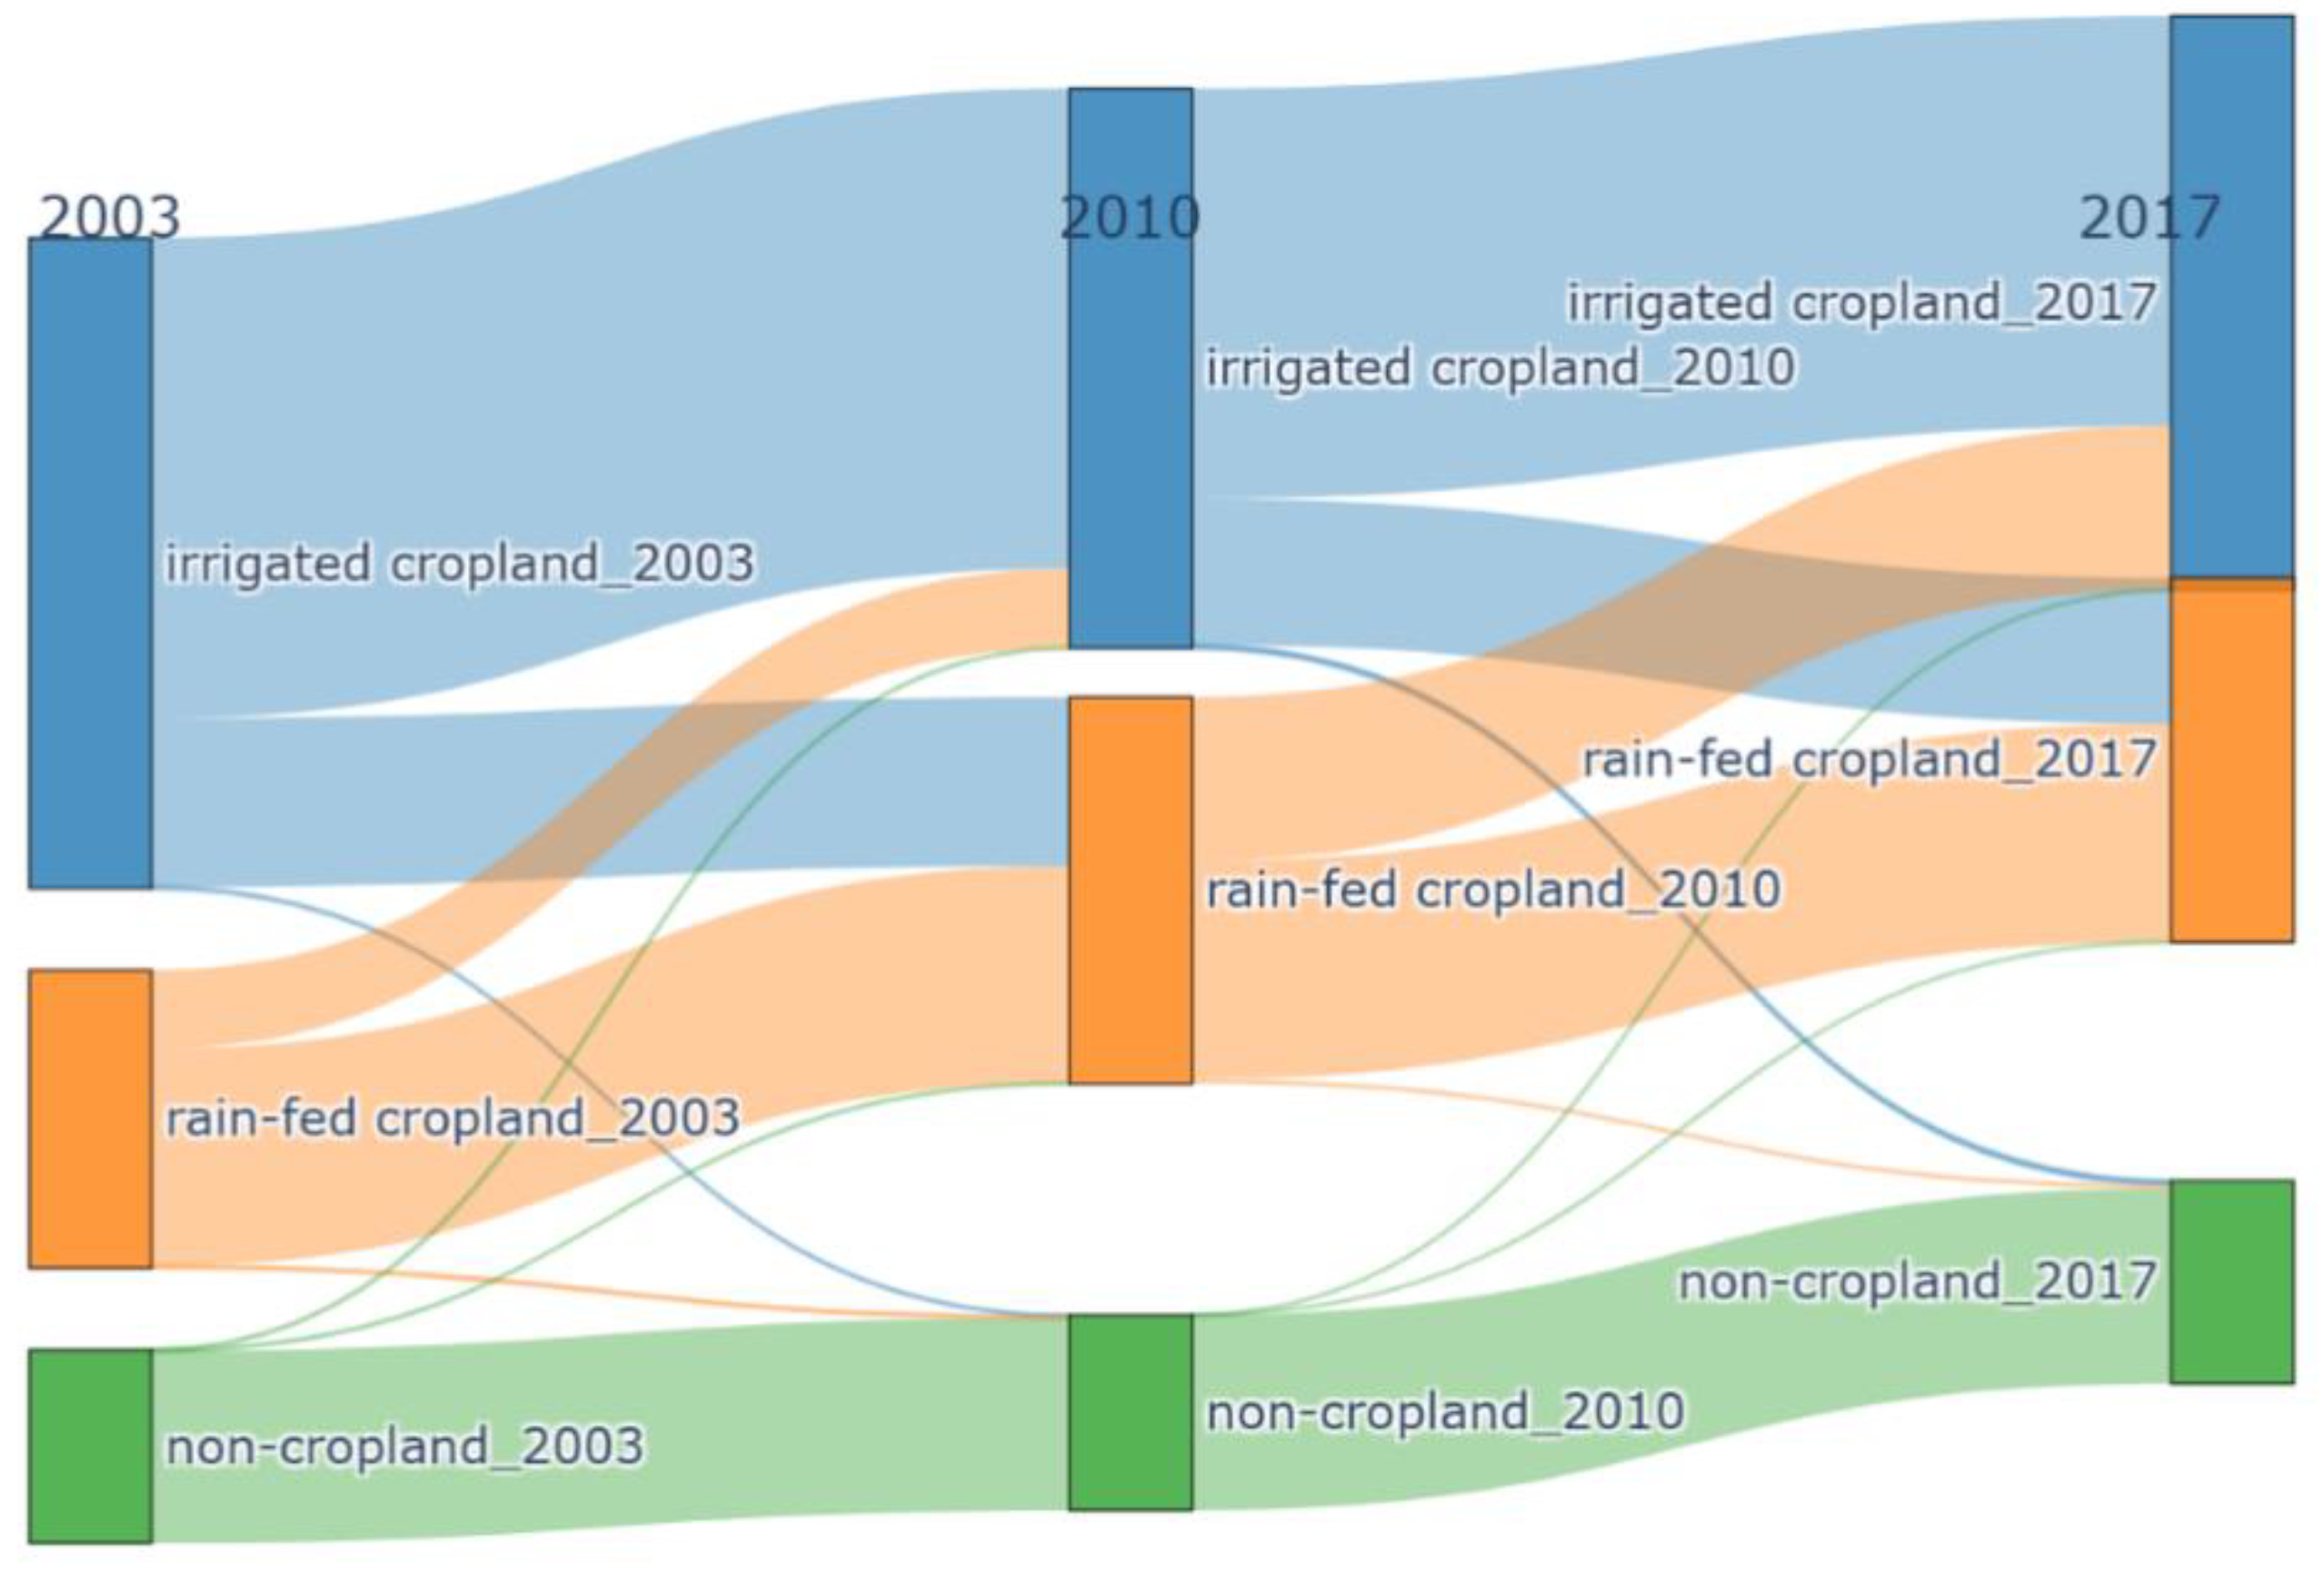
The land cover types within the study area were classified into irrigated cropland, rain-fed cropland, and non-cropland based on the presence of cultivation and the occurrence of irrigation. These classifications served as the basis for constructing the spatiotemporal transition matrix of irrigation distribution in the Shijin irrigation district (Figure 5). The results indicate that between 2003 and 2017, land-use changes were dominated by transitions between irrigated and rain-fed conditions, while conversions between cropland and non-cropland were minimal. During 2003–2010, 26% of irrigated cropland was converted to rain-fed cropland, while 27% of rain-fed cropland shifted to irrigated cropland. In the 2010–2017 period, another 26% of irrigated cropland transitioned to rain-fed, whereas 42% of rain-fed cropland became irrigated cropland. Throughout both periods, the conversion from cropland to non-cropland accounted for only 0.3% and 0.8% of the total area, respectively. Overall, the extent of irrigated cropland in the study area exhibited a downward trend over the 15-year period, with a total reduction of approximately 12%.
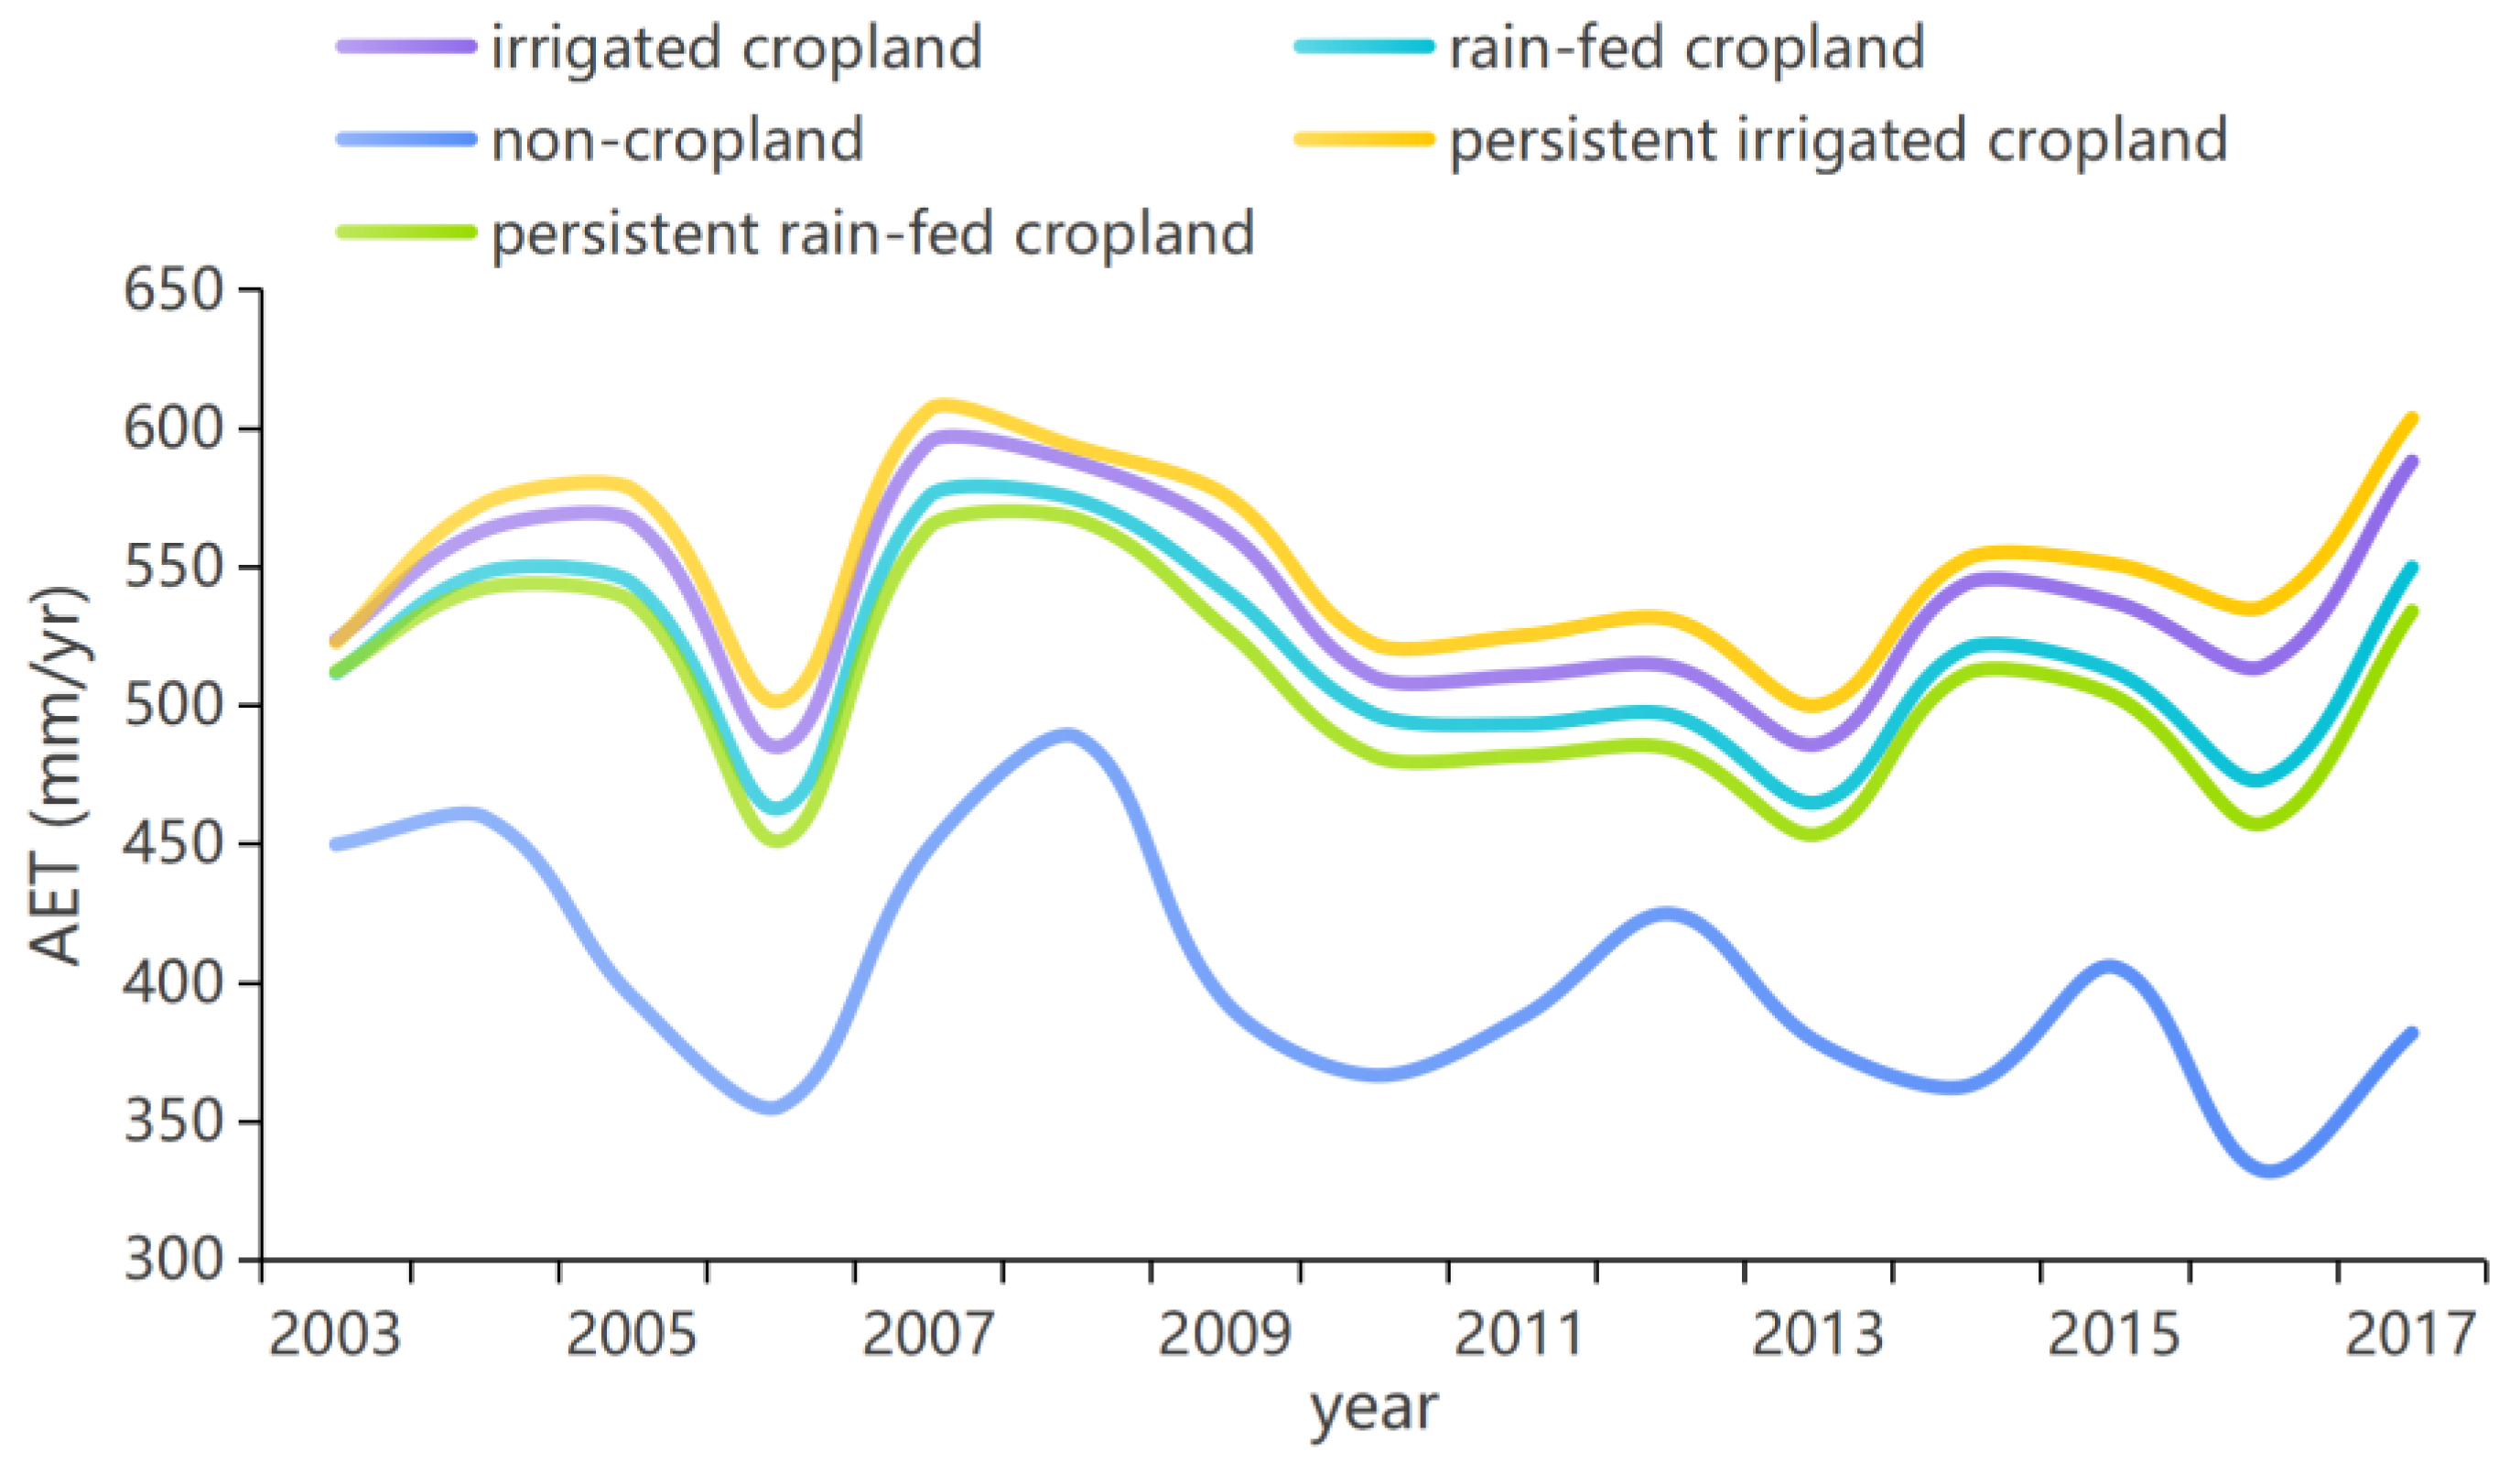
The annual AET for different land-cover types was statistically analyzed and compared, as shown in Figure 6. During the study period, the average AET values for irrigated cropland, rain-fed cropland, and non-cropland were 539.31 mm/yr, 517.76 mm/yr and 402.08 mm/yr, respectively. Notably, the AET of irrigated cropland was 21.55 mm/yr higher than that of rain-fed cropland and 137.23 mm/yr higher than that of non-cropland. To further evaluate the spatial differences associated with irrigation, AET was specifically analyzed for areas that remained consistently as irrigated or rain-fed cropland throughout the study period. The results indicate that the average AET followed the order: persistent irrigated cropland > irrigated cropland > rain-fed cropland > persistent rain-fed cropland. Specifically, the mean AET of persistently irrigated areas was 12.26 mm/yr higher than the overall average for irrigated cropland, while rain-fed cropland AET was 10.33 mm/yr higher than that of persistently rain-fed areas. During the study period, AET variations within irrigated and rain-fed croplands remained generally stable, whereas AET in non-cropland areas exhibited a downward trend.

3.3. Driving Factor Analysis of AET

To further isolate the interference of non-cropland areas on the overall AET trends, this study employed the projection pursuit model to evaluate the contribution of various environmental factors within the cultivated land of the Shijin irrigation district. Specifically, precipitation, temperature, wind speed, air pressure, LAI, irrigation frequency, and sunshine duration were selected as driving factors to quantify their respective impacts on the spatial distribution of AET.
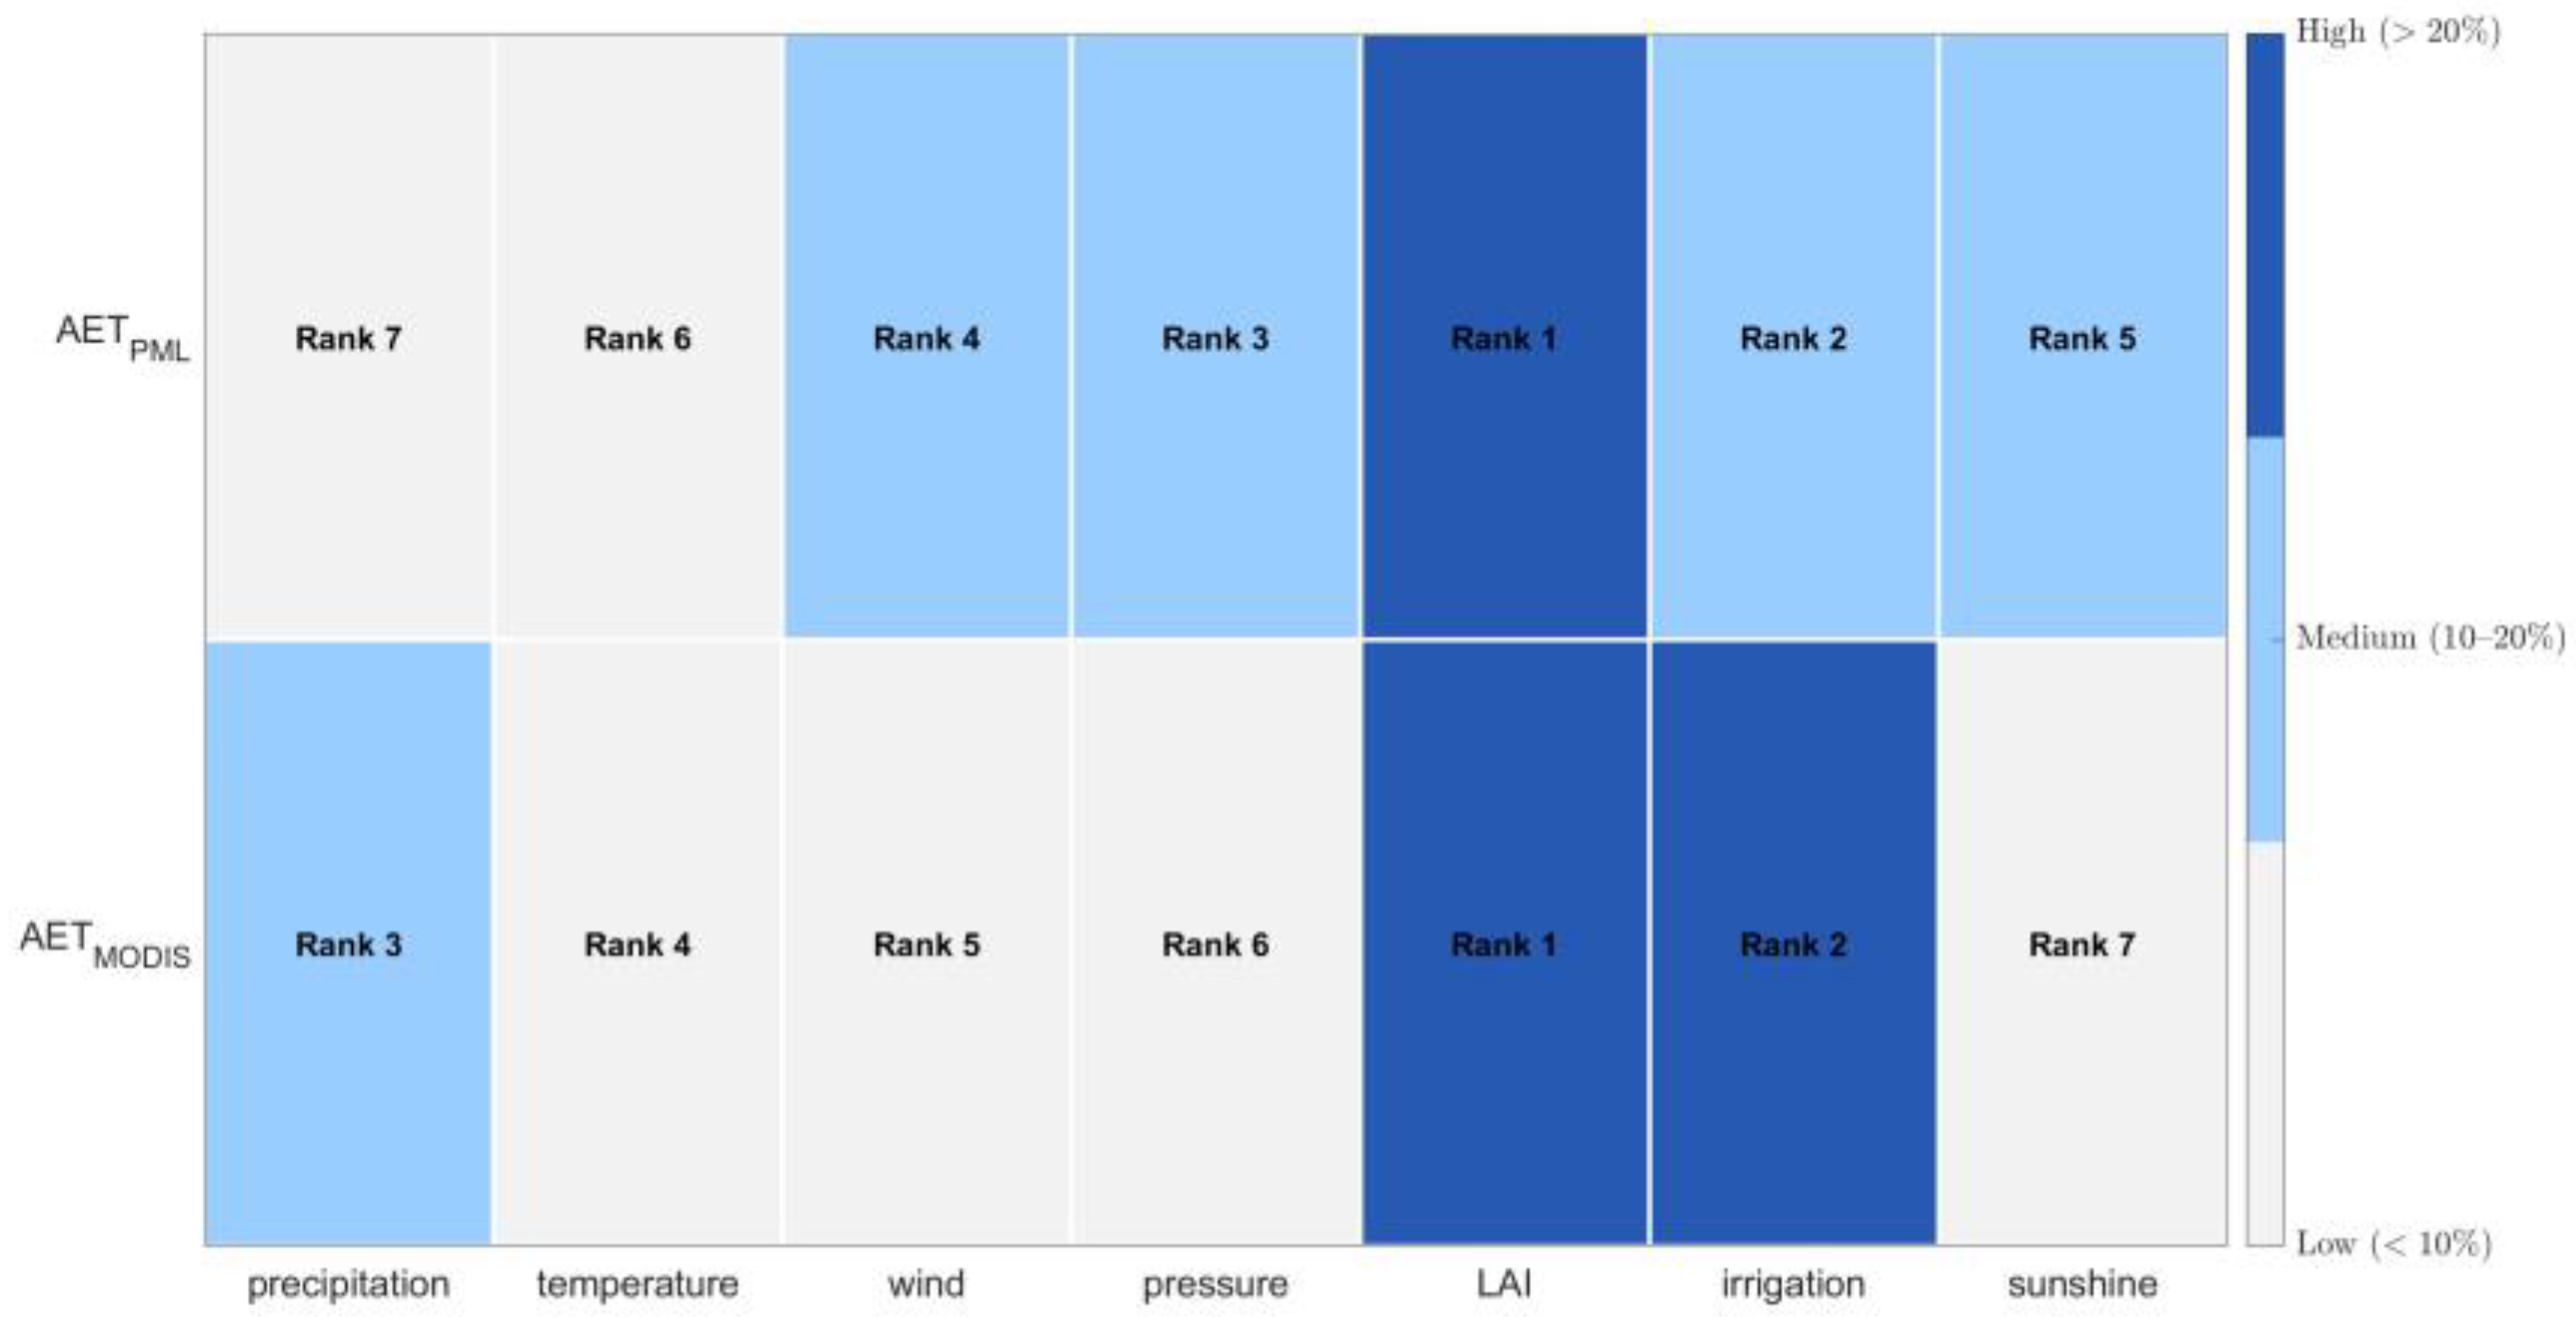
Based on the AET data of PML_V2 and MODIS and corresponding environmental variables, the projection pursuit attribution analysis was conducted (Figure 7). Global evaluations [30] showed that 8-day composite PML_V2 and MODIS products effectively capture seasonal evapotranspiration variations. Validated against ground sites, PML_V2 yield r = 0.7 and root-mean-square difference (RMSD) is 28.2 W/m2, while MODIS showed r > 0.6 and RMSD = 31.9 W/m2. The daily PML_V2 product within China used in this study has been validated against a more extensive network of domestic stations, further improving its accuracy. For the PML AET during the study period, LAI and irrigation emerged as the primary drivers of AET, with their respective contribution rates exceeding or approaching 20%. These were followed by air pressure, wind speed, and sunshine duration, all contributing over 10%. Regarding the AET of MODIS, the contributions of LAI and irrigation were more significant, with both exceeding 20%. The contribution rates of most other factors remained below 10%.
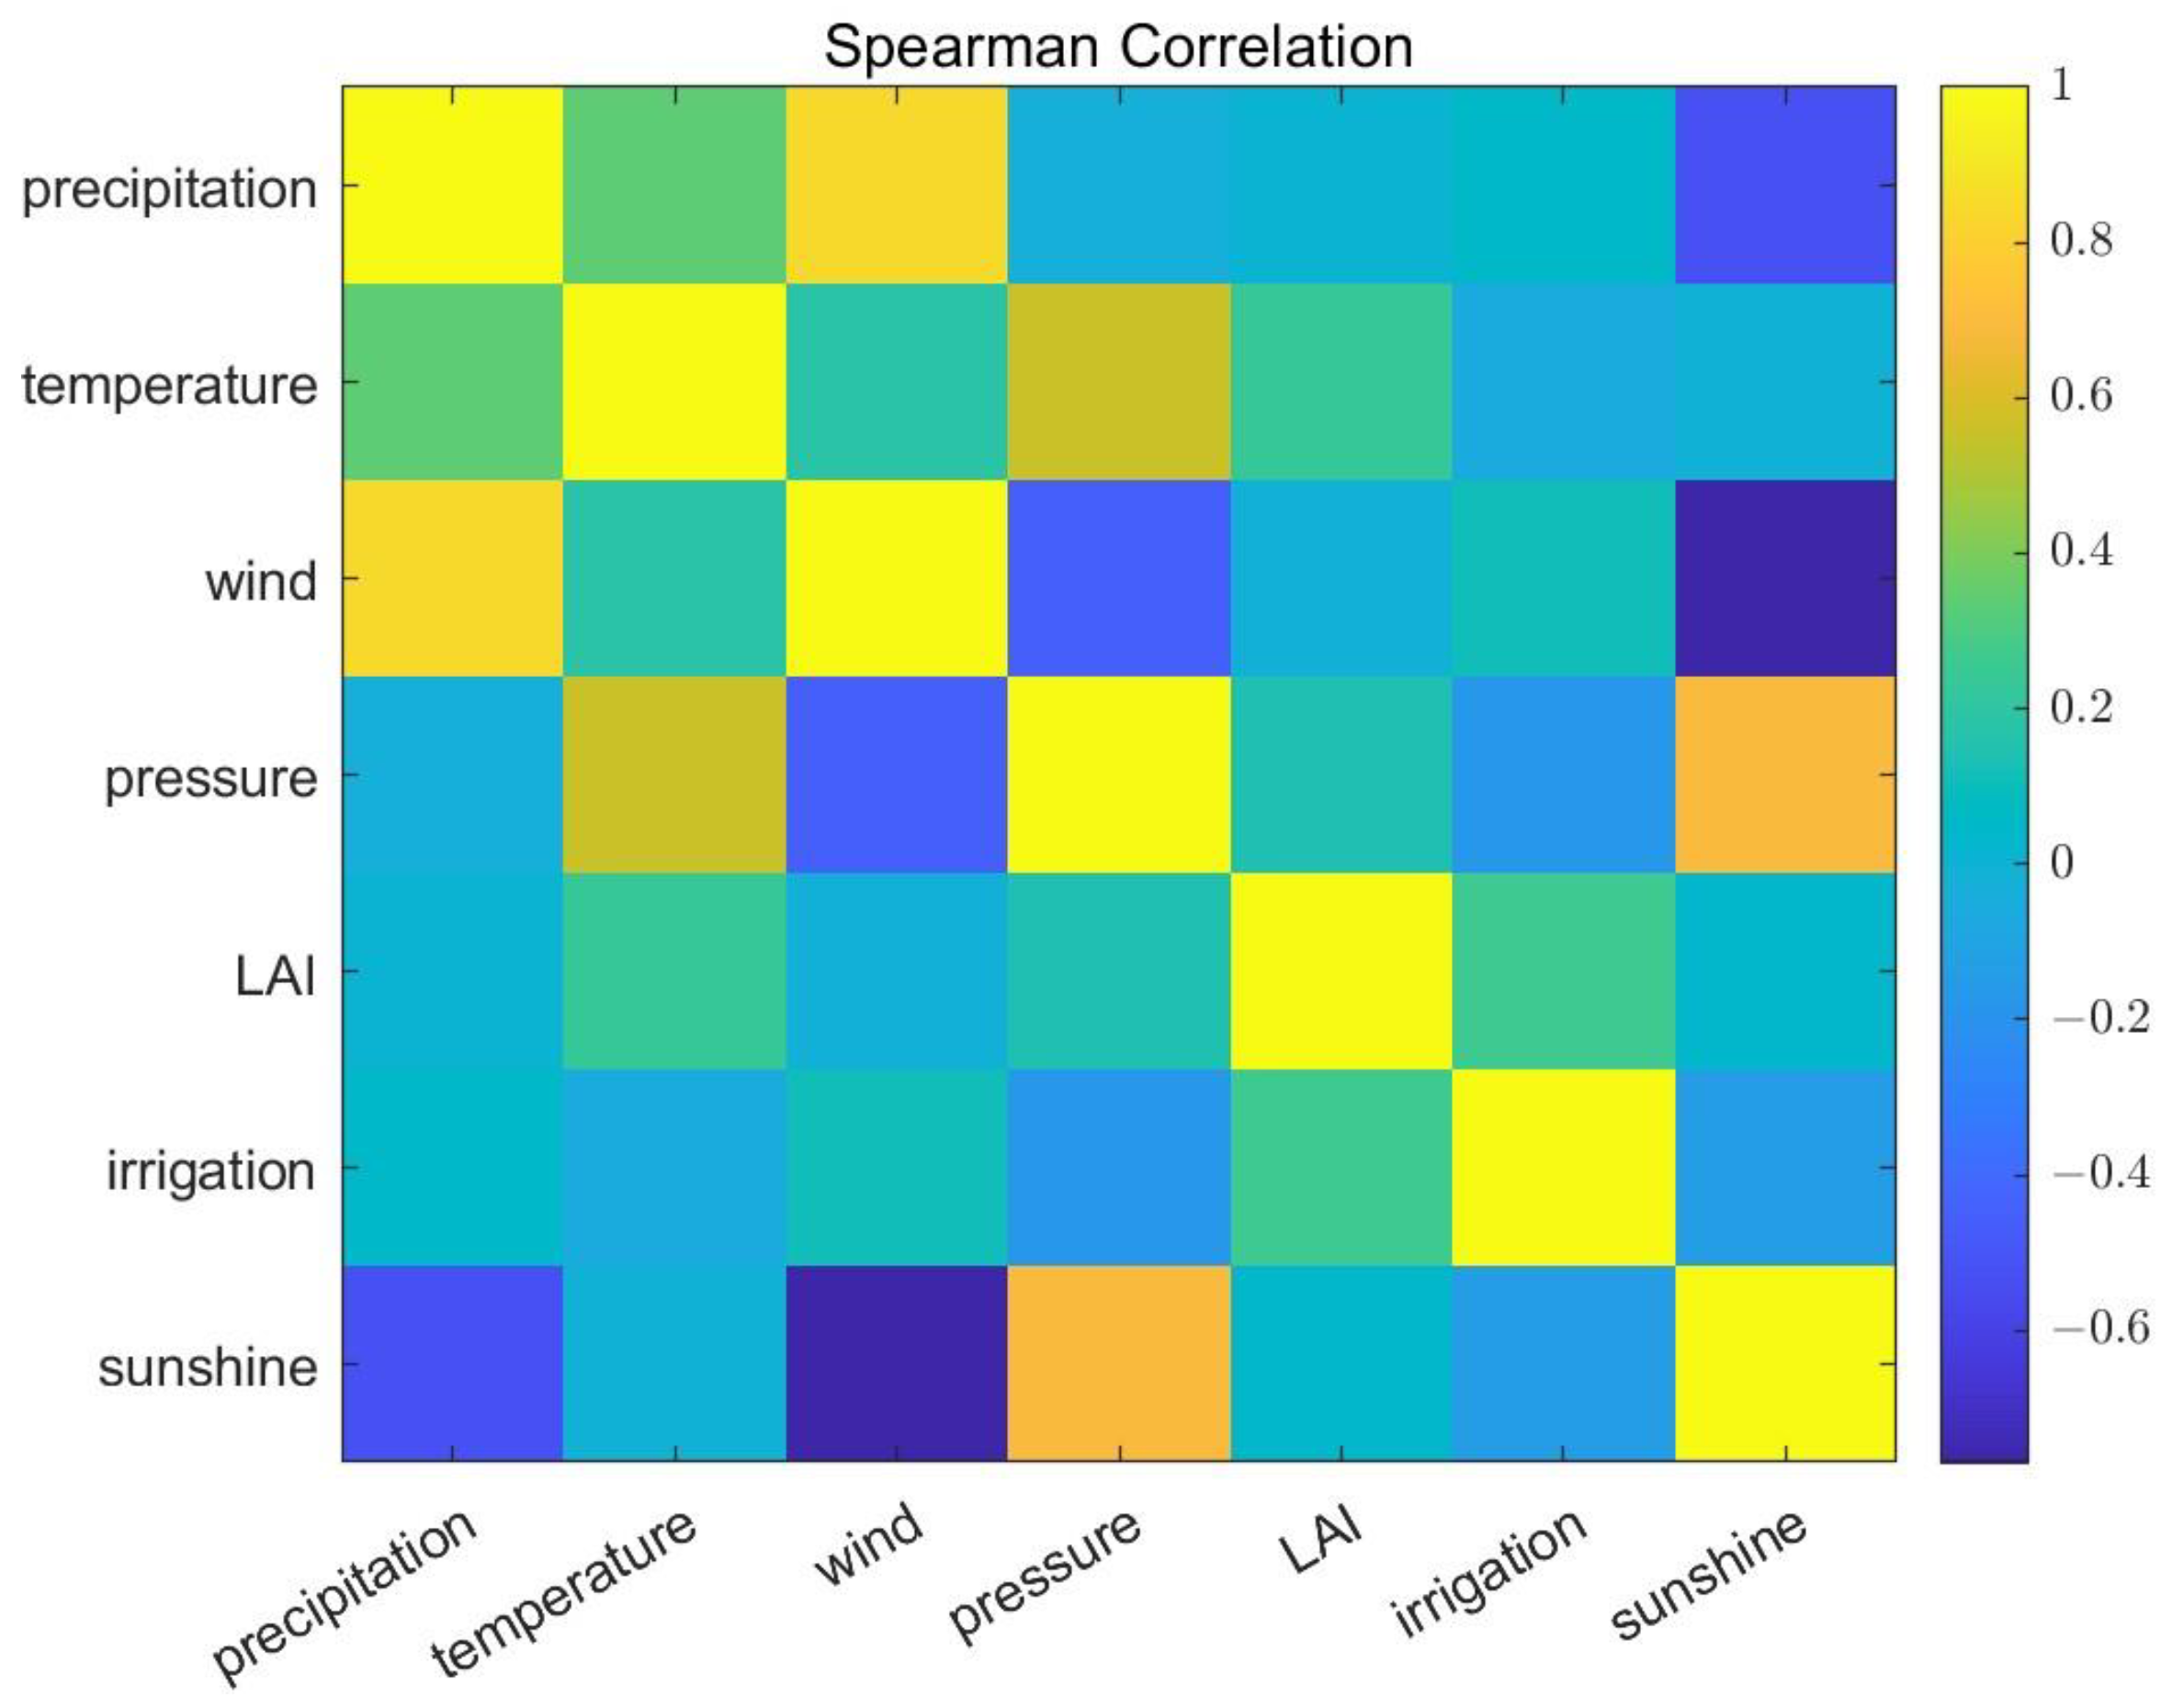
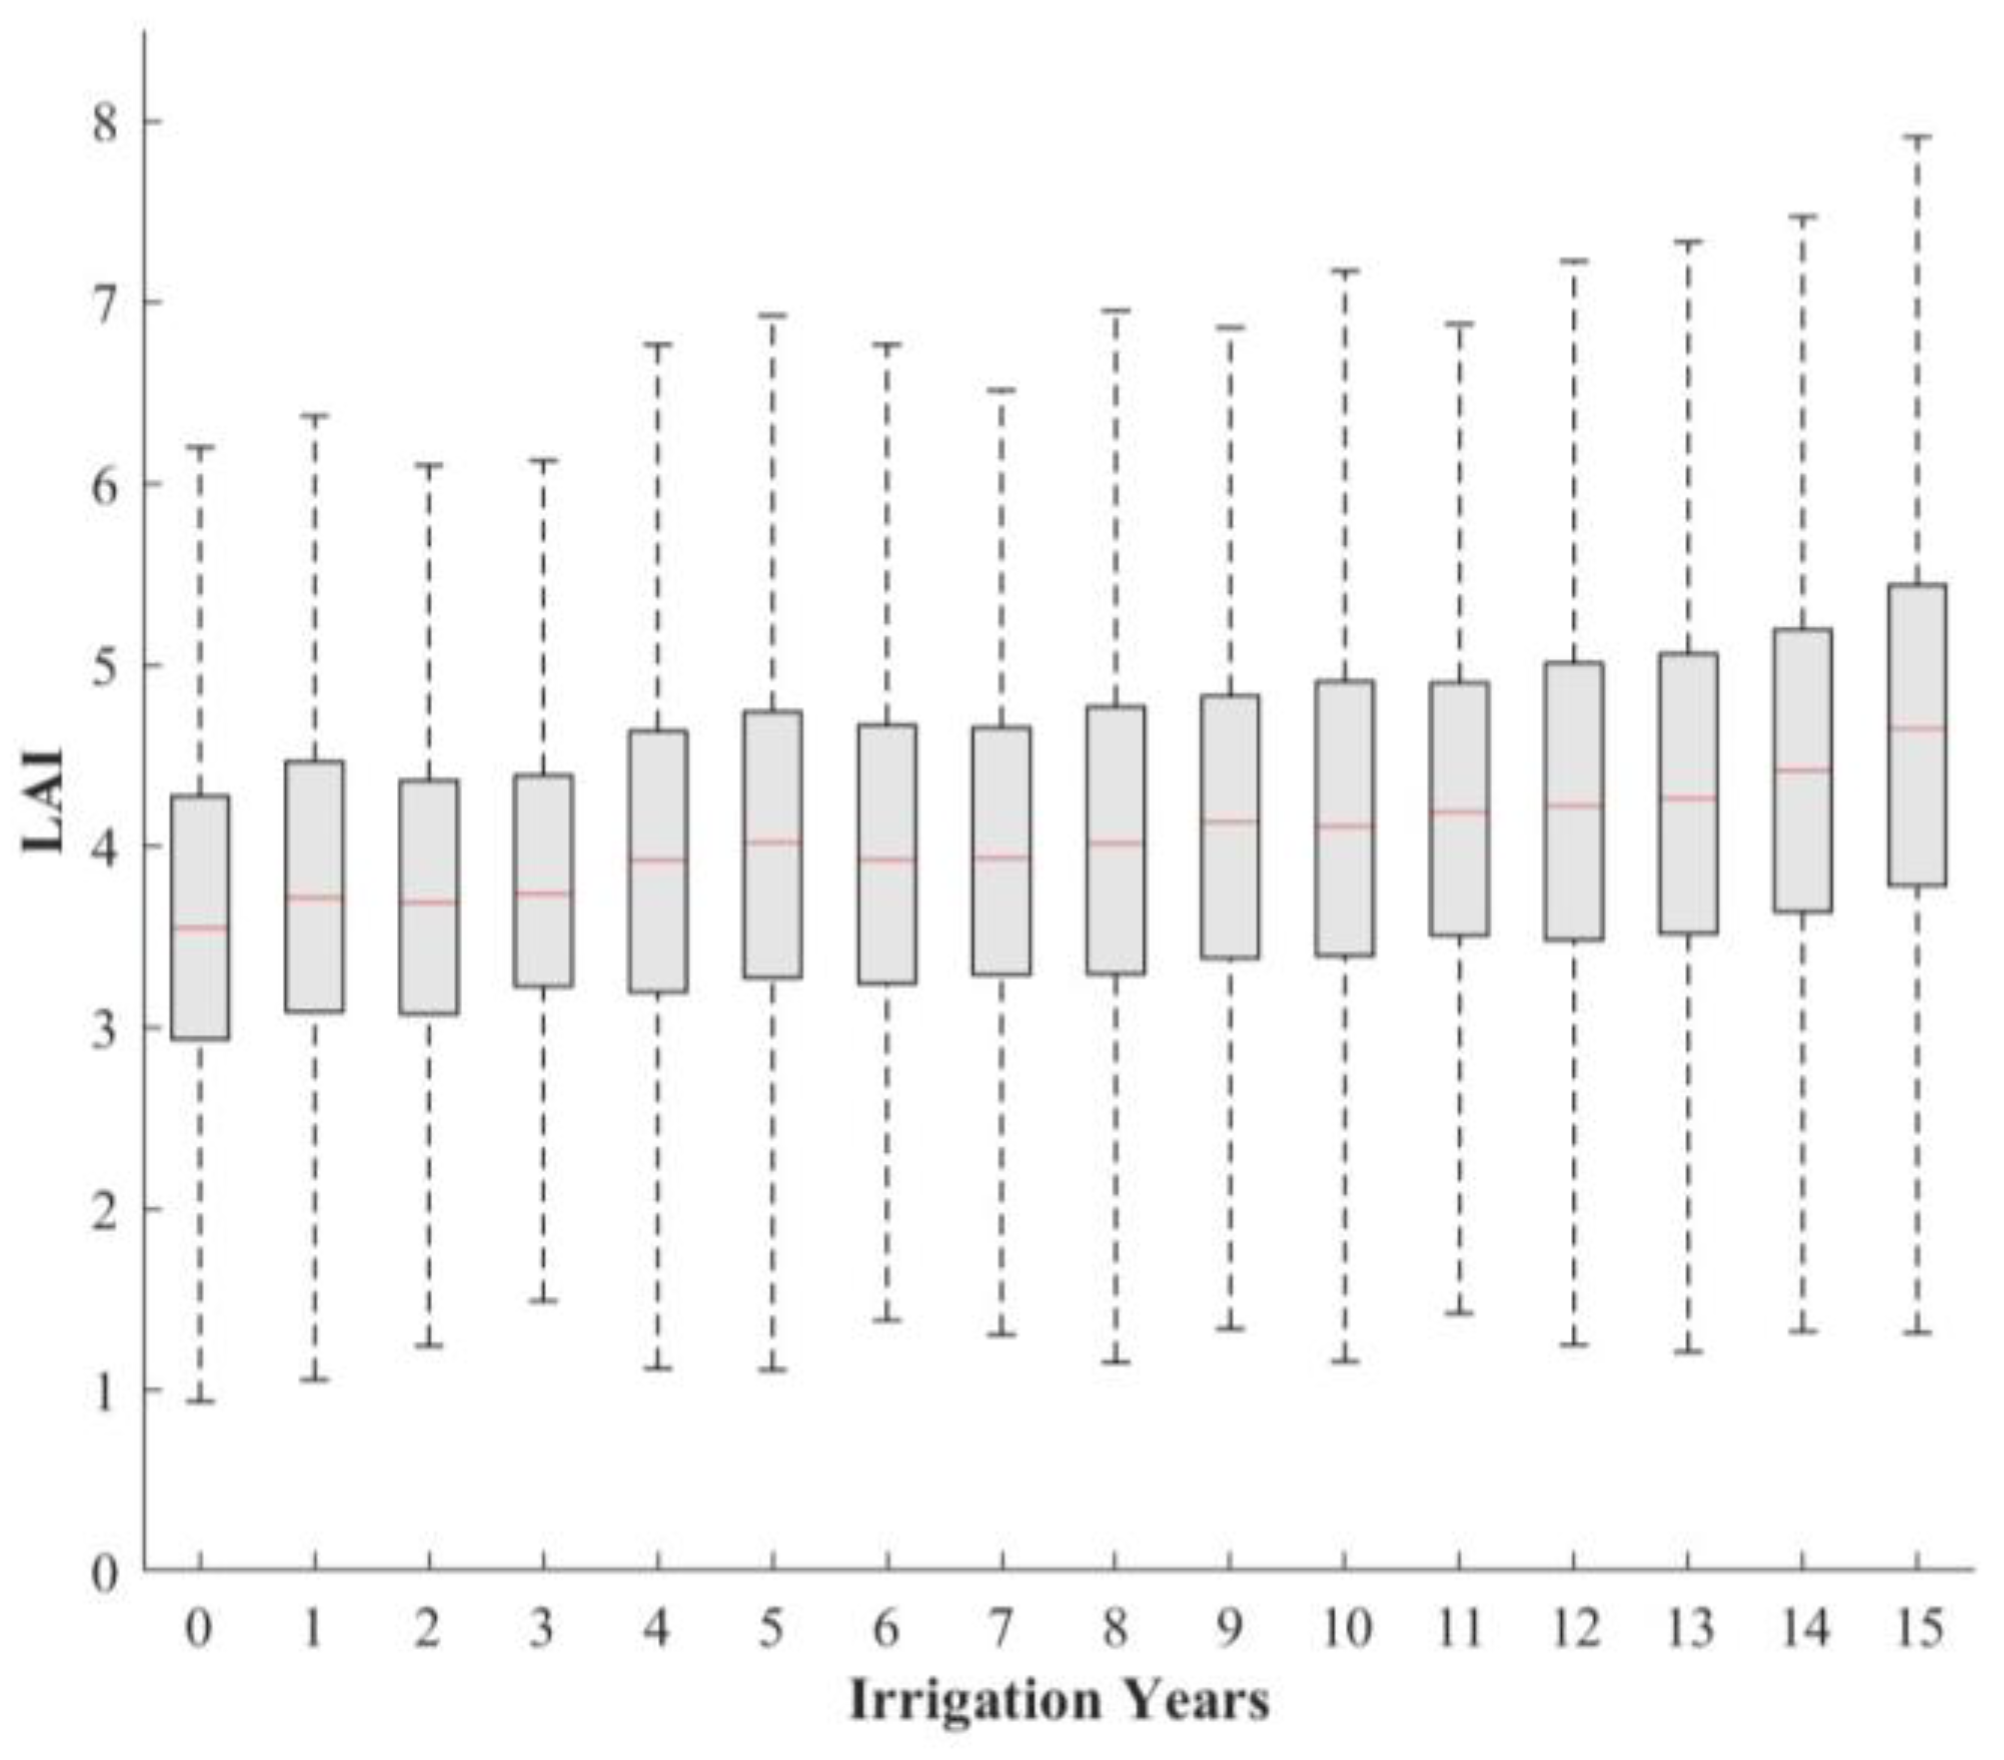
By analyzing the correlations among environmental factors and their corresponding weights in the projection pursuit model, the synergistic effects of these drivers on interannual AET evolution were further elucidated. This analysis was statistically conducted based on all grid cells within the study area. The spearman correlation coefficients between precipitation and wind speed, temperature and air pressure, and air pressure and sunshine duration all exceeded 0.5 (Figure 8). Similar statistical patterns were observed for the MODIS evapotranspiration data, and for brevity, only the results from the PML AET are shown here. However, when considering the optimal projection direction vectors, the underlying synergistic driving mechanisms for both AET datasets diverge slightly. Specifically, for the AET of PML model, both air pressure and sunshine duration showed negative values in the optimal projection direction, indicating a synergistic inhibitory effect on AET. In the optimal projection direction vector for MODIS AET, the positive signs for both temperature and air pressure, air pressure and sunshine duration reveal a slight combined enhancement of AET. Taking into account the magnitudes of the weights in the best projection direction vectors, the synergistic inhibition by air pressure and sunshine duration of PML AET becomes more evident. In contrast, the synergistic effects for the remaining factor groups of MODIS AET remain negligible. In terms of the relationship between factors, the spearman coefficient between irrigation and LAI was relatively high (approximately 0.3), while both factors also exhibited bigger weights within the optimal projection direction vector. Together with LAI, irrigation exhibited a positive correlation AET variation, an effect that was observed in the total AET. Based on the classification of irrigation events across different years, the boxplots of LAI (Figure 9) show a significant stepwise rise in median values as the irrigation frequency increases within the analysis units.

3.4. Effects of Irrigation on AET

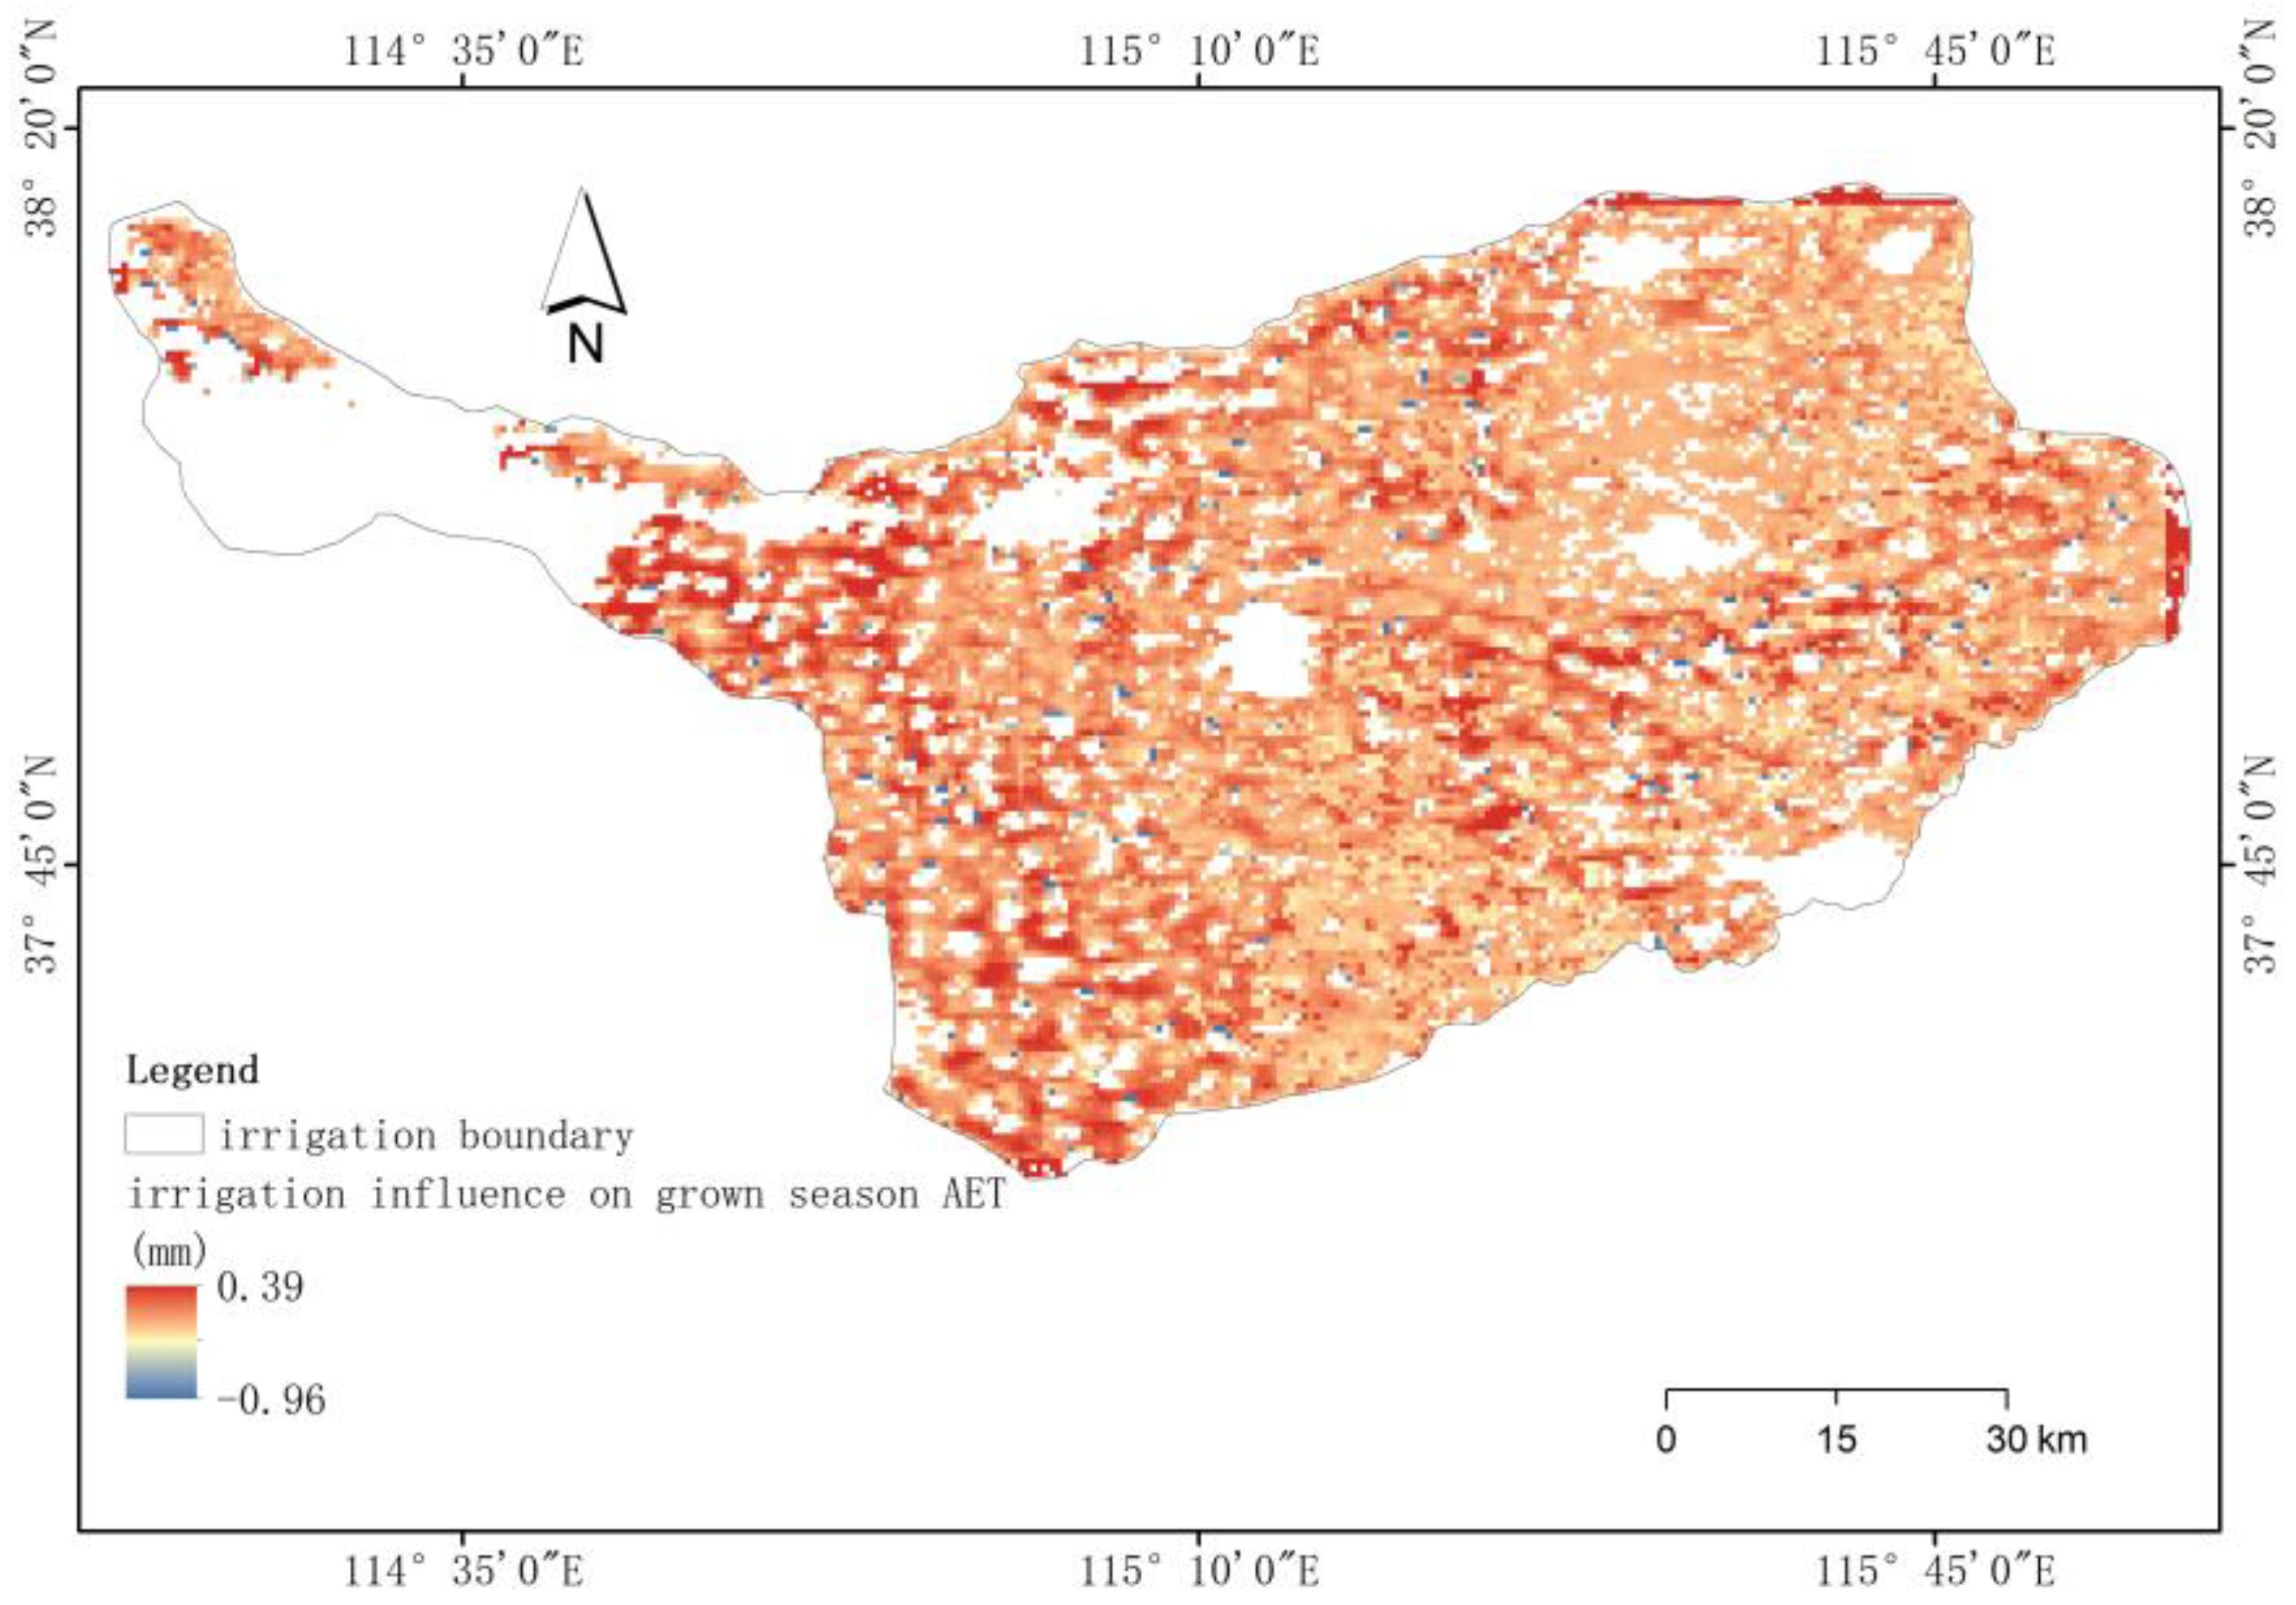
This study quantified the effects of irrigation on AET variations within the persistent cropland areas of the Shijin irrigation district, utilizing dynamic irrigation data products. The analysis indicated that AET (Figure 10) was higher in irrigated areas than in rain-fed areas. Specifically, 72.7% of the cropland in the irrigation district exhibited higher AET rates compared to rain-fed areas, with an average daily AET difference of 0.06 mm/d. This discrepancy showed minimal variation across different soil textures within the district. The primary soil types in the Shijin irrigation district are loam and loamy sand. In loamy areas, the AET of irrigated crops was 0.06 mm/d higher than that of rain-fed crops. In loamy sand areas, this difference was 0.07 mm/d.

4. Discussion

4.1. Spatiotemporal Variation Trend of AET

Based on the AET data products derived from PML_V2 model, this study conducted an analysis of the spatiotemporal variation patterns of actual AET in the Shijin irrigation district. This approach provides a comprehensive characterization of the AET features and their corresponding evolution trends within the study area. The AET in the Shijin irrigation district exhibited dynamic variation trends between 2003 and 2017. The multi-year average AET obtained in this study is consistent with the evaluation results by Yang et al. [31]. This spatial pattern highlights discrepancies in water resource development and utilization across different parts of the study area.
Analysis of transpiration trends showed that certain areas still experienced an upward trend in transpiration, indicating that the reduction in soil evaporation was an important driver of the overall AET decline in these regions. Notably, the observed changes in LAI did not show clear spatial synchronicity with the decline in soil evaporation. A potential explanation is the significant drawdown of the groundwater table caused by groundwater overexploitation in the North China Plain during the study period [32,33], which reduced soil moisture content and consequently inhibited soil evaporation [34]. In summary, these analytical findings provide a crucial scientific basis for water resource management in the Shijin irrigation district. The spatiotemporal variations in AET reveal the profound impact of regional water utilization on the hydrological cycle. In particular, the decline in soil evaporation necessitates a highlighted focus on the influence of groundwater dynamics on water consumption within the district to achieve rational allocation and sustainable utilization of water resources. A thorough understanding of the variation patterns in AET will facilitate the formulation of more precise water management policies, thereby promoting regional sustainable development.

4.2. Analysis of AET Driving Factors

The results of this study indicate that LAI and irrigation are the primary factors influencing total AET in the study area. LAI was identified as the dominant factor affecting both the PML AET and the MODIS AET. This dominance is likely attributable to LAI being a critical parameter in the model, where it serves as the basis for calculating surface conductance [35]. Furthermore, irrigation was one of the dominant environmental drivers for total AET. It provides supplemental water to crops, thereby increasing water uptake and elevating AET at the regional scale [8]. In contrast, the contribution of precipitation to AET variations in the study region was found to be relatively minor, which differs from previous findings in the Yellow River Basin [36]. This discrepancy may be linked to the limitations of our data and optimization approaches, and potentially associated with irrigation patterns and climatic conditions of the study area. The Shijin irrigation district employs a conjunctive irrigation system using both surface water and groundwater. In particular, the accessibility of well irrigation ensures stable water supplementation during the growing season [37]. Conversely, precipitation in this region is highly concentrated, primarily occurring during the summer. This concentration promotes significant runoff rather than sustained soil moisture for transpiration. Such a phenomenon aligns with recent global findings that AET across diverse climates and biomes exhibits a ‘saturation limit’ [38]. Consequently, once this ecohydrological saturation is reached, further increases in precipitation contribute more to water yield than to AET, which may limit its overall impact on AET variations at an annual scale.
Previous studies have indicated that climatic factors are the primary factors influencing AET [39]. However, this study reveals that, in addition to meteorological elements, irrigation exerts a significant impact on AET in the Shijin irrigation district. This is because AET variations in agricultural activities are the result of the synergistic effect between irrigation and various other environmental factors [40]. Moreover, irrigation plays a synergistic role in enhancing LAI while modulating AET processes. Such results provide clear evidence of the promotion of crop development by supplemental irrigation, aligning well with the research conducted by Mo et al. [41]. The findings suggest that when formulating water resource management schemes, it is essential to fully consider the influence of irrigation on water dissipation, rather than focusing solely on meteorological factors. The water consumption patterns of the irrigation district are jointly determined by irrigation practices, changing meteorological conditions, and crop growth requirements. Understanding these relationships is crucial for scientifically assessing future water supply demand dynamics and improving the integrated water use efficiency within irrigation districts.

4.3. Limitations

This study analyzed the evolution and driving forces of AET in the Shijin irrigation district by integrating remote sensing AET products, meteorological data, and irrigation records using projection pursuit method. However, due to the constraints in data availability and other factors, there are several limitations to the preliminary results of this research. First, the analysis period is limited. Owing to constraints in data collection, this study was unable to examine the conditions following the implementation of groundwater overexploitation control in the North China Plain. Supplementary work in this area is urgently needed in the future to facilitate a more comprehensive understanding of the AET evolution patterns in Shijin irrigation district. Second, the analysis and evaluation were conducted solely at the annual scale. Future research should incorporate multi-source AET and irrigation products for a more robust evaluation to further validate and refine the conclusions of this study. It is also necessary to acquire higher-resolution meteorological data to refine the inputs derived from spatial interpolation. Simultaneously, incorporating diversified irrigation area data is crucial, as the choice of different inputs may introduce uncertainties into the model. With the improvement of temporal resolution in datasets, multi-dimensional uncertainty analysis methods, such as sensitivity analysis, and different initialization and optimization algorithms can be employed to further evaluate how projection pursuit model responds to different inputs. Third, this study lacks in-situ AET observations for different crops. Without ground-based validation across various crop types, the study provides a remote sensing based reference for understanding the response of AET to irrigation management. Further efforts will integrate in-situ monitoring to better evaluate how cropping systems respond to irrigation management and to enhance the model’s explanatory regarding to evolution of AET.

5. Conclusions

Based on remote sensing AET products and environmental factor data, this study analyzed the spatiotemporal variations and driving mechanisms of AET in the Shijin irrigation district from 2003 to 2017 using projection pursuit method. Specifically, the impact of agricultural irrigation on AET evolution was examined. The findings transition from data observation to a mechanistic understanding of agricultural systems. The study reveals a slow declining trend in regional AET, primarily reflected in the reduction of soil evaporation in the north-central part of the district.
The agricultural irrigation played an important role in the evolution of AET. The significant AET disparity between irrigated and rain-fed croplands demonstrates that irrigation exhibited a long-term effect on regional AET. Projection pursuit analysis indicates that LAI and irrigation were the dominant factors controlling the evolution of AET in the Shijin irrigation district during the study period. Specifically, irrigation ranked second in terms of contribution, which highlights the necessity of accounting for irrigation induced water fluxes when managing water resources in agricultural zones.
AET is a critical route for water resource consumption in irrigation districts. By integrating projection pursuit method, this study analyzes the mechanisms through which irrigation influences AET, providing significant guidance for water resource allocation within the study area. However, the current study is limited to a specific range of AET products and annual scale evaluation scheme. Future research could implement a comprehensive evaluation based on multi-source irrigation monitoring datasets to achieve a more exhaustive and explanatory analysis of AET variations.

Author Contributions

Conceptualization, H.D.; methodology, H.D.; resources, Y.G.; data curation, Z.Z.; writing—original draft preparation, H.D. and H.Z.; writing—review and editing, T.Q. and H.X. All authors have read and agreed to the published version of the manuscript.

Funding

This research is founded by the National Key Research and Development Program of China (2024YFC3213600), the National Natural Science Foundation of China (52130907).

Institutional Review Board Statement

Not applicable.

Informed Consent Statement

Not applicable.

Data Availability Statement

The MODIS land use products are available from Earth Data (https://code.earthengine.google.com/ (accessed on 19 March 2026)). The PML-V2 datasets is provided by National Tibetan Plateau/Third Pole Environment Data Center (http://data.tpdc.ac.cn (accessed on 28 January 2025)).

Conflicts of Interest

The authors declare no conflicts of interest.

References

  1. Jung, M.; Reichstein, M.; Ciais, P.; Seneviratne, S.I.; Sheffield, J.; Goulden, M.L.; Bonan, G.; Cescatti, A.; Chen, J.; de Jeu, R.; et al. Recent decline in the global land evapotranspiration trend due to limited moisture supply. Nature 2010, 467, 951–954. [Google Scholar] [CrossRef]
  2. Liu, J.; You, Y.; Li, J.; Sitch, S.; Gu, X.; Nabel, J.E.; Lombardozzi, D.; Luo, M.; Feng, X.; Arneth, A.; et al. Response of global land evapotranspiration to climate change, elevated CO2, and land use change. Agric. For. Meteorol. 2021, 311, 108663. [Google Scholar] [CrossRef]
  3. Tran, B.N.; Van Der Kwast, J.; Seyoum, S.; Uijlenhoet, R.; Jewitt, G.; Mul, M. Uncertainty assessment of satellite remote-sensing-based evapotranspiration estimates: A systematic review of methods and gaps. Hydrol. Earth Syst. Sci. 2023, 27, 4505–4528. [Google Scholar] [CrossRef]
  4. Volk, J.M.; Huntington, J.L.; Melton, F.S.; Allen, R.; Anderson, M.; Fisher, J.B.; Kilic, A.; Ruhoff, A.; Senay, G.B.; Minor, B.; et al. Assessing the accuracy of OpenET satellite-based evapotranspiration data to support water resource and land management applications. Nat. Water 2024, 2, 193–205. [Google Scholar] [CrossRef]
  5. Guerschman, J.P.; McVicar, T.R.; Vleeshower, J.; Van Niel, T.G.; Peña-Arancibia, J.L.; Chen, Y. Estimating actual evapotranspiration at field-to-continent scales by calibrating the CMRSET algorithm with MODIS, VIIRS, Landsat and Sentinel-2 data. J. Hydrol. 2022, 605, 127318. [Google Scholar] [CrossRef]
  6. Grossiord, C.; Buckley, T.N.; Cernusak, L.A.; Novick, K.A.; Poulter, B.; Siegwolf, R.T.W.; Sperry, J.S.; McDowell, N.G. Plant responses to rising vapor pressure deficit. New Phytol. 2020, 226, 1550–1566. [Google Scholar] [CrossRef]
  7. Laluet, P.; Corbari, C.; Baez-Villanueva, O.; Walther, S.; Zhang, Y.; Muñoz-Sabater, J.; Albergel, C.; Dorigo, W. Assessing the suitability of global evapotranspiration products over irrigated areas. Hydrol. Earth Syst. Sci. 2026, 30, 1779–1799. [Google Scholar] [CrossRef]
  8. Dari, J.; Quintana-Seguí, P.; Barella-Ortiz, A.; Rahmati, M.; Saltalippi, C.; Flammini, A.; Brocca, L. Quantifying the hydrological impacts of irrigation on a Mediterranean agricultural context through explicit satellite-derived irrigation estimates. Water Resour. Res. 2024, 60, e2023WR036510. [Google Scholar] [CrossRef]
  9. Shadmehri Toosi, A.; Batelaan, O.; Shanafield, M.; Guan, H. Uncovering evapotranspiration patterns in the Murray Darling Basin over two decades. J. Hydrol. Reg. Stud. 2025, 61, 102675. [Google Scholar] [CrossRef]
  10. Liu, Z.; Chen, H.; Huo, Z.; Wang, F.; Shock, C.C. Analysis of the contribution of groundwater to evapotranspiration in an arid irrigation district with shallow water table. Agric. Water Manag. 2016, 171, 131–141. [Google Scholar] [CrossRef]
  11. Jansen, F.A.; Jongen, H.J.; Jacobs, C.M.; Bosveld, F.C.; Buzacott, A.J.; Heusinkveld, B.G.; Kruijt, B.; van der Molen, M.; Moors, E.; Steeneveld, G.; et al. Land cover control on the drivers of evaporation and sensible heat fluxes: An observation-based synthesis for the Netherlands. Water Resour. Res. 2023, 59, e2022WR034361. [Google Scholar] [CrossRef]
  12. Cheng, W.; Xi, H.; Celestin, S. Application of geodetector in sensitivity analysis of reference crop evapotranspiration spatial changes in Northwest China. Sci. Cold Arid Reg. 2021, 13, 314–325. [Google Scholar]
  13. Bashir, R.N.; Mzoughi, O.; Shahid, M.A.; Alturki, N.; Saidani, O. Principal Component Analysis (PCA) and feature importance-based dimension reduction for Reference Evapotranspiration (ET0) predictions of Taif, Saudi Arabia. Comput. Electron. Agr. 2024, 222, 109036. [Google Scholar] [CrossRef]
  14. Zi, S.; Li, Y.; Zhang, J.; Hou, C.; Lin, H.; Xu, Z.; Sang, S.; Dong, J.; Fu, B. The biophysical and crop yield effects of irrigation and their changes in China’s drylands. Agric. Water Manag. 2025, 313, 109471. [Google Scholar] [CrossRef]
  15. Renner, M.; Hauffe, C. Impacts of climate and land surface change on catchment evapotranspiration and runoff from 1951 to 2020 in Saxony, Germany. Hydrol. Earth Syst. Sci. 2024, 28, 2849–2869. [Google Scholar] [CrossRef]
  16. Friedman, J.H.; Tukey, J.W. A Projection Pursuit Algorithm for Exploratory Data Analysis. IEEE Trans. Comput. 1974, C-23, 881–890. [Google Scholar] [CrossRef]
  17. An, H.; Yang, W.; Huang, J.; Huang, A.; Wan, Z.; An, M. Identify and Assess Hydropower Project’s Multidimensional Social Impacts with Rough Set and Projection Pursuit Model. Complexity 2020, 2020, 9394639. [Google Scholar] [CrossRef]
  18. Wang, Y.; Wu, P.; Zhao, X.; Jin, J. Projection pursuit evaluation model: Optimizing scheme of crop planning for agricultural sustainable development and soil resources utilization. Clean Soil Air Water 2012, 40, 592–598. [Google Scholar] [CrossRef]
  19. Gan, T.Y.; Kalinga, O.; Singh, P. Comparison of snow water equivalent retrieved from SSM/I passive microwave data using artificial neural network, projection pursuit and nonlinear regressions. Remote Sens. Environ. 2009, 113, 919–927. [Google Scholar] [CrossRef]
  20. Hong, S.; Jiao, F.; Kuang, N.; Liu, C.; Ma, Y.; Li, Q. Simulating the effects of irrigation and tillage on soil water, evapotranspiration, and yield of winter wheat with RZWQM2. Soil Till. Res. 2021, 214, 105170. [Google Scholar] [CrossRef]
  21. Liu, X.; Yan, Z.; Shen, Y.J.; Min, L.; Wang, S.; Shen, Y.; Guo, Y. Quantifying the effects of irrigation schedule on groundwater level variability using a linked APSIM-MODFLOW model framework. Agric. Water Manag. 2025, 316, 109610. [Google Scholar] [CrossRef]
  22. Zhang, C.; Dong, J.; Zuo, L.; Ge, Q. Tracking spatiotemporal dynamics of irrigated croplands in China from 2000 to 2019 through the synergy of remote sensing, statistics, and historical irrigation datasets. Agric. Water Manag. 2022, 263, 107458. [Google Scholar] [CrossRef]
  23. Zhang, Y.; He, S. PML-V2 (China): Evapotranspiration and Gross Primary Production Dataset(2000.02.26–2020.12.31); National Tibetan Plateau/Third Pole Environment Data Center: Beijing, China, 2022. [Google Scholar]
  24. He, S.; Zhang, Y.; Ma, N.; Tian, J.; Kong, D.; Liu, C. A daily and 500 m coupled evapotranspiration and gross primary production product across China during 2000–2020. Earth Syst. Sci. Data 2022, 14, 5463–5488. [Google Scholar] [CrossRef]
  25. Zhang, Y.; Kong, D.; Gan, R.; Chiew, F.H.S.; McVicar, T.R.; Zhang, Q.; Yang, Y. Coupled estimation of 500m and 8-day resolution global evapotranspiration and gross primary production in 2002–2017. Remote Sens. Environ. 2019, 222, 165–182. [Google Scholar] [CrossRef]
  26. Zhang, Y.; Peña-Arancibia, J.L.; McVicar, T.R.; Chiew, F.H.S.; Vaze, J.; Liu, C.; Lu, X.; Zheng, H.; Wang, Y.; Liu, Y.Y.; et al. Multi-decadal trends in global terrestrial evapotranspiration and its components. Sci. Rep. 2016, 6, 19124. [Google Scholar] [CrossRef]
  27. Gui, Y.; Wang, Q.; Zhao, Y.; Dong, Y.; Li, H.; Jiang, S.; He, X.; Liu, K. Attribution analyses of reference evapotranspiration changes in China incorporating surface resistance change response to elevated CO2. J. Hydrol. 2021, 599, 126387. [Google Scholar] [CrossRef]
  28. Guan, Q.; Jin, C.; Gong, L.; Tian, J.; Zhou, Y. Application of improved projection pursuit model in water transport pollution assessment of the Gansu Section of the Yellow River Basin. Water Resour. Hydropower Eng. 2023, 54, 133–142, (In Chinese with English abstract). [Google Scholar] [CrossRef]
  29. Liu, W.; Tang, R.; Zhang, G.; Xue, J.; Xue, B.; Wang, Y. Spatiotemporal changes in evapotranspiration and its influencing factors in the jiziwan region of the yellow river from 1982 to 2018. Remote Sens. 2025, 17, 252. [Google Scholar] [CrossRef]
  30. Xie, Z.; Yao, Y.; Tang, Q.; Liu, M.; Fisher, J.B.; Chen, J.; Zhang, X.; Jia, K.; Li, Y.; Shang, K.; et al. Evaluation of seven satellite-based and two reanalysis global terrestrial evapotranspiration products. J. Hydrol. 2024, 630, 130649. [Google Scholar] [CrossRef]
  31. Yang, X.; Zhang, J.; Bao, Z.; Wang, G.; Guan, X.; Liu, C.; Jin, J. Temporal and spatial distribution characteristics of evapotranspiration in the Huang-Huai-Hai River basin. Hydro-Sci. Eng. 2022, 44, 12–22, (In Chinese with English abstract). [Google Scholar]
  32. Zhao, Y.; Wu, C.; Liu, R.; Ma, M.; Lu, C. Evolution patterns, protection, and restoration of deep confined aquifer in the North China Plain. China Water Resour. 2026, 2, 19–28, (In Chinese with English abstract). [Google Scholar] [CrossRef]
  33. Ali, S.; Ran, J.; Luan, Y.; Khorrami, B.; Xiao, Y.; Tangdamrongsub, N. The GWR model-based regional downscaling of GRACE/GRACE-FO derived groundwater storage to investigate local-scale variations in the North China Plain. Sci. Total Environ. 2024, 908, 168239. [Google Scholar] [CrossRef] [PubMed]
  34. Iden, S.C.; Blöcher, J.R.; Diamantopoulos, E.; Durner, W. Capillary, film, and vapor flow in transient bare soil evaporation (1): Identifiability analysis of hydraulic conductivity in the medium to dry moisture range. Water Resour. Res. 2021, 57, e2020WR028513. [Google Scholar] [CrossRef]
  35. Liang, T.; Li, C.; He, Y.; Tan, J.; Niu, W.; Cui, Y.; Yang, H. PML_30: A high resolution (30 m) estimates of evapotranspiration based on remote sensing model with application in an arid region. J. Hydrol. 2024, 642, 131862. [Google Scholar] [CrossRef]
  36. Liu, Y.; Lin, Z.; Wang, Z.; Chen, X.; Han, P.; Wang, B.; Wang, Z.; Wen, Z.; Shi, H.; Zhang, Z.; et al. Discriminating the impacts of vegetation greening and climate change on the changes in evapotranspiration and transpiration fraction over the Yellow River Basin. Sci. Total Environ. 2023, 904, 166926. [Google Scholar] [CrossRef] [PubMed]
  37. Cheng, Y.; Yan, Z.; Jiang, Y.; Yan, D.; Liu, M.; Wu, C.; Wang, K.; Wei, R. Enhancing drought resilience in combined surface water and groundwater supply areas with a hedging policy triggered by drought-limited water level. J. Water Resour. Plan. Manag. 2025, 151, 04025057. [Google Scholar] [CrossRef]
  38. Rotenberg, E.; Tatarinov, F.; Muller, J.D.; Yakir, D. Evapotranspiration saturation amplifies climate sensitivity of terrestrial water yield. Nat. Commun. 2025, 16, 11577. [Google Scholar] [CrossRef]
  39. Li, X.; Pang, Z.; Xue, F.; Ding, J.; Wang, J.; Xu, T.; Xu, Z.; Ma, Y.; Zhang, Y.; Shi, J. Analysis of spatial and temporal variations in evapotranspiration and its driving factors based on multi-source remote sensing data: A case study of the Heihe river basin. Remote Sens. 2024, 16, 2696. [Google Scholar] [CrossRef]
  40. Lioubimtseva, E. Impact of Climate Change on the Aral Sea and Its Basin. In The Aral Sea; Springer Earth System Sciences; Micklin, P., Aladin, N., Plotnikov, I., Eds.; Springer: Berlin/Heidelberg, Germany, 2014; Volume 10178. [Google Scholar]
  41. Mo, X.; Liu, S.; Lin, Z.; Xu, Y.; Xiang, Y.; McVicar, T. Prediction of crop yield, water consumption and water use efficiency with a SVAT-crop growth model using remotely sensed data on the North China Plain. Ecol. Model. 2005, 183, 301–322. [Google Scholar] [CrossRef]
Figure 1. Overview of the Shijin irrigation district.
Atmosphere 17 00540 g001
Figure 2. Actual evapotranspiration (AET) variation of Shijin irrigation area from 2003 to 2017.
Atmosphere 17 00540 g002
Figure 3. Spatial distribution of multi-year actual evapotranspiration (AET) in Shijin irrigation area from 2003 to 2017.
Atmosphere 17 00540 g003
Figure 4. Spatial variation trends and M-K tests of PML AET components in Shijin irrigation district: (a) trend of actual evapotranspiration (AET) and (b) its M-K test; (c) trend of vegetation transpiration and (d) its M-K test; (e) trend of soil evaporation and (f) its M-K test.
Atmosphere 17 00540 g004aAtmosphere 17 00540 g004b
Figure 5. Sankey plot of irrigation and crop land transfer for 2003–2017 in Shijin irrigation area. The irrigation area was divided into irrigated cropland, rain-fed cropland and non-cropland, which are distinguished by different colors. The year following the category indicates the area of that land type in that specific year.
Atmosphere 17 00540 g005
Figure 6. Yearly actual evapotranspiration (AET) changes for different irrigation condition and land use.
Atmosphere 17 00540 g006
Figure 7. Evaluation of contribution ranking of actual evapotranspiration (AET) of PML and MODIS datasets in Shijin irrigation area.
Atmosphere 17 00540 g007
Figure 8. Spearman correlation map of different environmental variables.
Atmosphere 17 00540 g008
Figure 9. Leaf Area Index (LAI) variation under different irrigation levels in the study area. The horizontal line with each box represents the median value of LAI, which increases from 3.5 to 4.6 as the number of irrigation years grows. The box boundaries denote the interquartile range.
Atmosphere 17 00540 g009
Figure 10. Spatial pattern of irrigation influence on actual evapotranspiration (AET).
Atmosphere 17 00540 g010
Disclaimer/Publisher’s Note: The statements, opinions and data contained in all publications are solely those of the individual author(s) and contributor(s) and not of MDPI and/or the editor(s). MDPI and/or the editor(s) disclaim responsibility for any injury to people or property resulting from any ideas, methods, instructions or products referred to in the content.