Article

Air Quality and Emergency Department Visits for Pediatric Respiratory Outcomes in Fresno County, California, USA


1
Department of Public Health, School of Social Sciences, Humanities and Arts, University of California, Merced, Merced, CA 95343, USA
2
Department of Life and Environmental Sciences, School of Engineering, University of California, Merced, Merced, CA 95343, USA
3
Central California Asthma Collaborative, Fresno, CA 93727, USA
4
Division of Epidemiology, Surveillance, & Data Management, Fresno County Department of Public Health, Fresno, CA 93721, USA
5
Valley Children’s Hospital, Madera, CA 93636, USA
6
Stockton Unified School District, Stockton, CA 95206, USA
7
Health Sciences Research Institute, University of California, Merced, Merced, CA 95343, USA
8
Valley Improvement Projects, Modesto, CA 95352, USA
*
Author to whom correspondence should be addressed.
Atmosphere 2026, 17(6), 534; https://doi.org/10.3390/atmos17060534
Submission received: 9 December 2025 / Revised: 15 May 2026 / Accepted: 20 May 2026 / Published: 22 May 2026
(This article belongs to the Section Air Quality and Health)

Abstract

Air quality in the San Joaquin Valley (SJV) ranks among the worst in the US. Exposures to traffic-related air pollutants have been associated with pediatric health complications, and few studies have investigated respiratory complications in relation to short-term exposures to PM less than 2.5 microns in diameter (PM2.5) in the SJV. We used Bayesian Poisson spatiotemporal conditional autoregressive models to analyze the association between PM2.5 and pediatric respiratory emergency department (ED) visits in Fresno County, California. Additional analyses stratified respiratory outcomes by sex and age group. Weekly ambient PM2.5 levels were estimated for each zip code using community science and regulatory air monitors. Weekly residential zip code counts of respiratory ED visits were provided by Fresno County Department of Public Health and Valley Children’s Hospital from 2 April 2022 to 31 December 2024. A ten-fold increase in PM2.5 was associated with increased asthma ED visits among females (Relative Risk (RR):1.15; 95% Credible Interval (CrI):1.01, 1.32) and children aged 0 to 4 (RR:1.18; 95% CrI:1.03, 1.34) and other chronic respiratory conditions among males (RR:1.93; 95% CrI:1.19, 3.16) and ages 10 to 14 (RR:2.90; 95% CrI:1.32, 6.30). Findings suggest that efforts to better assess and reduce pollution exposures will improve public health in the SJV.

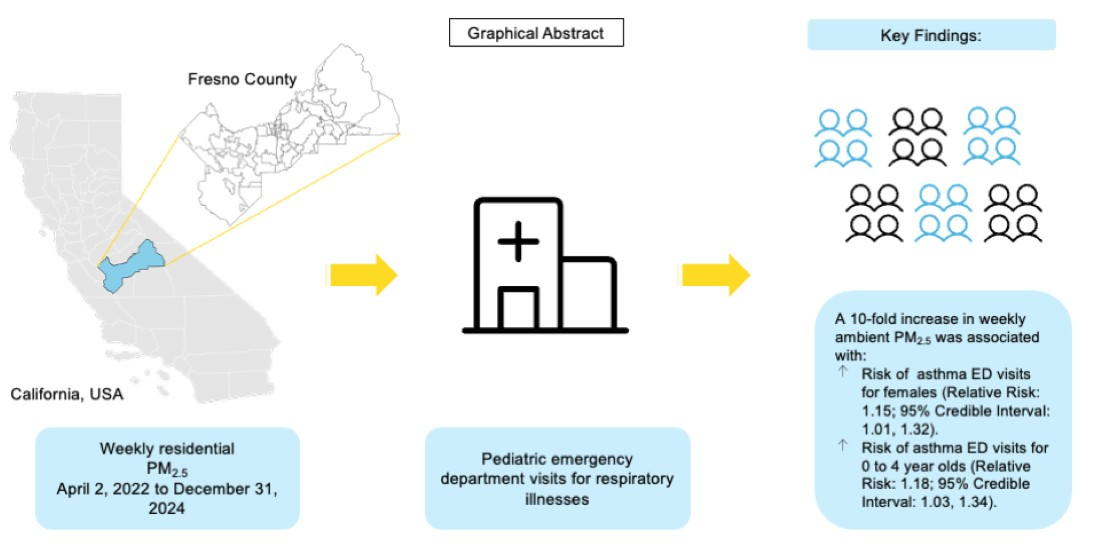
Graphical Abstract

1. Introduction

The San Joaquin Valley (SJV), California, experiences elevated air pollutant levels and has historically failed to meet California and United States (U.S.) Environmental Protection Agency’s (EPA) standards for particulate matter 2.5 (PM2.5) [1]. PM2.5 is fine particulate matter consisting of particles with an aerodynamic diameter of 2.5 micrometers or smaller [1]. The topography and meteorology of the valley, including surrounding high mountains, combined with intensive agriculture production, industry, and heavily trafficked interstate (I-5) and state (CA-99) highway transportation corridors, create ideal conditions for air pollution formation and retention [2,3].
Previous research has reported an association between increased air pollution exposure and adverse respiratory outcomes, especially asthma [4,5,6,7,8]. Asthma, a chronic disease that inflames and narrows the airways of the lungs, may cause episodes of wheezing, breathlessness, chest tightness, nighttime or early morning coughing, and in severe cases, death [9,10]. Increased air pollutant exposure to individuals with pre-existing respiratory conditions can exacerbate symptoms and may result in hospital emergency department (ED) visits [11].
Extensive research supports the relationship between exposure to air pollutants and increased ED visits for individuals with asthma [12,13,14,15]. In Los Angeles County, Delamater et al. (2012) evaluated the relationship between asthma hospitalizations, levels of ambient air pollution, and weather conditions and observed a positive and significant association between PM2.5 and asthma morbidity [16]. Strickland et al. (2016) reported an association between a 10 μg/m3 increase in same-day PM2.5 concentrations and odds of 1.013 and 1.015 for pediatric ED hospital visits for asthma or wheezing and upper respiratory infections, respectively, in Georgia, U.S. [17]. For rare events, these increases reflect an increase of approximately 1%. Findings from Ahanti et al. (2016) indicate a greater susceptibility in school-aged children (5–18 years) for asthma exacerbation in response to air pollution [18]. A systematic review and meta-analysis conducted by Lim et al. (2016) evaluated 26 studies and found that a 10 μg/m3 increase in short-term PM2.5 exposure was associated with a 4.8% increase in the risk of asthma-related hospital admissions or ED visits among children [19].
In the U.S., regulatory air quality monitors are often sparsely located; for example, the U.S. EPA has reported that only one-third of U.S. counties have air monitoring data based on regulatory air monitoring equipment [20]. Higher quality low-cost air monitors have recently been developed and deployed across the U.S. Low-cost air quality monitors allow increased availability and accessibility to real-time air quality information for individuals or citizen scientists to monitor and measure the air quality where they spend time [21]. Furthermore, low-cost air quality sensors provide information about locations away from regulatory air quality monitors, thereby increasing data quality.
Spatial analyses may provide a fuller assessment of the effects of air quality and ED visits by accounting for regional variation in ED visits [22,23,24]. In this study, we spatiotemporally linked air pollution information from community-scientist and regulatory air monitors with ED visit information from the Fresno County Department of Public Health (FCDPH) and Valley Children’s Hospital (VCH) to investigate the association between zip-code level weekly PM2.5 exposure and pediatric ED visits for respiratory illnesses in Fresno County, California between 2 April 2022 and 31 December 2024.

2. Materials and Methods

2.1. Study Population

The study area encompassed Fresno County in the central SJV (Supplementary Figure S1). As of 2024, the county population is 1,024,125. Overall, 55% of the population is Hispanic or Latino compared to 40% in California. The median annual household income is $74,201, more than $20,000 less than California as a whole ($99,122). Furthermore, 18% of the population in the county lives below the federal poverty level, as defined by the U.S. Census Bureau income thresholds that vary by family size and composition, compared to 12% in the overall California population [25].

2.2. PM2.5 Short-Term Exposure

Regional PM2.5 concentration data was obtained from the San Joaquin Valley Center for Air Injustice Reduction (SJV-CAIR) and regulatory monitors. The SJV-CAIR is a community-university partnership that includes community members, university researchers, local health departments, and environmental agencies. SJV-CAIR deployed a network of low-cost air quality monitors across the SJV to augment community-science air monitoring in the region. Details of the data acquisition, quality assurance and quality control procedures, including intra- and inter-sensor comparisons, and use of collocated monitors to generate correction equations, are described elsewhere [21]. Briefly, to establish full coverage of zip codes in Fresno County, we worked with community members to install low-cost PM air sensors (PurpleAir, Inc., Bluffdale, UT, USA) across a uniform grid for each zip code. After the placement of the PurpleAir (PA-II) devices, every zip code in Fresno County contained at least one air quality monitor. All air quality data used for this study are publicly available [26].
Daily PM2.5 data were downloaded and weekly averages at the zip code level were calculated to align with the zip code level ED visit information. Average weekly residential zip code level concentrations were calculated using the following possible scenarios, in the specified order, to ensure accurate data and to account for rare instances of Wi-Fi disconnections or power outages from the PA-II devices: (1) if a zip code contained one regulatory monitor, that regulatory data was used; (2) if a zip code contained two or more low-cost sensors, the median of the weekly sensor averages was calculated; (3) if there were no weekly sensor averages observed in a zip code, the median value was calculated from the weekly averages of all monitors within a 5 km radius from its centroid; and (4) if there were no weekly sensor averages observed within a 5 km radius, the median value from the weekly averages was calculated from PA-II and regulatory monitors within a 10 km radius of the zip code centroid. Lastly, if there were no monitors in a 10 km radius, then we identified all monitors within a 15 km or greater radius from the centroid of the zip code and took the median. Less than 5% of zip codes required distances ≥ 15 km, and these were primarily large rural zip codes where monitors were sparse and located far from population centers. The centroid was defined as the geographic center of the zip code based on latitude and longitude. To reduce the impact of outliers, we added 1 to all values (to avoid taking the log of 0) and then applied a base-10 logarithmic transformation to PM2.5 levels (Supplementary Figure S2).

2.3. Health Outcome Information

Respiratory outcomes were identified based on International Classification of Disease codes, 10th version (ICD-10) from two sources: local syndromic surveillance data provided by the FCDPH and ED visit data provided by VCH. These datasets were mutually exclusive to prevent double counting of respiratory outcomes. Syndromic surveillance data refers to information such as symptoms and demographics collected in real time from local EDs and transmitted to city or county public health departments [27]. ED visit data from VCH was included because it is Central California’s only pediatric hospital which serves as a major tertiary referral center for a 13-county region with a catchment of approximately 1.3 million children, including Fresno County. De-identified diagnostic codes, basic demographics, and residential zip codes were provided from FCDPH and VCH. ICD-10 discharge codes were used to identify specific ED visits that involved respiratory infections (J00-J06, J09-J18, and J20-J22), asthma (J45), and other chronic respiratory conditions (J40-J44, J46-J47, and J60-J70). Supplementary Information S1 provides ICD-10 codes definitions. For each parent diagnostic code, all sub-codes were selected. The ICD-10 codes corresponded to both primary and secondary diagnostic codes. Cases were restricted to patients who reside in one of the 46 residential zip codes in Fresno County. The ED data included 68,741 respiratory visits from FCDPH and VCH in Fresno County. The ED visit data were first aggregated as the total number of visits for each respiratory outcome by zip code and week number. Additionally, we aggregated each respiratory outcome by age group (0–4, 5–9, 10–14, and 15–17 years) and sex (male and female), again at the week and zip code level.

2.4. Covariates

Given evidence suggesting that temperature and season influence both PM2.5 and respiratory health outcomes, we also included weekly temperature and an indicator for the cold season [28,29]. Cold season was defined as week 1 through 13 and week 45 through 52 (1 January through 1 April and 5 November through 31 December) compared with warm season, which was defined as week 14 through 44 (2 April through 4 November). Furthermore, we utilized the 2022 5-year U.S. American Community Survey (ACS) to account for zip code-specific child population in the analysis [30]. The ACS estimates included in the analysis were zip code-level total number of children, male children, female children, 0 to 4-year-olds, 5 to 9-year-olds, 10 to 14-year-olds, and 15 to 17-year-olds.

2.5. Statistical Analysis

We used Bayesian Poisson spatiotemporal conditional autoregressive models to analyze the relationship between weekly PM2.5 and the weekly count of ED visits for respiratory outcomes. A conditional autoregressive spatial prior and a first order autoregressive term were included to account for spatial and temporal correlations. Regression models included temperature, an indicator of cold season, and an interaction between temperature and cold season. The outcome was modeled with a Poisson distribution, and population estimates from the ACS were used as offsets. Specifically
Respiratory   outcomes i j Poisson ( λ i j ) , where
log ( λ i j ) = β 0 + β 1 log 10 ( PM i j + 1 ) + β 2 temperature i j + β 3 cold   season j + β 4 ( cold   season j × temperature i j ) + log ( ACS   population   estimate i ) + u i + v j   .
ED visits for respiratory outcomes i j represents the count of events in spatial (zip code) unit i and temporal (week) unit j. λ i j is the mean of the Poisson distribution for spatial unit i and temporal unit j. β 0 is the intercept; β 1 through β 4 are slope coefficients corresponding to log-transformed10 PM + 1, temperature, cold season indicator, and an interaction term between cold season and temperature, respectively. All predictors are defined for spatial unit i and temporal unit j. The term log ( ACS   population   estimate i ) is included as an offset to account for population size. Spatial and temporal random effects are denoted by u i and v j , respectively.
A spatial neighbor matrix was first constructed, where zip codes with a shared boundary were defined as neighbors. The models were fit using the CARBayesST package version 4.0 in R (Lee et al. [31]; Glasgow, UK). Models were run with 100,000 Markov Chain Monte Carlo (MCMC) samples, a burn-in of 40,000, and no thinning. The first-order temporal autoregressive parameter (AR) was set to 1. Trace plots and density plots were used to assess convergence [32]. The coefficients were exponentiated to provide relative risks (RR) and corresponding credible intervals (CrI) for the predictors of this study.
Further analyses stratified the data by age group and sex, focusing on respiratory outcomes. While the overall modeling approach remained similar as the formula above, the respiratory-related ED visit counts and ACS population estimates were adjusted according to each specific respiratory outcome, sex (male and female), and age group (0–4, 5–9, 10–14, and 15–17 years). These adjustments were necessary to reflect population distribution and controlling for potential confounders that might arise from differences in population size within residential zip codes. This stratified approach highlighted the magnitude of association between exposure to PM2.5 and ED visits for each group in our stratified analysis. All statistical analyses were conducted with R version 4.2.1 (R Core Team; Vienna, Austria) [33].

2.6. Sensitivity Analysis

To evaluate the robustness of our findings we conducted several sensitivity analyses using the same modeling strategies described above, including using only data from VCH (the primary data source). We compared these results to those for the combined dataset of VCH and FCDPH for each respiratory outcome. We also compared results when modeling total counts of primary and secondary ICD-10 codes for respiratory outcome ED visits.

2.7. Ethics Approval

All health outcome data were de-identified and securely transferred to the University of California (UC), Merced for analysis. All study procedures were conducted in accordance with the Declaration of Helsinki and approved by the Institutional Review Boards of UC Merced, FCDPH and VCH (Protocol UCM2022-23, approved 6 April 2022). Informed consent was waived because this study used de-identified, secondary data and did not involve direct contact with individuals or acquisition of personal identifying information.

3. Results

The analyses included a total of 68,741 ED visits for respiratory outcomes. Table 1 presents the demographic characteristics of our population. Most ED visits were due to respiratory infections (74%), followed by asthma (25%), and lastly, other chronic respiratory conditions (1%). Males had slightly higher ED visits (56%) compared to females (44%); children aged 0 to 4 visited the ED the most (47%), compared to children aged 5 to 9 (29%), 10 to 14 (17%) and 15 to 17 (8%). Hispanic children made up the largest share of ED visits (72%) compared with non-Hispanic children (28%) in Fresno County. These percentages are higher than the overall percentage of Hispanic individuals in Fresno County (55%).
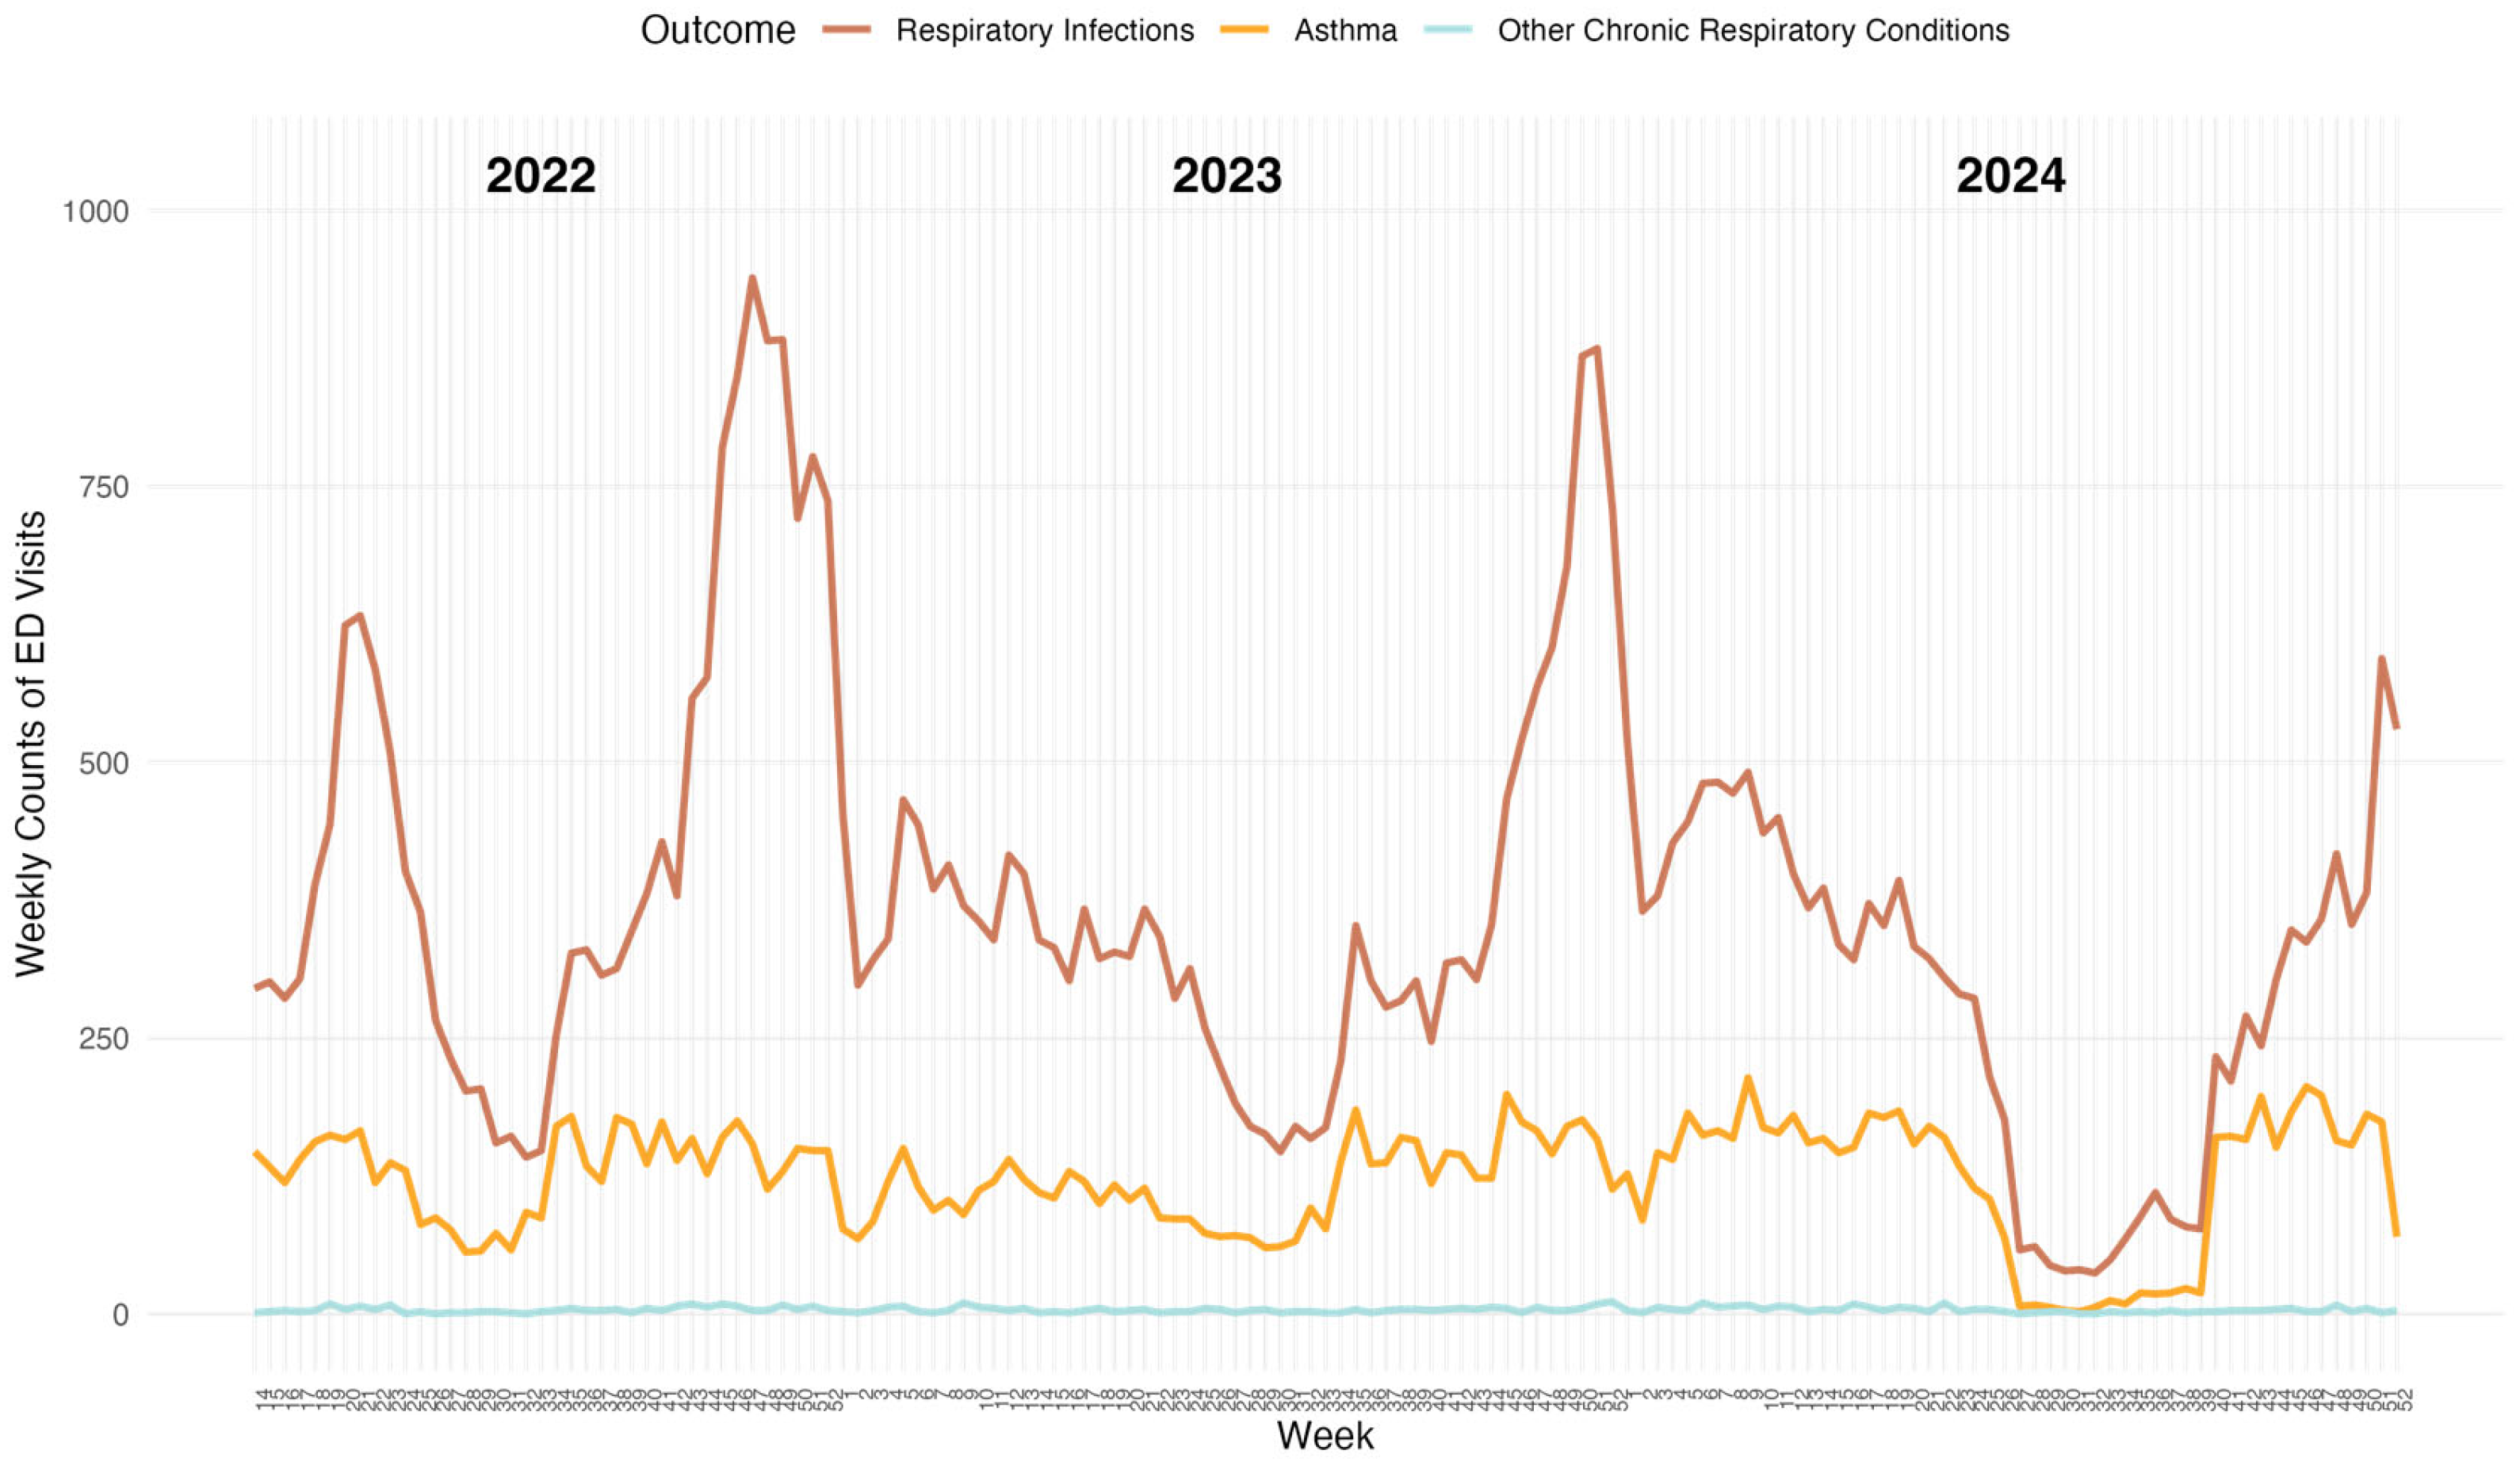
Figure 1 presents the distribution of weekly counts of ED visits for pediatric respiratory outcomes in Fresno County over the duration of the study, and Table 2 presents the average weekly ED visits. On average, there were approximately 481 total respiratory-related ED visits per week. ED visits for respiratory infections, asthma, and other chronic respiratory conditions accounted for an average of 360, 122, and 4 visits per week, respectively (Table 2).
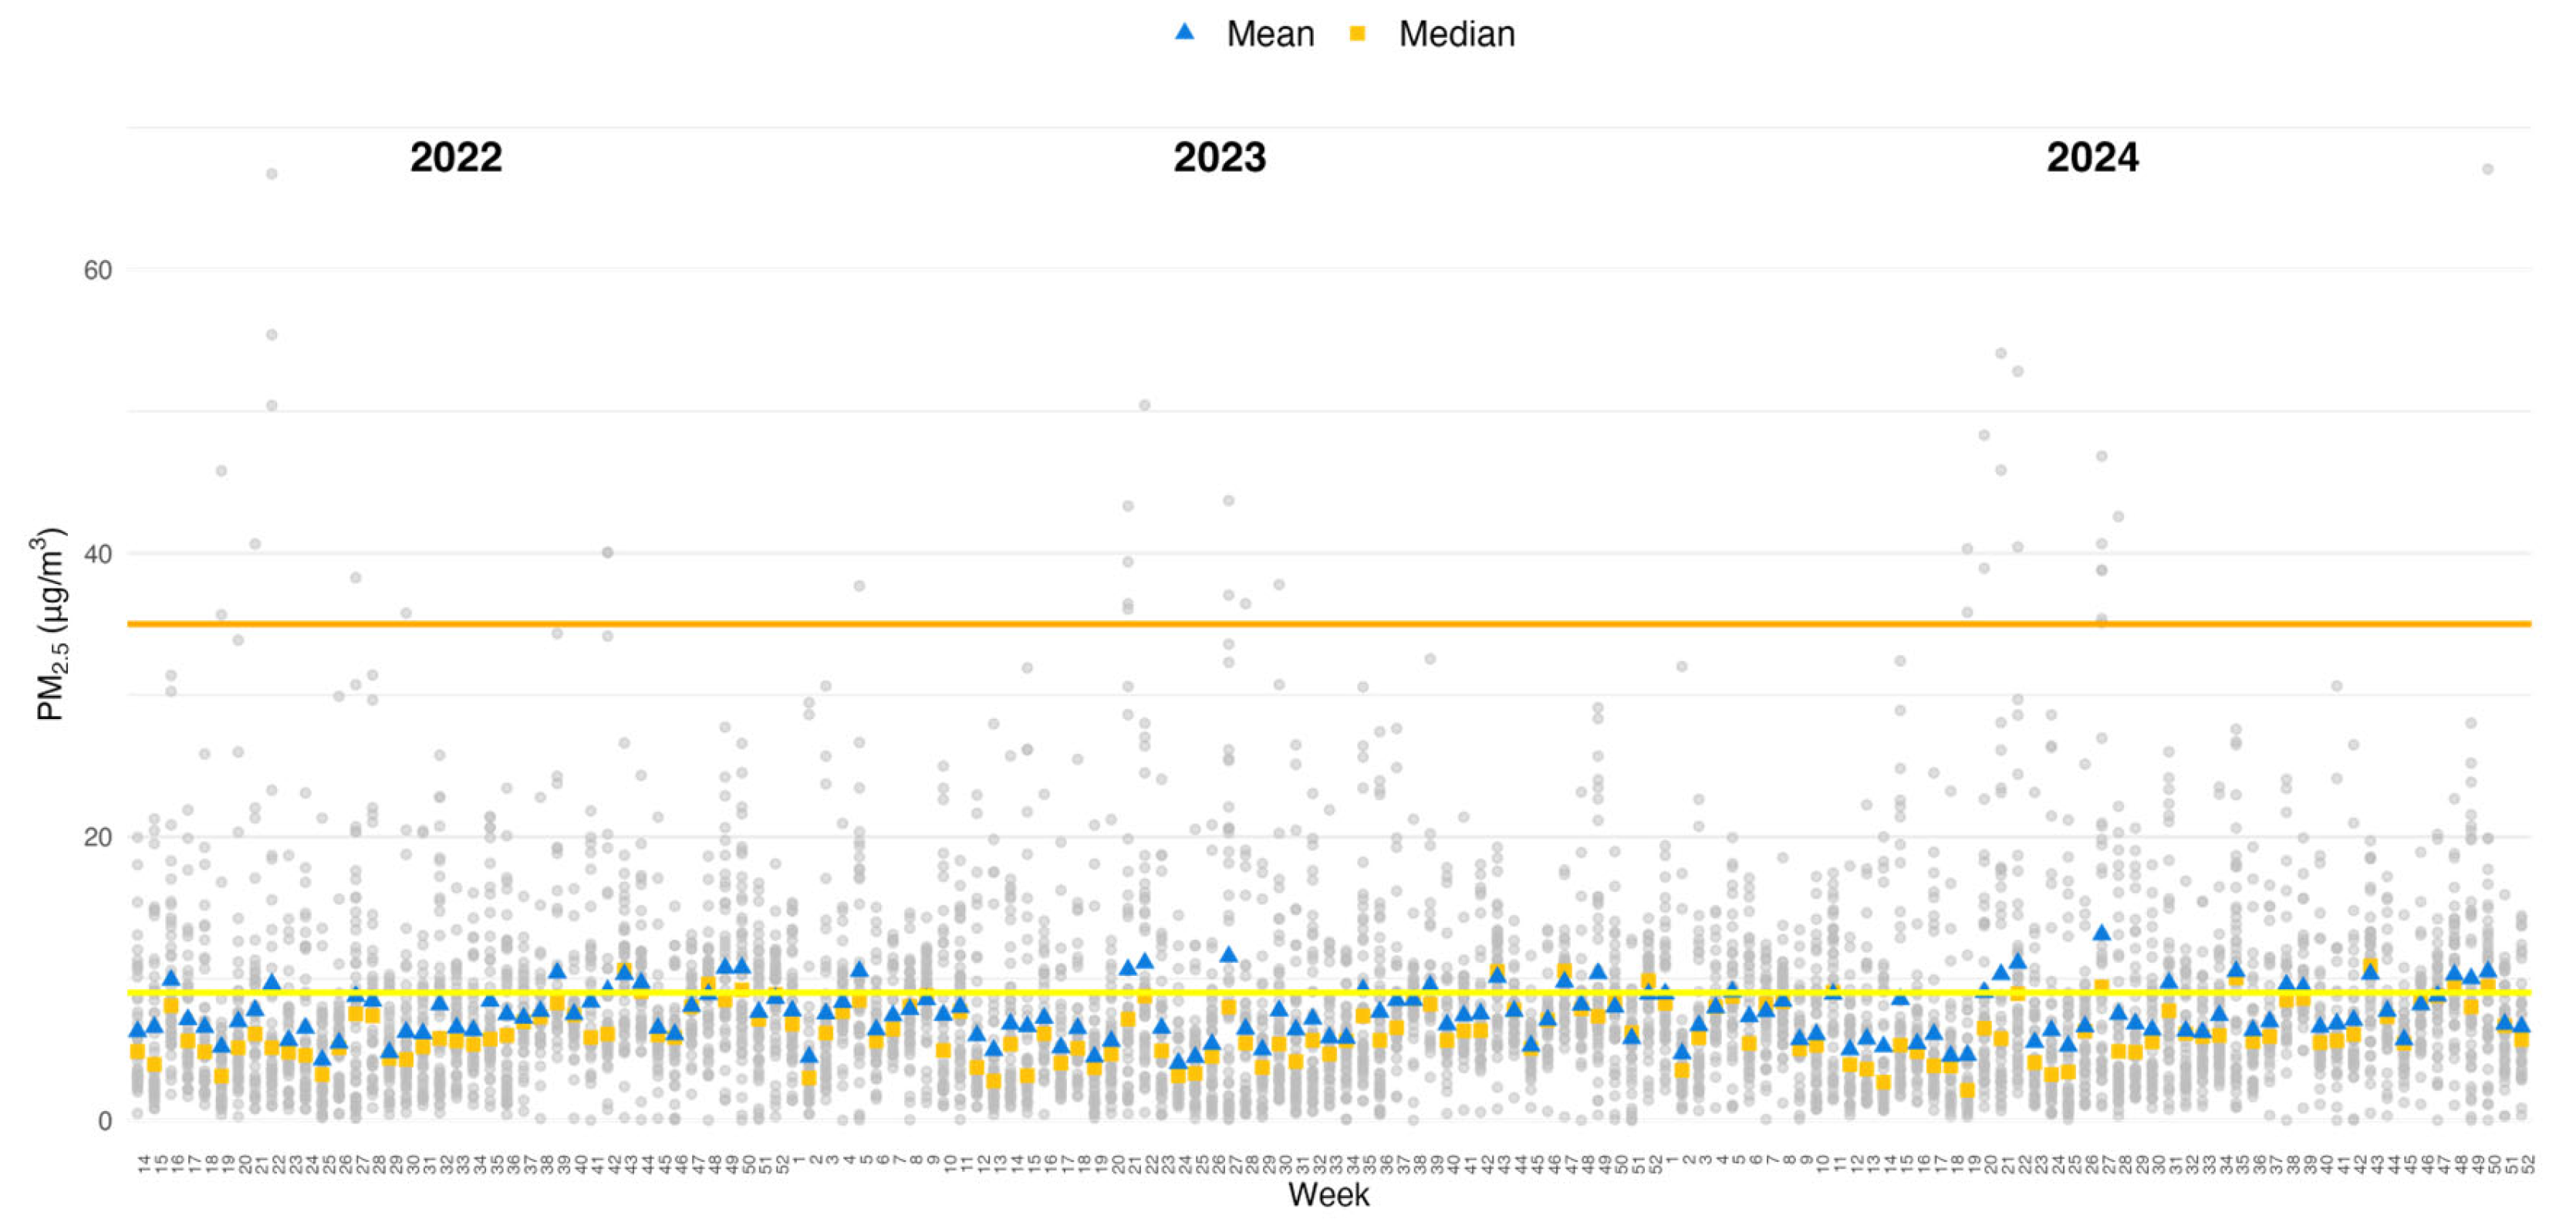
Figure 2 presents the weekly distributions of PM2.5 in Fresno County. During our study, the median PM2.5 level was 6.3 µg/m3, the 25th percentile was 3.8 µg/m3, and the 90th percentile was 13.8 µg/m3 (see Supplementary Table S1). The weekly average temperature was similar across seasons. The mean temperature for the cold season was 73.2 °F and for the warm season 73.1 °F.
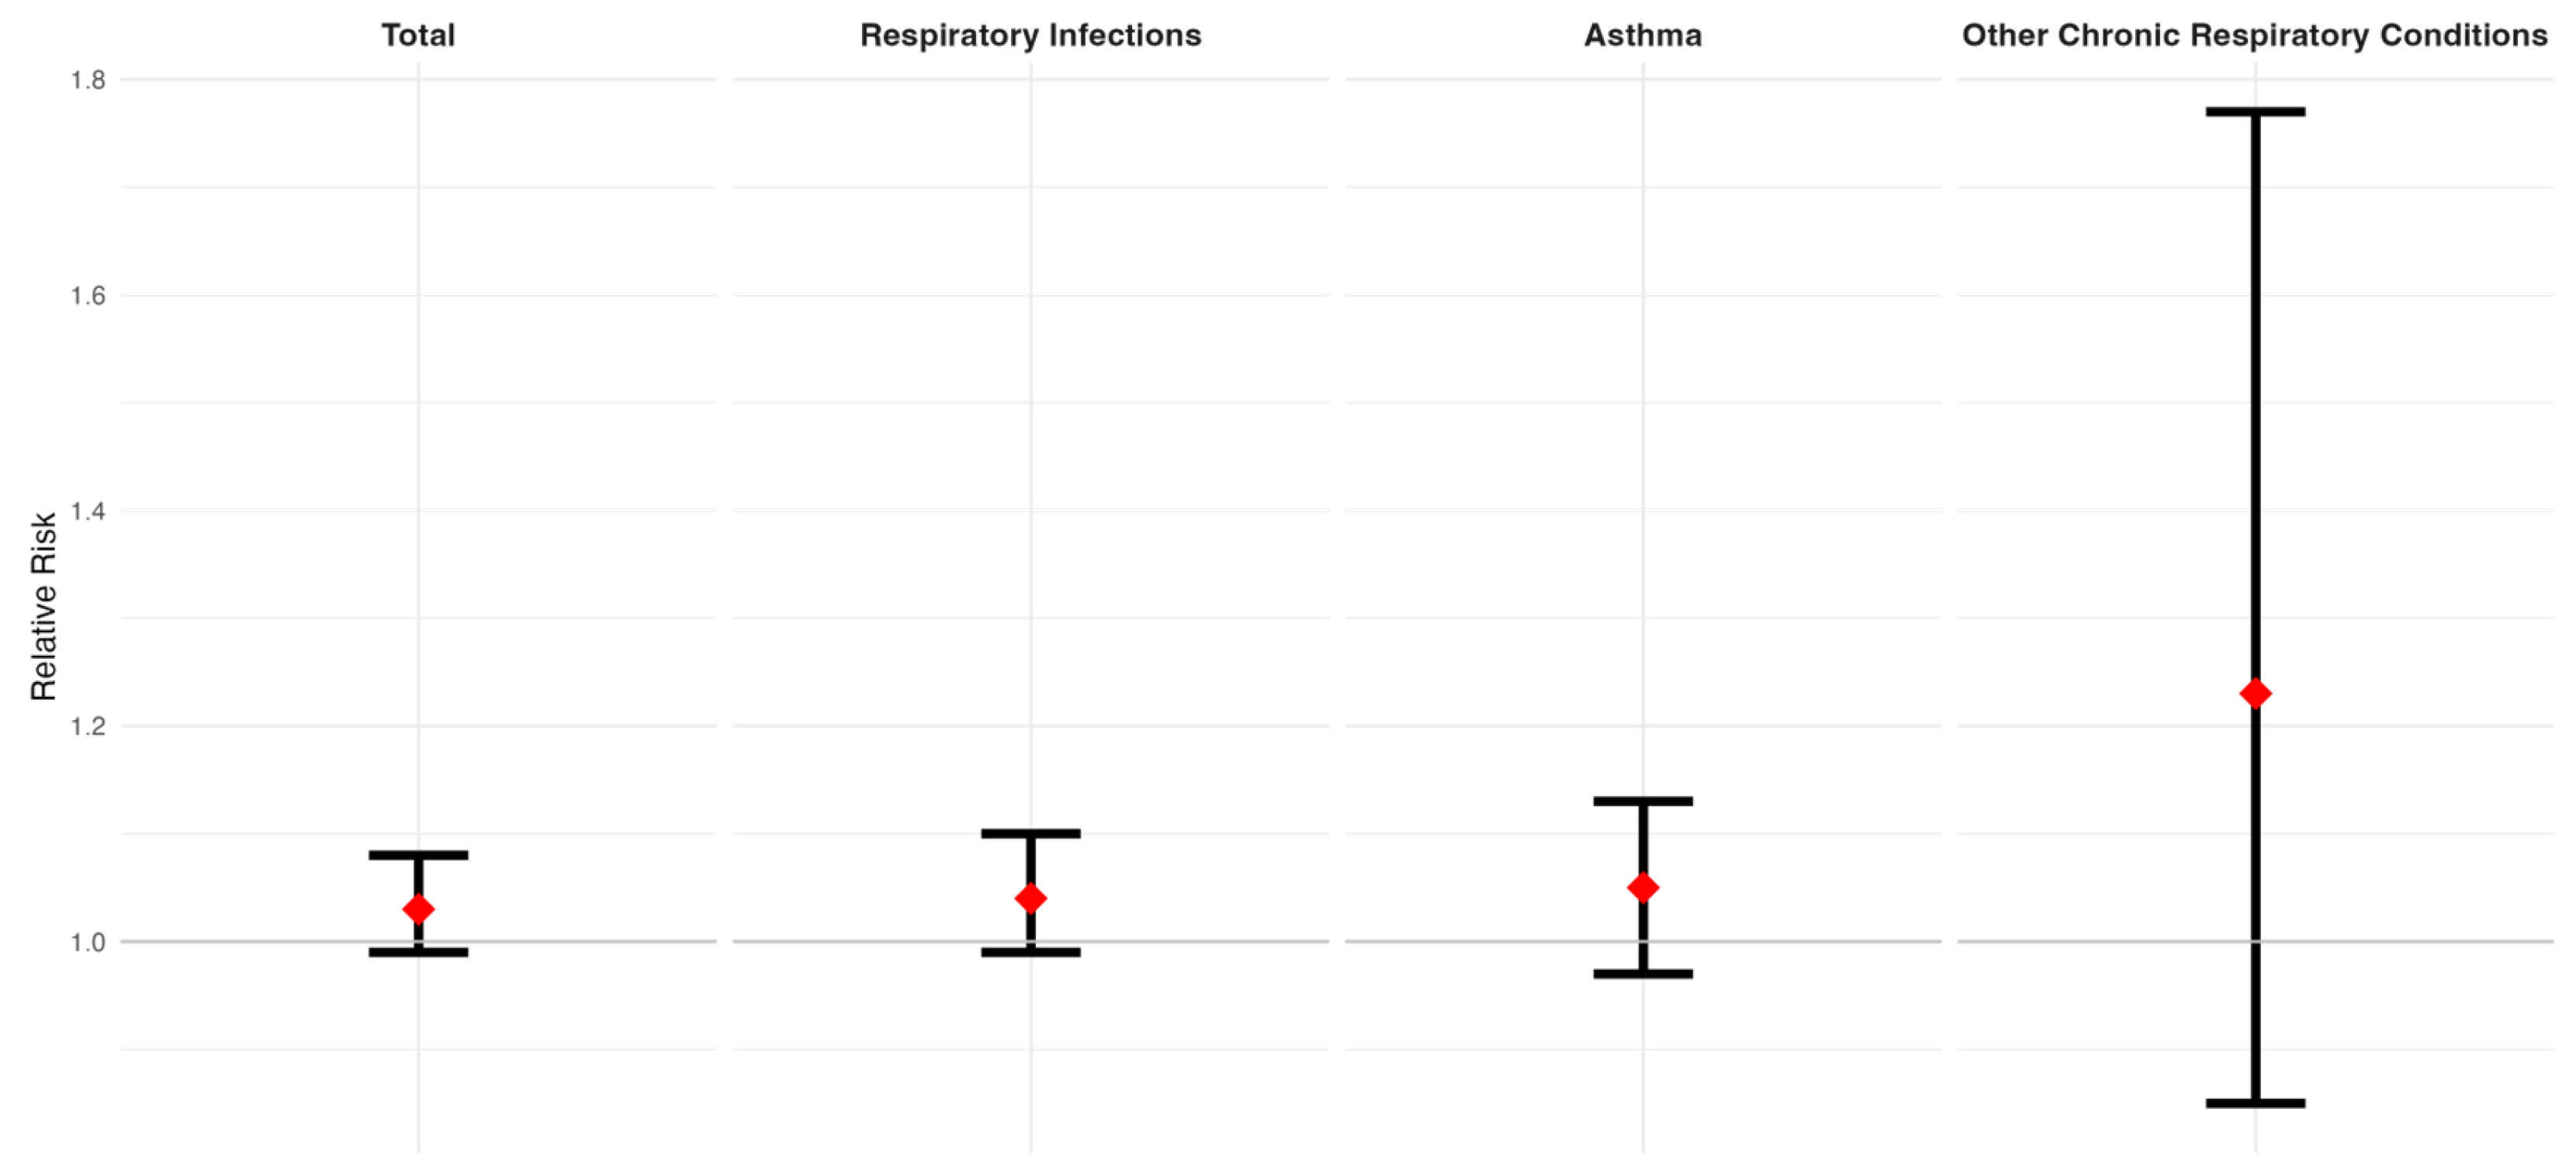
Figure 3 shows the relative risk of a ten-fold increase in PM2.5 levels and the occurrence of ED visits for total respiratory outcomes, respiratory infections, asthma, and other chronic respiratory conditions. An increase, albeit not significant, in the likelihood of ED visits was also observed for all respiratory outcomes (RR: 1.04 95% CrI: 0.99, 1.08), respiratory infections (RR: 1.04; 95% CrI: 0.99, 1.10), asthma (RR: 1.05; 95% CrI: 0.97, 1.13), and other chronic respiratory conditions (RR: 1.23; 95% CrI: 0.85, 1.77). Supplementary Table S2 provides detailed information of the model results.
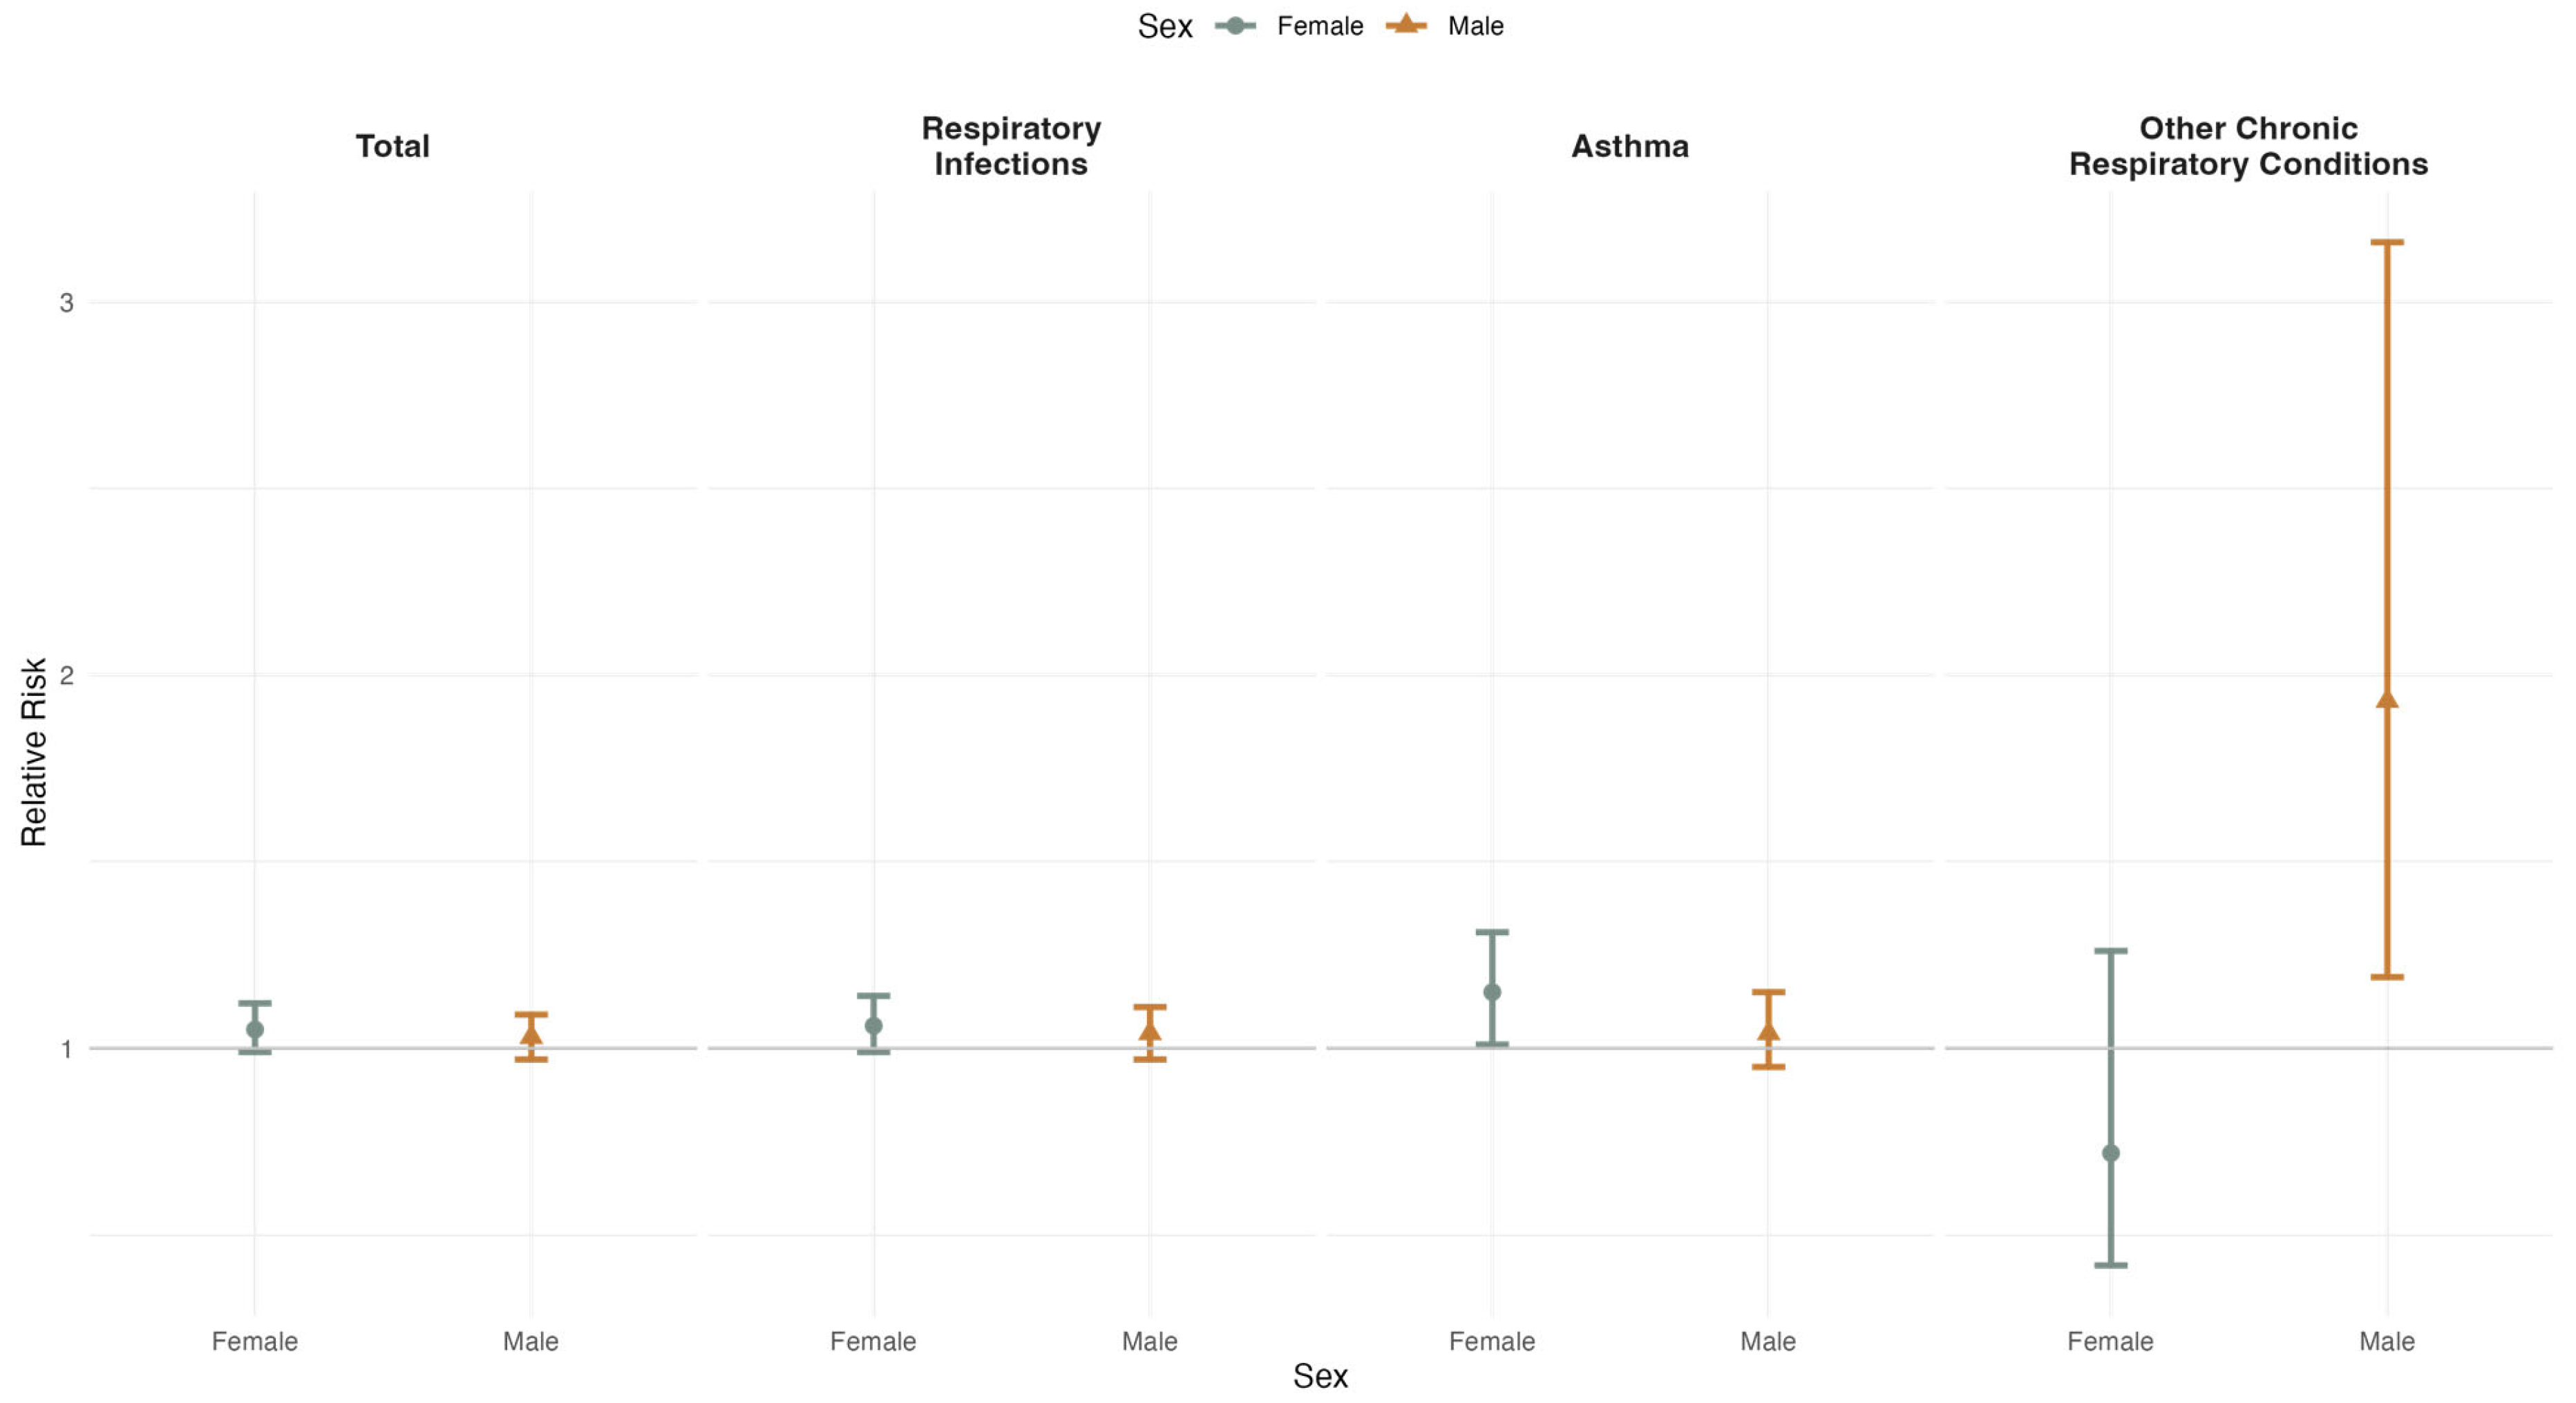
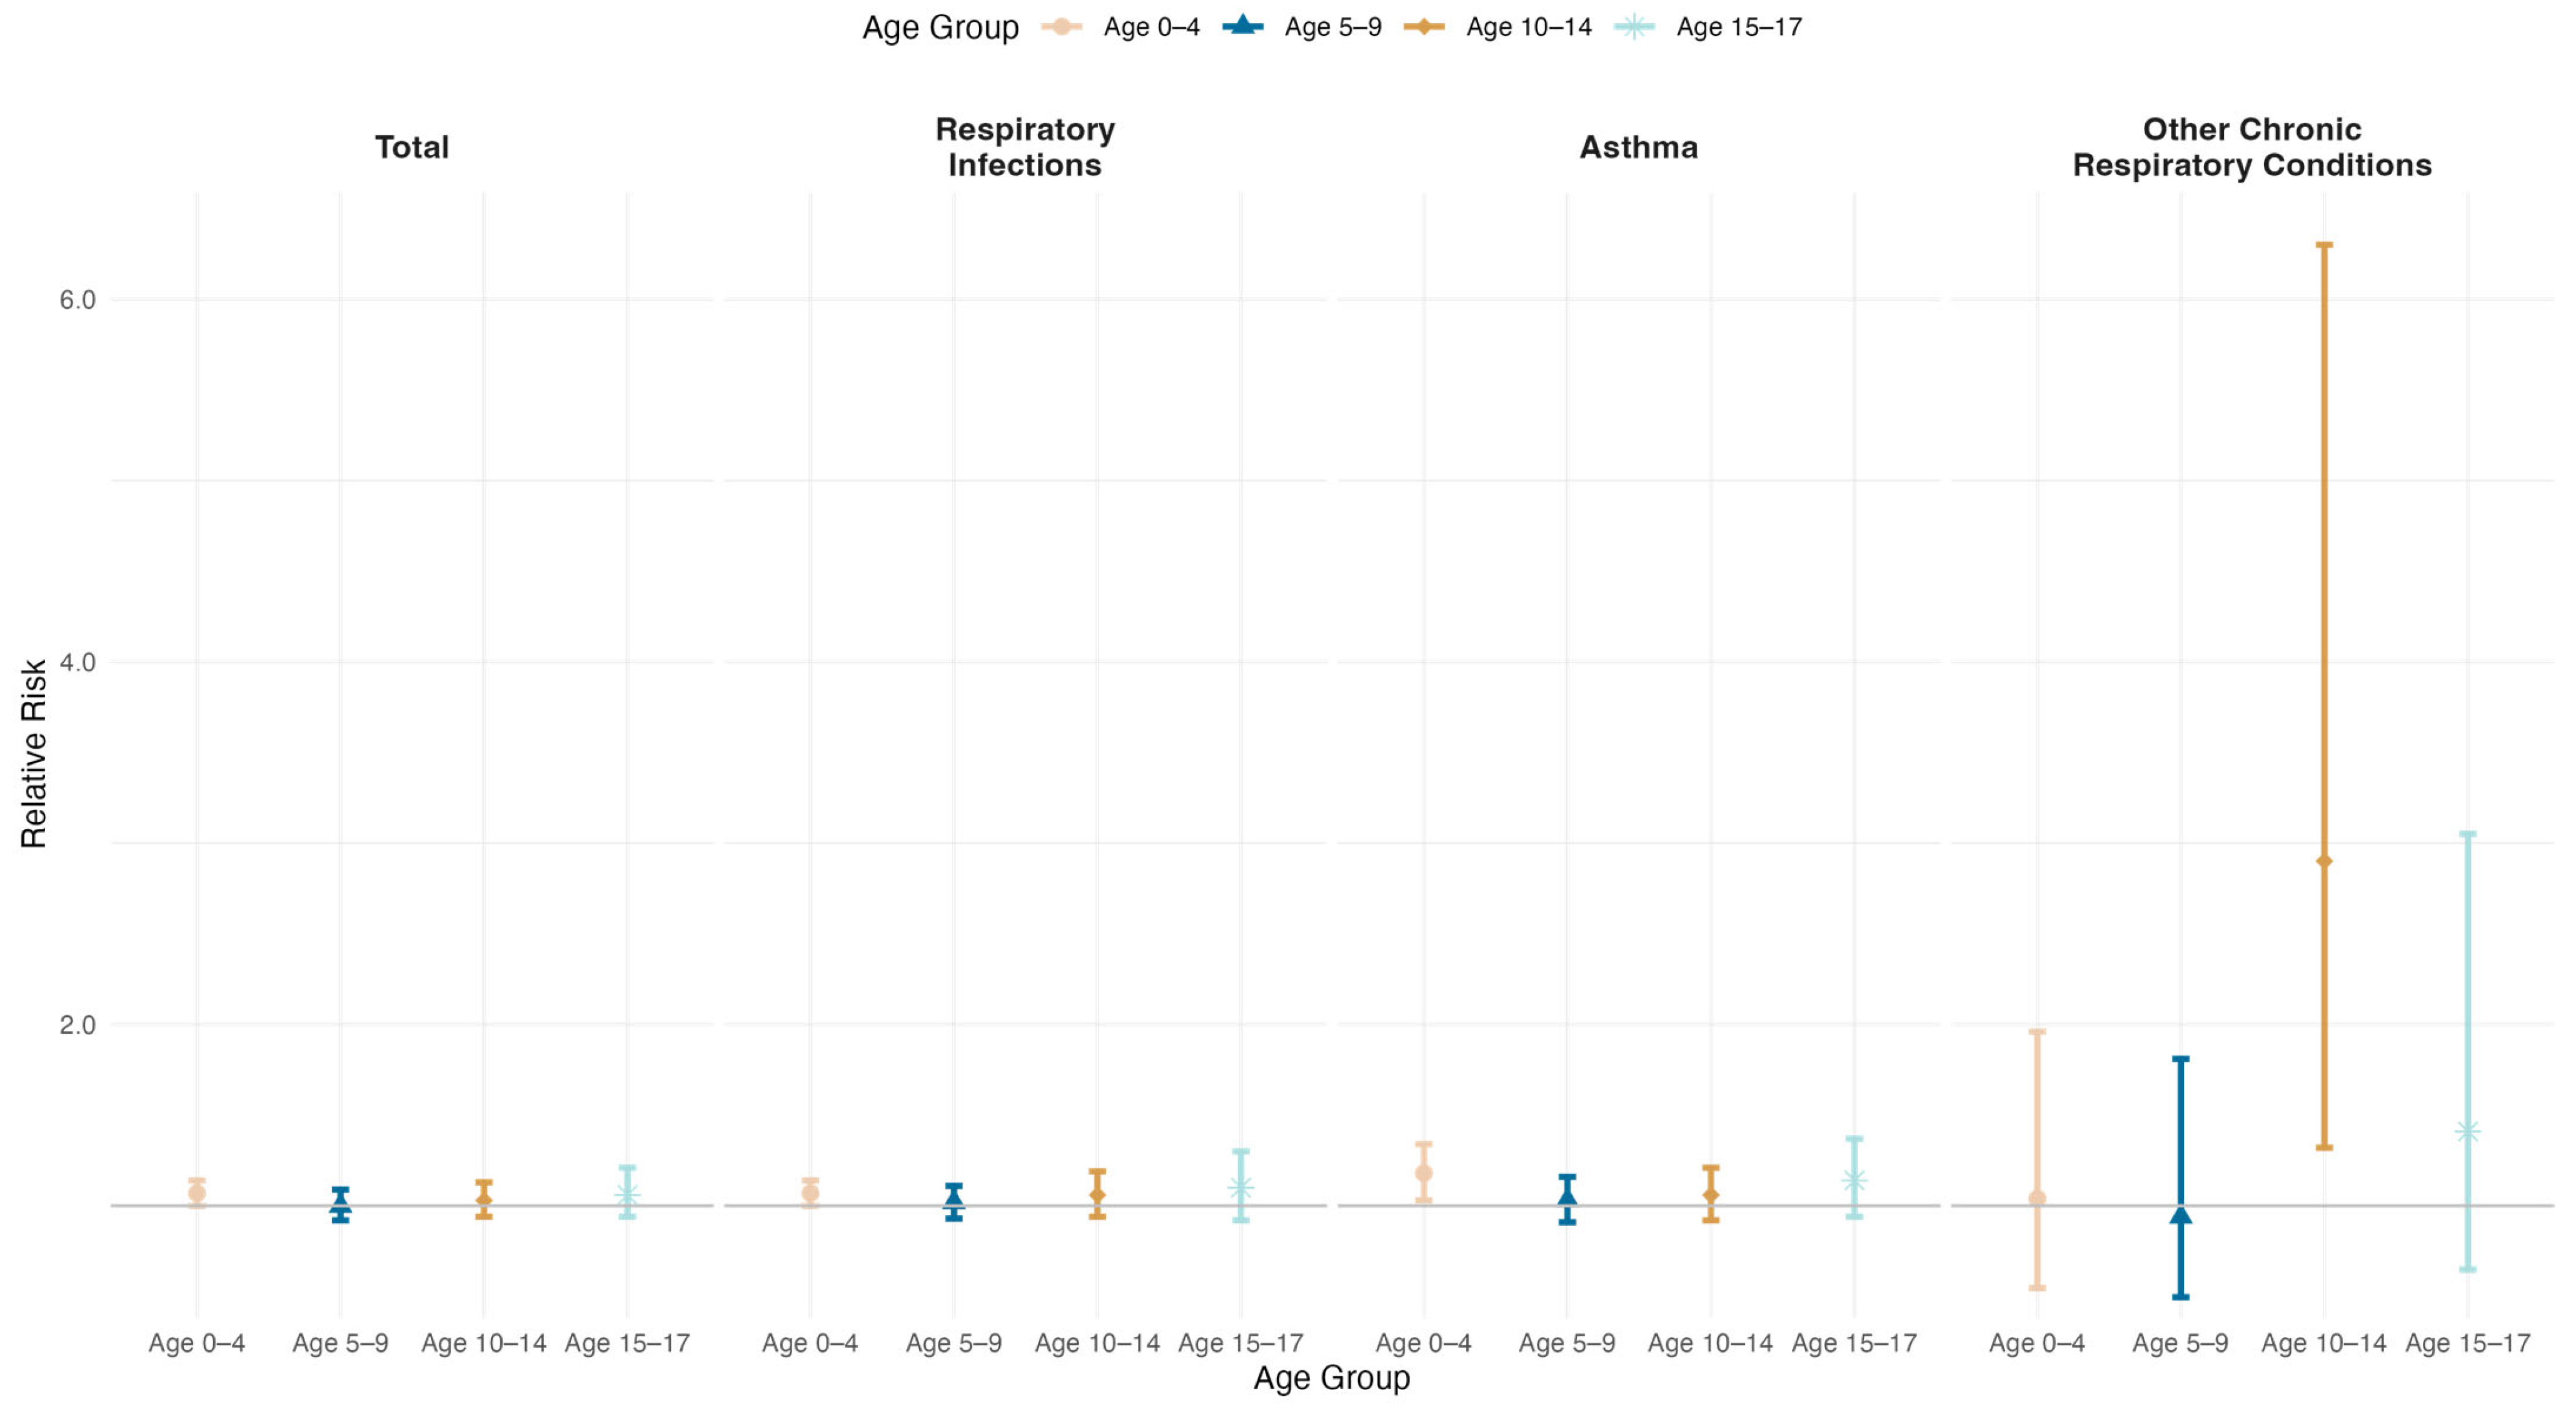
Figure 4 presents the results from sex-stratified analyses. A significant association between a ten-fold increase in weekly residential PM2.5 and pediatric ED visits for females with asthma (RR: 1.15; 95% CrI: 1.01, 1.32) and males with other chronic respiratory conditions (RR: 1.93; 95% CrI: 1.19, 3.16) was observed. Figure 5 shows the results of analyses stratified by age group. Significant associations were observed between a ten-fold increase in weekly residential PM2.5 and pediatric ED visits for asthma ED visits in children aged 0 to 4 (RR: 1.18; 95% CrI: 1.03, 1.34), and ED visits for other chronic respiratory conditions in children aged 10 to 14 years (RR: 2.90; 95% CrI: 1.32, 6.30). Supplementary Tables S3–S6 provide detailed information on the results of each stratified model. Supplementary Figures S3–S6 present concentration–response curves for the significant associations observed in the stratified analyses.
The associations remained consistent in our primary analysis and in the sensitivity analysis with data from only VCH (Supplementary Table S7). Additional sensitivity analyses were conducted to examine the association between PM2.5 exposure and total ED respiratory visits for primary and secondary diagnoses. No significant increases in the risk of all-cause ED visits from a ten-fold increase in residential PM2.5 exposure for primary (RR: 1.04; 95% CrI: 0.97, 1.10) and secondary diagnoses (RR: 1.08; 95% CrI: 1.00, 1.16) were observed (Supplementary Table S8).

4. Discussion

By leveraging a rich network of regulatory and citizen-science air monitoring data together with ED visit data, this study investigated the association between exposure to PM2.5 and hospital ED visits for respiratory infections, asthma, and other chronic respiratory conditions. We found that short-term exposure to higher levels of ambient PM2.5 is associated with an increased risk of pediatric ED visits for asthma among females and children aged 0 to 4 years. Stratified analyses also suggest that an increased ambient PM2.5 exposure is associated with increased risk in ED visits for other chronic respiratory conditions among males and children aged 10 to 14 years.
PM2.5 levels were variable in individual weeks for each zip code throughout the years included in the analysis. Average PM2.5 levels in Fresno County from 2022 to 2024 remained consistent at approximately 7.5 µg/m3 (Supplementary Table S1). Although annual PM2.5 averages across Fresno County were below the U.S. EPA National Air Quality Standards (NAAQS) [34] (9.0 µg/m3), our study showed several periods of high exposure to PM2.5.
Overall, we observed that a ten-fold increase in residential PM2.5 is associated with increased risk of pediatric ED visits for asthma and other chronic respiratory conditions in specific subgroups. Our findings are consistent with other studies that suggest exposure to PM2.5, even at concentrations below the NAAQS standard, can result in adverse health outcomes [35]. For example, several studies indicate that there is no safe level of PM2.5 exposure, and even low concentrations can increase the risk of health problems, particularly among vulnerable populations such as children, the elderly, and those with pre-existing conditions [36]. Thus, our findings underscore the importance of continuous monitoring and the implementation of stricter air quality regulations to protect public health.
Our results for asthma demonstrate partial consistency with existing literature. While prior studies have reported significant associations between PM2.5 exposure and increased ED visits for asthma, our overall findings were not statistically significant. However, observed association in our stratified analysis suggest that PM2.5 exposure may contribute to asthma related pediatric ED visits. Previous studies, including Bi et al. (2023) examined the acute effects of ambient air pollution on asthma ED visits across ten states in the U.S and reported significant positive associations between short-term exposure to various air pollutants, including PM2.5, and increased rates of asthma ED visits [37]. The authors also highlighted the susceptibility of children and older adults to air pollution exposure. Similarly, a systematic review and meta-analysis by Fan et al. (2016) demonstrated that higher short term PM2.5 concentrations were associated with an increased asthma ED visits, particularly among children [38]. Another meta-analysis by Orellano et al. (2017) provided evidence of the association between selected air pollutants, including PM2.5, and asthma exacerbations, underscoring the significant impact of air pollution on public health [39].
We observed a higher risk of ED visits for asthma among females. A plausible explanation for this finding is the potential underdiagnosis and undertreatment of asthma in female adolescents, which could lead to higher rates of ED visits following exposure to environmental pollutants [40]. Previous research has shown that females experience a rise in asthma symptoms during and after puberty, likely due to hormonal changes associated with adolescence [41,42]. As a result, females may face increased vulnerability to asthma, and increased exposure to PM2.5 may exacerbate asthma symptoms, contributing to a higher risk of ED visits. We also observed an increased risk for asthma-related ED visits for children aged 0 to 4. Factors contributing to the risk for young children include higher breathing rates, lack of breathing control and cough reflex in infants, and smaller airways, making them more susceptible to the adverse impacts of air pollution exposure.
Our results for respiratory infections are inconsistent with previous literature. For example, Darrow et al. [43] investigated short-term changes in ambient air pollutant concentrations, including PM2.5 and its relation to ED visits for respiratory infections in children aged 0 to 4 residing in Atlanta, Georgia. They showed that increases in ozone, nitrogen dioxide, organic carbon fraction, and PM2.5 were associated with higher ED visits for pneumonia and upper respiratory infections, particularly during the cold season [43]. Furthermore, Zarate-Gonzalez et al. [44] found that higher single-day estimates of PM2.5 exposure showed increased odds of hospitalization due to asthma and upper respiratory infections in 2016. While our findings differ, they still suggest that air pollutants may adversely affect children’s respiratory health. Importantly, reducing air pollutant exposure could lead to an overall reduction in healthcare costs in the SJV region [45].

Strengths and Limitations

A strength of this study is the large sample size and the breadth of ED data for the largest county in the SJV, where the asthma rate is high. EDs serve as a crucial social safety net in the healthcare system [46]. Another strength of this study is the richness of the exposure data. We evaluated real-time PM2.5 air pollution levels in a broad geographic area from widely distributed sensors, including community-scientist sensors and regulatory monitors.
Our deployment and use of low-cost PM2.5 improved spatial characterization of air quality in the zip codes where study participants lived and thereby improved exposure assessment. As noted above, we took several steps to ensure the quality of the data and elsewhere we report good correlations between collocated low-cost sensors and regulator monitors [21]. However, low-cost sensors also have limitations. Measurements are less accurate than professionally managed regulatory monitors and they may be impacted by humidity and other factors which can increase variability. Furthermore, few zip codes included weekly average PM2.5 values from monitors located >10 km away due to sparse monitoring coverage in some rural areas. Using monitors located farther from residential zip code may reduce spatial specificity and smooth local variation in PM2.5 concentrations, potentially leading to underestimation of localized hotspots and reduced ability to capture fine-scale spatial variability in rural areas. However, because these larger distance assignments were uncommon (less than 5%), their overall influence on results is likely limited.
There are other limitations to this study. By focusing on ED visits, we are limiting our population to only individuals who visited the ED for respiratory illness care. Some individuals with poor respiratory health may not visit the ED due to a lack of health insurance, mild respiratory symptoms, or they may seek care from an urgent care provider or their primary health care provider.
Finally, this analysis focused on PM2.5. We did not examine other pollutants, including ozone and nitrogen dioxide, because high-resolution spatial monitoring data are not available. The SJV is considered a non-attainment region for ozone, and nitrogen oxides are periodically elevated, especially along transportation corridors. Exposure to these pollutants may also increase the incidence of acute respiratory illness. Future research should investigate the dose–response relationship between the observed PM2.5 levels and hospital visits to determine if there are thresholds for adverse outcomes. Future studies could extend this work to longer time frames to more carefully account for seasonal trends and lagged effects and examine the association between ED visits and other air pollutants, such as ozone and nitrogen dioxide. Although this work focused on the Fresno County area, future work should expand to other SJV areas heavily impacted by air pollution.

5. Conclusions

Fresno County experiences high levels of air pollution and some of the highest respiratory health disparities in the nation, especially in children. In this study, a ten-fold increase in PM2.5 at the week and zip code level was associated with increased asthma ED visits among females and children aged 0 to 4 and other chronic respiratory conditions among males and ages 10 to 14. These findings highlight subgroup vulnerabilities and have important public health implications for the SJV region. Addressing air quality concerns requires a comprehensive approach to air quality management and public health interventions. By expanding research to include other pollutants and considering the seasonal variations in air quality, more targeted strategies can be developed to protect vulnerable populations, such as children living in Fresno County. Lastly, continued collaboration among community members, researchers, healthcare professionals, and policymakers is essential to mitigate the impact of air pollution and reduce respiratory health disparities in the SJV.

Supplementary Materials

The following supporting information can be downloaded at https://www.mdpi.com/article/10.3390/atmos17060534/s1: Supplementary Information S1: International Classification of Disease codes, 10th version (ICD-10) definitions; Supplementary Figure S1: Map of Fresno County location (purple) and the city of Fresno (white star); Supplementary Figure S2: Particulate matter 2.5 distribution in Fresno County, California between 2 April 2022 and 31 December 2024; Supplementary Table S1: Weekly distribution of particulate matter 2.5 (ug/m3) in Fresno County (April 2022 through December 2024); Supplementary Table S2: Associations (Relative Risk (RR) and 95% Credible Interval (CrI)) between ambient particulate matter 2.5 and weekly pediatric respiratory emergency department visits in Fresno County, California; Supplementary Table S3: Associations (Relative Risk (RR) and 95% Credible Interval (CrI)) between ambient particulate matter 2.5 and weekly pediatric respiratory emergency department visits stratified by sex and age in Fresno County, California; Supplementary Table S4: Associations (Relative Risk (RR) and 95% Credible Interval (CrI)) between ambient particulate matter 2.5 and weekly pediatric emergency department visits for respiratory infections stratified by sex and age in Fresno County, California; Supplementary Table S5: Associations (Relative Risk (RR) and 95% Credible Interval (CrI)) between ambient particulate matter 2.5 and weekly pediatric emergency department visits for asthma stratified by sex and age in Fresno County, California; Supplementary Table S6: Associations (Relative Risk (RR) and 95% Credible Interval (CrI)) between ambient particulate matter 2.5 and weekly pediatric emergency department visits for other chronic respiratory conditions stratified by sex and age in Fresno County, California; Supplementary Table S7: Associations (Relative Risk (RR) and 95% Credible Interval (CrI)) between ambient particulate matter 2.5 and covariates with weekly pediatric respiratory emergency department visits in Fresno County, California. Data from Valley Children’s Hospital; Supplementary Table S8: Associations (Relative Risk (RR) and 95% Credible Interval (CrI)) between ambient particulate matter 2.5 and weekly pediatric respiratory visits in Fresno County, California. Data from Valley Children’s Hospital comparing primary and secondary diagnoses; Supplementary Figure S3: Concentration–response curve for the association between PM2.5 and the risk of pediatric emergency department visits for asthma among females in Fresno County, California. The solid black line represents the estimated relative risk across increasing PM2.5 concentrations from a Bayesian spatiotemporal Poisson model controlled for temperature, an indicator of the cold season, an interaction between temperature and cold season, and population estimates from the American Community Survey. The gray shaded area represents the 95% credible interval. The dashed horizontal line indicates the null relative risk value (1.0); Supplementary Figure S4: Concentration–response curve for the association between PM2.5 and the risk of asthma emergency department visits for children aged 0 to 4 in Fresno County, California. The solid black line represents the estimated relative risk across increasing PM2.5 concentrations from a Bayesian spatiotemporal Poisson model controlled for temperature, an indicator of the cold season, an interaction between temperature and cold season, and population estimates from the American Community Survey. The gray shaded area represents the 95% credible interval. The dashed horizontal line indicates the null relative risk value (1.0); Supplementary Figure S5: Concentration–response curve for the association between PM2.5 and the risk of pediatric emergency department visits for other chronic respiratory conditions among males in Fresno County, California. The solid black line represents the estimated relative risk across increasing PM2.5 concentrations from a Bayesian spatiotemporal Poisson model controlled for temperature, an indicator of the cold season, an interaction between temperature and cold season, and population estimates from the American Community Survey. The gray shaded area represents the 95% credible interval. The dashed horizontal line indicates the null relative risk value (1.0); Supplementary Figure S6: Concentration–response curve for the association between PM2.5 and the risk of emergency department visits for other chronic respiratory conditions among children aged 10 to 14 in Fresno County, California. The solid black line represents the estimated relative risk across increasing PM2.5 concentrations from a Bayesian spatiotemporal Poisson model controlled for temperature, an indicator of the cold season, an interaction between temperature and cold season, and population estimates from the American Community Survey. The gray shaded area represents the 95% credible interval. The dashed horizontal line indicates the null relative risk value (1.0).

Author Contributions

Conceptualization, K.V., K.D., S.H., S.G.-M., A.B. and A.M.C.-G.; methodology, K.V., K.D., S.H., S.G.-M., A.B. and A.M.C.-G.; software, K.V., K.D. and A.M.C.-G.; validation, K.V., K.D., S.H., S.G.-M., A.B. and A.M.C.-G.; formal analysis, K.V., K.D., S.H., S.G.-M., A.B. and A.M.C.-G.; investigation, S.H., S.G.-M., A.B. and A.M.C.-G.; resources, A.B. and A.M.C.-G.; data curation, K.V. and K.D.; writing—original draft preparation, K.V., K.D., S.H., S.G.-M., A.B. and A.M.C.-G.; writing—review and editing, K.V., K.D., E.H., T.T., D.P., S.K.-K., M.L.R., J.R., T.P.H., M.H., A.E., S.H., S.G.-M., A.B. and A.M.C.-G.; visualization, K.V., K.D. and A.M.C.-G.; supervision, S.H., S.G.-M., A.B. and A.M.C.-G.; project administration, K.V., K.D., E.H., T.T., D.P., S.K.-K., M.L.R., J.R., T.P.H., S.H. and A.B.; funding acquisition, A.B. All authors have read and agreed to the published version of the manuscript.

Funding

This research was funded by the California Department of Justice (CDOJ) Automobile Emissions Research and Technology Fund (GNT0000424). The views expressed in this document are solely those of the authors and do not necessarily reflect those of the CDOJ. The mention of commercial products, their source, or their use in connection with material reported herein is not to be construed as actual or implied endorsement of such products.

Institutional Review Board Statement

All study procedures were conducted in accordance with the Declaration of Helsinki and approved by the Institutional Review Boards of UC Merced, FCDPH and VCH (Protocol UCM2022-23, approved 6 April 2022).

Informed Consent Statement

Informed consent was waived because this study used de-identified, secondary data and did not involve direct contact with individuals or acquisition of personal identifying information.

Data Availability Statement

Due to the sensitivity of the emergency department data, this data in not publicly available. The air quality data is publicly available at SJVAir.com.

Acknowledgments

We thank the community partners, citizen scientists, and PurpleAir monitors hosts who contributed to this study. We also thank the Fresno County Department of Public Health and Valley Children’s Hospital for their collaboration. This manuscript is based on a chapter of a PhD dissertation entitled “Assessing the Respiratory Health Effects of Air Pollutants and Pesticide Exposure in Rural California Communities” by Kimberly Valle, electronically published by the University of California, Merced in partial fulfillment of a doctoral degree under a Creative Commons Attribution 4.0 International (CC BY 4.0) license, available at: https://escholarship.org/uc/item/5dz620dn (accessed on 26 February 2025) [47]. Since the completion of the dissertation, the study sample increased due to new data availability, and the analyses were updated; the current manuscript therefore presents new results.

Conflicts of Interest

The authors declare no conflicts of interest.

Abbreviations

The following abbreviations are used in this manuscript:
EDEmergency Department
SJVSan Joaquin Valley
CA-99California State Route 99
CrICredible Interval
EPAEnvironmental Protection Agency
FCDPHFresno County Department of Public Health
ICD-10International Classification of Disease codes, 10th version
I-5Interstate 5
NAAQSNational Air Quality Standards
μg/m3 Micrograms per cubic meter
PM2.5PM less than 2.5 microns in diameter
PA-IIPurpleAir
RRRelative Risk
SJV-CAIRSan Joaquin Valley Center for Air Injustice Reduction
ACSU.S. American Community Survey
USUnited States
UCUniversity of California
VCHValley Children’s Hospital

References

  1. US Environmental Protection Agency. Environmental Protection Agency Activities for Cleaner Air. Available online: https://www.epa.gov/sanjoaquinvalley/epa-activities-cleaner-air (accessed on 5 February 2024).
  2. San Joaquin Valley Air District Air Pollution Control District. About the District. Available online: https://ww2.valleyair.org/about/ (accessed on 5 March 2025).
  3. The American Lung Association. State of the Air 2025 Report; The American Lung Association: Chicago, IL, USA, 2025. [Google Scholar]
  4. Bates, D.V. The effects of air pollution on children. Environ. Health Perspect. 1995, 103, 49–53. [Google Scholar] [CrossRef] [Scilit]
  5. Bateson, T.F.; Schwartz, J. Children’s response to air pollutants. J. Toxicol. Environ. Health A 2008, 71, 238–243. [Google Scholar] [CrossRef] [Scilit]
  6. Brumberg, H.L.; Karr, C.J.; Bole, A.; Ahdoot, S.; Balk, S.J.; Bernstein, A.S.; Byron, L.G.; Landrigan, P.J.; Marcus, S.M.; Nerlinger, A.L.; et al. Ambient Air Pollution: Health Hazards to Children. Pediatrics 2021, 147, e2021051484. [Google Scholar] [CrossRef] [Scilit] [PubMed]
  7. Fuentes-Leonarte, V.; Tenias, J.M.; Ballester, F. Environmental factors affecting children’s respiratory health in the first years of life: A review of the scientific literature. Eur. J. Pediatr. 2008, 167, 1103–1109. [Google Scholar] [CrossRef] [Scilit] [PubMed]
  8. Gauderman, W.J.; Gilliland, G.F.; Vora, H.; Avol, E.; Stram, D.; McConnell, R.; Thomas, D.; Lurmann, F.; Margolis, H.G.; Rappaport, E.B.; et al. Association between air pollution and lung function growth in southern California children: Results from a second cohort. Am. J. Respir. Crit. Care Med. 2002, 166, 76–84. [Google Scholar] [CrossRef] [Scilit]
  9. National Heart Lung and Blood Institute. What Is Asthma? National Heart Lung and Blood Institute: Bethesda, MD, USA, 2022. Available online: https://www.nhlbi.nih.gov/health/asthma (accessed on 1 February 2024).
  10. Centers for Disease Control and Prevention. Asthma. Available online: https://www.cdc.gov/asthma/about/index.html (accessed on 5 February 2024).
  11. Yadav, R.; Nagori, A.; Madan, K.; Lodha, R.; Kabra, S.K. Short-term exposure to air pollution and emergency room visits for acute respiratory symptoms among adults. Int. J. Tuberc. Lung Dis. 2023, 27, 761–765. [Google Scholar] [CrossRef] [Scilit]
  12. Li, S.; Batterman, S.; Wasilevich, E.; Wahl, R.; Wirth, J.; Su, F.C.; Mukherjee, B. Association of daily asthma emergency department visits and hospital admissions with ambient air pollutants among the pediatric Medicaid population in Detroit: Time-series and time-stratified case-crossover analyses with threshold effects. Environ. Res. 2011, 111, 1137–1147. [Google Scholar] [CrossRef] [Scilit] [PubMed]
  13. Wendt, J.K.; Symanski, E.; Stock, T.H.; Chan, W.; Du, X.L. Association of short-term increases in ambient air pollution and timing of initial asthma diagnosis among Medicaid-enrolled children in a metropolitan area. Environ. Res. 2014, 131, 50–58. [Google Scholar] [CrossRef] [Scilit]
  14. Malig, B.J.; Green, S.; Basu, R.; Broadwin, R. Coarse particles and respiratory emergency department visits in California. Am. J. Epidemiol. 2013, 178, 58–69. [Google Scholar] [CrossRef] [Scilit]
  15. Sheppard, L.; Levy, D.; Norris, G.; Larson, T.V.; Koenig, J.Q. Effects of Ambient Air Pollution on Nonelderly Asthma Hospital Admissions in Seattle, Washington, 1987–1994. Epidemiology 1999, 10, 23–30. [Google Scholar] [CrossRef] [Scilit]
  16. Delamater, P.L.; Finley, A.O.; Banerjee, S. An analysis of asthma hospitalizations, air pollution, and weather conditions in Los Angeles County, California. Sci. Total Environ. 2012, 425, 110–118. [Google Scholar] [CrossRef] [Scilit] [PubMed]
  17. Strickland, M.J.; Hao, H.; Hu, X.; Chang, H.H.; Darrow, L.A.; Liu, Y. Pediatric Emergency Visits and Short-Term Changes in PM2.5 Concentrations in the U.S. State of Georgia. Environ. Health Perspect. 2016, 124, 690–696. [Google Scholar] [CrossRef] [Scilit] [PubMed]
  18. Alhanti, B.A.; Chang, H.H.; Winquist, A.; Mulholland, J.A.; Darrow, L.A.; Sarnat, S.E. Ambient air pollution and emergency department visits for asthma: A multi-city assessment of effect modification by age. J. Expo. Sci. Environ. Epidemiol. 2016, 26, 180–188. [Google Scholar] [CrossRef] [Scilit]
  19. Lim, H.; Kwon, H.J.; Lim, J.A.; Choi, J.H.; Ha, M.; Hwang, S.S.; Choi, W.J. Short-term Effect of Fine Particulate Matter on Children’s Hospital Admissions and Emergency Department Visits for Asthma: A Systematic Review and Meta-analysis. J. Prev. Med. Public Health 2016, 49, 205–219. [Google Scholar] [CrossRef] [Scilit]
  20. US Environmental Protection Agency. Do You Have Outdoor Air Monitoring Data for All Counties in the U.S.? Available online: https://www.epa.gov/outdoor-air-quality-data/do-you-have-outdoor-air-monitoring-data-all-counties-us (accessed on 5 February 2024).
  21. DeMarsh, K.; Valle, K.; Tyner, T.; Payton, D.; Reece, J.; Herrera, E.; Ha, S.; Goldman-Mellor, S.; Hirst, T.P.; Bradman, A.; et al. Evaluation of a Community Monitoring Network for Improved Characterization of PM2.5 Exposure in Fresno County, California, USA. Atmosphere 2026, 17, 187. [Google Scholar] [CrossRef] [Scilit]
  22. Meng, Y.Y.; Rull, R.P.; Wilhelm, M.; Lombardi, C.; Balmes, J.; Ritz, B. Outdoor air pollution and uncontrolled asthma in the San Joaquin Valley, California. J. Epidemiol. Community Health 2010, 64, 142–147. [Google Scholar] [CrossRef] [Scilit]
  23. Gharibi, H.; Entwistle, M.R.; Ha, S.; Gonzalez, M.; Brown, P.; Schweizer, D.; Cisneros, R. Ozone pollution and asthma emergency department visits in the Central Valley, California, USA, during June to September of 2015: A time-stratified case-crossover analysis. J. Asthma 2019, 56, 1037–1048. [Google Scholar] [CrossRef] [Scilit]
  24. San Joaquin Valley Air District Air Pollution Control District. Air Quality in the San Joaquin Valley. Available online: https://ww2.valleyair.org/media/4x5ng03o/short-presentation-for-web-2021.pdf (accessed on 4 March 2024).
  25. US Census Bureau. QuickFacts, Fresno County, California; United States. Available online: https://www.census.gov/quickfacts/fact/table/CA,fresnocountycalifornia/INC110223#INC110223 (accessed on 28 March 2025).
  26. SJVAir. About. Available online: https://www.sjvair.com/about/ (accessed on 5 February 2024).
  27. Goldman-Mellor, S.; Jia, Y.; Kwan, K.; Rutledge, J. Syndromic Surveillance of Mental and Substance Use Disorders: A Validation Study Using Emergency Department Chief Complaints. Psychiatr. Serv. 2018, 69, 55–60. [Google Scholar] [CrossRef] [Scilit]
  28. Jhun, I.; Coull, B.A.; Schwartz, J.; Hubbell, B.; Koutrakis, P. The impact of weather changes on air quality and health in the United States in 1994–2012. Environ. Res. Lett. 2015, 10, 084009. [Google Scholar] [CrossRef] [Scilit]
  29. Cong, X.; Xu, X.; Zhang, Y.; Wang, Q.; Xu, L.; Huo, X. Temperature drop and the risk of asthma: A systematic review and meta-analysis. Environ. Sci. Pollut. Res. 2017, 24, 22535–22546. [Google Scholar] [CrossRef] [Scilit]
  30. US Census Bureau. American Community Survey 5-Year Estimates. Available online: https://www.census.gov/data/developers/data-sets/acs-5year.html (accessed on 5 February 2024).
  31. Lee, D.; Rushworth, A.; Napier, G.; Pettersson, W. CARBayesST: Spatio-Temporal Generalized Linear Mixed Models for Areal Unit Data, 4.0 th; R package: 2023. Available online: https://cran.r-project.org/web/packages/CARBayesST/CARBayesST.pdf (accessed on 5 February 2024).
  32. Hamra, G.; Maclehose, R.; Richardson, D. Markov Chain Monte Carlo: An introduction for epidemiologists. Int. J. Epidemiol. 2013, 42, 627–634. [Google Scholar] [CrossRef] [Scilit]
  33. R Core Team. R: A Language and Environment for Statistical Computing; R Core Team: Vienna, Austria, 2022. [Google Scholar]
  34. US Environmental Protection Agency. NAAQS Table. Available online: https://www.epa.gov/criteria-air-pollutants/naaqs-table (accessed on 1 July 2024).
  35. Papadogeorgou, G.; Kioumourtzoglou, M.-A.; Braun, D.; Zanobetti, A. Low Levels of Air Pollution and Health: Effect Estimates, Methodological Challenges, and Future Directions. Curr. Environ. Health Rep. 2019, 6, 105–115. [Google Scholar] [CrossRef] [Scilit] [PubMed]
  36. World Health Organization. World Health Organization Global Air Quality Guidelines. Particulate Matter (PM2.5 and PM10), Ozone, Nitrogen Dioxide, Sulfur Dioxide and Carbon Monoxide; World Health Organization: Geneva, Switzerland, 2021. [Google Scholar]
  37. Bi, J.; D’Souza, R.R.; Moss, S.; Senthilkumar, N.; Russell, A.G.; Scovronick, N.C.; Chang, H.H.; Ebelt, S. Acute Effects of Ambient Air Pollution on Asthma Emergency Department Visits in Ten U.S. States. Environ. Health Perspect. 2023, 131, 047003. [Google Scholar] [CrossRef] [Scilit] [PubMed]
  38. Fan, J.; Li, S.; Fan, C.; Bai, Z.; Yang, K. The impact of PM2.5 on asthma emergency department visits: A systematic review and meta-analysis. Environ. Sci. Pollut. Res. 2016, 23, 843–850. [Google Scholar] [CrossRef] [Scilit] [PubMed]
  39. Orellano, P.; Quaranta, N.; Reynoso, J.; Balbi, B.; Vasquez, J. Effect of outdoor air pollution on asthma exacerbations in children and adults: Systematic review and multilevel meta-analysis. PLoS ONE 2017, 12, e0174050. [Google Scholar] [CrossRef] [Scilit] [PubMed]
  40. Almqvist, C.; Worm, M.; Leynaert, B. Impact of gender on asthma in childhood and adolescence: A GA2LEN review. Allergy 2008, 63, 47–57. [Google Scholar] [CrossRef] [Scilit]
  41. Schatz, M.; Camargo, C.A. The relationship of sex to asthma prevalence, health care utilization, and medications in a large managed care organization. Ann. Allergy Asthma Amp. Immunol. 2003, 91, 553–558. [Google Scholar] [CrossRef] [Scilit]
  42. Fuseini, H.; Newcomb, D.C. Mechanisms Driving Gender Differences in Asthma. Curr. Allergy Asthma Rep. 2017, 17, 19. [Google Scholar] [CrossRef] [Scilit]
  43. Darrow, L.A.; Klein, M.; Flanders, W.D.; Mulholland, J.A.; Tolbert, P.E.; Strickland, M.J. Air Pollution and Acute Respiratory Infections Among Children 0–4 Years of Age: An 18-Year Time-Series Study. Am. J. Epidemiol. 2014, 180, 968–977. [Google Scholar] [CrossRef] [Scilit]
  44. Zarate-Gonzalez, G.; Cisneros, R.; Gharibi, H.; Brown, P. Air pollution related adverse respiratory health outcomes in California’s San Joaquin Valley: Evidence from 2016 linked emergency department and hospital records. Environ. Res. Health 2024, 2, 025003. [Google Scholar] [CrossRef] [Scilit]
  45. Zarate-Gonzalez, G.; Brown, P.; Cisneros, R. Costs of Air Pollution in California’s San Joaquin Valley: A Societal Perspective of the Burden of Asthma on Emergency Departments and Inpatient Care. J. Asthma Allergy 2024, 17, 369–382. [Google Scholar] [CrossRef] [Scilit]
  46. Winquist, A.; Klein, M.; Tolbert, P.; Flanders, W.D.; Hess, J.; Sarnat, S.E. Comparison of emergency department and hospital admissions data for air pollution time-series studies. Environ. Health 2012, 11, 70. [Google Scholar] [CrossRef] [Scilit]
  47. Valle, K. Assessing the Respiratory Health Effects of Air Pollutants and Pesticide Exposure in Rural California Communities. Ph.D. Dissertation, University of California, Merced, Merced, CA, USA, 2024. [Google Scholar]
Figure 1. Weekly counts of emergency department visits for pediatric respiratory outcomes in Fresno County, California.
Atmosphere 17 00534 g001
Figure 2. Weekly distribution of particulate matter 2.5 (ug/m3) in Fresno County, California. Each gray dot in the plot represents the weekly average particulate matter 2.5 (PM2.5, ug/m3) for each zip code. The mean is displayed in the blue triangles, while the median is shown by orange squares. The yellow horizontal line represents the U.S. EPA National Air Quality Standards (NAAQS) annual PM2.5 standard (9.0 µg/m3); the orange horizontal line represents the daily standard (35 µg/m3).
Atmosphere 17 00534 g002
Figure 3. Associations between ambient particulate matter 2.5 and weekly pediatric respiratory emergency department visits in Fresno County, California. Relative risk was calculated for particulate matter 2.5 (PM2.5) and emergency department at the week and zip code level. Association represents the logarithm 10 of the PM2.5 concentration plus one. Red diamonds represent the estimated relative risk, and vertical lines represent the 95% credible intervals (CrI). Each bar represents the results of a Bayesian spatiotemporal Poisson model that is controlled for temperature, an indicator of the cold season, an interaction between temperature and cold season, and population estimates from the ACS.
Atmosphere 17 00534 g003
Figure 4. Associations between particulate matter 2.5 and emergency department pediatric respiratory visits by sex in Fresno County, California. Relative risk (RR) was calculated for particulate matter 2.5 (PM2.5) and emergency department visits at the week and zip code level stratified by sex. Association represents the logarithm 10 of the PM2.5 concentration plus one. Each bar represents the results of a Bayesian spatiotemporal Poisson model that is controlled for temperature, an indicator of the cold season, an interaction between temperature and cold season, and population estimates from the ACS.
Atmosphere 17 00534 g004
Figure 5. Associations between particulate matter 2.5 and emergency department pediatric respiratory visits by age group in Fresno County, California. Relative risk (RR) was calculated for particulate matter 2.5 (PM2.5) and emergency department visits at the week and zip code level stratified by age group. Association represents the logarithm 10 of the PM2.5 concentration plus one. Each bar represents the results of a Bayesian spatiotemporal Poisson model that is controlled for temperature, an indicator of the cold season, an interaction between temperature and cold season, and population estimates from the ACS.
Atmosphere 17 00534 g005
Table 1. Characteristics of pediatric respiratory emergency department visits in Fresno County, California.
Fresno County Department of Public Health and Valley Children’s Hospital 1Valley Children’s Hospital 1Fresno County Department of Public Health 1
Characteristicn = 68,741n = 46,625n = 22,116
ICD-10-CM category
Respiratory Infections51,498 (74%)31,317 (67%)20,181 (88%)
Asthma17,416 (25%)15,095 (32%)2321 (10%)
Other Chronic Respiratory Conditions519 (1%)213 (<1%)306 (1%)
Sex
Male38,687 (56%)26,684 (57%)12,003 (54%)
Female30,054 (44%)19,941 (43%)10,113 (46%)
Age
0–432,246 (47%)22,840 (49%)9406 (43%)
5–919,647 (29%)13,063 (28%)6584 (30%)
10–1411,412 (17%)7392 (16%)4020 (18%)
15–175436 (8%)3330 (7%)2106 (10%)
Race/Ethnicity
Hispanic49,215 (72%)34,360 (74%)14,855 (67%)
Non-Hispanic19,526 (28%)12,265 (26%)7261 (33%)
Diagnosis
Primary--27,533 (59%)--
Secondary--19,092 (41%)--
1 n (%); -- indicates data not available.
Table 2. Weekly average emergency department visits for respiratory outcomes 1.
Respiratory Outcomesn
Respiratory Infections360.1
Asthma121.8
Other Chronic Respiratory Conditions3.6
Total visits480.7
1 n = 68,741.
Disclaimer/Publisher’s Note: The statements, opinions and data contained in all publications are solely those of the individual author(s) and contributor(s) and not of MDPI and/or the editor(s). MDPI and/or the editor(s) disclaim responsibility for any injury to people or property resulting from any ideas, methods, instructions or products referred to in the content.