1. Introduction
Flash floods are rapidly accumulating floods that occur in small mountainous basins. As a common natural disaster in China, flash floods are characterised by suddenness, high frequency, and poor predictability [
1]. The flash flood prevention and control area in China covers an area of 3.86 million square kilometres, threatening 570,000 villages and 300 million people. Since the 1990s, China’s flash floods have accounted for more than 60% of flood disasters and have been the main factor raising the severity of flood disasters [
2]. Chongqing is located in the transitional zone between the Tibetan Plateau and the middle and lower reaches of the Yangtze River, where mountainous and hilly terrain covers more than 90% of the territory [
3]. Complex topographic and geological conditions, frequent rainstorms, dense population distribution, and excessive human activities have led to frequent flash floods in Chongqing. From 2001 to 2019, 364 rainstorms and floods occurred in Chongqing, causing economic losses of 53.745 billion yuan, and 763 people were killed or missing, of which more than 70% were caused by flash floods alone [
4]. In the context of climate change, the frequency and intensity of heavy precipitation in some regions are projected to increase [
5,
6]. Chongqing is likely to encounter more frequent flash floods, which will adversely affect the defence work implemented by government departments and the public. Therefore, conducting scientific flash flood risk assessments is of considerable significance for understanding the distribution of flash flood risk areas in Chongqing.
Many studies have recently been conducted on the risk assessment of natural disasters [
7,
8,
9,
10,
11,
12,
13], with scholars generally focusing on the flood risk of major rivers and urban waterlogging risk, drought risks, and flash flood risks [
14,
15,
16,
17,
18]. The AHP is simple to calculate and suitable for multi-objective decision analysis, and it is widely used in risk assessment. For example, a multi-criteria analytical model based on the AHP-entropy method was used for long- and short-term flood risk evaluation of the Poyang Lake Basin, which considered six flood hazard factors and four flood vulnerability factors, namely maximum three-day rainfall and population density [
19]. A methodology for comprehensively assessing flash flood risk was used in Guangdong Province, China, using the improved AHP and the maximum likelihood clustering algorithm [
11]. Many influencing factors were incorporated into the assessment model, such as rainfall [
20], underlay, slope, vegetation cover, and economic properties, all of which contributed to the regional flash flood defence capability [
21,
22]. These studies provided valuable knowledge, yet they exhibited two main limitations when applied to flash flood risk in mountainous regions. First, the assessments were typically conducted at coarse spatial scales and thus could not effectively identify the small river channels where flash floods actually originated. Second, the indicator systems relied heavily on generic, readily available geospatial data (e.g., regional rainfall, topography, and population density) [
21,
23], while the findings of dedicated flash flood disaster investigation and evaluation projects, which contained rich field-validated information [
24] (e.g., historically calibrated rainfall thresholds, surveyed at-risk populations, existing monitoring stations, and flood control capacities), remained largely unused. Ignoring these empirically grounded data might result in inaccurate identification of risk factors and an inability to reflect local disaster prevention capabilities.
To address these gaps, this study developed a refined flash flood risk assessment framework for mountainous regions. The primary novelty lay not in the use of AHP and GIS tools themselves, but in how we grounded the framework with high-resolution, field-validated data and implemented the assessment at a fine spatial resolution. In doing so, we shifted the AHP framework from a purely expert-driven model to a hybrid model calibrated by field-validated data, thereby significantly enhancing the reliability and local relevance of risk zoning. Furthermore, the synergistic combination of enriched indicators and refined assessment units yielded a risk map with markedly improved spatial accuracy, which more precisely delineated high-risk hotspots and effectively reduced both over-generalisation and false positives, offering a more trustworthy basis for targeted early warning and mitigation resource allocation.
Specifically, the study established a flash flood disaster risk assessment framework based on risk assessment theory by AHP [
25], factor analysis, and cluster analysis [
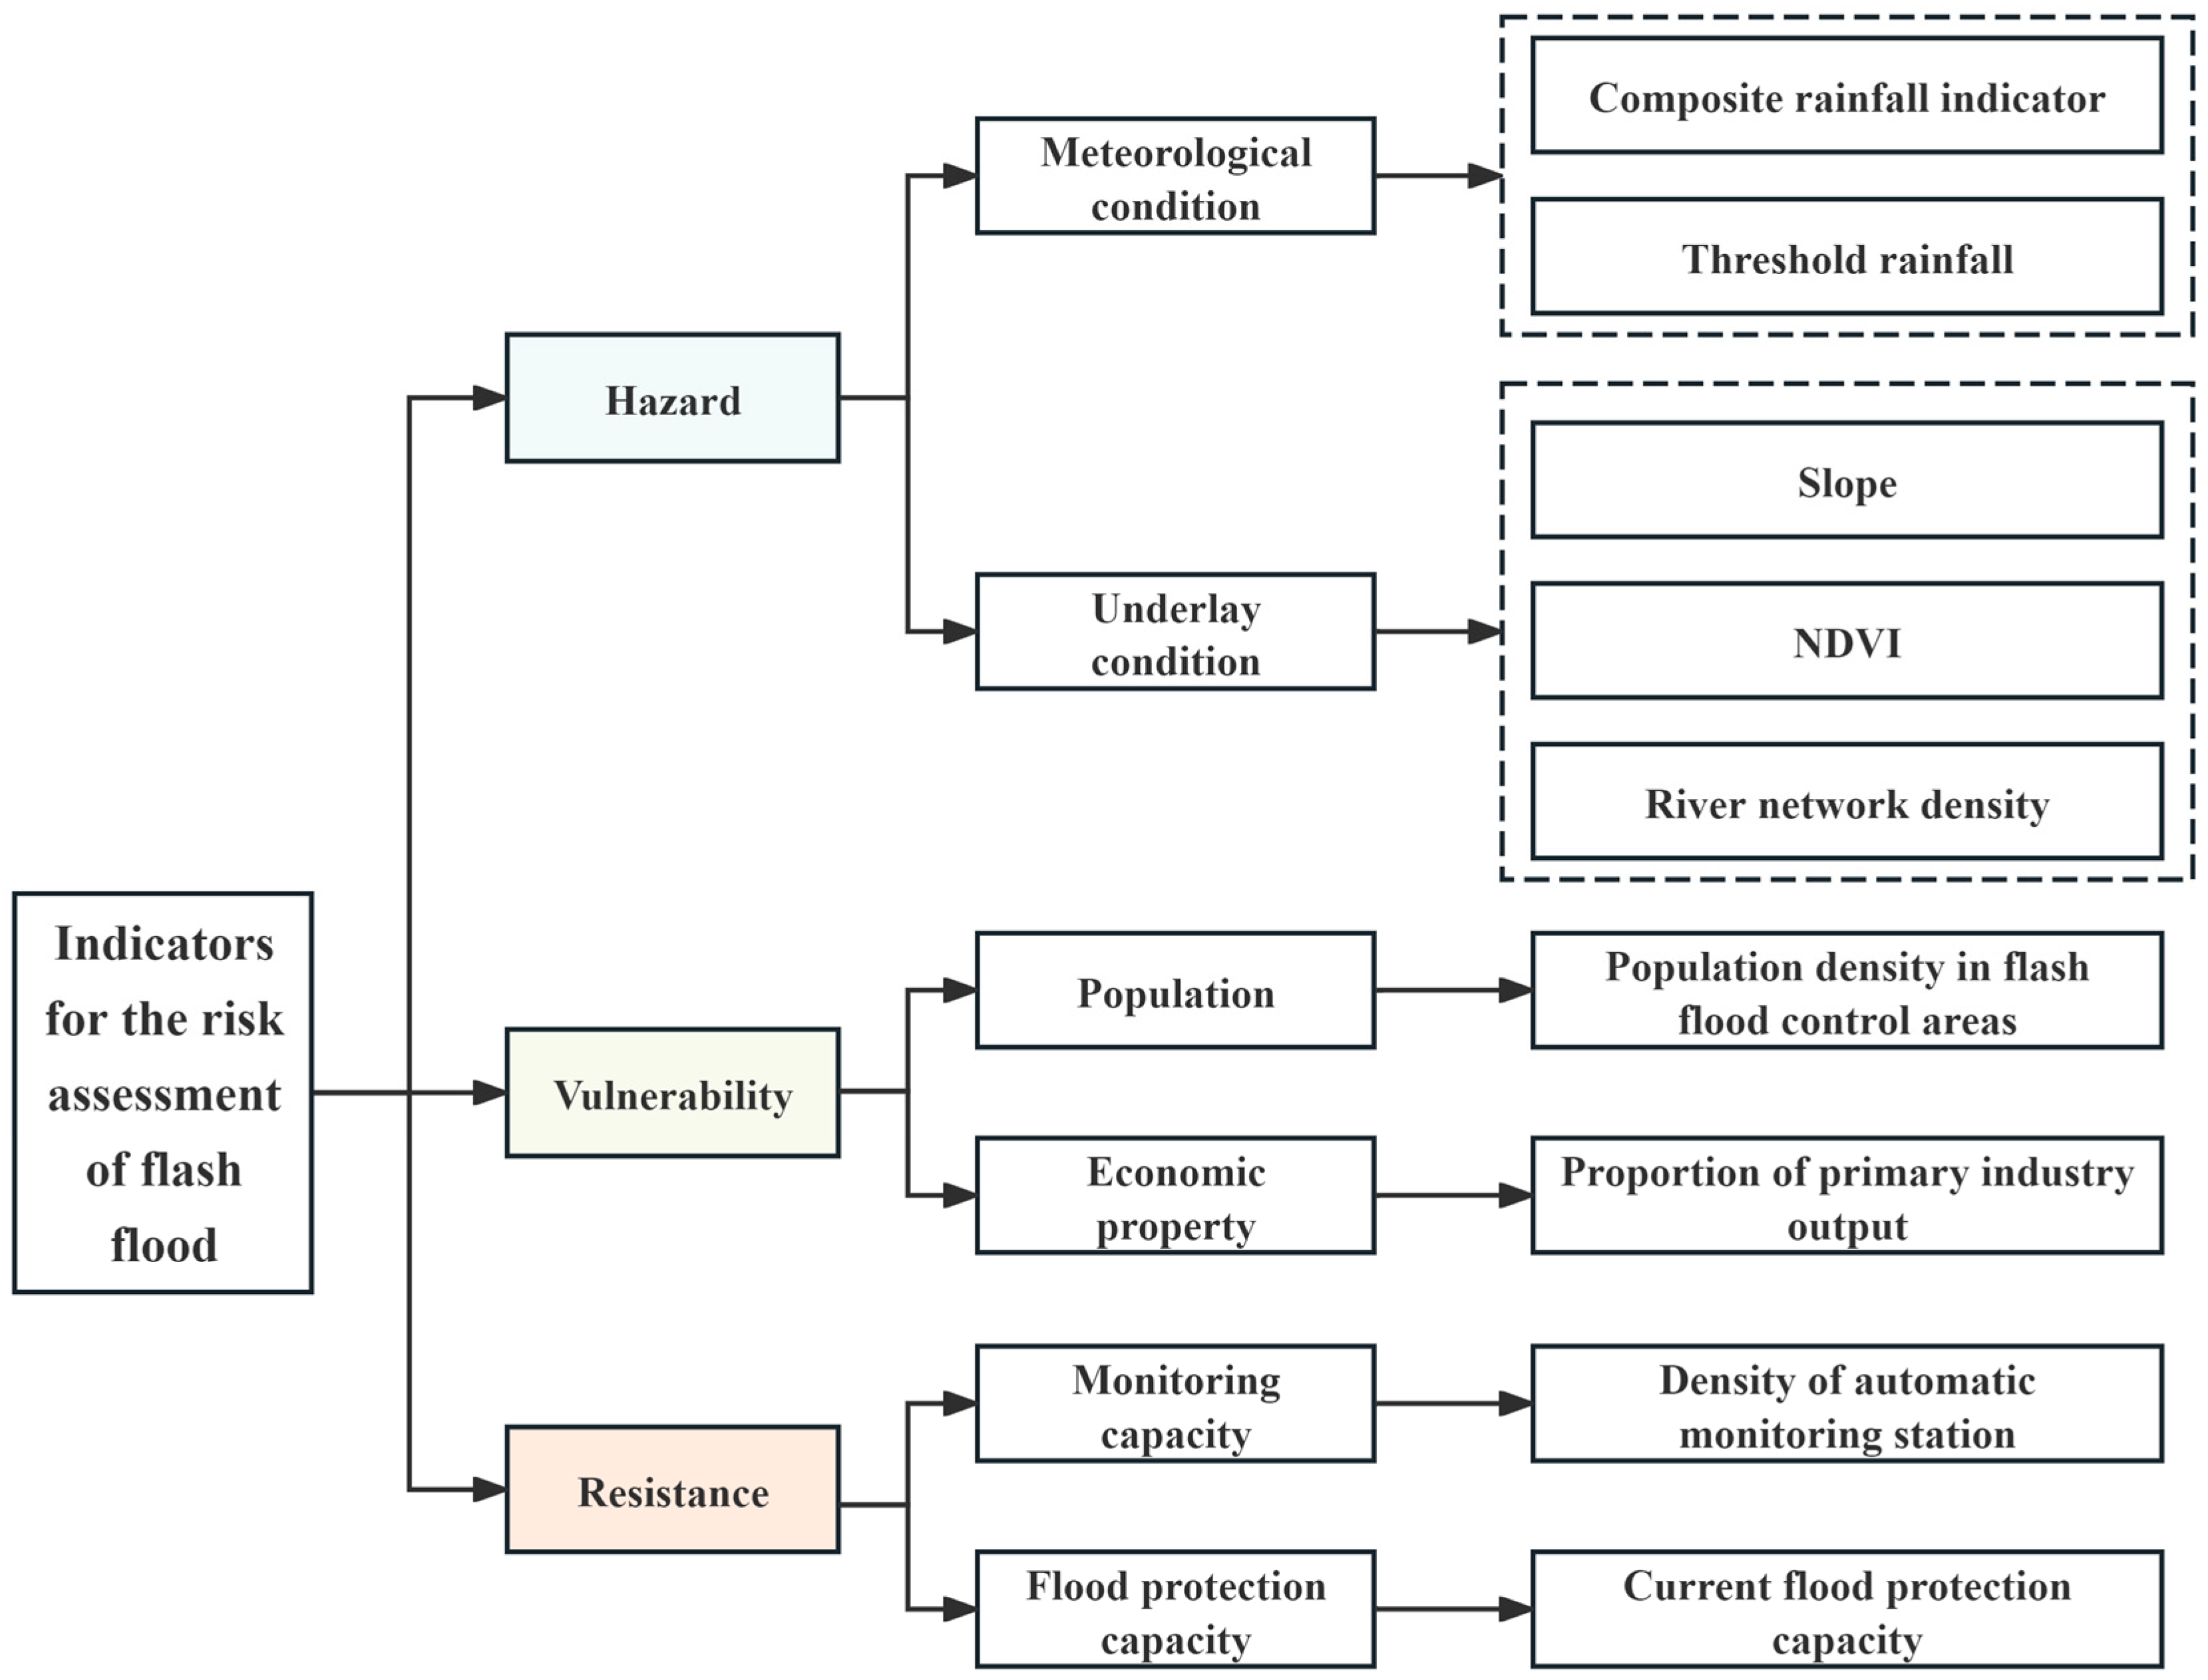
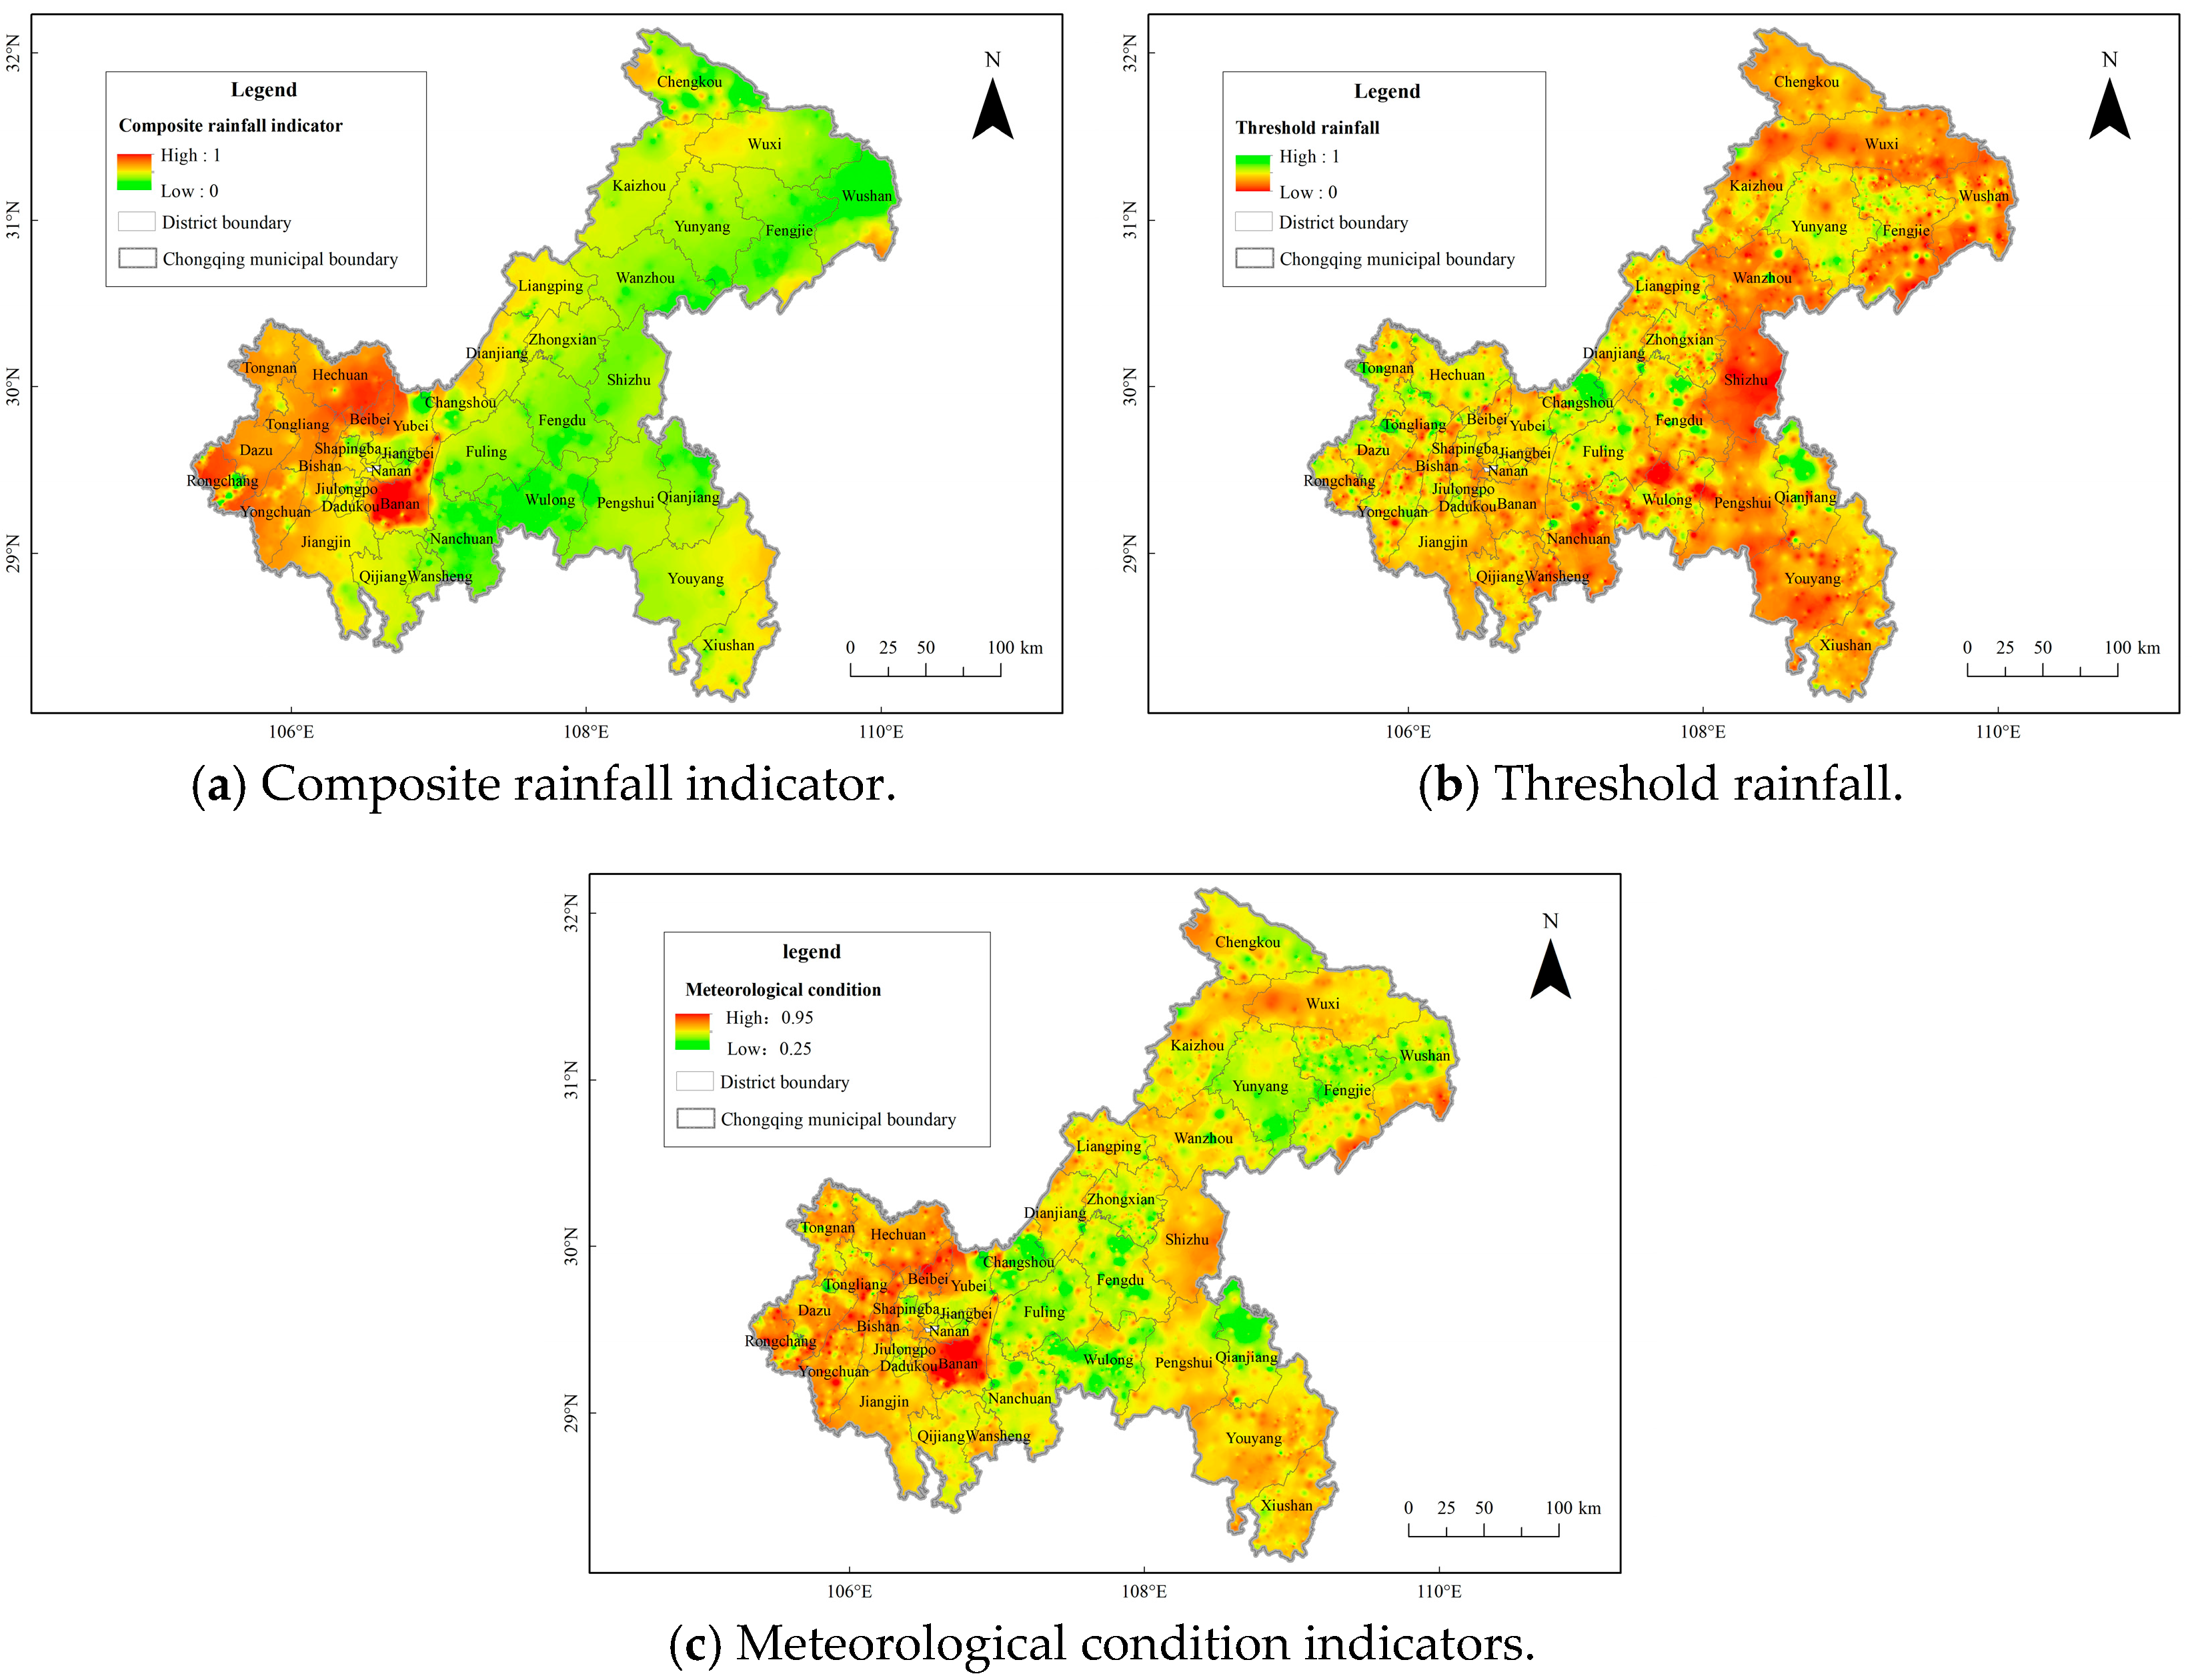
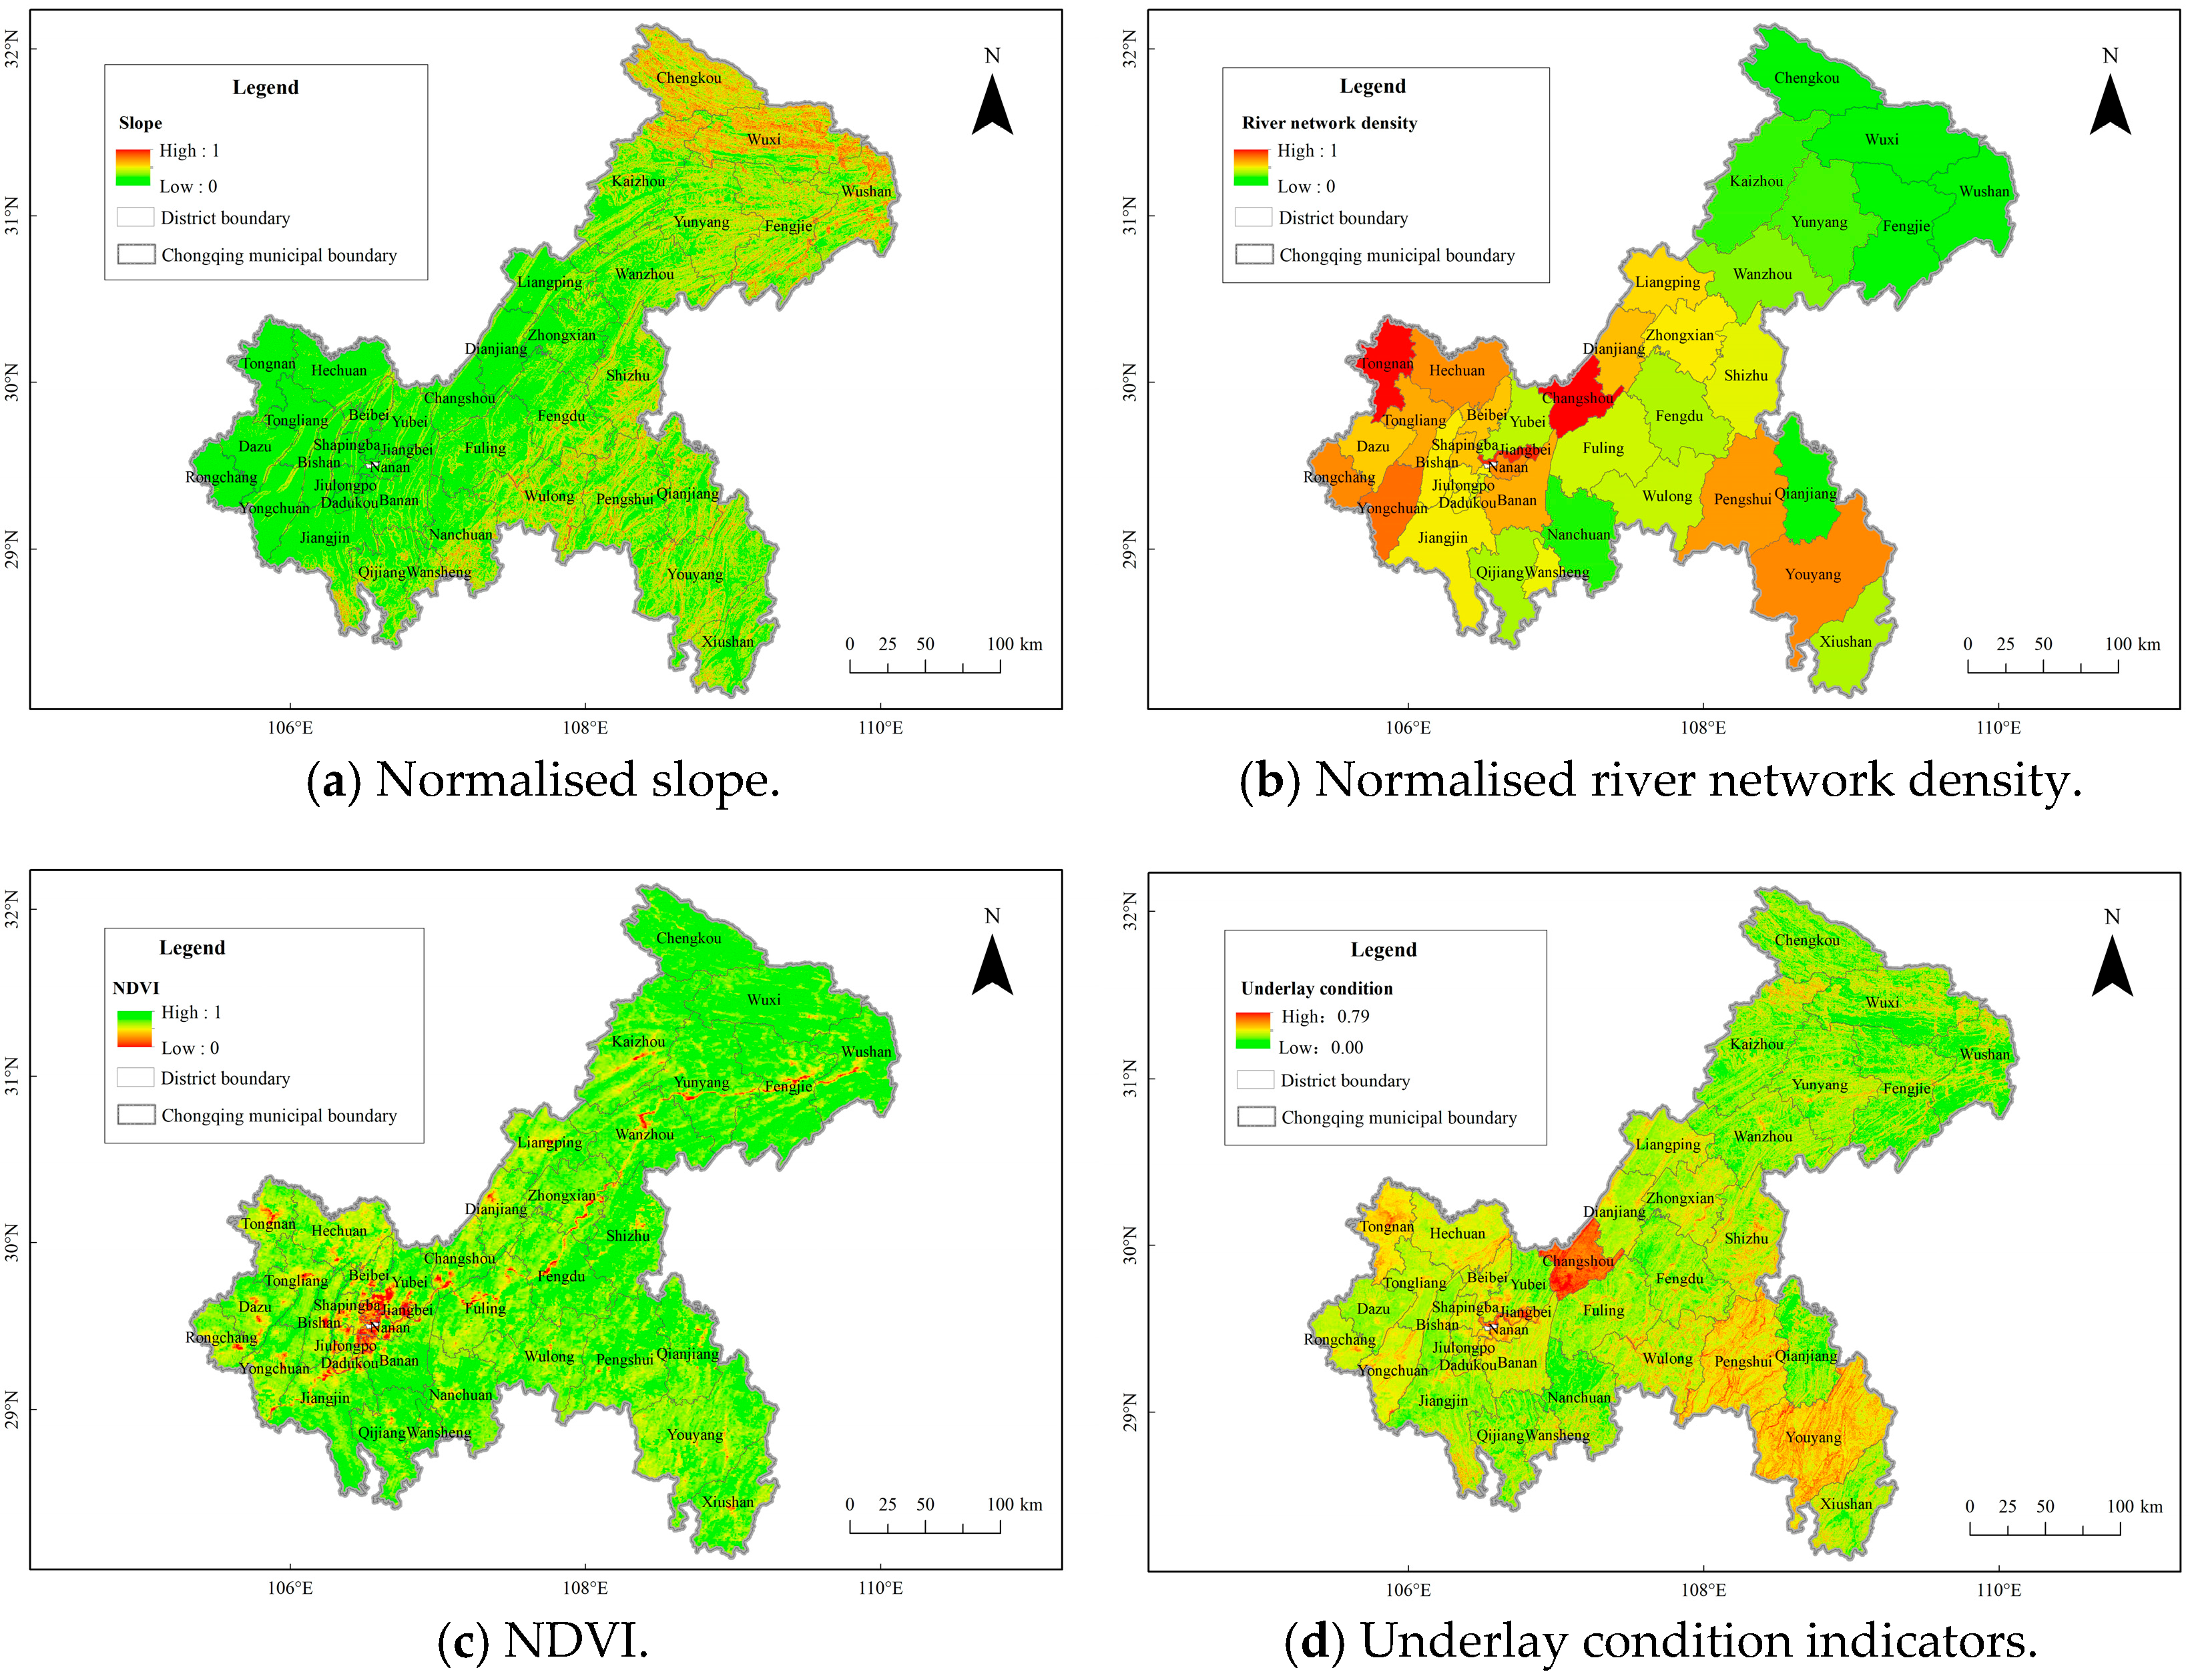
26], with Chongqing, China, as the study area and an assessment unit of 30 m. In particular, we innovatively integrate the achievements of Chongqing’s flash flood disaster investigation and evaluation project into the AHP indicator system. The indicators considered in this study include meteorological conditions (
composite rainfall indicator and threshold rainfall), underlay conditions (slope, NDVI, and
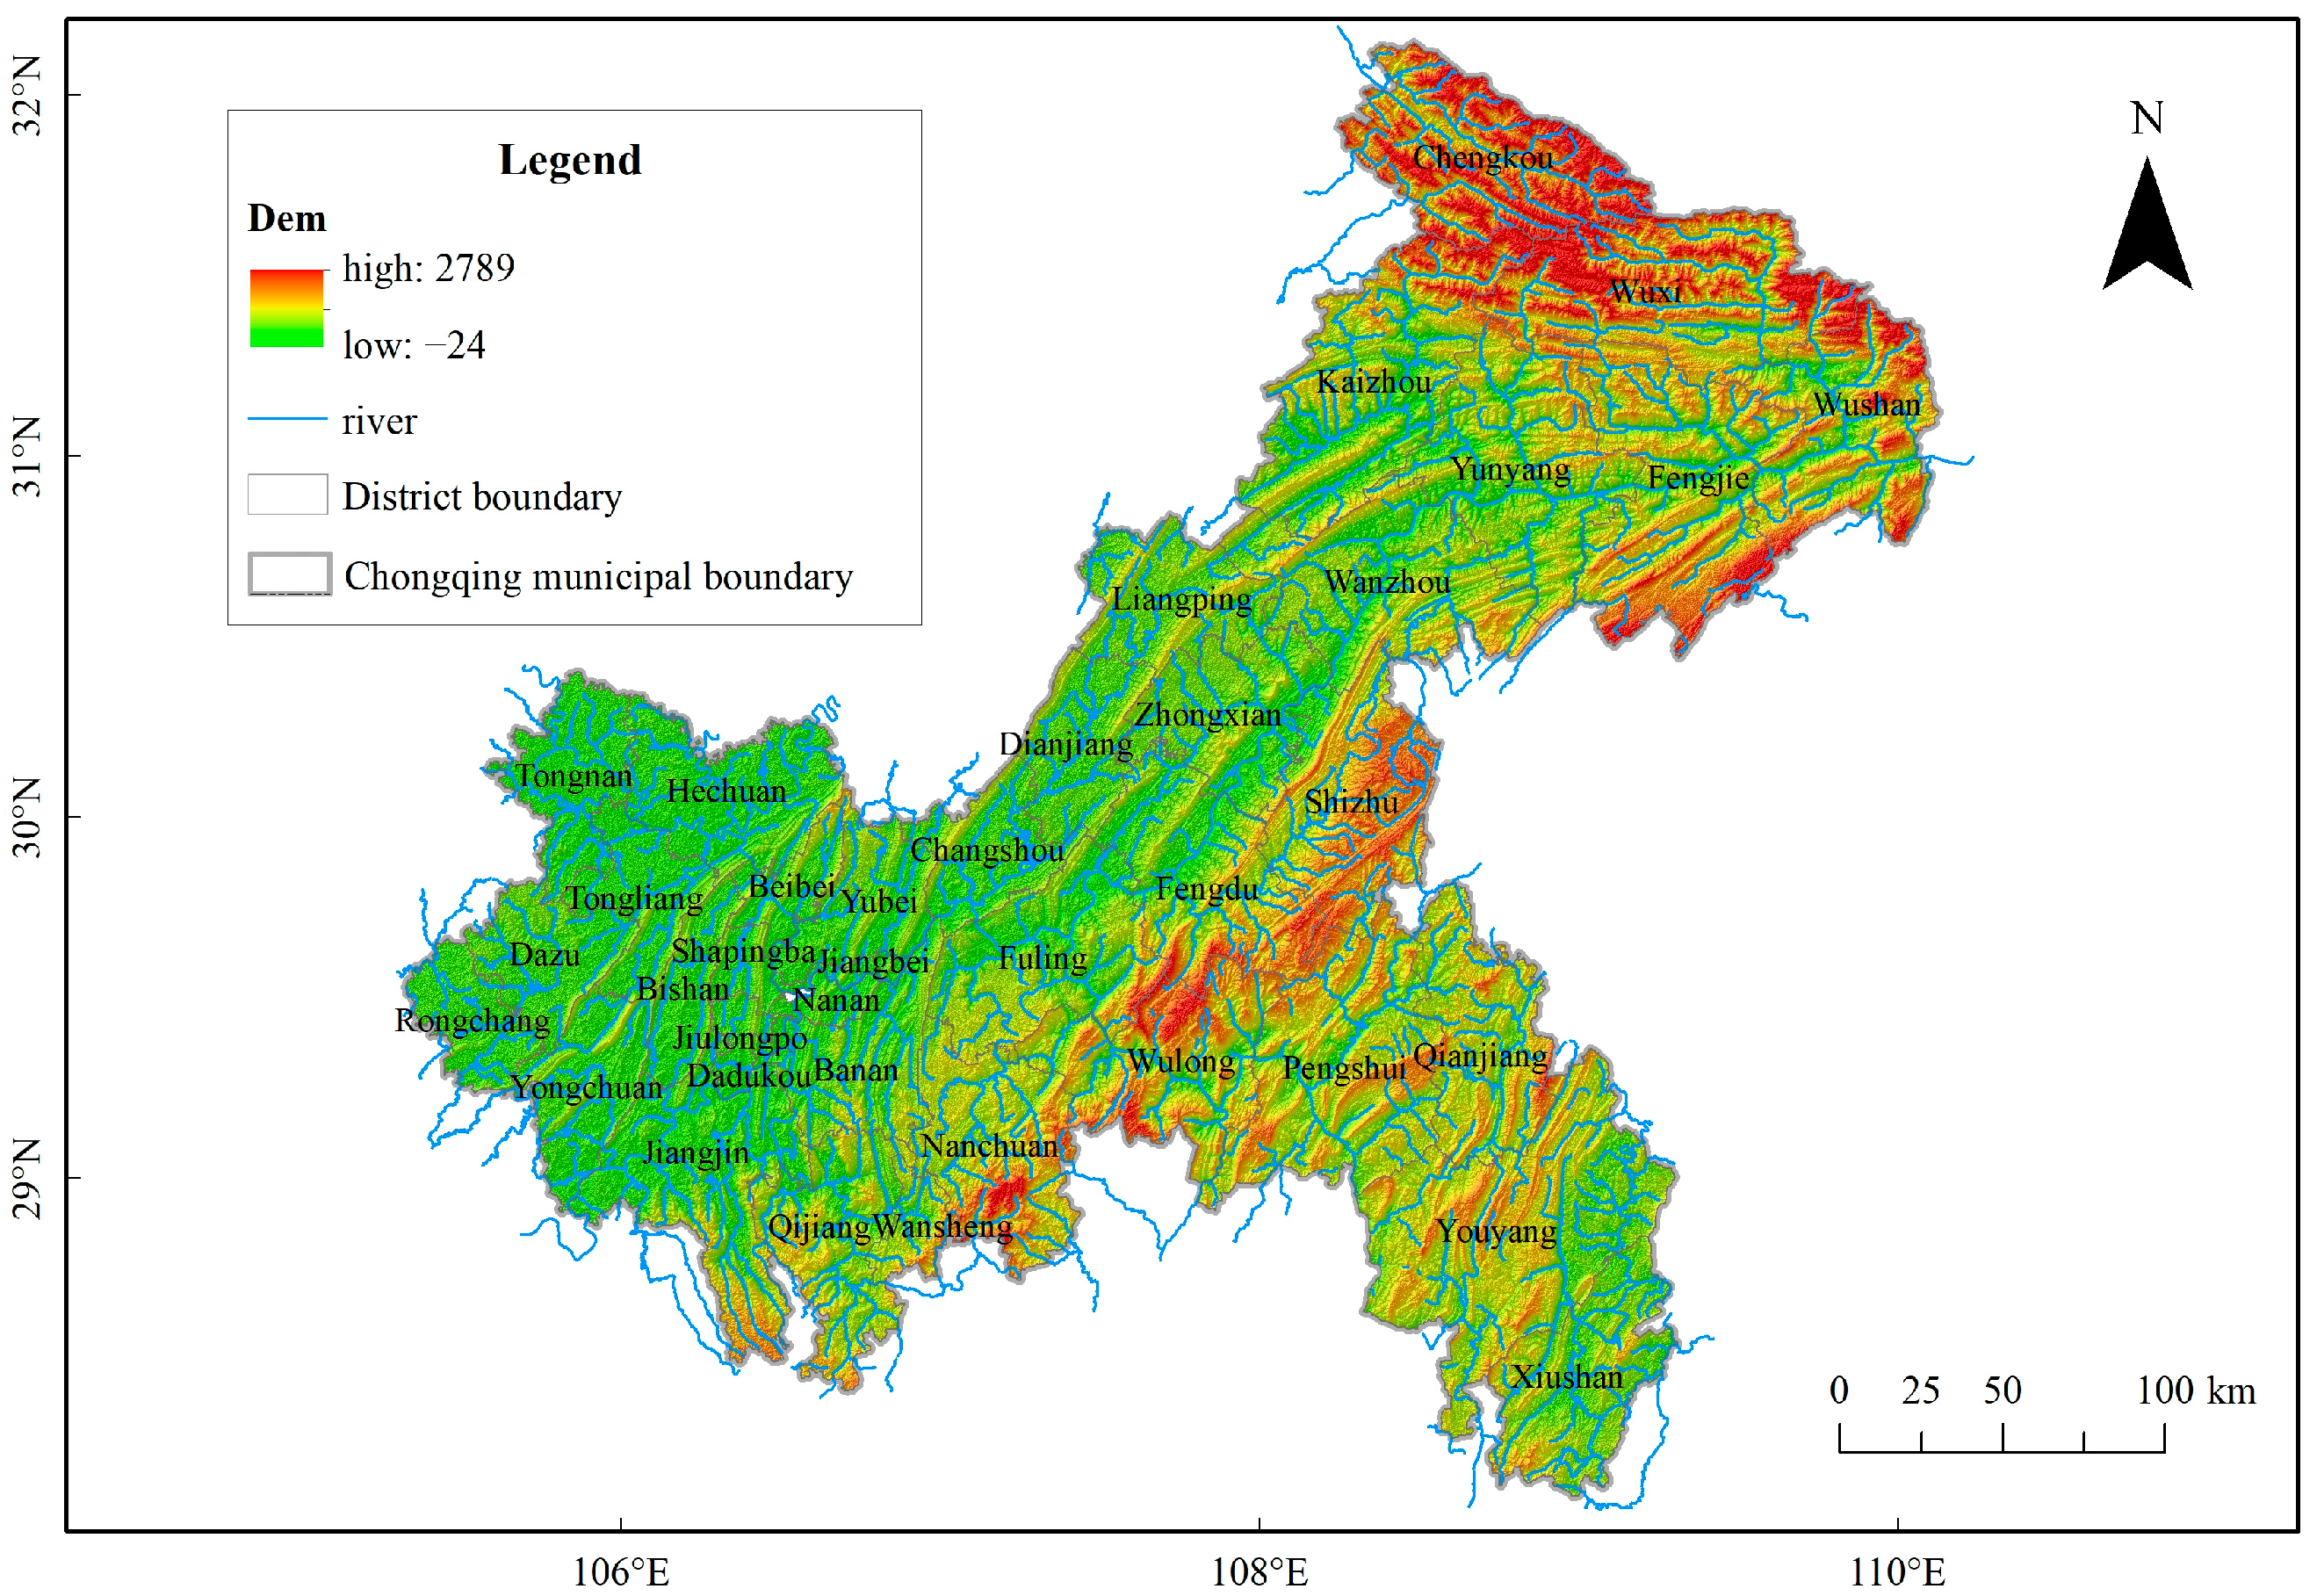
river network density), population indicators (
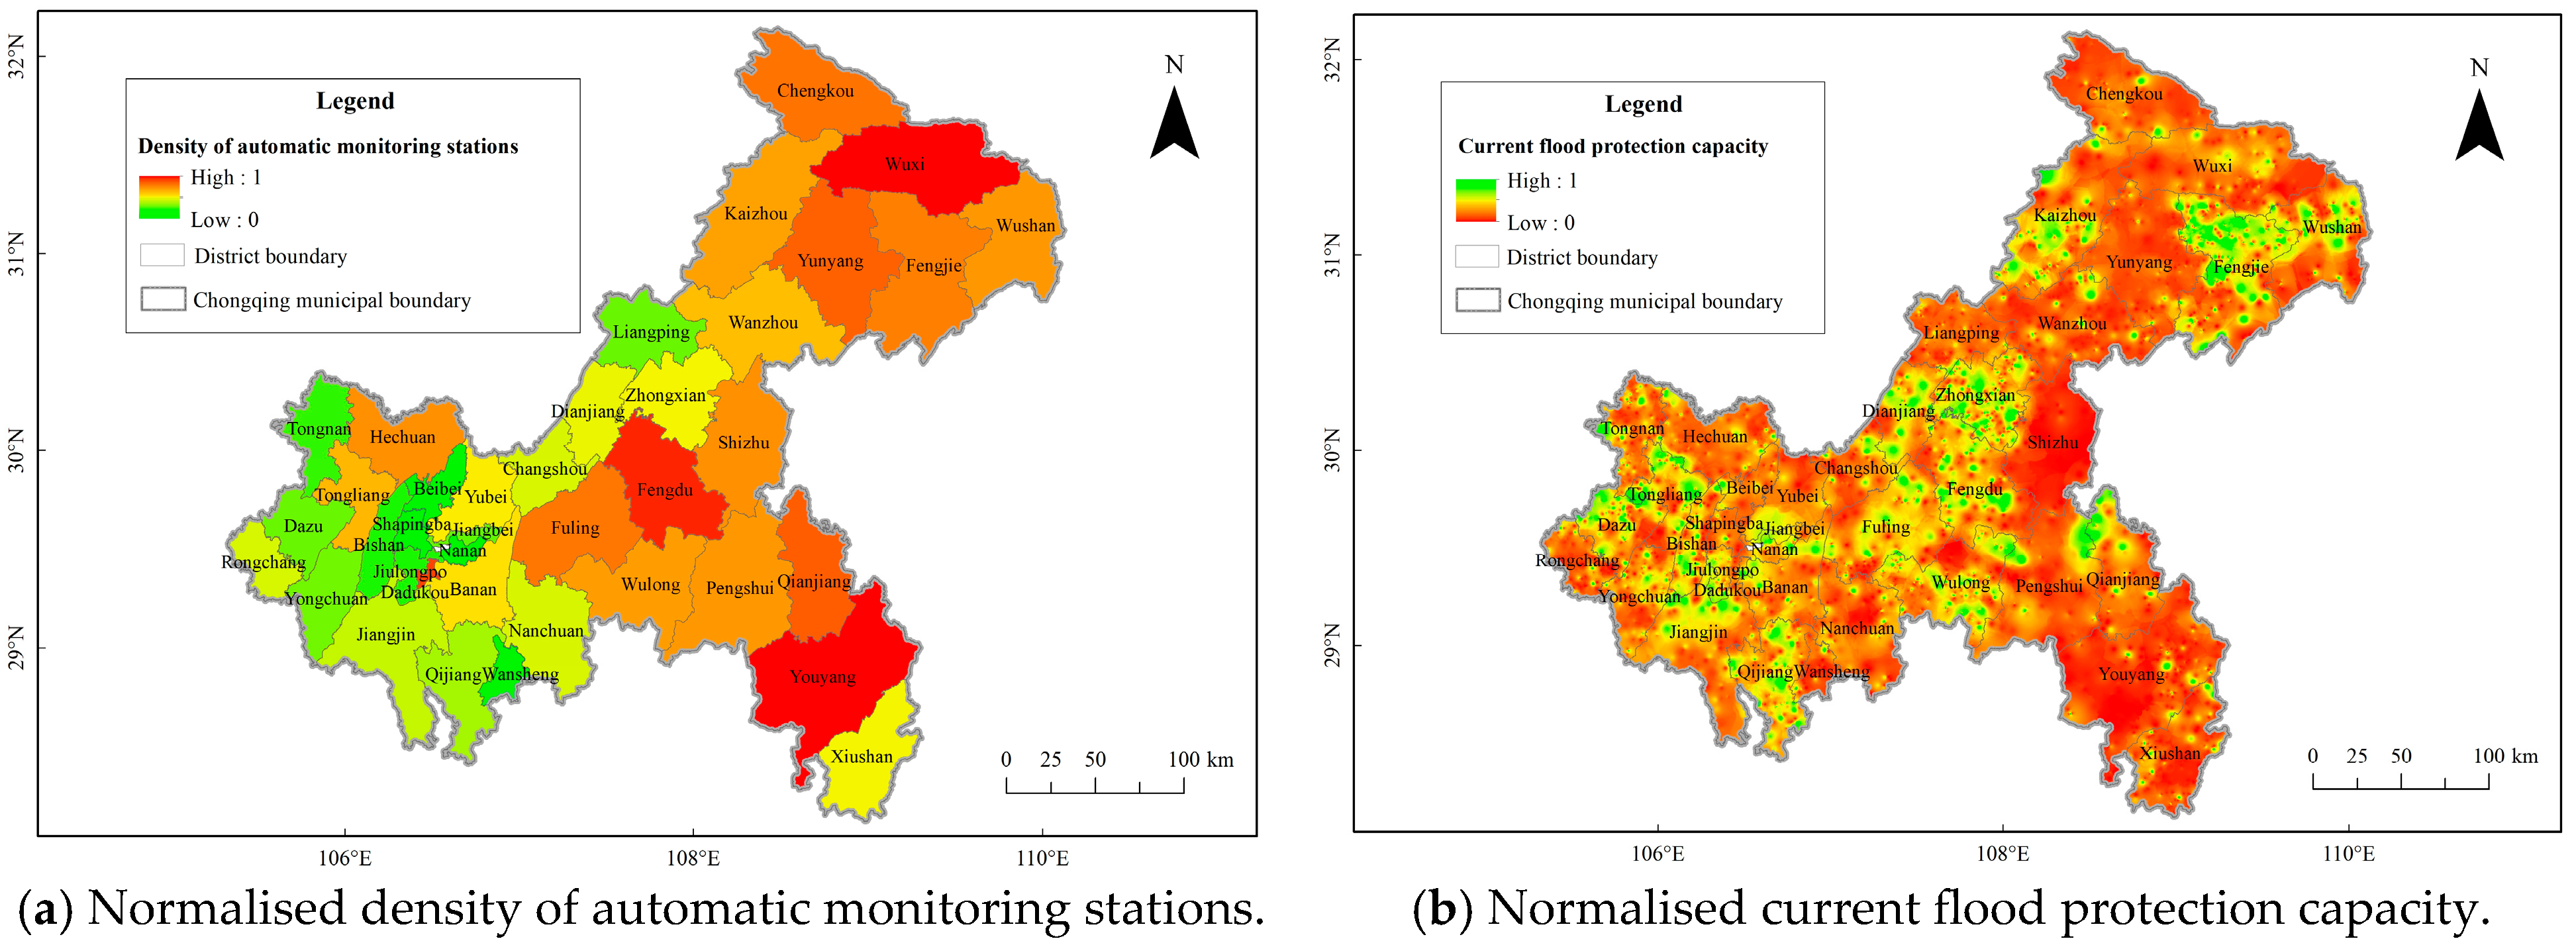
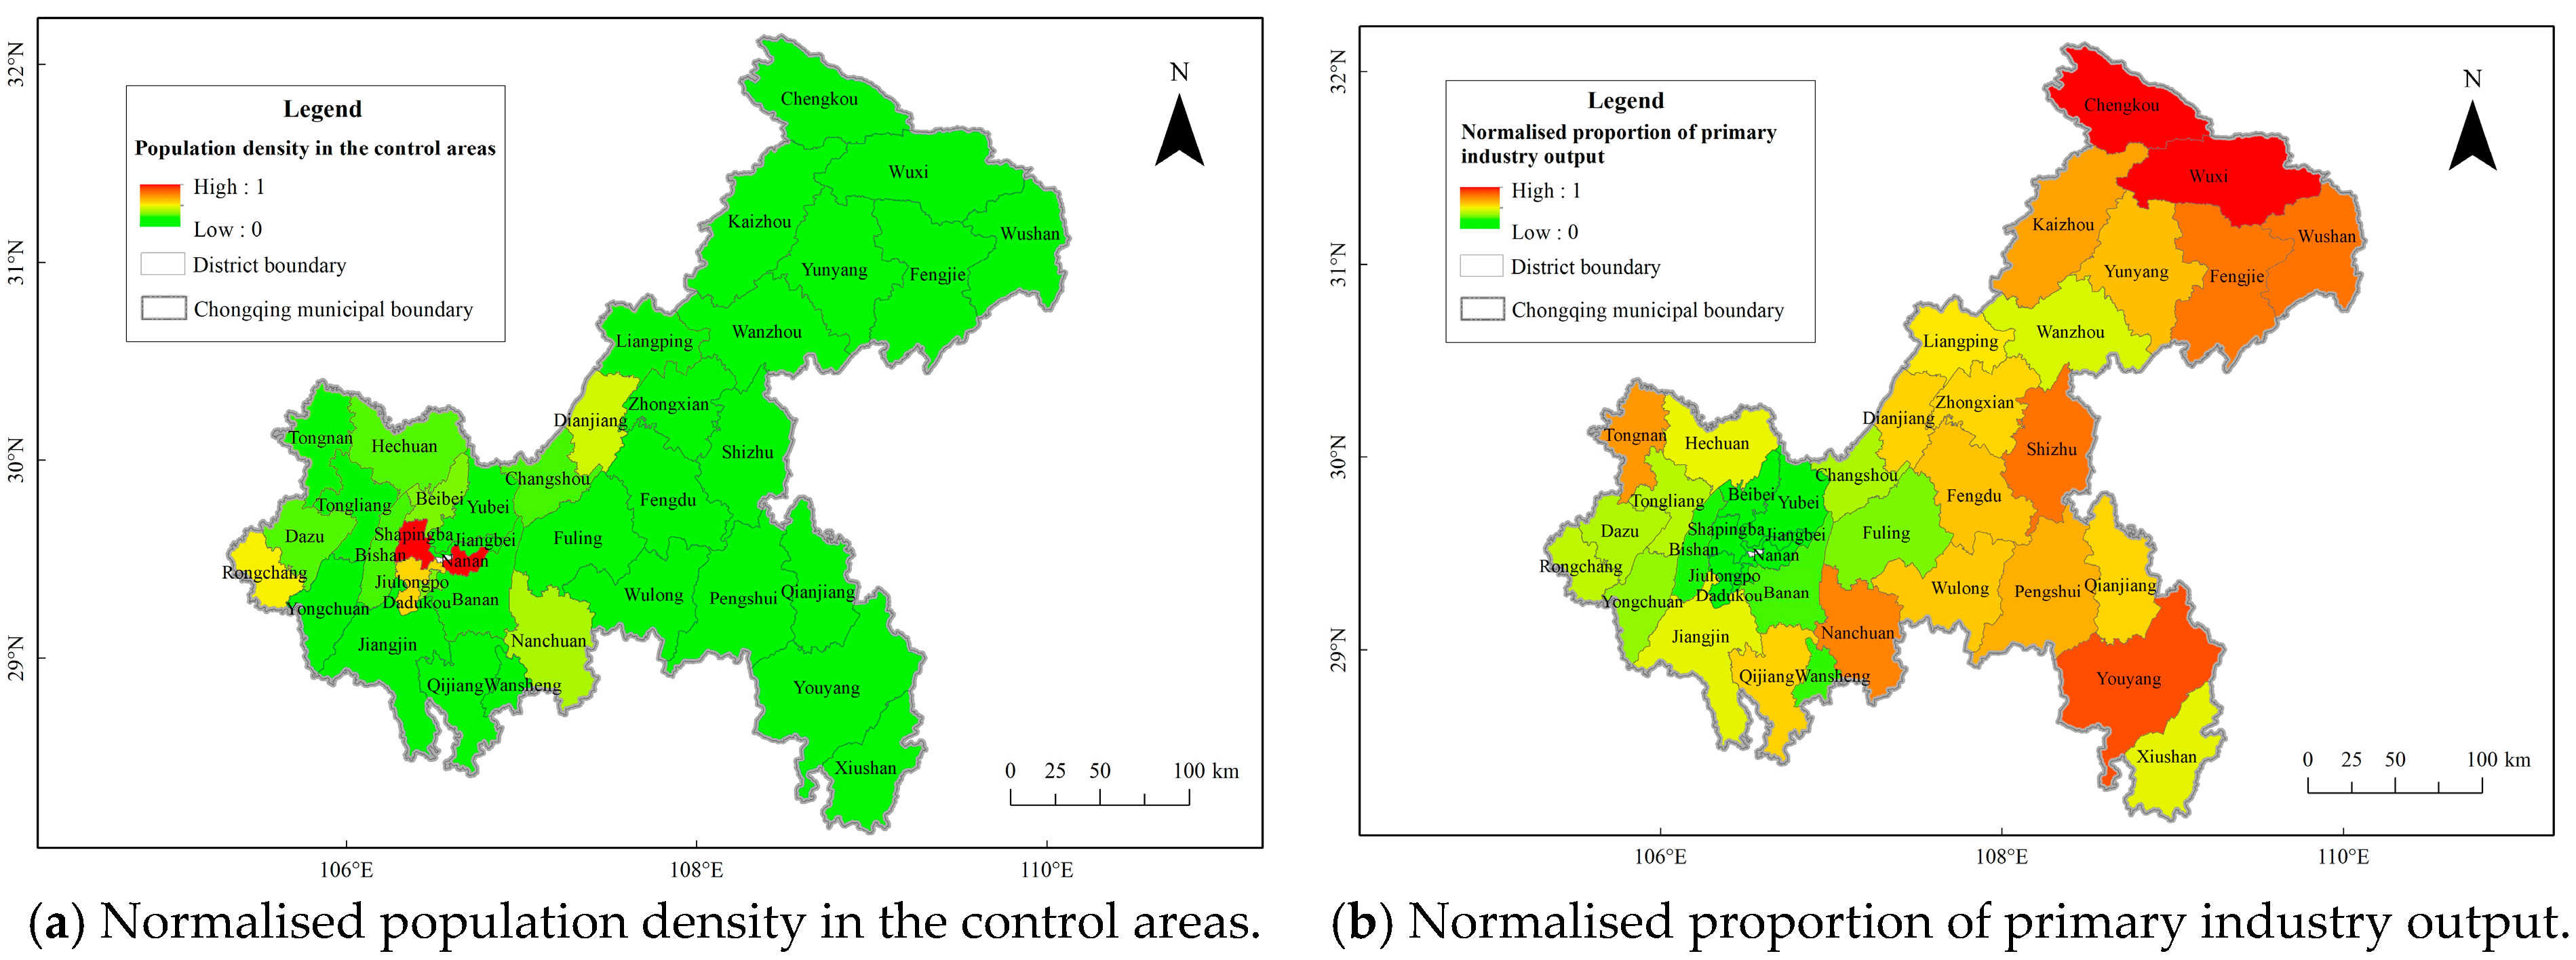
population density in flash flood control areas), economic property indicators (proportion of primary industry output), monitoring capacity indicators (
density of automatic monitoring stations), and flood protection capacity indicators (
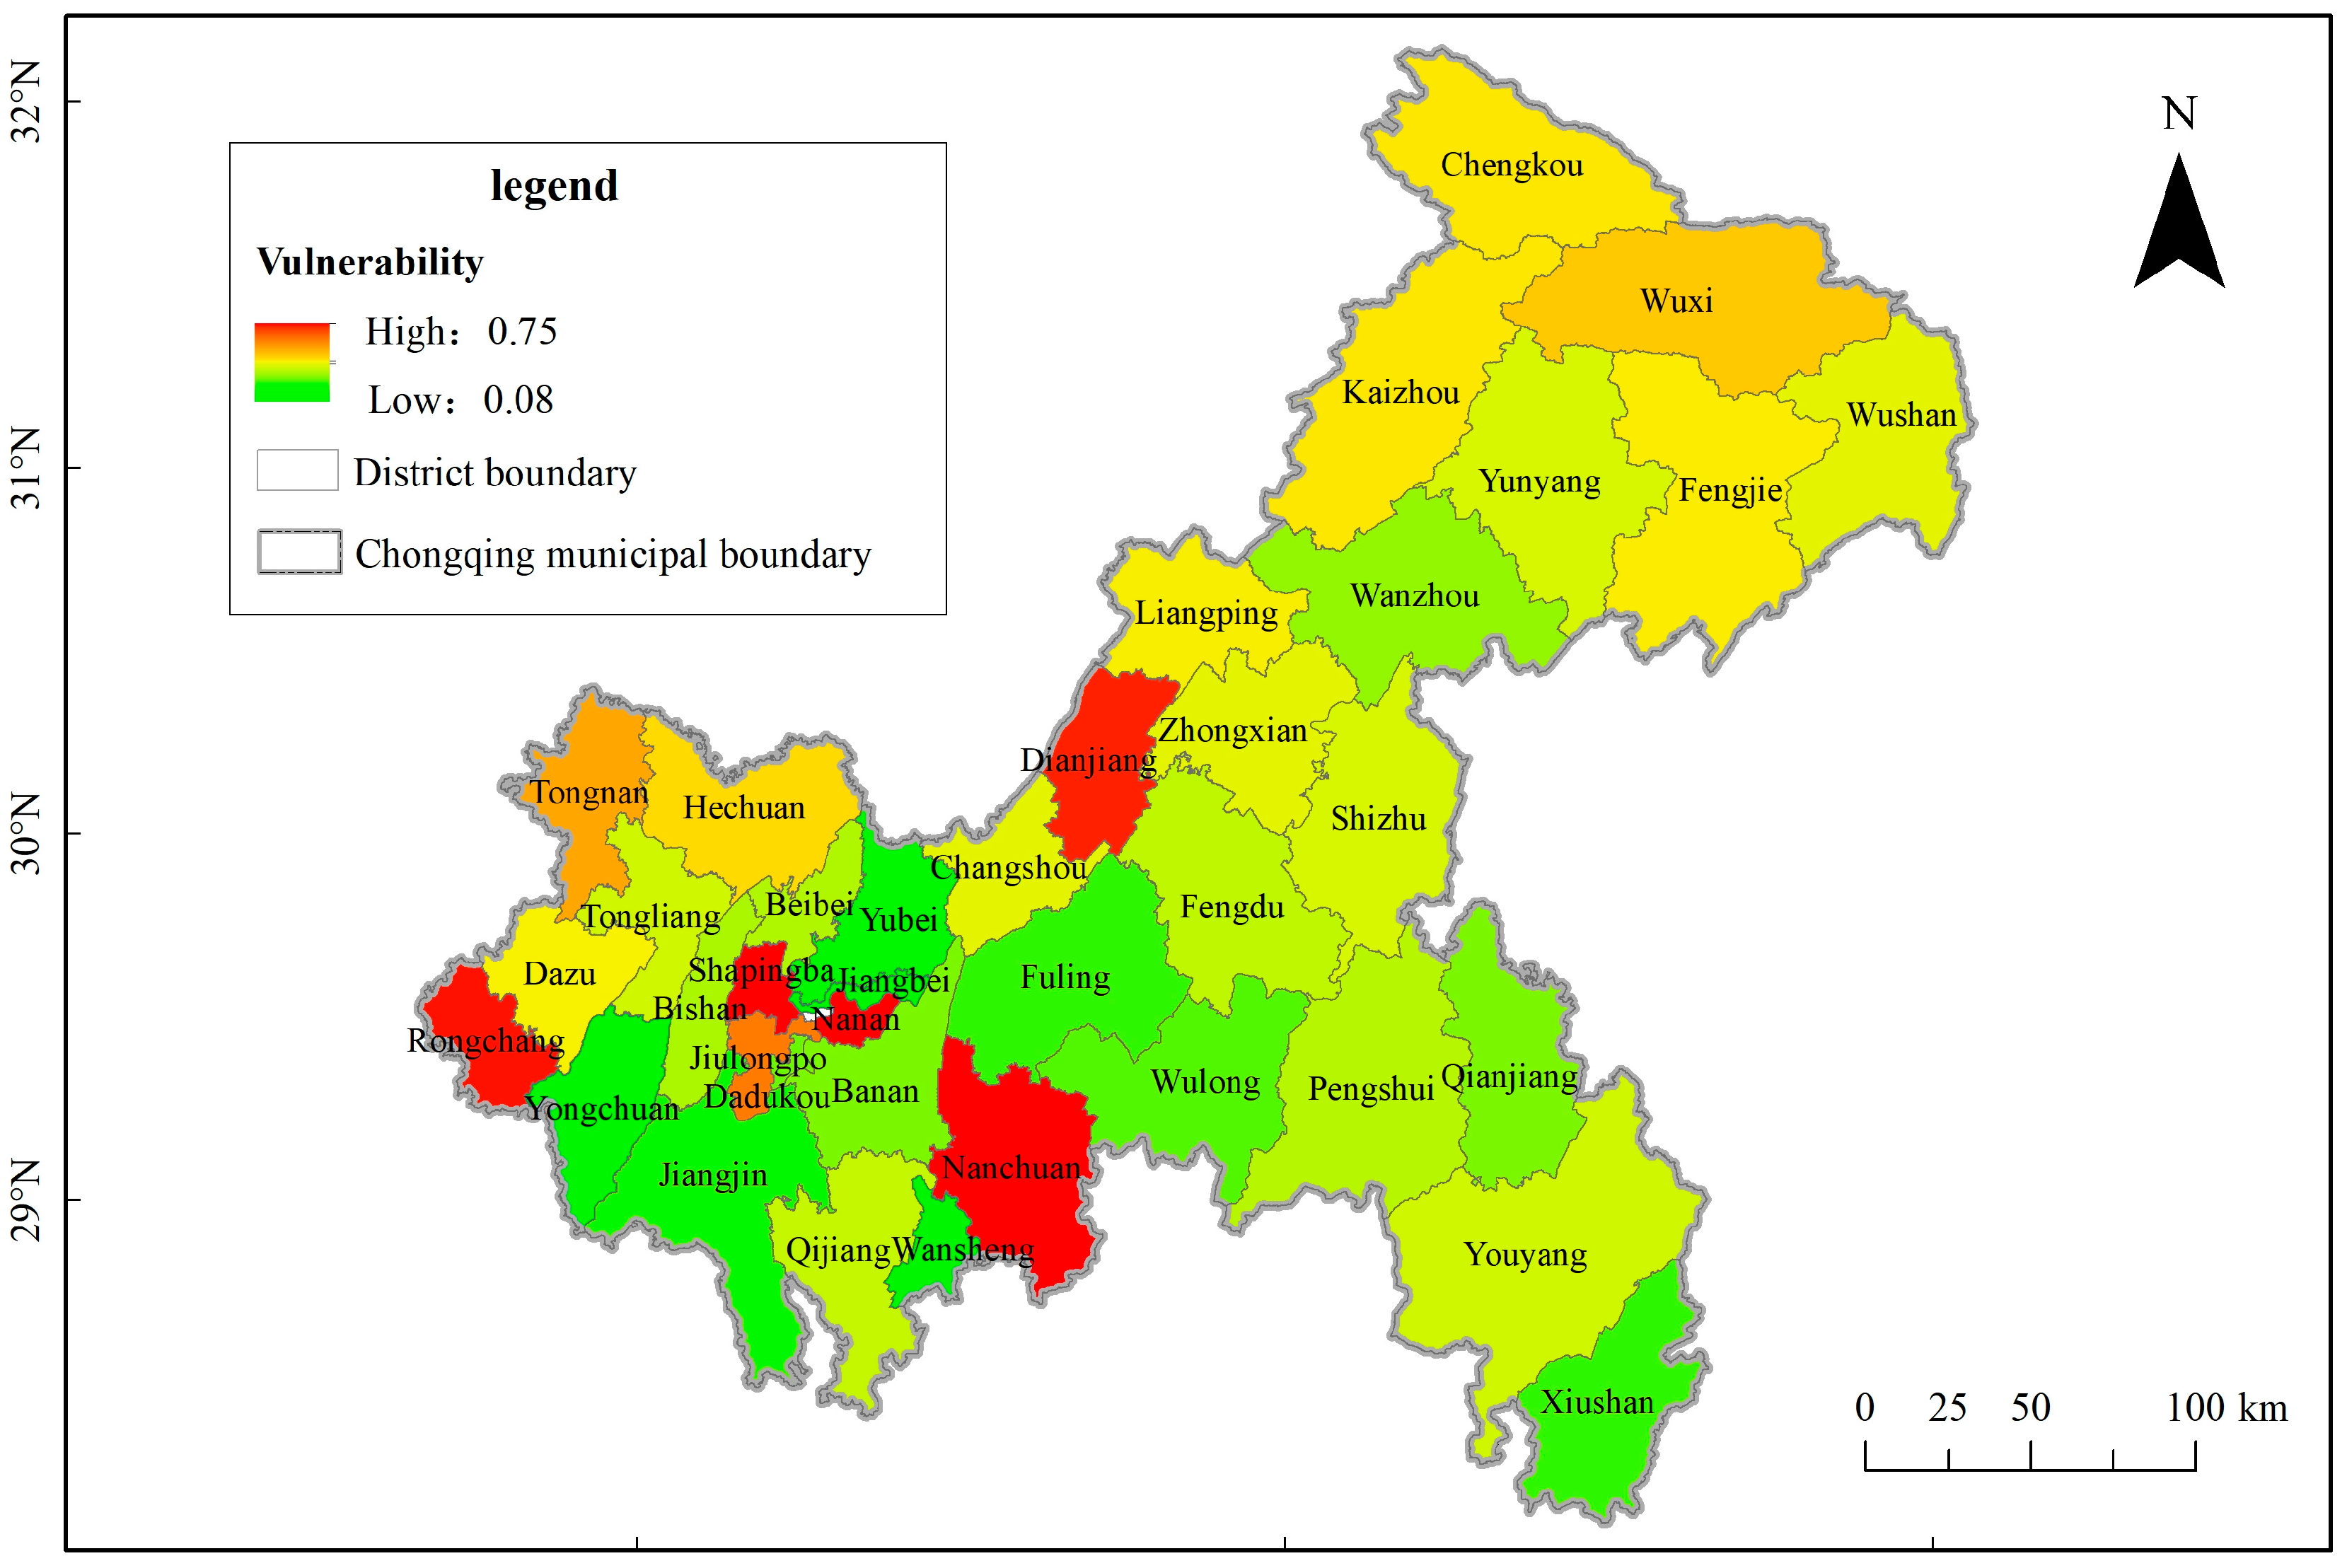
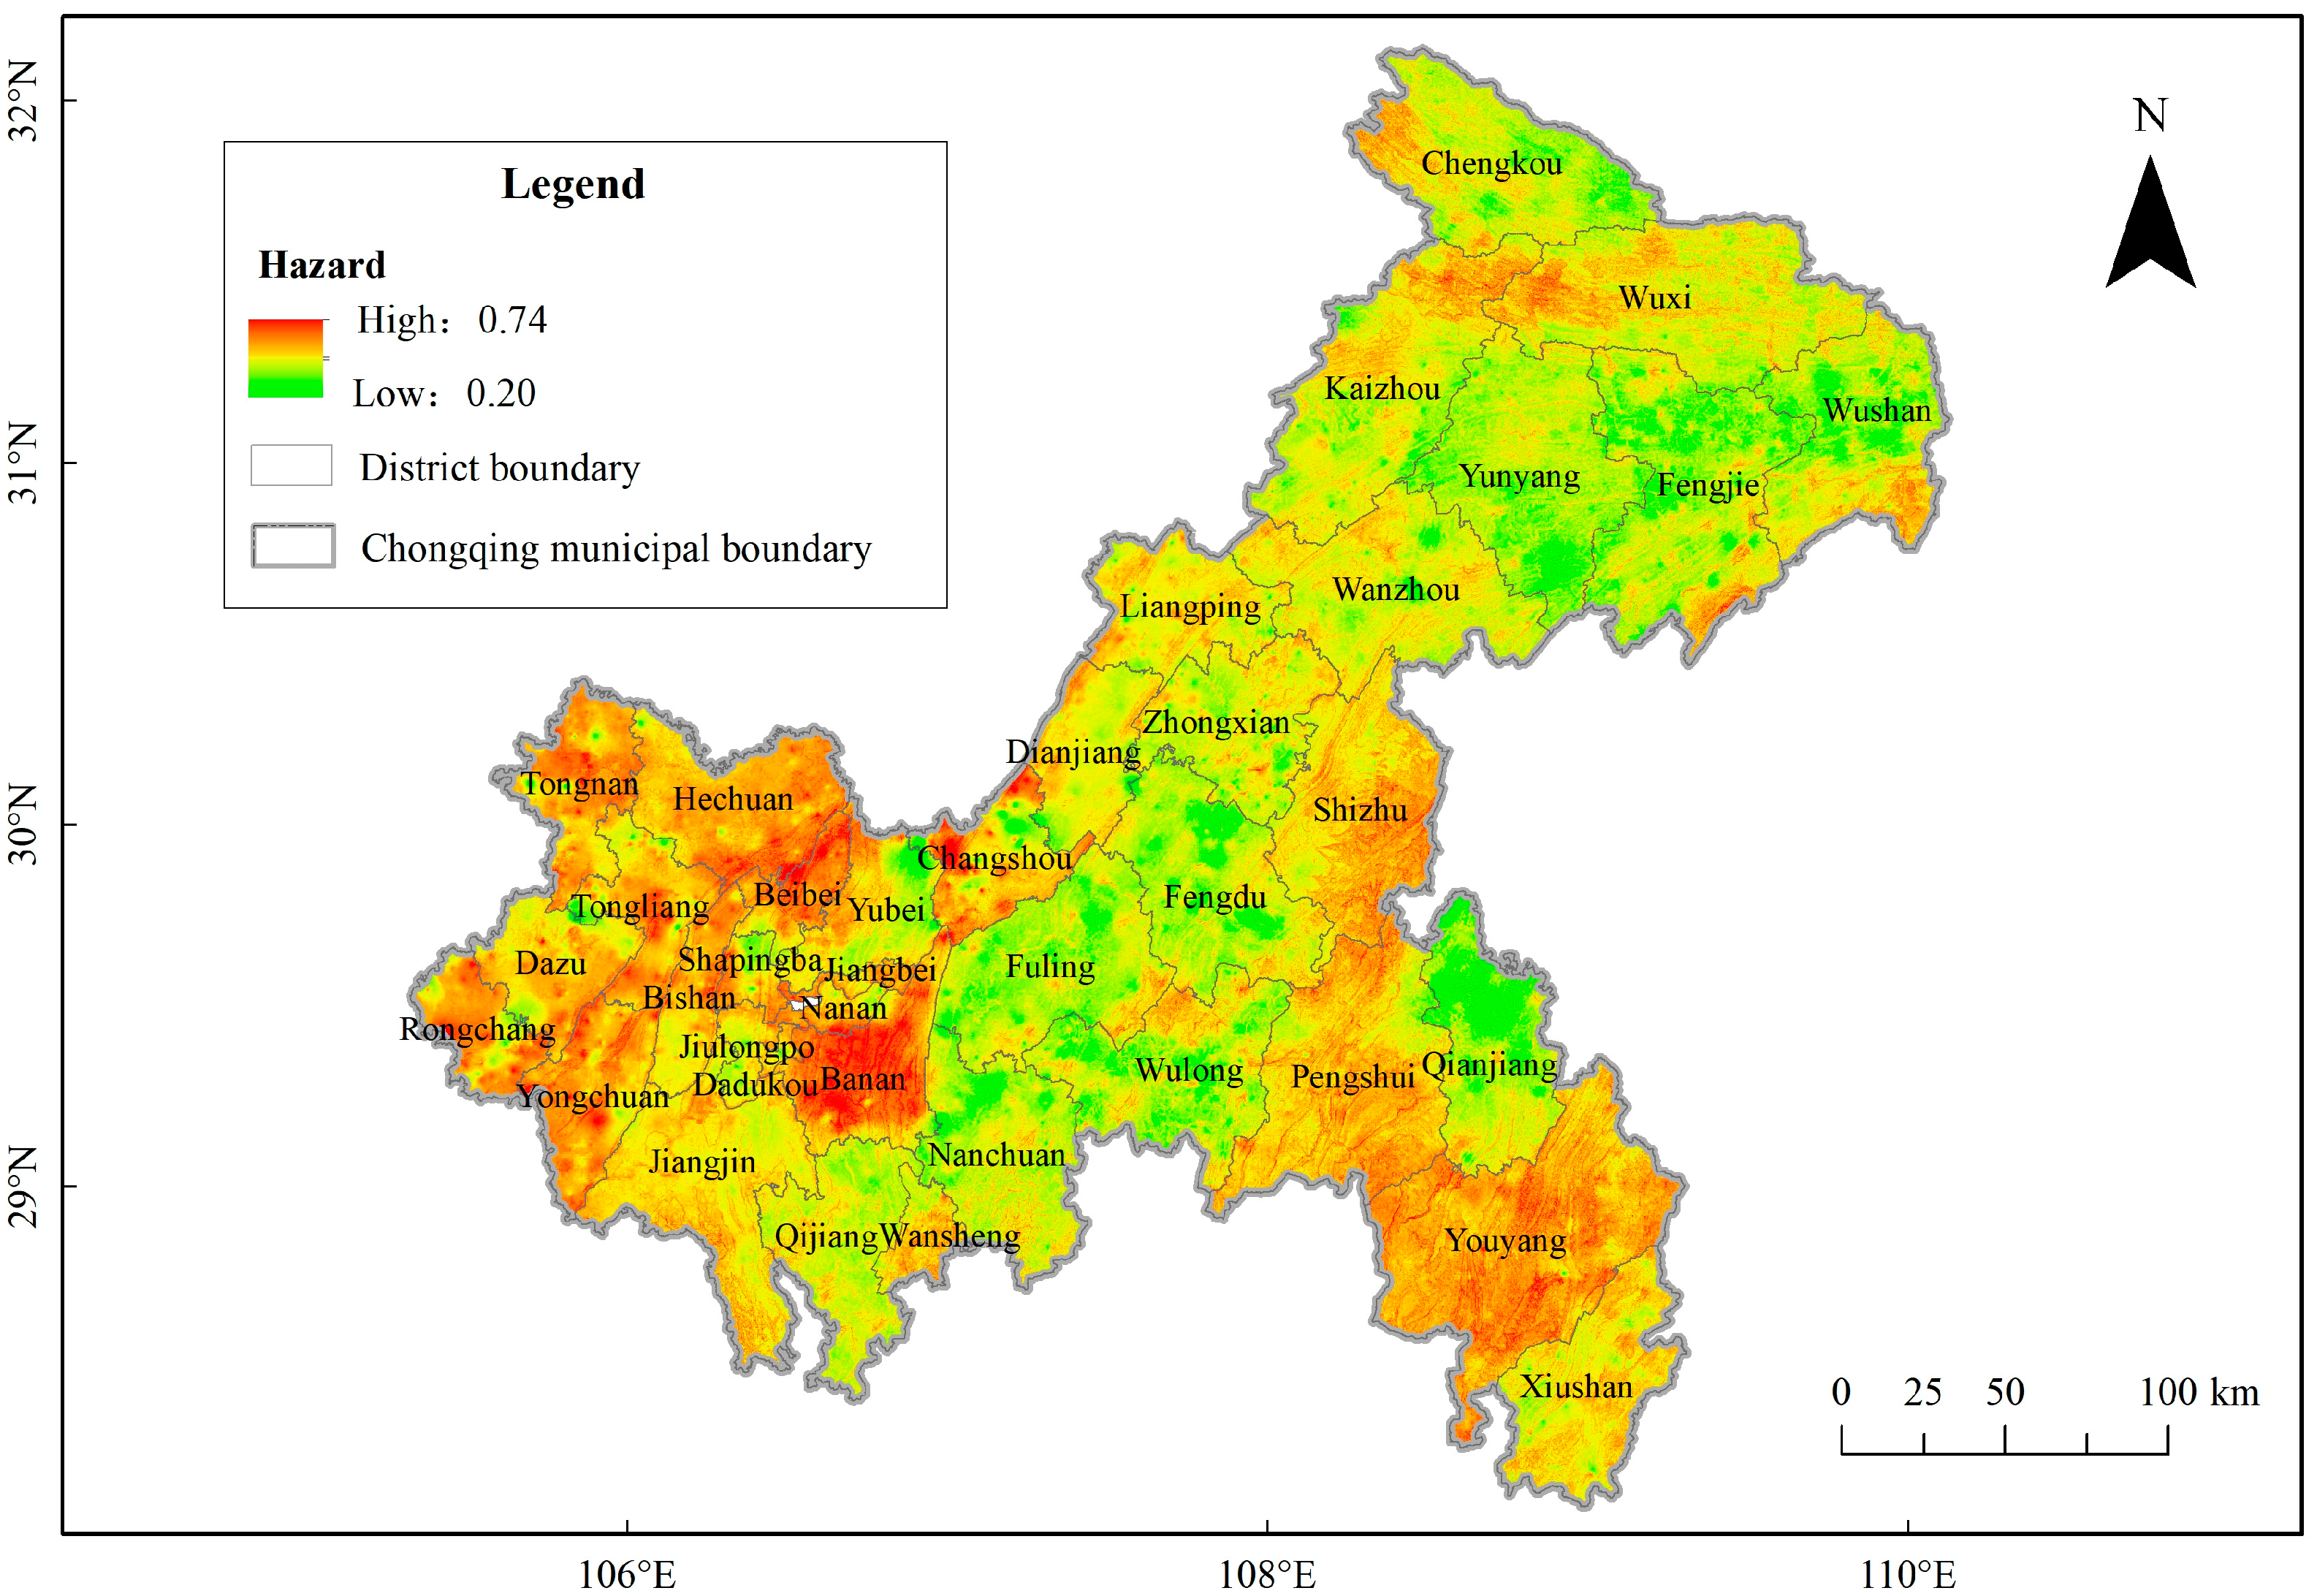
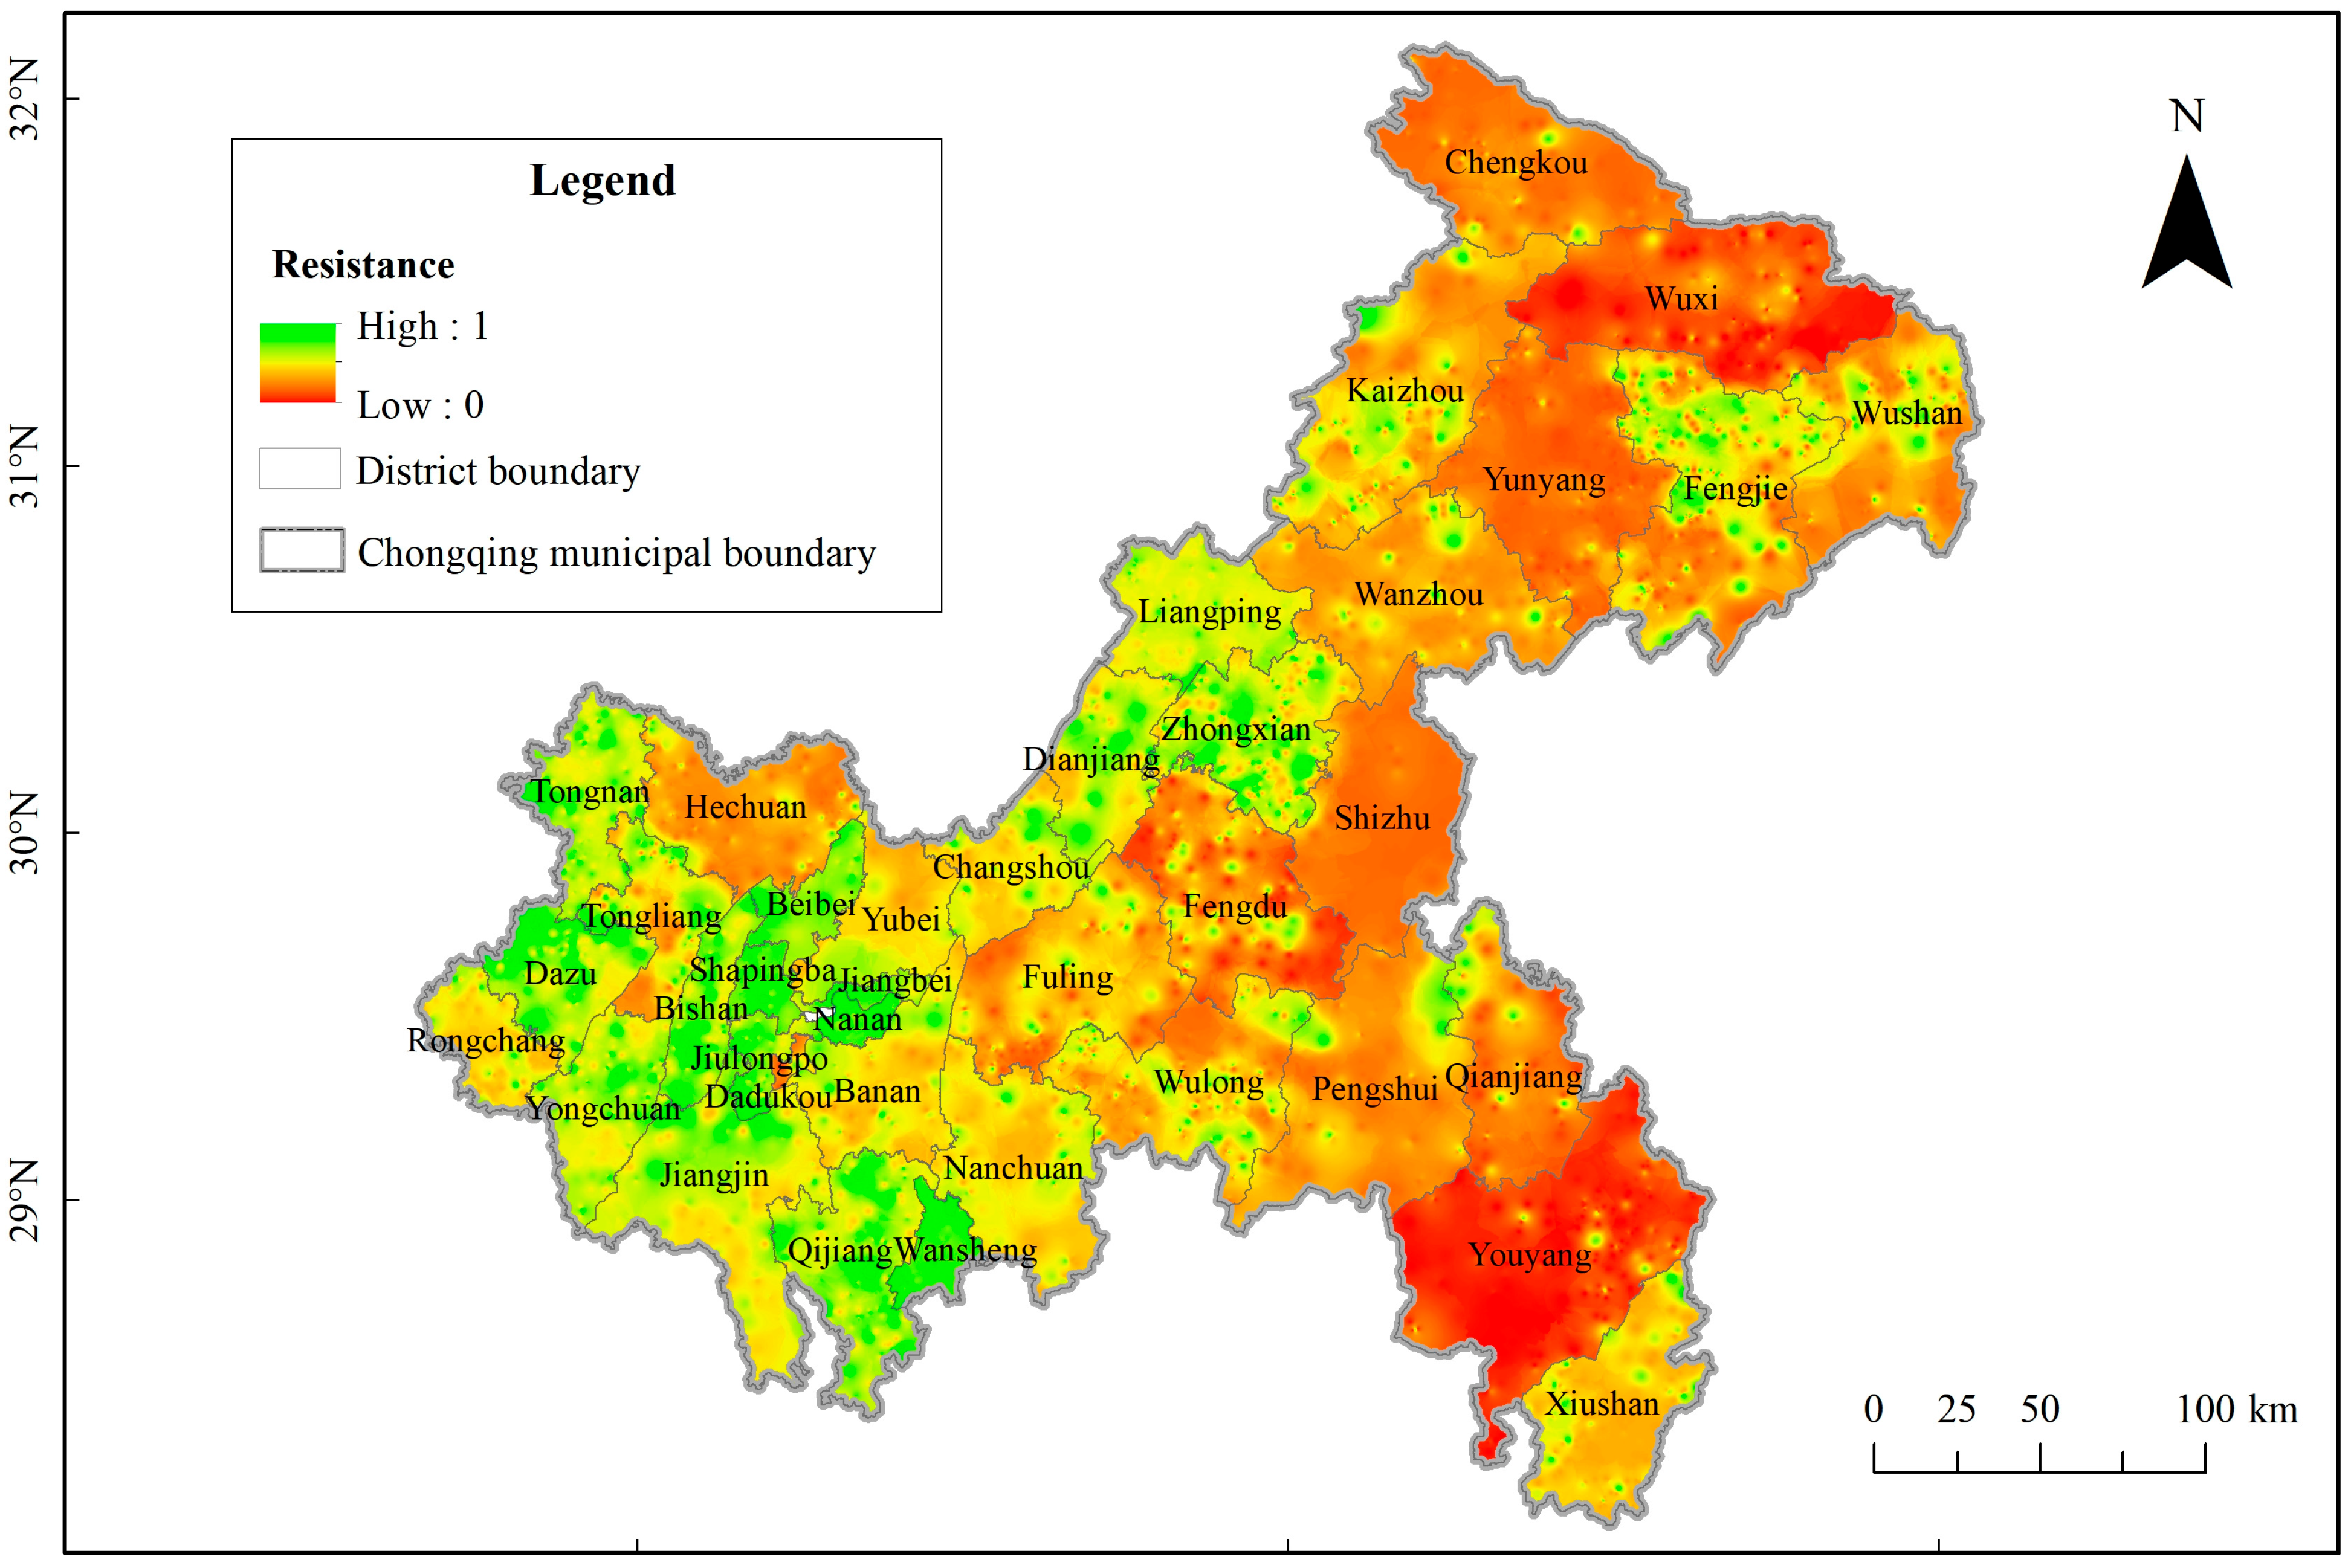
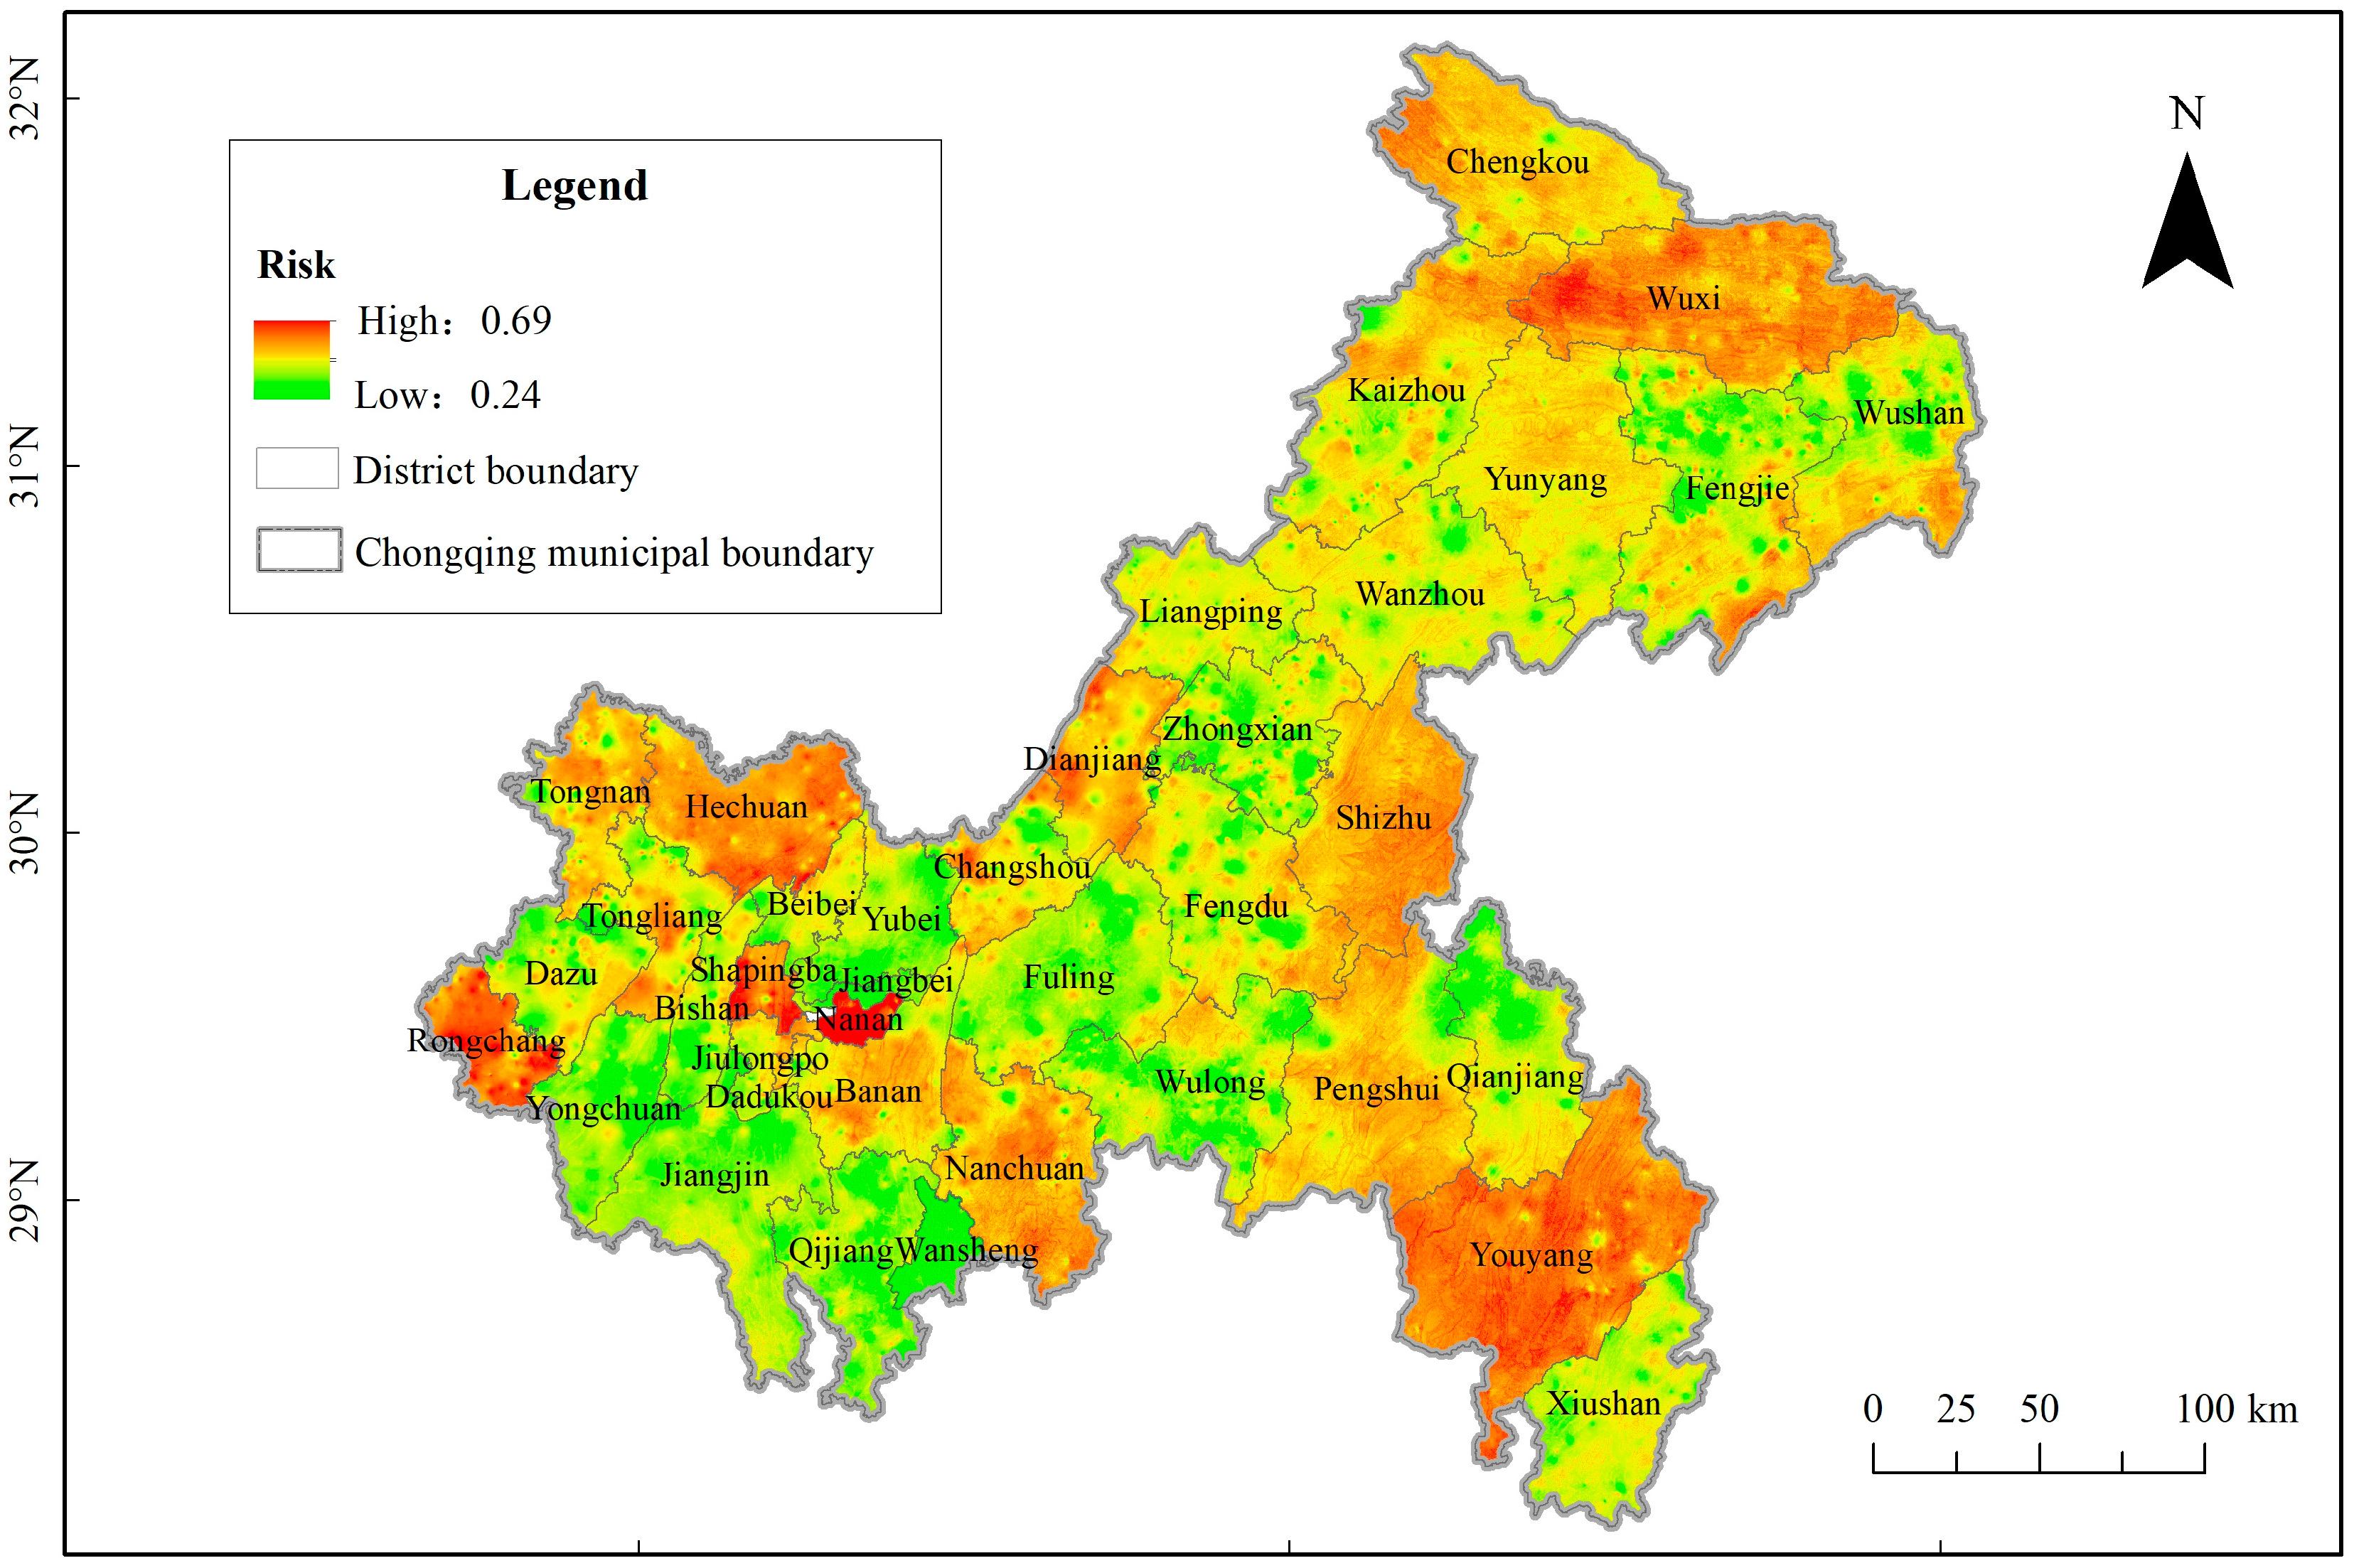
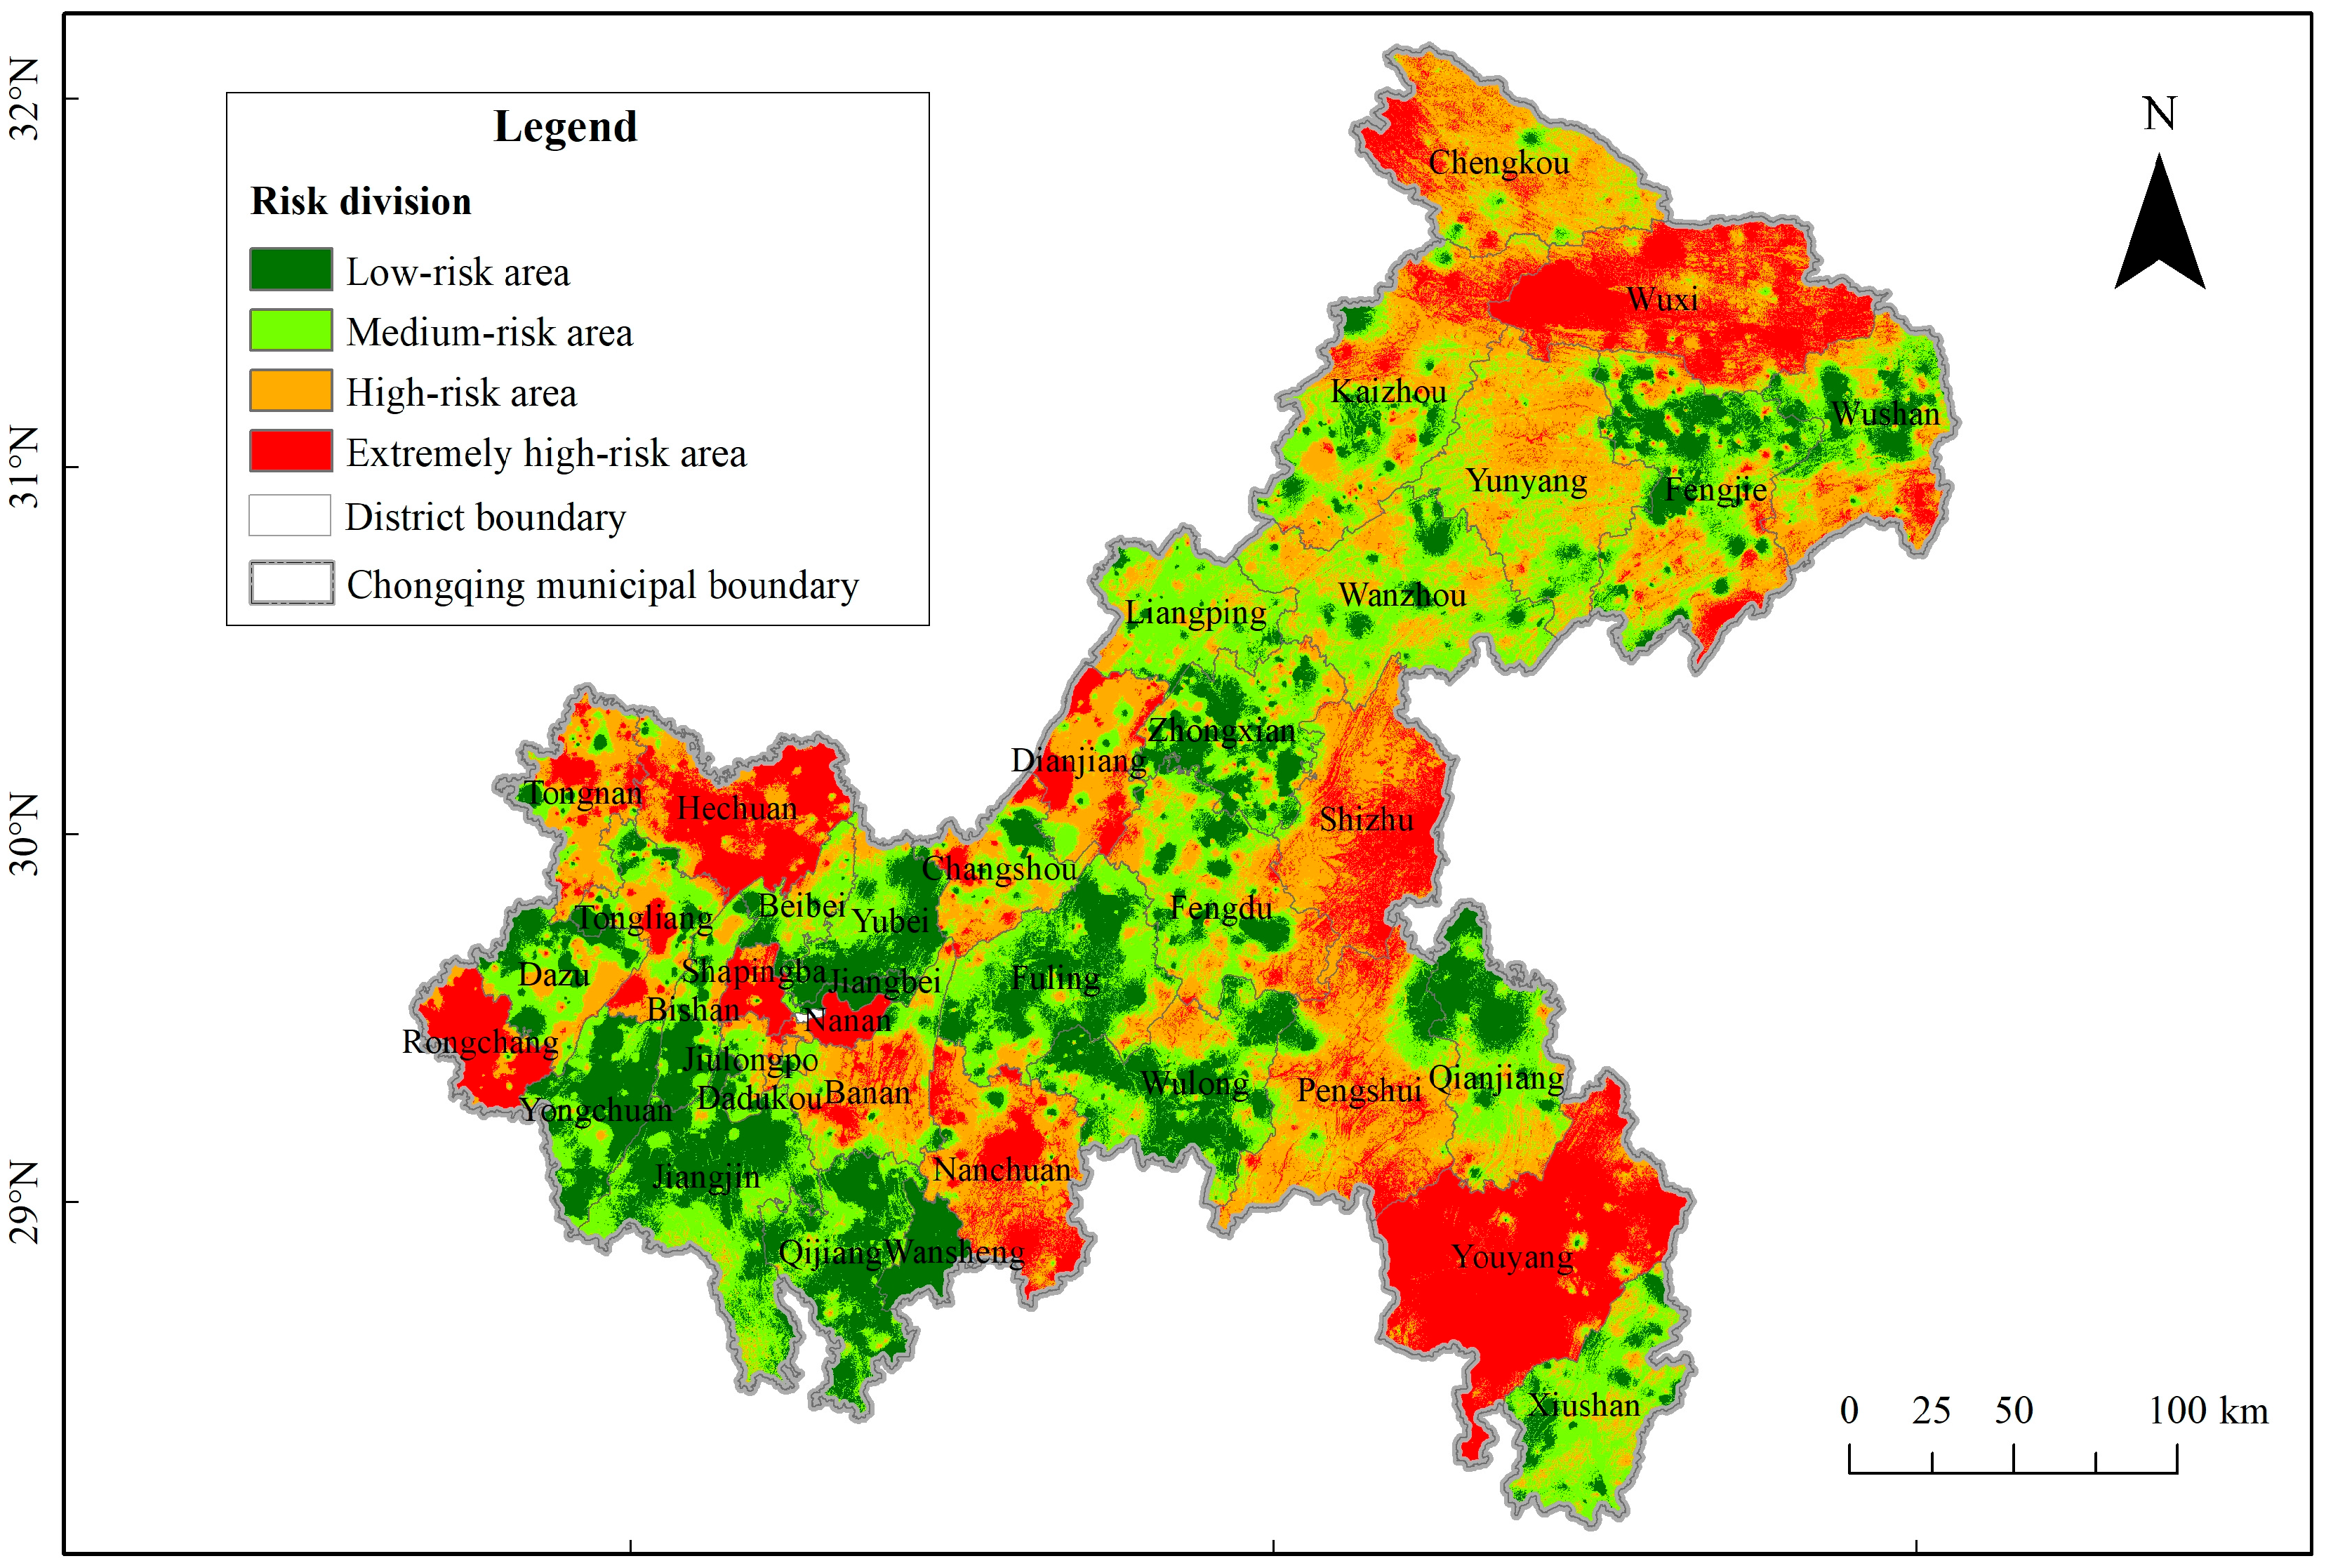
current flood protection capacity). Data marked with an underscore are derived from the results of surveys and evaluations conducted in the last decade. These datasets are intrinsically linked to the region’s actual risk characteristics and are transformed into quantitative, spatially explicit indicators. Based on this risk assessment framework, the risk of flash flood disasters was quantified systematically and scientifically. This study demonstrates the following: (i) distribution of flash flood hazard, vulnerability, and resistance in Chongqing and its districts; (ii) distribution of flash flood risk in Chongqing and its districts; and (iii) area and distribution of risk zones with four levels of risk: low, medium, high, and extremely high in Chongqing and its districts.
Section 2 describes the study area and its data.
Section 3 describes the risk assessment framework used in this study.
Section 4 presents the results and analysis.
Section 5 discusses the accuracy of the research results. Finally, the conclusions are presented in
Section 6.
5. Discussion
The evaluation framework based on AHP is widely used in risk assessment, which views the object as a system and makes decisions based on the thinking of decomposition, comparison, judgement, and synthesis. Many researchers have used this framework to conduct risk assessments of floods, urban flooding, and other disasters [
14,
15,
16,
33,
34]. The accuracy of mountain flood disaster risk assessment plays a very important role in the later mountain flood disaster prevention. Considering the limitations of the evaluation framework, it is necessary to verify the risk assessment results of mountain flood disasters. To verify the reliability of the AHP-based risk assessment framework, this study calculated the weight of each indicator and the flash flood risk using the entropy weighting method [
19] (
Table 14), an objective weighting approach. Additionally, the results obtained from the two methods were compared and validated against historical flash flood event sites.
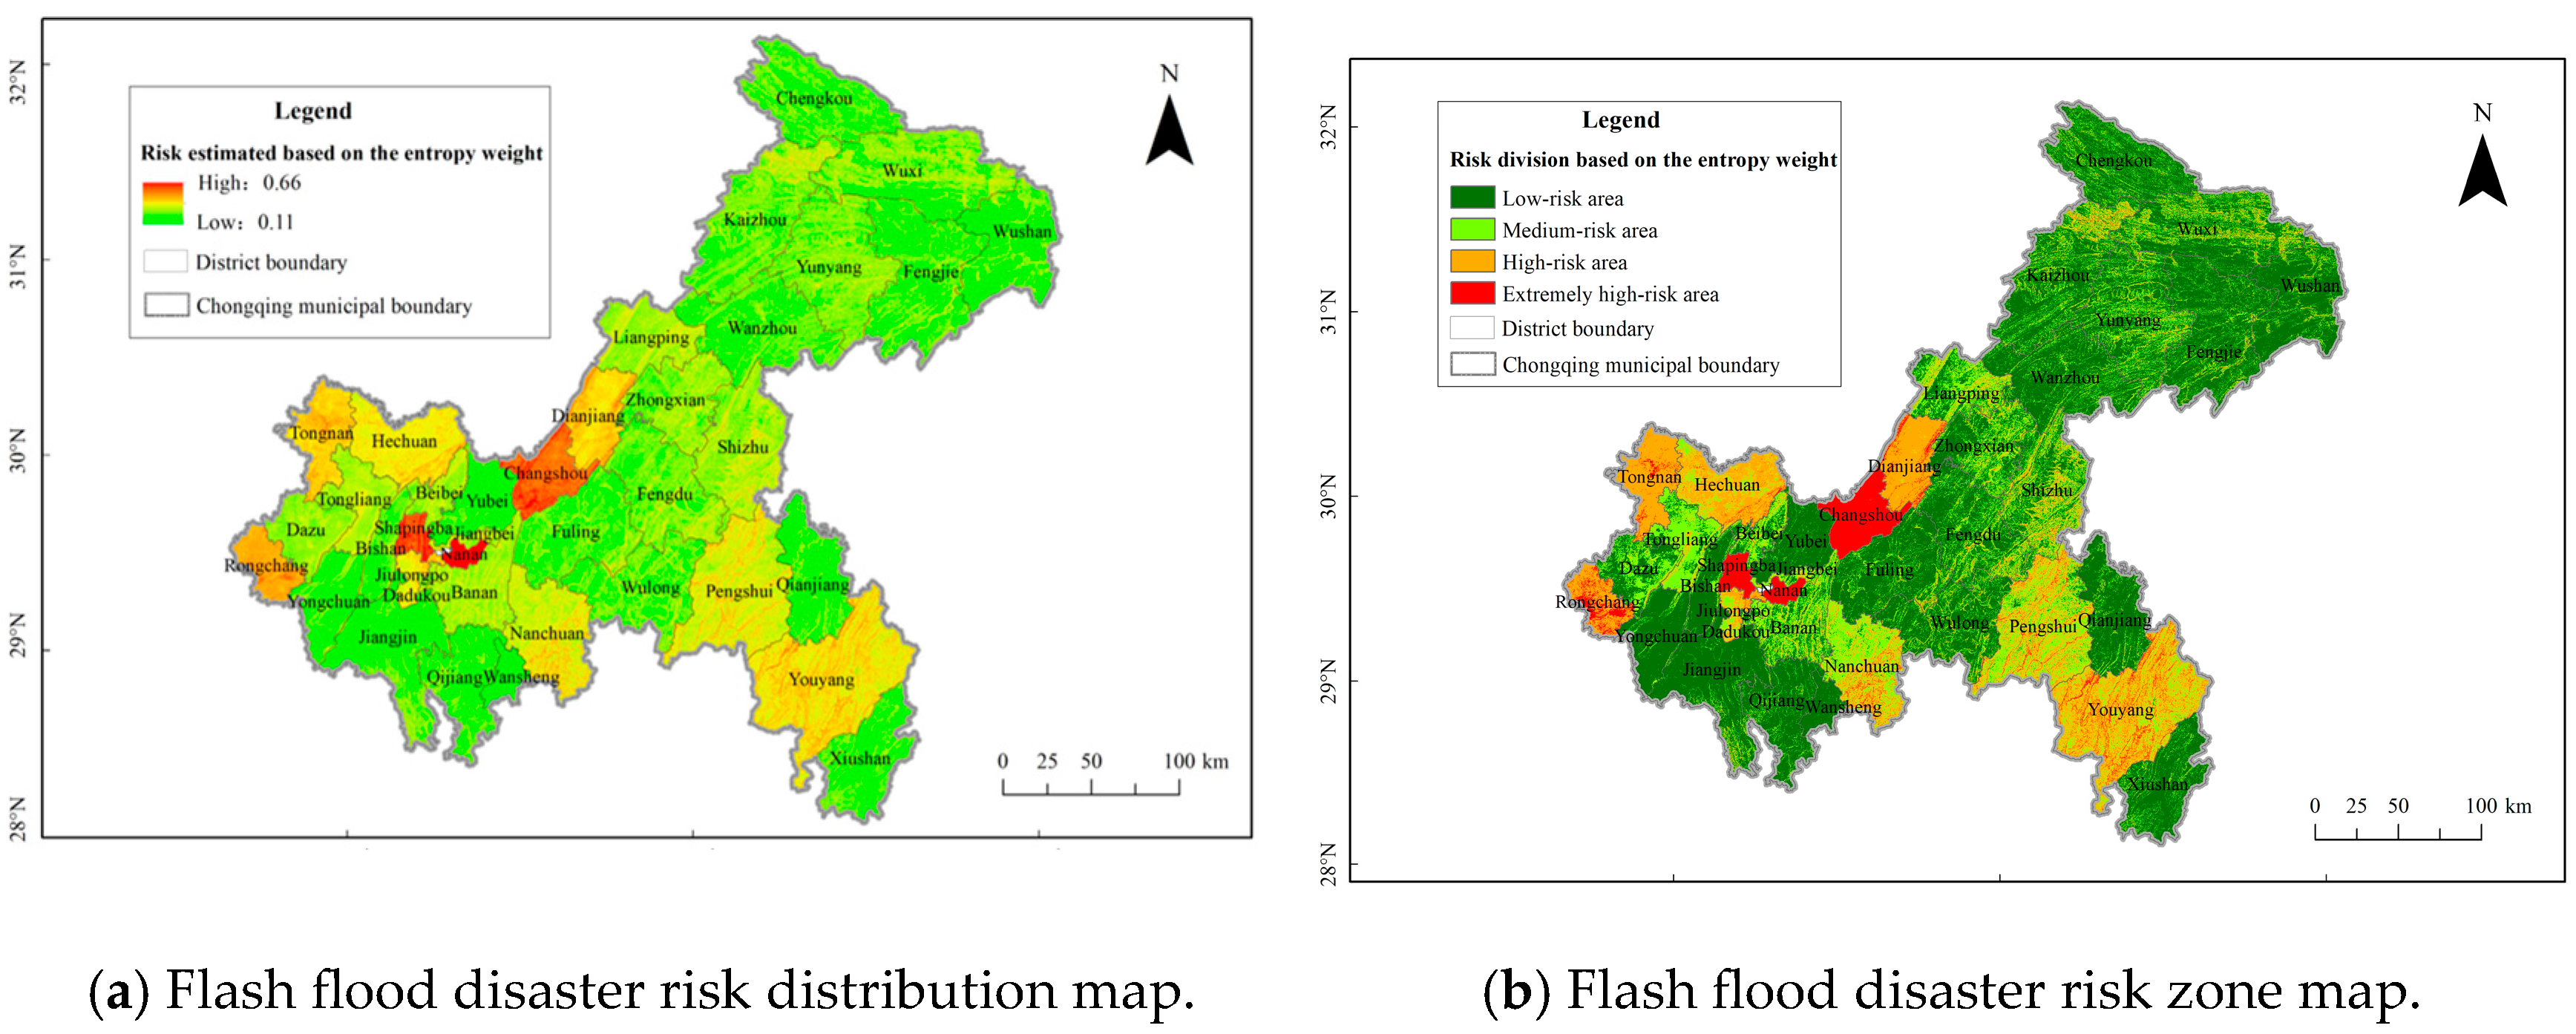
According to the flash flood risk assessment and zoning for Chongqing (
Figure 13,
Table 15), which was derived using the entropy weighting method, the risk values ranged from 0.11 to 0.66. The low-risk, medium-risk, high-risk, and extremely high-risk zones accounted for 53.62%, 24.95%, 17.09%, and 4.34% of the total area, respectively. It was worth noting that high-risk areas were primarily concentrated in parts of western Chongqing, which contradicted the fact that flash floods frequently occurred in the southeastern and northeastern regions of the municipality.
In this study, a total of 809 historical flash flood sites were collected. Risk zoning was based on AHP following spatial matching, and the proportions of these sites located in the low-, medium-, high-, and extremely high- risk zones were 16.56%, 27.19%, 40.17% and 16.07%, respectively (
Table 16). Similarly, these locations were spatially matched with risk zones defined using the entropy-weighted method, and the proportions of these sites located in the low-, medium-, high-, and extremely high- risk zones were 57.97%, 28.55%, 9.02%, and 4.45%, respectively (
Table 16). Further statistical analysis under the AHP-based classification revealed that 56.24% of the sites were located in high-risk zones and above, while 83.44% were in medium-risk zones and above. In contrast, under the entropy-based classification, 13.47% and 42.03% of the sites were located in the high-risk and medium-risk zones, respectively.
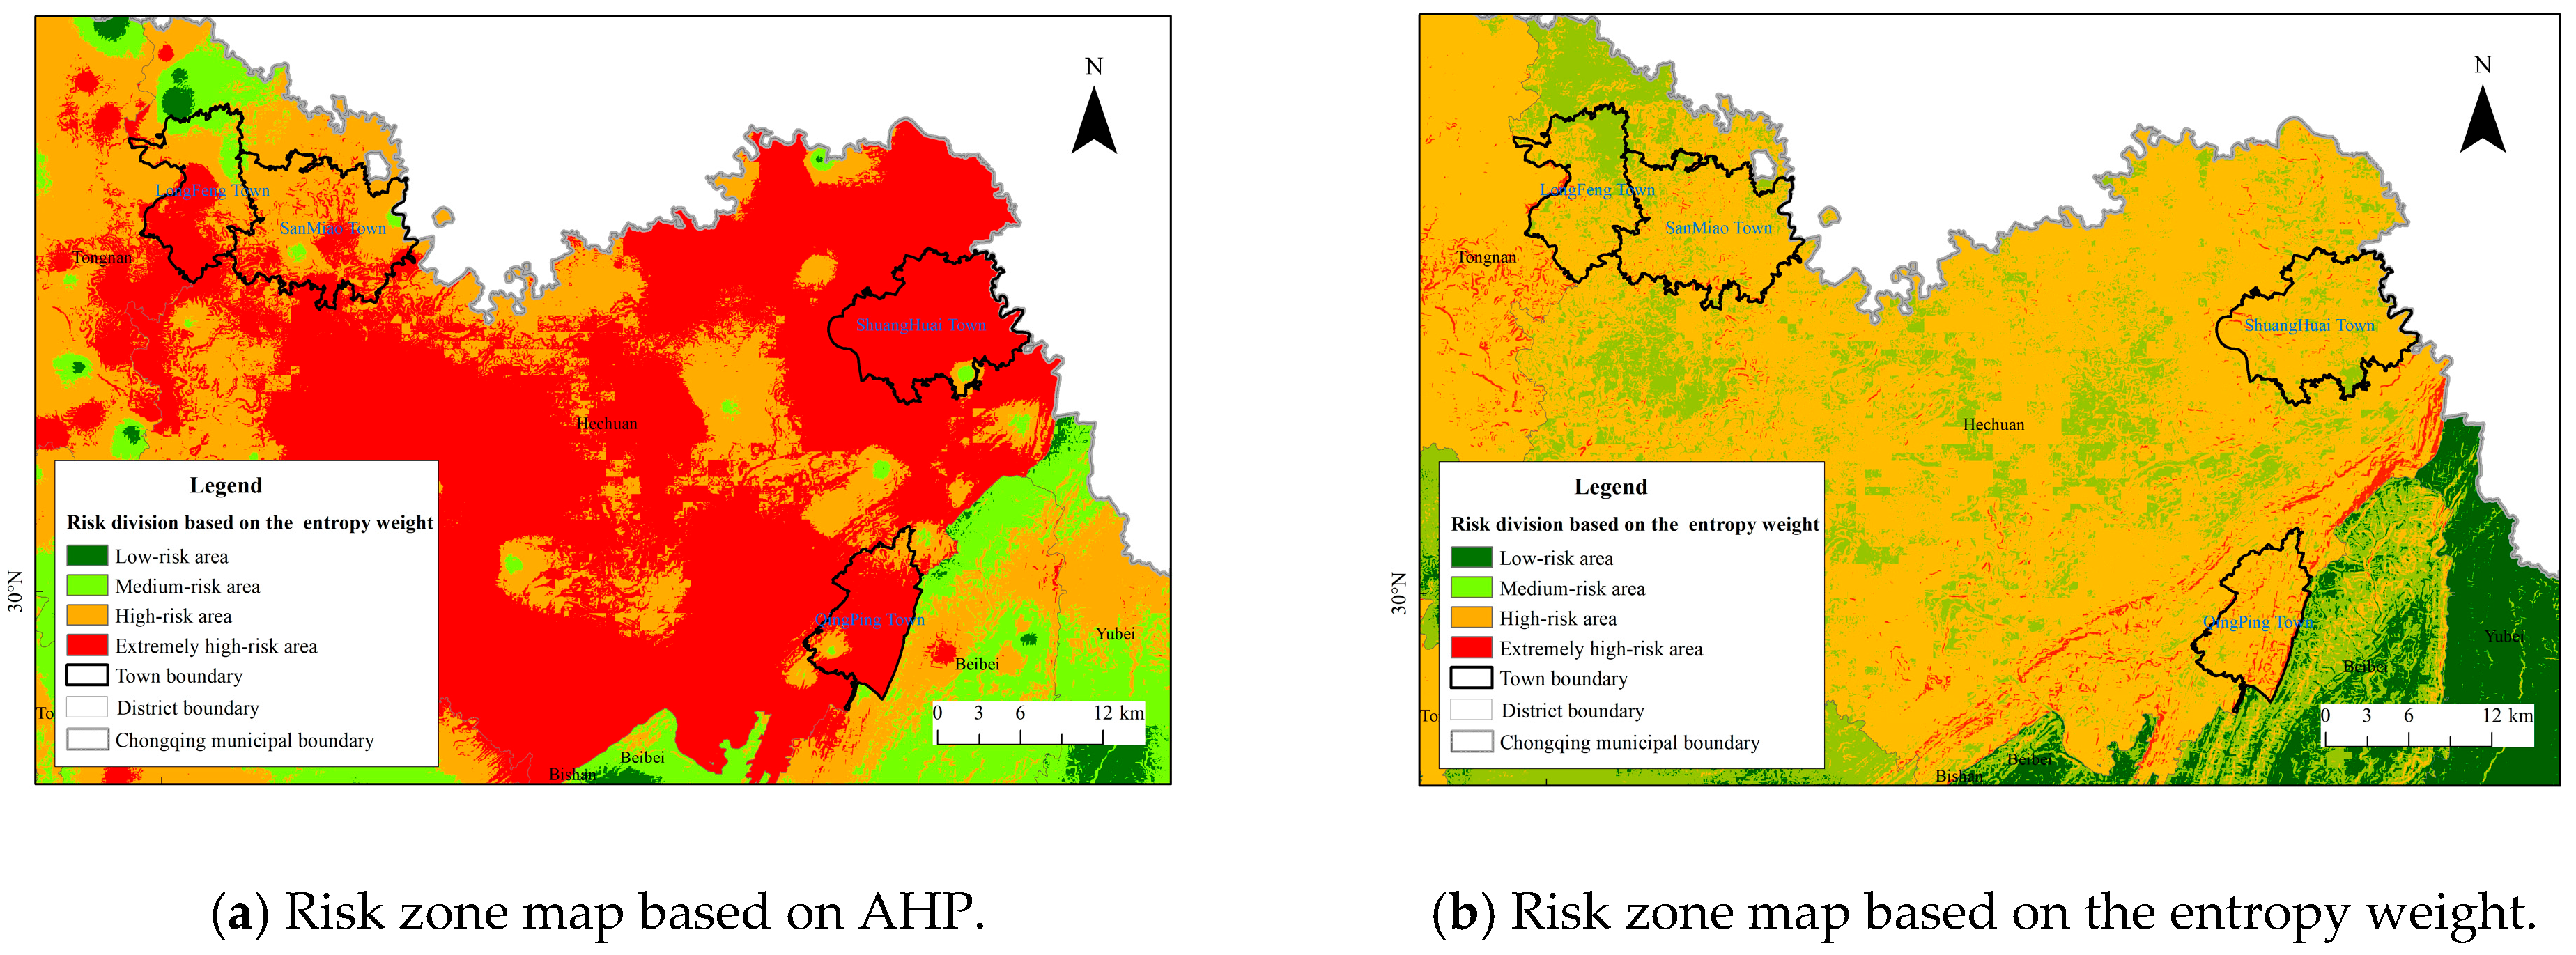
Recognising that evaluating model performance based solely on the risk levels of specific locations may have limited validity, the study further searched for additional historical flash flood disaster records. We identified disaster data for Hechuan District, which came from the district government’s flash flood disaster prevention plan (
https://www.hc.gov.cn/xxgk/zfxxgkmlrk/zcwj_11903/qtwj/202406/t20240604_13264655.html (accessed on 18 May 2026)). This plan introduced the historical flash flood situations in Hechuan District and, for the period after 2017, mainly mentioned disaster impacts in Qingping Town, Shuanghuai Town, Sanmiao Town, and Longfeng Town. We compared the flash flood risk zoning of these towns, and the results showed that a higher proportion of their areas fell within high-risk or above zones in the AHP-based risk map (the area classified as high-risk or higher accounts for 95.38%; under another method, it accounts for 81.86%), further demonstrating the reliability of our research framework (
Figure 14,
Table 17).
Historically documented flash flood hazard sites are expected to be located in higher-risk zones. In this study, the flash flood risk assessment results derived from the expert scoring method and the entropy weight method were compared. The comparison showed that a higher proportion of historical flash flood sites were situated in high-risk zones in the AHP-based map, indicating better agreement with the recorded disaster locations. We further examined loss data from recent flash flood events in Hechuan District and found that the affected towns also fell predominantly within high-risk or above categories in the AHP-based zoning. These results substantiated the reliability of the AHP-based framework in identifying flash-flood-prone areas. Further analysis of the entropy weight method revealed that, because it relied solely on intrinsic data information, certain indicators that strongly influence flash flood risk (e.g., design rainstorm and threshold rainfall) received relatively low weights. As a result, the entropy-based risk distribution tended to assign low risk to areas that were actually prone to flash floods, highlighting the limitations of a purely data-driven weighting approach in this context. Nevertheless, this research framework was better suited to regions where flash flood disaster survey and evaluation data were available, although it did not incorporate physical processes into the risk assessment. Future work could integrate hydrological and hydrodynamic models to enhance the objectivity of risk classification.
6. Conclusions
In this study, we integrated multiple parameters, including rainfall and underlying surface conditions, to establish a flash flood disaster risk assessment model. This model was employed to evaluate flash flood hazard, vulnerability, disaster resilience, and overall risk, and to identify the distribution of areas of flash flood with extremely high, high, medium, and low risk in Chongqing. Additionally, we conducted a comparative analysis using an objective weighting method to validate the validity and applicability of the proposed approach.
The risk value for flash flood disasters in Chongqing ranged between 0.24 and 0.69. The risk values of Hechuan and other districts in western Chongqing, Wuxi and other districts in northeastern Chongqing, and Youyang and other districts in southeastern Chongqing were large, and the risk of flash flood disasters was high. Wansheng, and other districts in western Chongqing, Fengjie, and other districts in northeast Chongqing, and Qianjiang, and other districts in southeastern Chongqing, had smaller risk values and a lower risk of flash flood disasters.
In the risk zones of flash flood disasters in Chongqing, high-risk areas accounted for the largest proportion (30.15%), followed by medium-risk (29.90%), extremely high-risk (21.32%), and low-risk areas accounting for the least (18.63%). The extremely high-risk areas were mainly concentrated in Wuxi in northeastern Chongqing, Youyang in southeastern Chongqing, and Nan’an, Rongchang, Hechuan, and other districts in western Chongqing. High-risk areas were mainly distributed in Chengkou in northeastern Chongqing, Pengshui, and Shizhu in southeastern Chongqing, and Jiangbei and Tongnan in western Chongqing.




 ,
,