Article

Multi-Stage Statistical Approach for PM2.5 Source Identification in Baghdad

School of Chemical and Process Engineering, University of Leeds, Leeds LS2 9JT, UK
*
Authors to whom correspondence should be addressed.
Atmosphere 2026, 17(5), 455; https://doi.org/10.3390/atmos17050455
Submission received: 1 March 2026 / Revised: 16 April 2026 / Accepted: 20 April 2026 / Published: 29 April 2026
(This article belongs to the Special Issue Advances in Air Quality Monitoring and Source Apportionment)

Abstract

Although prior research focused on Baghdad has identified variability in fine particulate matter concentrations (PM2.5) and their origins, there remains uncertainty in the identification of the relative importance of local and long-range PM2.5 sources. This study analysed hourly air pollutant concentrations and meteorological data from three monitoring sites over the year 2019 in Baghdad, namely Al-Wazeriya (WZ), Al-Andalus Square (AS), and Al-Saiydiya (SA) sites, to determine the nature of PM2.5 sources. Multi-stage statistical models were utilised to address inherent data limitations and varying sampling dates caused by limitations on power supplies to monitoring equipment, thus improving the identification of urban particulate sources. Bivariate polar plots, concentration ratios, and conditional bivariate probability function (CBPF) plots were used to identify local sources of PM2.5. Potential Source Contribution Function (PSCF) and concentration weighted trajectory (CWT) methods were employed for distant and regional source apportionment. Domestic diesel generators are suggested to be the primary local source of PM2.5 pollutants in Baghdad’s WZ area (categorised as residential with significant traffic volumes). Gasoline- and diesel-fueled motor vehicles significantly contribute to PM2.5 concentrations in the AS and SA areas, which are commercial areas with the latter having close proximity to motorway sources. Additional impacts result from gas flaring and thermal power plants in these regions. Long-range PM2.5 transport may be attributed to the combustion of low-quality heavy fuel oils from several potential sources, including Nahrawan brick factories, oil fields, and Al-Musayyab thermal power plants, primarily towards the northeast, east, and southeast of Baghdad. Transboundary contributions to PM2.5 concentrations in Baghdad were also identified, from industrial sources in western Iran and eastern Syria, as well as dust particulates, and oil and gas production from southwestern Iran’s Khuzestan Province, Kuwait, and the Arabian Gulf. Low to medium wind speeds (1–4 ms−1) were linked with the highest source contributions, suggesting local emission sources to be the most significant contributors to high PM2.5 at the studied sample locations.

1. Introduction

Particulate matter (PM) pollution can reach alarming levels in urban areas around the world, creating a growing concern for health and political organisations due to its negative influence on air quality and human health, atmospheric chemistry, visibility, and climate impacts [1]. According to epidemiological studies, exposure to fine particulate matter with aerodynamic diameter < 2.5 microns (PM2.5) is linked to respiratory illness and cardiovascular morbidity and death. These effects can be linked to the small particle sizes of PM2.5, which enable them to escape the normal defence mechanisms of the body in the upper respiratory tract and reach the deep lung tissue. Therefore, these particles can possibly enter the bloodstream, causing cardiopulmonary effects. The hazard may be increased by the higher surface area-to-mass ratio of smaller particles, thereby increasing their potential to carry toxic heavy metals, which can cause significant long-term cell damage [2,3,4,5]. Elevated PM2.5 pollution levels have become a prevalent problem in many developing countries, especially those in the Middle East, such as Iraq and Iran [6,7,8].
One of the Middle Eastern nations with significant oil and natural gas reserves is Iraq. The country has endured multiple wars and economic sanctions in the past four decades, leading to service deterioration, potentially exacerbating the air pollution problem. The incidence of pollution-related illnesses has increased dramatically because of these challenges, significantly impacting population health [9]. Iraq is currently experiencing a reduction in water levels in the Tigris and Euphrates rivers and a rise in the salinity of their water, combined with frequent dust storms [10]. The transportation system, the use of low-quality heavy fuel in electricity production and the oil and gas industries, and poorly controlled combustion, such as from the flaring of natural gas or domestic open burning, are all significant contributors to Iraq’s air pollution dilemma [11].
Electricity shortage is a significant environmental concern in this oil-rich region, particularly since 2003, as the government has not been able to meet the electricity demands of its citizens through the national grid, leading to regular interruptions in grid supply throughout the summer, which can reach 16 h per day. This has led to the use of tens of thousands of diesel and gas-powered medium and large-scale generators, typically without exhaust after-treatment systems, thus releasing millions of tonnes of pollutants into the atmosphere [12]. A comprehensive knowledge of pollutant sources is required to develop appropriate control measures to reduce air pollution in Iraq.
There is much research on the causes of air pollution in Iraq. However, most investigations relied on inexpensive equipment with inadequate detection sensitivity [13,14,15]. Consequently, further research is required to identify and quantify Iraq’s primary sources of air pollutants. Baghdad is Iraq’s most populated metropolitan area, with a population exceeding 8 million, and the second largest city in the Arab world after Cairo, Egypt [16,17]. Exposure to pollution, therefore, affects large numbers of people, and thus, Baghdad was selected as the study area in this research. The Iraqi Ministry of Environment has developed air quality monitoring stations in large Iraqi cities such as Baghdad, Mosul, and Basrah. Those stations use reference methodologies with high-resolution data to identify the concentrations of the major air pollutants. However, due to power cuts and security circumstances, the monitoring stations operate only during official working hours [18]. Therefore, developing appropriate modelling tools for data records is crucial for identifying local and remote air pollutant sources in air quality management studies.
Combining receptor modelling, air quality models, and emission inventories has proven to be a practical tool in source apportionment, addressing local and distant sources [19]. Nevertheless, such models rely on complex boundary layer modelling approaches as well as comprehensive emission source data for distant point source emitters and small local sources, which can all influence receptor concentrations. Extreme weather conditions, such as sandstorms or rainy days, also influence concentrations, and receptor models often fail to provide direct allocation of unknown sources [20,21]. Developing countries, such as Iraq, frequently encounter challenges related to insufficient data on emissions, fuel burning profiles and the problem of inconsistent national electricity supplies, which pose obstacles to the successful use of receptor modelling to identify pollution sources. Hamad et al. [6] used a chemical mass balance (CMB) receptor approach to detect organic PM2.5 sources in Baghdad city as an example of previous difficulties. They identified gasoline and diesel engines as the dominant sources of carbonaceous PM2.5 at Al-Andalus Square (AS), but failed to delineate between motor vehicles and domestic power generators. According to Hamad’s study, unidentified sources accounted for 42 ± 19% of the monitored carbonaceous PM2.5, and dust was the main contributor to PM2.5 mass. In contrast, other studies, such as that of AL-Salihi [22], revealed that urban combustion-generated sources of particulates were the primary contributor to PM2.5 due to the use of low-quality heavy fuel oils in power generation, consistent with the Ministry of Iraqi Environment findings [18,22,23].
A further methodology that can provide information on the sources of air pollution involves an analysis of pollutant concentration ratios, since different sources have different fingerprints related to the relative emissions of different species. Pollutant ratios may exhibit significant independence from atmospheric variations [24]. In many cases, obtaining valuable insight into sources is possible despite limited data due to the long-lifetime existence of atmospheric pollutants [25]. Using the PM2.5/CO ratio (based on µg/m3) as a tracer could be an excellent tool to investigate particulates generated from fire burning [26], since gas-flared or open burning fires have very high PM2.5/CO ratios compared to motor vehicles. It has been reported that PM2.5/CO ratios in typical metropolitan areas range from 0.017 to 0.054, while for areas influenced by heavy smoke, these exceed 0.054. These past studies reveal a consistent view that PM2.5/CO for surface smoke is about 3–4 times greater than the ratio for metropolitan observations without smoke [27,28].
Another effective tool for identifying local air pollutant sources is the conditional probability function (CPF), which quantifies the probability that the concentration of a specific pollutant in a particular wind sector exceeds a specified criterion, such as the 75th or 90th percentile concentration [29]. It has been found that a CPF is an excellent statistical approach for determining the direction of pollution sources and isolating individual source types by utilising wind direction, wind speed, and the concentration of specific pollutants [30]. Bae et al. [31] used a CPF approach coupled with back trajectory calculations to clearly reveal pollution sources at medium and far distances throughout New York State. Uria-Tellaetxe et al. [21] created an innovative method for identifying and characterising source contributions by combining bivariate polar plots with a CPF. The conditional bivariate probability function (CBPF) expands our understanding of the potential source types by emphasising fundamental dispersion properties through providing directional information on pollution sources and wind speed dependency of concentrations.
This study adopts the novel approach of employing multi-stage statistical models to identify PM2.5 profiles for local and distant sources of concentrations measured at receptors in Baghdad. Hybrid receptor techniques such as Potential Source Contribution Functions (PSCFs) and concentration weighted trajectories (CWTs) were also employed for distant and regional source apportionment since these approaches have proven efficient in determining, characterising, quantifying, and identifying the longer range dispersion of pollutants.

2. Materials and Methods

2.1. Area of Study and Data Sources

Iraq is situated in the eastern area of the Middle East and Northern African nations (MENA region) [32]. Baghdad is the capital of Iraq in the middle of the country at 33.3191° N and 44.3920° E. The population of Baghdad exceeds 8 million, which makes it one of the most congested cities in the Middle East [17]. The city experiences hot and dry summer and cold winter months, with an annual average temperature of 23 °C [33].
In Iraq, dust storms are frequent and can continue for many days. The Ministry of Iraqi Environment (MOE) reported 122 dust storms and 283 dusty days with fewer than 10 km of yearly visibility in 2013. It has been forecast that the country could experience an average of 272 days of dust yearly over the next few decades [34,35]. As a result, the number of dusty hours in this study was separated from the measurement data collection. The observed data of dusty days were collected from the General Authority for Meteorology and Seismic Monitoring in Iraq. During the measurement period, it recorded 97 dusty days in Baghdad in 2019, corresponding to 224, 161, and 109 h at WZ, AS, and SA monitoring sites, respectively. Since inadequate maintenance funds reduced the number of monitoring stations to two after 2019, this study has adopted 2019 as the study period.
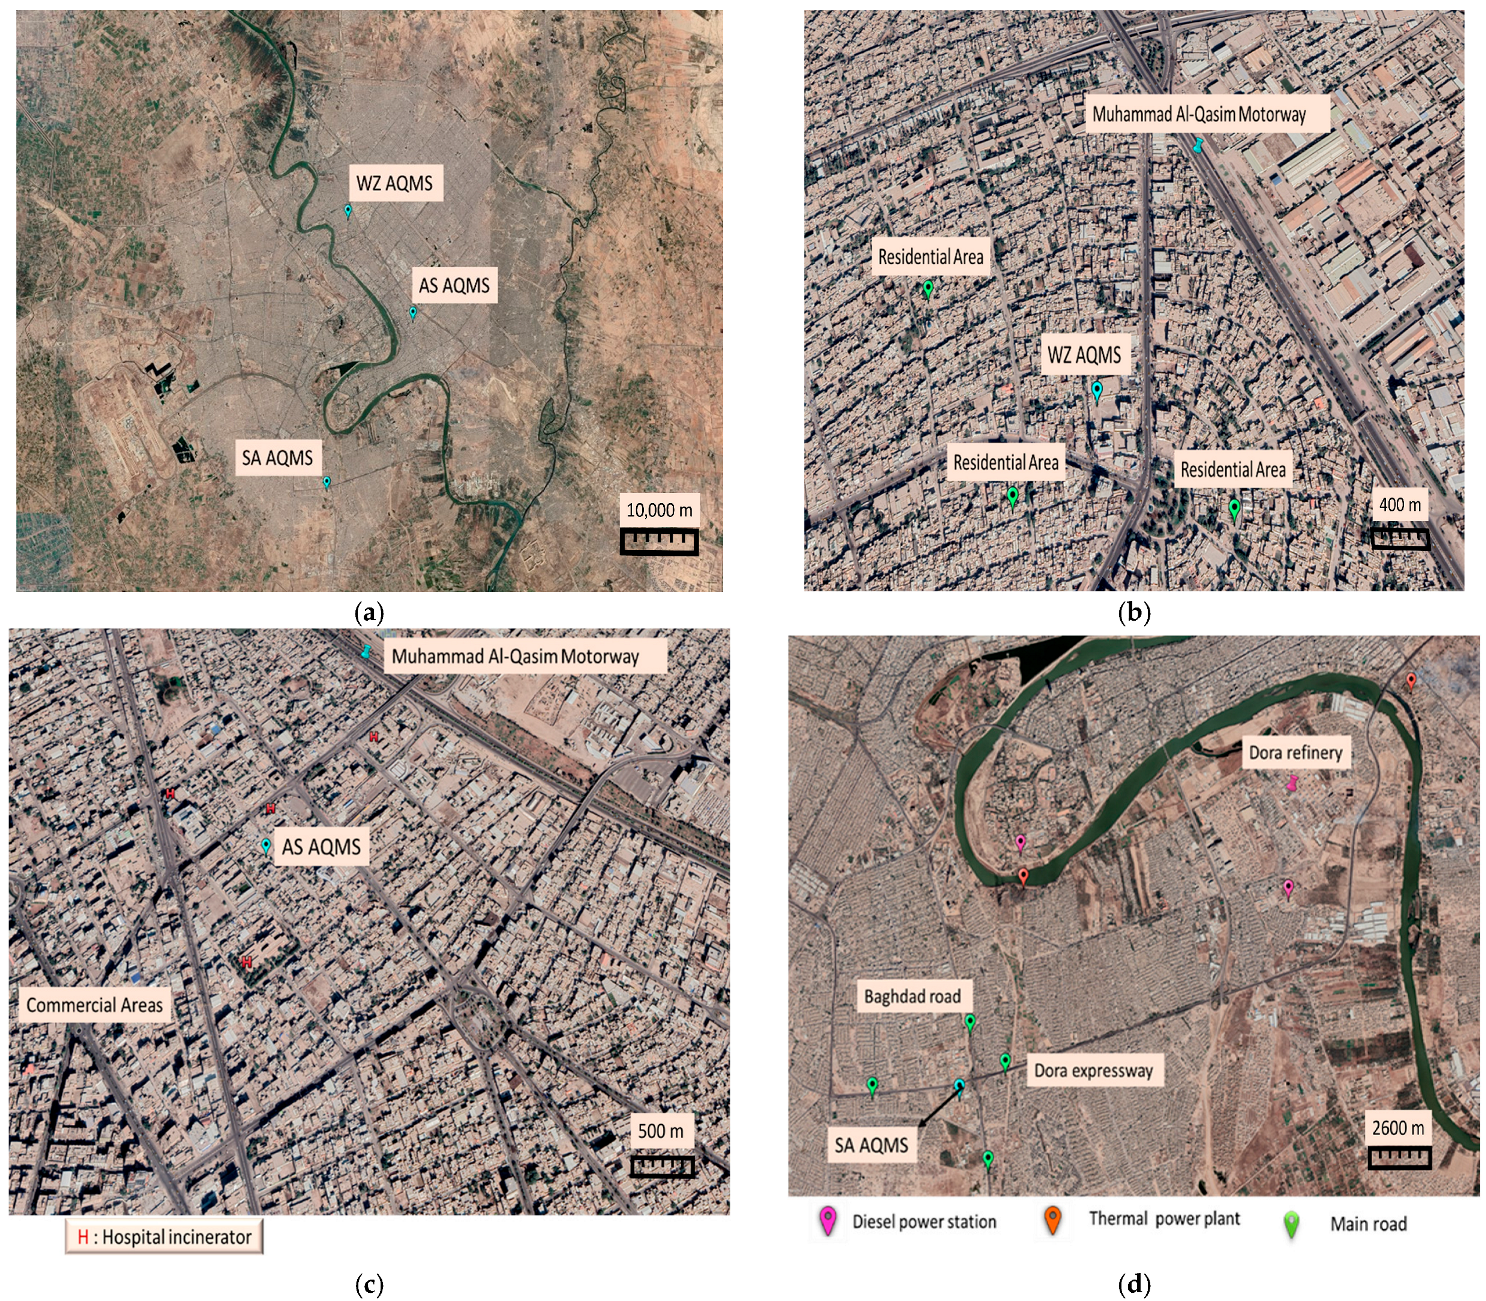
Sulphur dioxide (SO2), carbon monoxide (CO), non-methane hydrocarbon (NMHC), PM2.5, and meteorological parameters, such as wind speed and wind direction, were measured using Horiba air quality monitoring stations in all three locations. Table S1 in the Supplementary Materials displays the technical specification of the monitoring station’s instrumentation. Samples were collected from three Air Quality Monitoring Stations (AQMSs) located in different areas of Baghdad city (Al-Wazeriya (WZ), Al-Andalus square (AS), and Al-Saiydiya (SA) regions), as shown in Figure 1a–d). As discussed above, hourly samples were collected during working hours (i.e., 8:00 to 14:00 local time) due to electricity shortages throughout the entire year of 2019. The distances between the three monitoring stations are as follows: WZ-AS is approximately 6.96 km, AS-SA is approximately 10.59 km, and WZ-SA is approximately 14.49 km.
The WZ station is placed on the roof of the Ministry of Iraqi Environment’s first floor (33°36′45.9′ N and 44°38′37.0′ E), with a sample inlet installed 7 m above ground level. Generally, it is a residential area with main roads for commercial activities. The station is located around 90 m west of Abu Talib Street and around 80 m north of AL-Maghrib Street. The major highway in Baghdad, “Muhammad Al-Qasim”, runs from the north to the southeast of the station area, as seen in Figure 1b, near the station. However, the local region could be denoted as a residential-traffic area. The main pollution sources are likely to be congested traffic in the area and on the surrounding motorway, and the influence of significant numbers of local and home generators [36,37].
Figure 1c shows the AS station, which is part of the Baghdad Environment Directorate complex (the sample inlet is 1 m above the roof of the monitoring station, approximately 4 m above ground level with coordinates (33′18′56.1′ N and 44′25′45.1′ E)). The site is in a mixed residential and commercial area, which is heavily trafficked; four private hospitals (containing four incinerators) and eight government institutes are located within a 1 km radius of the AS station, so that it could be denoted as a commercial-traffic area [16]. To the southeast of the region are a South Baghdad thermal power plant using high sulphur fuel oil, a South Baghdad gas power plant and a wide area of irregular residential dumping sites where open burning might occur at approximate distances of 3.7 and 8.5 km, respectively. To the southwest of the site are the Dora refinery and Dora thermal power plant at an approximate distance of 5 and 8 km, respectively [38].
The SA station is located at ground level with GPS coordinates (33°16′21′ N and 44°22′25.8′ E). A traffic area, including a motorway, surrounds it. The monitoring station is located southeast of the busy traffic crossroads of the Dora Expressway and the main Baghdad Road, which connects Baghdad’s southern provinces at a distance of 400 m from the intersection. It is denoted as a motorway area where gasoline- or diesel-powered vehicles are commonly observed. The roads experience peak-hour traffic volumes of around 3000 vehicles per hour [39]. The Dora thermal power plant and Dora refinery are northeast of the site at approximately 3 and 7 km, respectively, with two main diesel-power generators (i.e., 60 and 30 MW), as shown in Figure 1d. It has been found that heavy-duty vehicle drivers try to avoid the major highways near government institutions, commercial activities, residential areas, and non-expressway routes during official business hours to avert congestion during periods when PM2.5 concentrations have been measured. Hence, gasoline-fuelled vehicles are likely to be the dominant source in the WZ and the AS region [40,41]. For the SA site, the motor vehicles could be either gasoline or diesel-fueled vehicles [18].
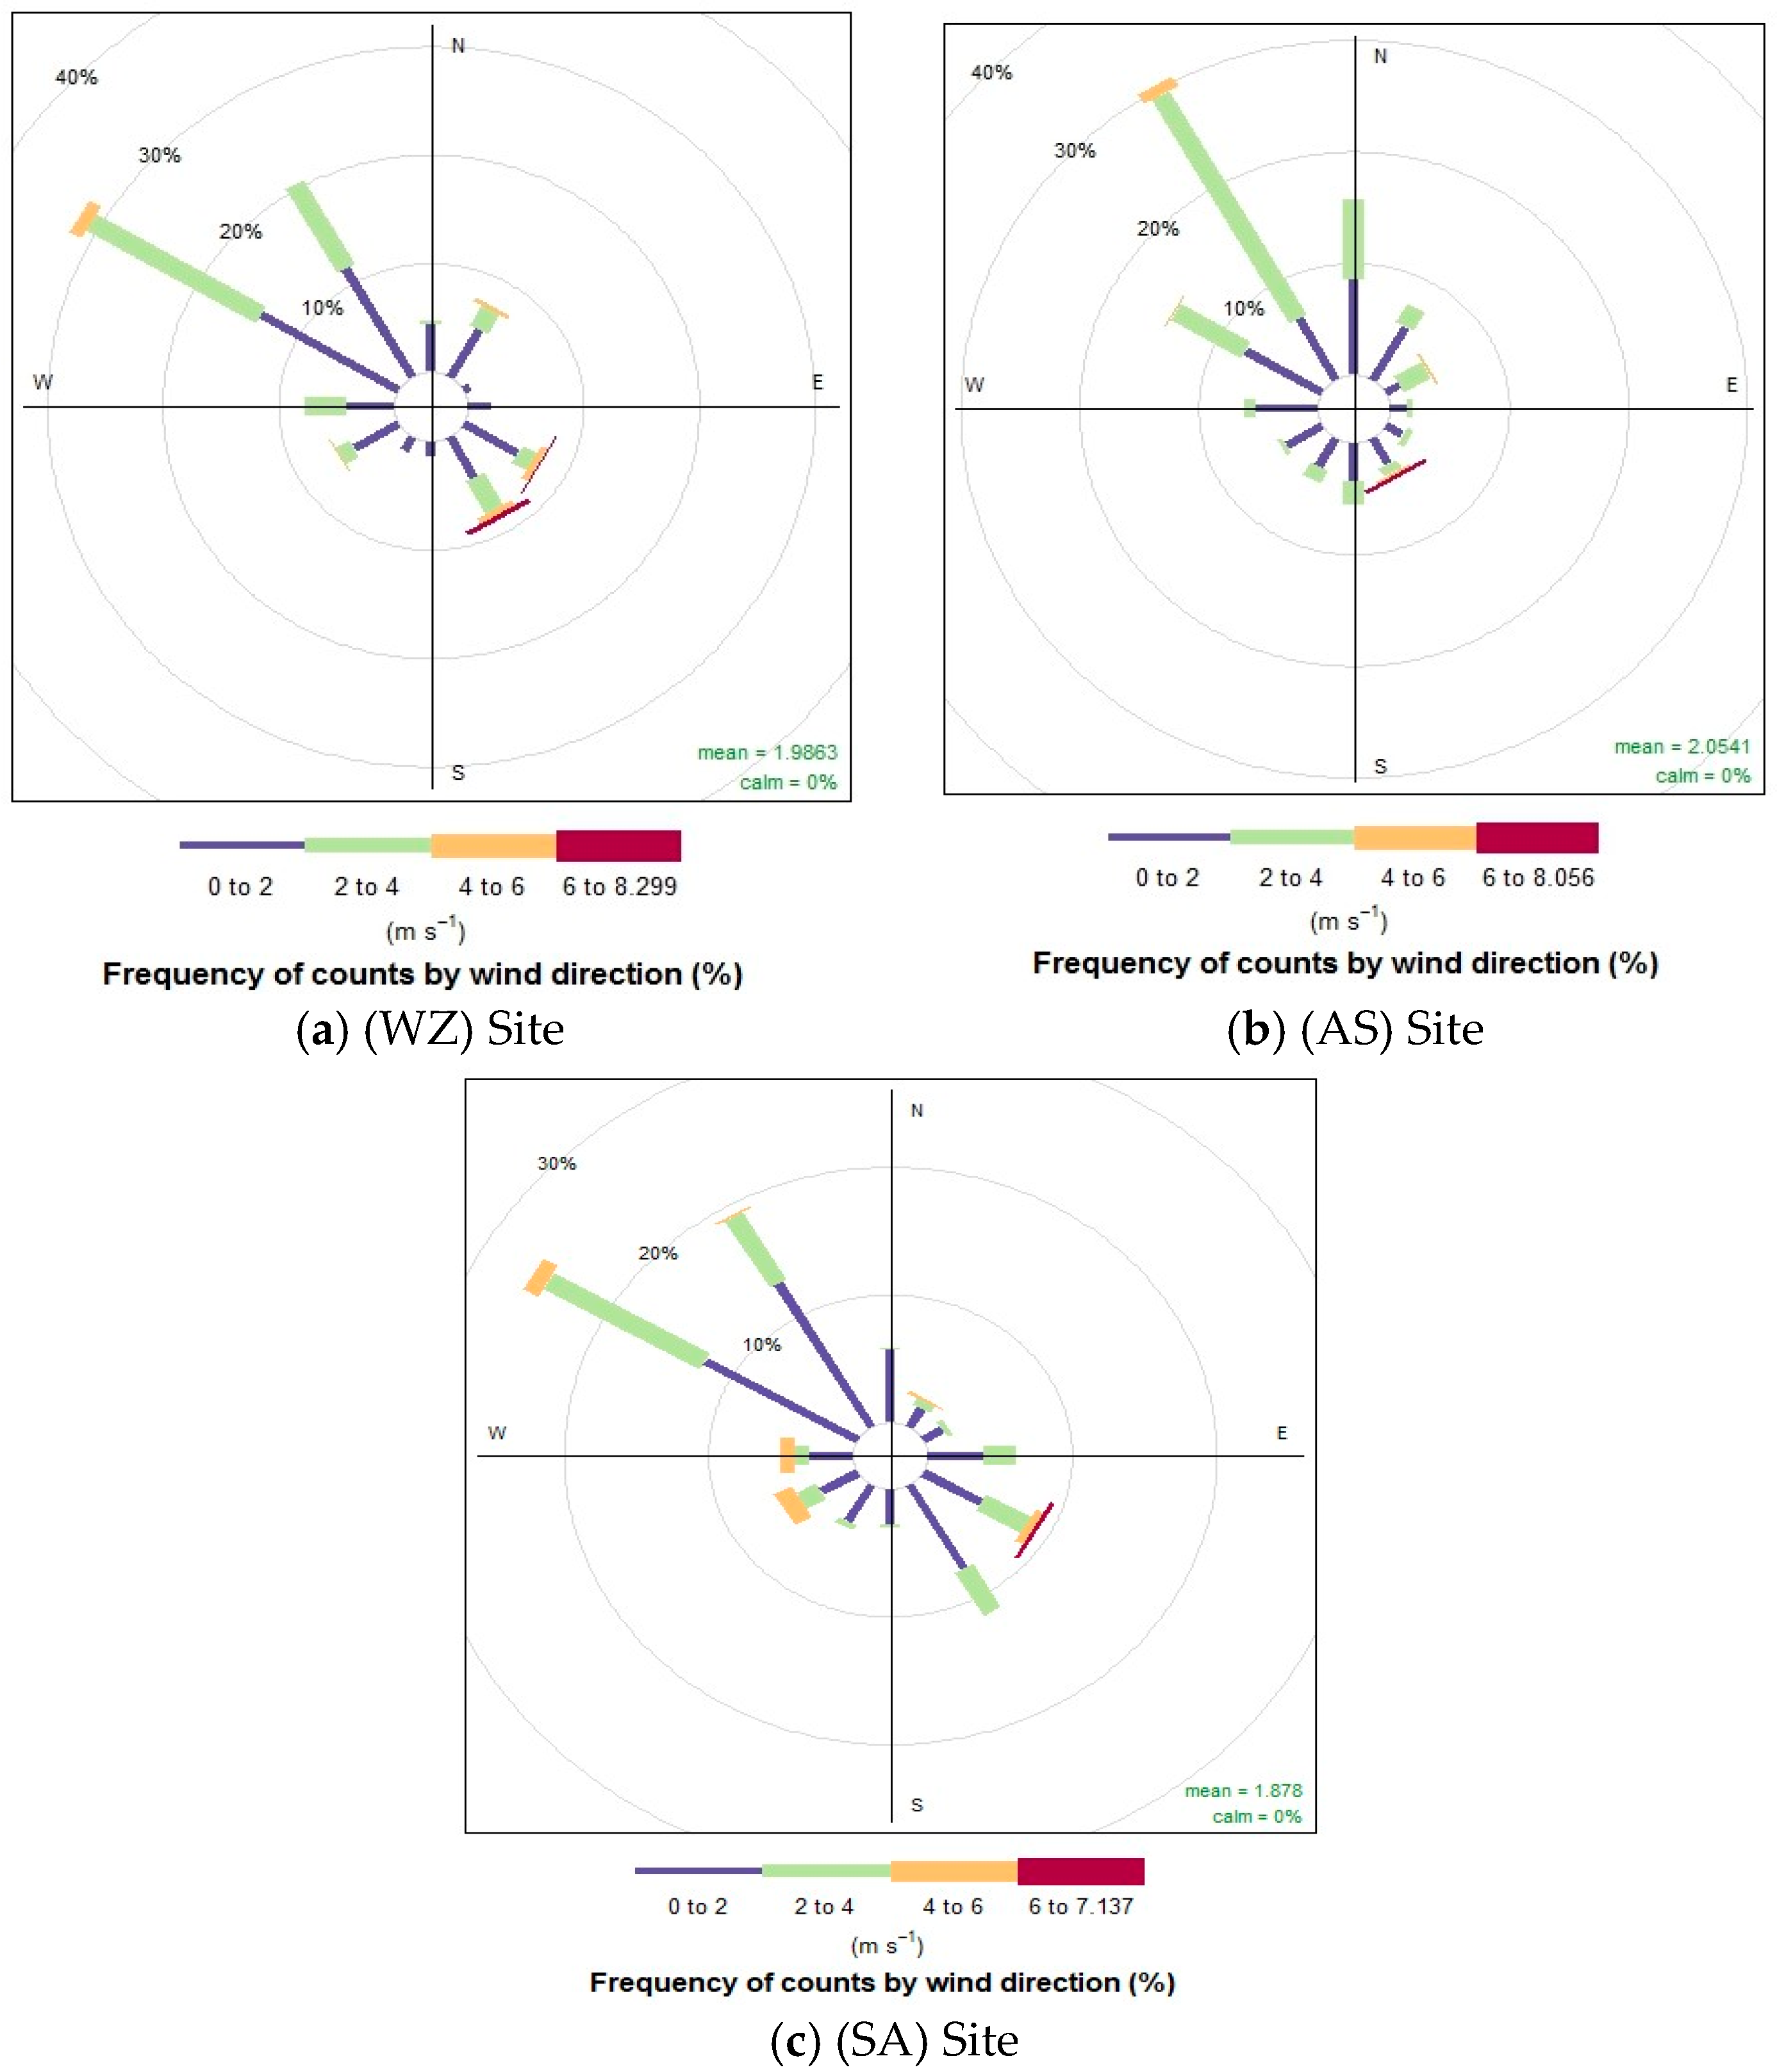
Wind roses representing the wind conditions in 2019 for the three monitoring sites are shown in Figure 2. The picture illustrates the predominance of north-westerly winds with low-to-medium mean wind speeds (i.e., 0–4 ms−1).

2.2. Statistical Techniques for Source Apportionment

This study utilised multi-stage statistical models due to limited data availability and varying sampling dates for local, regional, or national sources. Additionally, the conditional bivariate probability function of the particle-gas ratio was employed for the first time to differentiate between different urban particulate sources. In this multi-approach analysis, PM2.5 originating from natural sources such as dust storms is termed dust particulates. Similarly, the PM2.5 released in urban areas due to human activities is termed urban particulates.

2.2.1. Bivariate Polar Plots (BPPs) and Concentration Ratios (CRs)

Bivariate polar plots are a valuable analytical tool for identifying possible sources of air pollutants employing graphical analysis [42,43,44]. They show how the concentration of a pollutant at a measurement location varies jointly with wind speed and wind direction in polar coordinates. Using polar coordinates improves understanding of the directional dependency of various sources when exploring multiple observation locations, as employed in this study [45]. This technique facilitates the identification of potential sources of pollution and their associated dispersion directions, as well as the correlation between the concentration of pollutants and wind speed [46]. Bivariate polar graphs were created using hourly data on wind direction, wind speed, and PM2.5 concentrations to locate the potential PM2.5 sources and dust particulate assessment in Baghdad city as the first local source apportionment stage. Two polar plot maps were generated: one including all PM2.5 concentration measurements during the monitoring period, and another excluding measurements taken during dusty hours. The polar plot code of the Openair package in the R studio software (v2023.06.1 Build 524) was utilised to generate the bivariate polar graphs [42]. This code employs the generalised additive model (GAM) for smoothing, which is performed through the utilisation of the mixed GAM computation vehicle (mgcv) package in R for fitting smooth, non-linear relationships and thus providing a valuable tool for modelling complex data and enhancing the readability of the diagram [24,45].
Concentration ratios have been commonly utilised to identify ambient pollutant sources qualitatively. The characterisation of pollutant source diversity can be achieved by comparing concentration ratios between pairs of frequently found two-phase particle-gas concentrations [47]. The concentration ratio of pollutant X is determined as CR = X/Y, where Y is a reference/tracer species. Ideally, a reference species (Y) should predominantly be emitted from a single source type and remain relatively stable over a short time period without significant changes caused by photochemistry or other processes [48]. The second stage of the local source identification involved the computation of the concentration ratio of PM2.5/CO at the three monitoring sites. These were then compared with values in the existing literature to gain a preliminary understanding of the emission sources of fine particulates and to identify the heavy smoke regions. The Fire Information for Resource Management System (FIRMS) website map, which utilises the Moderate Resolution Imaging Spectroradiometer (MODIS) sensor from the National Aeronautics and Space Administration’s (NASA) Earth Observing System satellites, is then used to assess the influence of heavy smoke plumes by calculating the percentage of possible fire events at the monitoring sites. In this study, the percentages indicate the frequency with which the wind direction at the monitoring stations coincided with the location of possible fire locations for measurements exceeding the 90th percentile, in agreement with previous studies in the literature [49].

2.2.2. Conditional Bivariate Probability Function (CBPF)

CBPF methods can help to identify source impacts according to wind speed and direction [50]. The CBPF offers additional insights into the characteristics of sources as various types of sources may exhibit distinct dependencies on wind speed, which enables a certain level of differentiation between source types based on their dispersion patterns [46]. The probability of the determined concentration exceeding a predetermined threshold criterion for a particular wind direction and wind speed is estimated by CBPF. In this way, it is possible to determine those wind directions/speeds that lead to, for example, the exceedance of air quality standards at a particular monitoring location, and thus the direction in which significant pollution sources are located can be identified. CBPF can be expressed mathematically as
C B P F Δ θ , Δ u =   ( m θ   u   c x ) ( n θ u )
The total number of samples in a given wind direction (Δθ) and speed (Δu) sector is denoted by nθu, whereas the sample number in that sector of the wind direction–speed with concentration c that exceeds a set-point value x is characterised by mθu [21]. Two criterion values are used in this study. The first criterion is used for concentrations that exceed the daily Iraqi ambient standards (PM2.5 concentrations ≥ 25 µg/m3 as adopted by the Ministry of Iraqi Environment’s internal regulatory guidelines), and another for values above the 75th percentile, which reflect the probable source locations leading to higher concentrations. CBPF diagrams were generated using the Openair package (12 November 2019) [24].

2.2.3. Backward Trajectory Calculations

The study conducted a backward trajectory analysis by using the potential source contribution probability function and concentration-weighted trajectory to understand long-distance air mass plume transportation originating from remote upwind source areas. The 72 h back-trajectories were computed utilising the meteorological data fields from the Global Data Assimilation System (GDAS1) [51], with starting times corresponding to hours where hourly average pollutant concentrations were obtained at the pollution monitoring sites, i.e., from 05:00 to 12:00 UTC (08:00 to 15:00 LT—local time). This resulted in a total of 7 trajectories per sampling day. GDAS employs a spectral medium-range forecast model, and the trajectory calculation relies on the Hybrid Single-Particle Lagrangian Integrated Trajectory Model (HYSPLIT) [51]. Additional information regarding the HYSPLIT may be gathered from the National Oceanic and Atmospheric Administration NOAA Air Resources Laboratory website [52].
The starting atmospheric level was chosen as 500 m above ground level. Previous research has suggested that the height should vary from 100 to 600 m to adequately reflect the wind in the lower boundary layer and mitigate the effects of surface friction [53,54,55]. The selected height is suitable for minimising surface frictional effects and capturing pollutant movement within the approximate atmospheric boundary layer in this particular area and to accurately represent long-range pollutant transport, given the region’s topography and climatic conditions as recommended in previous studies [56,57,58].

2.2.4. Potential Source Contribution Function (PSCF)

The Potential Source Contribution Function (PSCF) is a technique utilised for recognising regional sources of fine particles (PM2.5) by employing the HYSPLIT [59]. Back air mass trajectories are related to the composition of the gathered material by comparing the arrival time of each trajectory at the receptor location (such as an air quality monitoring station in the current study) to the measurement interval. Therefore, PSCF can be defined as the conditional probability that concentrations greater than a specified criteria value are linked to the movement of air parcels through the grid cell during transportation to the receptor location [53]. The PSCF value for a given grid cell is determined by counting the trajectories whose endpoints lie within that cell. The number of terminal points in the i,jth cell is denoted by ni,j. The variable denoted as mi,j represents the count of terminal locations associated with a particular cell with arrival times at the receptor site corresponding with pollutant concentrations exceeding a specific threshold value [60]. This analysis considers the hourly Iraqi standards (µg/m3) as the criterion value. The PSCF value for the i,jth cell is then determined as follows:
P S C F ( i , j ) =   m i , j n i , j
In this study, each grid cell had a resolution of 0.5° × 0.5°, within the total domain of interest extending from 28° N to 44° N and from 36° E to 50° E.
The PSCF technique identifies areas more likely to be in the upwind direction when the receptor concentrations are high, specifically in the top 40% of days, compared to the average on a daily basis. However, a region characterised by a reduced Potential Source Contribution Function value does not necessarily refer to reduced emissions from the area, as these emissions may not undergo transportation to the receptor site. Furthermore, upwind regions where secondary pollutants are formed in the atmosphere could include not only areas where primary emissions originate but also areas where the secondary formation is notably increased [60].
The adoption of the weighting function Wij was implemented to more accurately represent variation in cells with small nij values, particularly when these values increase uncertainty in PSCF estimates [53]. Weighting factors were calculated and pre-programmed in the TrajStat software (v 3.6) as follows [61]:
W i j = 1.00 , 80 < n i j 0.70 , 20 < n i j 80 0.42 , 10 < n i j 20 0.05 , n i j 10

2.2.5. Concentration Weighted Trajectory (CWT) Analysis

Since PSCF represents the percentage of pollution trajectories from a particular grid point rather than the actual concentration of pollutants along the trajectory, CWT is also utilised to evaluate trajectories with related concentrations [62]. In this approach, each grid cell is assigned a weighted concentration derived from the average sample concentrations corresponding to trajectories that passed that grid cell as follows [63]:
C i j   =     1 l   = 1 M τ i j l l = 1 M C l τ i j l
The variable Cij represents the weighted mean concentration in the grid cell (i,j). The concentration of PM2.5 is denoted by Cl, while τijl stands for the count of trajectory endpoints within the grid cell (i,j) linked to the Cl sample. M, on the other hand, refers to the total number of samples that have trajectory endpoints in the same grid cell (i,j). The PSCF’s weighting function and grid-scale area were utilised in the CWT method to mitigate the impact of low nij values and cell uncertainty. The technique employed for computing trajectories, PSCF, and CWT involved the utilisation of the Geographical Information System (GIS)-based software TrajStat [61].

3. Results and Discussion

3.1. Baghdad’s Local Sources of Fine Particulates

The first stage of the analysis used bivariate polar plots for dust and urban fine particulates assessment by separating measurements of dust storm days and removing data collected during dusty hours from the overall monitoring period. This approach aimed to ascertain the primary source of PM2.5, specifically examining whether they were predominantly derived from natural events such as dust storms or human activities in urban areas, including vehicle emissions, industrial activities, and domestic heating. Subsequently, pollutant concentration ratios have been used to distinguish the influence of particular sources, such as open fire burning and gas flaring, compared to other urban sources. PM2.5 urban assessment using the CBPF was employed for the third stage.

3.1.1. Stage One: Dust and Urban Particulates Assessment Using BPPs

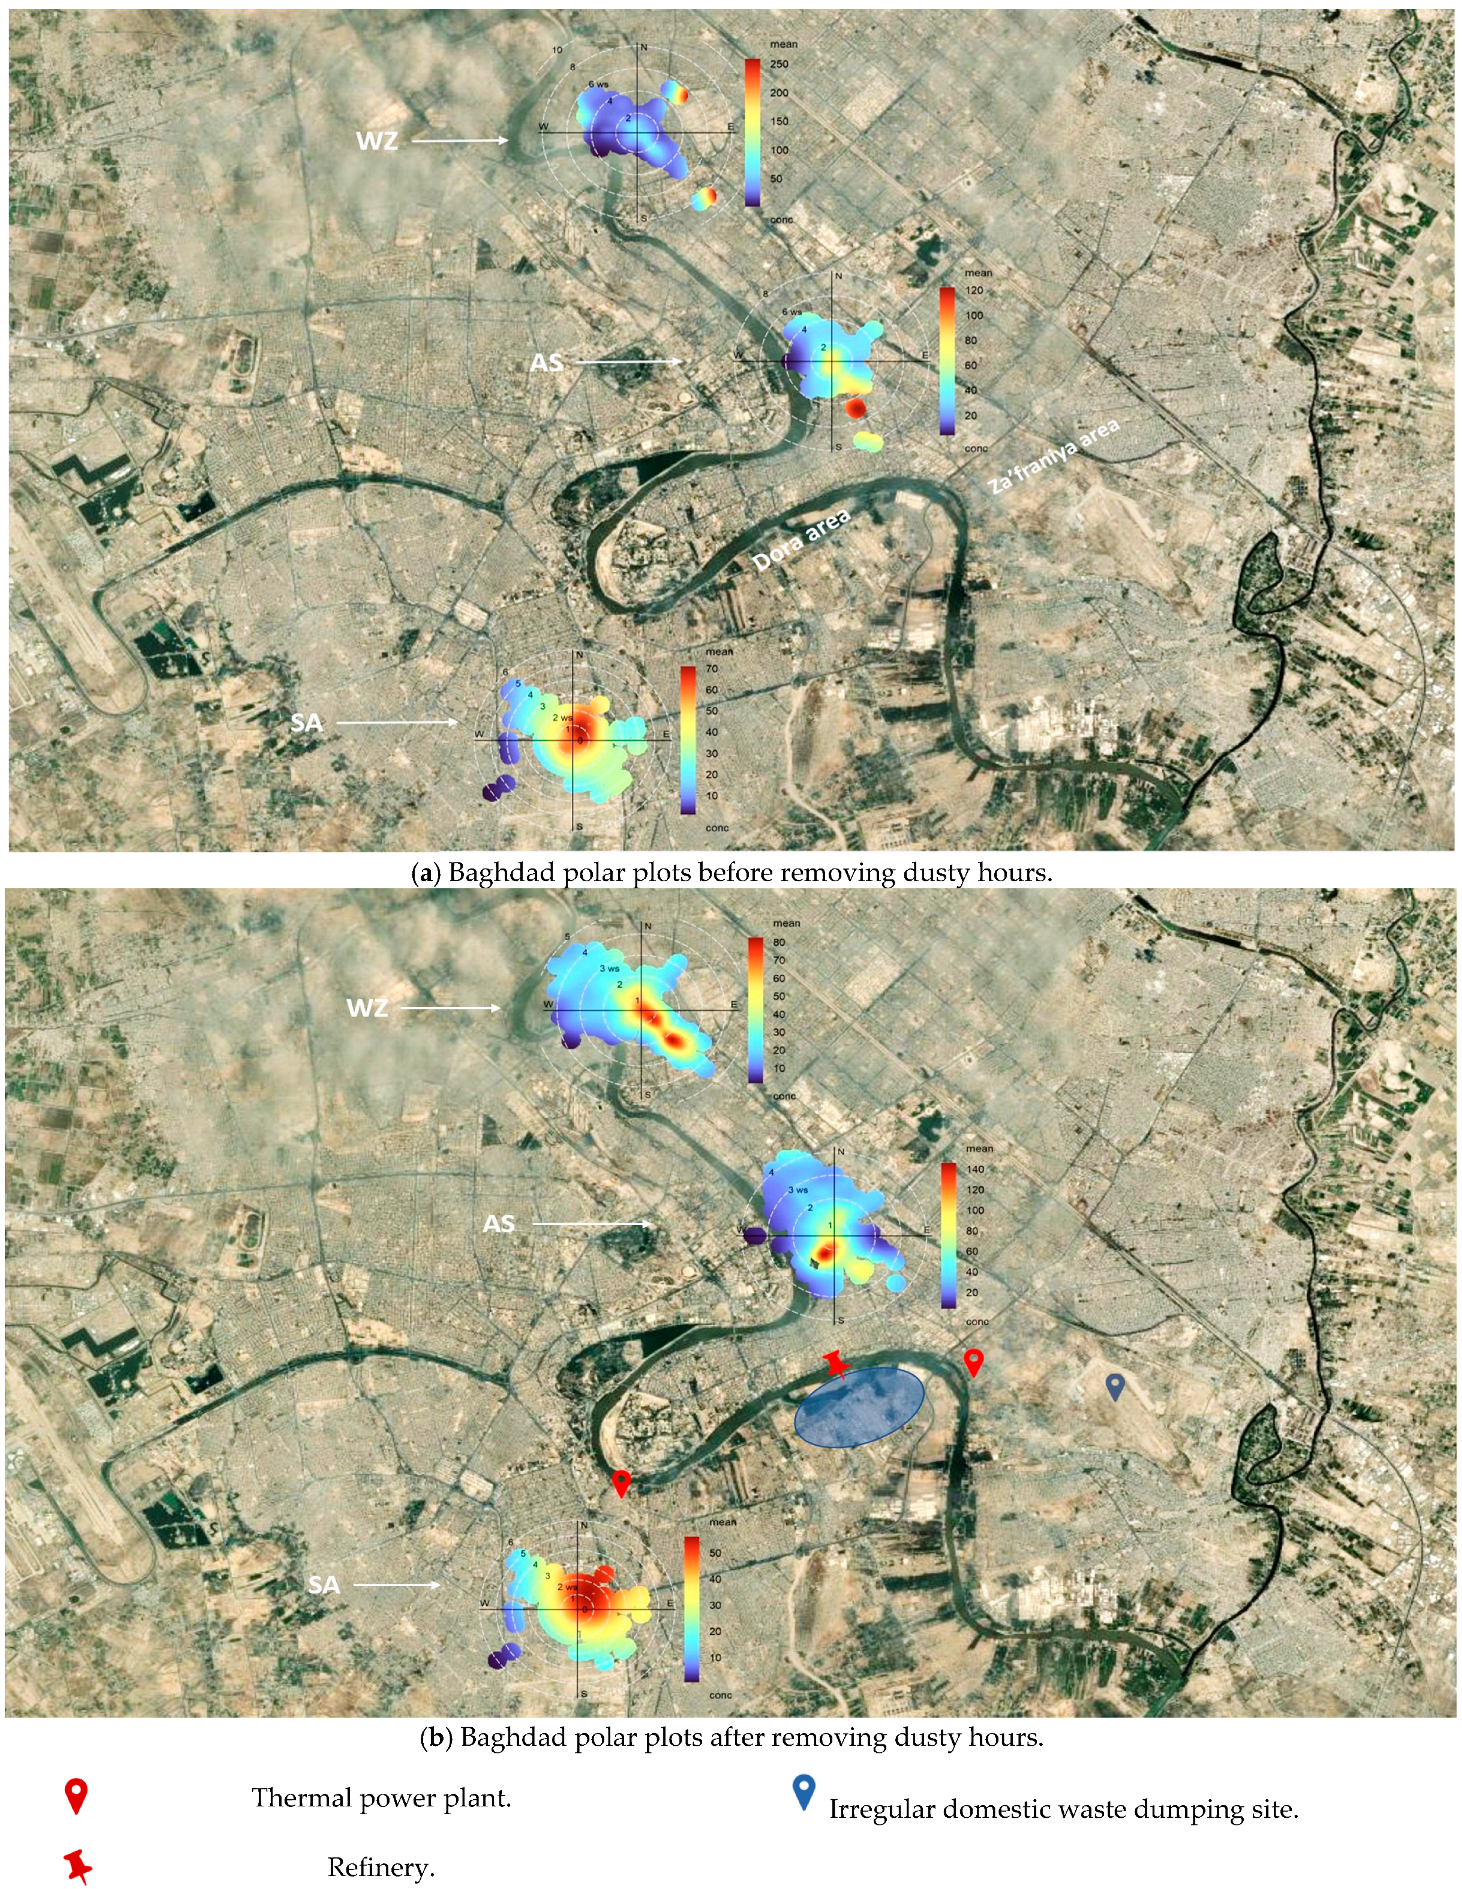
The polar plots in Figure 3a,b illustrate the average PM2.5 levels across different wind sectors in the WZ (residential-traffic), AS (commercial-traffic), and SA (motorway) areas before and after removing the dusty days, respectively, emphasising the spatial distribution patterns in relation to wind conditions. The maximum mean concentration related to a specific wind sector in the WZ area decreases significantly by 170 µg/m3 when data for dusty days is removed. In comparison, the SA site witnesses a marginal decrease from (60 to 50 µg/m3). These reductions are most significant for winds from the northeast and southeast sectors and for high wind speed conditions, which would be expected to drive dust storms. In contrast, the peak concentrations in the AS region do not see a reduction in the maximum concentrations, which remain above 100 µg/m3 and occur at low wind speeds. These plots reveal that although dust storms generate higher PM2.5 concentrations of more than 100 µg/m3, there are other, mainly urban contributors, to PM2.5 pollutants. These findings are consistent with previous studies. For instance, a study by Al-Salihi (2018) demonstrated that urban-type PM constituted 47.5% of the aerosol types [22]. In contrast, dust-type PM accounted for 30.25% of the collected PM, based on optical characteristics [6].
Once the data from dusty days have been removed, the polar plots in Figure 3b suggest that locally urban sources of elevated PM2.5 concentrations are present, as potentially indicated by the elevated concentrations during calm conditions (wind speed < 1 ms−1) for the three monitoring stations. For the WZ site, fine particulates were carried to the monitoring site by north-westerly winds and south-easterly winds at low wind speeds (i.e., <1 ms−1), while for the AS and SA sites, the pollutants were carried by south-westerly and north-easterly winds, respectively. The local sources could be attributed to motor vehicles and private domestic power generators [6,40,64].
Another interesting common feature for the WZ (traffic-residential) and AS (commercial-traffic) regions is that the PM2.5 originates from the same wind direction sectors (from the SE of both sites and SW of the AS site) with medium wind speed. In contrast, the plot for SA takes a different pattern. High concentrations at the SA site arise from wind sectors from the north to the northeast, where there is a thermal power plant (with a 100 m stack height) and the Dora refinery, as seen in Figure 1d and Figure 3b.
It is worth mentioning that the AS AQMS is located southeast of the WZ station. However, the southwest direction of WZ could refer to either the southwest or southeast of the AS station. The maximum ambient concentrations of WZ and AS were found for winds coming from the southeast and southwest at wind speeds of (2–3.5 ms−1) and (1.5–3 ms−1), respectively. High concentrations at non-calm wind speeds are likely to reflect a distant rather than immediate local source of PM2.5 for WZ and AS, respectively. A common source could be responsible for both peaks at both sites. Apart from dust resuspension, a possible air pollution source in the remote southeastern areas of WZ and southwestern regions of AS and northeastern SA site could be generated from gas-flare burning from the Dora refinery, Dora thermal plant, Dora diesel power station and AL-Jadriya power station. Another potential source could be the southern Baghdad thermal power plant. This thermal plant is located southeast of the WZ and AS sites, but near the AS sites. Another possible source is the open burning of domestic waste where large, irregular waste piles accumulate on an abandoned military airport southeast of the AS monitoring site [65]. It has been found in previous studies that the Dora, AL-Za’franiya areas are considerably polluted due to various anthropogenic facilities, including two thermal and diesel power plants, two gas power plants, and a main refinery and open burning activities [14,16,66]. The high sulphur content in heavy fuel oil (i.e., 2.5–4.5% by weight), combined with a lack of modern exhaust gas mitigation measures or inadequate air quality management, exacerbates the pollution in these areas [40,67]. Notably, the three monitoring sites under low-medium wind speeds (i.e., 1–4 ms−1) could potentially align with these two areas.

3.1.2. Stage Two: Fire Burning Assessment Using CR of PM2.5/CO

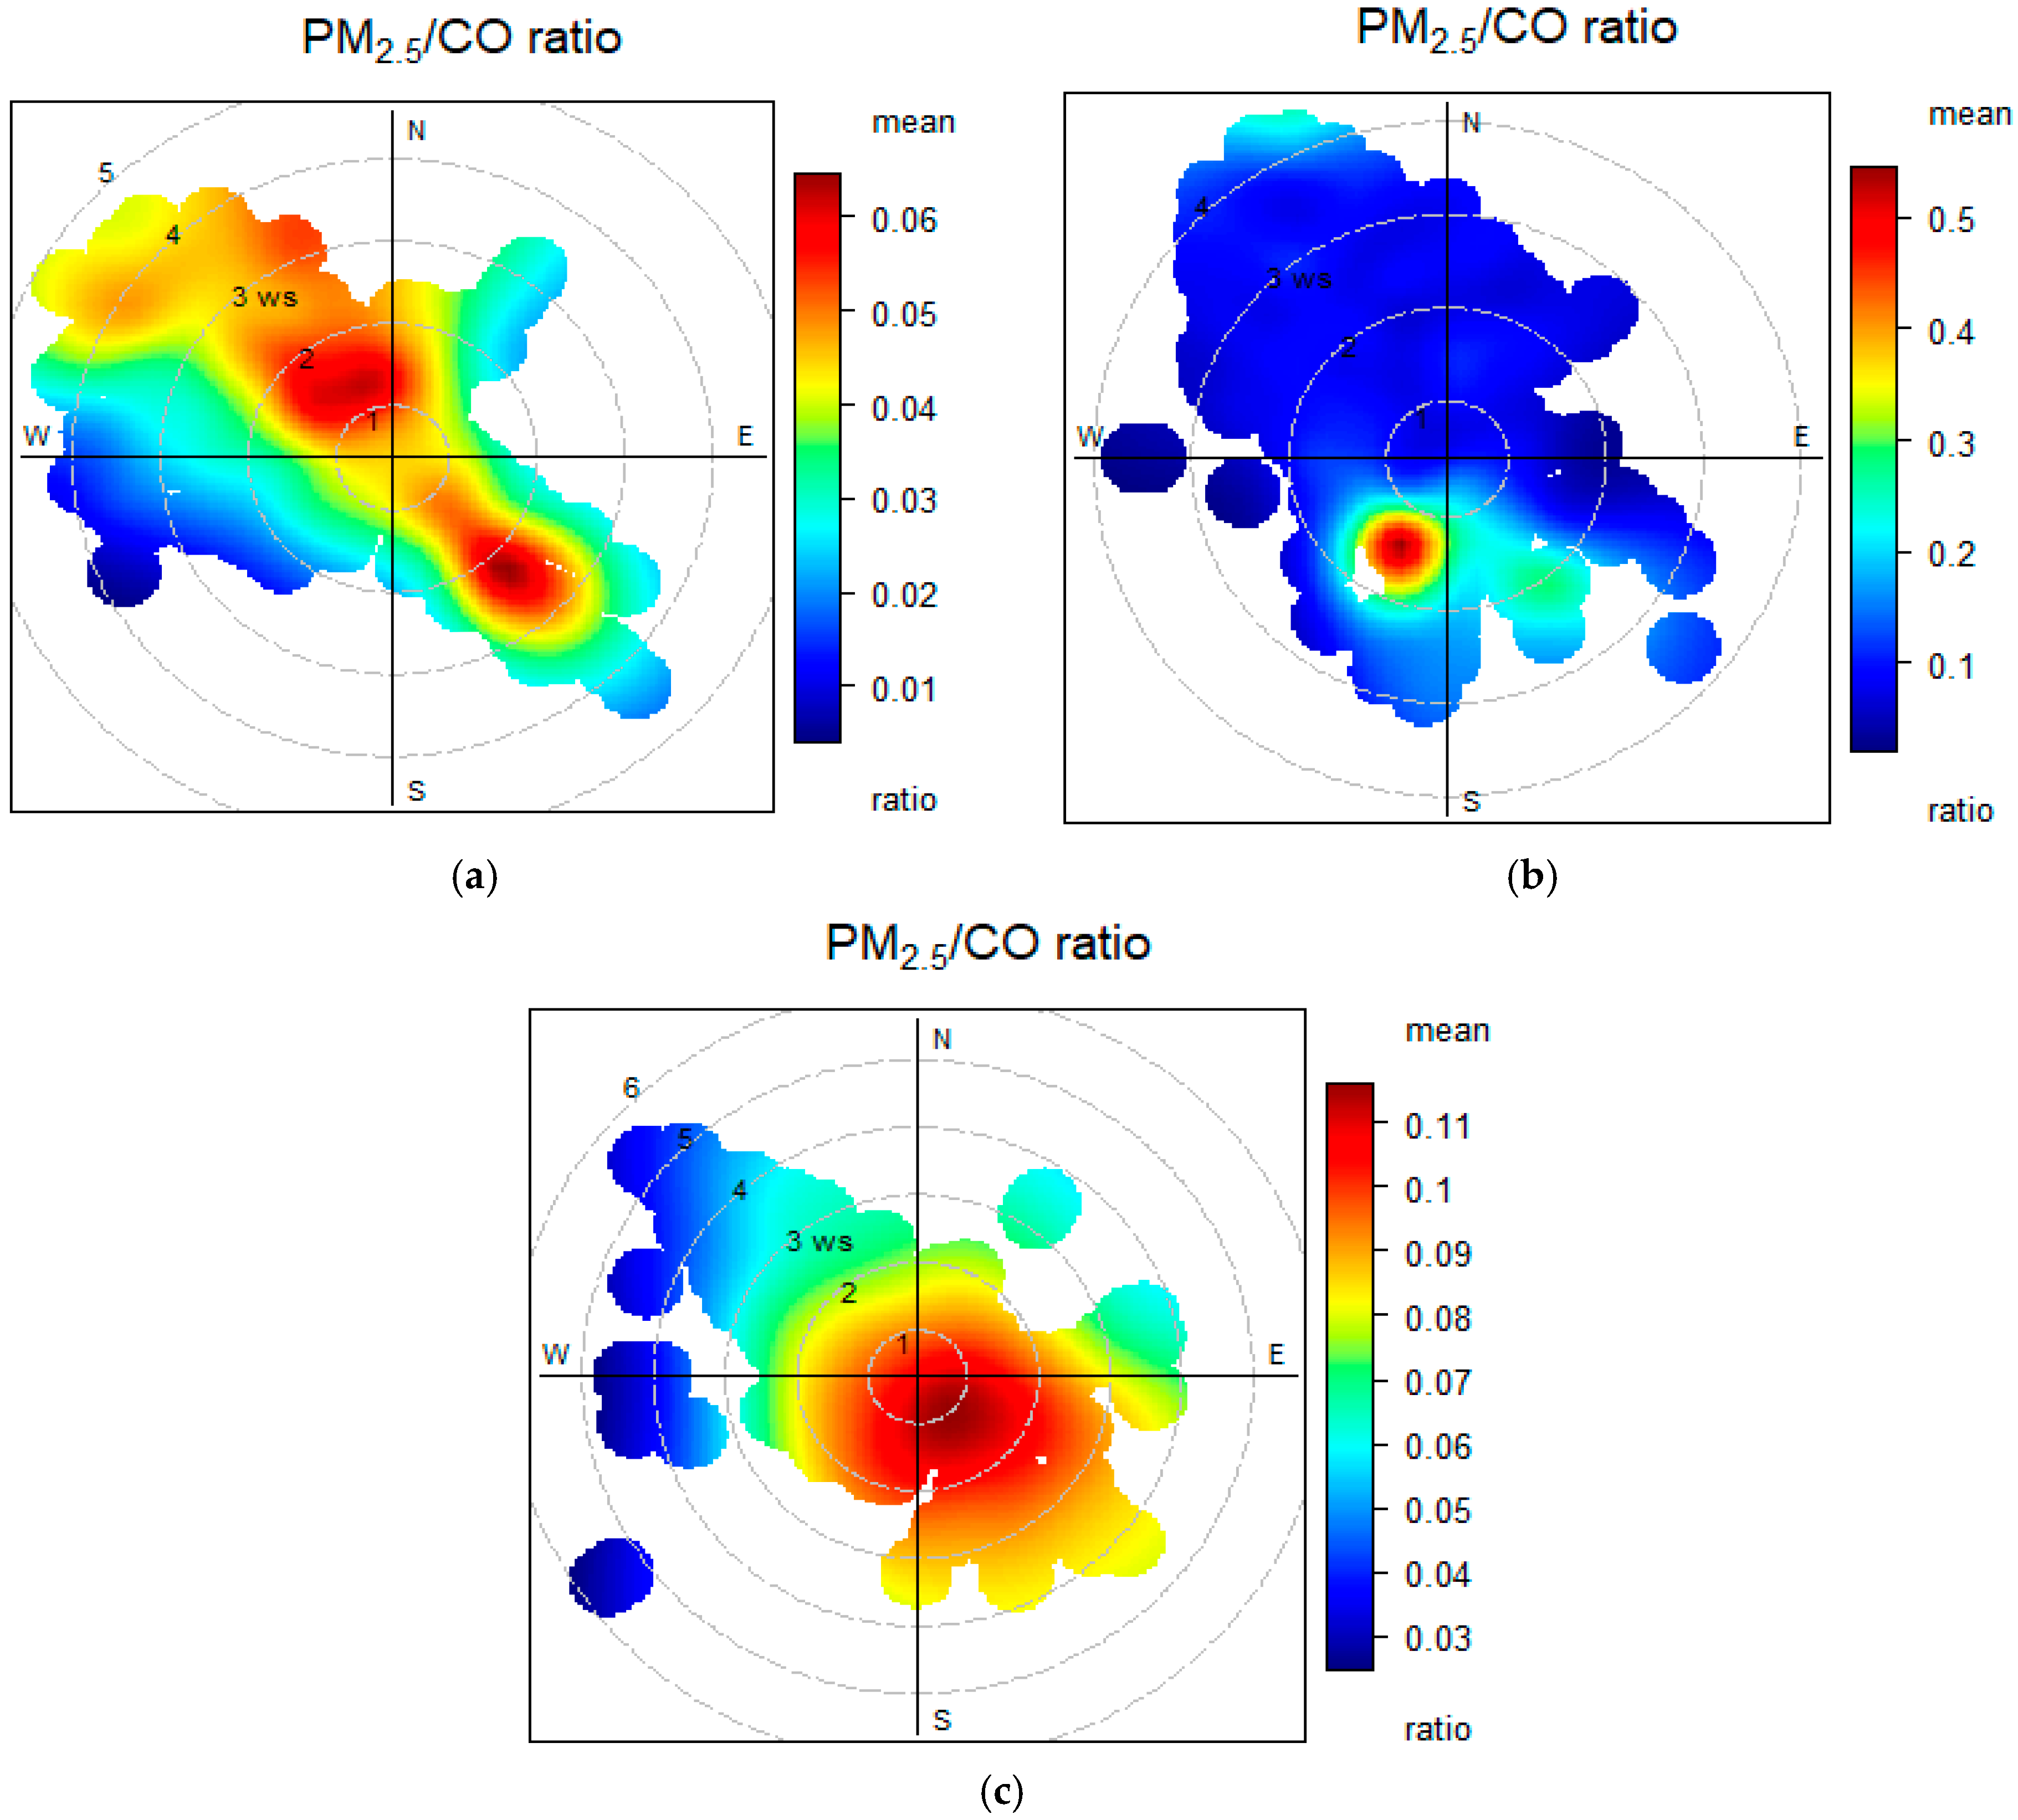
Figure 4 shows BPPs of PM2.5/CO CR at the WZ, AS, and SA sites. The highest ratio was observed for pollutants within air masses transported from the southwest and southeast directions at AS, indicating potential sources from heavy smoke areas caused by sources such as gas flaring or open burning incidents. In Baghdad’s winter, open fire burning is commonly used for home heating. However, open burning may also occur during the year due to emergency gas flares at oil refineries or gas power plants, open waste burning, or coal burning for outdoor cooking [6]. The PM2.5/CO ratio ranges from (0.3–0.5) and (0.08–0.11) at AS and SA, respectively, which is consistent with other findings in the United States [26,27]. The highest ratio of PM2.5/CO (0.3–0.5) for winds from the southwest of the AS region may be attributed to the gas flaring that frequently occurs at the Dora refinery or the heavy smoke released from the Dora thermal power plant. While for winds from the southeast of AS, it is more likely to result from the southern Baghdad thermal power plant or a big irregular garbage pile where open burning could occur [68]. The high concentration ratio from the southwest could be attributed to primary or secondary particulates. A possible source of secondary particulates could be nucleation processes, which potentially occurred during periods of elevated concentrations of SO2 (i.e., >0.04 ppm) with winds from the southwest (Figure S1b,c) in the presence of foggy and cold atmospheric conditions, which may enhance the formation of sulphate particles. Whilst this remains a hypothesis, Figure S1a,b) shows a high PM2.5/CO ratio and PM2.5 concentrations of more than 160 µg/m3 from the southwest under high relative humidity (i.e., around 60%).
In contrast, SA and WZ have a lower PM2.5/CO ratio than AS. WZ records the lowest ratio due to increased emissions from gasoline-powered motor vehicles, which significantly contribute to CO levels, and its distance from sources of fire burning, such as gas flaring [27,28]. To further distinguish between possible sources, the Fire Information for Resource Management System (FIRMS) website map, which utilises the Moderate Resolution Imaging Spectroradiometer (MODIS) sensor from the National Aeronautics and Space Administration’s (NASA) Earth Observing System satellites, is used to evaluate the PM2.5/CO ratio findings. Figures S2 and S3 in the Supplementary Material depict the possible fire map of specific peak episodes where the WZ, AS, and SA AQMS measured the maximum hourly PM2.5 concentrations at moderate to high wind speeds (i.e., 2–5 ms−1). The temporal distribution of PM2.5 during these days and associated wind direction are shown for 21 October 2019 at the WZ station, where PM2.5 peaked at 397 µg/m3; 16 February at the AS station, where PM2.5 soared to 663 µg/m3 and 15 December 2019 at the SA site, where PM2.5 reached 349 µg/m3. It has been found that a directional correlation between possible fire events and wind patterns occurs in 75%, 60%, and 29% of cases at the WZ, AS, and SA sites, respectively, among the 90th percentile of concentration measurements (i.e., the concentrations surpass 80, 80, and 75 µg/m3, respectively). The peak concentration at the SA station, despite the absence of any observed fire, such as a gas flare, on the FIRMS map, suggests that the peak episode could be caused by heavy smoke from the thermal power plant, in line with studies conducted in the Baikal region [49]. These findings reveal that fire burning, such as gas flaring or open burning, and the heavy smoke from distant thermal power plants are likely to cause significant PM2.5 concentrations, but are not the dominant sources. However, to evaluate whether fire burning is the dominant source of fine particulates, CBPF analysis will be employed in this study.

3.1.3. Stage Three: Fine Particulate Urban Assessment Using a Conditional Bivariate Probability Function

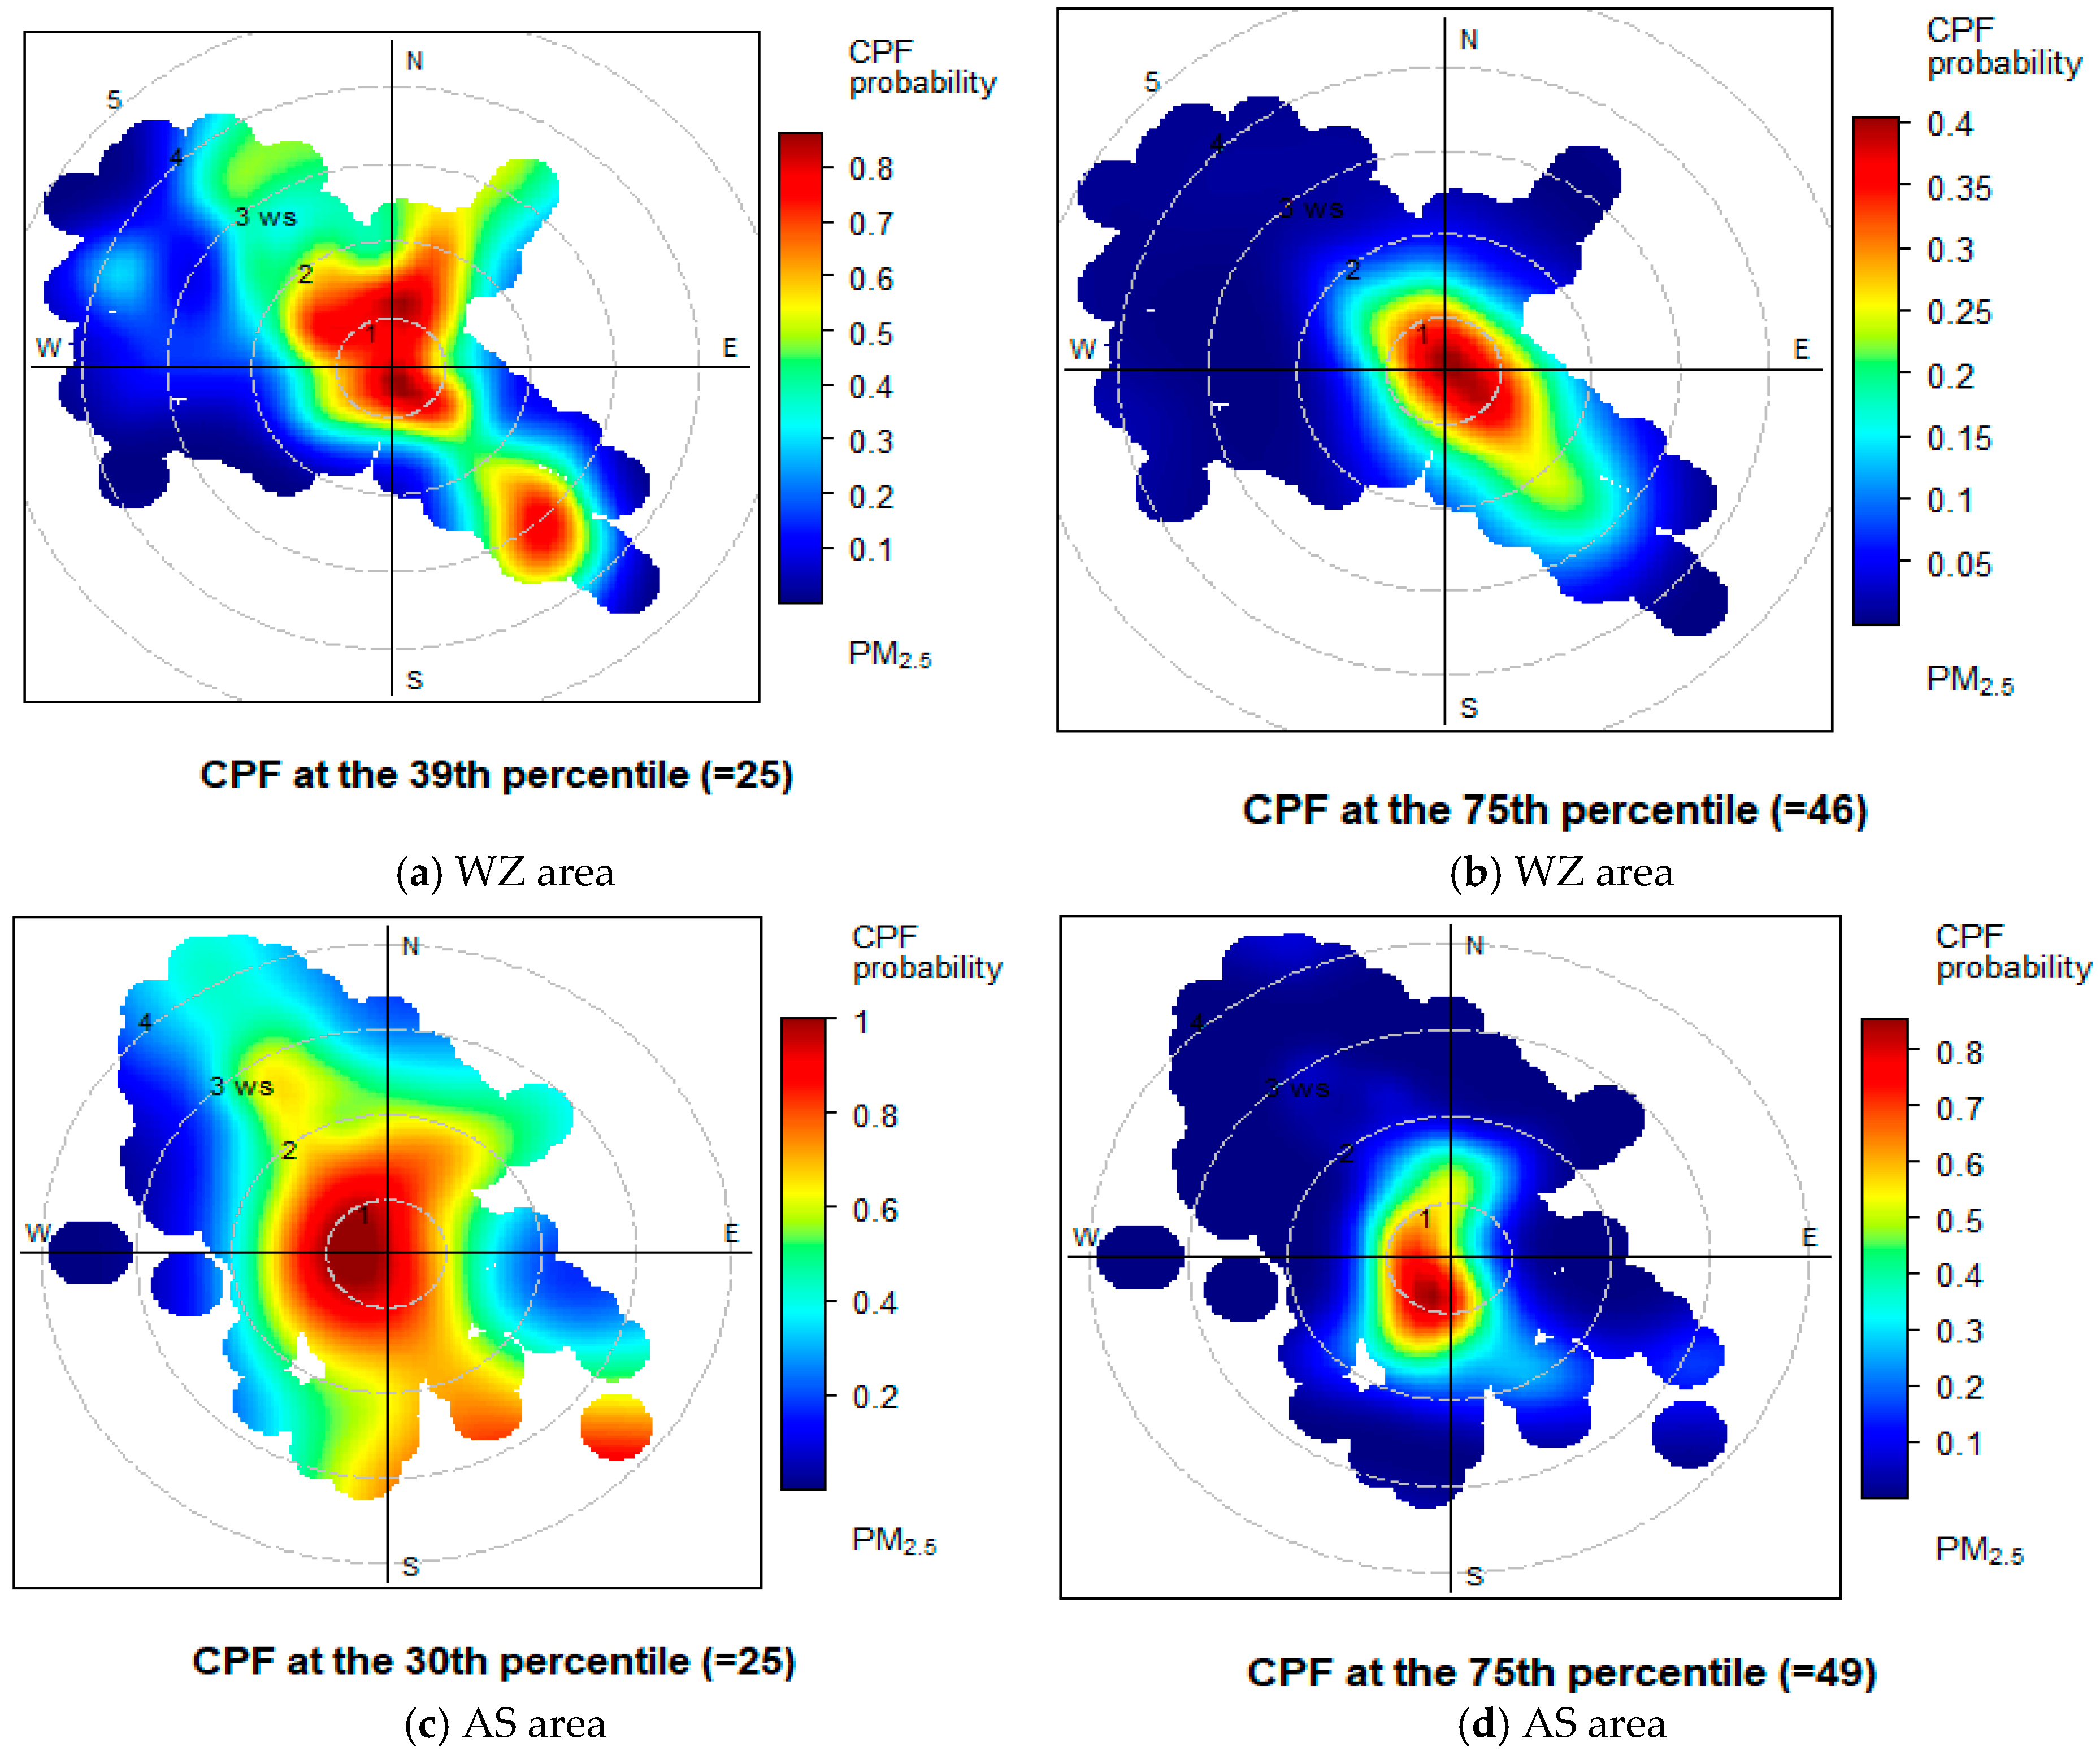
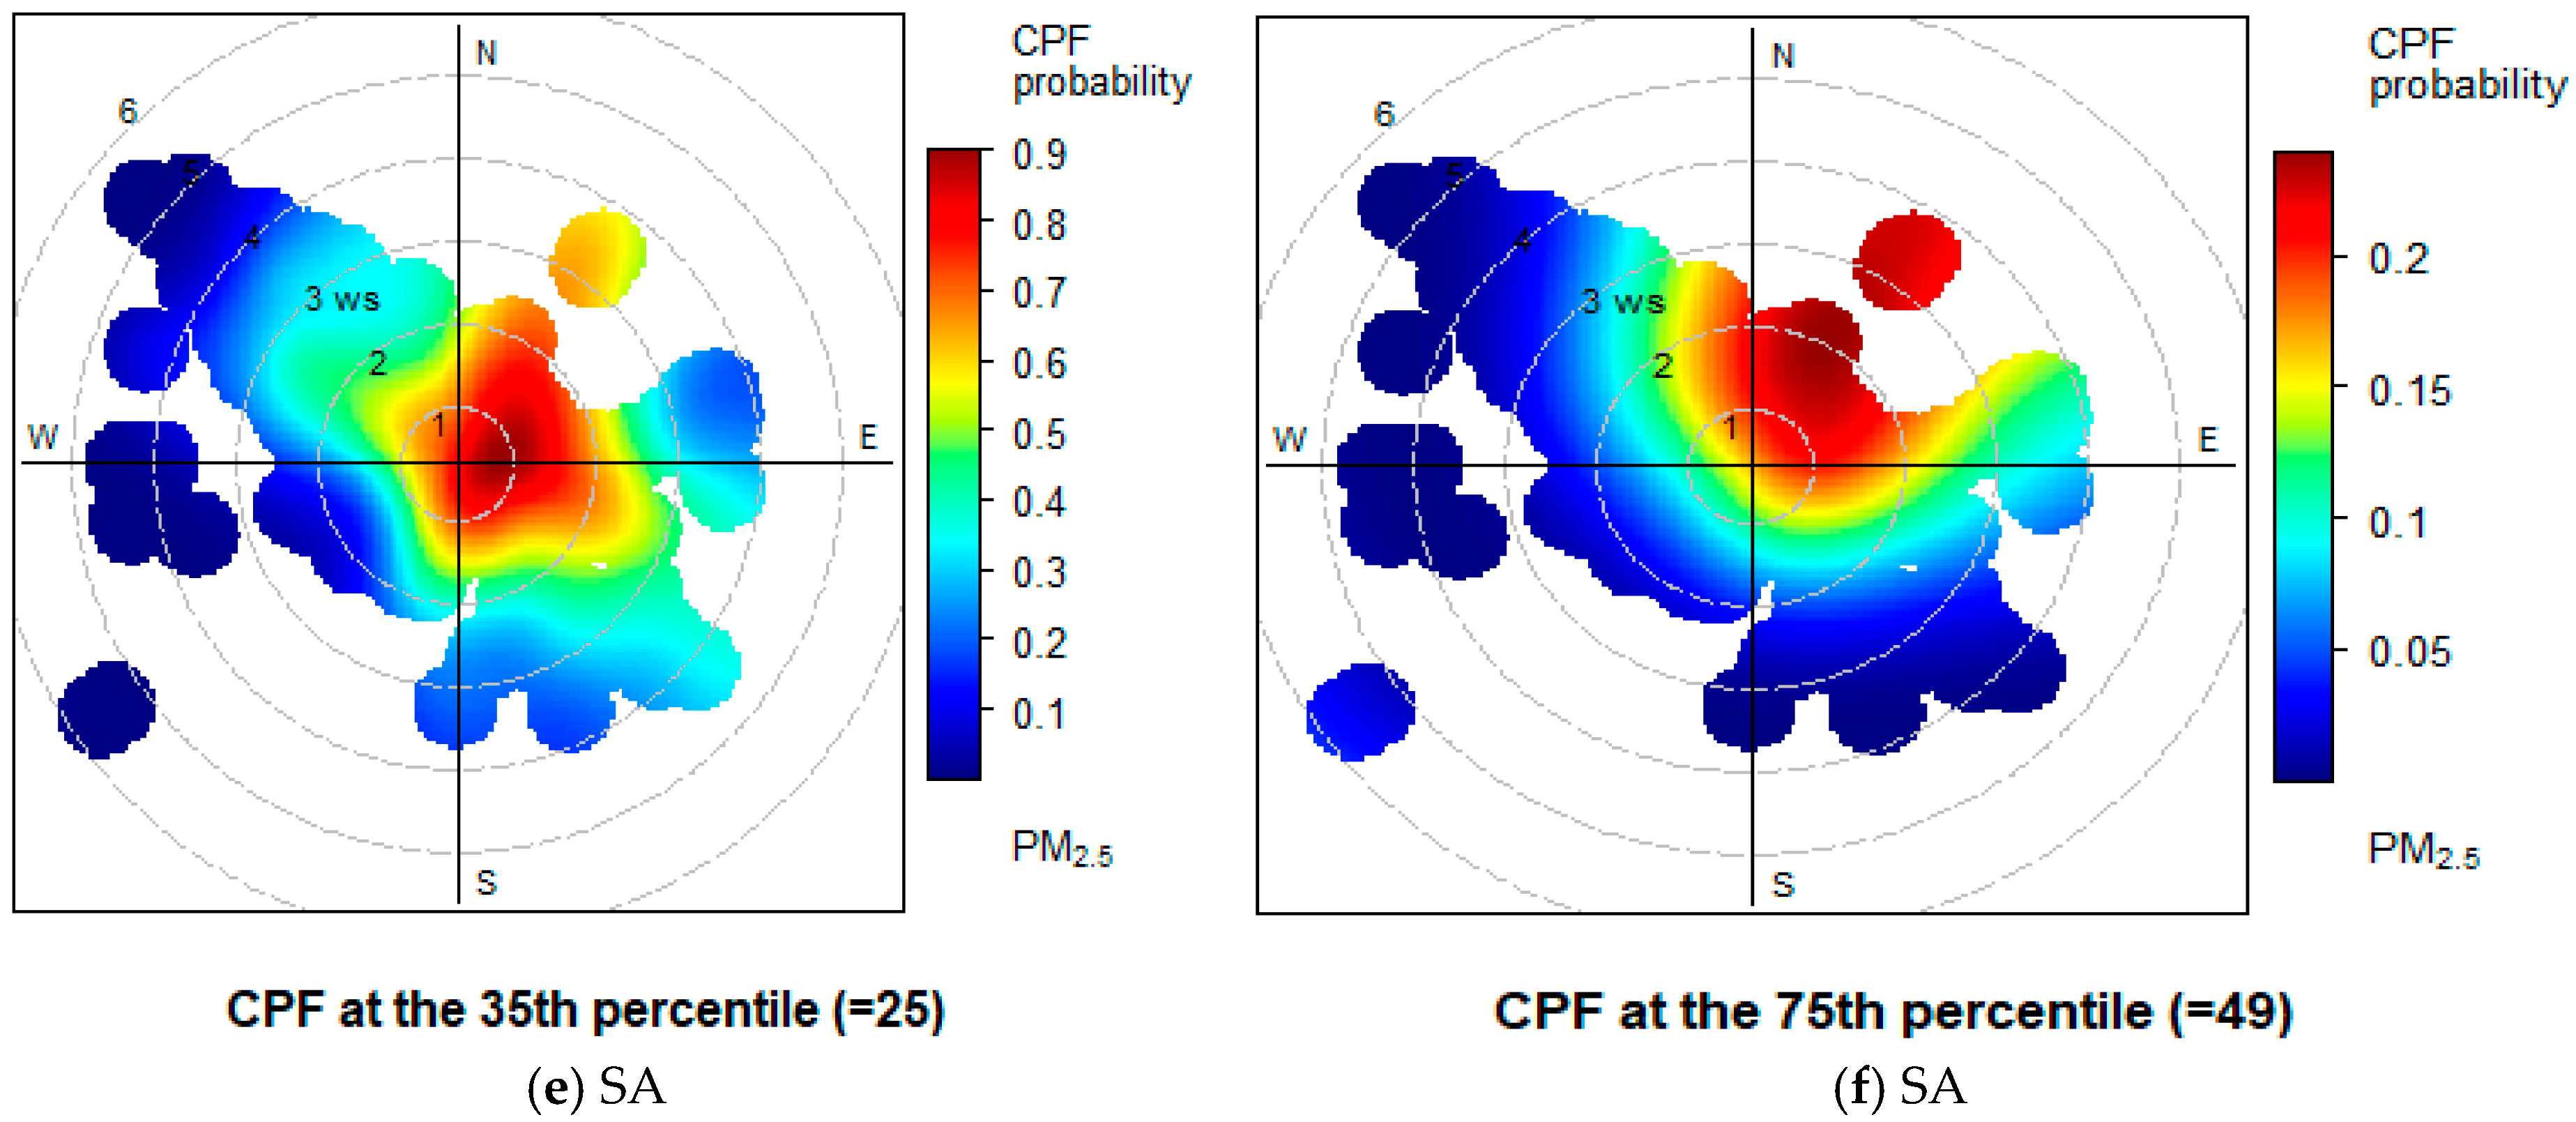
Possible local sources of pollution can be identified using CBPF plots. Since in this section, we are interested in analysing contributions from local sources, data collected during dust storm conditions has been removed before calculating the CBPFs. Figure 5a,c,e shows the CBPF plots of PM2.5 concentrations at the WZ, AS, and SA sites for concentrations > the daily ambient Iraqi standards (=25 µg/m3). At the same time, the 75th percentile is chosen as the criterion value in Figure 5b,d,f at the WZ, AS, and SA sites. This criterion represents high concentrations, which may be of significant health concern, highlighting the dominant cause of peaks in PM2.5 [30].
The bivariate plot of the CBPF in Figure 5b reveals that the dominant PM2.5 sources coincide with calm wind speeds at the WZ region from northwest to southeast direction, suggesting local sources. Notably, the residential areas in the northwest and southeast, where private diesel generators are prevalent, could be the main contributors [69]. It has been observed that approximately 13,000 domestic diesel generators are owned and managed by Local Provincial Councils in Baghdad, which represent 18% of the total number of diesel generators in Iraq. These generators are distributed among residential and commercial areas [70]. Another potential local source to the southeast could be gasoline motor vehicles from the AL-Maghrib Street intersection. Although the available data only allows for informed estimation about the source of PM2.5 in the WZ area, local diesel generators and gasoline vehicular traffic are likely sources of this pollutant. This interpretation is consistent with the observed relationship between low wind speeds and high concentrations, indicating surface-level emissions, such as road traffic sources [71].
Fine particles in the AS region are highly likely to be transported mainly through south-westerly winds with calm to low wind speeds (0.5–1.5 ms−1), as seen in Figure 5d. The differences in peaks due to in wind speed differences might be attributed to local and distant sources. Local sources of northwest, west and southwest winds include motor vehicles and private diesel generators (i.e., traffic-congested commercial and residential areas). However, it could be argued that the hospital’s incinerator, located northwest of the monitoring station, is one of the primary sources of particulates, as shown in Figure 1c. Nevertheless, several hospital incinerators are located northeast of the monitoring station, which depicts a medium probability rate for PM2.5 pollutants compared to the west and southwest of the region. For the distant sources, the possible source could be the Dora refinery and the Dora thermal power plant.
The SA area demonstrates a higher probability of higher PM2.5 concentrations from the east to the north, particularly during low to moderate north-easterly wind speed periods (i.e., 1–4 ms−1), implying local and some distant sources, as shown in Figure 5f. The nearby sources consist of automobiles and private diesel generators. However, the plot’s characteristics indicate the existence of stationary pollution sources, with an increase in the probability rate of PM2.5 with wind speed. An observed increase in pollutant concentration with increasing wind speeds suggests the existence of a buoyant plume originating from a source, such as a chimney stack [72]. The Dora thermal power plant, AL-Jadriya diesel power station, Dora diesel power stations, and gas flaring from the Dora refinery are distinct possibilities for remote sources. The fine particulates from distant sources could be primary pollutants dispersed directly from the stack plume or, potentially, secondary aerosols that may have been produced through photochemical reactions or nucleation processes [73]. The formation of secondary aerosols could stem from high rates of contaminants such as non-methane hydrocarbons (NMHCs), SO2 or NOx, which could be generated mainly from fire burning or gasoline and diesel engines [74].
Thus, it is reasonable to conclude that gasoline- and diesel-fuelled motor vehicles and domestic diesel power generators are the primary sources for nearby air quality monitoring stations. While for distant sources, Dora thermal power plant, diesel power stations and fire burning, such as gas flaring from Dora, are the dominant primary sources.

3.2. Baghdad Countryside and Regional Sources of Fine Particulates

The local air quality in Baghdad could be subject to significant influence from regional sources and the transportation of air pollutants because of the presence of extreme dust storms and oil and gas industries in neighbouring regions [75,76]. Both weighted PSCF and CWT (WPSCF and WCWT) techniques were implemented to address this matter. Three-day backward trajectories arriving at the selected monitoring sites were calculated in 2019 using the HYSPLIT (NOAA) [51]. In this technique, the term “PM2.5 particles originating from natural sources such as dust or sandstorms” will denote dust particulates.

3.2.1. Identification of Rural and Regional Sources from WPSCF Analysis

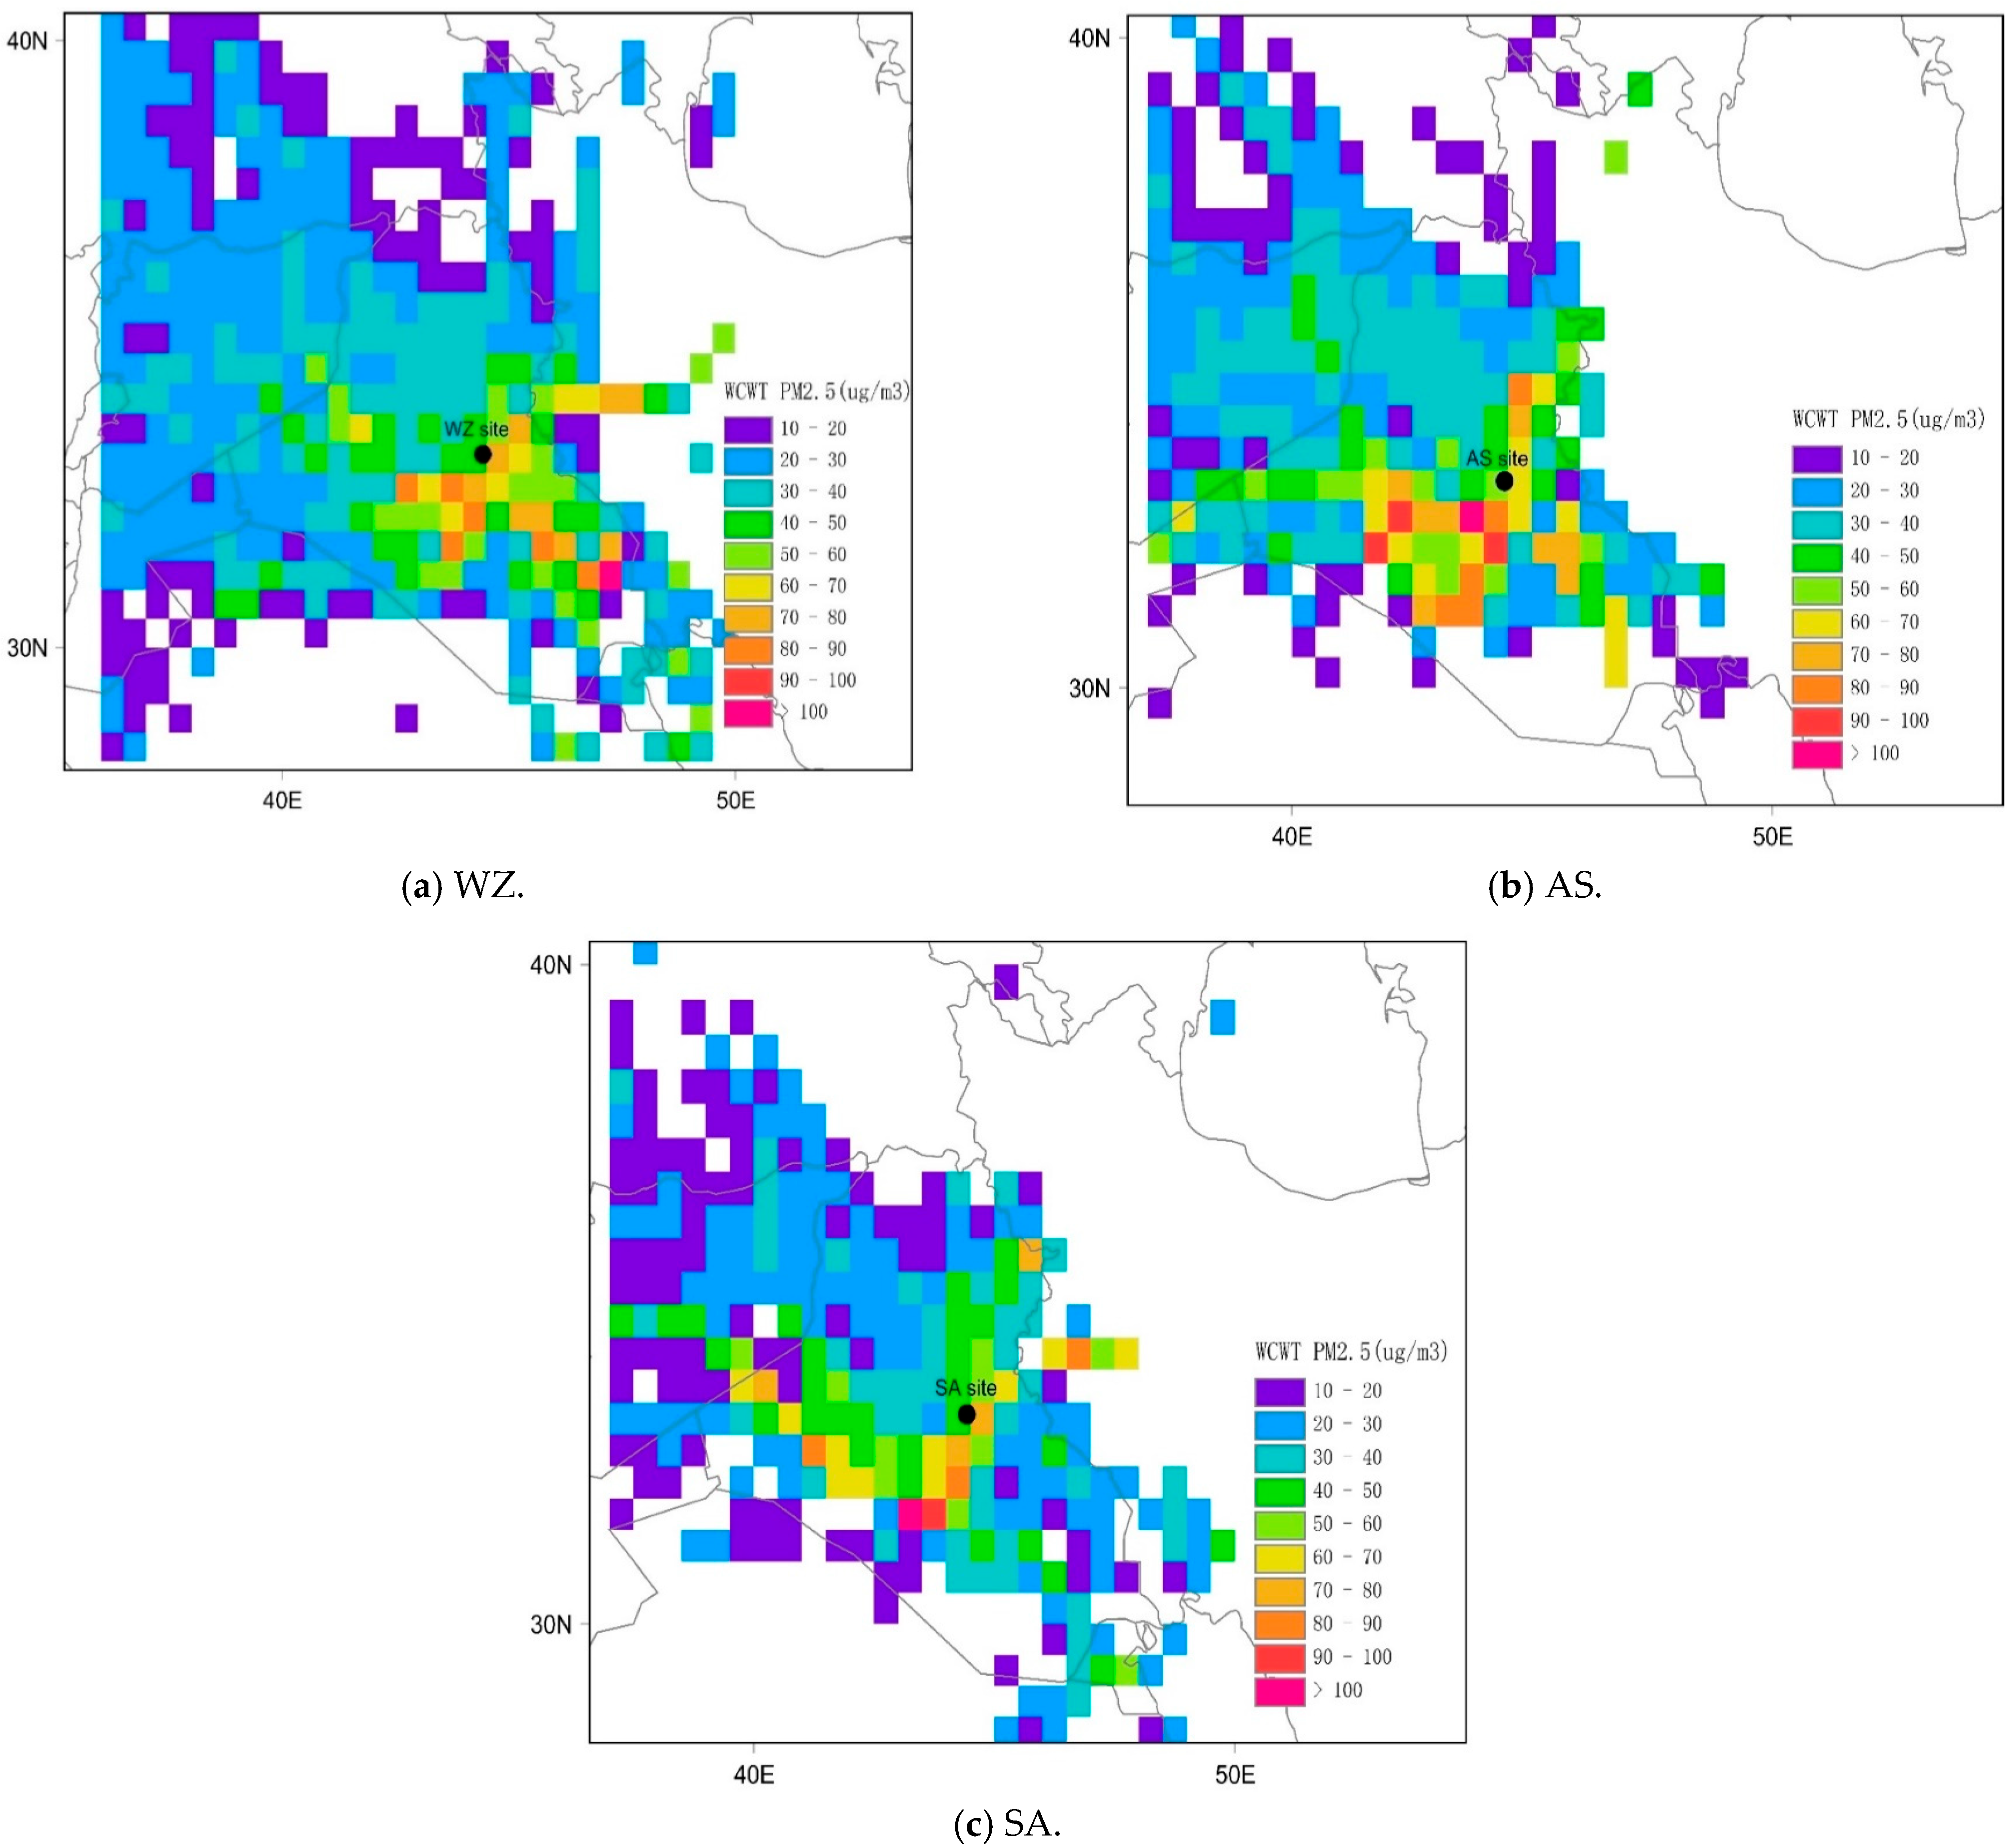
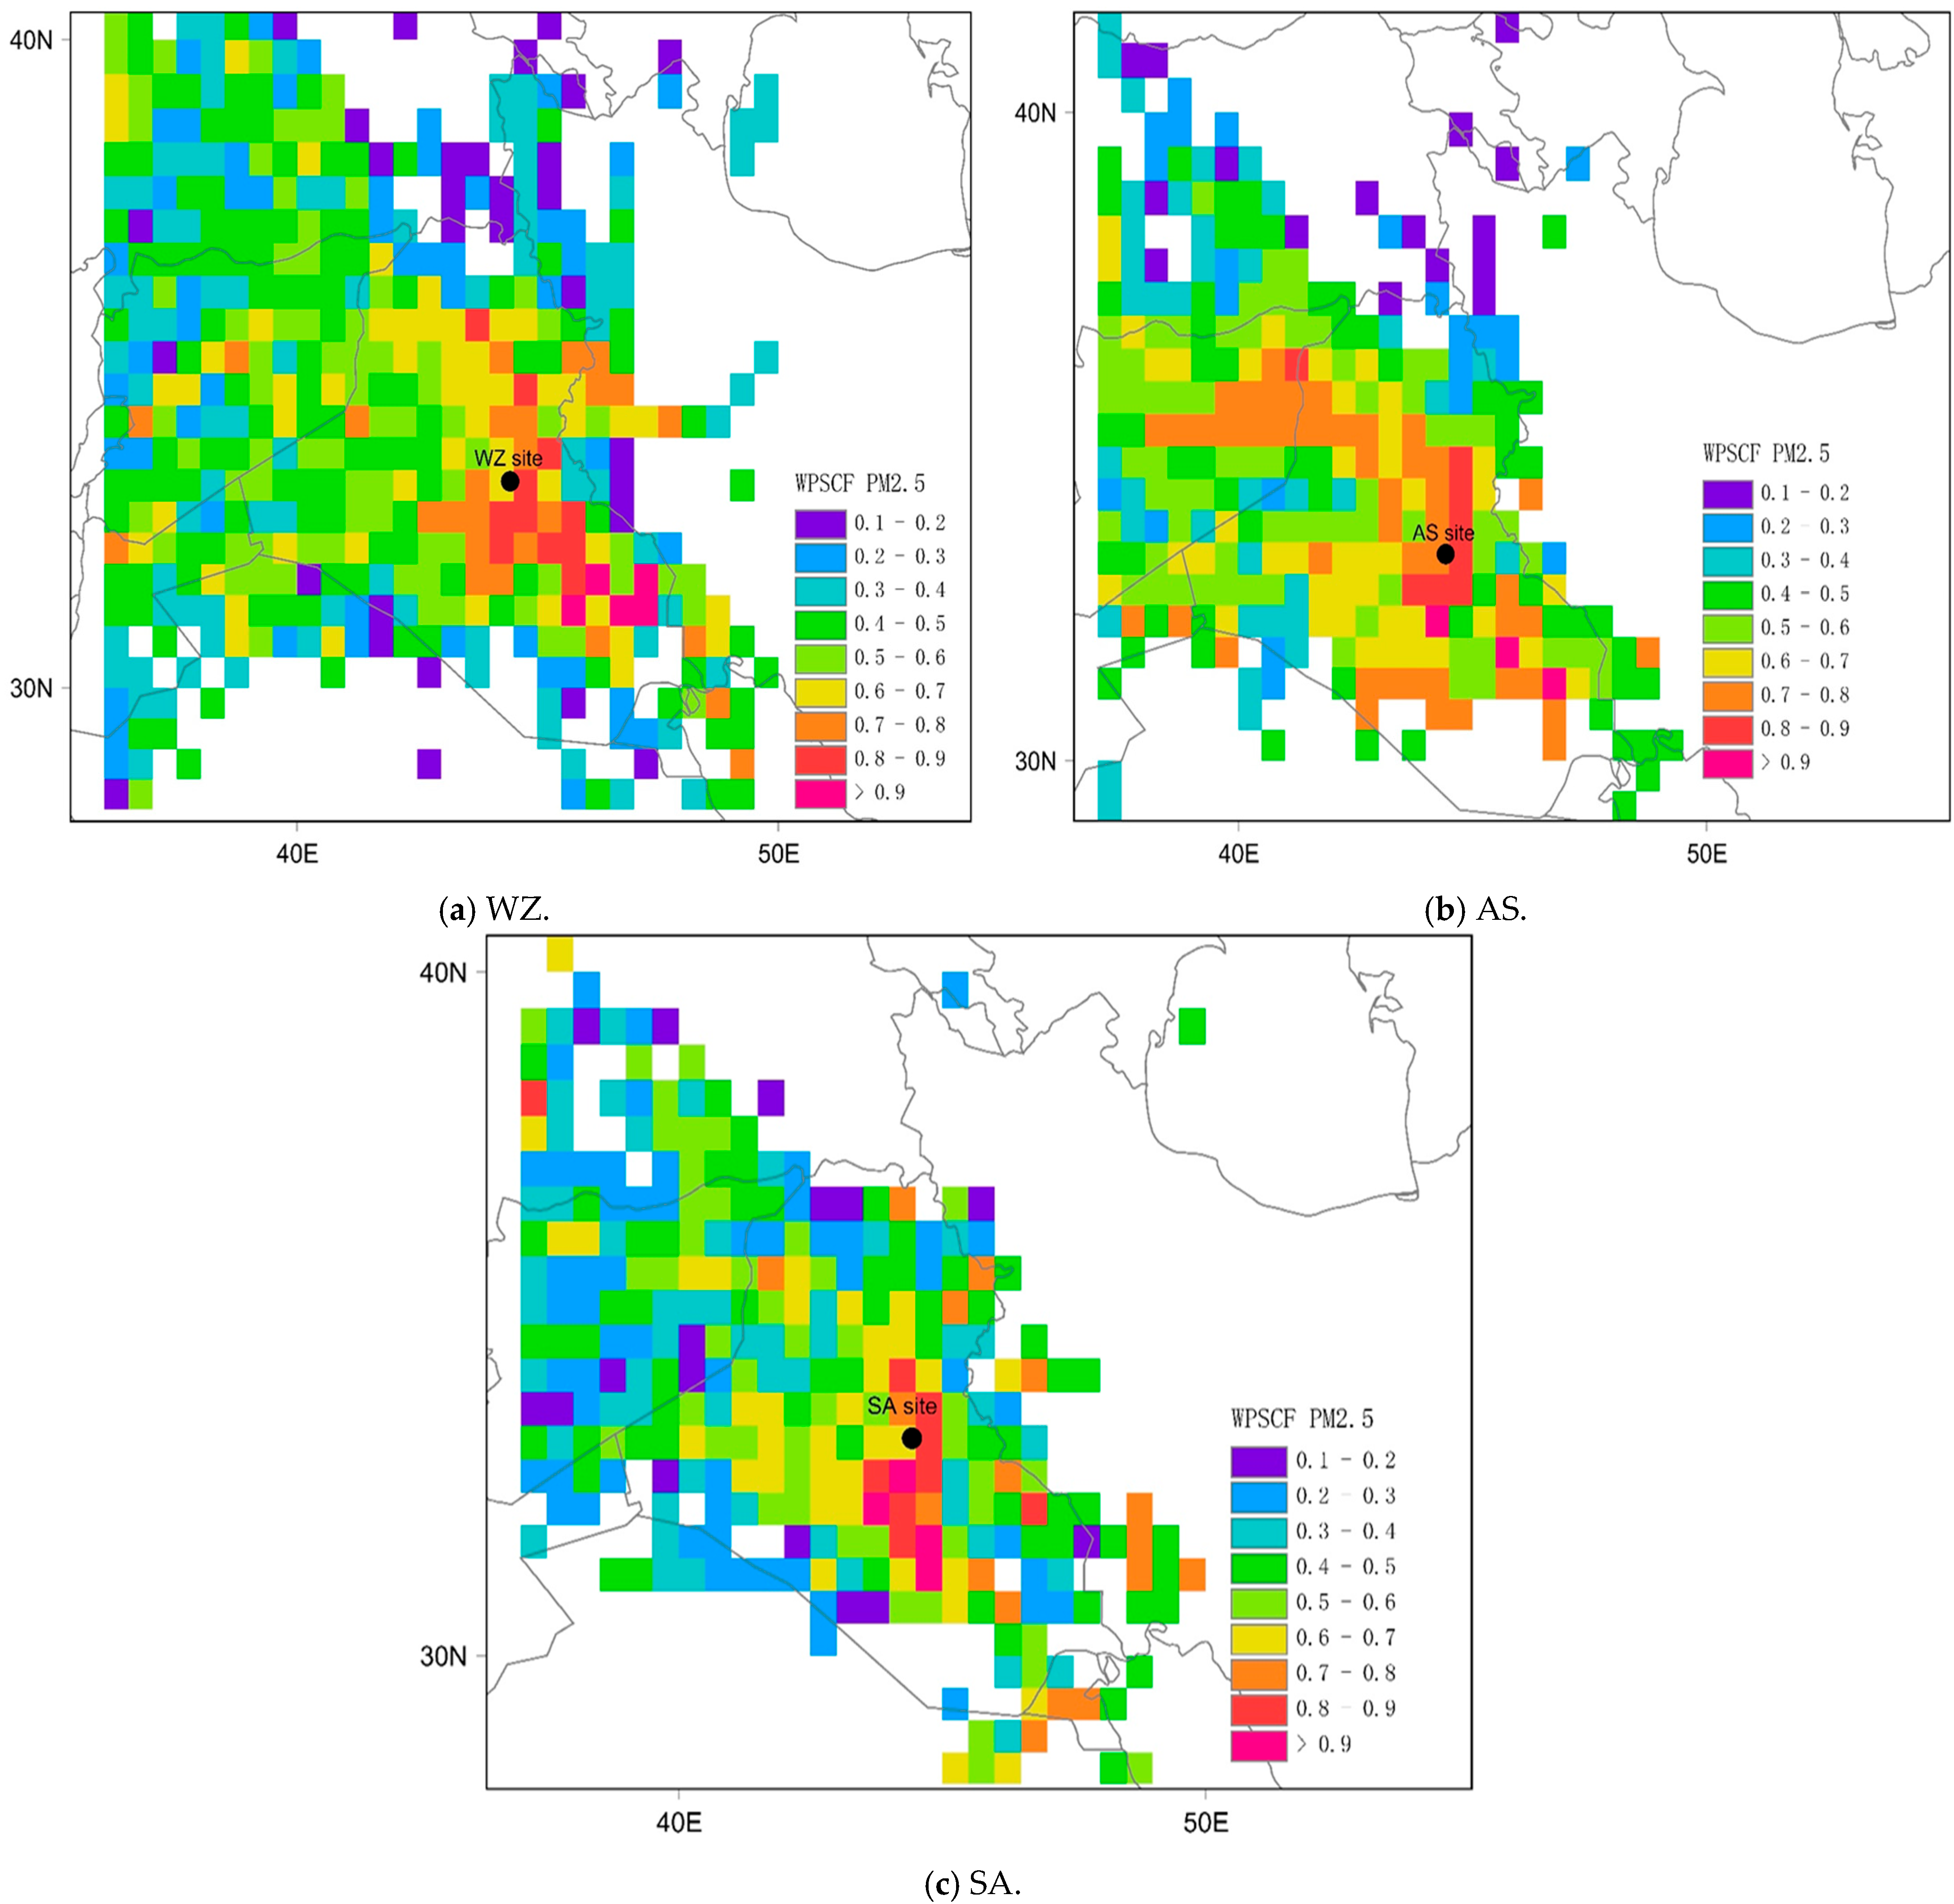
Figure 6 shows the WPSCF for WZ, AS and SA, respectively. Ideally, all stations at the same grid size scale encompass similar distant sources. Nevertheless, the hourly and daily measurements of the stations are inconsistent due to electricity shortages or security circumstances. There may also be differences under very low wind speed conditions. Consequently, the potential sources may differ across all three stations. WPSCF plots were calculated using the 25 µg/m3 of the source contribution, representing the ambient air quality standard as the criterion value.
The WPSCF plot for the WZ station reveals the highest probability function in the area immediately east to southeast of Baghdad. It extends to the southeast of Iraq, especially in Wasit, Misan and Basra governorates. The immediate east to southeast of Baghdad might relate to two main possible sources of fine particulates: brick factories in Nahrawan, the eastern rural area of Baghdad, and southeastern Baghdad oil fields. It has been found that the total suspended particulates in Nahrawan could exceed 2000 µg/m3 [77]. Using inferior black heavy oil with a high sulphur content of around 4% could be one of the main reasons for the high particulate pollutants in this area [78,79]. In addition, oil and gas extraction in the southeastern Baghdad oil fields could serve as another significant source of particulate matter, where gas flares could happen systematically.
The high probability function in the southeast of Iraq could be related to oil and gas production in the Alhdab oil field in Wasit, Halfaya oil in Misan governorate, and the AL-Qurna oil fields in the Basra governorate. Another potential PM2.5 source for the distant south-easterly air mass trajectories arriving at the WZ station is urban particulates. Two main areas lie in the south easterly passage: Amara and Kut, the main cities of Misan and Wasit governorates. It has been found that motor vehicles and private power generators could represent the primary sources of particulate pollution [80]. Moreover, the dryness of marshland in the southwest of Iraq has increased the dust particulates. These marshes have witnessed severe shrinkage during the last 50 years and have become one of the primary dust sources in the region [81]. The highest PSCF value of the fine particulate was found in the Chibaysh marshland with a 0.9 probability; similarly, Hwr-Aldmlj witnessed a high probability rate (0.8–0.9) for fine particulates.
Another potential region for distant fine particulates observed by the WZ station is nearest south of Baghdad, extending to the southwest of Iraq. The south of Baghdad could be referred to as the Al-Musayyab thermal power plant, which represents the third largest power plant in Iraq, or it may indicate the presence of the three primary urban cities, namely Karbala, Hilla, and Al-Najaf, where gasoline and diesel engines are recognised as significant sources of urban PM2.5 [82]. Apart from the gasoline and diesel engines at the AL-Najaf and Karbala, the Al-Kifl oil field and Karbala refinery are located in these governorates. Dust has also become a significant contributor to the accumulation of fine particulate matter in the southwestern region of Iraq. The probability rate exceeded 0.7 in certain regions, specifically in the remote areas of the AL-Anbar, AL-Najaf, and Karbala governorates. The rise in dust emissions in this region can be attributed to desertification and drought resulting from inadequate agricultural practices, mismanagement of water resources, and the effects of climate change [83].
An additional significant origin of WZ backward air mass transitions is in the nearest northeast of Baghdad, which could extend towards the far northwest. For the nearest northeast, the Baquba urban area is the Diyala governorate’s capital city. Urban particulates from gasoline and diesel engines could be this city’s primary pollution source. In addition to urban activities, the Mansuriya oil field could be another source for the nearest northeast passage. However, the path regarding the distant northeast trajectories could be related to the western region of Iran, specifically the Kermanshah and Irani Kurdistan areas. Research has documented scenarios of long-distance transportation events linked to emissions of sulphur dioxide that originate from Kermanshah city and extend to Tehran city, which serves as the capital of Iran [56]. A study conducted by Taleshi and colleagues has indicated that air parcel plumes containing PM2.5-bound polyaromatic hydrocarbon pollutants originating from Kermanshah and Kurdistan provinces and moving towards Tehran city exhibited a PSCF probability rate exceeding 0.6. It has been proposed that the emission of pollutant plumes in these areas could be primarily attributed to the combustion of coal and biomass, diesel and petrol exhaust emissions, and other emissions from diverse industrial sources [7].
The three-day northern backward trajectories reveal a high potential fine particulate probability function ranging between 0.7 and 0.9, predominantly within the governance boundaries of Kirkuk and Nineveh. These grid-scale regions could be substantially associated with Kirkuk oil fields and refineries. Backward trajectories from the northwest show a moderate to high probability function rate (0.5–0.8) encompassing the arid land of the Al-Jazeera desert and extending to the Iraq-Syrian border at Al-Qa’im city, and could expand to eastern Syria. Over the past three decades, an estimated 5000 square kilometres of land in these regions has experienced desertification. The acceleration of desertification in these areas can be attributed mainly to anthropogenic factors, including the expansion of agricultural activities, the implementation of infrastructure projects such as dam construction and the extensive civil war experienced in Syria [83]. The dust particulates in northwest Iraq and eastern parts of Syria have become one of the most active dust source regions in the Middle East [84].
The backward trajectories of AS from the northwest witness a considerable PSCF value ranging (from 0.7 to 0.9) compared with lower values for northwest air mass trajectories at WZ. The northwestern grid scale encompasses a vast region, especially the Al-Jazeera desert, which includes remote areas of the governorates of Nineveh, Al-Anbar, and Salah al-Din. In addition, it covers the eastern regions of Syria, including the governorates of Deir El-Ezzor, Al-Hasaka, Ar-Raqqa, and Homs. It is worth noting that this region has faced several challenges that could contribute to particulate pollution, such as conflict and war, industrial activities such as oil production, especially in Deir El-Ezzor and Al-Hasaka, and agricultural burning [85]. The immediate southwest, south, southeast, and east areas have a similar pattern of the weighted PSCF at the WZ station, with the highest probability rate of more than 0.9 at the Kifl oil field and Al-Najaf city, which could reflect the oil and gas production facilities and gasoline and diesel engines used in the main urban area of the Al-Najaf governorate. Furthermore, the highest probability number in this region could be related to the dust particulates from various wind directions, especially from the southwest of remote areas in the Al-Najaf and Al-Anbar governorates. The AS northeastern and southeastern air mass plumes probably exhibit characteristics comparable to the WZ air mass trajectories, indicating a similarity in the possible origins of fine particulate matter. The study reveals supplementary origins of particulate matter in the marshland regions, including the Hammar Marshes, with a likelihood ranging from 0.7 to 0.9. The wetland regions comprising marshlands and lakes have been identified as the primary origins of dust particulate matter, which can be linked to the prolonged and severe drought conditions that have continued over the past 50 years [83]. Another potential source of fine particulates in the wetland areas, which record a probability rate of 0.8, is Razzaza Lake in the southeast backward air mass plumes for the WZ, AS, and SA combined.
The weighted PSCF for three-day backward trajectories arriving at the SA monitoring station may reveal the same pollution sources as the WZ and AS region, with the highest PSCF appearing immediately to the southwest, south, southeast, east, and northeast of Baghdad. Additionally, the PSCF examination of SA highlights the impact of regional sources, including the Khuzestan Province in the southwest of Iran, Kuwait, and the Arabian Gulf. The mentioned areas possess a thoroughly documented oil and gas extraction operation [56]. Previous studies have shown that the combustion of heavy oil, mainly from refineries and marine shipping, as well as biogenic emissions such as wood combustion and soil dust, are significant factors contributing to the levels of PM2.5 [56,86,87]. Studies have indicated that the PSCF does not distinguish between moderate and significant sources. Therefore, the concentration-weighted trajectory has been adopted for further investigation.

3.2.2. The Concentration Weighted Trajectory Analysis (CWT)

The CWT concentration gradients, which represent average PM2.5 concentrations associated with trajectories coming from specific directions, suggest that the southeastern region of Iraq, encompassing the Basrah and Misan governorates, could be a noteworthy origin for air pollution transport that impacts measured PM2.5 concentrations at the WZ monitoring station, as shown in Figure 7. An analysis of the governorates revealed that the western Qurna oil field’s grid-scaled region exhibited a high concentration of pollutants, surpassing 100 µg/m3. Other potential sources in the surrounding area comprise the Chibaysh marshland and the urban particulate matter arising from Amara. The secondary significant contributors to the long-distance transport of particulate matter to the WZ station are located to Baghdad’s immediate east and southeast, as well as to the south and southwest. Industrial facilities like the Kufa cement plant, the Nahrawan brick manufacturing units, and power plants, particularly the Al-Musayyab thermal power station, have been identified as potential sources within these grid scales. Urban particulates originating from cities such as Najaf, Karbala, and Hillah are believed to contribute significantly. The information obtained from 72 backward trajectory air plume analyses conducted within the WZ area is consistent with the results derived from the PSCF analysis. This comprehensive approach provides an understanding of the spatial distribution and potential sources of air pollutants.
Similarly, the CWT results at the AS monitoring station show the same findings as the WZ station, revealing the same possible sources for fine particulates. However, Baghdad’s nearby southern and southwest regions appear to be the most probable sources of PM2.5. These results can be ascribed to anthropogenic sources such as the Hindiya cement factory, the Nahrawan brick manufacturing facilities, and the Al-Musayyab power plants, which collectively account for the 90th percentile of concentration measurements exceeding 80 µg/m3. Another possible primary source to the southwest of Baghdad is the particulate dust in the remote areas of Al-Anbar and Al-Najaf governorates and the Razzaza Lake. The southeast and northeast of Iraq could be considered a moderate source for air plumes arriving at the AS monitoring station. It could be linked to the oil and gas production in Basrah, Kut, the southeast of Baghdad, and Diyala governorate. These moderate sources also include marshland dust particulates from southeast Iraq.
In contrast to the PSCF results, the CWT results demonstrate a relatively reduced weighted concentration in the region encompassing Syria’s northwest and eastern parts, where dust particulates represent the principal source of pollutants [83]. The findings suggest that anthropogenic particulates, rather than natural sources, primarily influence the air mass plume reaching the AS monitoring station.
The three-day backward trajectories arriving at the SA monitoring site were comparable with both WZ and AS regarding possible sources from the immediate east, south, and southwest. These sources may include urban particulates, thermal power plants, biomass and open burning, and dust particulates. However, air mass plumes at SA and WZ monitoring sites reveal the same regional source from the east of Iraq. Specifically, an external source in the Kermanshah province of Iran exhibits a concentration gradient exceeding 70 µg/m3. Based on the World Health Organisation report, Kermanshah, located in Iran, is among the top three cities with the highest pollution levels. The primary contributors to environmental contamination in Kermanshah are the petrochemical sector, power generation facilities, and cement manufacturing plants [88,89].

3.3. Conclusions

The study combined three approaches commonly used for PM2.5 source apportionment within hybrid receptor modelling, utilising hourly PM2.5 and CO monitored concentrations from three sites in Baghdad. The CBPF and concentration ratio were used to identify local sources of pollutants in metropolitan Baghdad, while the PSCF and CWT methods were utilised for studying potential long-distance and regional sources.
The apportionment of local sources of fine particulates has been conducted using three distinct approaches via polar plots, concentration ratio and CBPF for dust particulate assessment, fire burning particulate assessment, and urban particulate assessment. Several common patterns and potential pollution sources appear across the three phases. Excluding dust sources, CBPF and PM2.5/CO analysis revealed that high concentrations of pollutants at the studied monitoring sites in Baghdad were commonly found under low wind speed conditions, indicating local sources of emissions such as gasoline- and diesel-powered motor vehicles, residential diesel power generators, and local thermal power plants. The use and gas flaring of low-grade, high-sulphur fuels from all these source types has a significant influence on PM2.5 concentrations, which regularly exceed local air quality standards with likely impacts on population health. The principal sources for more distant locations were revealed to be fire burning, gas flaring, open waste burning, and thermal power plants. The PSCF and CWT results showed that the increased level of PM2.5 could be caused by different sources involving the use of low-quality heavy fuel oil in combustion.
These sources’ possible directions are as follows:
  • The immediate east-to-southeast and south-to-southwest of Baghdad, which revealed the nearest distant sources around Baghdad. The possible sources are brick factories in Nahrawan, the southeastern Baghdad oil fields, the thermal power plant in Al-Musayyab, and other metropolitan cities like Al-Najaf, Karbala, and Hilla, where gasoline and diesel engines contribute to PM2.5 formation.
  • The southeast of Iraq. The potential sources are oil and gas production in the Alhdab oil field in Wasit, Halfaya oil fields in Misan governorate, and the West Qurna oil field in Basra governorate. Another possible source is dust particulates from marshlands.
  • The northeast of Baghdad extending to the Kermanshah Province in the western region of Iran, where gasoline and diesel engines, oil and gas production, and coal/biomass combustion are possible sources.
Increasing desertification in the surrounding regions due to changes in climate is also leading to substantial dust resuspension and a strong influence of dusty days on measured PM2.5 concentrations in Baghdad. However, the CWT findings confirmed the PSCF results and demonstrated that anthropogenic particulates have a higher contribution than natural sources to PM2.5 concentrations. The improvement of air quality in Baghdad will require reductions in emissions, which predominantly derive from the combustion of low-grade fuels either through enhanced control of exhaust emissions or through improvements in fuel quality. The work particularly highlights the importance of exhaust after-treatment systems (EATSs) for internal combustion engines, particularly diesel engines, which are flexible enough to cope with a wide range of fuels, including those with high sulphur content. This aligns with ongoing and future work by the authors in the development of effective EATS for various fuels, which will be vital for mitigating combustion emissions in regions where low-grade fuels are being used.

3.4. Limitations of the Study

This study focused on identifying the PM2.5 sources in Baghdad, Iraq, using a multi-stage statistical approach. Although the research offers valuable insights into the origins of PM2.5, it is important to mention certain limitations. Nevertheless, this method provides several benefits, especially in less developed areas where there may be limitations on data and resources.
  • Data Quality and Completeness
A significant disadvantage of this study is the reliability and completeness of the data collected. Because of the frequent power cuts and security circumstances, the air quality monitoring stations were only running during official working hours in 2019, which led to incomplete data records. Nevertheless, this approach shows the ability to adapt in circumstances where data is lacking, enabling the gathering of useful information despite the limited availability of data. The study highlights the possibility of performing efficient air quality analysis in areas that face comparable difficulties in air quality management.
2.
Variations in Sampling Dates
The study encountered difficulties because the sampling dates differed among the three monitoring sites in Baghdad. The presence of this inconsistency could potentially introduce biases in the analysis of source apportionment. The method’s flexibility enables effective analysis despite temporal variations, making it particularly valuable in developing regions where consistent data collection poses difficulties.
3.
Lack of Emission Inventory Data
Due to a lack of emission data in Iraq, the application of conventional receptor modelling methods experiences challenges. Nevertheless, the technique’s capacity to offer valuable information even in the absence of comprehensive emission data demonstrates its potential as a novel approach to air quality management in data-limited regions.
4.
Limited Use of Pollutants
The study examined multiple pollutants, but the main focus of the analysis was on PM2.5 and CO. The insufficient information on additional pollutants for some of the AQMS, e.g., the lack of NOx concentration data at the WZ station, hinders the thoroughness of the source identification process. Nevertheless, the technique’s emphasis on key pollutants highlights its effectiveness in identifying major sources even with limited pollutant data, which makes it a practical approach for developing countries that have limited analytical capabilities.
5.
Methodological Redundancy
The study utilised multi-stage statistical methods to identify the origins of PM2.5, resulting in consistent findings. Although this technique may seem repetitive, it actually highlights the robustness of our approach. The consistency observed in our approach serves as a validation for the obtained results. This type of validation is especially valuable in regions with limited air quality studies, particularly in developing areas, as it establishes a strong basis for policy decisions and future research.
6.
Novelty and Implications
It could be argued that this multi-stage statistical approach lacks novelty. However, this study introduces a novel approach to air quality management in areas with scarce data, highlighting its flexibility. It offers a framework for developing effective strategies in other regions that are dealing with similar challenges, such as limited data availability, resource constraints, and complex urban environments. The findings provide a solid basis for future research and policy efforts focused on enhancing air quality in developing regions.

Supplementary Materials

The following supporting information can be downloaded at: https://www.mdpi.com/article/10.3390/atmos17050455/s1. Table S1. Technical specification of the monitoring stations’ instruments. Figure S1. (a) BPP plot for PM2.5/CO ratio at the AS (b) BPP plot for PM2.5 at the AS. However, the radial scale displays the relative humidity (%) instead of wind speed, which increases from the centre of the plot radially outwards for both plots (c) BPP plot for SO2 at the AS with the ordinary radial scale, which shows the wind speed in ms−1. Figure S2. The possible fire map in 2019 when the highest concentration of PM2.5 was measured at (a) WZ on 21 October 2019, (b) AS on 16 February 2019, and (c) SA on 15 December 2019. The square red symbol shows the possible fire map site, and the red oval with a black dot symbol shows the monitoring station. Figure S3. Temporal distribution of PM2.5 concentrations at three sites on the days of maximum concentrations being observed.

Author Contributions

Methodology, O.S.N.; Software, O.S.N.; Validation, O.S.N.; Formal analysis, O.S.N.; Data curation, O.S.N.; Writing – original draft, O.S.N.; Writing – review & editing, O.S.N., H.L. and A.S.T.; Visualization, O.S.N. and A.S.T.; Supervision, A.S.T. and H.L. All authors have read and agreed to the published version of the manuscript.

Funding

This study received funding from the Higher Committee for Education Development in Iraq, supporting the work of O.S.N. The authors would also like to thank the UKRI STFC grant ST/Z51035X/1 for supporting this work by providing facilities to obtain emission factors. APC charges were supported via the University of Leeds UKRI block grant.

Institutional Review Board Statement

Not applicable.

Informed Consent Statement

Not applicable.

Data Availability Statement

The original contributions presented in this study are included in the article/Supplementary Material. Further inquiries can be directed to the corresponding authors.

Acknowledgments

The authors express their gratitude to Ali Jaber, the head of the Air Quality and Noise Monitoring Department at the Ministry of Iraqi Environment, for supplying the raw air quality data covering Baghdad in 2019. The authors express their gratitude to Yaqiang Wang, the creator of TrajStat software, and Jack Davison, a consultant at Ricardo Energy & Environment, for their technical assistance in utilising the TrajStat software and the Openair package, essential tools in the analysis of air pollution data for this paper. This manuscript was revised using Grammarly to enhance readability and language comprehension. While Grammarly was used as a tool to improve the clarity and conciseness of the writing, the authors assume full responsibility for the content and accuracy of the manuscript.

Conflicts of Interest

The authors declare that they have no financial or personal conflicts of interest that could have influenced the findings of this study.

Abbreviations

The following abbreviations are used in this manuscript:
PM2.5Fine Particulate Matter
WZAl-Wazeriya
ASAl-Andalus Square
SAAl-Saiydiya
CBPFConditional Bivariate Probability Function
PSCFPotential Source Contribution Function
CWTConcentration Trajectory Function
WHOWorld Health Organisation
BPPsBivariate Polar Plots
CRsConcentration ratios

References

  1. World Health Organization (WHO). Ambient Air Pollution: A Global Assessment of Exposure and Burden of Disease; WHO: Geneva, Switzerland, 2016. [Google Scholar]
  2. Boogaard, H.; Patton, A.; Atkinson, R.; Brook, J.; Chang, H.; Crouse, D.; Fussell, J.; Hoek, G.; Hoffmann, B.; Kappeler, R.; et al. Long-term exposure to traffic-related air pollution and selected health outcomes: A systematic review and meta-analysis. Environ. Int. 2022, 164, 107262. [Google Scholar] [CrossRef]
  3. Hamanaka, R.B.; Mutlu, G.M. Particulate Matter Air Pollution: Effects on the Cardiovascular System. Front. Endocrinol. 2018, 9, 680. [Google Scholar] [CrossRef]
  4. Almetwally, A.A.; Bin-Jumah, M.; Allam, A.A. Ambient air pollution and its influence on human health and welfare: An overview. Environ. Sci. Pollut. Res. 2020, 27, 24815–24830. [Google Scholar] [CrossRef]
  5. Xue, Y.; Wang, L.; Zhang, Y.; Zhao, Y.; Liu, Y. Air pollution: A culprit of lung cancer. J. Hazard. Mater. 2022, 434, 128937. [Google Scholar] [CrossRef]
  6. Hamad, S.H.; Shafer, M.M.; Kadhim, A.K.; Al-Omran, S.M.; Schauer, J.J. Seasonal trends in the composition and ROS activity of fine particulate matter in Baghdad, Iraq. Atmos. Environ. 2015, 100, 102–110. [Google Scholar] [CrossRef]
  7. Ali-Taleshi, M.S.; Moeinaddini, M.; Bakhtiari, A.R.; Feiznia, S.; Squizzato, S.; Bourliva, A. A one-year monitoring of spatiotemporal variations of PM2.5-bound PAHs in Tehran, Iran: Source apportionment, local and regional sources origins and source-specific cancer risk assessment. Environ. Pollut. 2021, 274, 115883. [Google Scholar] [CrossRef] [PubMed]
  8. Klingmüller, K.; Pozzer, A.; Metzger, S.; Stenchikov, G.L.; Lelieveld, J. Aerosol optical depth trend over the Middle East. Atmos. Meas. Tech. 2016, 16, 5063–5073. [Google Scholar] [CrossRef]
  9. Rabee, A.M. Estimating the health risks associated with air pollution in Baghdad City, Iraq. Environ. Monit. Assess. 2015, 187, 4203. [Google Scholar] [CrossRef]
  10. Yassein, B.R.; Chaichan, M.T.; Yaseen, B.R.; Al Asaady, K.A.; Kazem, A.A.; Chaichan, M.T. Environmental Impacts of Salt Tide in Shatt Al-Arab-Basra/Iraq. IOSR J. Environ. Sci. Toxicol. Food Technol. 2016, 10, 35–43. [Google Scholar] [CrossRef]
  11. International Energy Agency. Iraq Energy Outlook; International Energy Agency: Paris, France, 2012; pp. 1–142. [Google Scholar]
  12. Kazem, H.A.; Chaichan, M.T. Status and future prospects of renewable energy in Iraq. Renew. Sustain. Energy Rev. 2012, 16, 6007–6012. [Google Scholar] [CrossRef]
  13. Saleh, S.A.H.; Mohamed, G.H.; Mohamed, Z.B. Air Quality Index (AQI) for Kirkuk City. Kirkuk Univ. J.—Sci. Stud. 2016, 11, 185–201. [Google Scholar] [CrossRef]
  14. Rasheed, K.A.; Azeez, Z.A.; Al-salhy, A.A. Effects of Air Pollutants from Al-Dura Power plant in the Surrounding Area South Baghdad. J. Int. Environ. Appl. Sci. 2016, 11, 170–175. [Google Scholar]
  15. Al-Azzawi, M.N.A.; Al-Dulaimi, S.H.H. Measuring the concentration of Suspended Particulate Matter and some heavy metals in air of two areas of Rusafa in Baghdad. Iraqi J. Sci. 2015, 56, 361–366. [Google Scholar]
  16. Mohammed, Z.B.; Kamal, A.A.K.; Resheq, A.S.; Alabdraba, W.M.S. Assessment of Air Pollution over Baghdad City Using Fixed Annual Stations and GIS Techniques. J. Southwest Jiaotong Univ. 2019, 54, 1–12. [Google Scholar] [CrossRef]
  17. SCO Iraq. Iraq Population Estimates 2020. 2020. Available online: https://cosit.gov.iq/documents/population/projection/%D8%AA%D9%82%D8%AF%D9%8A%D8%B1%D8%A7%D8%AA%20%D8%B3%D9%83%D8%A7%D9%86%20%D8%A7%D9%84%D8%B9%D8%B1%D8%A7%D9%82%202020.pdf (accessed on 6 January 2024).
  18. Ministry of Iraqi Environment. Environmental Status for Ambient Air Quality 2019. 2020. Available online: https://moen.gov.iq (accessed on 5 December 2023).
  19. Althuwaynee, O.F.; Pokharel, B.; Aydda, A.; Balogun, A.-L.; Kim, S.-W.; Park, H.-J. Spatial identification and temporal prediction of air pollution sources using conditional bivariate probability function and time series signature. J. Expo. Sci. Environ. Epidemiol. 2021, 31, 709–726. [Google Scholar] [CrossRef] [PubMed]
  20. Feng, X.; Wang, S. Influence of different weather events on concentrations of particulate matter with different sizes in Lanzhou, China. J. Environ. Sci. 2012, 24, 665–674. [Google Scholar] [CrossRef]
  21. Uria-Tellaetxe, I.; Carslaw, D.C. Conditional bivariate probability function for source identification. Environ. Model. Softw. 2014, 59, 1–9. [Google Scholar] [CrossRef]
  22. Al-Salihi, A.M. Characterization of aerosol type based on aerosol optical properties over Baghdad, Iraq. Arab. J. Geosci. 2018, 11, 633. [Google Scholar] [CrossRef]
  23. Ministry of Iraqi Environment; UNEP. Environmental Status Outlook in Iraq (2013). 2013. Available online: https://iq.chm-cbd.net/outlook-report-environment-status-iraq-2013-only-available-arabic (accessed on 14 November 2022).
  24. Carslaw, D.C. Package ‘Openair’. Tools for the Analysis of Air Pollution Data. Available online: https://cran.r-project.org/web/packages/openair/openair.pdf (accessed on 10 October 2022).
  25. Salmon, O.E.; Shepson, P.B.; Ren, X.; He, H.; Hall, D.L.; Dickerson, R.R.; Stirm, B.H.; Brown, S.S.; Fibiger, D.L.; McDuffie, E.E.; et al. Top-Down Estimates of NOx and CO Emissions from Washington, D.C.-Baltimore During the WINTER Campaign. J. Geophys. Res. Atmos. 2018, 123, 7705–7724. [Google Scholar] [CrossRef]
  26. Jaffe, D.A.; Schnieder, B.; Inouye, D. Technical note: Use of PM2.5 to CO ratio as an indicator of wildfire smoke in urban areas. Atmos. Meas. Tech. 2022, 22, 12695–12704. [Google Scholar] [CrossRef]
  27. Laing, J.R.; Jaffe, D.A.; Slavens, A.P.; Li, W.; Wang, W. Can ΔPM2.5/ΔCO and ΔNOy/ΔCO Enhancement Ratios Be Used to Characterize the Influence of Wildfire Smoke in Urban Areas? Aerosol Air Qual. Res. 2017, 17, 2413–2423. [Google Scholar] [CrossRef]
  28. Jaffe, D.A.; O’Neill, S.M.; Larkin, N.K.; Holder, A.L.; Peterson, D.L.; Halofsky, J.E.; Rappold, A.G. Wildfire and prescribed burning impacts on air quality in the United States. J. Air Waste Manag. Assoc. 2021, 70, 583–615. [Google Scholar] [CrossRef]
  29. Ashbaugh, L.L.; Malm, W.C.; Sadeh, W.Z. A residence time probability analysis of sulfur concentrations at Grand Canyon National Park. Atmos. Environ. 1985, 19, 1263–1270. [Google Scholar] [CrossRef]
  30. Malby, A.R.; Whyatt, J.D.; Timmis, R.J. Conditional extraction of air-pollutant source signals from air-quality monitoring. Atmos. Environ. 2013, 74, 112–122. [Google Scholar] [CrossRef]
  31. Bae, M.-S.; Schwab, J.J.; Chen, W.-N.; Lin, C.-Y.; Rattigan, O.V.; Demerjian, K.L. Identifying pollutant source directions using multiple analysis methods at a rural location in New York. Atmos. Environ. 2011, 45, 2531–2540. [Google Scholar] [CrossRef]
  32. Al-Ansari, N.A. Management of Water Resources in Iraq: Perspectives and Prognoses. Engineering 2013, 5, 667–684. [Google Scholar] [CrossRef]
  33. Hashim, B.M.; Sultan, M.A. Using remote sensing data and GIS to evaluate air pollution and their relationship with land cover and land use in Baghdad City. Limaye Iran. J. Earth Sci. 2010, 2, 20–24. [Google Scholar]
  34. The Climate Center. Iraq Sees More Than One Heavy Sandstorm a Week—Red Cross Red Crescent Climate Centre. Available online: https://www.climatecentre.org/8535/iraq-sees-more-than-one-heavy-sandstorm-a-week/ (accessed on 7 October 2023).
  35. United Nations. Sand and Dust Storms—Fact Sheet. 2013, p. 7. Available online: https://reliefweb.int/sites/reliefweb.int/files/resources/SDS%20Fact%20Sheet.pdf (accessed on 5 October 2023).
  36. Al-Shammari, S. Air Pollution in the City of Baghdad (Al-Rusafa) after 2003 AD: Causes and Solutions. J. Tikrit Univ. Humanit. 2022, 26, 281–300. (In Arabic) [Google Scholar] [CrossRef]
  37. Hassan, A.W.A.A.; Al-Waeli, A.A.K. The spatial and temporal variation of the concentration of gaseous pollutants in the air of Al-Waziriya region. Res. Mil. 2022, 12, 4471–4481. [Google Scholar]
  38. Al-Sudani, I.M.; Altmimi, A.; Al-Khayat, A.S.I.; Al-Waeli, A.J. Air pollution increase susceptibility of Baghdad (Iraq) population to COVID-19: Al-Zafarania distract case study. Int. J. Pharm. Res. 2020, 12, 1775–1782. [Google Scholar] [CrossRef]
  39. Jrew, B.; Hadi, A. Improvement of Multi-Lane Airport Highway in Baghdad-Iraq. IOP Conf. Ser. Mater. Sci. Eng. 2019, 584, 012012. [Google Scholar] [CrossRef]
  40. Chaichan, M.T.; Kazem, H.A.; Abed, T.A. Traffic and outdoor air pollution levels near highways in Baghdad, Iraq. Environ. Dev. Sustain. 2018, 20, 589–603. [Google Scholar] [CrossRef]
  41. Central Statistical Organization (CSO). Private Sector Cars Registered in the General Traffic Directorate Until December 31, 2020; CSO: Baghdad, Iraq, 2021. [Google Scholar]
  42. Carslaw, D.C.; Ropkins, K. openair—An R package for air quality data analysis. Environ. Model. Softw. 2012, 27–28, 52–61. [Google Scholar] [CrossRef]
  43. Habeebullah, T.M. An analysis of air pollution in Makkah—A view point of source identification. Environ. Asia 2013, 7, 104–111. [Google Scholar] [CrossRef]
  44. Wright, S.; Ulke, J.; Font, A.; Chan, K.; Kelly, F. Atmospheric microplastic deposition in an urban environment and an evaluation of transport. Environ. Int. 2020, 136, 105411. [Google Scholar] [CrossRef]
  45. Carslaw, D.C.; Beevers, S.D. Characterising and understanding emission sources using bivariate polar plots and k-means clustering. Environ. Model. Softw. 2013, 40, 325–329. [Google Scholar] [CrossRef]
  46. Khan, B.; Masiol, M.; Formenton, G.; Di Gilio, A.; de Gennaro, G.; Agostinelli, C.; Pavoni, B. Carbonaceous PM2.5 and secondary organic aerosol across the Veneto region (NE Italy). Sci. Total. Environ. 2016, 542, 172–181. [Google Scholar] [CrossRef]
  47. Ravindra, K.; Sokhi, R.; Vangrieken, R. Atmospheric polycyclic aromatic hydrocarbons: Source attribution, emission factors and regulation. Atmos. Environ. 2008, 42, 2895–2921. [Google Scholar] [CrossRef]
  48. Sahu, L.K.; Yadav, R.; Pal, D. Source identification of VOCs at an urban site of western India: Effect of marathon events and anthropogenic emissions. J. Geophys. Res. 2016, 175, 18. [Google Scholar] [CrossRef]
  49. Molozhnikova, Y.; Shikhovtsev, M.; Khodzher, T. Results of a Comprehensive Study on Atmospheric Pollution at the Tankhoi Observation Point (Southeastern Coast of Lake Baikal, Russia): Temporal Variability and Identification of Sources. Environments 2025, 12, 462. [Google Scholar] [CrossRef]
  50. Jain, S.S.; Sharma, S.; Vijayan, N.; Mandal, T. Seasonal characteristics of aerosols (PM2.5 and PM10) and their source apportionment using PMF: A four year study over Delhi, India. Environ. Pollut. 2020, 262, 114337. [Google Scholar] [CrossRef]
  51. Stein, A.F.; Draxler, R.R.; Rolph, G.D.; Stunder, B.J.B.; Cohen, M.D.; Ngan, F. Noaa’s hysplit atmospheric transport and dispersion modeling system. Bull. Am. Meteorol. Soc. 2015, 96, 2059–2077. [Google Scholar] [CrossRef]
  52. Rolph, G.; Stein, A.; Stunder, B. Real-time Environmental Applications and Display sYstem: READY. Environ. Model. Softw. 2017, 95, 210–228. [Google Scholar] [CrossRef]
  53. Polissar, A.V.; Hopke, P.K.; Paatero, P.; Kaufmann, Y.J.; Hall, D.K.; Bodhaine, B.A.; Dutton, E.G.; Harris, J.M. The aerosol at Barrow, Alaska: Long-term trends and source locations. Atmos. Environ. 1999, 33, 2441–2458. [Google Scholar] [CrossRef]
  54. Polissar, A.V.; Hopke, P.K.; Harris, J.M. Source Regions for Atmospheric Aerosol Measured at Barrow, Alaska. Environ. Sci. Technol. 2001, 35, 4214–4226. [Google Scholar] [CrossRef]
  55. Begum, B.A.; Kim, E.; Jeong, C.-H.; Lee, D.-W.; Hopke, P.K. Evaluation of the potential source contribution function using the 2002 Quebec forest fire episode. Atmos. Environ. 2005, 39, 3719–3724. [Google Scholar] [CrossRef]
  56. Khuzestani, R.B.; Taheri, A.; Yeganeh, B. Long-range transport of sulfur dioxide emissions from external sources to Tehran. Urban Clim. 2023, 49, 101445. [Google Scholar] [CrossRef]
  57. Tepe, A.M.; Doğan, G. Chemical characterization of PM2.5 and PM2.5–10 samples collected in urban site in Mediterranean coast of Turkey. Atmos. Pollut. Res. 2021, 12, 46–59. [Google Scholar] [CrossRef]
  58. Karaca, F.; Anil, I.; Alagha, O. Long-range potential source contributions of episodic aerosol events to PM10 profile of a megacity. Atmos. Environ. 2009, 43, 5713–5722. [Google Scholar] [CrossRef]
  59. Bari, A.; Kindzierski, W.B. Characteristics of air quality and sources affecting fine particulate matter (PM2.5) levels in the City of Red Deer, Canada. Environ. Pollut. 2017, 221, 367–376. [Google Scholar] [CrossRef]
  60. Polissar, A.V.; Hopke, P.K.; Poirot, R.L. Atmospheric Aerosol over Vermont: Chemical Composition and Sources. Environ. Sci. Technol. 2001, 35, 4604–4621. [Google Scholar] [CrossRef]
  61. Wang, Y.Q.; Zhang, X.Y.; Draxler, R.R. TrajStat: GIS-based software that uses various trajectory statistical analysis methods to identify potential sources from long-term air pollution measurement data. Environ. Model. Softw. 2009, 24, 938–939. [Google Scholar] [CrossRef]
  62. Liu, B.; Liang, D.; Yang, J.; Dai, Q.; Bi, X.; Feng, Y.; Yuan, J.; Xiao, Z.; Zhang, Y.; Xu, H. Characterization and source apportionment of volatile organic compounds based on 1-year of observational data in Tianjin, China. Environ. Pollut. 2016, 218, 757–769. [Google Scholar] [CrossRef] [PubMed]
  63. Hsu, Y.-K.; Holsen, T.M.; Hopke, P.K. Comparison of hybrid receptor models to locate PCB sources in Chicago. Atmos. Environ. 2003, 37, 545–562. [Google Scholar] [CrossRef]
  64. Hamad, S.H.; Schauer, J.J.; Heo, J.; Kadhim, A.K. Source apportionment of PM2.5 carbonaceous aerosol in Baghdad, Iraq. Atmos. Res. 2015, 156, 80–90. [Google Scholar] [CrossRef]
  65. Price, R. Environmental Risks in Iraq; Reuters AP: London, UK, 2018. [Google Scholar]
  66. Roomi, T.O.; Abed, A.S. Estimating gaseous pollutants in the air near Daura Refinery, Daura Power Plant and South of Baghdad Power Plant by calculating the fuel discharge. Sci. Rev. Eng. Environ. Sci. (SREES) 2021, 30, 195–207. [Google Scholar] [CrossRef]
  67. Abass, K.I. Iraqi Experiment in the Use of Alternative Fuel: A Review. Saudi J. Eng. Technol. 2017, 2, 171–184. [Google Scholar] [CrossRef]
  68. Muslim, A.S.; Ammar, H. Burning Garbage and Smoke from Factories Suffocate Iraqis; Reuters AP: London, UK, 2019. (In Arabic) [Google Scholar]
  69. Al Slik, G.; Hameed, A. The Urban and Environmental Impact of Electrical Power Generators on the Residential Districts in IRAQ (Baghdad City Case Study). 2018. Available online: https://www.researchgate.net/publication/346060193_The_Urban_and_Environmental_Impact_of_Electrical_Power_Generators_on_the_Residential_Districts_in_IRAQ_Baghdad_City_Case_Study (accessed on 3 March 2024). (In Arabic)
  70. Al-Wakeel, A. Local Energy Systems in Iraq. Energy 2021, 1, 26. [Google Scholar]
  71. Carslaw, D.C.; Beevers, S.D.; Ropkins, K.; Bell, M.C. Detecting and quantifying aircraft and other on-airport contributions to ambient nitrogen oxides in the vicinity of a large international airport. Atmos. Environ. 2006, 40, 5424–5434. [Google Scholar] [CrossRef]
  72. Seinfeld, J.H.; Pandis, S.N. Atmospheric Chemistry and Physics: From Air Pollution to Climate Change; John Wiley & Sons: New York, NY, USA, 2016. [Google Scholar]
  73. Mishra, M.; Gulia, S.; Shukla, N.; Goyal, S.K.; Kulshrestha, U.C. Review of Secondary Aerosol Formation and Its Contribution in Air Pollution Load of Delhi NCR. Water Air Soil Pollut. 2023, 234, 47. [Google Scholar] [CrossRef]
  74. Mangia, C.; Cervino, M.; Gianicolo, E.A.L. Secondary Particulate Matter Originating from an Industrial Source and Its Impact on Population Health. Int. J. Environ. Res. Public Health 2015, 12, 7667–7681. [Google Scholar] [CrossRef]
  75. NASA. Dust Storm in Iraq. 2022. Available online: https://science.nasa.gov/earth/earth-observatory/dust-storm-in-iraq-149695 (accessed on 30 January 2024).
  76. Trew, B. The Poisoned Clouds Suffocating the People of Iraq. The Independent. 16 April 2021. Available online: https://www.independent.co.uk/climate-change/news/iraq-oil-air-pollution-health-environment-b1828465.html (accessed on 4 March 2025).
  77. Hashim, B.M.; Abdulwahed, E.A.; Sultan, M.A. Evaluation of Chemistry and Concentration of Air Pollutants from Brick Factories in Nahrawan Area, Northeast Baghdad, Using GIS Methods. Al-Nahrain J. Sci. 2018, 21, 16–22. [Google Scholar] [CrossRef]
  78. Al-Nuzal, S.M.; Al-Bakri, S.A.; Zankana, S.D. Environmental Impact Assessment for Modern Brick Factory in Baghdad, Iraq. Eng. Technol. J. 2019, 37, 377–384. [Google Scholar] [CrossRef]
  79. U.S. Energy Information Administration (EIA). Background Reference: Iraq. 2019; pp. 1–9. Available online: https://www.eia.gov/international/content/analysis/countries_long/Iraq/background.htm (accessed on 6 April 2025).
  80. Reda, A.; Al-Shammari, A.K.H. Spatial analysis of air pollution in suspended particles and heavy elements in urban centers in Wasit Governorate. Al-Qadisiyah J. Humanit. Sci. 2020, 2020, 29–69. [Google Scholar]
  81. Ajmi, R.N.; Zeki, H.F.; Ati, E.M.; Al-Newani, H.R. Monitoring of some heavy metals transboundary air pollution. J. Eng. Appl. Sci. 2018, 13, 9862–9867. [Google Scholar] [CrossRef]
  82. Mahdi, A.; Alasedi, K. Determination of concentrations of pollutant gases and trace elements in air of holy city of Karbala. Alqadisiyah J. Pure Sci. 2014, 19, 55–66. [Google Scholar]
  83. Salmabadi, H.; Khalidy, R.; Saeedi, M. Transport routes and potential source regions of the Middle Eastern dust over Ahvaz during 2005–2017. Atmos. Res. 2020, 241, 104947. [Google Scholar] [CrossRef]
  84. Ginoux, P.; Prospero, J.M.; Gill, T.E.; Hsu, N.C.; Zhao, M. Global-scale attribution of anthropogenic and natural dust sources and their emission rates based on MODIS Deep Blue aerosol products. Rev. Geophys. 2012, 50, RG3005. [Google Scholar] [CrossRef]
  85. Gaafar, R. The Environmental Impact of Syria’s Conflict: A Preliminary Survey of Issues → Roba Gaafar; Arab Reform Initiative: Paris, France, 2021. [Google Scholar]
  86. Javed, W.; Iakovides, M.; Garaga, R.; Stephanou, E.G.; Kota, S.H.; Ying, Q.; Wolfson, J.M.; Koutrakis, P.; Guo, B. Source apportionment of organic pollutants in fine and coarse atmospheric particles in Doha, Qatar. J. Air Waste Manag. Assoc. 2019, 69, 1277–1292. [Google Scholar] [CrossRef] [PubMed]
  87. Alolayan, M.A.; Brown, K.W.; Evans, J.S.; Bouhamra, W.S.; Koutrakis, P. Source apportionment of fine particles in Kuwait City. Sci. Total. Environ. 2013, 448, 14–25. [Google Scholar] [CrossRef]
  88. Khamutian, R.; Sharafi, K.; Najafi, F.; Shahhoseini, M. Association of air pollution and hospital admission for cardiovascular disease: A case study in Kermanshah, Iran. Zahedan J. Res. Med. Sci. 2014, 16, 43–46. [Google Scholar]
  89. Doabi, S.A.; Karami, M.; Afyuni, M.; Yeganeh, M. Pollution and health risk assessment of heavy metals in agricultural soil, atmospheric dust and major food crops in Kermanshah province, Iran. Ecotoxicol. Environ. Saf. 2018, 163, 153–164. [Google Scholar] [CrossRef]
Figure 1. (a) locations of AQMSs in Baghdad city (blue symbols), (b) WZ AQMS, (c) AS AQMS and (d) SA AQMS (source: Google Earth).
Atmosphere 17 00455 g001
Figure 2. Wind roses illustrating the hourly speed and direction of the wind frequencies at (a) WZ, (b) AS, and (c) SA sites for 2019, respectively.
Atmosphere 17 00455 g002
Figure 3. Polar plots of mean concentrations (μg/m3) of PM2.5 at the WZ area, AS area, and SA area before (a) and after (b) removing dusty hours, respectively. Each circle in the polar plots represents an increment in wind speed of 1 ms−1.
Atmosphere 17 00455 g003
Figure 4. PM2.5/CO ratio at (a) WZ, (b) AS, and (c) SA. All wind speeds are in ms−1.
Atmosphere 17 00455 g004
Figure 5. CBPF for (a,b) WZ site for concentration > 25, 46 µg/m3, respectively, (c,d) AS site for concentration > 25, 49 µg/m3, respectively, and (e,f) SA site for concentration > 25, 49 µg/m3, respectively (i.e., the second concentration of each site represents the 75th percentile, which indicates possible emission sources that contribute to higher levels of PM2.5).
Atmosphere 17 00455 g005aAtmosphere 17 00455 g005b
Figure 6. Weighted PSCF plots of PM2.5 for concentration > 25 µg/m3 as threshold value arriving at (a) WZ, (b) AS, (c) SA monitoring stations for three days backward trajectories.
Atmosphere 17 00455 g006
Figure 7. Weighted CWT plots of PM2.5 arriving at (a) WZ, (b) AS, (c) SA monitoring stations for three-day backward trajectories.
Atmosphere 17 00455 g007
Disclaimer/Publisher’s Note: The statements, opinions and data contained in all publications are solely those of the individual author(s) and contributor(s) and not of MDPI and/or the editor(s). MDPI and/or the editor(s) disclaim responsibility for any injury to people or property resulting from any ideas, methods, instructions or products referred to in the content.