Article

Atmospheric Loss of Energetic Electrons and Protons from the Radiation Belts After the Exceptional Injection of the 11 May 2024 Superstorm Leading to Four Electron Belts

by
Viviane Pierrard
1,2,* and
Alexandre Winant
1,2
1
Solar Terrestrial Center of Excellence (STCE) and Space Physics, Royal Belgian Institute for Space Aeronomy (BIRA-IASB), Avenue Circulaire 3, B-1180 Brussels, Belgium
2
Earth and Life Institute—Climate Sciences ELI-C, Université Catholique de Louvain (UCLouvain), B-1348 Louvain-la-Neuve, Belgium
*
Author to whom correspondence should be addressed.
Atmosphere 2026, 17(3), 324; https://doi.org/10.3390/atmos17030324
Submission received: 13 February 2026 / Revised: 16 March 2026 / Accepted: 17 March 2026 / Published: 22 March 2026
(This article belongs to the Special Issue Advances in Observation and Simulation Studies of Ionosphere)

Abstract

The exceptionally strong geomagnetic storm of 10–11 May 2024 injected new energetic protons and electrons into the terrestrial radiation belts, creating extraordinary conditions to study the loss mechanisms scattering these particles into the atmosphere after the storm. For the first time, four electron belts were observed during several weeks. We show that this structure was due to electron loss, highly dependent on specific positions. Using the proton and electron fluxes measured by the Energetic Particle Telescope, EPT, on board PROBA-V, we determine the lifetimes of these populations depending on their energy ranges and positions. We show that the lifetimes are much longer for protons than for electrons, which enables us to determine their time variations independently. For electrons, the wave–particle loss mechanisms depend on the background ionosphere–plasmasphere density. The lifetimes determined after the May 2024 and 10 October 2024 big events are compared with average ones to understand their unusual specificity for the formation of four and three belts, respectively. For the injected protons of 9.5 to 13 MeV, the lifetime is minimum at L~1.9, where the fluxes are maximum, showing a lifetime depending on the flux intensity. Loss is due to pitch angle diffusion and collisions with electrons and nuclei in the ambient plasma and neutral atmosphere. At the outer edge of the proton belt, the flux is depleted at all energies after the geomagnetic perturbation, and we determine that the progressive time of refilling after the storm generally reaches more than 40 days. There is an excellent discrimination between the different populations of energetic electrons (0.5–8 MeV) and the injected protons (9.5–13 MeV) that are still observed several months after the event. Such results contribute to advancing understanding of the interactions between the terrestrial atmosphere and space radiation.

1. Introduction

On 10 May 2024, at 17h 07 UT, the strongest geomagnetic storm of the last 20 years started and caused severe disturbances in the upper atmosphere and ionosphere everywhere in the world (e.g., [1,2,3]). This “Mother’s Day event” of 10–11 May 2024, also called the “Gannon event”, generated strong injections of both electrons and protons in the radiation belts. These particles remained trapped along specific McIlwain L-shells, creating for the first time four electron belts observed until the end of June 2024 and a long-term proton belt in the southern part of the South Atlantic Anomaly (SAA) [4]. These observations were obtained using measurements of the EPT (Energetic Particle Telescope) on board the PROBA-V satellite and were also corroborated using the Medium Energy Proton and Electron Detector (MEPED) on board METOP satellite circulating on the same polar orbit at 820 km [4,5]. These additional belts were also confirmed subsequently by REPTile-2 on NASA’s CIRBE [6], CSES [7], and NOAA satellites [8].
In normal conditions, only two belts (inner and outer) are generally observed, separated by a slot located around L = 2.5. However, the location of the slot is also energy dependent [9]. In the past, a third belt of high-energy (>2 MeV) was observed in the geocentric radial range of 3.0 to ~3.5 Re (Earth radii) during 4 weeks in September 2012 with Van Allen Probes [10], but a four-belt structure like in May–June 2024 was never observed before.
Such increased proton and electron fluxes in the radiation belts during the storm enable us to determine the lifetimes of the different particles as a function of the position and energy range. The lifetime is the average duration energetic particles remain trapped by Earth’s magnetic field before being lost by scattering in the atmosphere and by atmospheric collisions. These injected particles cause atmospheric ionization with maximum rates that depend on the species and energy of the particles [9]. Ground-based and space measurements during and after the Gannon event, as well as specific simulations, confirm a strong effect in the atmosphere at different altitudes [3,11], including a decrease in ozone and an increase in the temperature above 85 km [12].
Lifetimes of trapped particles are crucial to characterize their loss after injections. Several years ago, electron lifetimes were estimated using SAC-C and DEMETER satellite measurements [13]. Electron lifetimes were obtained to be >10 days in the inner belt (L < 2), around 5 days in the outer belt (L > 3), and around 3 days in the slot. Similar values were obtained using Van Allen Probes/MagEIS [14], despite the very different orbit. For protons, long-term variations between 2013 and 2019 have been studied in [15]. Injections of protons in the trapped belt were detected several times before 2001 [16], but never after the commissioning phase EPT in 2013 [17] until the May 2024 event. A split between the North and South parts of the proton SAA was identified previously in the energy range 9.5–13 MeV [18], but its origin was unclear.
In the present work, we study the characteristics of protons and electrons lost after their flux increases in the inner belt due to the 10–11 May 2024 event. Using this, we can identify why four electron belts appeared and disappeared 6 weeks later, and compare the lifetimes as a function of energy and position with those of other events in 2024 and 2025. For the protons, the exceptional flux increase in the energy range 9.5–13 MeV enables us to determine their lifetime after the injection. In addition, for all the energy ranges, we estimated the refilling time after the loss of protons at the outer edge of the belt due to the magnetic field disturbance leading to the violation of the guiding centre approximation [9].
Section 2 describes the PROBA-V/EPT data used in this study, Section 3 shows the electron flux variations, determines lifetimes, and comparisons with other events, while Section 4 focuses on the proton lifetimes and refilling times. Section 5 shows the consequences for the South Atlantic Anomaly, and Section 6 discusses the results and summarizes the conclusions.

2. Instruments and Data: PROBA-V/EPT Observations

The Energetic Particle Telescope (EPT) is a spaceborne detector developed at UCLouvain, BIRA-IASB, and Redwire Space (Kruibeke, Belgium) that measures the fluxes of high-energy particles in the radiation belts. This instrument was launched on 7 May 2013 onboard the ESA (European Space Agency) satellite PROBA-V [19]. The spacecraft has a Sun-synchronous polar Low Earth Orbit (LEO) at an altitude of 820 km, with an inclination of 98.73° and a descending node at 10:30 am local time. The EPT was designed for real-time and contamination-free measurements of charged particle spectra in the space environment and can discriminate between electrons, protons, alpha particles, and heavier ions while performing direct measurements of their energy spectra. The EPT features two energy sections. The low-energy section only measures lower-energy electron fluxes, while the high-energy section measures electron, proton, and heavier particle fluxes of higher energy. The EPT measures differential flux of electrons above 0.5 MeV in six energy channels, and of protons above 9.5 MeV in ten energy channels [20].

3. Electron Flux Variations Observed by EPT

3.1. Long-Term Variations

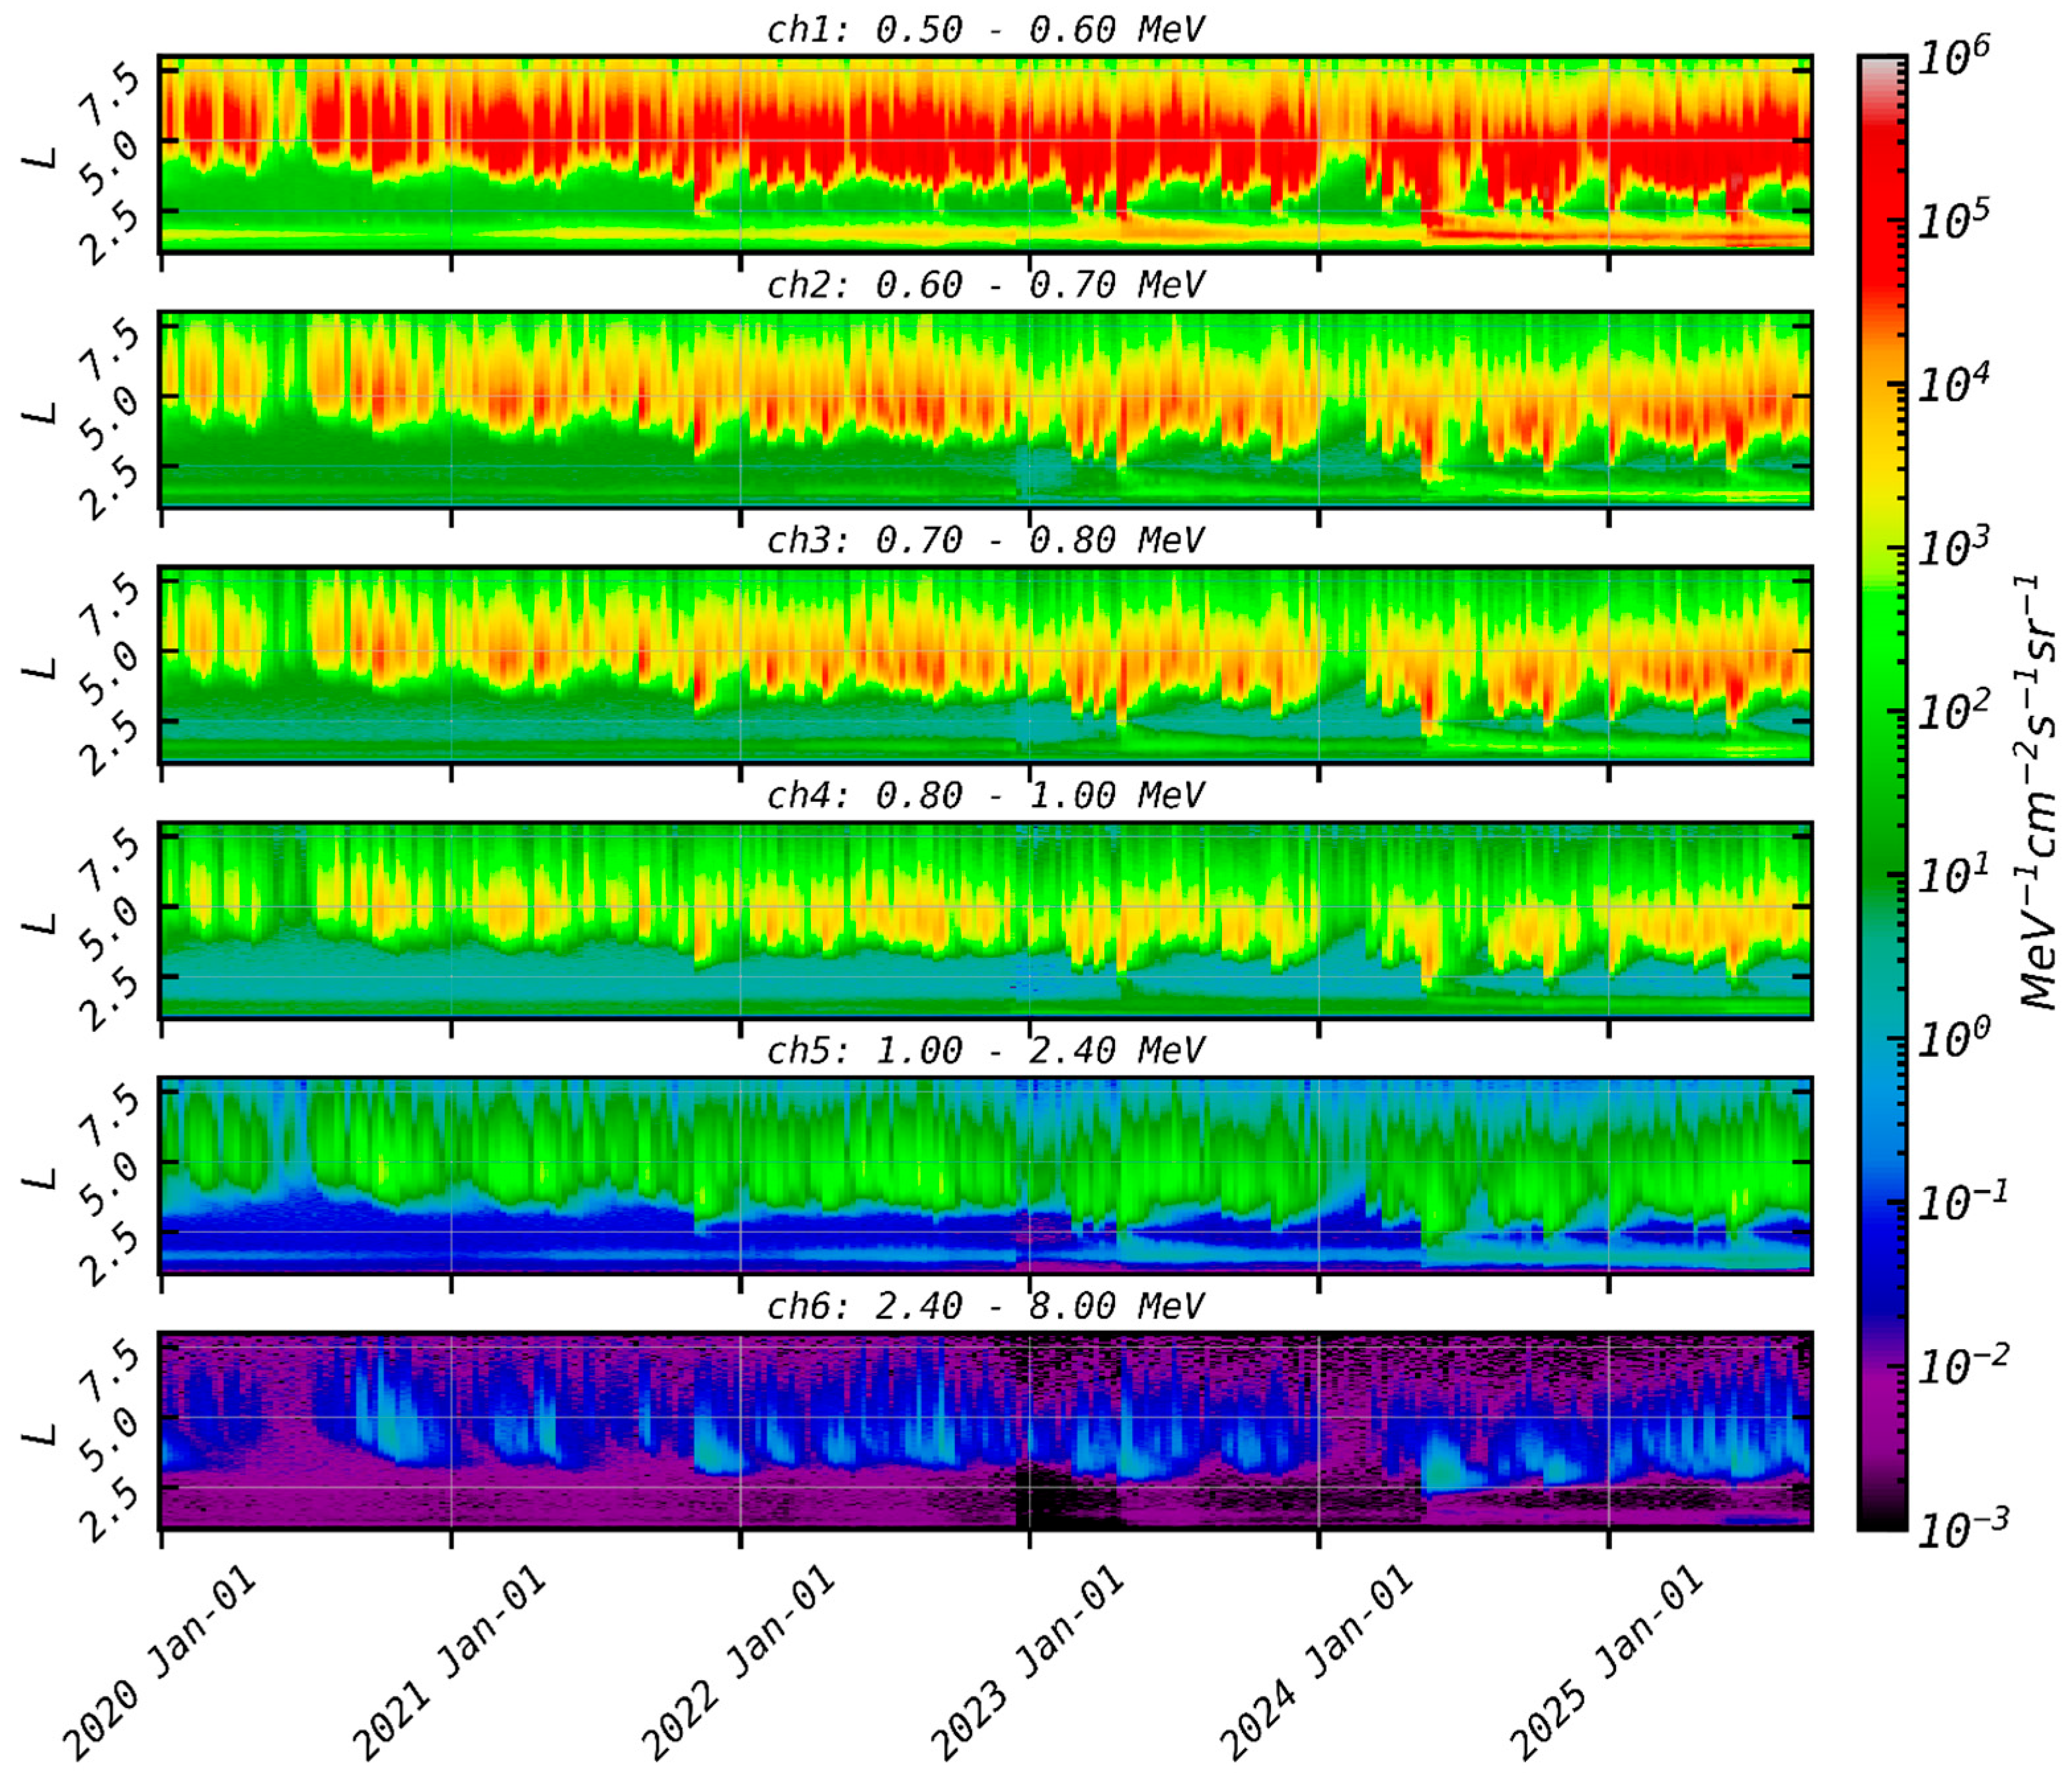
The differential fluxes measured by EPT from 1 January 2020 to 15 September 2025 in the six electron energy channels ranging from 0.5 MeV to 8 MeV and averaged by week are illustrated in Figure 1 as a function of the McIlwain parameter L (in Earth’s radii, y axis) and time (date, x axis). The results are quite different from what was observed during the first six years (2013–2019) of the PROBA-V/EPT (see Figure 1 in [21]) due to the different phase of the solar activity cycle. One can see that from 2020 to 2022, the inner belt at L < 2.5 is very tenuous in all channels and almost empty at high energies. This is due to the very low activity during this period: the minimum solar activity occurred in December 2019, officially marking the end of Solar Cycle 24 and the beginning of Solar Cycle 25.
In the first energy channel, Ch1 = 0.5–0.6 MeV, some injections in the inner belt are visible at the end of 2021 and in 2022. However, it is only in April 2023 that we can see an event (with Disturbance Storm Time index, Dst < −200 nT) injecting electrons in the inner belt for all the energy channels. The extreme event of May 2024 is well visible, as well as two intense events, one in October 2024 and the other in June 2025. Weaker events injected electrons only in the lowest energy channels, which explains why the inner belt fluxes are higher for low energies.

3.2. Four Belts After the Event of 11 May 2024

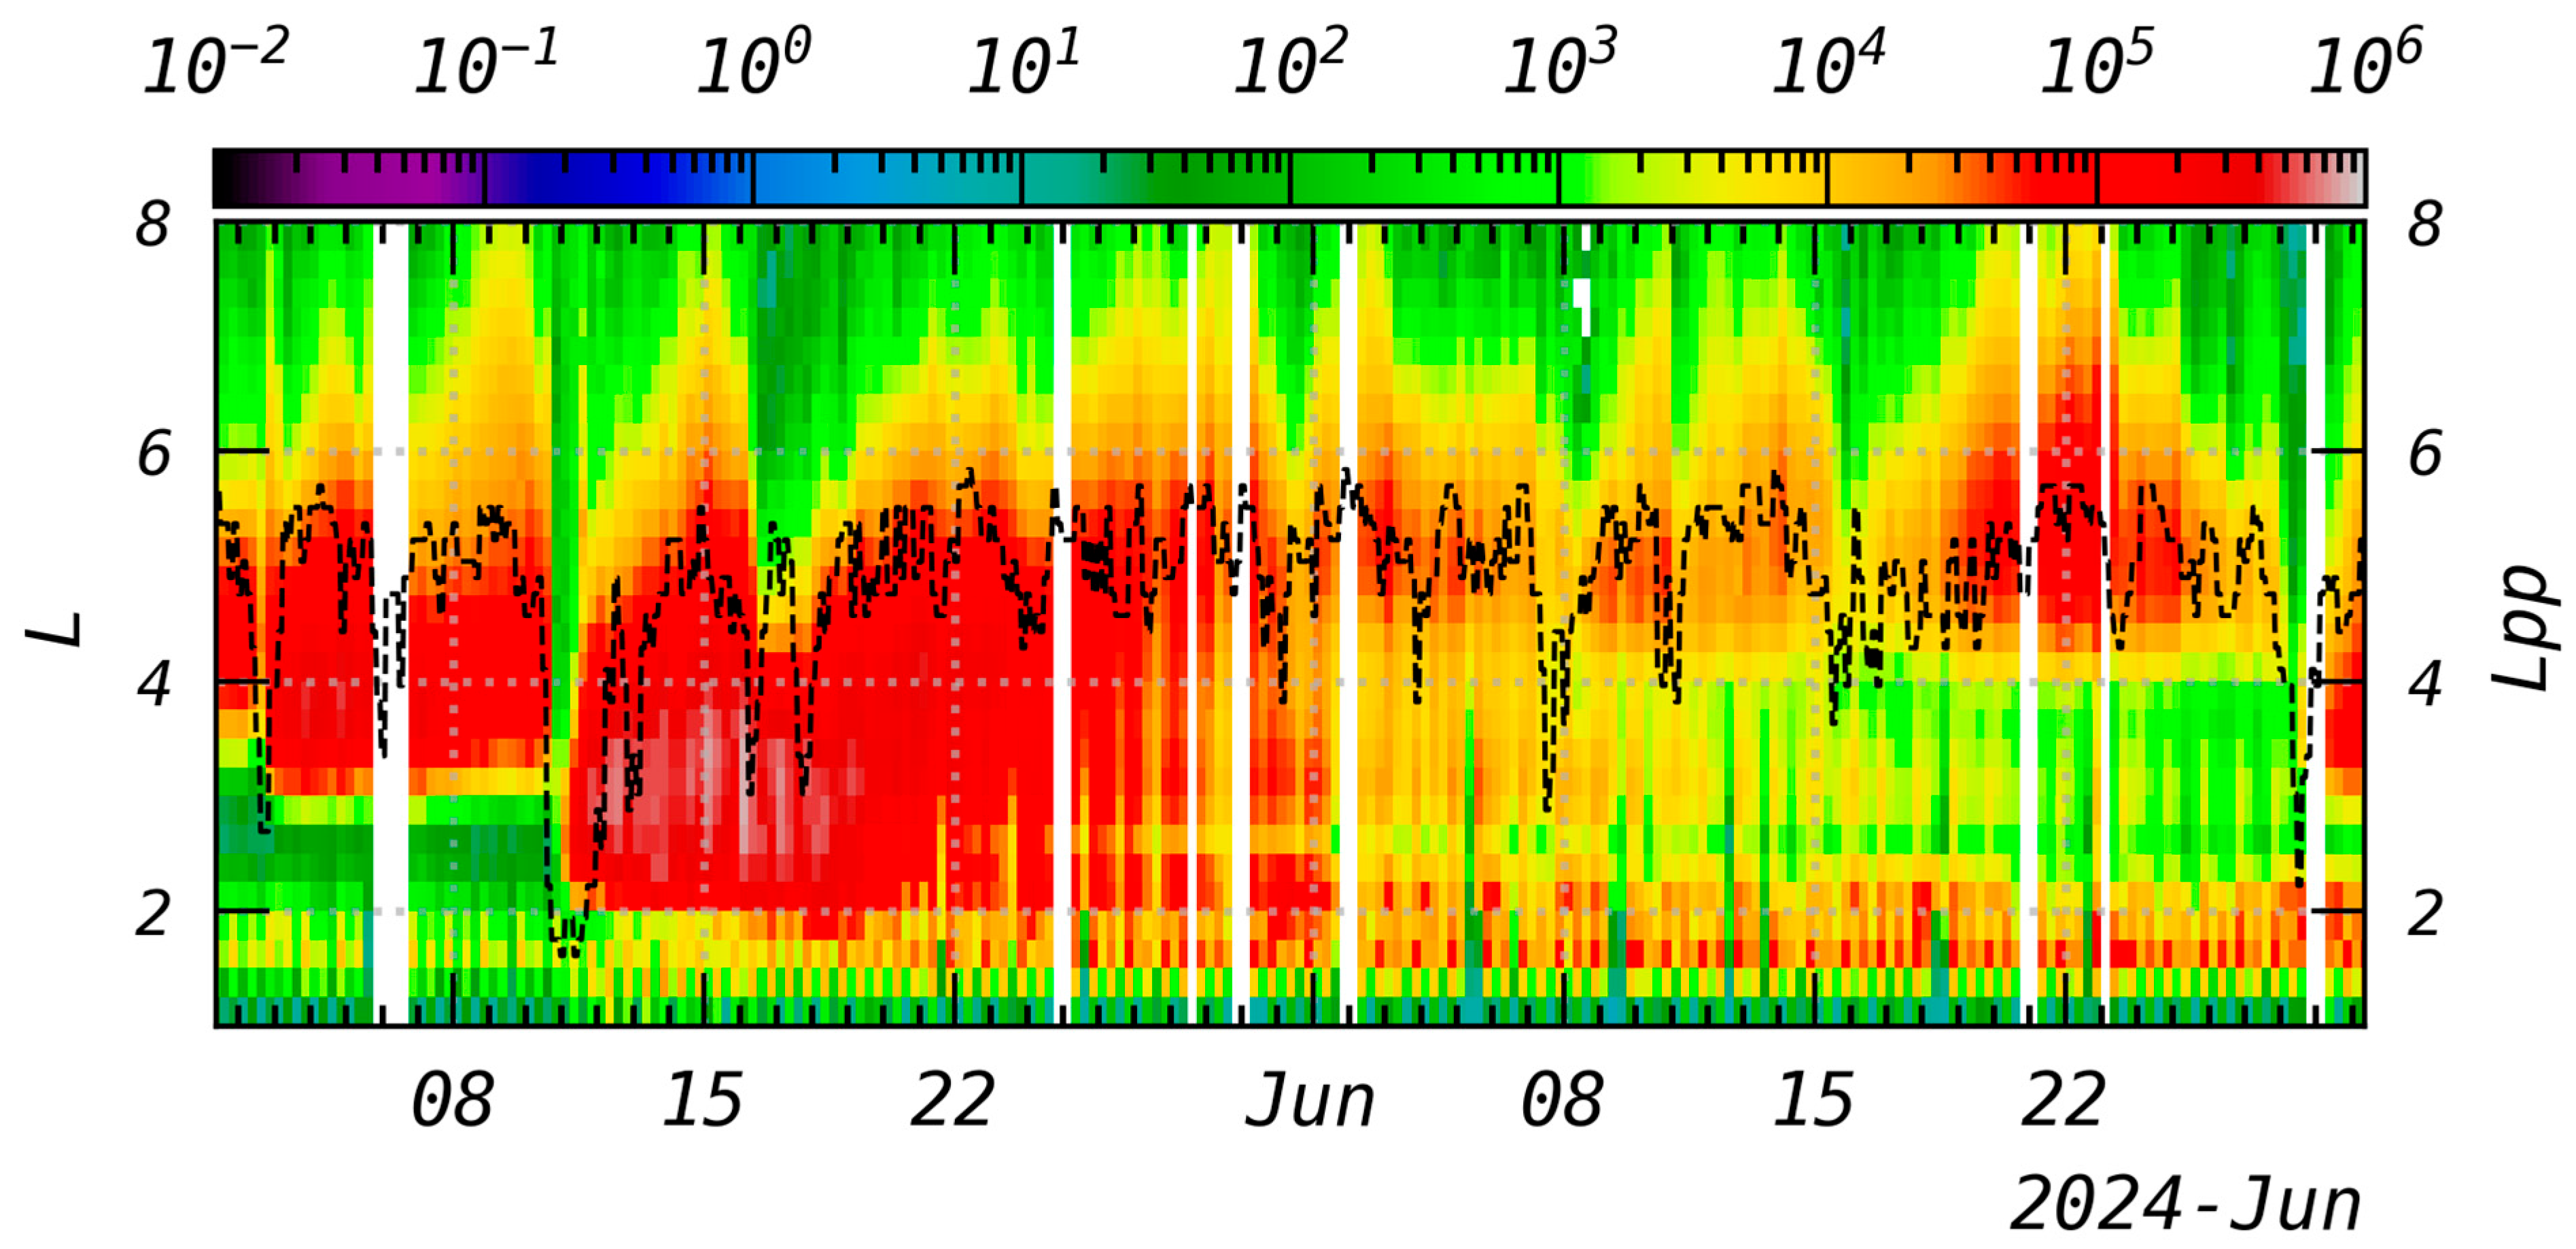
The event of May 2024 is highly unusual because it led to the formation of four electron belts until the end of June 2024, observed in all channels except the one with the highest energy (2.4–8 MeV) [4]. The four electron belts emerge from different loss processes, scattering the particles in the atmosphere. Slots appear at specific L values, as illustrated in Figure 2 showing PROBA-V/EPT fluxes in Ch1 from 1 May to 30 June 2024. One can see that the four belts do not appear immediately, but several days later, around 22 May 2024, and remain for almost one month after the Mother’s Day geomagnetic storm. The response to the geomagnetic storm presents different steps.
(1)
First, on 10 May 2024, at the arrival of the coronal mass ejection, a fast and deep dropout is observed, i.e., the electrons of the outer belt completely disappeared during several hours. Such dropouts are observed at the arrival of most storms and substorms due to the magnetopause shadowing and precipitation of electrons in the atmosphere, but they are rarely so deep [21].
(2)
Simultaneously, a strong increase in electron flux is observed in the usual slot (from L = 2–3) and in the inner belt (L < 2). The flux becomes very high above L = 2, and later, after the geomagnetic storm, the flux further increases above L = 1.4. This is deeper than usual. The depth of the inner belt injection corresponds well to the estimation based on the Dst value established in [21]. Such flux increase is due to radial diffusion and ULF (ultra-low frequency) waves (1 mHz–1 Hz), as described for instance in [23].
(3)
The black dashed line corresponds to the plasmapause position Lpp, here obtained using the linear approximation relating the Bartels planetary geomagnetic index Kp and the plasmapause from the BSPM (Belgian Swiff Plasmasphere Model): Lpp = −0.47 Kp + 5.84 [24], which is close but slightly higher than the position obtained by the linear relation of Carpenter and Anderson [25]. During the 11 May 2024 event, the very rare occasion of a maximum Kp value (Kp = 9) was reached. One can see that the plasmapause was closer to the Earth during the storm, as indeed confirmed by SWARM with a plasmapause position observed to be around L = 1.8 in the midnight MLT (Magnetic Local Time) sector [3]. One can see links between the plasmapause and outer radiation belt boundaries, as demonstrated in [24] with previous observations. This link is due to wave–particle interactions, such as EMIC (Electro-Magnetic Ion Cyclotron) and chorus waves that are present mainly outside the plasmasphere and scatter high-energy electrons into the atmosphere.
(4)
The figure also well illustrates how the four belts are formed after the event due to the loss of electrons at specific L. The usual slot reforms again around L = 2.5 after around 10 days, which corresponds to what is observed after other storms. The four belts are due to two additional slots appearing around L = 1.9 (in the inner belt) and L = 3.8 (in the outer belt), which have never been observed in this energy range.

3.3. Electron Flux Profiles After the 11 May 2024 Event

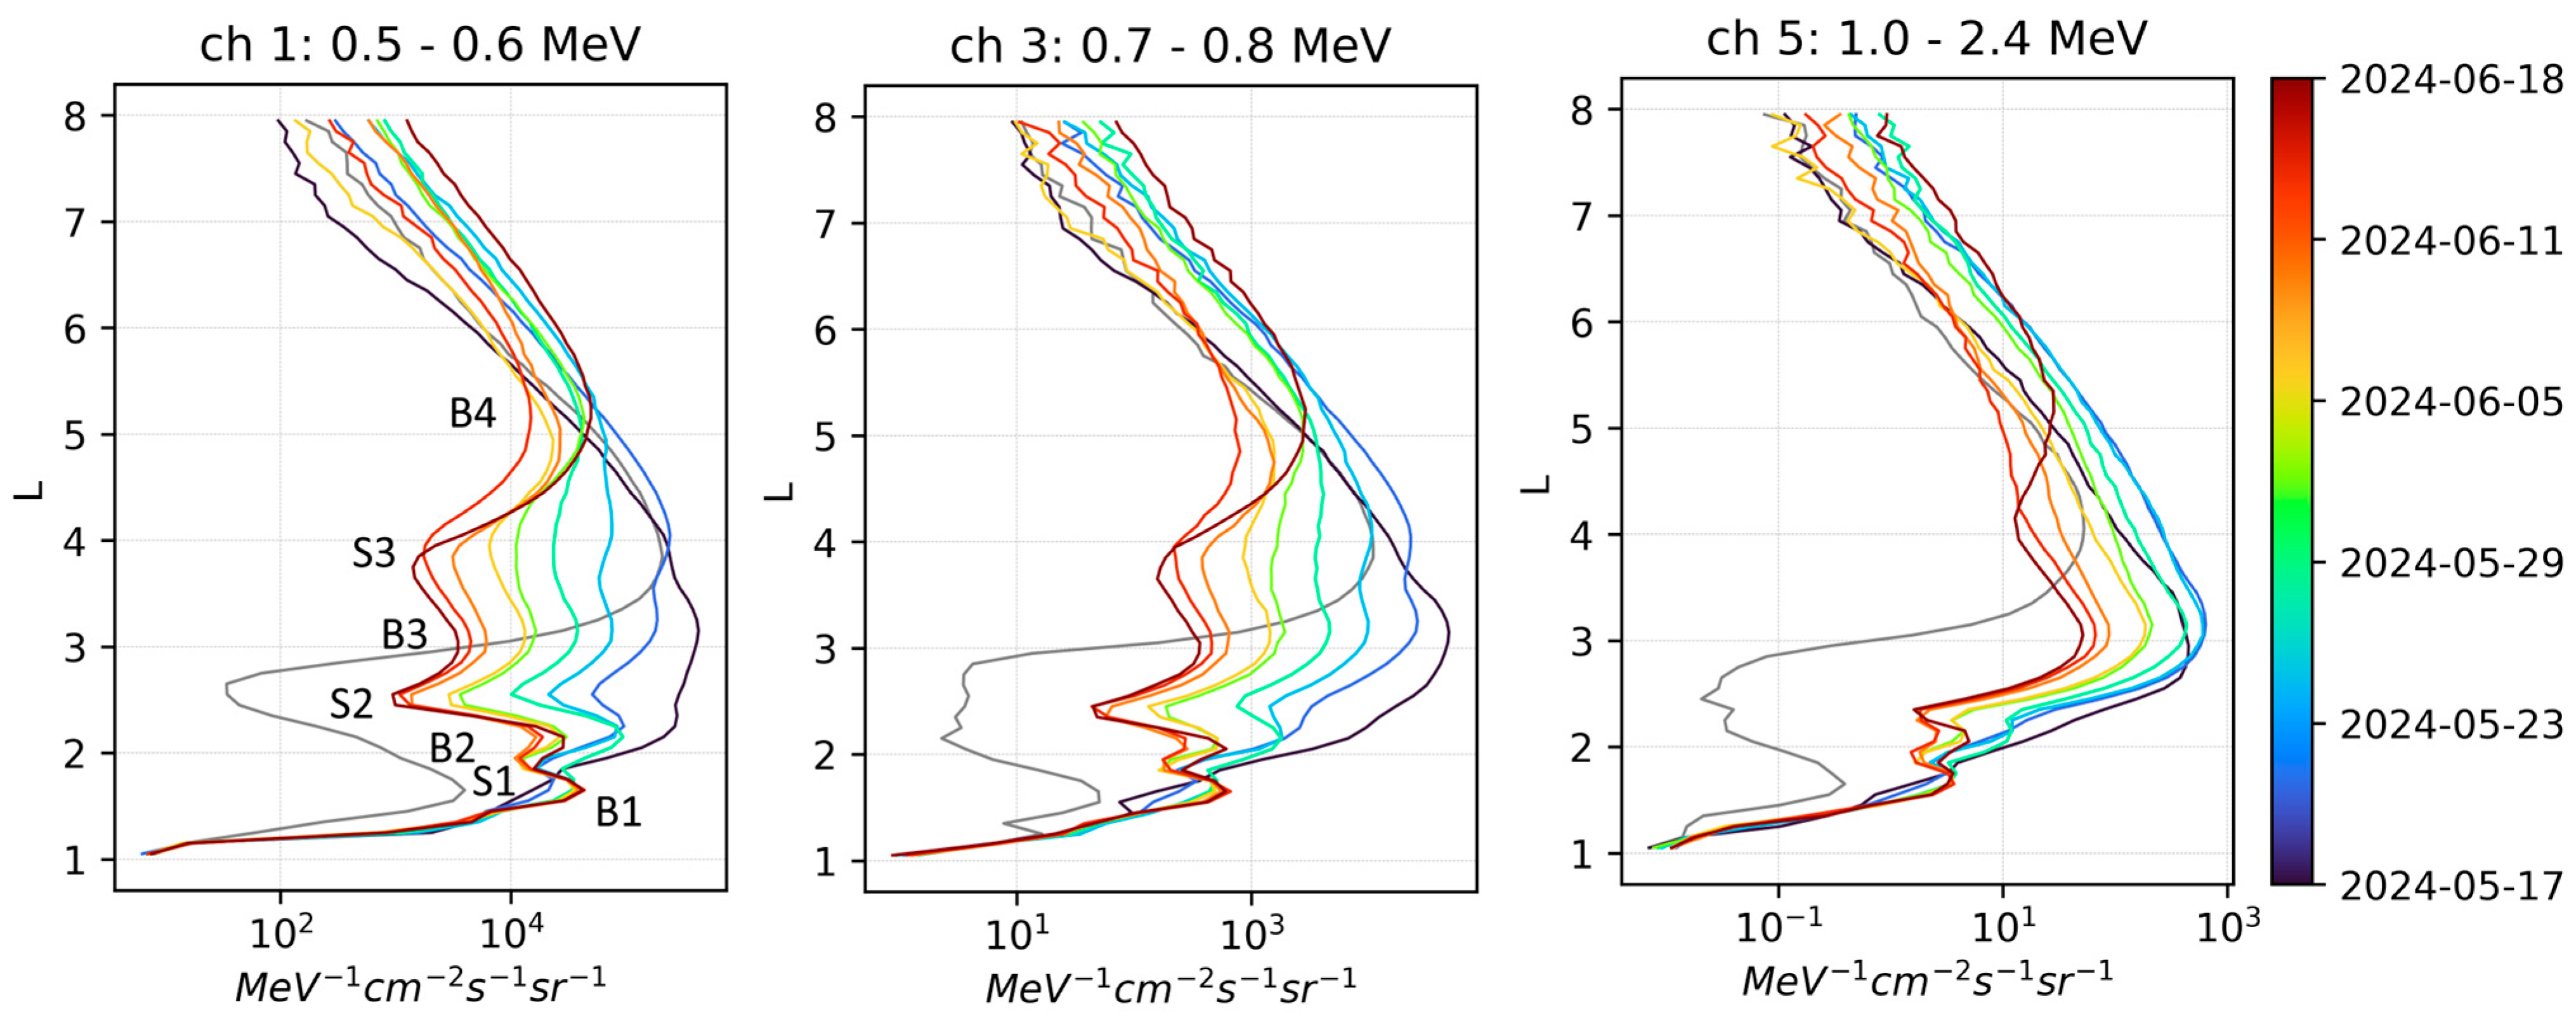
The positions of the three minima (slots) and four maxima (belts) of the fluxes in the different energy channels are even more apparent by illustrating the electron flux profiles as done in Figure 3. The three top panels illustrate the flux profiles averaged every 4 days in 3 energy ranges (0.5–0.6 MeV), (0.7–0.8 MeV), and (1–2.4 MeV) as a function of L (y axis), during one month after the storm. The averaged profiles are provided with different colours ranging from black (on 17 May 2024, just after the storm), blue to green (end May 2024), and orange to red for June 2024. The grey profile in the top panels of Figure 3 corresponds to that obtained from EPT, averaging the flux from 1 to 4 May 2024 (pre-storm), featuring the standard two-belt structure. On 17 May 2024, the profile in black shows only one belt just after the injection, while on 18 June 2024, the profile in dark red shows four clearly visible belts indicated by B1 to B4 in the first panel.
On 18 June 2024 (dark red), the flux maxima corresponding to the belts are located at L = 1.55 (B1), L = 2.1 (B2), L = 3 (B3), and L = 5 (B4). The flux minima corresponding to the slots are located at L = 1.85 (S1), L = 2.4 (S2), and L = 3.85 (S3), as also globally obtained at other previous times in June 2024, and the other channels are illustrated by the three panels (even if slow evolution and differences in maximum 0.1 Re can be observed).
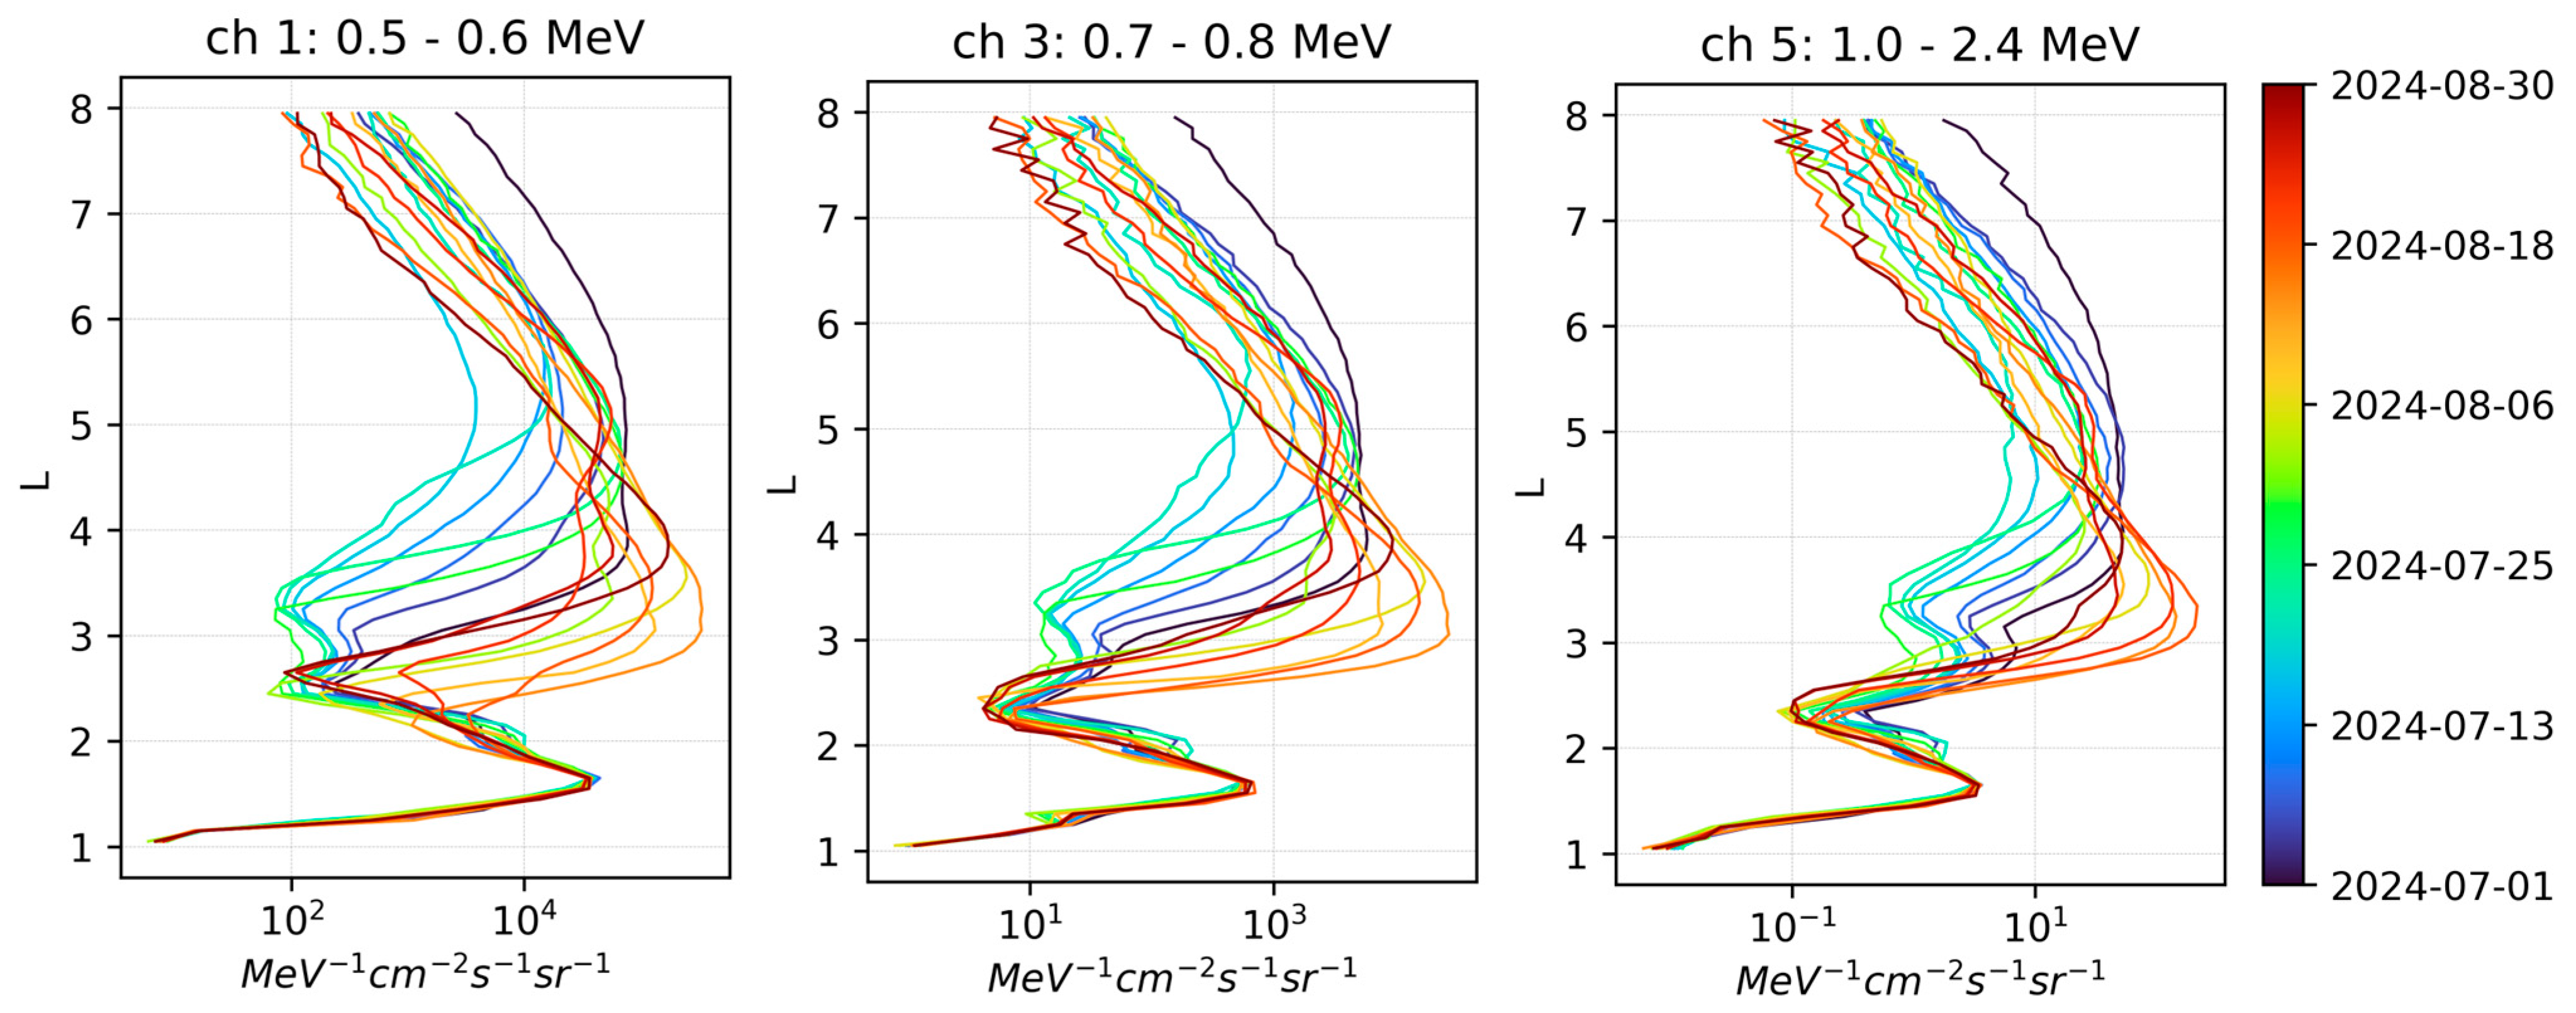
The bottom panels of Figure 3 illustrate the profiles from 1 July 2024 (black) to 30 August 2024 (dark red), after a new storm on 28 June 2024 injected electrons into the outer belt and into the main slot. Three belts remain visible in July (see blue to green profiles in the bottom panels) because, while the slot of the inner belt at L = 1.85 has disappeared, the slot at L = 3.4 is formed again, showing a clear loss mechanism at this L value. The fourth unexpected and temporary inner belt disappeared on 28 June 2024 after around 6 weeks.
The two other slots are thus again present in July at L = 2.35 and L = 3.4. The loss continues at these L even after the end of the June event. It is only in August (see orange profiles) that another injection fills the upper slot that disappears after this event. The loss at 2 < L < 3 continues to form the usual slot, leaving on 30 August 2024 (see dark red line) 2 normal belts with maximum around L = 1.7 and L = 4.

3.4. Three Belts After the 10 October 2024 Event

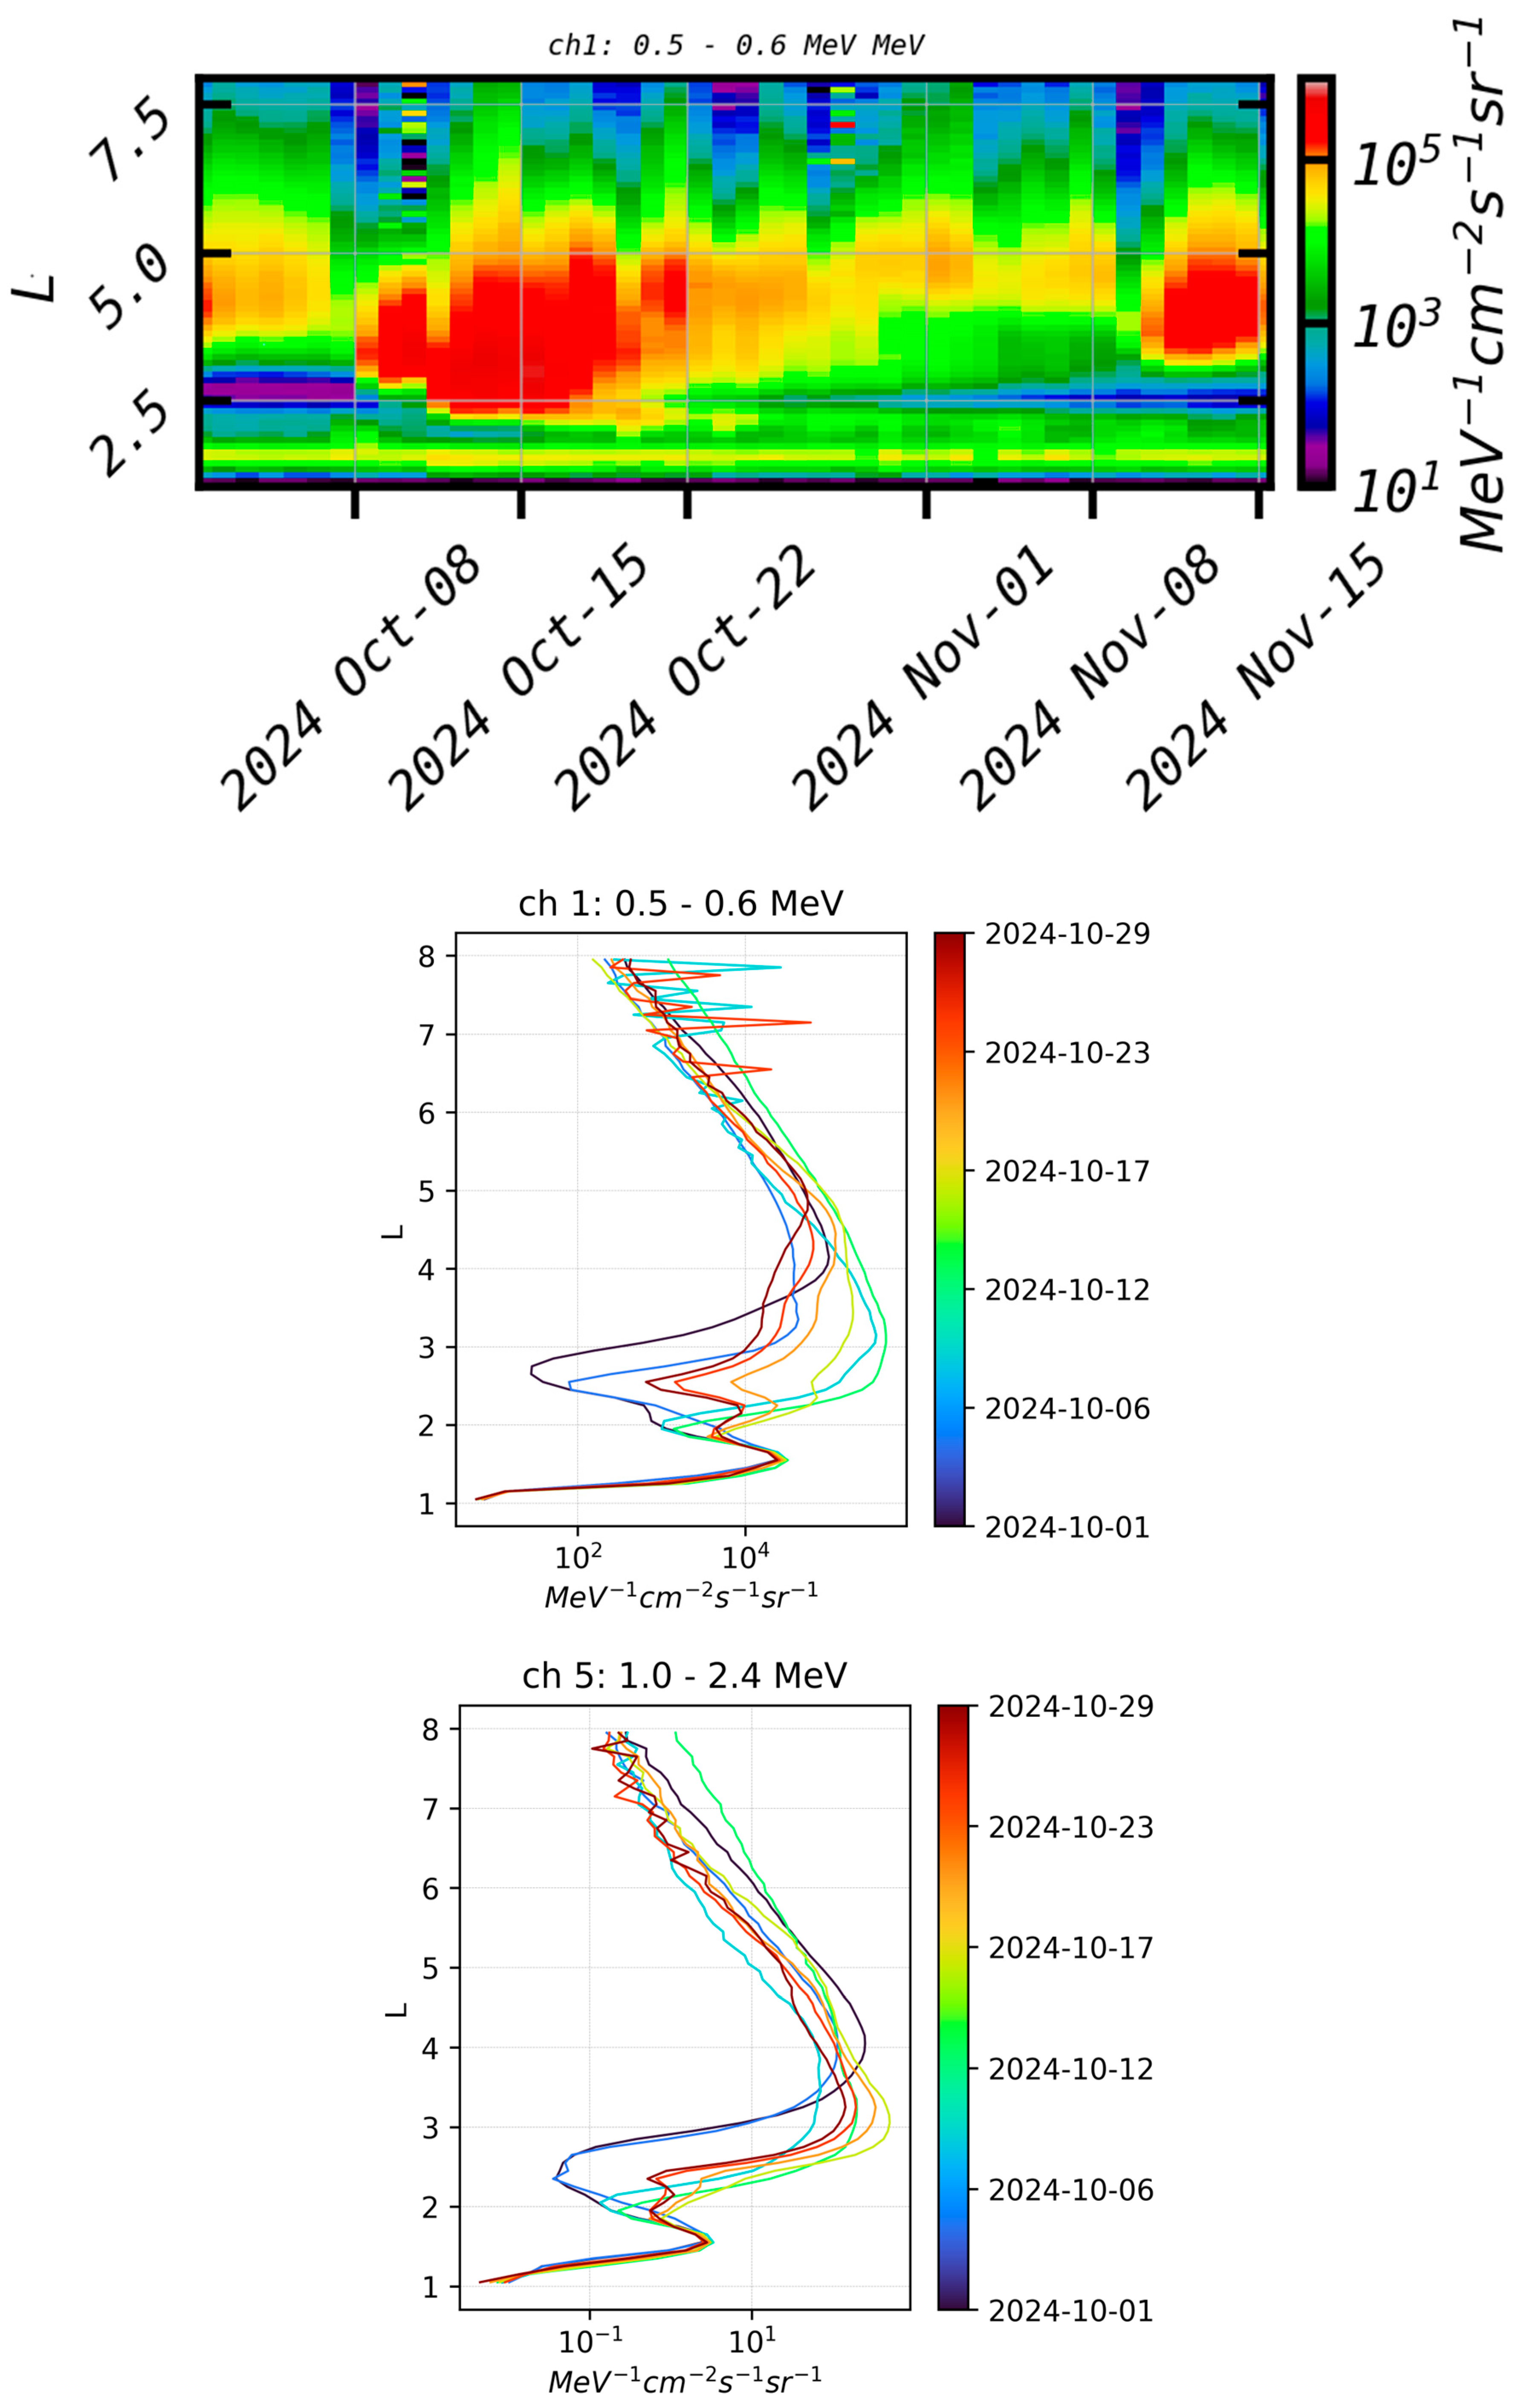
On 10 October 2024, a new big geomagnetic storm with Dst = −335 nT increased the fluxes in the slot and inner belt again, generating a third belt above L = 3 during a few weeks (see Figure 1 and Figure 4). This phenomenon also happened in June 2025.
The event of 10 October 2024, illustrated in Figure 4, shows that three belts were generated over more than 2 weeks. On 1 October 2024 (black line in bottom panels), two belts are well visible with maxima at L = 1.5 and L = 4 and a minimum (slot) at L = 2.8. The injection on 10 October decreases the position of the slot to L = 2 (see green profile) because the depth of the injection is limited to this distance located above the inner belt. A few days later, around 18 October, a new additional slot appears at L = 2.5 for 500–600 keV (L = 2.2 for 1–2.8 MeV) (see orange profile) and remains until the end of October 2024 (see red line). A clear decrease in the fluxes is also visible at L = 4, but it does not result in four belts.

3.5. Electron Lifetimes

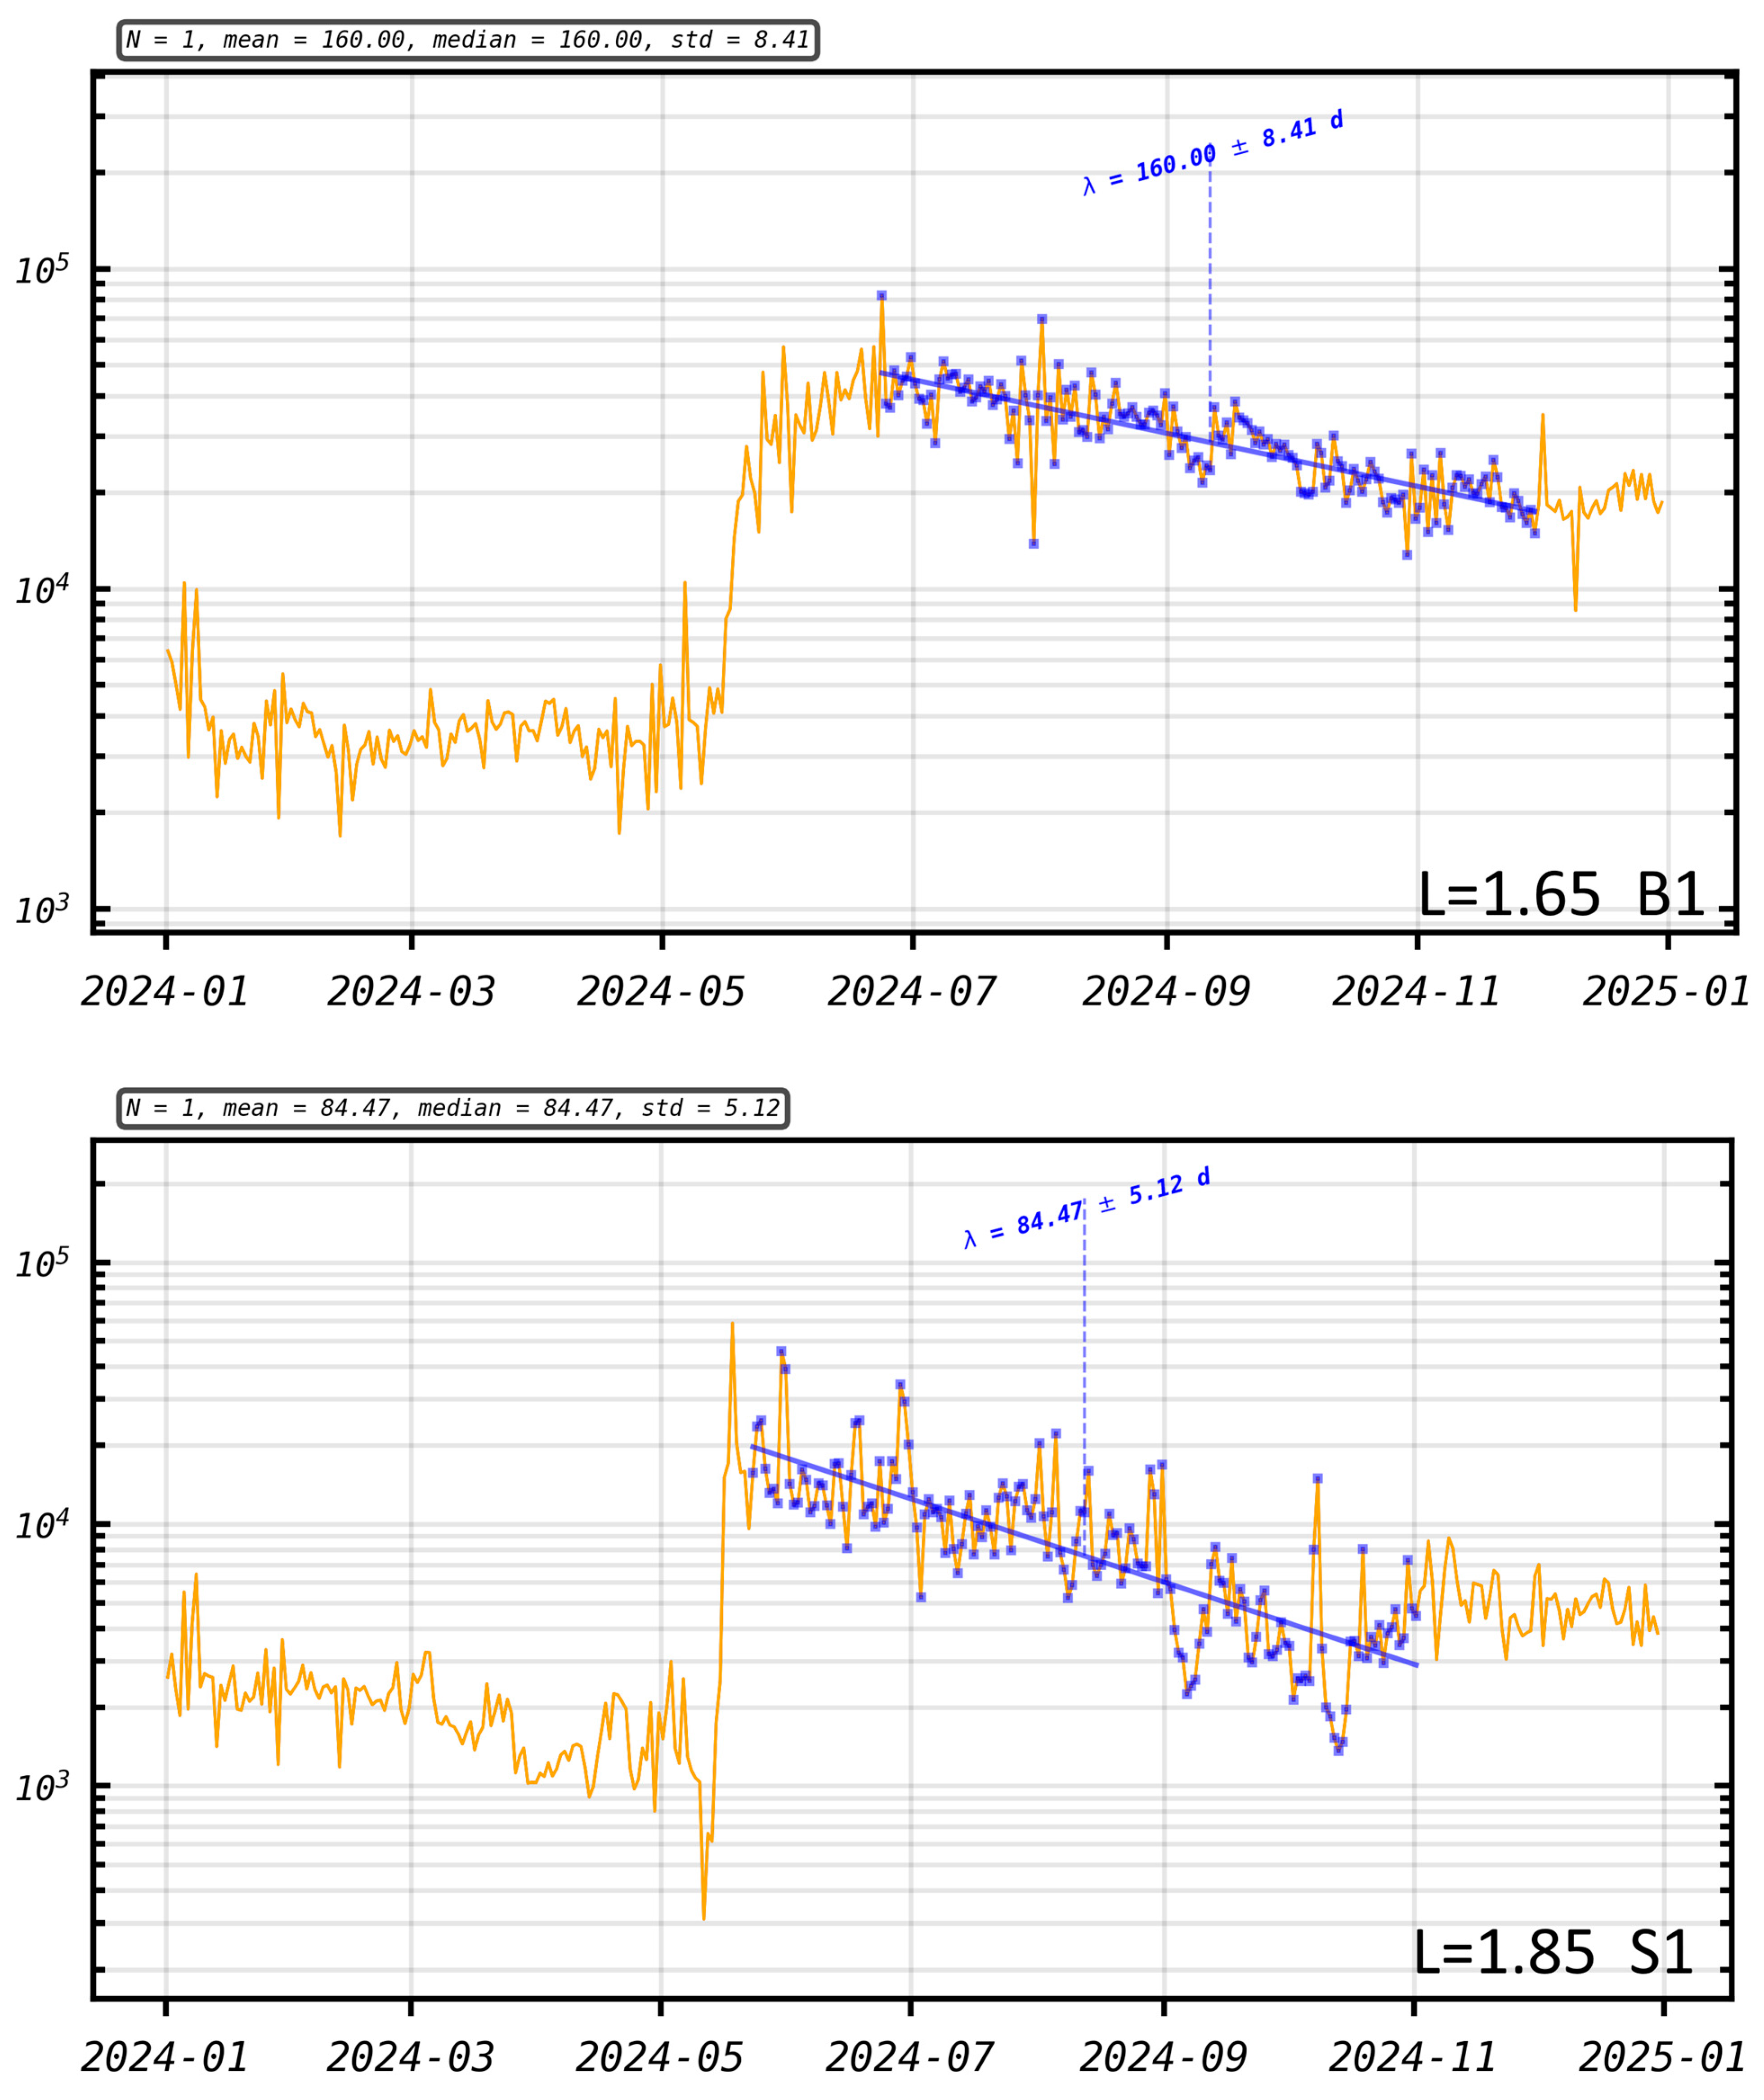
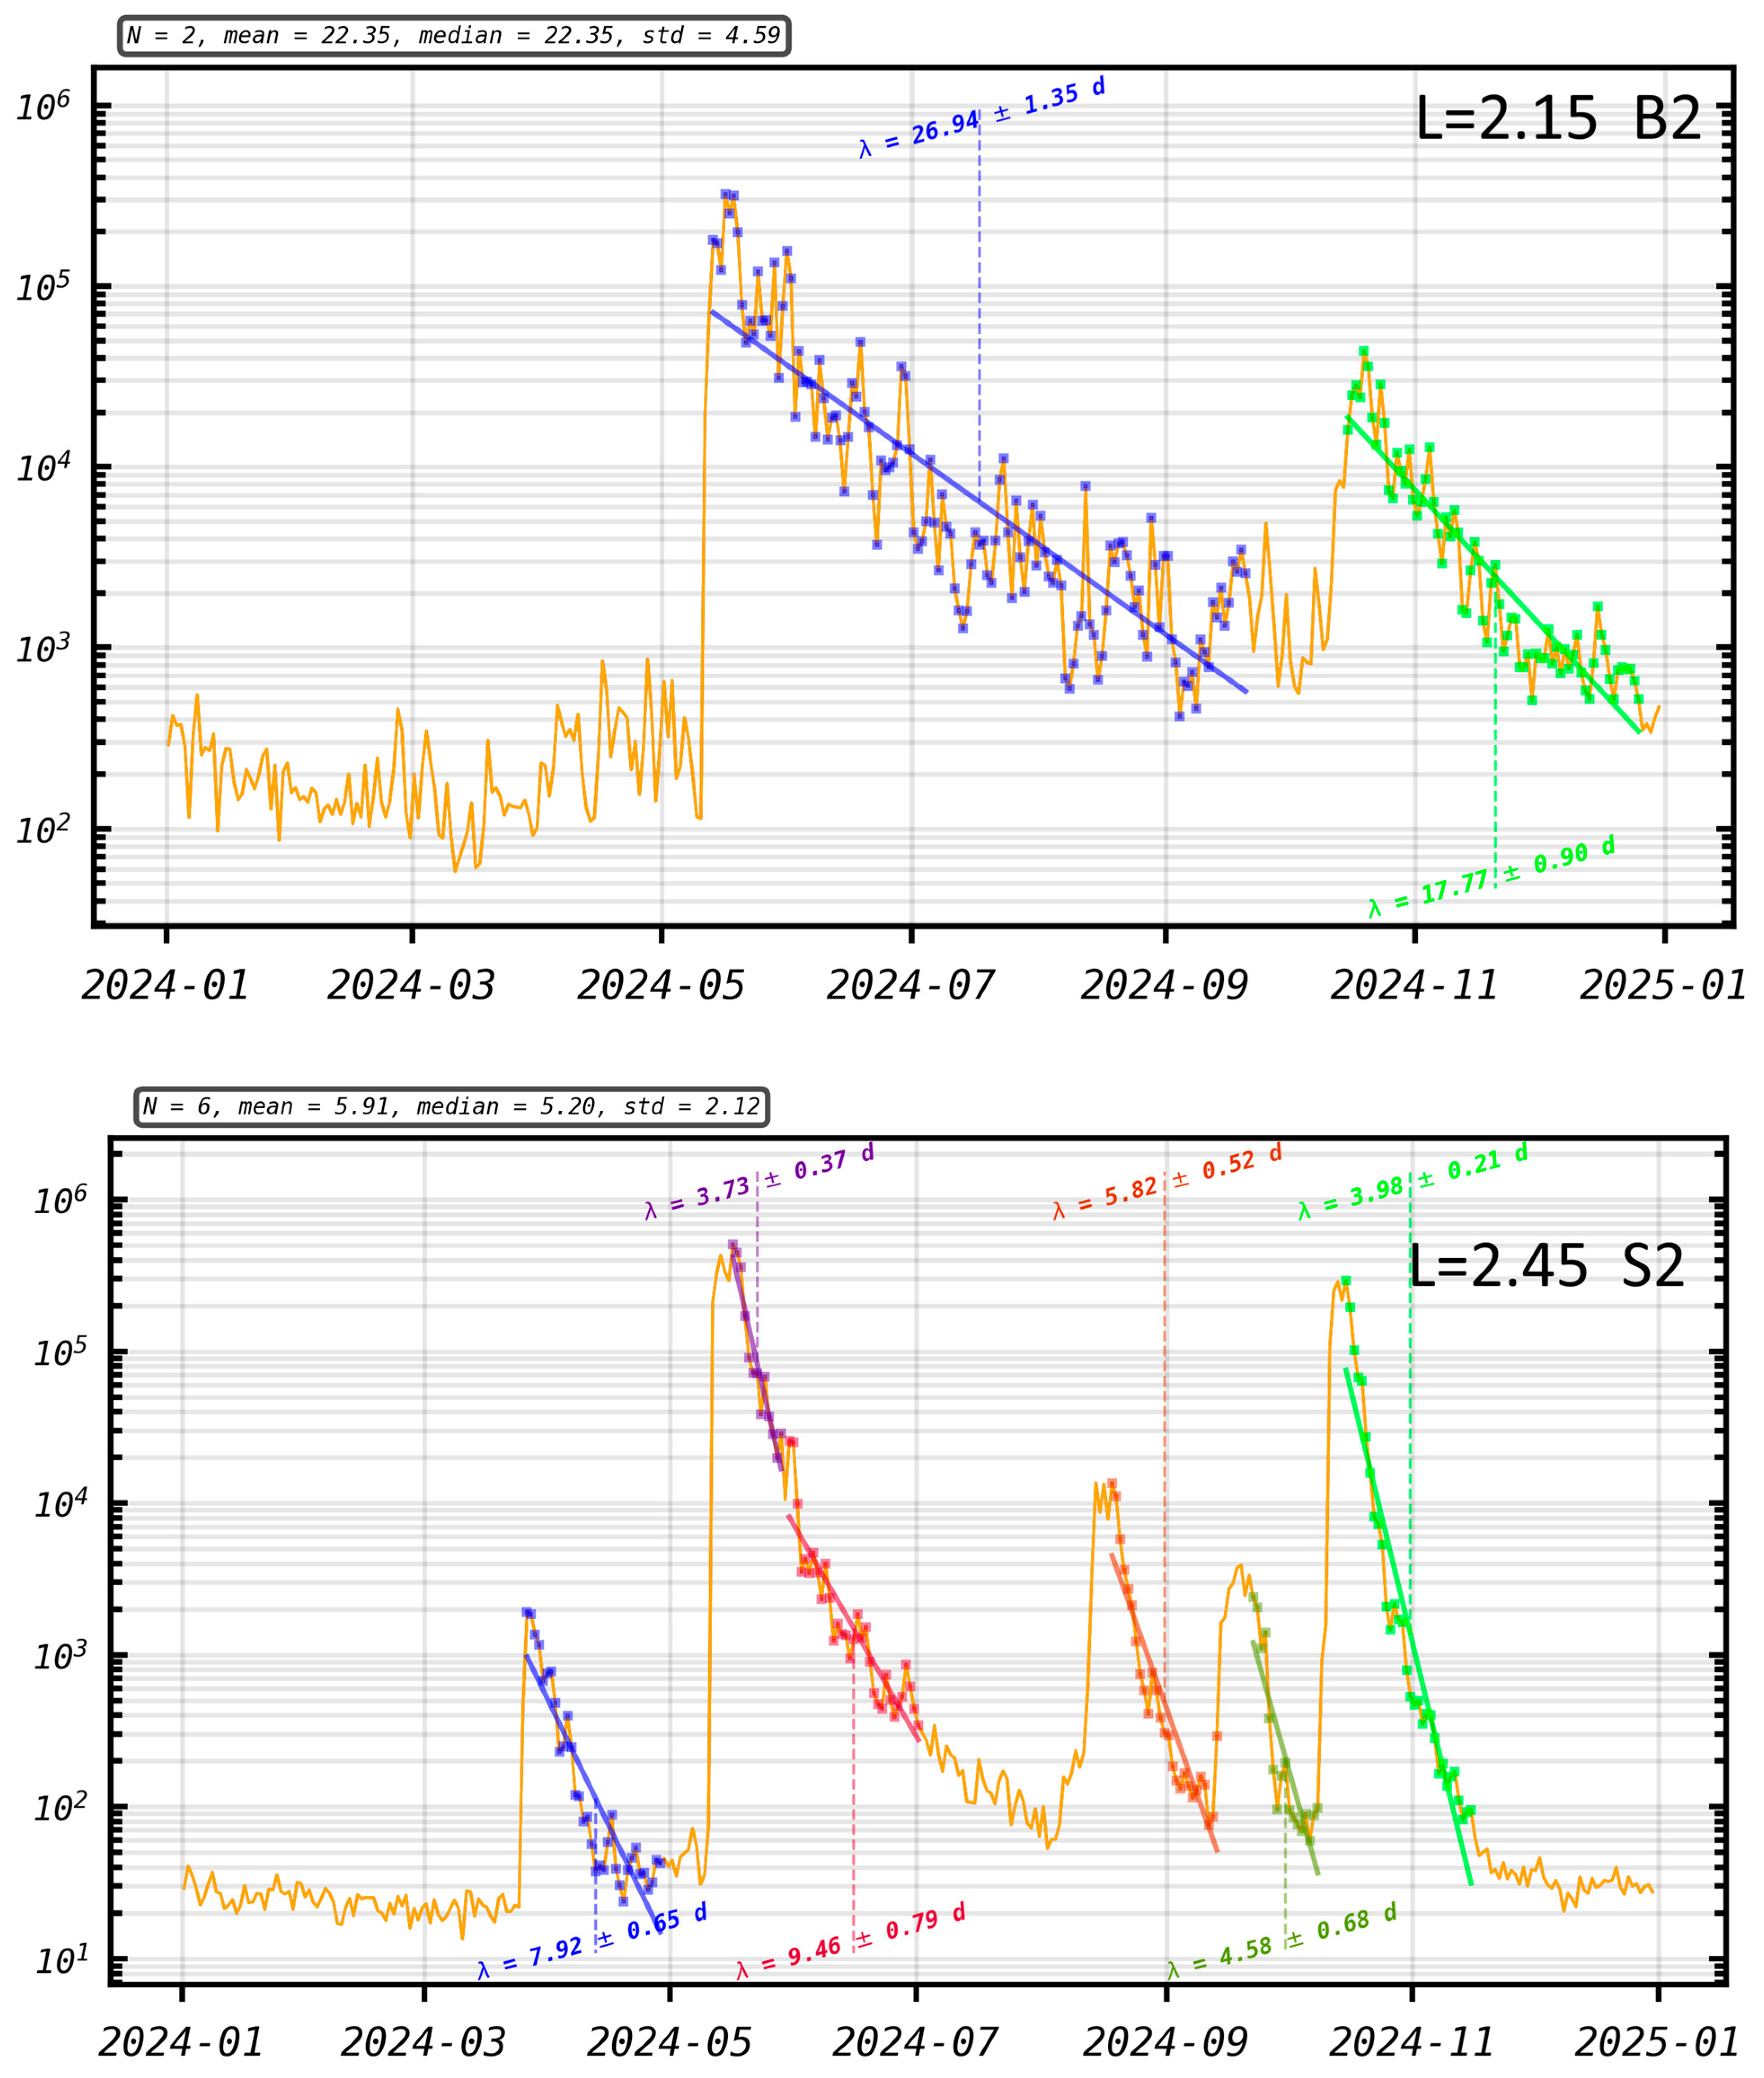
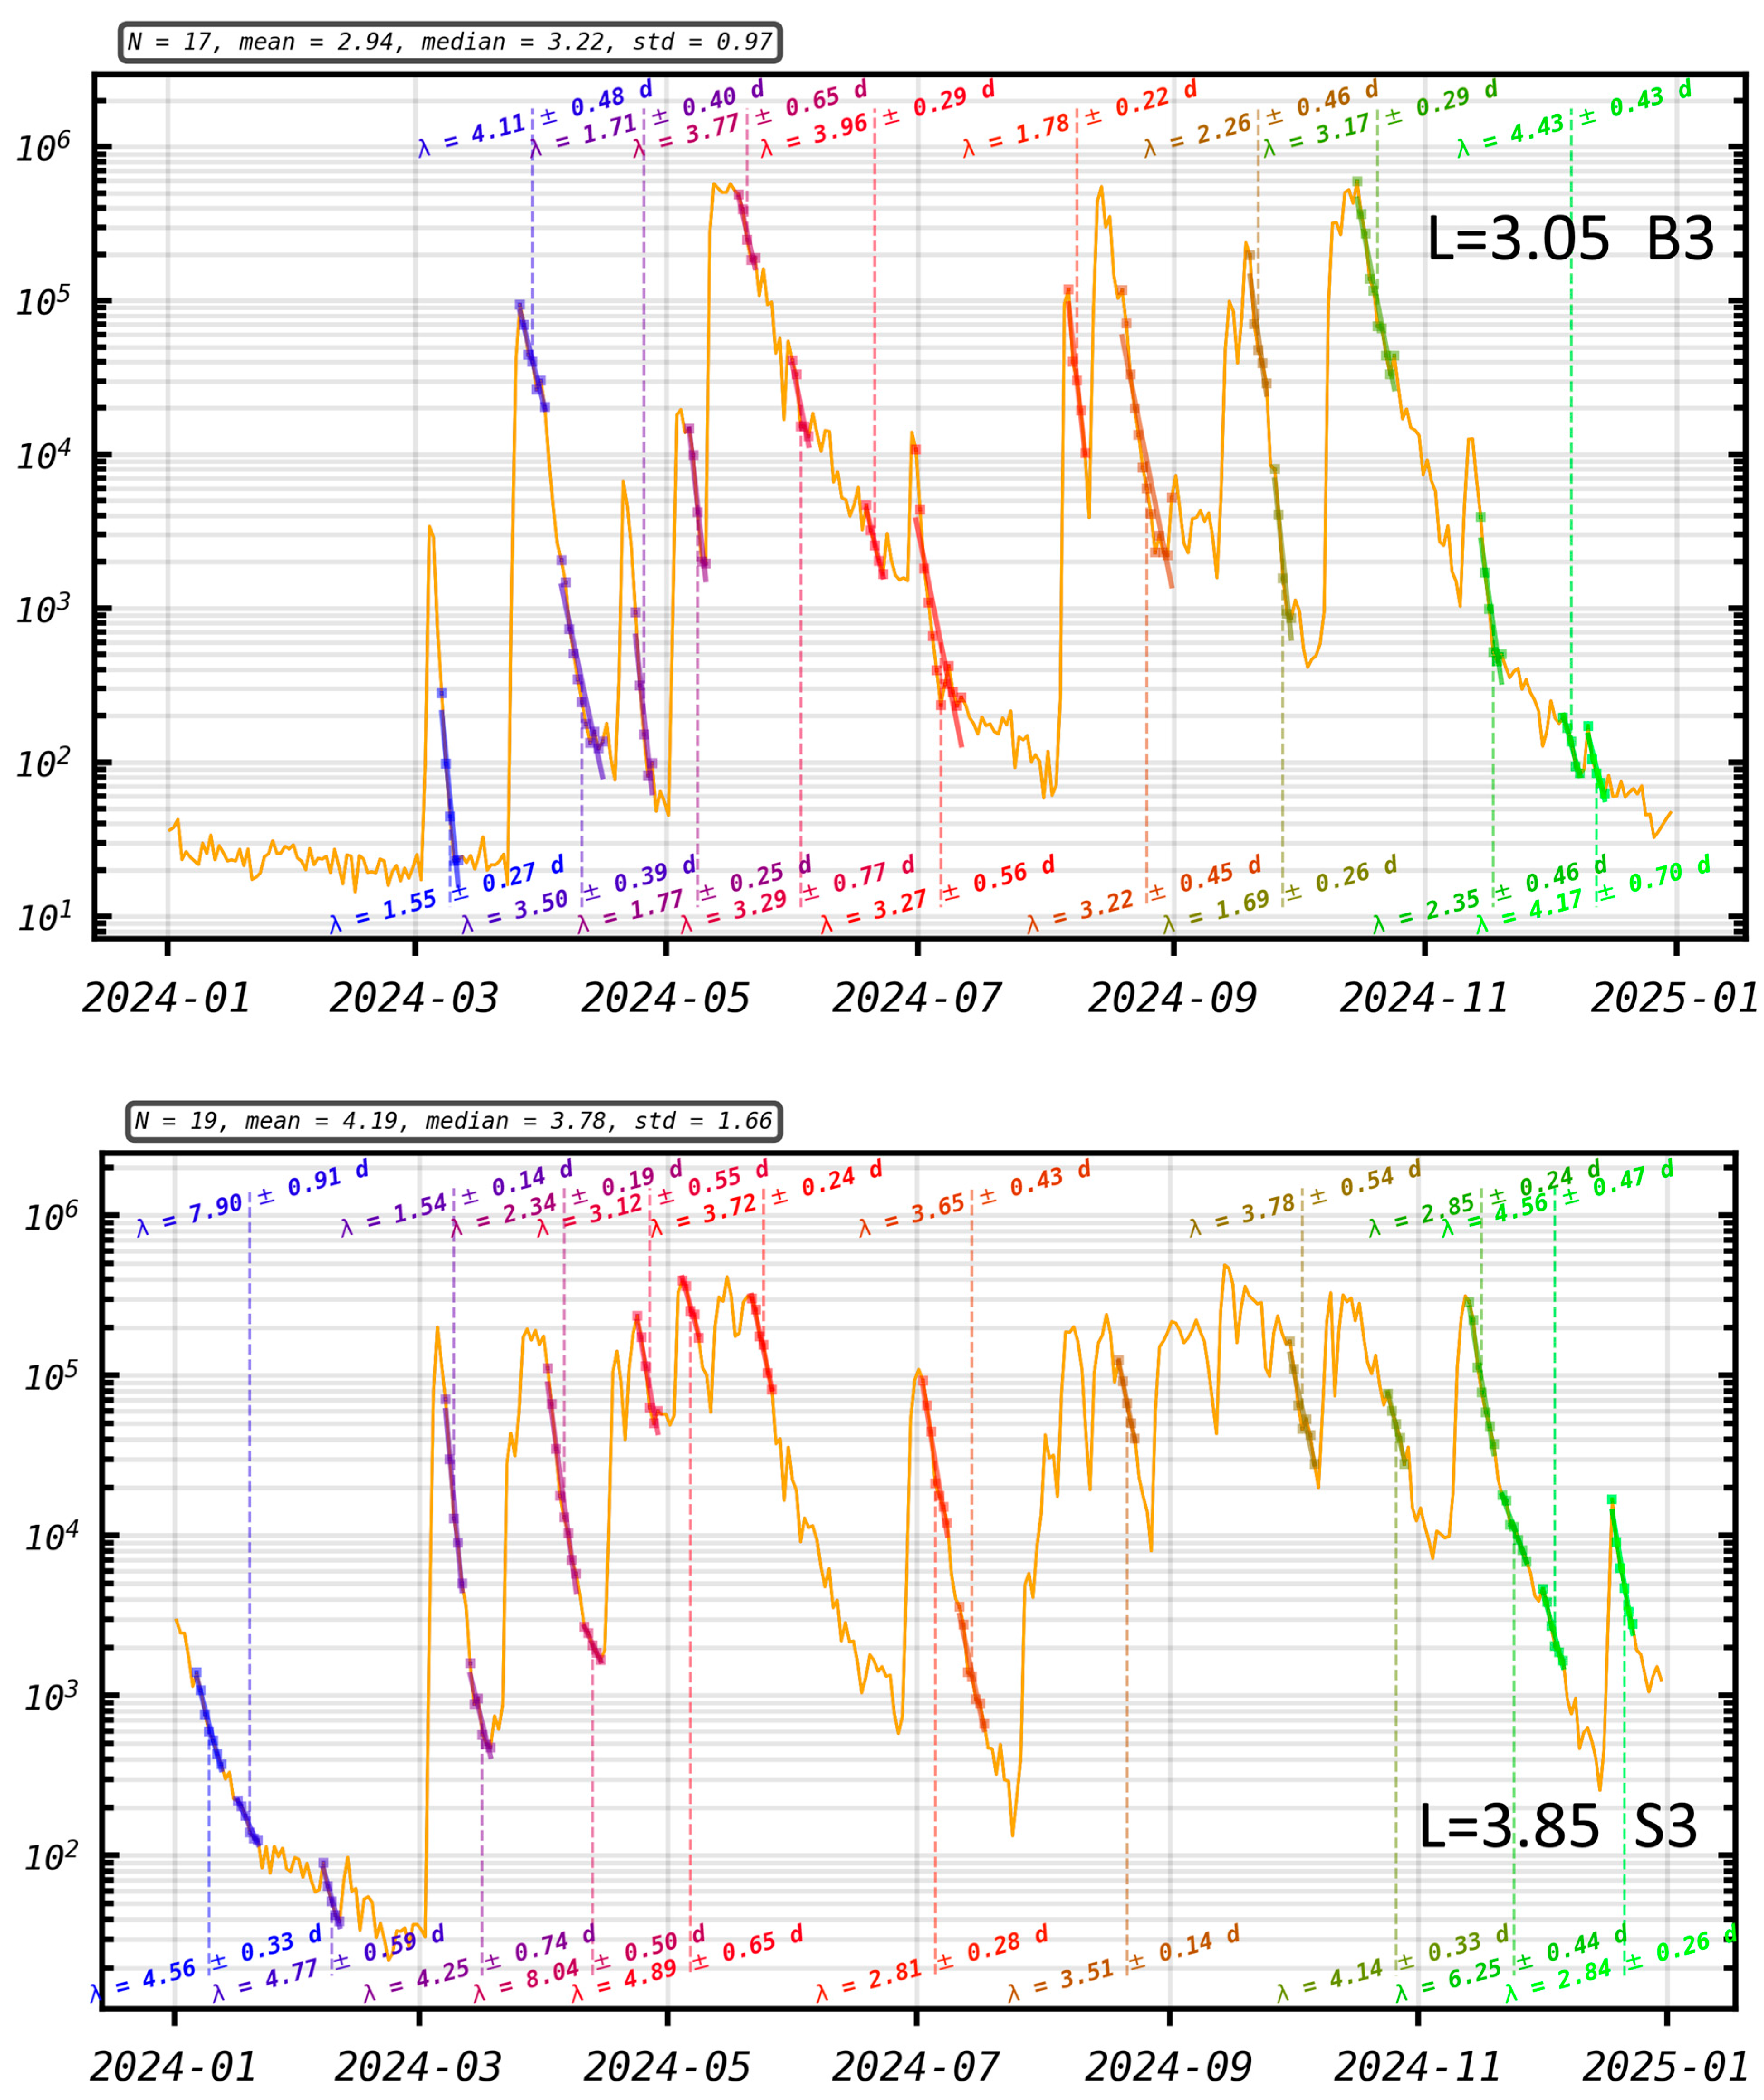
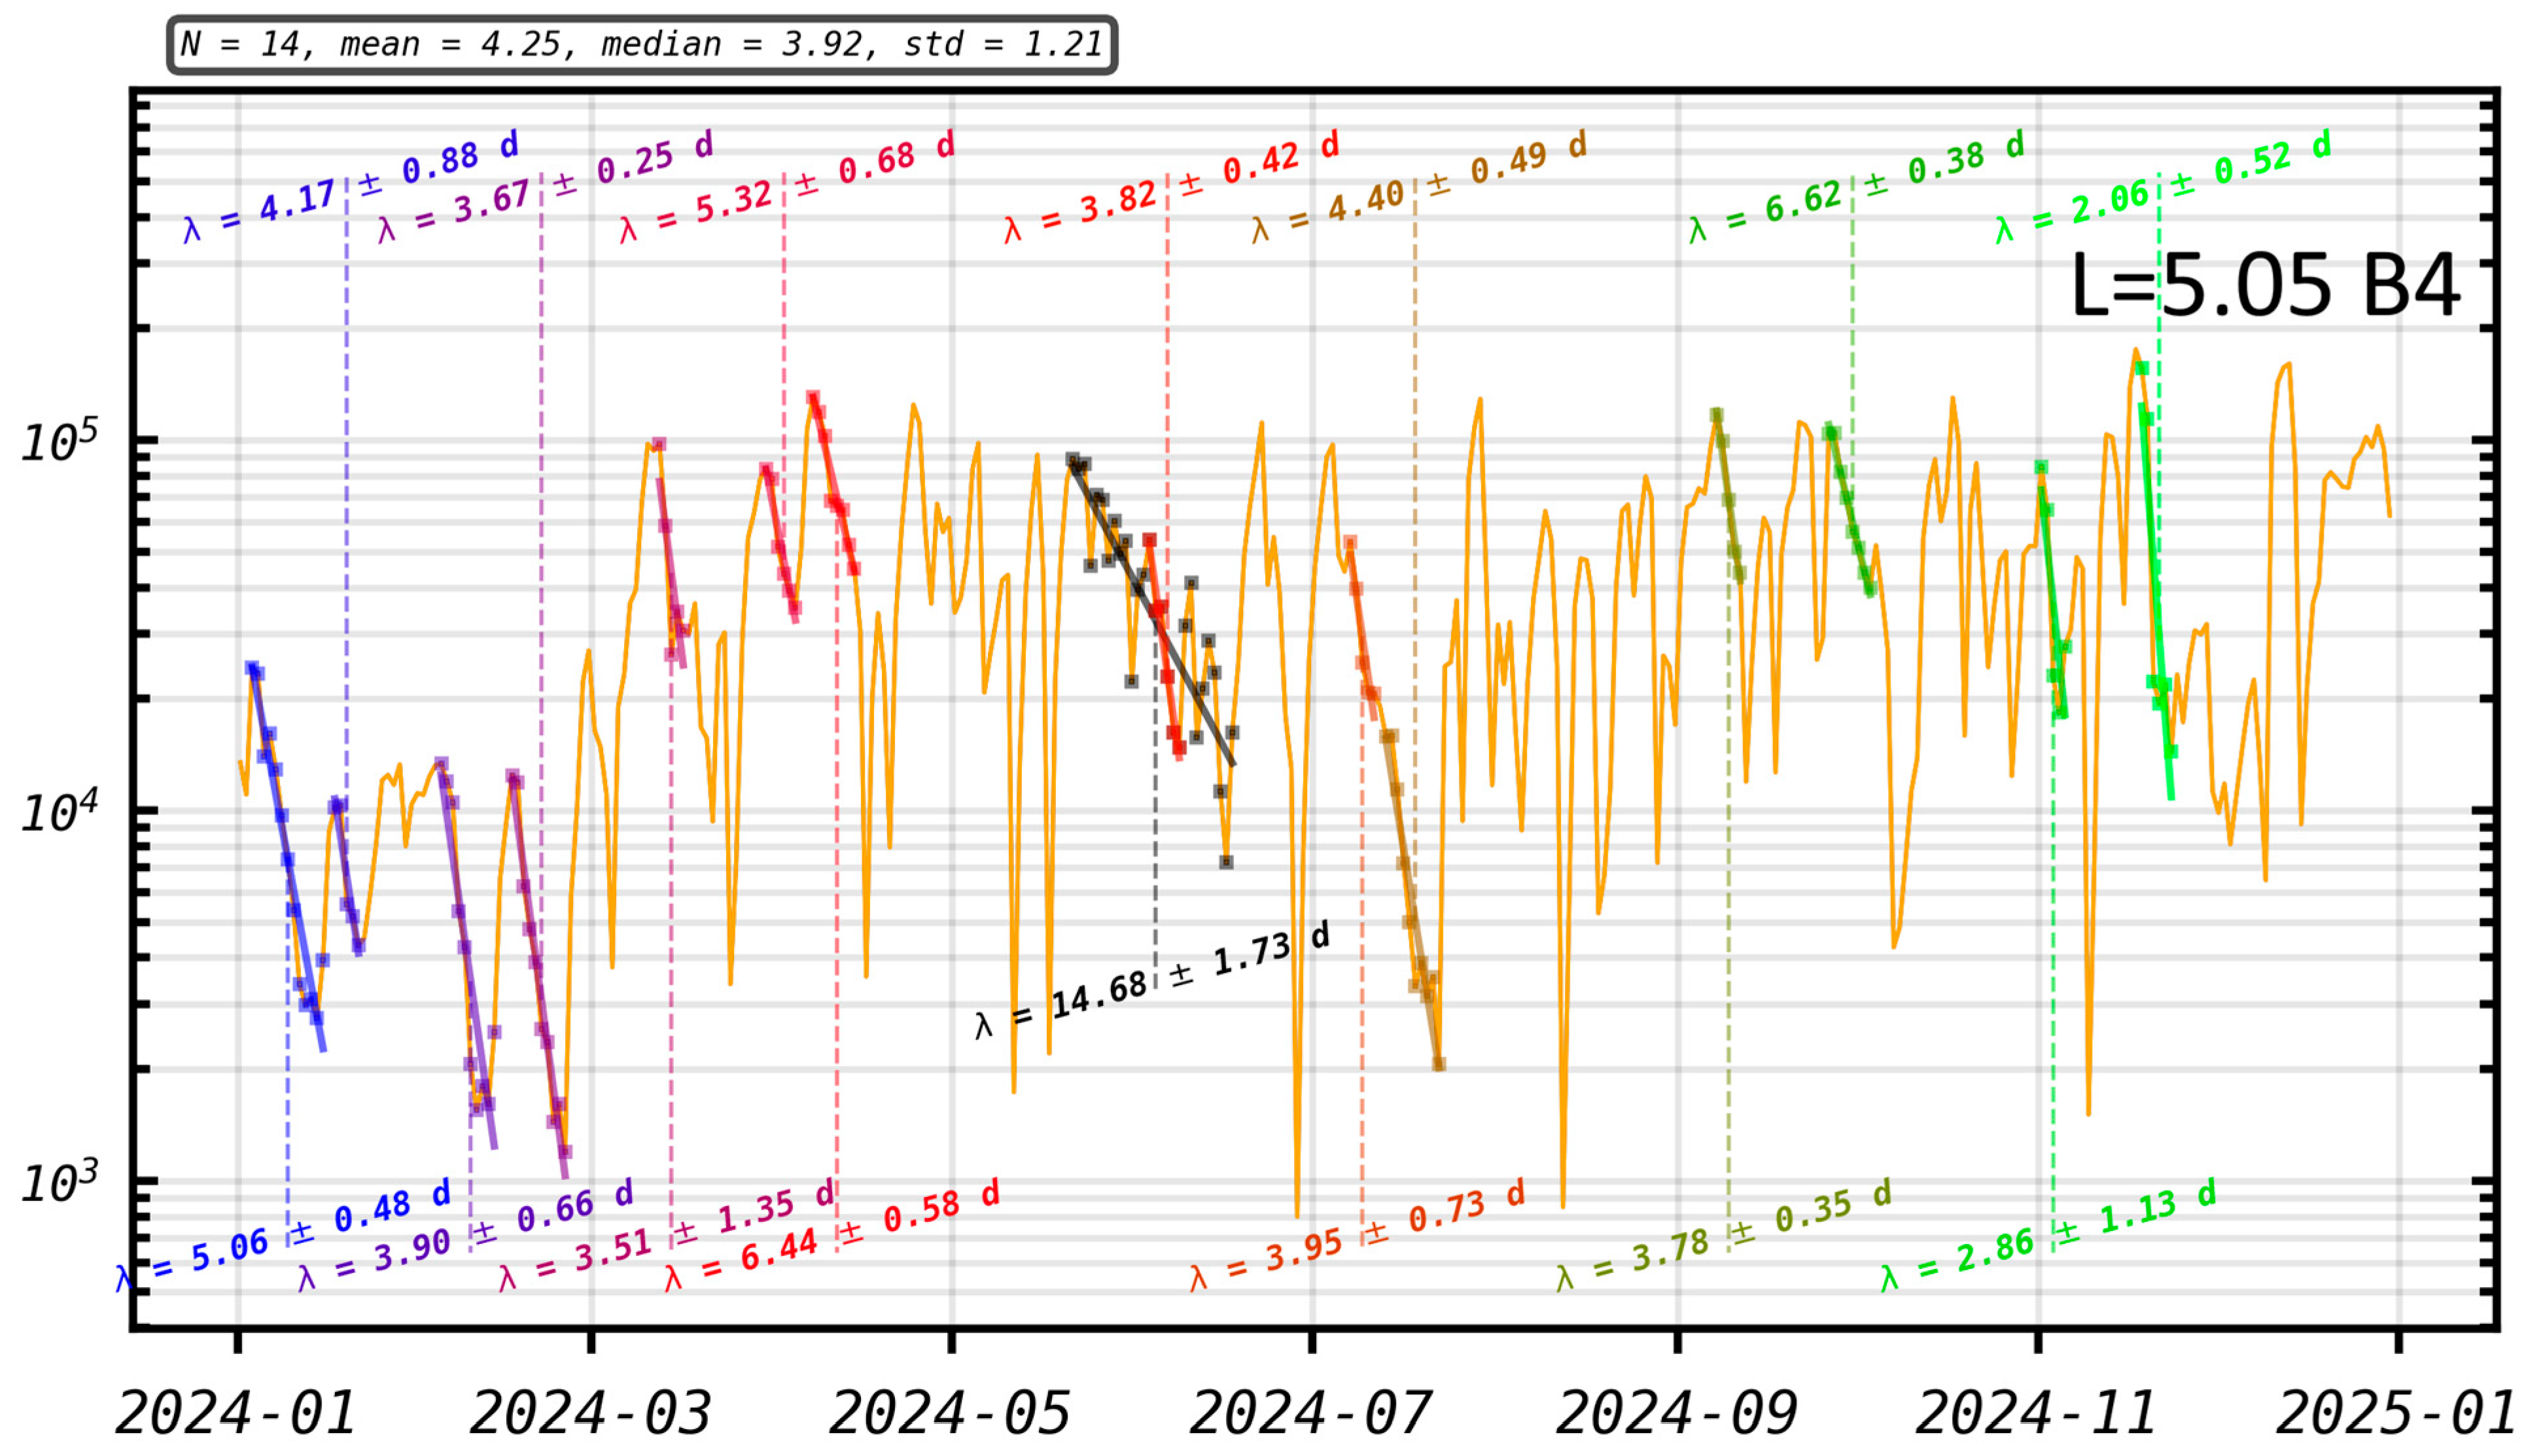
To characterize the loss of particles during the different events, it is useful to determine the lifetimes. Figure 5 presents the electron lifetimes around the maximum fluxes at L = 1.65 (panel 1), L = 2.15 (panel 3), L = 3.05 (panel 5), and L = 5.05 (panel 7) and around the minimum fluxes (slots) located at L = 1.85 (panel 2), 2.45 (panel 4) and 3.85 (panel 6).
Figure 5 shows clearly that injections are rare at low L (as expected, see, e.g., [21]). Only the strongest geomagnetic storm of 10 May 2024 (Dst = −412 nT) is visible for L = 1.65 in the inner belt, and in the unusual slot of the inner belt at L = 1.85. They are characterized by a sharp flux increase during the storm, followed by a progressive decrease with very long lifetimes, more than 160 days in the inner belt at L = 1.65. The fluxes are assumed to decay exponentially to the quiet time level after the event. Therefore, the lifetimes are obtained by fitting a linear function to the logarithm of the fluxes, and the results are shown in Figure 5.
At L = 2.15, i.e., at the unusual maximum, the event of 10 October 2024 (Dst < −300 nT) is visible as well. This enables us to see that the lifetime is longer (26.9 days) in May than in October 2024 (17.8 days).
At higher L, flux increases are more frequent and associated with geomagnetic storms, as already shown for previous years in [21]. At L = 2.45, the flux is at a minimum because the lifetime after the Mother’s Day event is shorter during the first days (3.73 days) and longer later (9.46 days), so that a linear regression in logarithmic scale is not the most appropriate fit in this particular case. A decreasing exponential could be better just for this sample. For the 6 events, the average lifetime corresponds to 5.9 days. The lifetimes seem shorter when the flux is high, which is an interesting characteristic to understand the loss mechanism at this slot.
At L = 3.05, the flux is maximum because the lifetime is longer than the average (3.8 days instead of 2.9 days on average based on 17 events). When there are long periods without flux increase due to a new storm, the lifetime becomes much longer than just after the injection.
At L = 3.85 (minimum), many events occur, yet Mother’s Day does not appear to be special, except in that the lifetime is shorter (3.7 days) than average (4.2 days).
At L = 5.05, in the outer belt, there are so many sharp flux variations that the calculation of the slopes becomes difficult. The decreases are nevertheless sufficiently fast to be determined: 4.3 days on average. After the May 2024 event, the flux decrease is nevertheless much longer, with a lifetime of 14.7 days shown by the black fit, even if the measured flux is quite unstable and has many small peaks. This lifetime after 11 May is much longer than usual (4.3 on average), which explains the fourth belt remaining there.
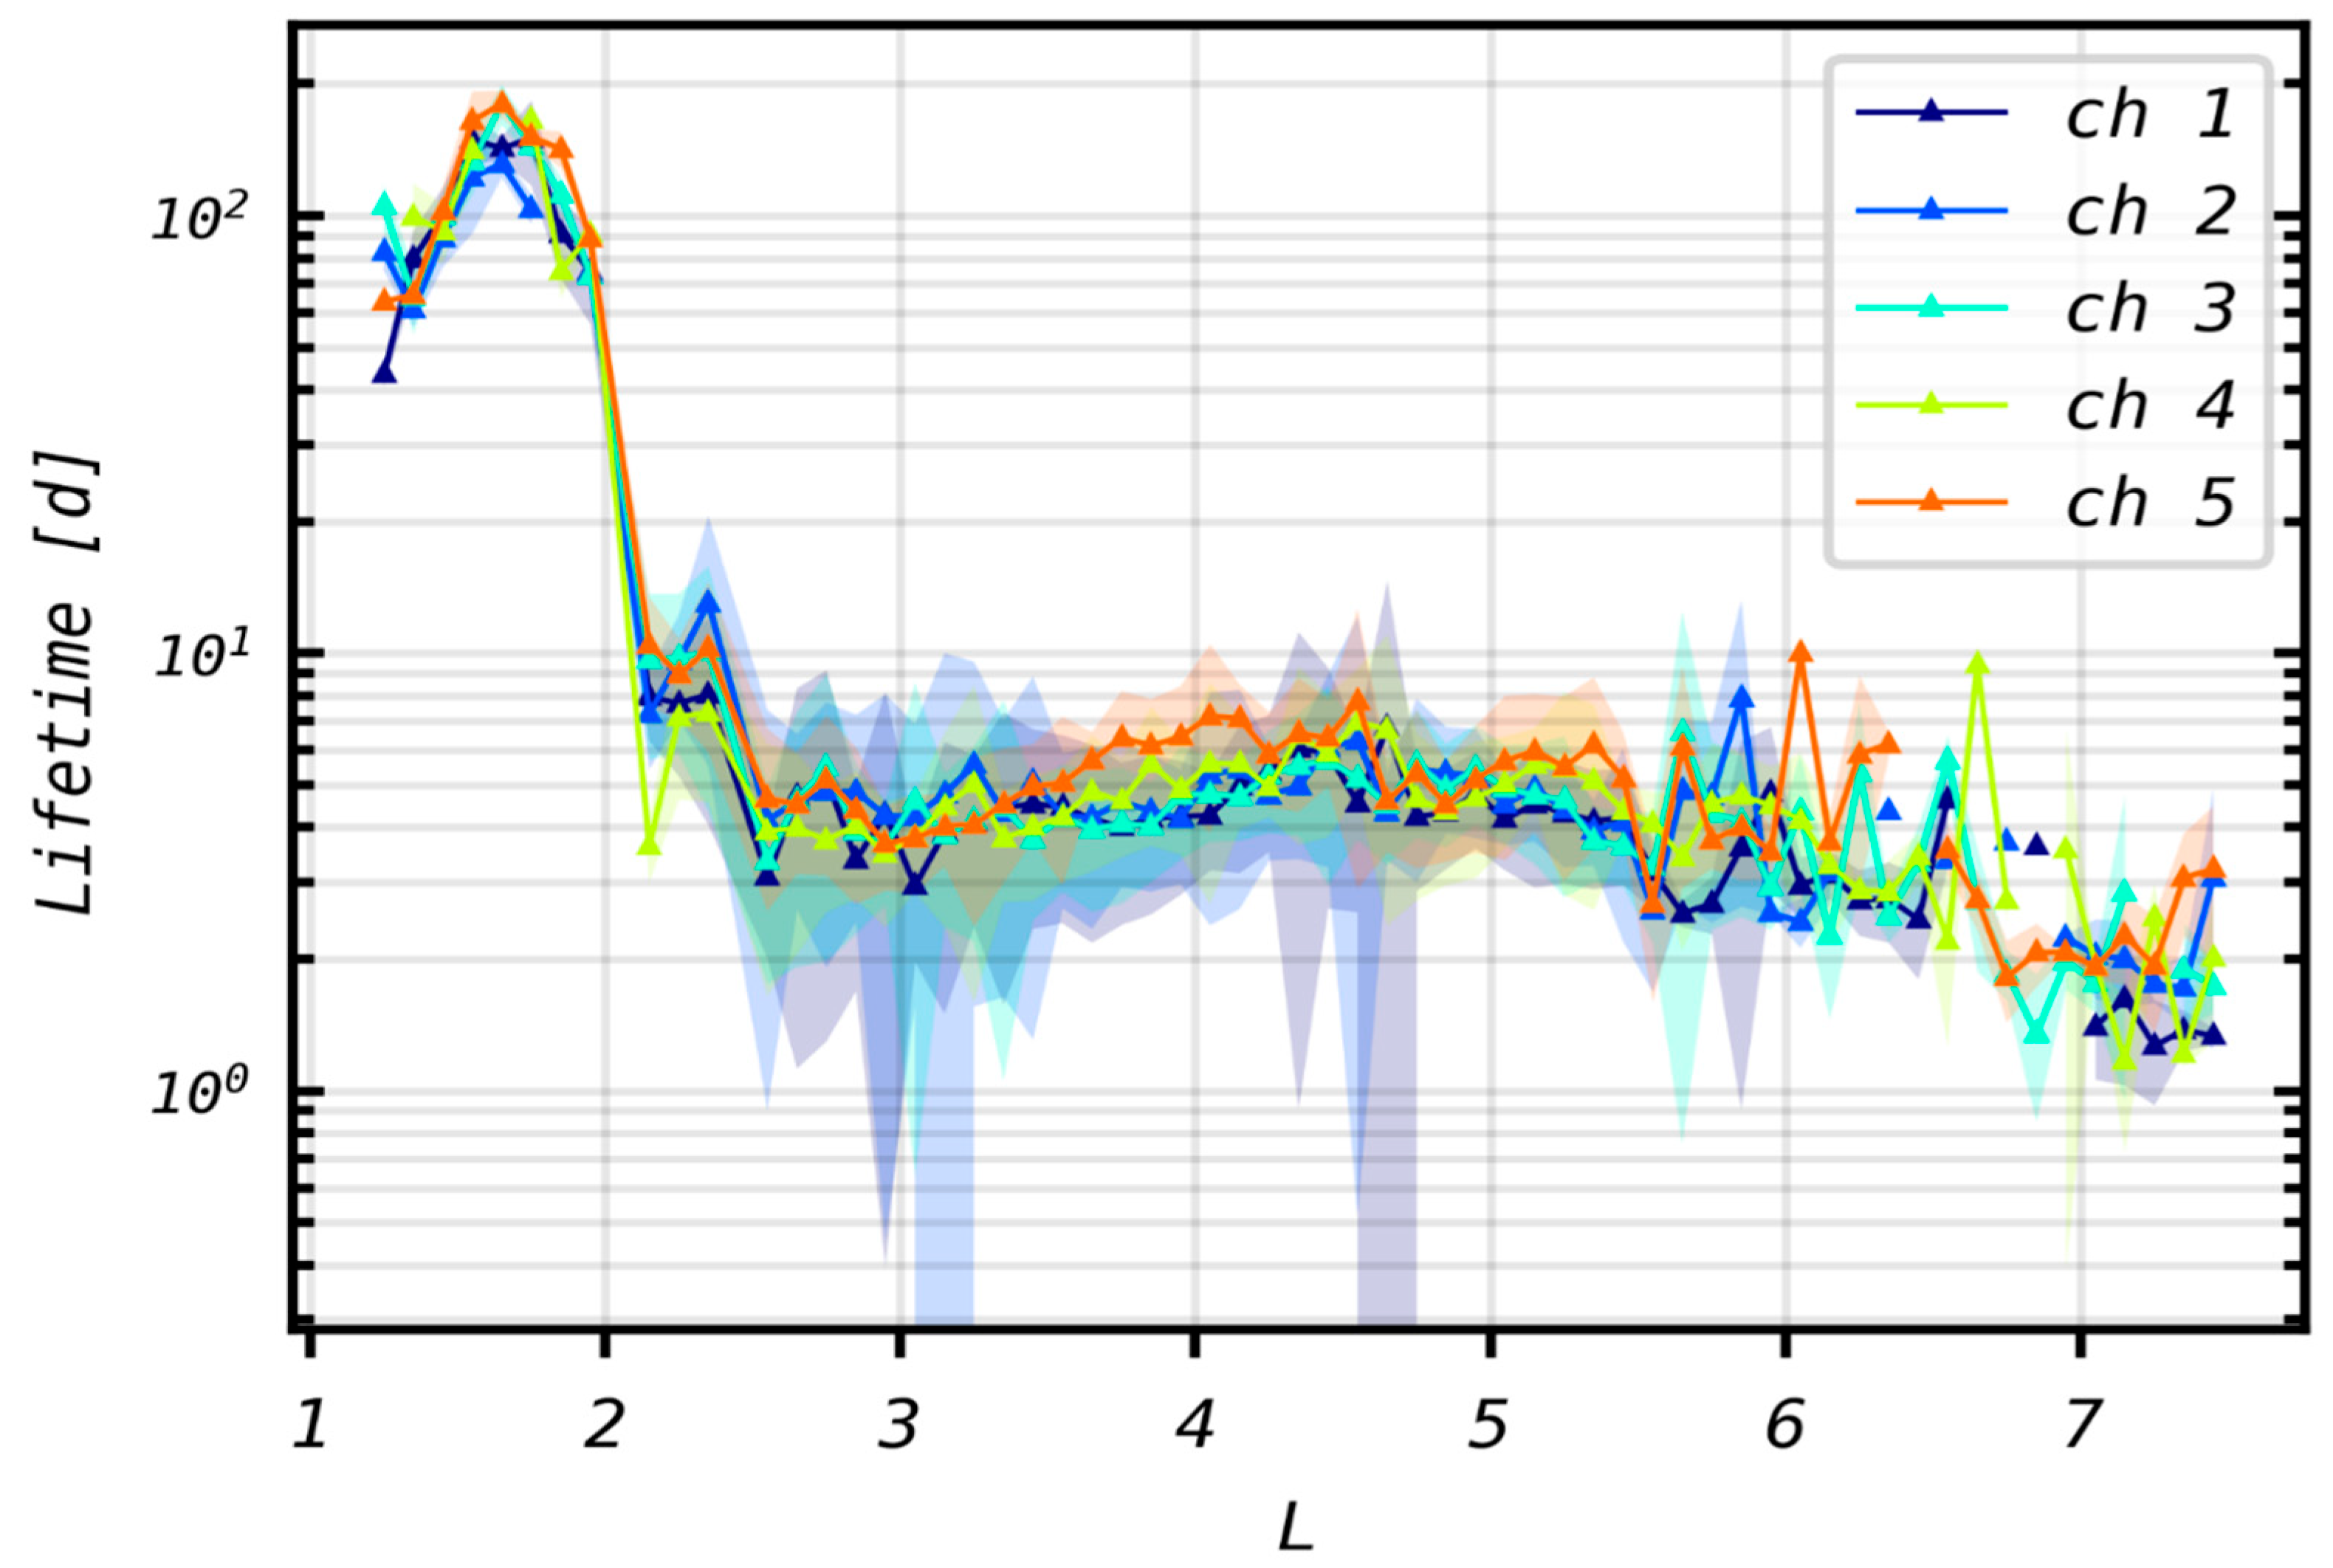
The mean lifetimes obtained with EPT measurements in 2024 for 500–600 keV are summarized in Table 1 as a function of L and represented in Figure 6 for the five energy ranges. In Table 1, they are also compared to the lifetimes observed after the 11 May 2024 event, and it becomes clear that the latest ones are larger than the mean lifetimes of 2024 in the regions where belts are formed (B2, B3 and B4), while it is the contrary in the slots (S2 and S3), which explains the formation of the four belts. For B1 and S1, no other event reaches such a low L, so no comparison is possible.
From Figure 6, illustrating the mean electron lifetimes as a function of L, one can see that the lifetime is high for L < 2 (>100 days) and decreases to a minimum of 3 days at L = 2.6 for all channels. The lifetime increases to 5–6 days at L = 4, corresponding to the outer belt, and then decreases to less than 2 days at L = 7. The mean lifetimes are slightly longer for higher energy, especially for E > 1 MeV (Ch5 in orange), with higher error bars in the regions with lower fluxes. The time period to calculate the average extends from 1 January 2024 to 1 January 2025 to have enough data. The results are in good agreement with previous lifetimes determined from other satellite observations on other orbits [13,14], with energy-dependent lifetimes that are very long in the inner zone, shorter in the slot region, and slightly higher in the outer zone, indicative of different loss mechanisms.

3.6. Discussion About the Loss Mechanisms

From the two events of May and October 2024, one can see that the usual slot (around L = 2.5) reappears typically 10 days after it is filled by the storm injection. Plasmaspheric hiss waves trapped inside the plasmasphere are expected to be responsible for the pitch angle scattering of electrons and their subsequent loss in the atmosphere that leads to the formation of the usual slot region separating the inner and the outer electron belts (e.g., [26,27]). The flux decrease that generates the different slots also seems to be due to electron resonance with Very Low Frequency (VLF) waves. The frequency of hiss waves (200–5000 Hz) inside the plasmasphere region corresponds to the gyration frequency of the energetic electrons, so that these waves scatter the electrons and cause their loss in the atmosphere [28].
While hiss waves appear inside the plasmasphere where the density is high, chorus waves (100 Hz–5 kHz) and EMIC waves (0.1–5 Hz) appear mainly above and close to the plasmapause, where the background density is much lower. Chorus waves cause auroral precipitation of the particles [29] and local acceleration of electrons [30]. EMIC waves scatter electrons at the highest energies and L shells, reducing the lifetimes in the outer belt.
High-powered radio wave transmitters that are used to communicate with submarines can also enhance the loss of particles from the inner belt [31]. Several observations have demonstrated this anthropogenic (human) influence on the inner radiation belt, with ground-based VLF transmitter waves leading to enhanced scattering of electrons in a narrow L region [31]. VLF transmitter waves have a significant impact on the lifetimes in the inner zone, particularly at energies less than ~300 keV, but also at higher energies up to 800 keV. Highly localized transmitter waves can produce a local minimum in the lifetimes at L < 2.5 at the low energies (30–300 keV) [32], with a location of this local minimum moving to lower L as energy increases, consistent with expectations from the cyclotron resonance condition.
Coulomb scattering is known to contribute significantly to radiation belt electron loss at L < 2.5 and is the dominant scattering mechanism at L < 1.5 (e.g., [26]). While EMIC waves are important at higher energy (≳1 MeV) and higher L, Coulomb scattering and VLF transmitter scattering are important at lower L. Moreover, lightning whistlers (300–30,000 Hz) inside the plasmasphere can also cause loss of electrons at L < 3 [33,34,35].
Hiss waves, lightning whistlers, VLF from transmitters, EMIC waves, Coulomb scattering, and chorus waves constitute the majority of the relevant loss processes leading to pitch angle scattering of radiation belt electrons. The wave–particle interactions lead to both energization and scattering of high-energy electrons, influencing the number and energy of electrons trapped in Earth’s radiation belts.

4. Proton Flux Variations Observed by EPT

4.1. Long-Term Variations

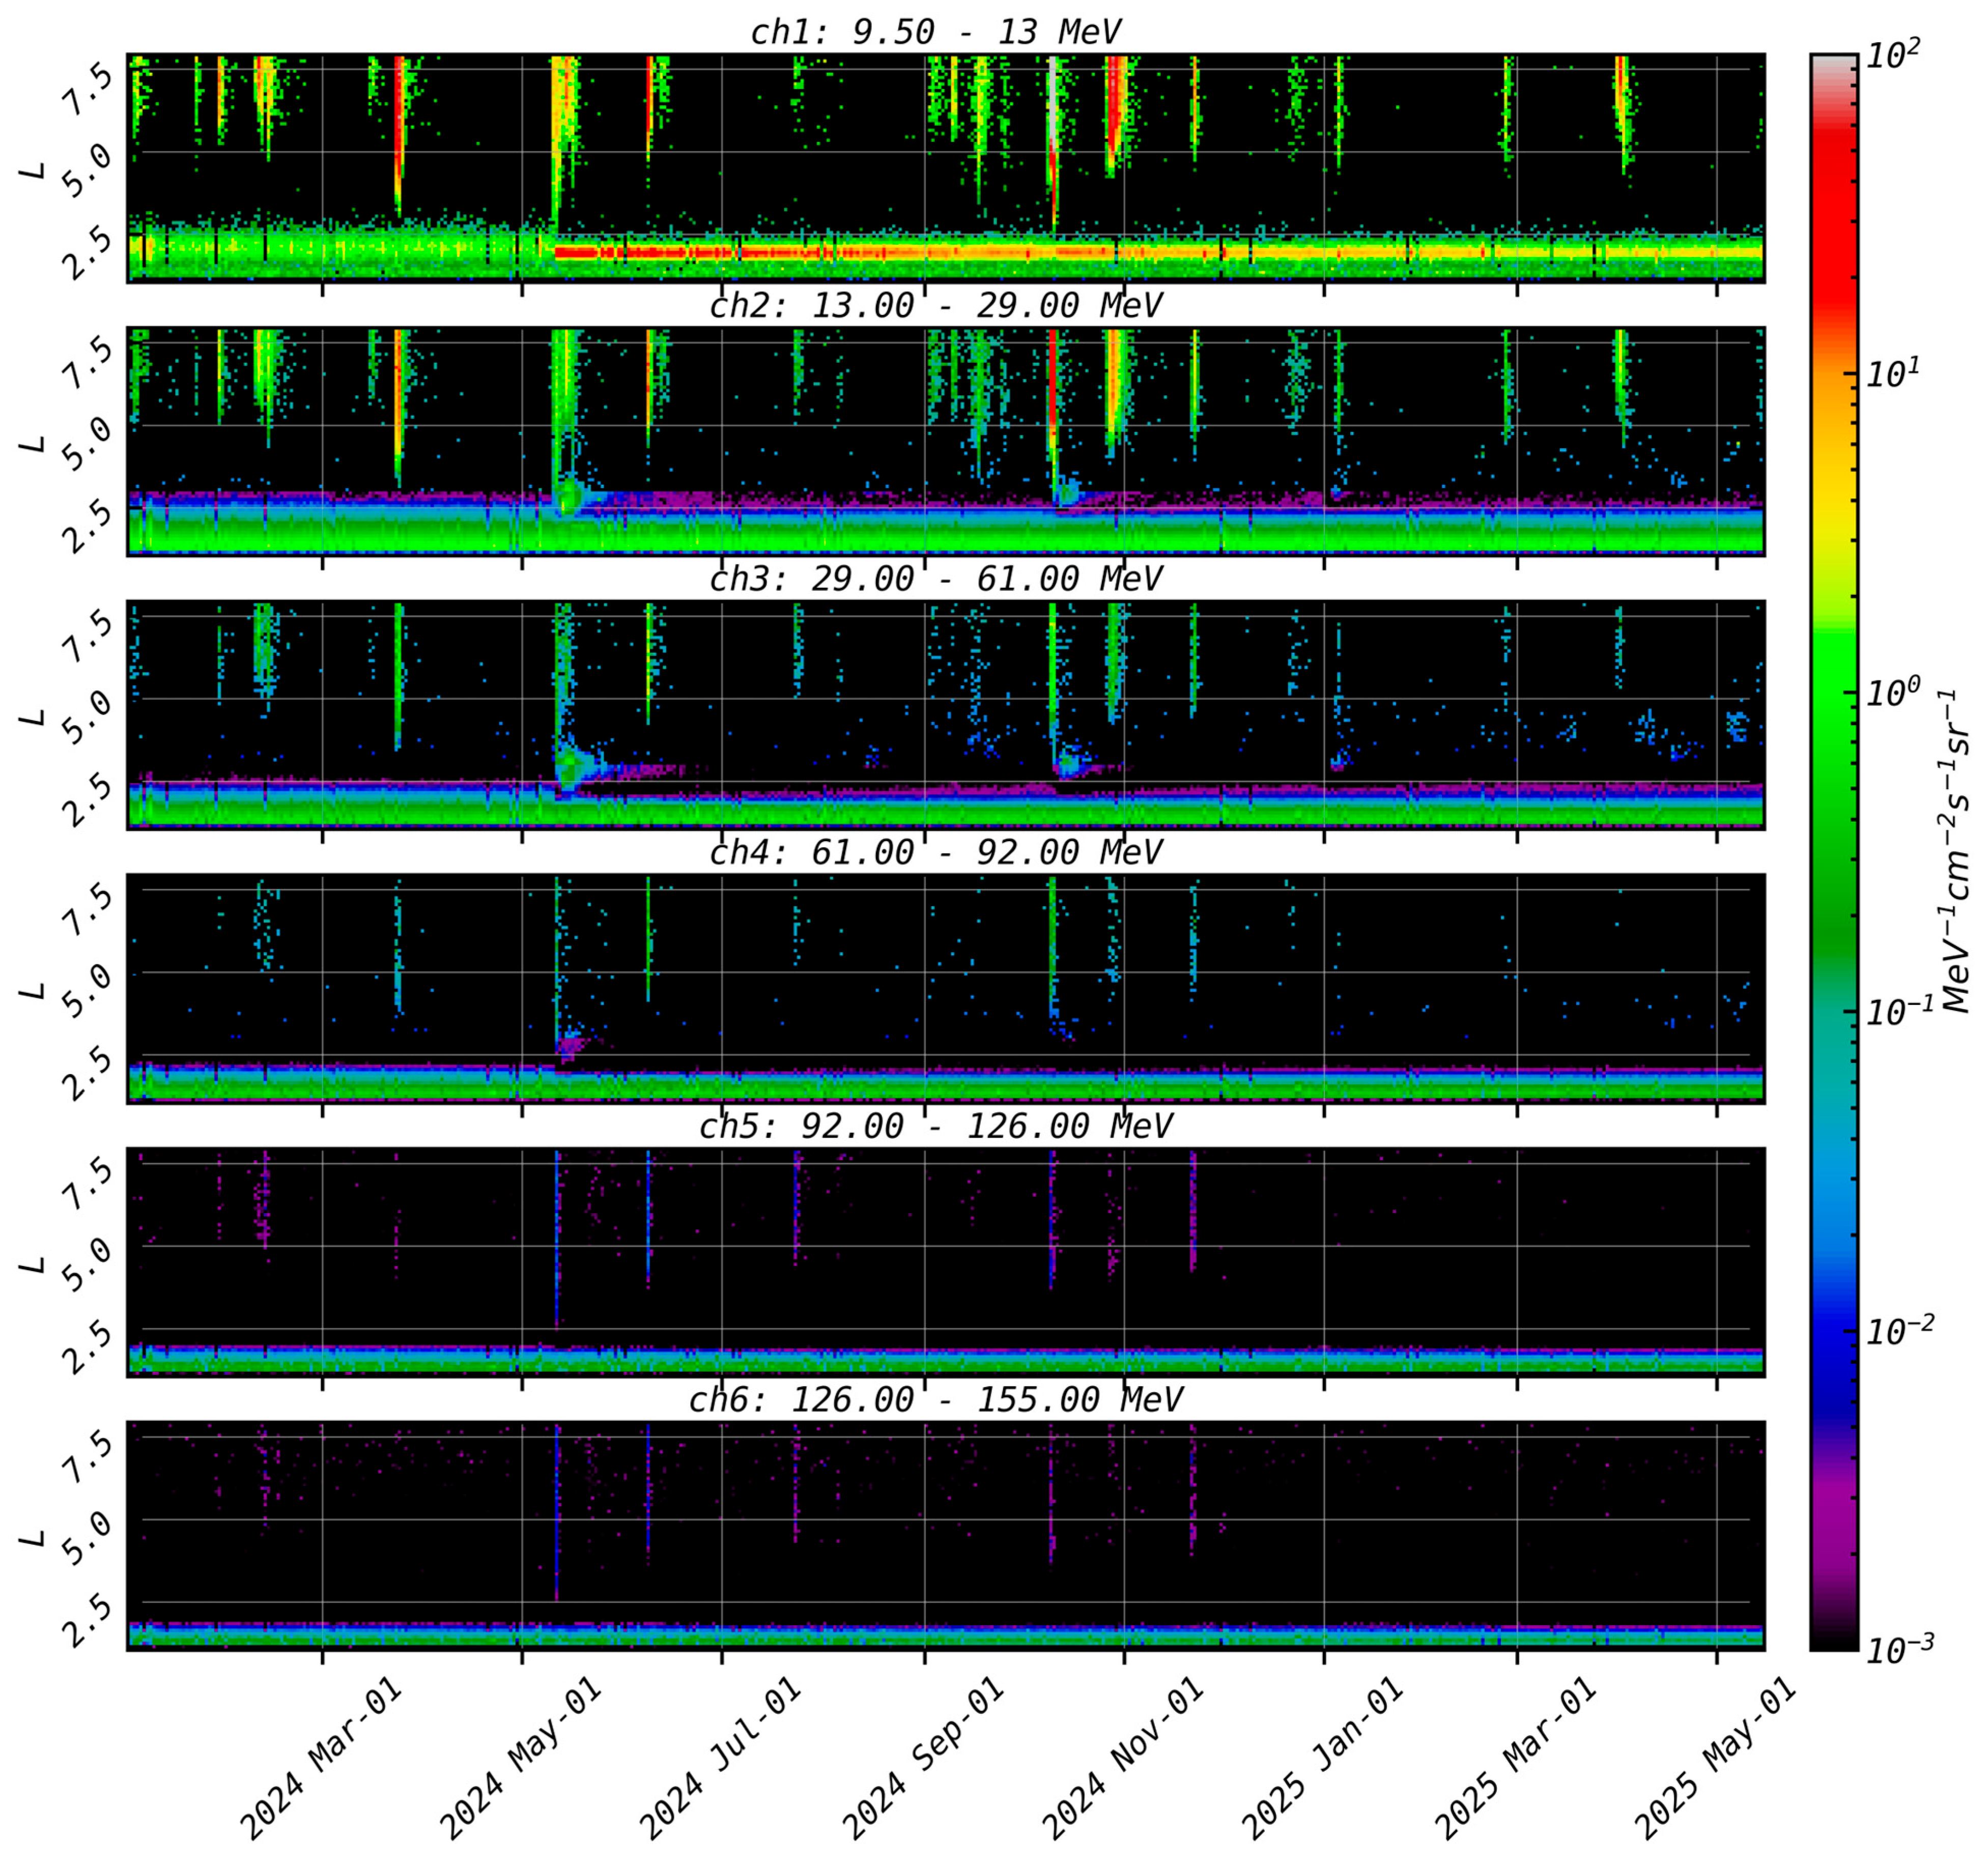
Figure 7 illustrates the EPT differential flux of protons as a function of L and time from 1 January 2024 to 15 May 2025 in the six proton channels, averaged with a time resolution of 1 day and a L resolution of 0.1 Re. The injection in the proton inner belt (at L < 2.5) in May 2024 is clearly visible for Ch1 (9.5–13 MeV). Even if, after the event, the flux in Ch1 slightly decreases, this new inner belt is still clearly visible in 2025. No long-term injection is visible in the other channels.

4.2. Proton Flux Profiles

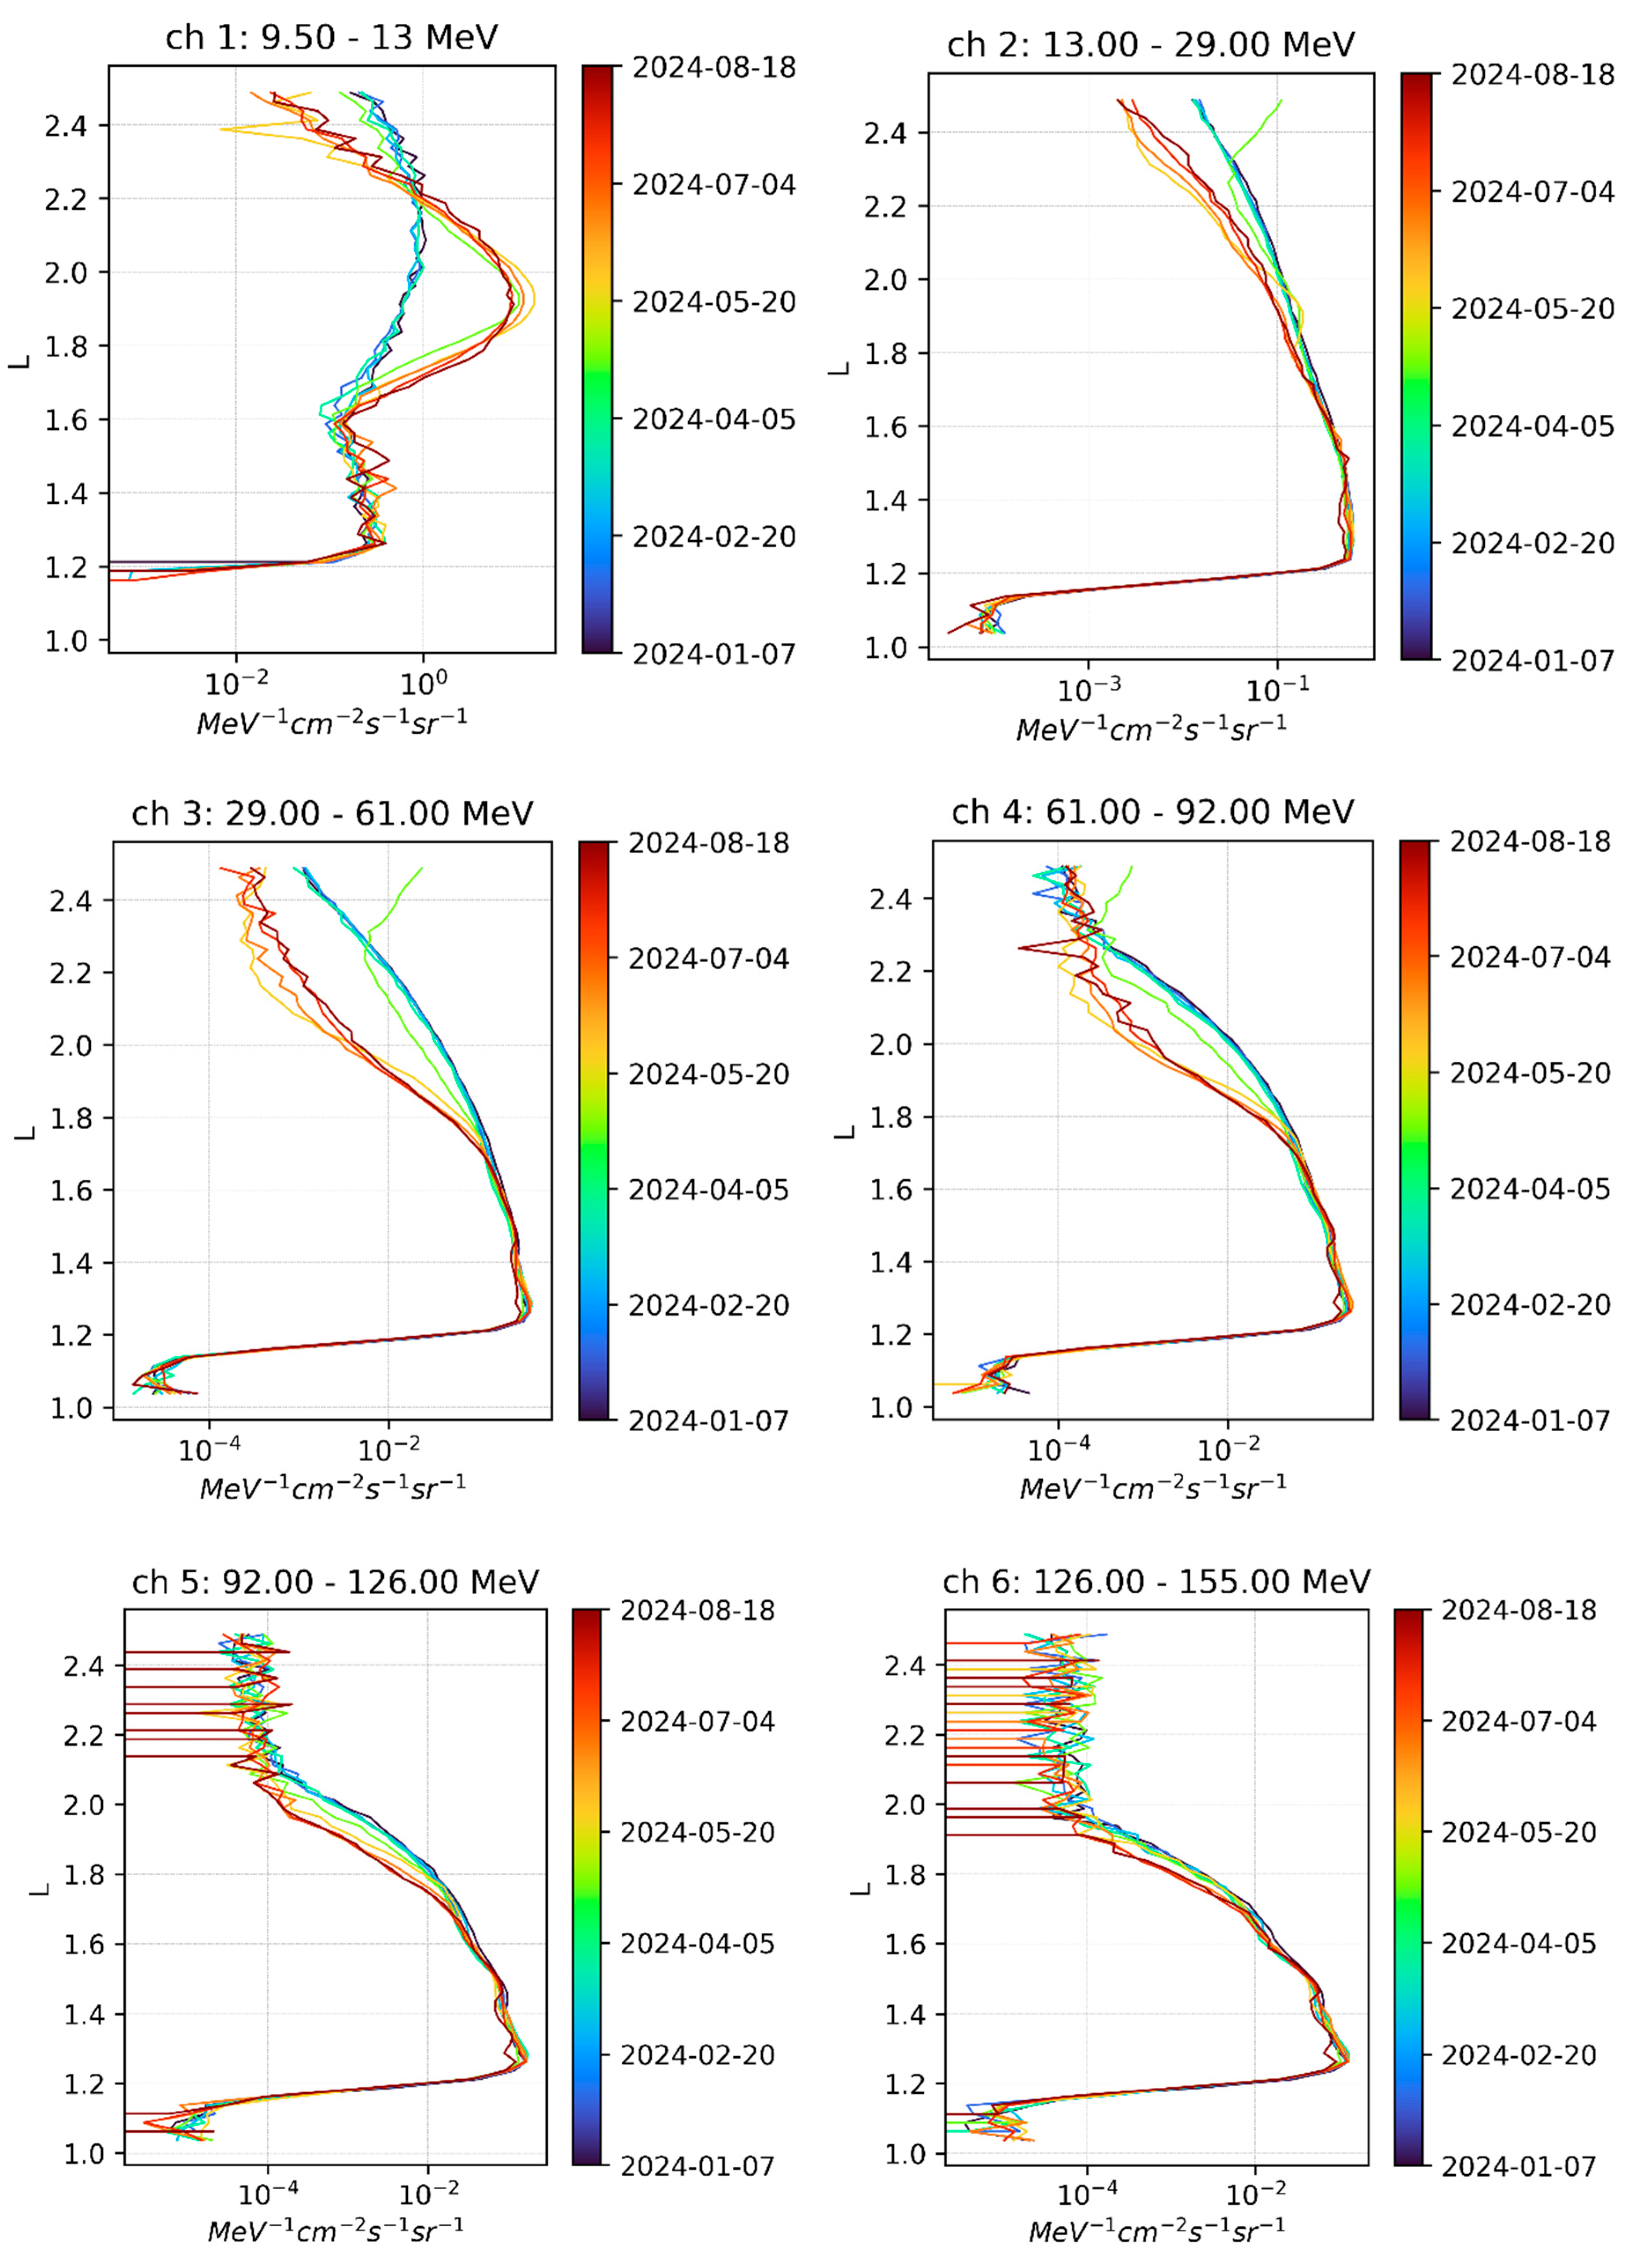
The profiles illustrated in Figure 8 show the proton flux variations averaged every 28 days before the storm (in black for January 2024, dark blue in February 2024, light blue in March–April), during the storm (light green in May 2024), and after the storm (orange to red until August 2024).
Due to the storm, the proton flux suddenly rose in May, but only in Ch1 and between L = 1.6–2.3 with a maximum around L = 1.9. After the storm, the flux steadily decreases with time in this energy range of 9.5–13 MeV, but the increased flux remains high even to the end of 2024. Comparing with Figure 3 illustrating the electron profiles, we observe that after the May event, the maximum electron flux occurred at L = 1.6, whereas the maximum proton flux is located at L = 1.9. Note also that the protons remain trapped much longer than electrons. This is consistent with the findings of [7] based on CSES observations that indicated that the peak of electron flux appeared later than the peak proton flux. The different locations and timings of the maximum electron and proton fluxes enable us to exclude that the four belts could be due to any cross-contamination.
Unlike the injection of protons in Ch1 around L = 1.9, the flux measured by the EPT decreases just after the storm at L > 2.3 for Ch1, and L > 1.8 for the other channels. This is due to the decrease in magnetic field during the storm that causes the protons at the outer edge of the belt to be lost, as already shown for previous events (e.g., [18]). Indeed, protons at large L experience rapid changes caused by field line curvature scattering [36,37,38], which breaks the first adiabatic invariant of a proton and leads to pitch angle diffusion [39]. Moreover, one can see that the outer edge of the proton belt is located at a lower L as the energy increases.
In the next sections, we determine the lifetimes of the new proton flux in Ch1 after the storm, and the refilling time at higher L for the other channels.

4.3. Proton Flux Lifetime of the New Belt at 9.5–13 MeV

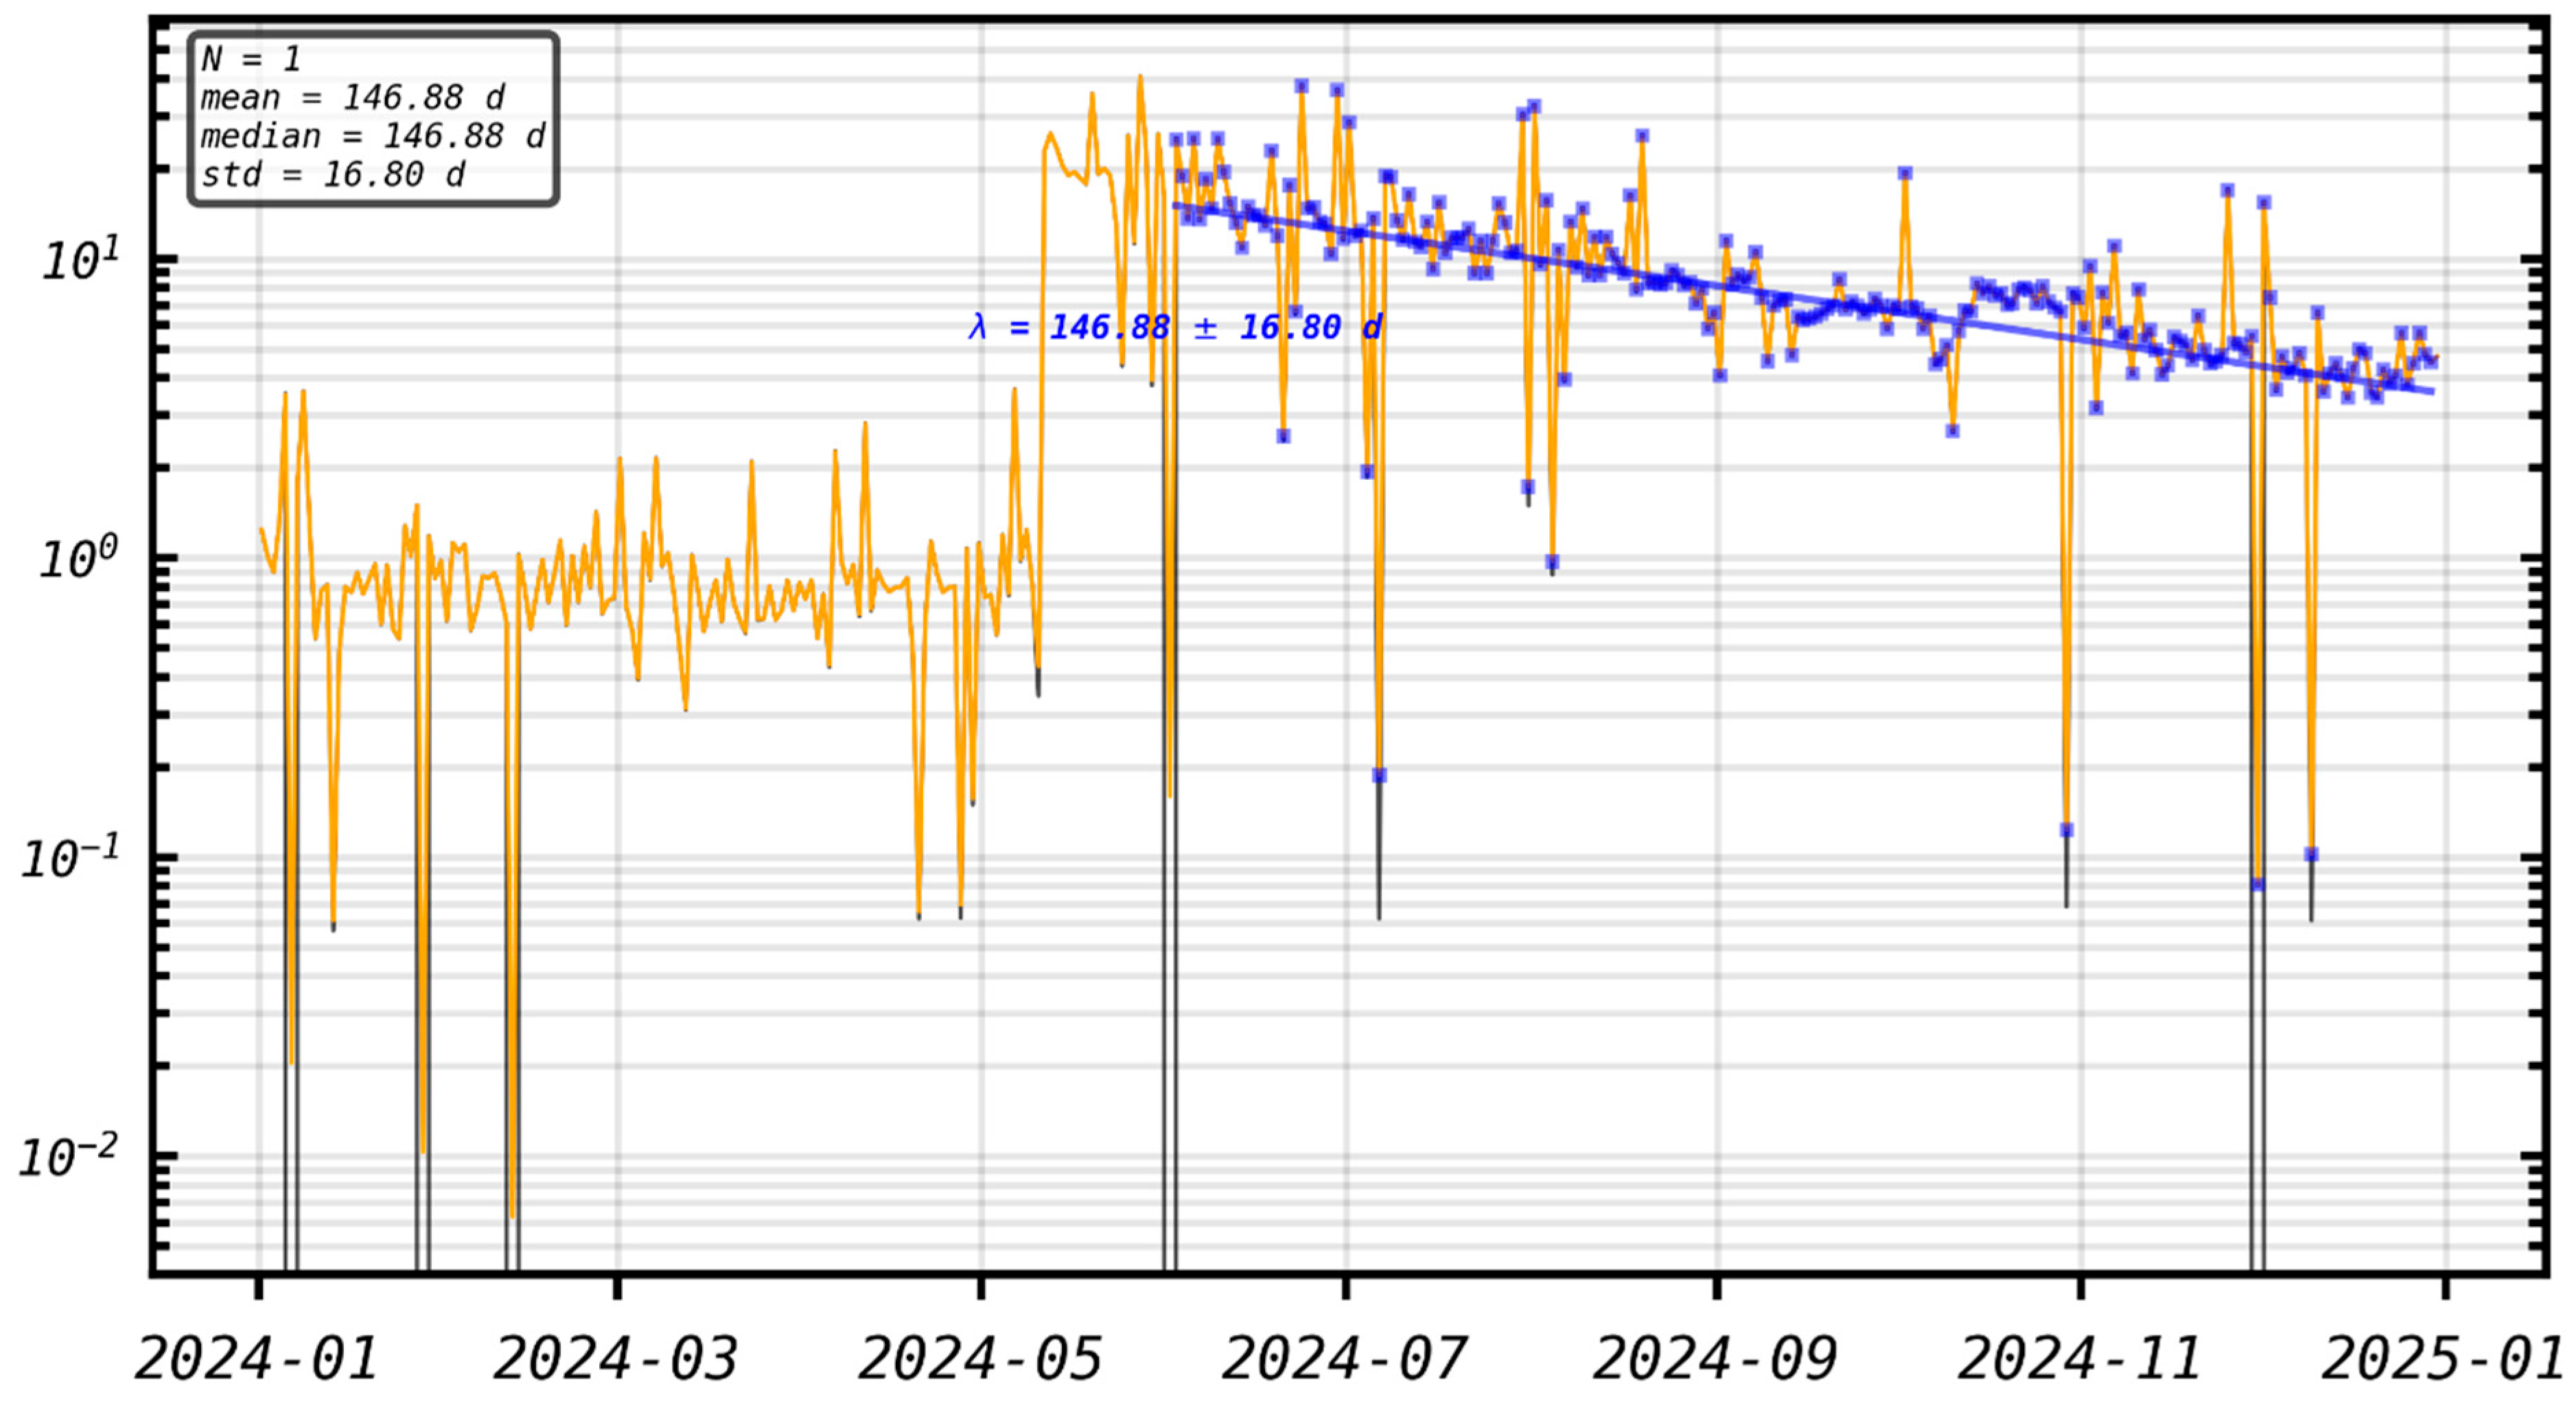
Figure 9 illustrates the proton flux variation in Ch1 and confirms the sharp flux increase (more than one order of magnitude) during the Gannon event and the long lifetime of the new belt obtained by fitting with a linear regression (in blue). The lifetime is longer for protons (146.88 days) than for electrons (84.47 days) at L = 1.85 (see panel 2 of Figure 5). The high proton flux is still present at the end of 2024, long after the four electron belts have disappeared.
Before the storm, the flux was constant and not decreasing with time. Even if no other proton flux injection due to storms could be observed since the launch of EPT in May 2013, the flux is not zero in any channel, indicating that there are other sources of protons in the inner belt, like the well-known cosmic rays (e.g., [17]).
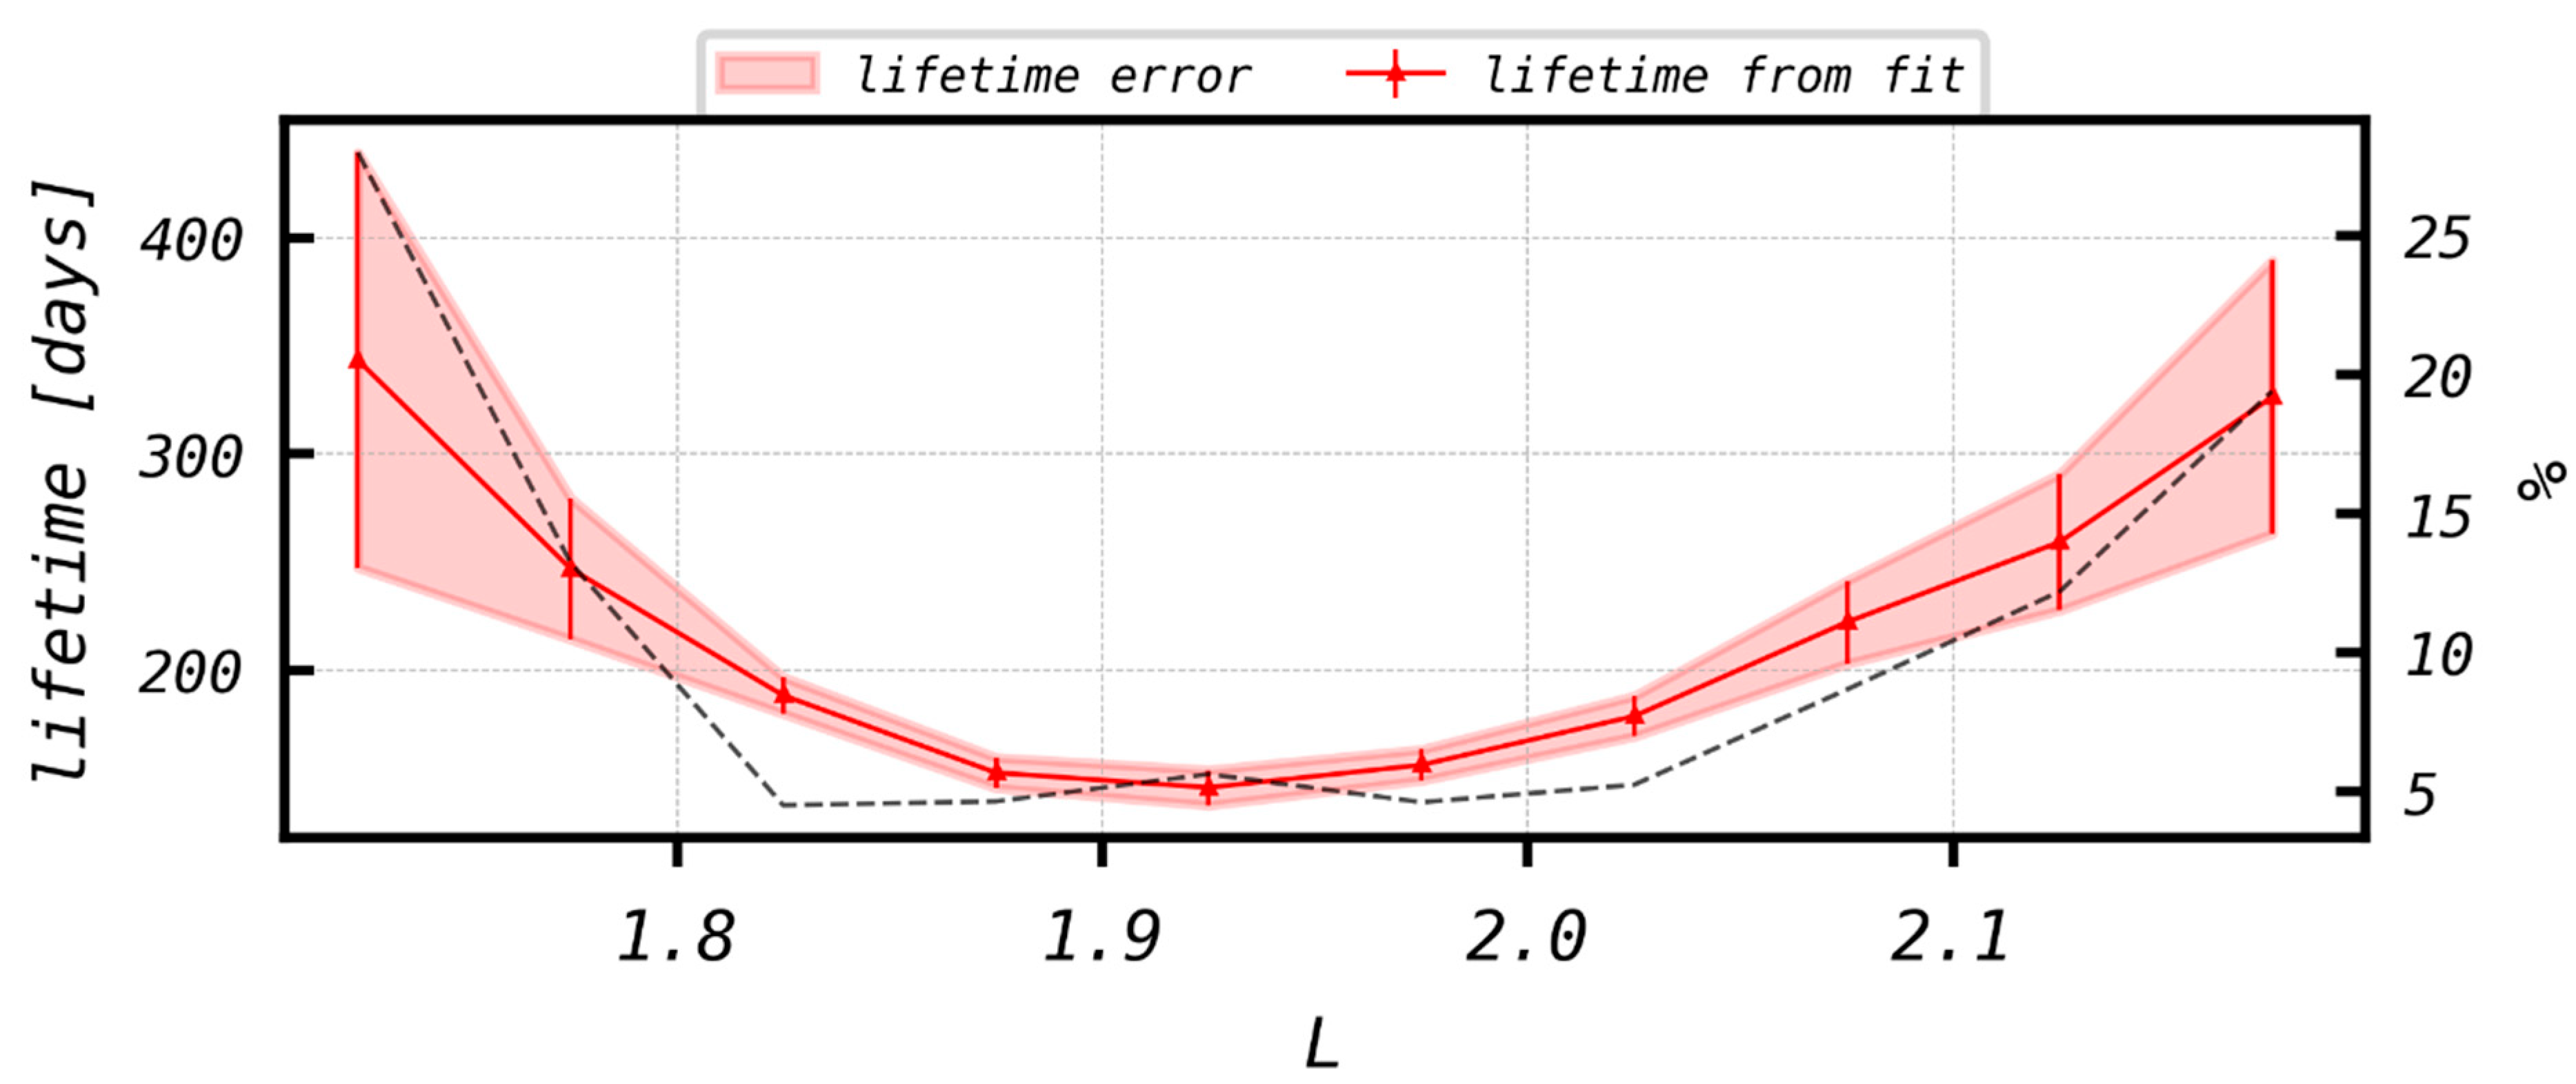
The lifetimes of the injected 9.5–13 MeV protons, determined from EPT observations, are very long (>140 days) and depend on L, as illustrated in Figure 10. It is particularly interesting to note that the lifetime is minimum at L = 1.9, where the proton flux is maximum just after the injection. The lifetime is inversely proportional to the flux and reaches >300 days at L = 1.7 and 2.2. The standard deviation (shaded red region) is also minimum in the slot between L = 1.8 and L = 2, as well as the relative error (dashed black line), which indicates that this is not an artificial effect due to lower lifetimes, but rather a region where the lifetimes are more stable.
Previous studies have shown that radiation belt protons at 1.7 < L < 2.2 vary gradually on time scales of ~1 year [37,40]. Lifetimes found after May 2024 in the present work are shorter. The shorter lifetimes during the first two months after the Mother’s Day injection can be explained by the fact that more electrons were present in the slot region around L = 2 during this period. Indeed, loss of radiation belt protons is mainly due to collisions with free electrons, bound electrons, and nuclei in the ambient plasma and neutral atmosphere [41,42]. Collisions with free and bound electrons produce energy losses that are stronger than nuclear scattering.

4.4. Proton Refilling Times at the Outer Edge of the Belt

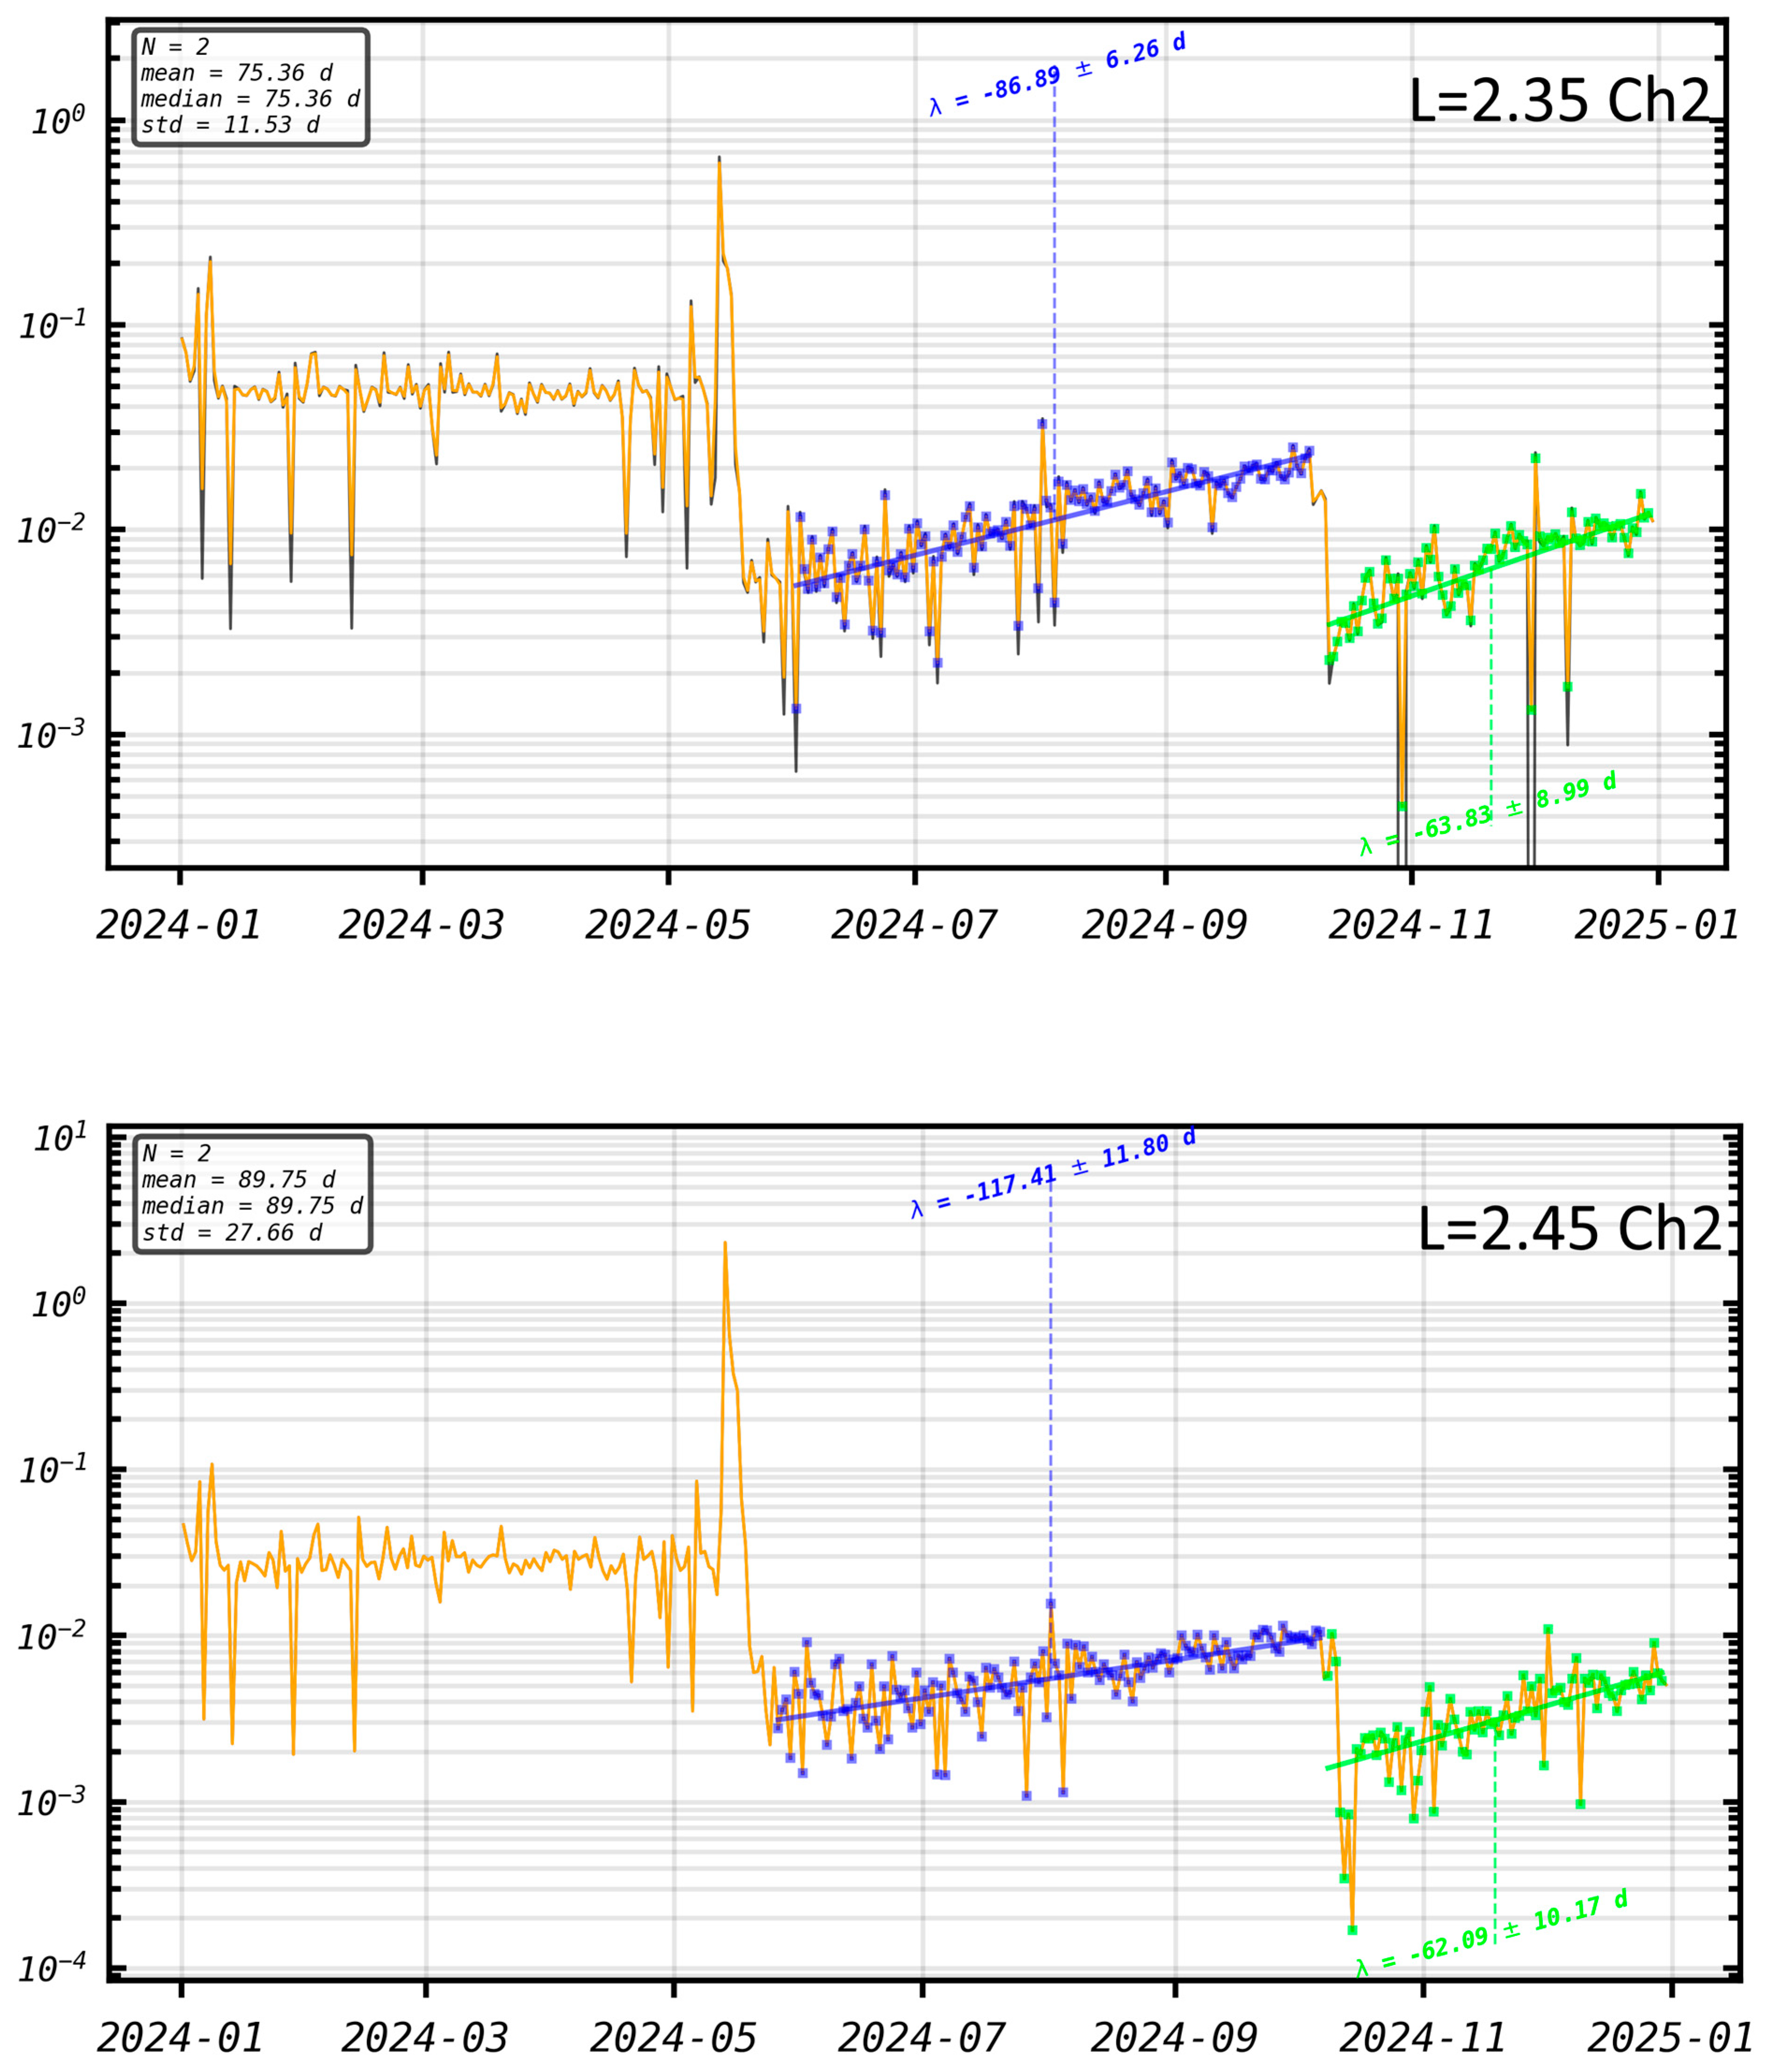
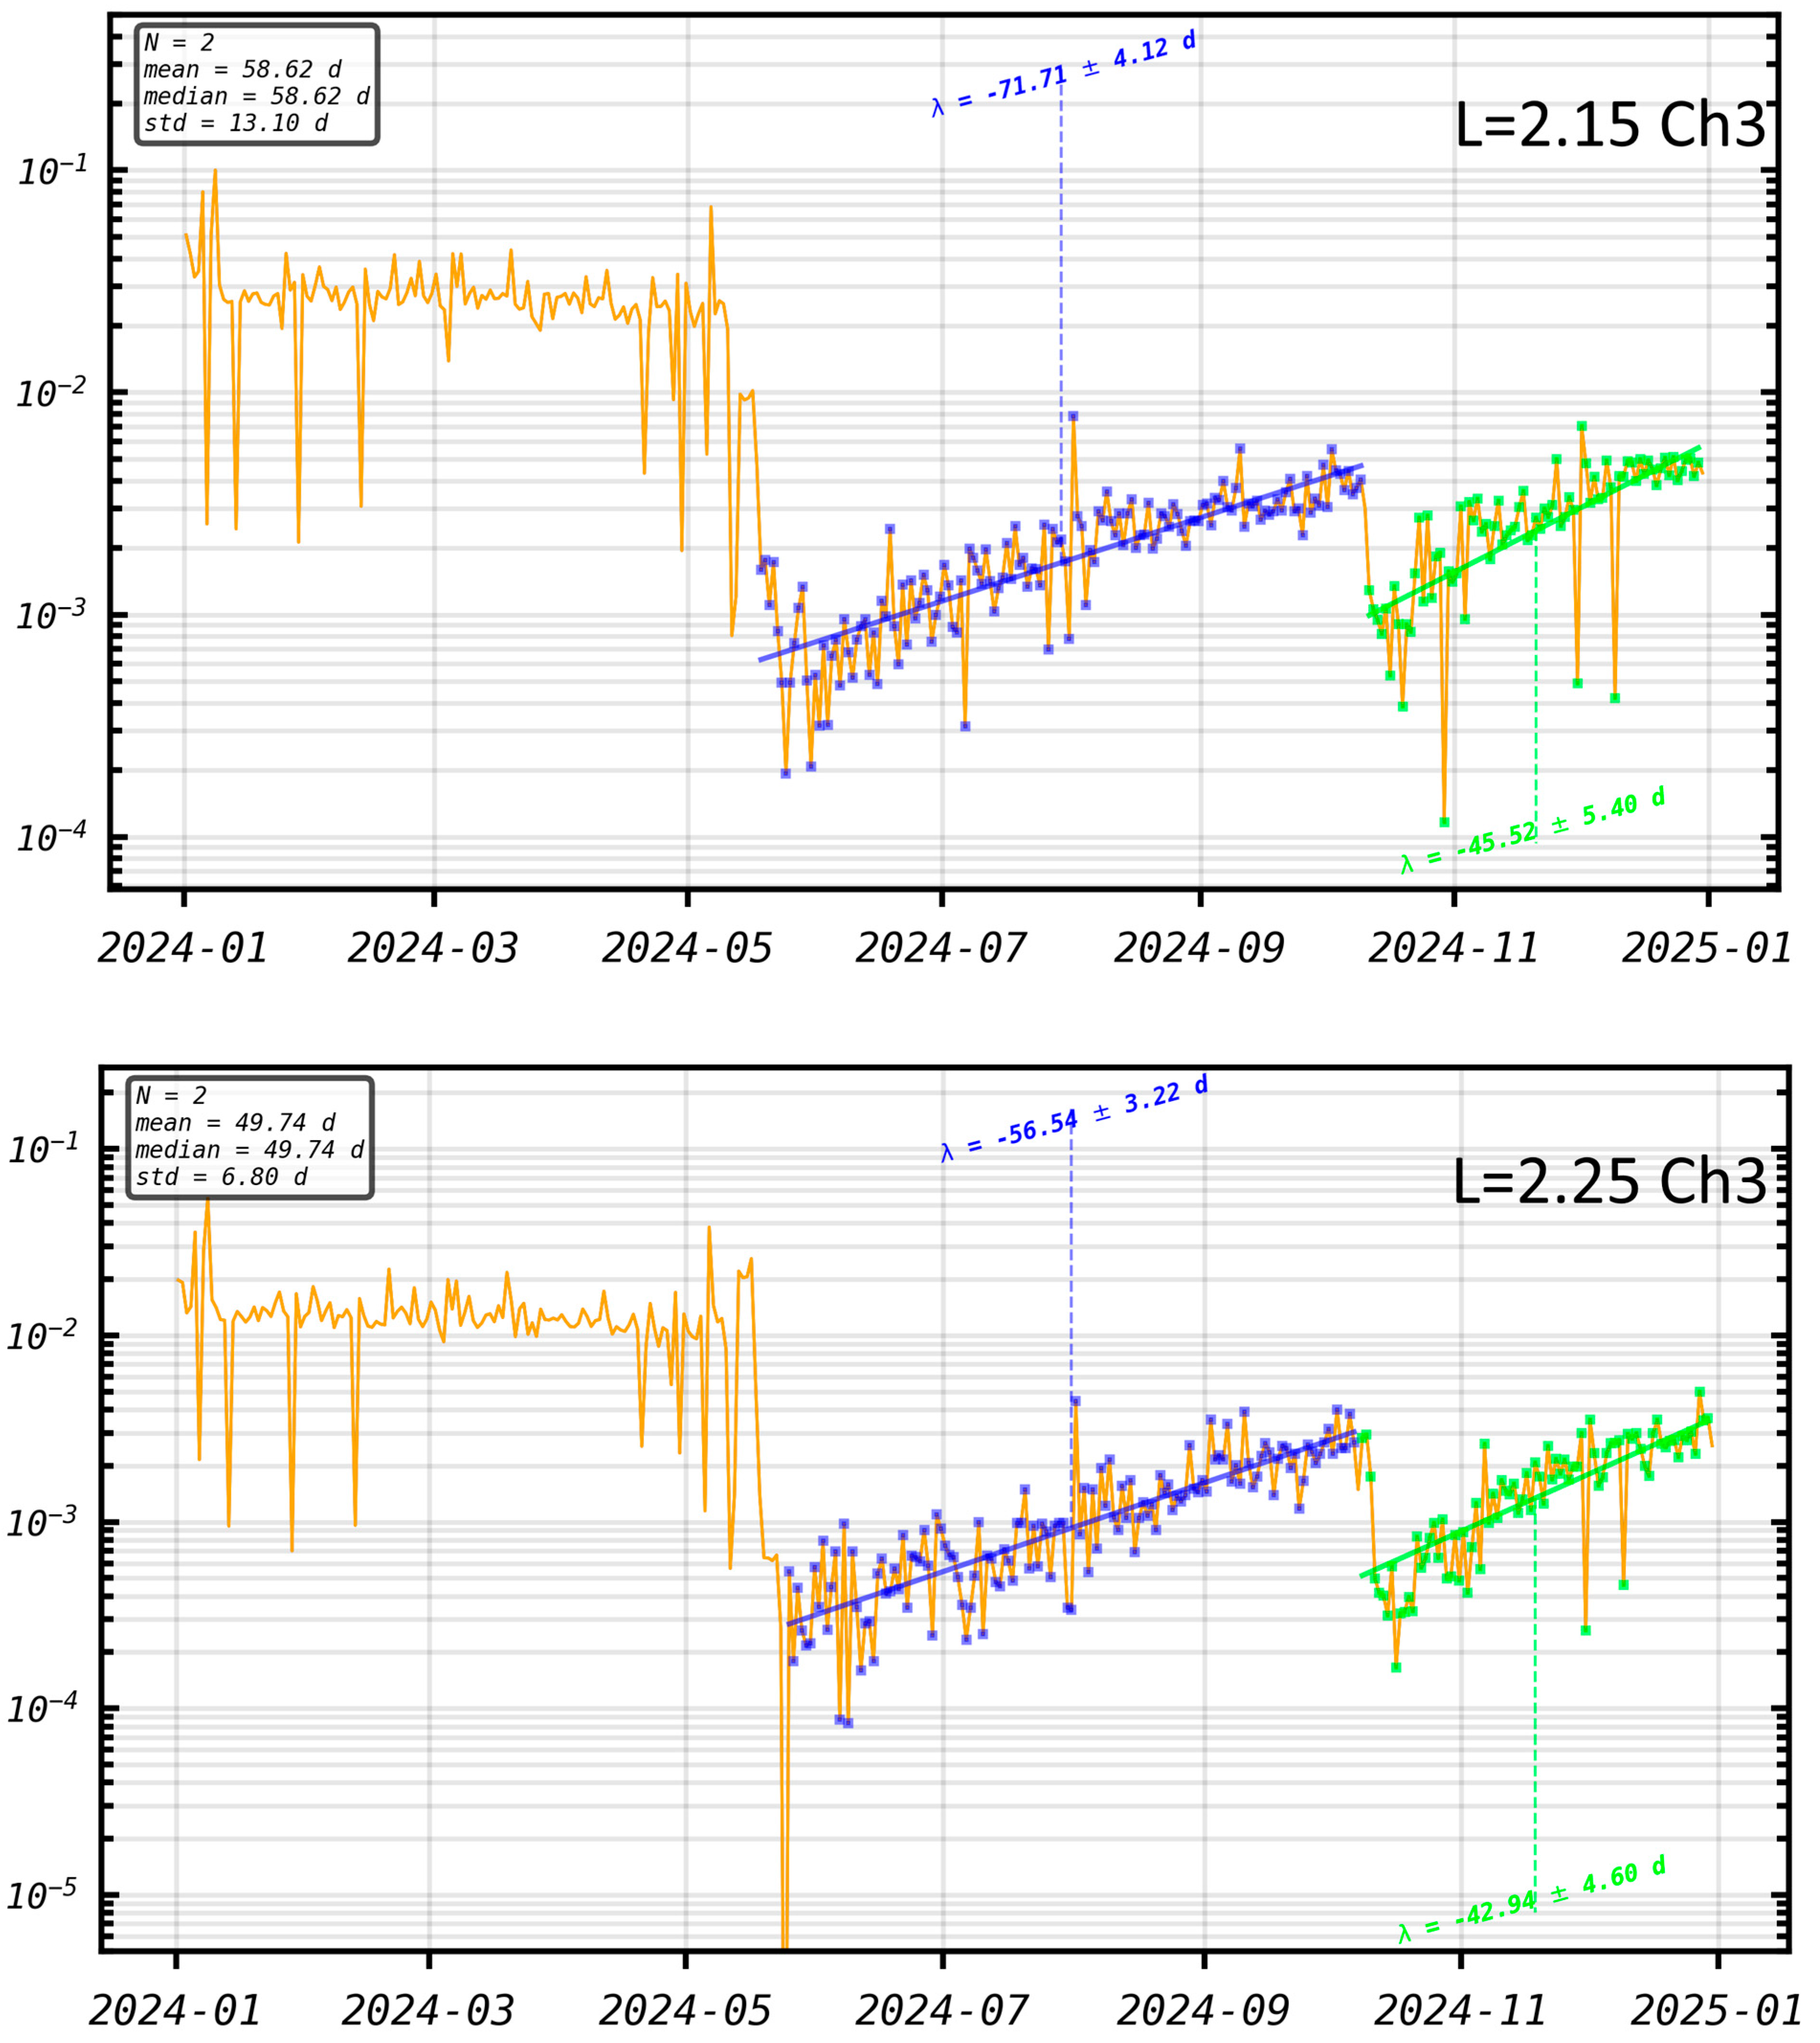
Figure 11 clearly shows that the proton flux sharply decreased at the outer edge of the proton belt just after the May 2024 and October 2024 severe geomagnetic storms. After the event, the fluxes are assumed to recover exponentially to the quiet time level. Therefore, the refilling timescales are again obtained by fitting a linear function to the logarithm of the fluxes. Refilling times at high L are longer than 40 days and depend on L and energies. They are also longer after the May 2024 event than after the October 2024 one, and longer in Ch2 than in Ch3. The storm of October 2024 prevents the flux to recover prestorm levels, because on 10 October 2024, a new sudden loss occurred at the external edge, followed again by progressive flux increase with a similar but shorter refilling time. The refilling time of October 2024 is not completely linear (in the logarithmic scale), but is shorter just after the event than later. The refilling times depend on L and are faster at lower L when the energy increases (as also visible in Figure 8). One can again see in Figure 11 that before the May 2024 event, the observed fluxes were constant.

5. South Atlantic Anomaly (SAA)

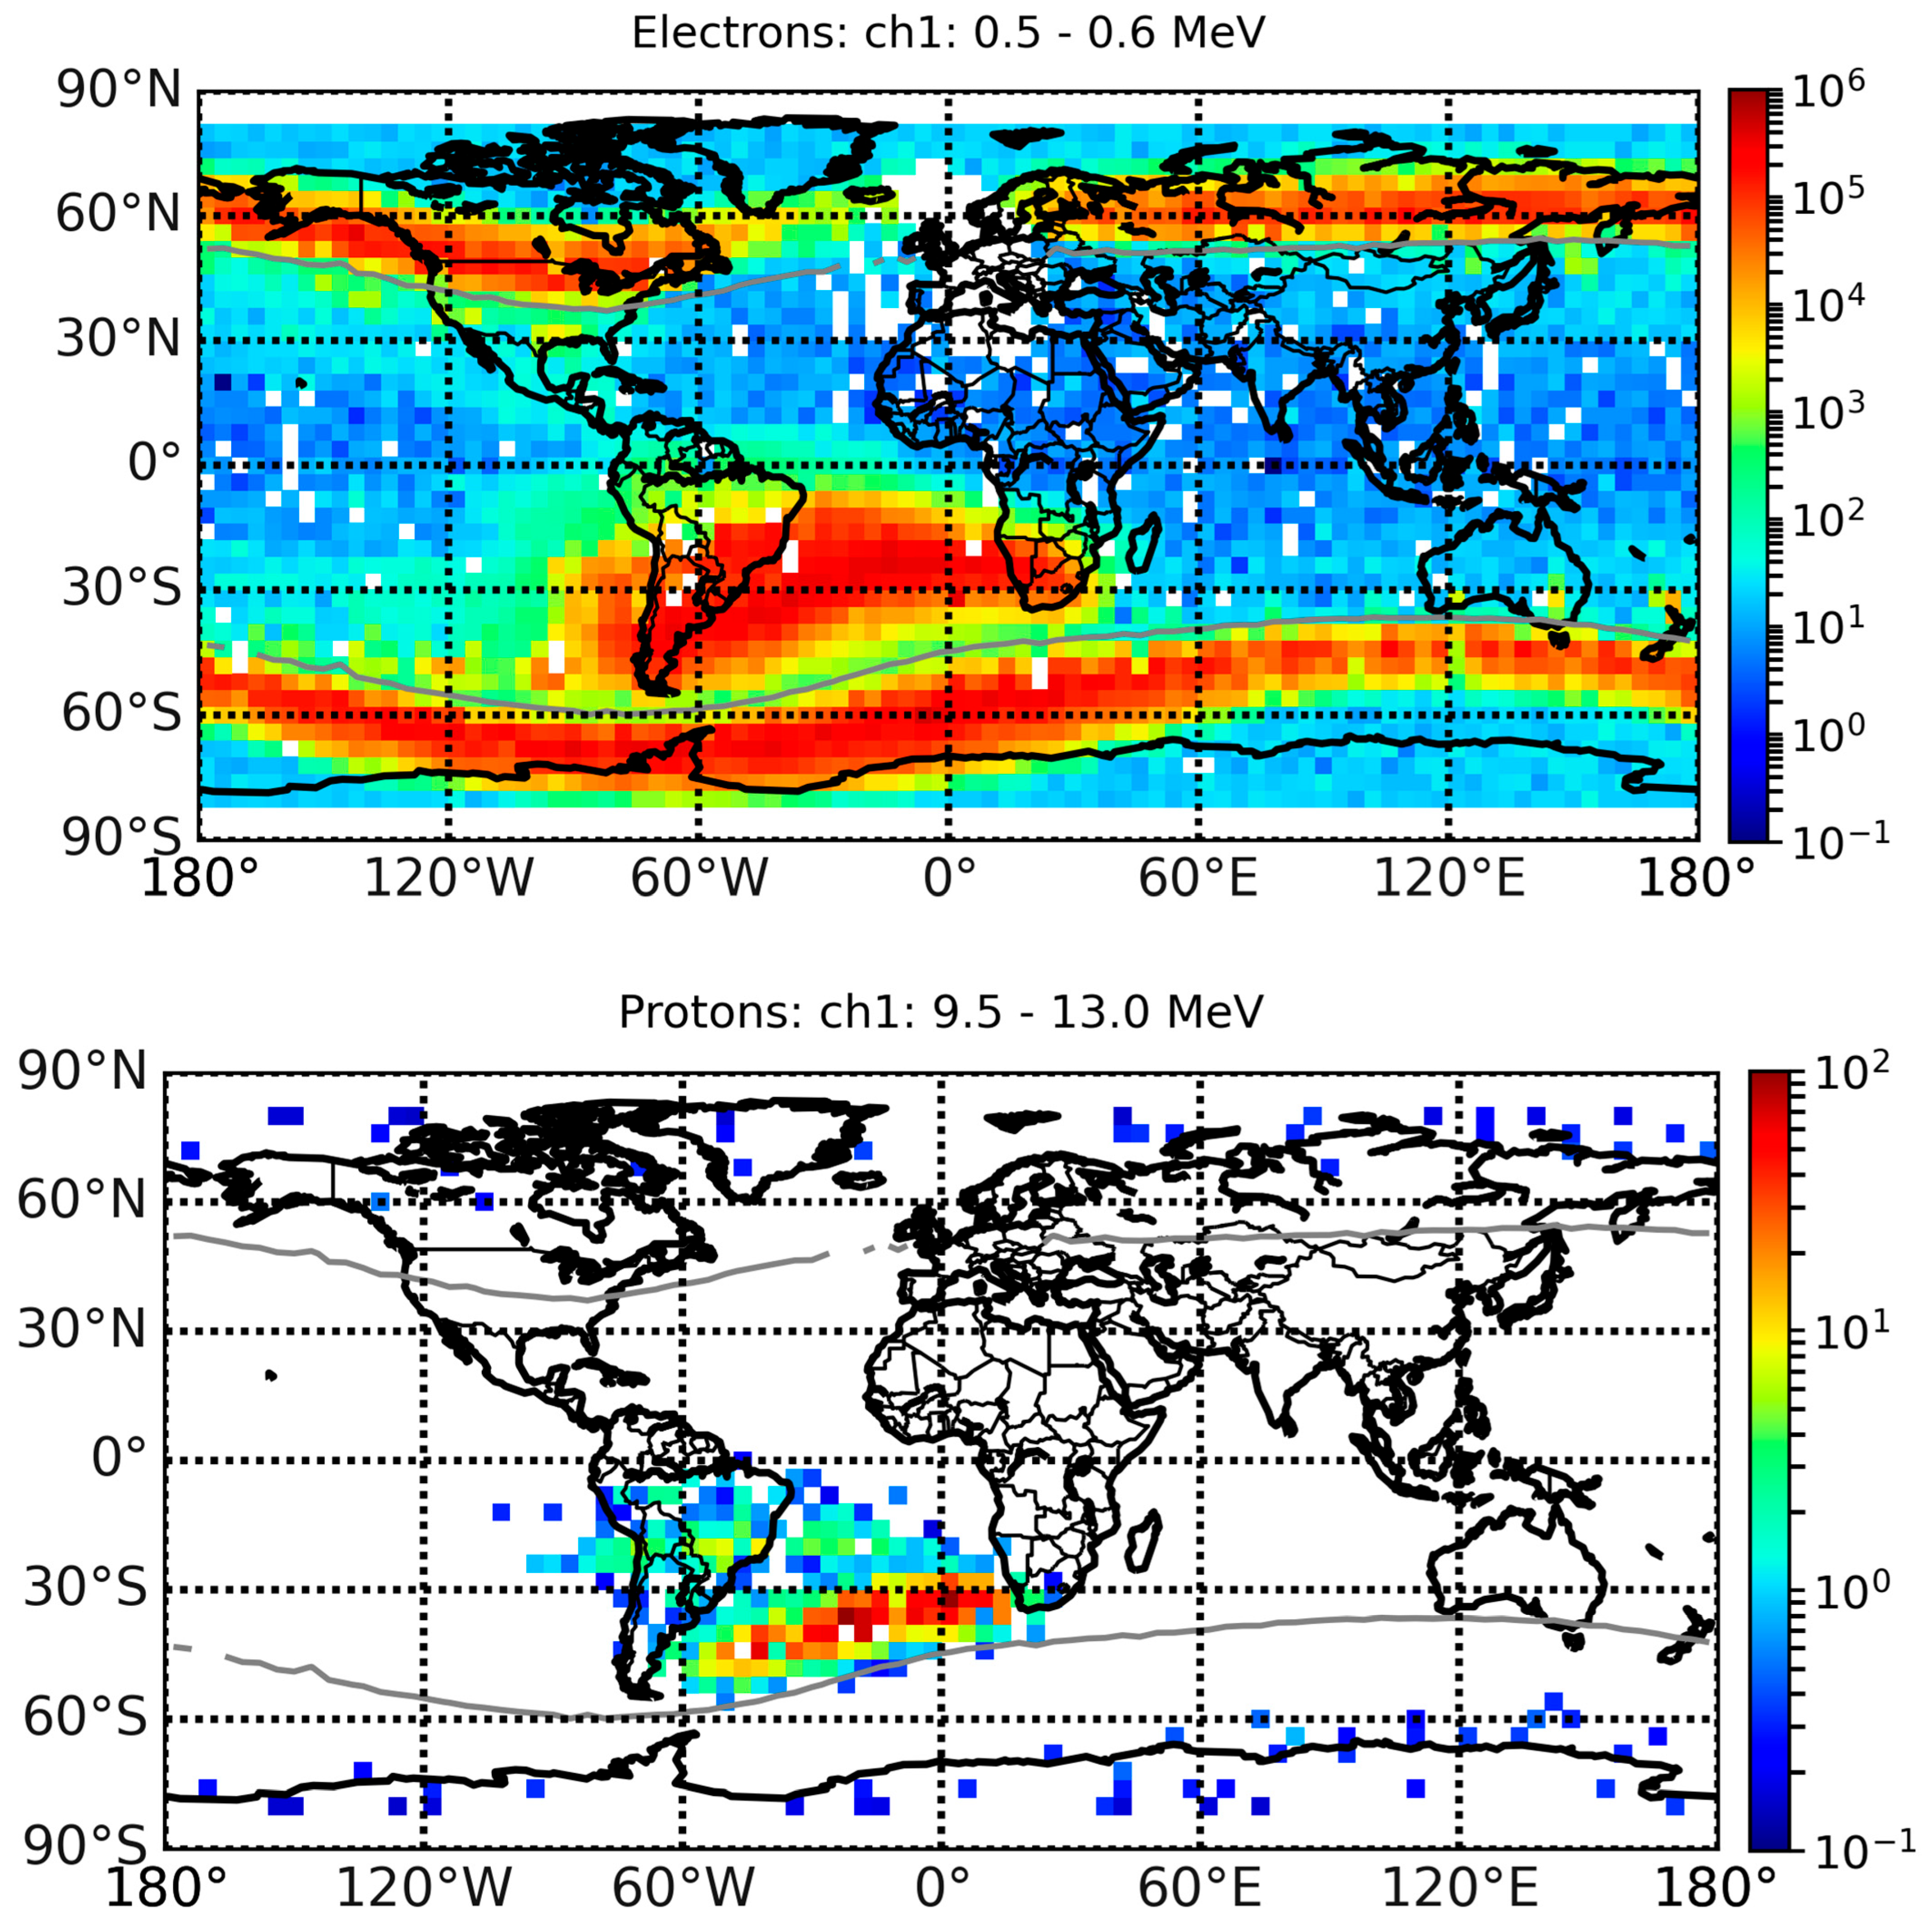
Figure 12 illustrates maps of proton (bottom panel) and electron fluxes (top panel) observed by PROBA-V/EPT in Ch1 from 5 August 2024 to 11 August 2024, averaged in bins of 4° in latitude and longitude. The flux of protons and electrons is high above the South Atlantic, which is why this region is called the South Atlantic Anomaly. The extension of the electron fluxes in the SAA is very different from the proton fluxes. One can also note the high latitude electron bands corresponding to the outer belt.
In August 2024, the flux of protons in this energy range is still very high in the southern part of the SAA due to the long decay time observed after the injection. This region partially overlaps the slot for the electron fluxes, because in August 2024, the electron flux around L = 2.5 has decreased and corresponds again to the normal slot (see also Figure 3, left bottom panel). Again, these different positions and timescales show the good discrimination between the electron and proton fluxes measured by the EPT.

6. Discussion and Conclusions

Our work has presented protons injected in the long-term trapped belt observed by EPT after 11 May 2024, only for E = [9.5–13] MeV, with a maximum flux around L = 1.9. The position and time dynamics of the proton fluxes are very different compared to those of the electrons. The proton injection that is present only in the southern part of the SAA enables us to explain the splitting already observed in the past [18], i.e., why the fluxes observed in the northern and southern parts of the SAA are very different.
No other proton injection in the trapped belt was observed in the last 10 years, but some were observed previously and reviewed in [16] for events before 2010. They showed that sudden trapped proton flux increases mainly during very strong Solar Energetic Particles (SEP) events, but not always. In the case of the May 2024 storm, a SEP was clearly present but was quite weak: the proton flux (>10 MeV) observed by GOES reached only 208 pfu. Thus, the increase in proton flux in the 9.5–13 MeV belt appears to be more related to the combination of the SEP and the strong geomagnetic storm (Dst = −412 nT) that modified solar proton fluxes due to the geomagnetic suppression. Radial diffusion and non-adiabatic effects due to drift invariant violations may also contribute to the flux increase [43]. The temporal coincidence between the detection of additional protons of 9.5–13 MeV trapped in the radiation belt and the incursions of solar particles below L = 2.5 (see Figure 7) during geomagnetic storms suggests that both the solar particle intensity and geomagnetic cutoff suppression play key roles in the formation of the new proton injection.
The event of 11 May 2024 is also unique due to the first detection of four electron belts in addition to the injection of protons in the inner belt [4]. The loss of electrons after flux injections is mainly due to wave–particle interactions, especially chorus above the plasmapause and hiss inside the plasmasphere [44,45]. By resonance at specific frequencies, the loss rate increases at specific L values, like L = 2.5 for the usual slot. From the present work using PROBA-V/EPT observations to determine the lifetimes of the particles, the loss at other specific L seems to only occur in the presence of very high flux injections caused by the very strong geomagnetic activity and magnetic field reduction. Other recent geomagnetic storms led to electron flux injections, causing three electron belts, at least in the first channel 0.5–0.6 MeV, like that of October 2024. This was not the case in the EPT observations before 2021 [21,46], probably because the injected fluxes were not high enough. Moreover, in the case of the Gannon event, an additional fourth belt appears due to a separation in the inner belt, due to the penetration of the fluxes at very low L.
For electrons, EPT observations show that injection during the May 2024 event is present in all energy channels from 0.5 MeV to 8 MeV, ruling out the impenetrable barrier for the highest energy particles postulated in [47]. The expression of the depth of penetration [21] as a function of the energy and Dst, and its extrapolation to extreme values of Dst as observed during the May 2024 event, is in very good agreement with the observed L positions.
EPT data demonstrated that electrons up to 0.8 MeV are scattered by resonant interactions with a very low-frequency transmitter in the Northwest Cape of Australia (NWC) to produce enhanced fluxes [31]. The enhanced fluxes appear at multiple L-shells for each energy channel, consistent with resonance conditions at distinct wave normal angles, which indicate ducted interactions at L < 1.55 and unducted interactions at L > 1.65. Such human influence can participate in the flux variations in the inner belt, as well as lightnings for low L < 3 [35].
Our work shows the dependence on L of the electron and proton lifetimes obtained using EPT observations during the very active year of 2024. At a given L, the lifetimes are generally shorter when the flux is higher. For the protons, the refilling times after the detrapping at the outer edge of the belt are also shorter when the flux is low. Linear regressions are thus not always the most appropriate fits to determine the evolution times of flux variations in logarithmic scale, even if they give interesting first approximations. Such observed characteristics of source and loss time dependence on the position and energy in the radiation belts should be considered in the space weather predictive tools, including those based on artificial intelligence [48].

Author Contributions

Conceptualization, V.P.; methodology, V.P. and A.W.; software, A.W.; validation, V.P. and A.W.; formal analysis, V.P. and A.W.; investigation, V.P. and A.W.; resources, V.P.; data curation, A.W.; writing—original draft preparation, V.P.; writing—review and editing, V.P. and A.W.; visualization, A.W.; supervision, V.P.; project administration, V.P.; funding acquisition, V.P. All authors have read and agreed to the published version of the manuscript.

Funding

The project 21GRD02 BIOSPHERE has received funding from the European Partnership on Metrology, co-financed from the European Union’s Horizon Europe Research and Innovation Programme and by the Participating States.

Institutional Review Board Statement

Not applicable.

Informed Consent Statement

Not applicable.

Data Availability Statement

The data presented in this study are available at https://doi.org/10.18758/4odiwjpo. These data were derived from the PROBA-V/EPT data available in the public domain: Space Situational Awareness website of ESA https://swe.ssa.esa.int/space-radiation (accessed on 20 January 2026). Dst data are available on https://wdc.kugi.kyoto-u.ac.jp/ (accessed on 20 January 2026).

Conflicts of Interest

The authors declare no conflicts of interest.

References

  1. Spogli, L.; Alberti, T.; Bagiacchi, P.; Cafarella, L.; Cesaroni, C.; Cianchini, G.; Coco, I.; DiMauro, D.; Ghidoni, R.; Giannattasio, F.; et al. The effects of the May 2024 Mother’s Day superstorm over the Mediterranean sector: From data to public communication. Ann. Geophys. 2024, 67, 218. [Google Scholar] [CrossRef]
  2. Paul, K.S.; Haralambous, H.; Moses, M.; Oikonomou, C.; Potirakis, S.M.; Bergeot, N.; Chevalier, J.-M. Investigation of the Ionospheric Response on Mother’s Day 2024 Geomagnetic Superstorm over the European Sector. Atmosphere 2025, 16, 180. [Google Scholar] [CrossRef]
  3. Pierrard, V.; Verhulst, T.G.W.; Chevalier, J.-M.; Bergeot, N.; Winant, A. Effects of the Geomagnetic Superstorms of 10–11 May 2024 and 7–11 October 2024 on the Ionosphere and Plasmasphere. Atmosphere 2025, 16, 299. [Google Scholar] [CrossRef]
  4. Pierrard, V.; Winant, A.; Botek, E.; Péters de Bonhome, M. The Mother’s Day solar storm of 11 May 2024 and its effect on Earth’s radiation belts. Universe 2024, 10, 391. [Google Scholar] [CrossRef]
  5. Evans, D.; Greer, M. Polar Orbiting Environmental Satellite Space Environment Monitor; NOAA National Geophysical Data Center: Boulder, CO, USA, 2000.
  6. Li, X.; Xiang, Z.; Mei, Y.; O’BRien, D.; Brennan, D.; Zhao, H.; Baker, D.N.; Temerin, M.A. A new electron and proton radiation belt identified by CIRBE/REPTile-2 measurements after the magnetic super storm of 10 May 2024. J. Geophys. Res. Space Phys. 2025, 130, e2024JA033504. [Google Scholar] [CrossRef]
  7. Zhang, Z.; Zhang, F.; Wang, L.; Li, X.; Zhima, Z.; Wang, Y.; Yang, Y.; Yang, D.; Li, S.; Chu, W.; et al. The Magnetosphere-Ionosphere-Ground Responses to the May 2024 Super Solar Storm. Space Weather 2025, 23, e2024SW004197. [Google Scholar] [CrossRef]
  8. Xu, X.; Ma, Y.; Zhang, L.; Yu, T.; Wang, J.; He, M.; Wang, C.; Li, H. Dynamics of Proton Flux in the South Atlantic Anomaly During the Super Geomagnetic Storm in May 2024. J. Geophys. Res. Space Phys. 2025, 130, e2024JA033536. [Google Scholar] [CrossRef]
  9. Pierrard, V. Effects of the Sun on the Space Environment of the Earth; Presses Universitaires de Louvain: Louvain-la-Neuve, Belgium, 2024; p. 208. ISBN 978-2-39061-442-5. Available online: https://i6doc.com/en/book/?gcoi=28001100628290 (accessed on 10 February 2026).
  10. Baker, D.N.; Kanekal, S.G.; Hoxie, V.C.; Henderson, M.G.; Li, X.; Spence, H.E.; Elkington, S.R.; Friedel, R.H.W.; Goldstein, J.; Hudson, M.K.; et al. A long-lived relativistic electron storage ring embedded in Earth’s outer Van Allen belt. Science 2013, 340, 186–190. [Google Scholar] [CrossRef] [PubMed]
  11. Pierrard, V.; Bolsée, D.; Winant, A.; Al-Qaaod, A.; Krasniqi, F.; de Bonhome, M.P.; Botek, E.; Van Laeken, L.; Sapundjiev, D.; Van Malderen, R.; et al. BIOSPHERE measurement campaign from January 2024 to March 2024 and in May 2024: Effects of the solar events on the radiation belts, UV radiation and ozone in the atmosphere. AIMS Geosci. 2025, 11, 117–154. [Google Scholar] [CrossRef]
  12. Winant, A.; Pierrard, V.; Botek, E. Ozone decrease observed in the upper atmosphere following the May 11th 2024 Mother’s day solar storm. Ann. Geophys. 2024. [Google Scholar] [CrossRef]
  13. Benck, S.; Mazzino, L.; Cyamukungu, M.; Cabrera, J.; Pierrard, V. Low altitude energetic electron lifetimes after enhanced magnetic activity as deduced from SAC-C and DEMETER data. Ann. Geophys. 2010, 28, 849–859. [Google Scholar] [CrossRef]
  14. Claudepierre, S.G.; Ma, Q.; Bortnik, J.; O’Brien, T.P.; Fennell, J.F.; Blake, J.B. Empirically estimated electron lifetimes in the Earth’s radiation belts: Van Allen Probe observations. Geophys. Res. Lett. 2020, 47, e2019GL086053. [Google Scholar] [CrossRef]
  15. Selesnick, R.S.; Albert, J.M. Variability of the proton radiation belt. J. Geophys. Res. Space Phys. 2019, 124, 5516–5527. [Google Scholar] [CrossRef]
  16. Selesnick, R.; Hudson, M.; Kress, B. Injection and loss of inner radiation belt protons during solar proton events and magnetic storms. J. Geophys. Res. Space Phys. 2010, 115, A08211. [Google Scholar] [CrossRef]
  17. Lopez Rosson, G.; Pierrard, V. Analysis of proton and electron spectra observed by EPT/PROBA-V in the South Atlantic Anomaly. Adv. Space Res. 2017, 60, 796–805. [Google Scholar] [CrossRef]
  18. Pierrard, V.; Benck, S.; Botek, E.; Borisov, S.; Winant, A. Proton flux variations during Solar Energetic Particle Events, minimum and maximum solar activity, and splitting of the proton belt in the South Atlantic Anomaly. J. Geophys. Res. Space Phys. 2023, 128, e2022JA031202. [Google Scholar] [CrossRef]
  19. Pierrard, V.; Rosson, G.L.; Borremans, K.; Lemaire, J.; Maes, J.; Bonnewijn, S.; Van Ransbeeck, E.; Neefs, E.; Cyamukungu, M.; Benck, S.; et al. The Energetic Particle Telescope: First results. Space Sci. Rev. 2014, 184, 87–106. [Google Scholar] [CrossRef]
  20. Cyamukungu, M.; Benck, S.; Borisov, S.; Grégoire, G.; Cabrera, J.; Bonnet, J.L. The Energetic Particle Telescope (EPT) on board PROBA-V: Description of a new science-class instrument for particle detection in space. IEEE Trans. Nucl. Sci. 2014, 61, 3667–3681. [Google Scholar] [CrossRef]
  21. Pierrard, V.; Botek, E.; Ripoll, J.F.; Cunningham, G. Electron dropout events and flux enhancements associated with geomagnetic storms observed by PROBA-V/EPT from 2013 to 2019. J. Geophys. Res. Space Phys. 2020, 125, e2020JA028487. [Google Scholar] [CrossRef]
  22. Pierrard, V.; Botek, E.; Darrouzet, F. Improving Predictions of the 3D Dynamic Model of the Plasmasphere. Front. Astron. Space Sci. 2021, 8, 681401. [Google Scholar] [CrossRef]
  23. Brautigam, D.H.; Albert, J.M. Radial diffusion analysis of outer radiation belt electrons during the October 9, 1990, magnetic storm. J. Geophys. Res. Space Phys. 2000, 105, 291–309. [Google Scholar] [CrossRef]
  24. Pierrard, V.; Botek, E.; Ripoll, J.-F.; Thaller, S.A.; Moldwin, M.B.; Ruohoniemi, M.; Reeves, G. Links of the plasmapause with other boundary layers of the magnetosphere: Ionospheric convection, radiation belts boundaries, auroral oval. Front. Astron. Space Sci. 2021, 8, 728531. [Google Scholar] [CrossRef]
  25. Carpenter, D.L.; Anderson, R.R. An ISEE/whistler Model of Equatorial Electron Density in the Magnetosphere. J. Geophys. Res. Space Phys. 1992, 97, 1097–1108. [Google Scholar] [CrossRef]
  26. Abel, B.; Thorne, R.M. Electron scattering loss in Earth’s inner magnetosphere: 2. Sensitivity to model parameters. J. Geophys. Res. Space Phys. 1998, 103, 2397–2407. [Google Scholar] [CrossRef]
  27. Dahmen, N.; Sicard, A.; Brunet, A.; Santolik, O.; Pierrard, V.; Botek, E.; Darrouzet, F.; Katsavrias, C. FARWEST: Efficient computation of wave-particle interactions for a dynamic description of the electron radiation belt diffusion. J. Geophys. Res. Space Phys. 2022, 127, e2022JA030518. [Google Scholar] [CrossRef]
  28. Thorne, R.M.; Church, S.R.; Gorney, D.J. On the origin of plasmaspheric hiss: The importance of wave propagation and the plasmapause. J. Geophys. Res. Space Phys. 1979, 84, 5241–5247. [Google Scholar] [CrossRef]
  29. Ni, B.; Thorne, R.M.; Shprits, Y.Y.; Bortnik, J. Resonant scattering of plasma sheet electrons by whistler-mode chorus: Contribution to diffuse auroral precipitation. Geophys. Res. Lett. 2008, 35, L11106. [Google Scholar] [CrossRef]
  30. Albert, J.M. Evaluation of quasi-linear diffusion coefficients for whistler mode waves in a plasma with arbitrary density ratio. J. Geophys. Res. Space Phys. 2005, 110, A03218. [Google Scholar] [CrossRef]
  31. Cunningham, G.S.; Botek, E.; Pierrard, V.; Cully, C.; Ripoll, J.-F. Observation of High-Energy Electrons Precipitated by NWC Transmitter from PROBA-V Low-Earth Orbit Satellite. Geoph. Res. Lett. 2020, 47, e2020GL089077. [Google Scholar] [CrossRef]
  32. Claudepierre, S.G.; Ma, Q.; Bortnik, J.; O’Brien, T.P.; Fennell, J.F.; Blake, J.B. Empirically estimated electron lifetimes in the Earth’s radiation belts: Comparison with theory. Geophys. Res. Lett. 2020, 47, e2019GL086056. [Google Scholar] [CrossRef]
  33. Feinland, M.; Blum, L.W.; Marshall, R.A.; Gan, L.; Shumko, M.; Looper, M. Lightning-induced relativistic electron precipitation from the inner radiation belt. Nat. Commun. 2024, 15, 8721. [Google Scholar] [CrossRef] [PubMed]
  34. Linzmayer, V.; Němec, F.; Santolík, O.; Kolmašová, I. Lightning-Induced Energetic Electron Precipitation Observed in Long-Term DEMETER Spacecraft Measurements. J. Geophys. Res. Space Phys. 2024, 129, e2024JA032713. [Google Scholar] [CrossRef]
  35. Feinland, M.A.; Blum, L.W. Lightning-induced precipitation as a proxy for inner belt MeV electron decay times. J. Geophys. Res. Space Phys. 2025, 130, e2025JA034258. [Google Scholar] [CrossRef]
  36. Young, S.L.; Denton, R.E.; Anderson, B.J.; Hudson, M.K. Empirical model for μ scattering caused by field line curvature in a realistic magnetosphere. J. Geophys. Res. Space Phys. 2002, 107, 1069. [Google Scholar] [CrossRef]
  37. Selesnick, R.S.; Baker, D.N.; Jaynes, A.N.; Li, X.; Kanekal, S.G.; Hudson, M.K.; Kress, B.T. Inward diffusion and loss of radiation belt protons. J. Geophys. Res. Space Phys. 2016, 121, 1969–1978. [Google Scholar] [CrossRef]
  38. Selesnick, R.S.; Looper, M.D. Field-line curvature scattering at the outer boundary of the proton radiation belt. J. Geophys. Res. Space Phys. 2023, 128, e2023JA031509. [Google Scholar] [CrossRef]
  39. Young, S.L.; Denton, R.E.; Anderson, B.J.; Hudson, M.K. Magnetic field line curvature induced pitch angle diffusion in the inner magnetosphere. J. Geophys. Res. Space Phys. 2008, 113, A03210. [Google Scholar] [CrossRef]
  40. Albert, J.M.; Ginet, G.P. CRRES observations of radiation belt protons 2. Time-dependent radial diffusion. J. Geophys. Res. Space Phys. 1998, 103, 14865–14878. [Google Scholar] [CrossRef]
  41. Albert, J.M.; Ginet, G.P.; Gussenhoven, M.S. CRRES observations of radiation belt protons 1. Data overview and steady state radial diffusion. J. Geophys. Res. Space Phys. 1998, 103, 9261–9274. [Google Scholar] [CrossRef]
  42. Selesnick, R.; Looper, M.; Mewaldt, R. A theoretical model of the inner proton radiation belt. Space Weather 2007, 5, S04003. [Google Scholar] [CrossRef]
  43. Li, Z.; Engel, M.; Hudson, M.; Kress, B.; Patel, M.; Qin, M.; Selesnick, R. Solar energetic proton access to the inner magnetosphere during the September 7–8, 2017 event. J. Geophys. Res. Space Phys. 2021, 126, e2021JA029107. [Google Scholar] [CrossRef]
  44. Pierrard, V.; Ripoll, J.-F.; Cunningham, G.; Botek, E.; Santolik, O.; Thaller, S.; Kurth, W.; Cosmides, M. Observations and simulations of dropout events and flux enhancements in October 2013: Comparing MEO equatorial with LEO polar orbit. J. Geophys. Res. Space Phys. 2021, 126, e2020JA028850. [Google Scholar] [CrossRef] [PubMed]
  45. Ripoll, J.-F.; Pierrard, V.; Cunningham, G.S.; Chu, X.; Sorathia, K.A.; Hartley, D.A.; Thaller, S.A. Modeling of the cold electron plasma density for radiation belt physics. Front. Astron. Space Sci. 2023, 10, 1096595. [Google Scholar] [CrossRef]
  46. Pierrard, V.; Lopez Rosson, G. The effects of the big storm events in the first half of 2015 on the radiation belts observed by EPT/PROBA-V. Ann. Geophys. 2016, 34, 75–84. [Google Scholar] [CrossRef]
  47. Baker, D.N.; Jaynes, A.N.; Hoxie, V.C.; Thorne, R.M.; Foster, J.C.; Li, X.; Fennell, J.F.; Wygant, J.R.; Kanekal, S.G.; Erickson, P.J.; et al. An impenetrable barrier to ultrarelativistic electrons in the Van Allen radiation belts. Nature 2014, 515, 531–534. [Google Scholar] [CrossRef]
  48. Botek, E.; Pierrard, V.; Winant, A. Prediction of radiation belts electron fluxes at a Low Earth Orbit using neural networks with PROBA-V/EPT data. Space Weather 2023, 21, e2023SW003466. [Google Scholar] [CrossRef]
Figure 1. Differential electron fluxes measured by PROBA-V/EPT from 1 January 2020 to 15 September 2025 for the 6 EPT energy channels.
Atmosphere 17 00324 g001
Figure 2. PROBA-V/EPT electron fluxes in MeV−1 cm−2 s−1 sr−1 measured in channel 1 (0.5–0.6 MeV) from 1 May 2024 to 30 June 2024. The black dashed line represents the plasmapause position as obtained from the simplified BSPM plasmasphere model [22].
Atmosphere 17 00324 g002
Figure 3. EPT electron differential fluxes (x-axis) as a function of L (y axis) averaged every 4 days (dates given by the colour bar) from 17 May 2024 (black) to 18 June 2024 (red) (upper panels) and from 1 July 2024 (black) to 30 August 2024 (red) after the new storm of 28 June 2024 (bottom panels) in Ch1 (0.5–0.6 MeV), Ch3 (0.7–0.8 MeV), and Ch5 (1–2.4 MeV).
Atmosphere 17 00324 g003aAtmosphere 17 00324 g003b
Figure 4. (Top) panel: PROBA-V/EPT electron fluxes measured in Ch1 (0.5–0.6 MeV) from 1 October 2024 to 15 November 2024 as a function of L and time. (Bottom) panels: EPT electron differential flux profiles as a function of L (y axis) averaged every 4 days (dates given by the colour scale) from 1 October 2024 (black) to 29 October 2024 (red) in Ch1 (0.5–0.6 MeV) (middle), and Ch5 (1–2.4 MeV) (bottom).
Atmosphere 17 00324 g004
Figure 5. Electron flux variations (in orange) in logarithmic scale measured by EPT in Ch1 (0.5–0.6 MeV) from 1 January to 31 December 2024 at L = 1.65 (max), 1.85 (min), 2.15 (max), 2.45 (min), 3.05 (max), 3.85 (min), and 5.05 (max). Fittings by linear regressions for the flux decreases after the flux injections are superposed. The slope (coloured solid lines) gives the lifetime after each event, and their values λ are indicated with the standard deviation, alternatively at the bottom and top of each panel. A coloured vertical dashed line relates the drawn slope to its value at the bottom or top of the panel. The number of fitted events (N), mean lifetimes, median lifetimes, and standard deviation are indicated above each panel.
Atmosphere 17 00324 g005aAtmosphere 17 00324 g005bAtmosphere 17 00324 g005cAtmosphere 17 00324 g005d
Figure 6. Mean electron lifetimes from L = 1.3 to 7.5 were obtained with the EPT observations from 1 January 2024 to 1 January 2025. The standard deviations are given by the shaded regions. The lifetimes are slightly longer for high energy (Ch5 in orange) than for low energy (Ch1 in black).
Atmosphere 17 00324 g006
Figure 7. Proton differential flux as a function of L and time measured by PROBA-V/EPT from 1 January 2024 to 15 May 2025 in the 6 proton channels with a time resolution of 1 day and L resolution of 0.1 Re.
Atmosphere 17 00324 g007
Figure 8. Proton differential flux averaged every 28 days as a function of L measured by PROBA-V/EPT from 7 January 2024 (black) to 18 August 2024 (red) in Ch1 (9.5–13 MeV) (top left panel) and Ch2 (13–29 MeV) (top right), Ch3 (29–61 MeV) (middle left), Ch4 (61–92 MeV) (middle right), Ch5 (92–126 MeV) and Ch6 (126–155 MeV) (bottom panels). The colour of the profiles specifies the date.
Atmosphere 17 00324 g008
Figure 9. Proton flux variations in logarithmic scale measured by EPT in Ch1 (9.5–13 MeV) from 1 January to 31 December 2024 at L = 1.85 (in orange). The fit with a linear regression of the flux decrease after the flux injection of May 2024 is superposed in blue. The slope gives the lifetime after the May 2024 event, indicating 146.88 days on average.
Atmosphere 17 00324 g009
Figure 10. Mean lifetime of protons (red line) after the May 2024 storm in Ch1 (9.5–13 MeV) from L = 1.7 to 2.2 determined from EPT observations. The shaded red region corresponds to the lifetime standard error of the linear regression fits. The black dashed line illustrates the relative error (in percentage) obtained by dividing the standard error by the mean lifetime at each L value.
Atmosphere 17 00324 g010
Figure 11. Proton flux variations in logarithmic scale measured by EPT from 1 January to 31 December 2024 (in orange) in Ch2 (13–29 MeV) at L = 2.35 (1st panel) and L = 2.45 (2nd panel) and in Ch3 (29–61 MeV) at L = 2.15 (3rd panel) and L = 2.25 (4th panel). The linear fit of the flux increase that followed the sharp flux loss of May 2024 is superposed in blue, and in green for the 10 October 2024 storm. The slopes give the refilling time (in days), and the mean, median, and standard deviation are indicated in the upper left corner of each panel.
Atmosphere 17 00324 g011aAtmosphere 17 00324 g011b
Figure 12. Maps of electron 0.5–0.6 MeV (top panel) and proton fluxes 9.5–13 MeV (bottom panel) observed by PROBA-V/EPT at the altitude of 820 km from 5 August 2024 to 11 August 2024, averaged in bins of 4° in latitude and longitude. The grey lines correspond to L = 2.5.
Atmosphere 17 00324 g012
Table 1. Summary of the mean lifetimes in Ch1 compared to the lifetimes after 11 May 2024 for increasing L values.
LMean Lifetime (Days)Lifetime After 11 May (Days)Belt or Slot After 11 May
1.65160160B1
1.858484S1
2.152227B2
2.455.93.7S2
3.052.9 3.8B3
3.854.2 3.7S3
5.054.314.7B4
Disclaimer/Publisher’s Note: The statements, opinions and data contained in all publications are solely those of the individual author(s) and contributor(s) and not of MDPI and/or the editor(s). MDPI and/or the editor(s) disclaim responsibility for any injury to people or property resulting from any ideas, methods, instructions or products referred to in the content.