Article

Significant Contributions of Gasoline Evaporation to Wintertime VOCs: Evidence from Online Measurements


1
Collaborative Innovation Center of Atmospheric Environment and Equipment Technology, Jiangsu Key Laboratory of Atmospheric Environment Monitoring and Pollution Control, School of Environmental Science and Engineering, Nanjing University of Information Science & Technology, Nanjing 210044, China
2
College of Environmental Sciences and Engineering, Peking University, Beijing 100871, China
3
Changzhou Ecological and Environmental Monitoring Center, Changzhou 213000, China
4
School of Ecological Environment and Urban Construction, Fujian University of Technology, Fuzhou 350118, China
5
The Jiangsu Key Laboratory of Electronic Waste and New Energy Solid Waste Resource Utilization, School of Resources and Environmental Engineering, Jiangsu University of Technology, Changzhou 213001, China
*
Author to whom correspondence should be addressed.
Atmosphere 2026, 17(3), 278; https://doi.org/10.3390/atmos17030278
Submission received: 22 January 2026 / Revised: 1 March 2026 / Accepted: 4 March 2026 / Published: 6 March 2026
(This article belongs to the Section Air Quality)

Abstract

The evaporation of gasoline serves as an important contributor to volatile organic compounds (VOCs) within urban regions. However, most previous studies have focused on summertime gasoline evaporation, with relatively limited attention to wintertime emissions. Within the present research, online VOC monitoring was carried out at three urban locations across Beijing over the winter seasons of 2014–2015 and 2021–2022. A wintertime gasoline evaporation VOC source profile was established using enhancement ratio analysis and positive matrix factorization, based on observations at a site near a gasoline station. The results show that n-butane dominated wintertime gasoline evaporation VOCs (35%), exceeding i-pentane (20%), in contrast to the i-pentane dominance reported in previous studies. The chemical mass balance (CMB) model was then applied to apportion VOC sources and assess the sensitivity to different gasoline evaporation source profiles. Gasoline evaporation was found to contribute 12–17% of wintertime VOCs, 2.3–3 times higher than estimates based on the literature profiles. Comparisons between the winters of 2014–2015 and 2021–2022 reveal a 63% decrease in VOC concentrations, with the coal combustion contribution dropping by 85% and vehicular exhaust and gasoline evaporation by 51–60%. These findings demonstrate that gasoline evaporation remains a non-negligible VOC source in winter and highlight that season- and observation-based source profiles are essential for reliable VOC source apportionment and effective air quality management.

1. Introduction

Ambient volatile organic compounds (VOCs) act as critical precursors for the generation of secondary organic aerosols [1,2] and ground-level ozone [3]. VOCs arise from a wide variety of natural and anthropogenic sources [4,5]. In urban areas, VOC concentrations are strongly affected by anthropogenic sources, including vehicle exhaust, gasoline evaporation, industrial processes, and paint and solvent use [6,7,8]. In recent years, the progressive tightening of tailpipe emission standards for vehicles [9], together with the relocation of industrial facilities away from urban centers, have led to substantial reductions in VOC emissions from these sources. However, with the continuous growth in vehicle population and gasoline consumption, gasoline evaporation from fueling stations has increasingly become a major contributor to urban VOC emissions [7,10,11,12,13]. Receptor model studies conducted in the Beijing–Tianjin–Hebei region and Shanghai, China, have shown that gasoline evaporation contributed approximately 16% and 18% of anthropogenic VOCs in summer, respectively, ranking behind only industrial sources and vehicle exhaust [7,14]. Studies in overseas urban regions have reported even higher contributions from gasoline evaporation, highlighting its growing importance in urban VOC budgets. For example, receptor model analyses in the New York metropolitan area indicated that gasoline evaporation accounted for as much as 34% of ambient VOC concentrations during the period from 2000 to 2021 [13].
Quantitative source apportionment of urban VOCs using receptor models requires detailed information on the chemical composition of emissions from individual sources: namely, VOC source profiles. Consequently, gasoline evaporation source profiles have received increasing attention in previous studies. VOC emissions associated with gasoline evaporation at fueling stations mainly arise from vehicle refueling operations, gasoline loading and unloading, tank breathing and emptying, and fuel hose overflows [15], among which vehicle refueling has been identified as the dominant emission process [16]. Previous studies have established gasoline evaporation VOC source profiles using laboratory-based simulation and characterization approaches [17,18,19]. For instance, Wang et al. (2023) simulated gasoline evaporation emissions using a vehicle testing sealed housing for evaporative determination (VT-SHED) system, covering processes such as refueling, running losses, hot soak, and diurnal breathing losses, and identified refueling as the dominant emission process [18]. Alkanes accounted for more than 70% of VOC emissions from gasoline evaporation, with pentanes being the most abundant species [18]. In addition, headspace experiments indicated that alkanes, alkenes, and aromatics accounted for 59–72%, 18–28%, and 4–10% of gasoline vapors, respectively, with pentanes being the predominant components [20]. However, laboratory-simulated gasoline evaporation emissions may not fully represent real-world emissions from fueling stations [21]. To date, although only a scarce number of investigations have characterized gasoline evaporation VOCs through offline sampling at fueling stations [22], investigations based on online measurements remain particularly scarce.
Gasoline evaporation VOC source profiles are influenced by both gasoline type and composition [23,24,25], as well as environmental conditions [24,25,26,27,28]. Winter gasoline typically exhibits a higher Reid vapor pressure (RVP) than summer gasoline to facilitate cold engine starts [29]. Consequently, the fraction of pentanes in liquid gasoline was lower in winter (9%) than that in summer (11%), whereas the fraction of butanes increased to 4%: more than seven times that in summer [30]. Moreover, because the temperature dependence of VOC evaporation rates varies among individual compounds, with less volatile species exhibiting stronger temperature sensitivity [31], the ambient temperature also affects both the emission rates and chemical composition of gasoline evaporation VOCs [22,32,33]. Prior studies have reported that within the temperature range of 298–313 K, the proportion of alkanes increases with the increasing temperature [28]. Field measurements conducted at fueling stations by Sun et al. (2024) further showed that the contributions of C4–C5 alkanes in summer (41%) were significantly lower than those in winter (69%) [22]. Nevertheless, studies focusing on the seasonal differences in gasoline evaporation VOC emission characteristics remain limited [34], with most research concentrating on the summer conditions.
In this study, winter online VOC monitoring was carried out at three urban locations across Beijing over the periods of 2014–2015 and 2021–2022. Observations from a site located near a gasoline station were used to identify VOC species strongly influenced by gasoline evaporation, and enhancement ratio analysis (ERA) along with positive matrix factorization (PMF) were subsequently applied to derive wintertime gasoline evaporation VOC source profiles. The discrepancies between the gasoline evaporation VOC source profiles obtained in this study and those reported in previous studies, as well as their influence on VOC source apportionment, were then evaluated using the chemical mass balance (CMB) model. Finally, changes in wintertime VOC concentrations from individual sources between 2015 and 2021, along with the impacts of control strategies, were analyzed to evaluate the effectiveness of emission mitigation measures.

2. Materials and Methods

2.1. Field Observation Period and Sites

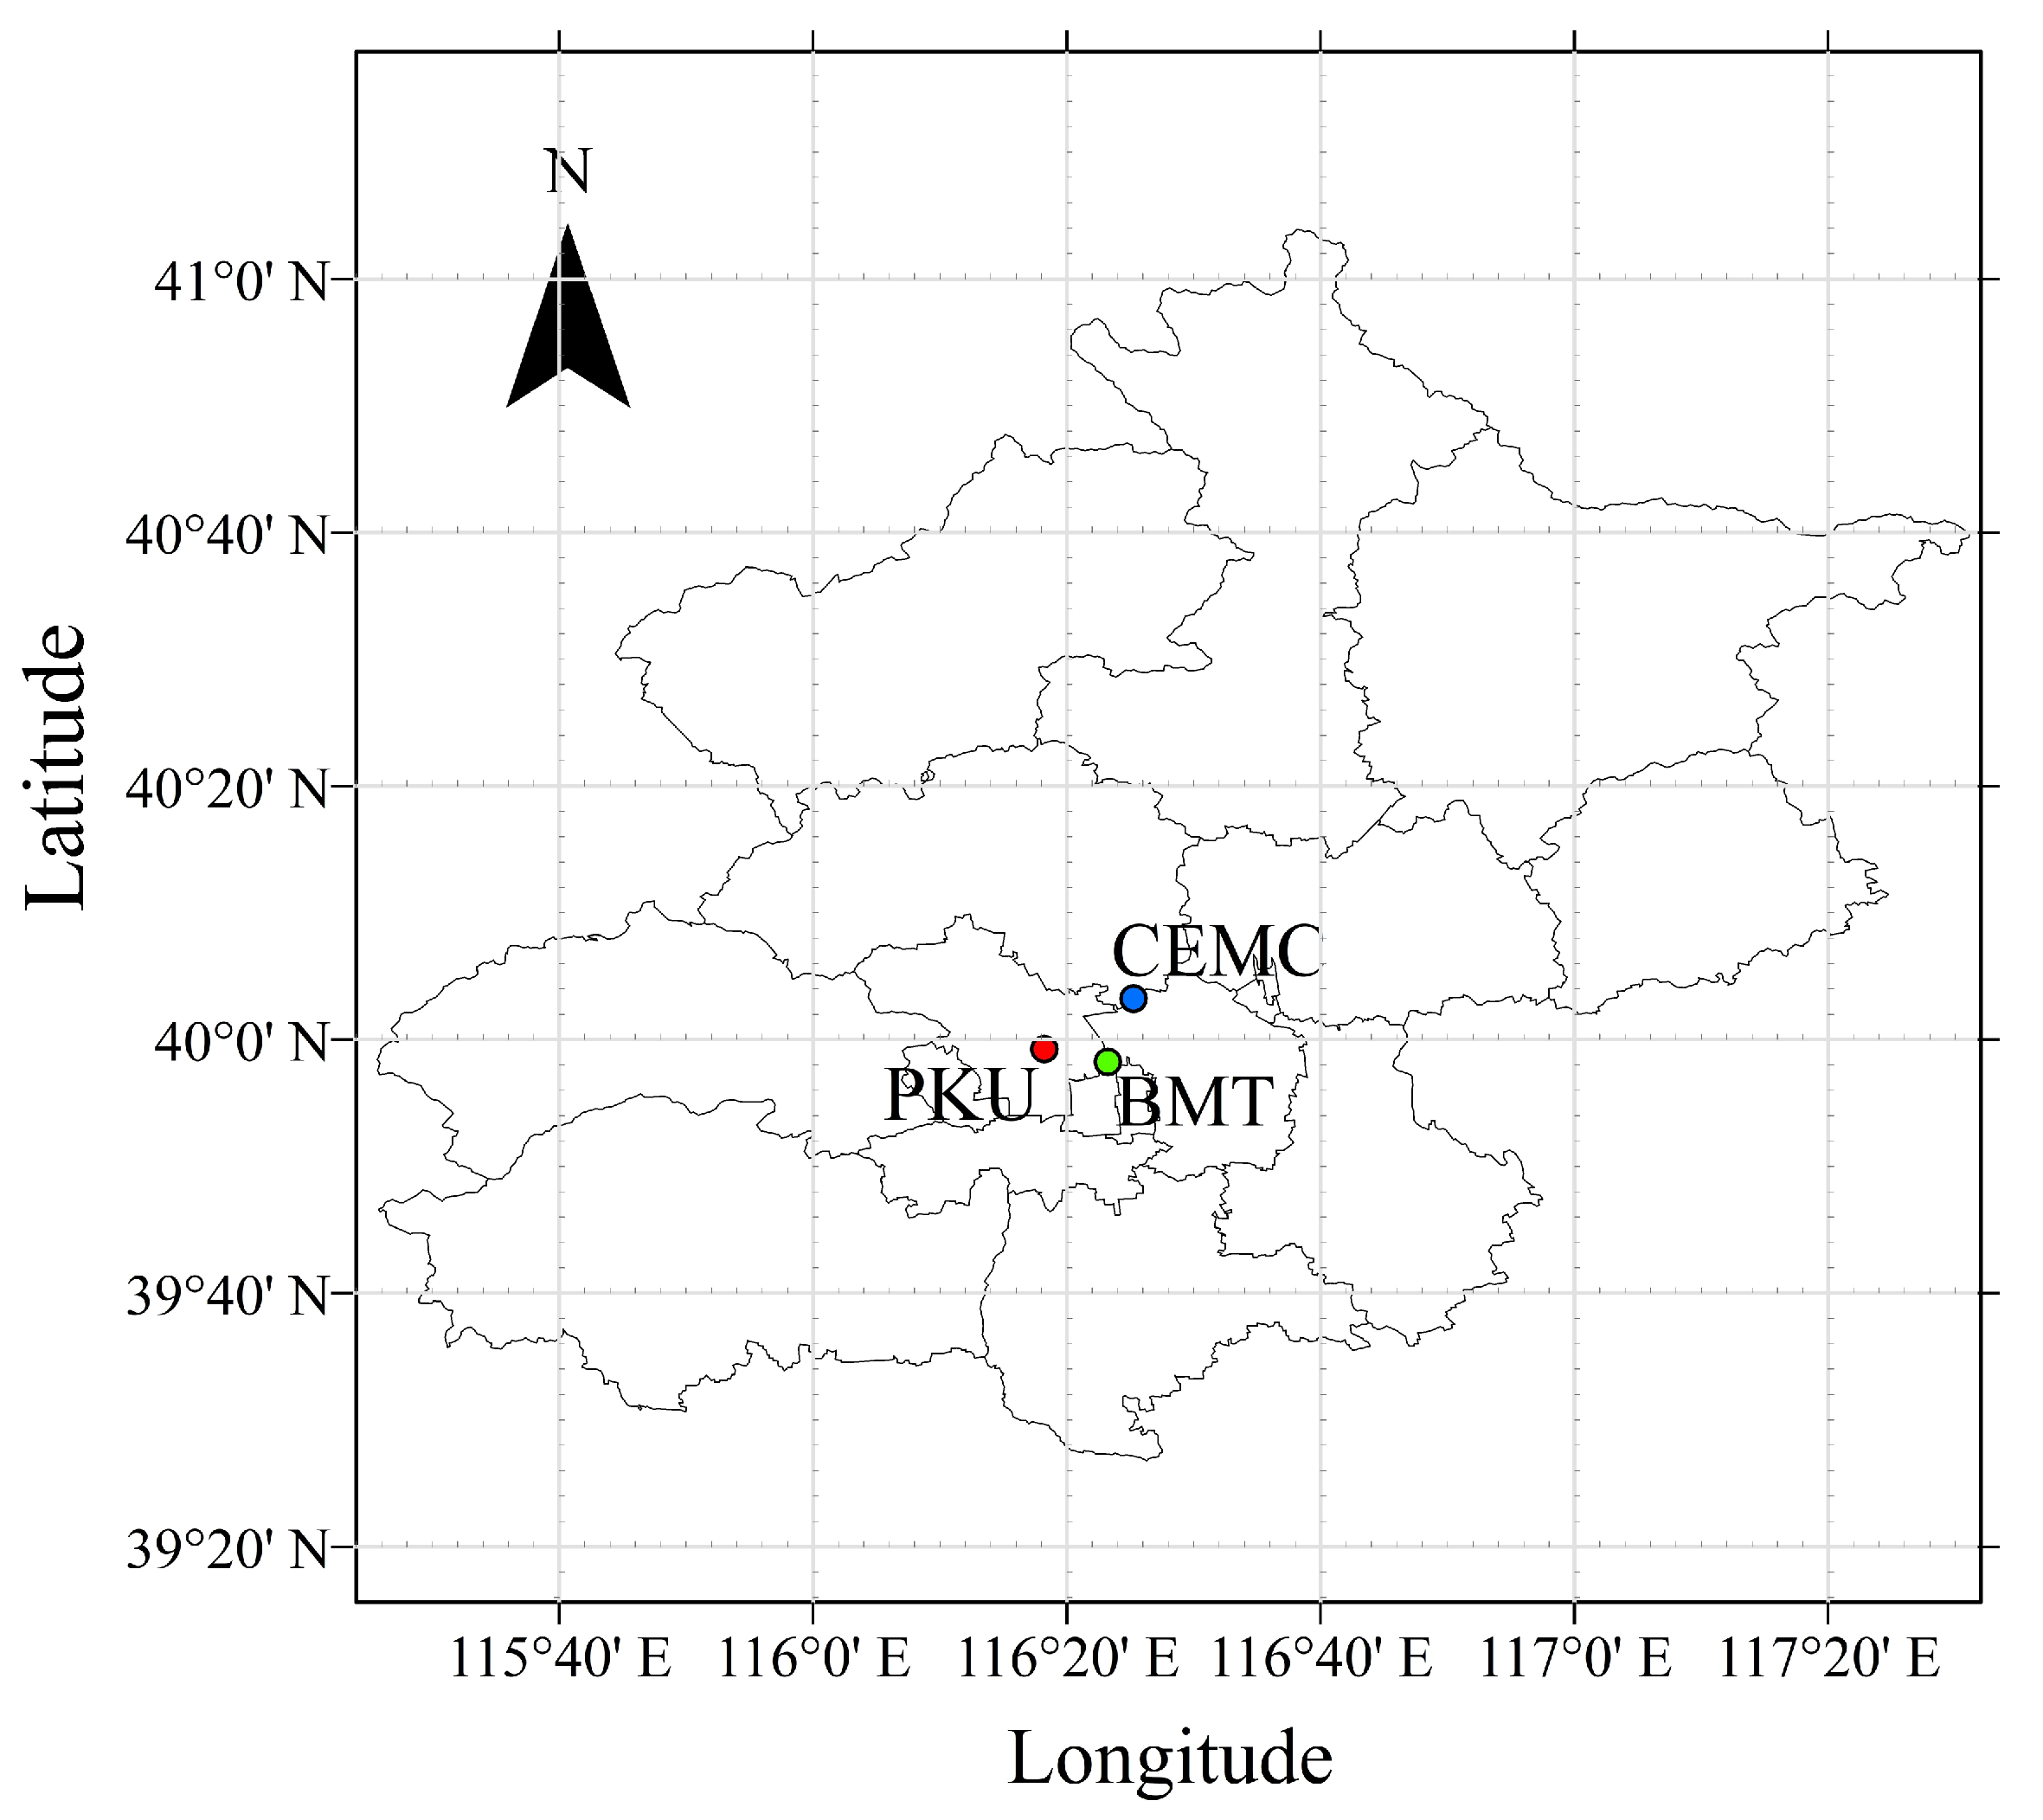
In this study, online VOC measurements were conducted at three observation sites: BMT (116°23′ E, 39°58′ N), PKU (116°18′ E, 39°59′ N), and CEMC (116°25′ E, 40°03′ N). All three sites are situated in the northern urban region of Beijing and are predominantly surrounded by residential and commercial districts, with no obvious nearby industrial emission sources (Figure 1). The BMT site is located approximately 100 m south of a gasoline station. In contrast, no apparent local emission sources were identified near the PKU and CEMC sites, which are considered to be representative of the urban atmospheric environment in Beijing. The distance between the BMT and PKU sites is approximately 6 km, while the distance between the PKU and CEMC sites is approximately 10 km. Detailed descriptions of the PKU and CEMC site can be found in Li et al. (2019) [35] and Chai et al. (2023) [36], respectively. Online VOC measurements at the BMT site were conducted from 5 November 2014 to 25 January 2015 with 1 h temporal resolution (82 days, 1671 observation data). Online VOC measurements at the PKU site were conducted from 1 November to 1 December 2014 (31 days, 653 observation data). The measurements at the CEMC site were conducted from 1 November 2021 to 31 January 2022 (92 days, 1725 observation data). The corresponding average ambient temperatures were −4.33 °C and 2.12 °C, respectively, which are both representative of wintertime atmospheric conditions in Beijing.

2.2. VOC Measurements

In this study, ambient VOCs were measured online using an automated gas chromatography–mass spectrometry/flame ionization detection system (GC–MS/FID) developed by Peking University. A detailed description of the system and its operating principles can be found in Wang et al. (2014) [37]. Briefly, ambient air was sampled through two parallel channels into a preconcentration system, where VOCs were trapped and enriched using two traps. The enriched VOCs were subsequently thermally vaporized and transferred to the gas chromatographic system for analysis. In total, 55 VOC species were quantitatively measured (Appendix A), including 54 non-methane hydrocarbons (NMHCs)—comprising 27 alkanes, 12 alkenes, acetylene, and 14 aromatic hydrocarbons—as well as methyl tert-butyl ether (MTBE). Before the campaign, calibration curves for each VOC species were established at five mixing ratios (0.5, 1, 2, 4, and 8 ppbv), using the commercial 56-NMHC mixture standard gases (Spectra Gases Inc., Branchburg, NJ, USA), with the coefficient of determination (r2) for individual species ranging from 0.99 to 1.00. The limits of detection (LOD) were determined by following the U.S. EPA Method TO-15 by analyzing seven replicates of a low-level standard near the expected detection limit and calculating LOD = 3.14 × standard deviation (SD), yielding LODs of 0.005–0.026 ppbv. The GC-MS/FID stability was tracked via hourly checks of 0.5 ppbv internal standard responses (bromochloromethane, 1,4-difluorobenzene, and 1-bromo-3-fluorobenzene), injected concurrently with the ambient samples, and daily calibration using a 2-ppbv standard gas mixture. The relative standard deviation of daily calibration during the campaigns was between 1% and 6%.

2.3. Enhancement Ratios (ERs)

MTBE is an important gasoline additive [38,39,40] and was therefore used as a tracer for gasoline evaporation in this study. Three approaches were applied to calculate the enhancement ratios (ERs) of individual VOC species relative to MTBE, in order to characterize the chemical profile of gasoline evaporation VOCs. Specifically, the following methods were employed: linear regression using all measurement data, with the slope of the regression representing the ER (LR method); data screening based on the MTBE concentration and MTBE-to-acetylene ratio (MTBE/acetylene), in which data influenced by gasoline evaporation were first selected using thresholds of MTBE > 0.8 ppbv and MTBE/acetylene > 0.03 ppbv ppbv−1, followed by the calculation of the median ratio of each VOC species to MTBE (median method); and local outlier factor-based linear regression (LOF-LR method), in which data associated with anomalously high MTBE concentrations were identified using the LOF method, after which the linear regression slope for these high-value data points was taken as the ER.

2.4. VOC Source Apportionment

In this study, the positive matrix factorization (PMF (v5.0)) and the chemical mass balance (CMB (v8.2)) receptor models developed by the U.S. Environmental Protection Agency were applied to quantitatively apportion the VOC sources.
The CMB model assumes that ambient VOCs follow the principle of mass conservation during transport from emission sources to the receptor site. By inputting the observed VOC concentrations ( c ) and the VOC chemical source profiles of individual emission sources ( a ), the contributions of each source ( s ) are estimated using the least-squares optimization approach [41,42].
c j i = j = 1 p a j k · s k i
where c j i represents the mass concentration of species j in sample i , s k i denotes the contribution of source k to sample i , a j k represents the mass fraction of species j in source k , and p is the number of sources. Based on previous VOC source apportionment studies conducted in Beijing [43,44,45], source profiles from five source categories were input into the CMB model to quantify their contributions, including vehicular exhaust, liquefied petroleum gas (LPG) use, paint and solvent use, coal combustion, and gasoline evaporation. The VOC source profiles for the first four source categories were obtained from the literature [46,47]. To evaluate the sensitivity of the CMB results to the choice of gasoline evaporation source profiles, three different profiles were separately applied in the CMB analysis for three winter VOC datasets in Beijing, including 2014–2015 BMT, 2014–2015 PKU, and 2021–2022 CEMC. These profiles included: Profile A, derived from headspace experiments [46]; Profile B, obtained from wintertime offline measurements at a gasoline station [22]; and Profile C, the source profile established in this study based on online observations. The CMB performance was evaluated using three indicators: r2, for which values closer to 1 indicate better agreement between calculated and observed concentrations; the mass closure (mass%) refers to the percentage of the measured mass explained (reconstructed) by the sum of the CMB-apportioned sources, for which values closer to 1 indicate better closure; and the percentage of negative source contributions, for which lower values indicate better model performance. A total of 23 VOCs was selected as fitting species, including C2–C9 alkanes, toluene, acetylene, and isoprene.
The PMF model decomposes the VOC mass concentration matrix, x , into a source profile matrix, f , and a contribution matrix, g , by minimizing the residual matrix, e , to obtain the optimal solution [48,49,50].
x i j = k = 1 p g i k · f k j + e i j
where g i k denotes the contribution of factor k to sample i , f k j represents the mass percentage of species j in factor k , e i j is the residual of VOC species j in sample i , and p represents the number of factors.
In this study, 29 VOC species with high concentrations and signal-to-noise ratios greater than 4 were selected as fitting species. The summed concentrations of these species accounted for 75–98% of the total VOC concentration. The number of PMF factors was tested from three to eight, and the results indicated that the five-factor solution could be associated with physically meaningful emission sources. Accordingly, the five-factor PMF solution was adopted for VOC source apportionment.

2.5. Vector Similarity Analysis (VSA)

In this study, vector similarity analysis (VSA) [51,52] was applied to evaluate the similarity among different gasoline evaporation VOC source profiles. Each VOC source profile is treated as a multidimensional vector, with each dimension corresponding to an individual VOC species. The similarity between two source profile vectors ( x , y ) is quantified by the angle θ :
cos θ = x · y x · y
Based on the angle θ , the similarity between two source profiles is classified into four levels: 0–15° indicates that the two profiles are highly consistent, 15–30° indicates good agreement, 30–50° indicates noticeable differences between the profiles, and θ values greater than 50° indicate significant differences [52].

3. Results

3.1. VOCs Observations from November 2014 to January 2015

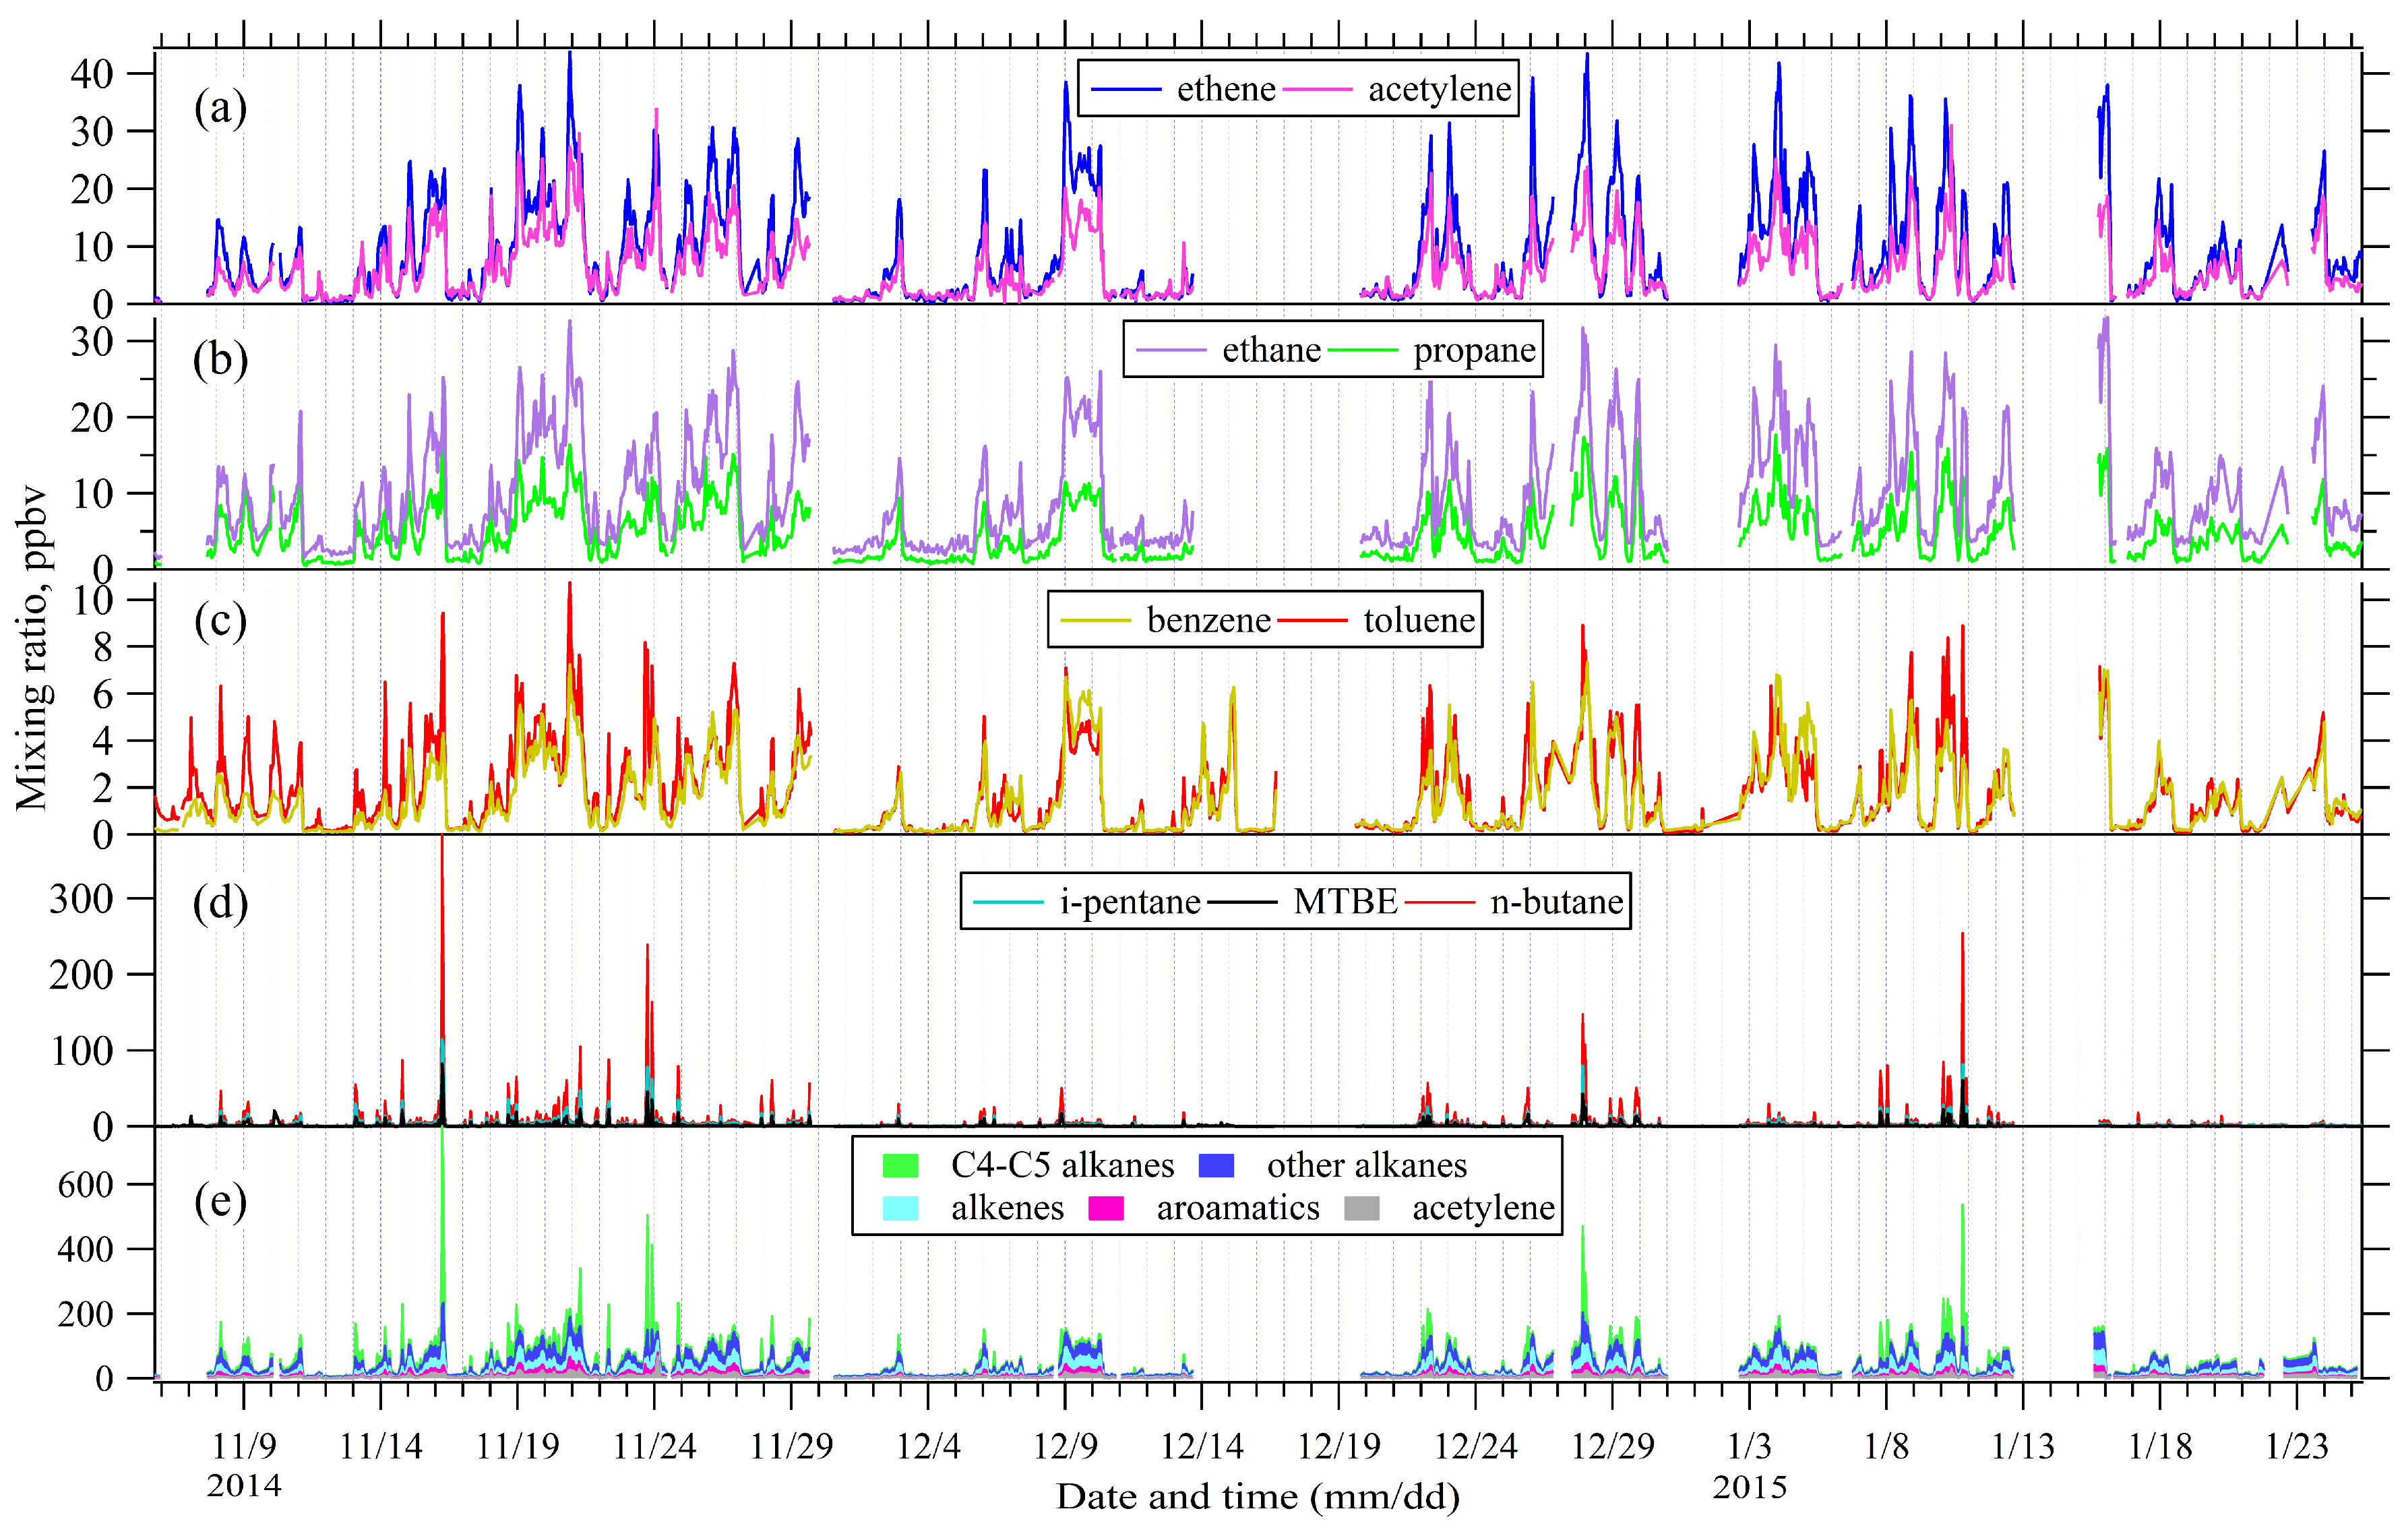
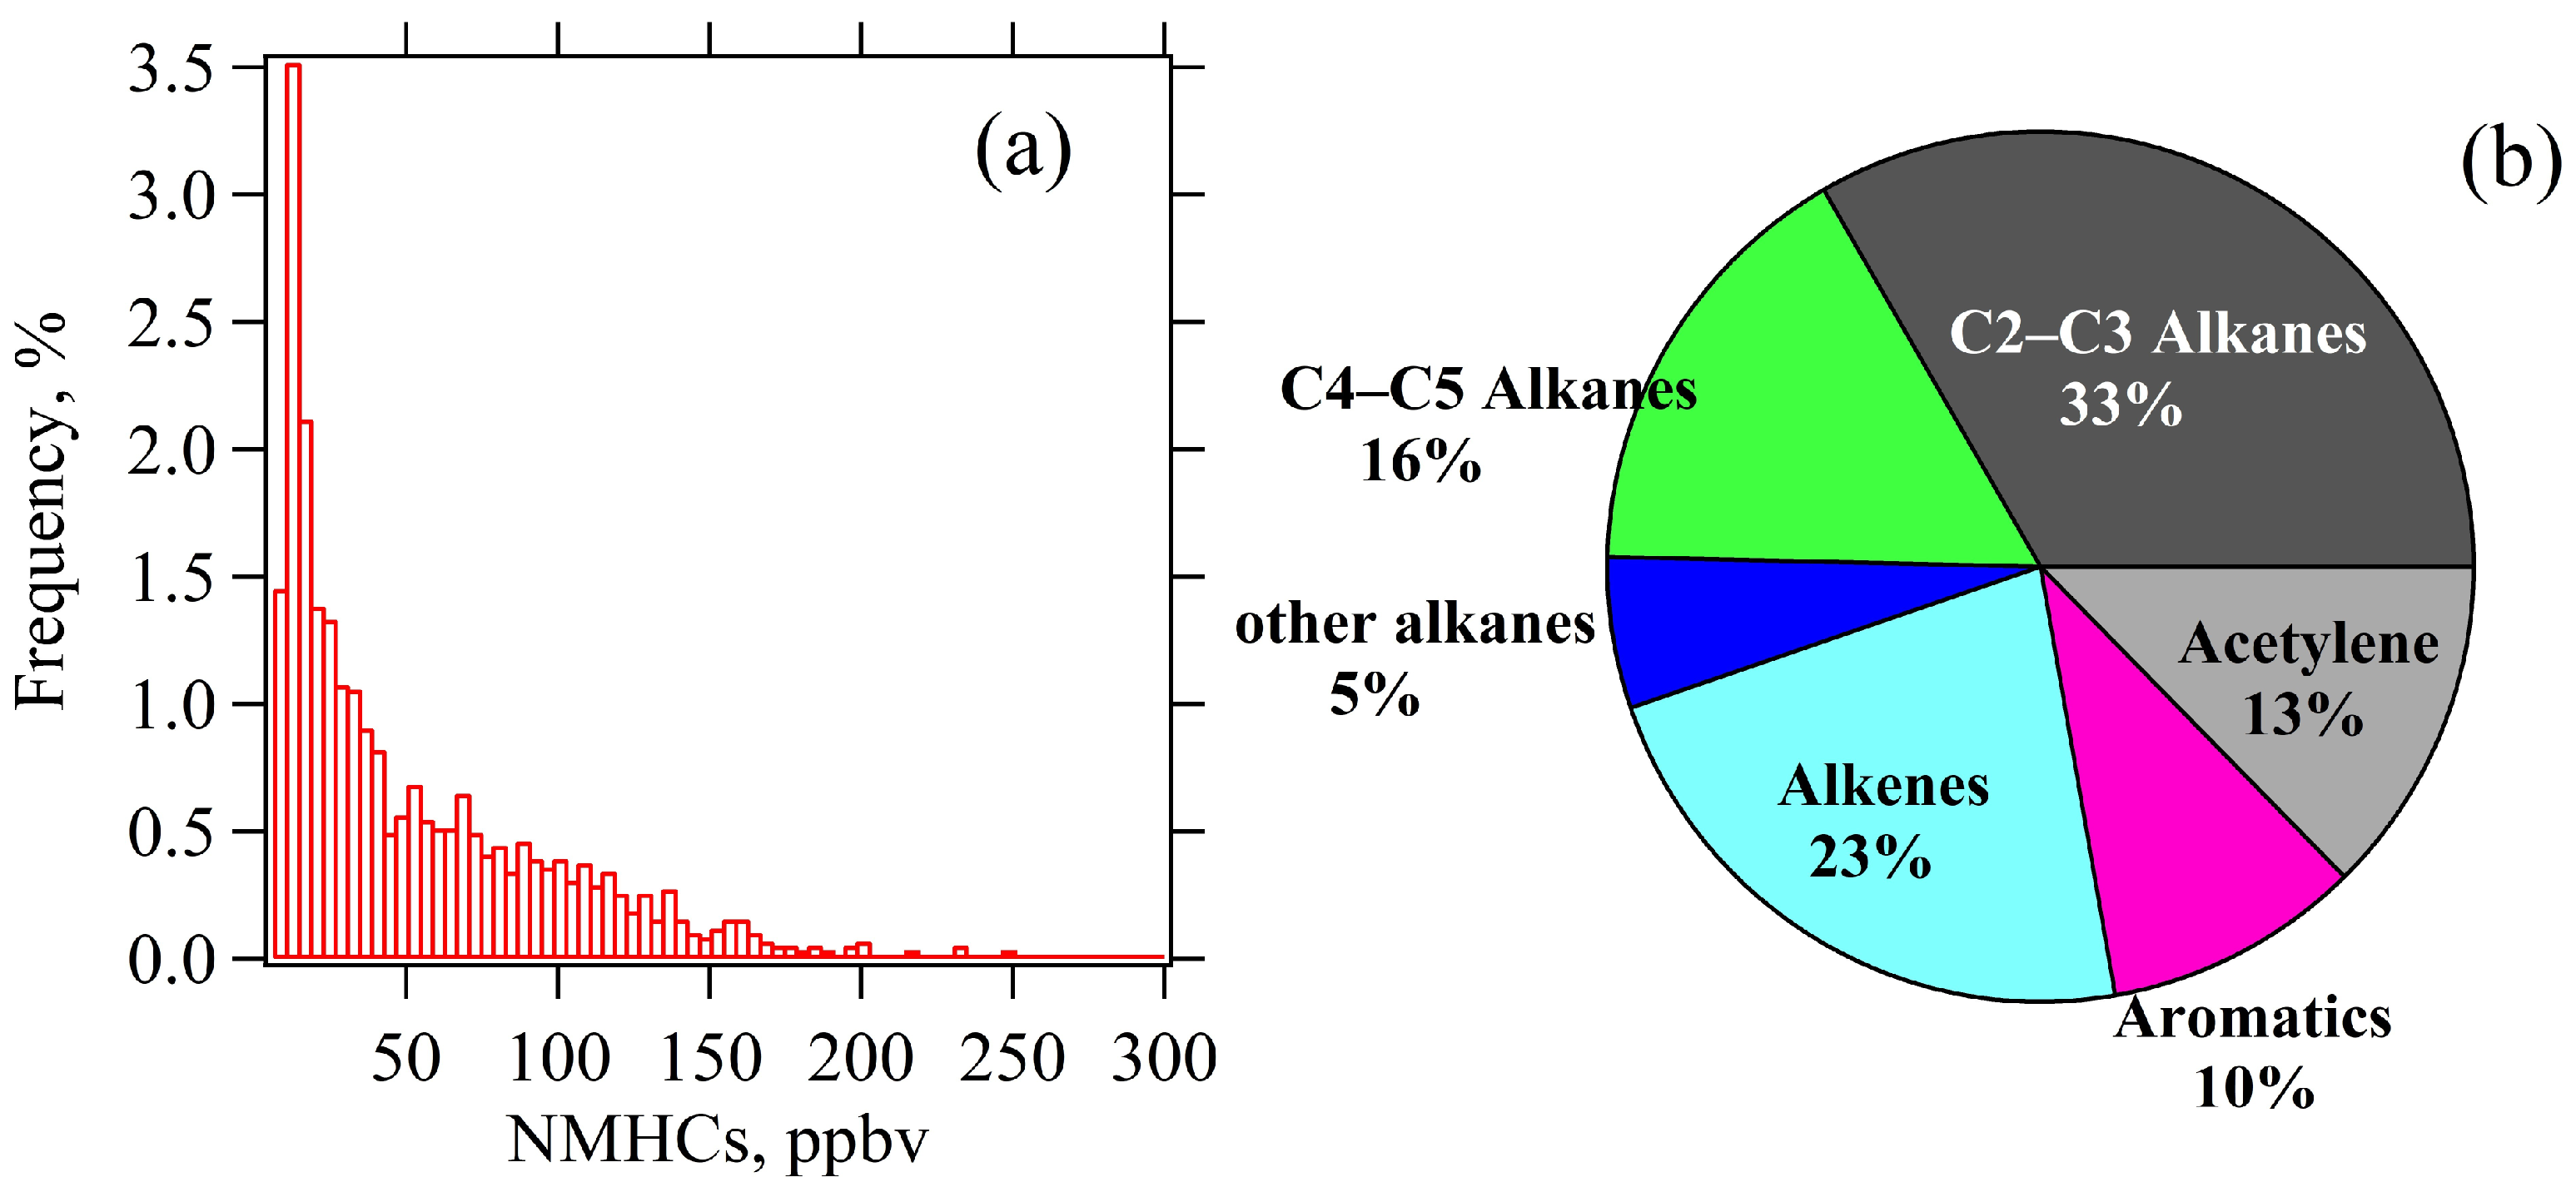
During the observation period from 5 November 2014 to 25 January 2015, NMHCs and MTBE concentrations at the BMT site exhibited pronounced variability, with NMHCs ranging from 6.94 to 779 ppbv (Figure 2e). Peak concentrations frequently occurred during nighttime and the early morning hours, and the corresponding frequency distribution had a pronounced right-skewed tail (Figure 3a), suggesting a strong influence from local emission sources. In terms of average chemical composition, C2–C3 alkanes were the dominant components of NMHCs, contributing 30% ± 10%, followed by alkenes (23% ± 7%), C4–C5 alkanes (20% ± 10%), acetylene (13% ± 4%), aromatic hydrocarbons (10% ± 4%), and other alkanes (10% ± 4%) (Figure 3b). In addition, several representative species—including ethene, acetylene, ethane, propane, benzene, toluene, n-butane, i-pentane, and MTBE—were selected to examine their concentration variations. Although all these species exhibited substantial temporal variability during the observation period, n-butane, i-pentane, and MTBE showed synchronous concentration peaks at certain times, with levels reaching several hundred ppbv. Given that MTBE is a widely used gasoline additive [12,38], these observations suggest that the VOCs measured at the BMT site were strongly influenced by gasoline evaporation and/or vehicle exhaust emissions.
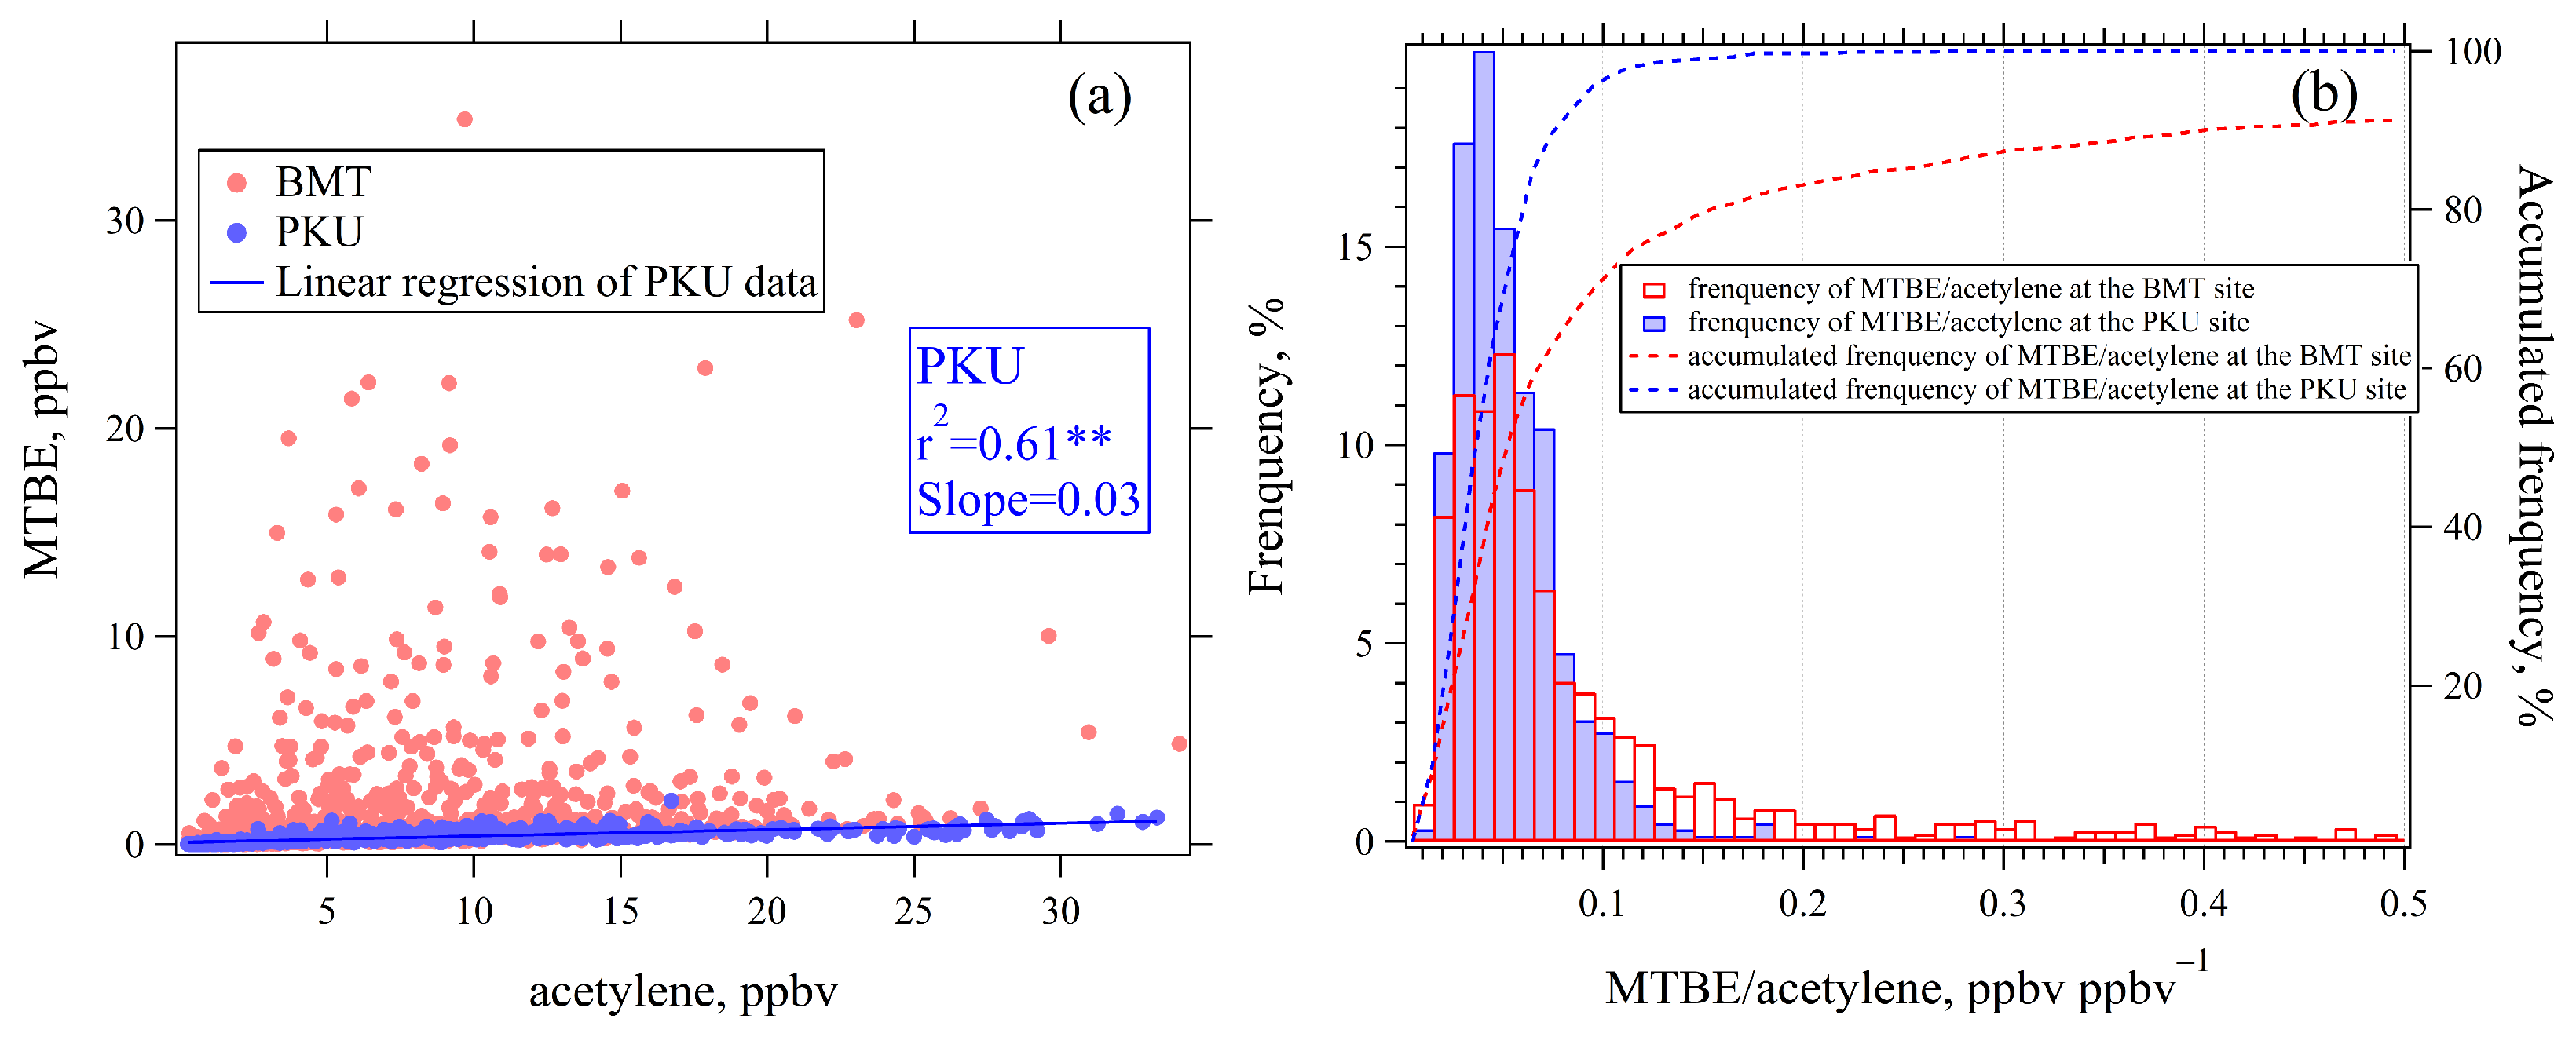
Further analysis of the correlation between the MTBE and acetylene mixing ratios revealed a weak relationship at the BMT site (r2 = 0.06, p > 0.05). In contrast, a significant correlation was observed at the PKU site (r2 = 0.61, p < 0.05), with a slope of 0.03 derived from linear regression (Figure 4a). The frequency distribution of the MTBE/acetylene ratios further indicates that data points with MTBE/acetylene ratios greater than 0.1 account for only 2% of the total observations at the PKU site, whereas this proportion increases to 25% at the BMT site (Figure 4b). Considering that acetylene in urban environments is primarily emitted from incomplete combustion processes such as vehicular exhaust [53], the elevated MTBE/acetylene ratios observed at the BMT site suggest that this site is substantially influenced by gasoline evaporation.

3.2. Wintertime VOC Source Profiles from Gasoline Evaporation

Enhancement Ratios of NMHCs, Relative to MTBE

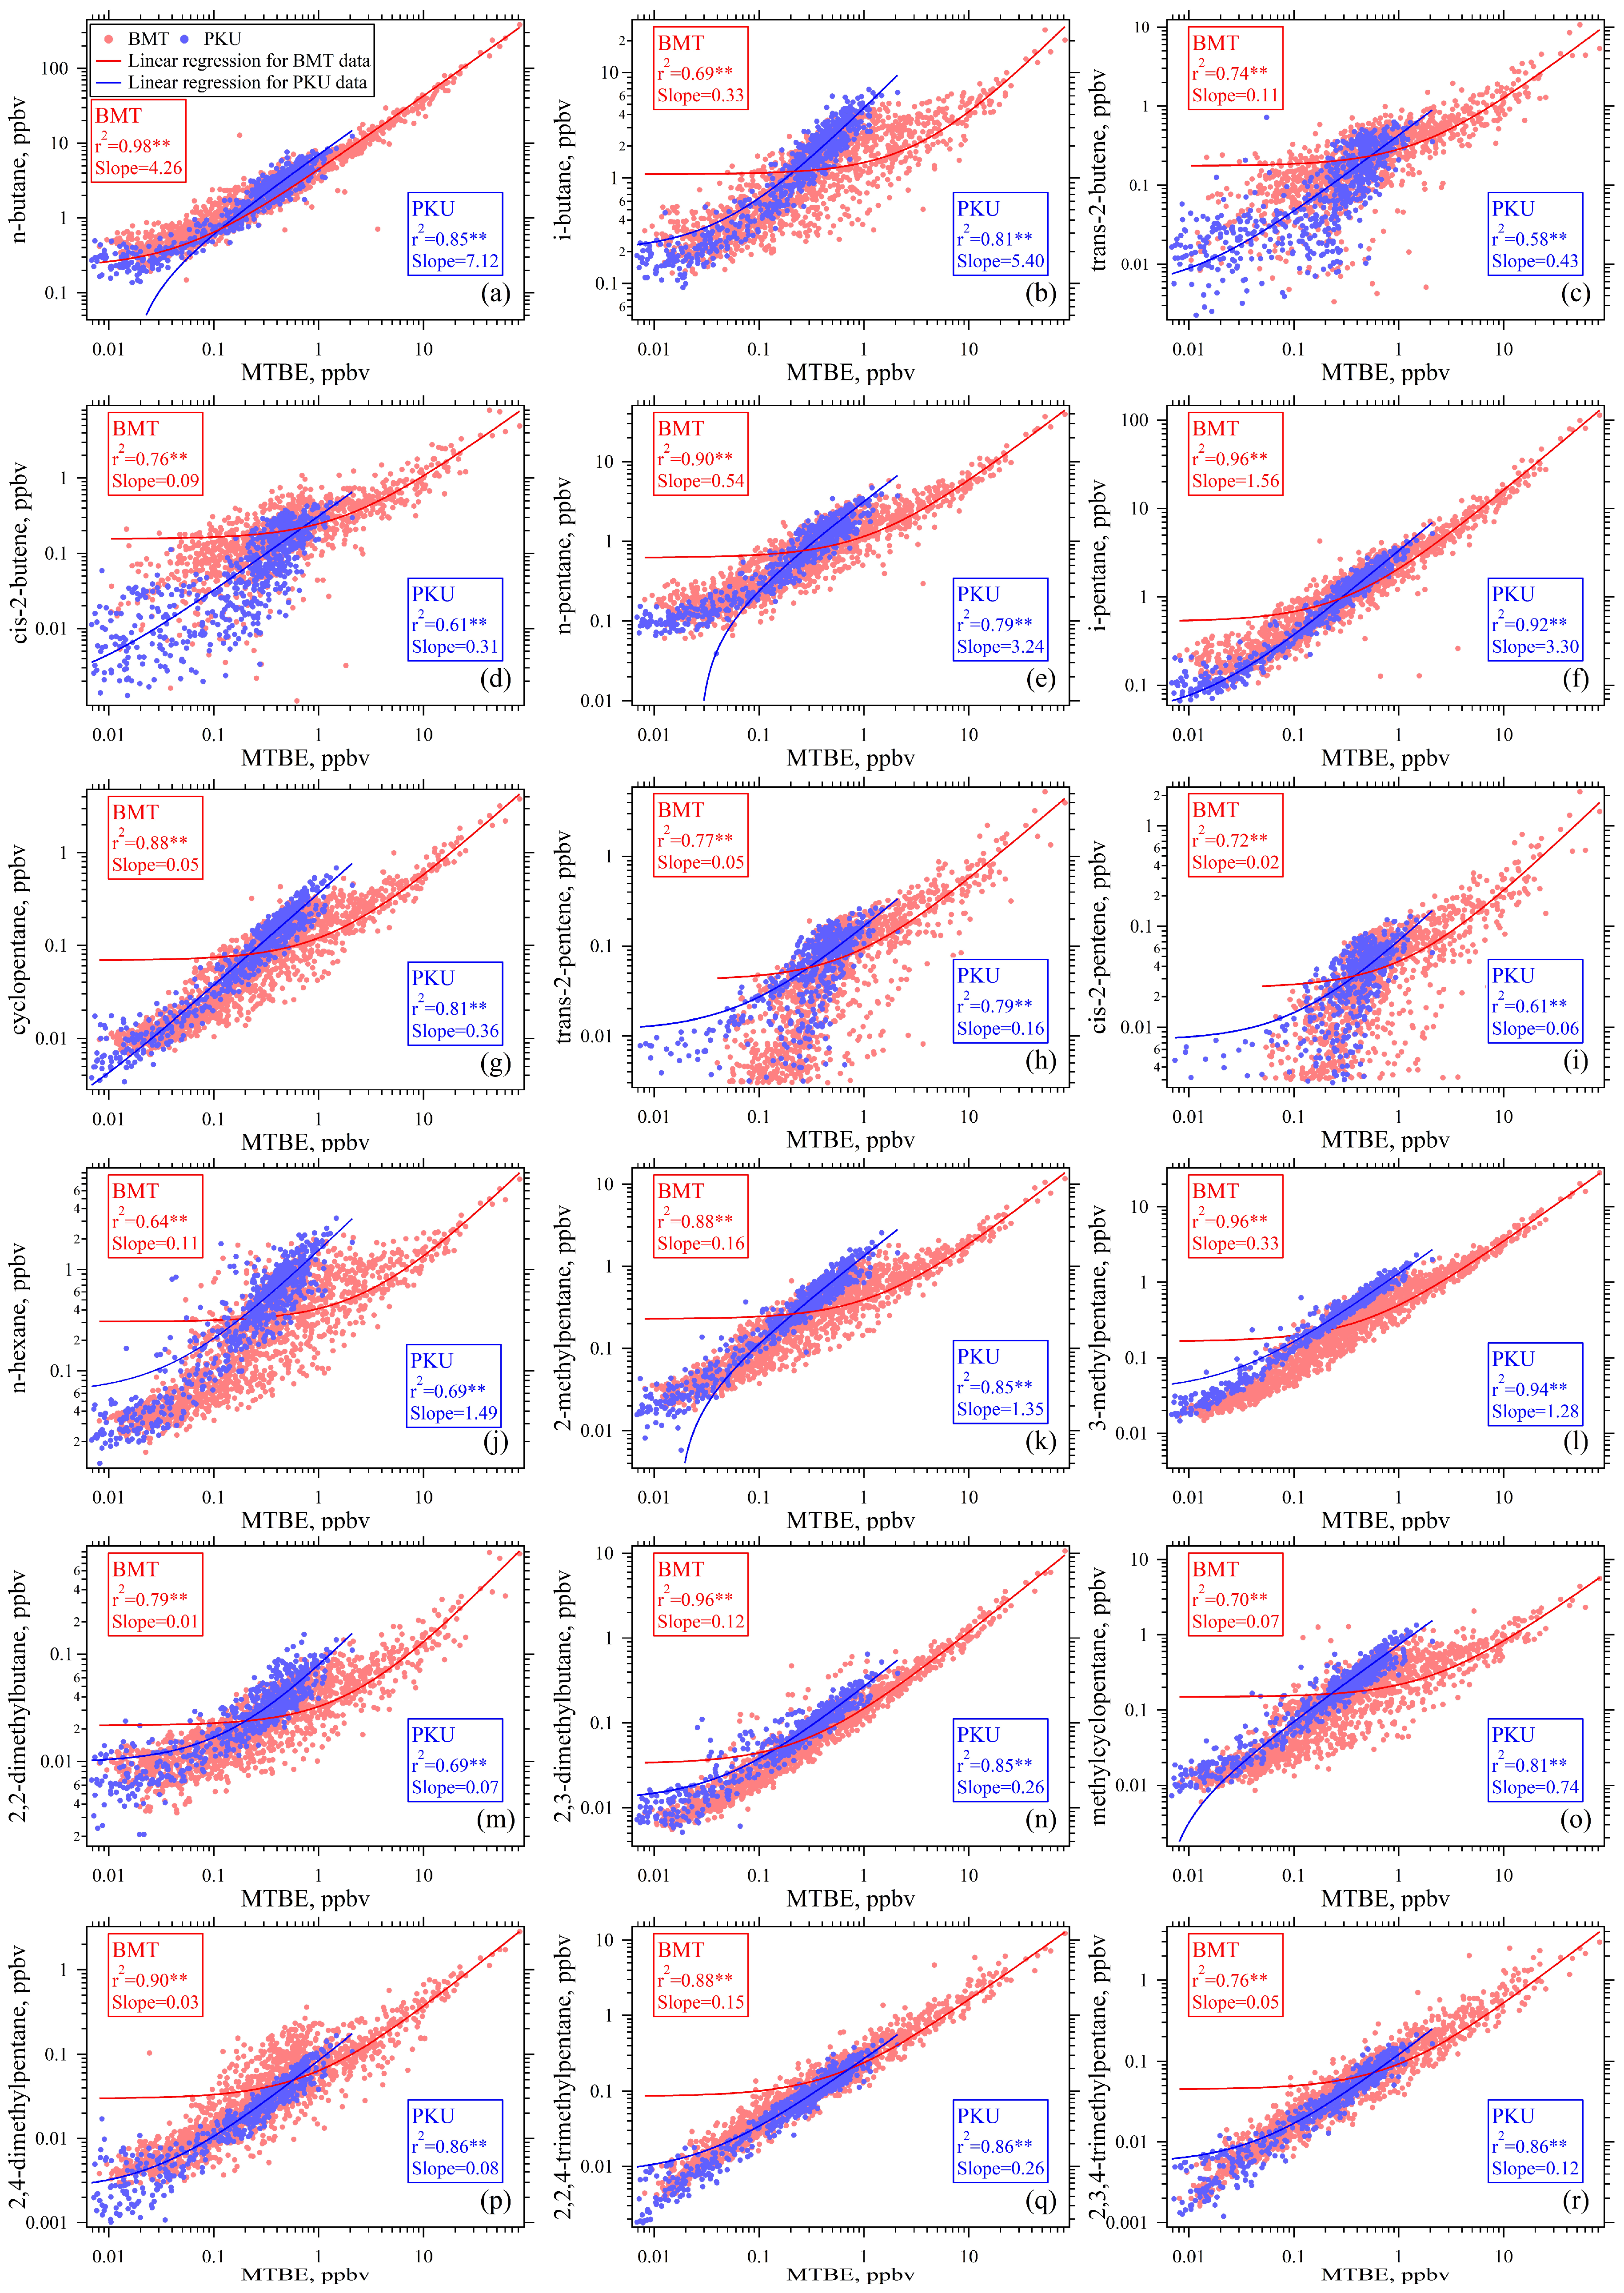
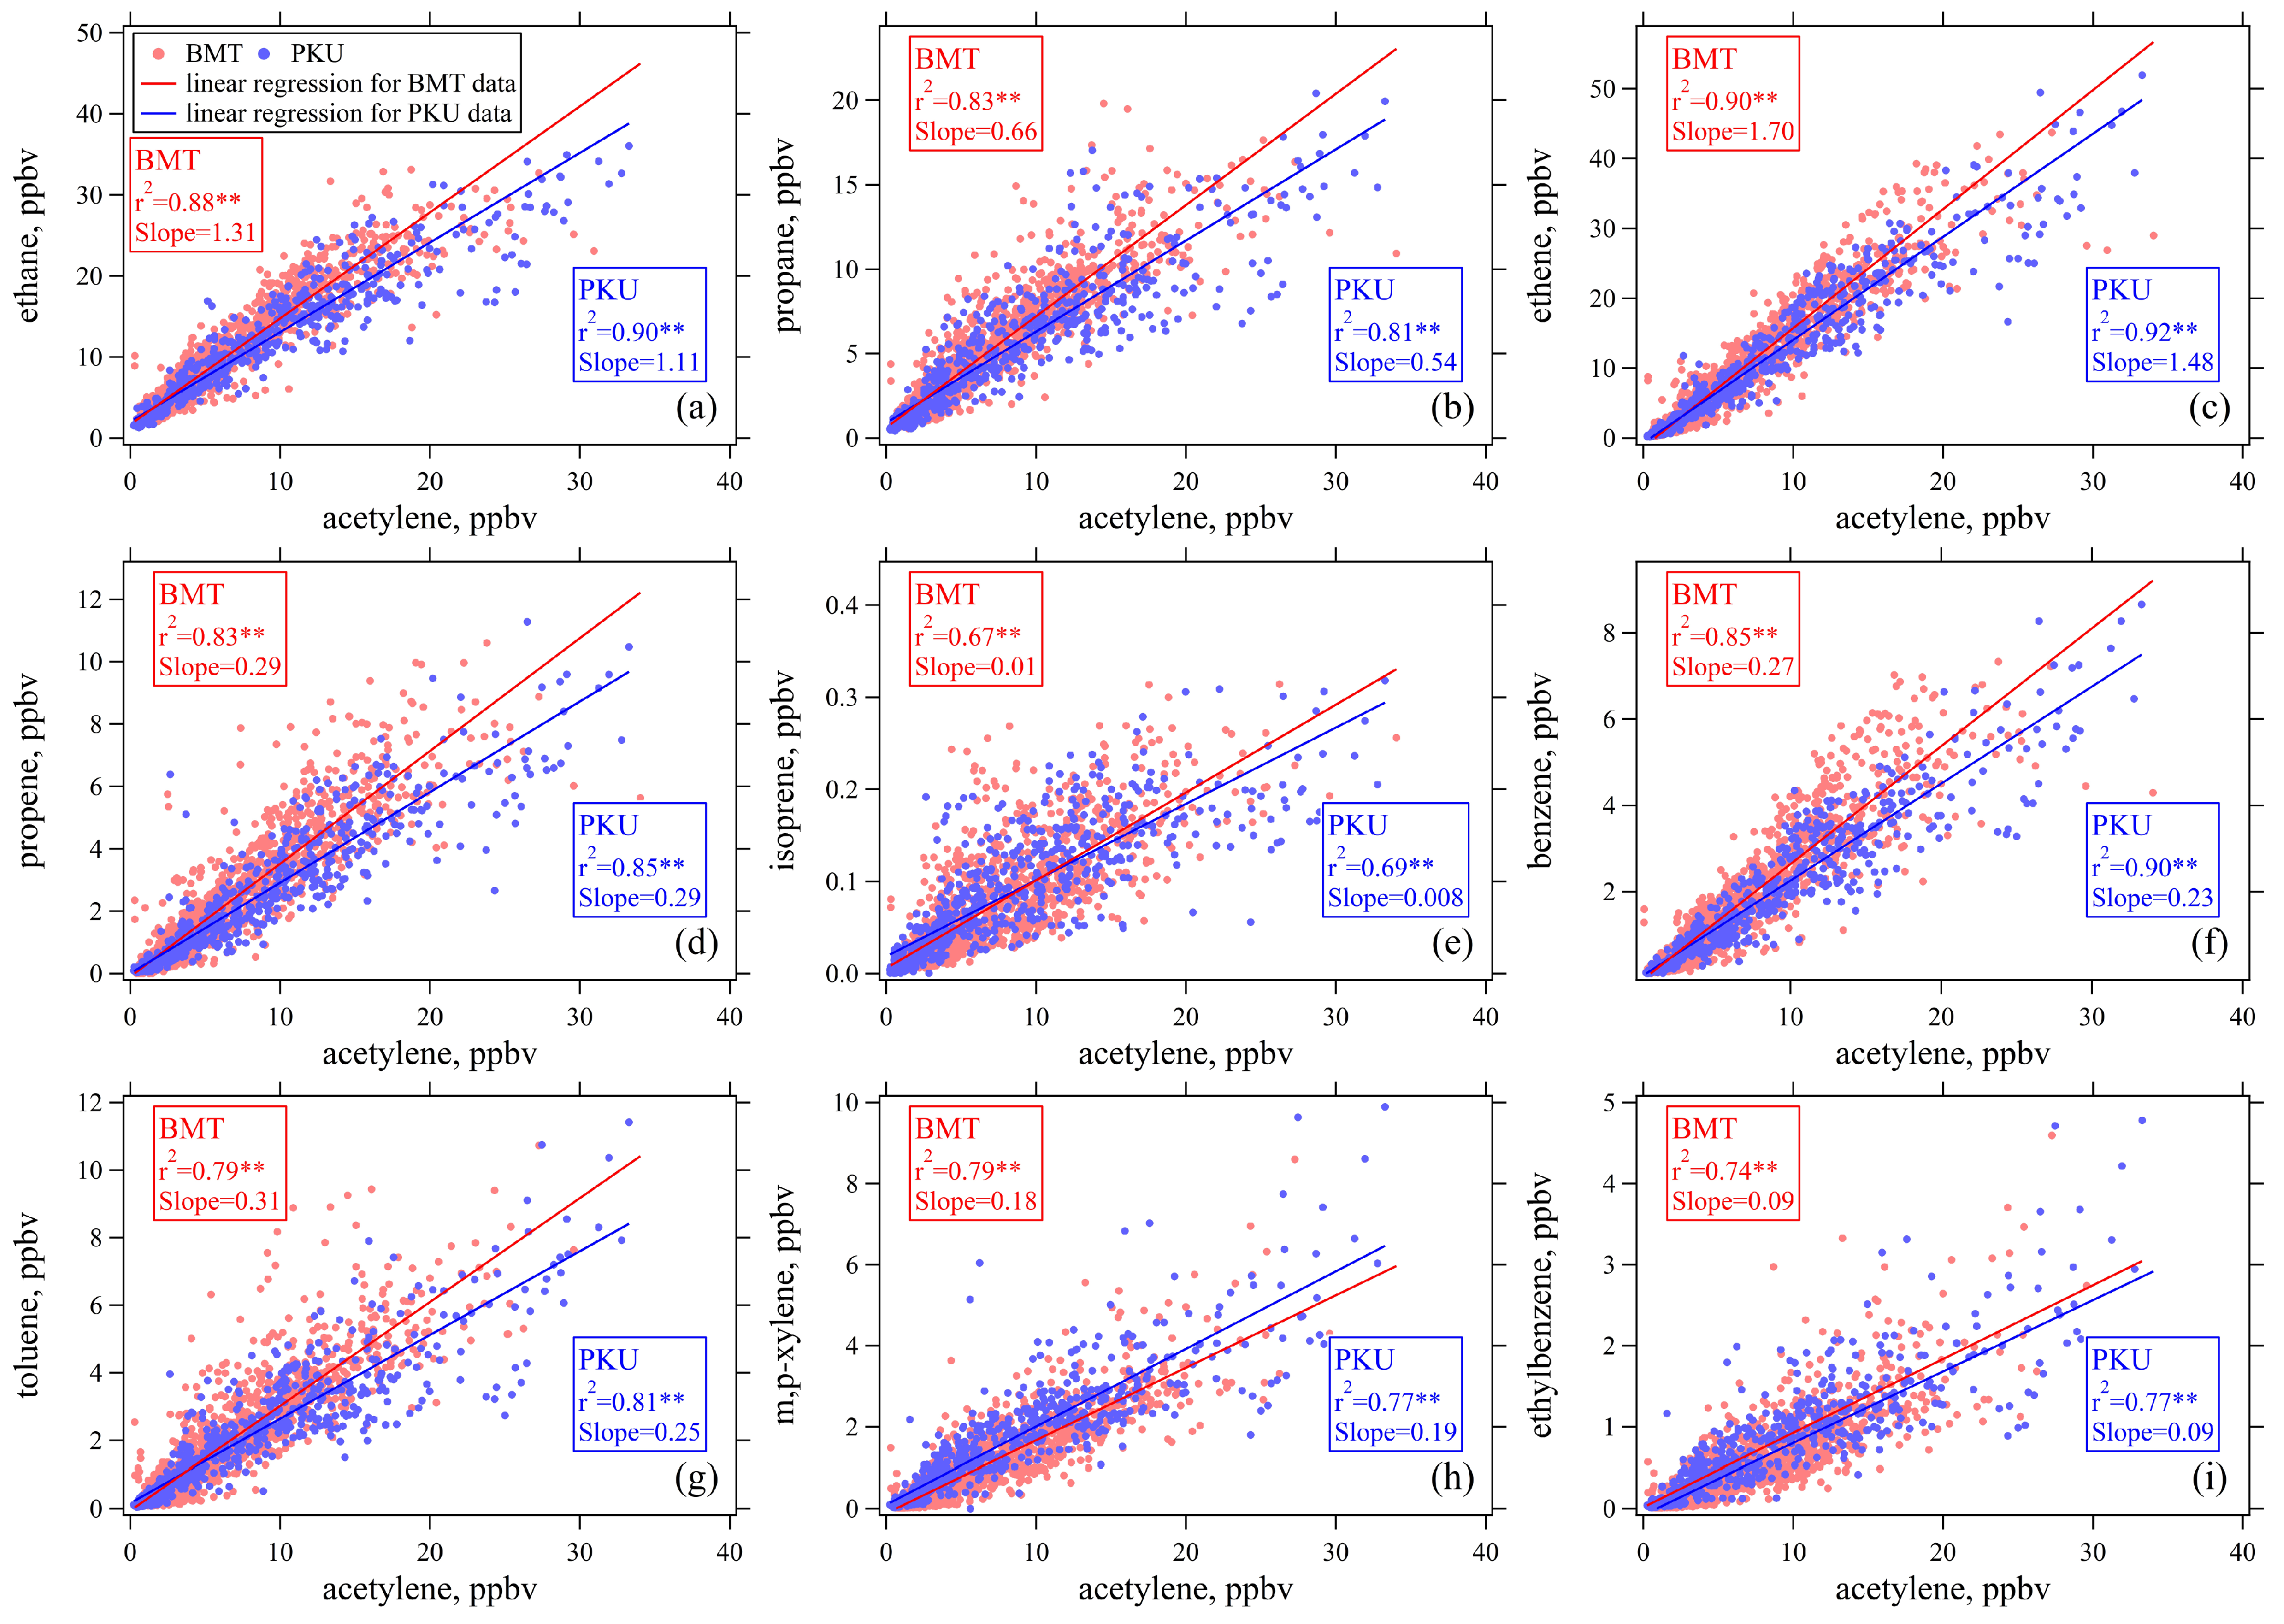
Correlation analyses between individual NMHC species and MTBE revealed that 18 out of the 56 measured NMHCs exhibited strong correlations with MTBE (r2 > 0.64, p < 0.01) (Figure 5), indicating potential influences from gasoline evaporation. These species included C4–C8 alkanes (n-butane, i-butane, n-pentane, i-pentane, cyclopentane, n-hexane, 2-methylpentane, 3-methylpentane, 2,2-dimethylbutane, 2,3-dimethylbutane, methylcyclopentane, 2,4-dimethylpentane, 2,2,4-trimethylpentane, and 2,3,4-trimethylpentane) and four C4–C5 alkenes (trans-2-butene, cis-2-butene, trans-2-pentene, and cis-2-pentene). In contrast, other NMHC species showed weak correlations with MTBE (r2 < 0.24) but strong correlations with acetylene (r2 > 0.64, p < 0.01) (Figure 6). Moreover, the ratios of these species to acetylene differed by less than 10% from those observed at the PKU site, suggesting that their concentrations were not substantially affected by gasoline evaporation.
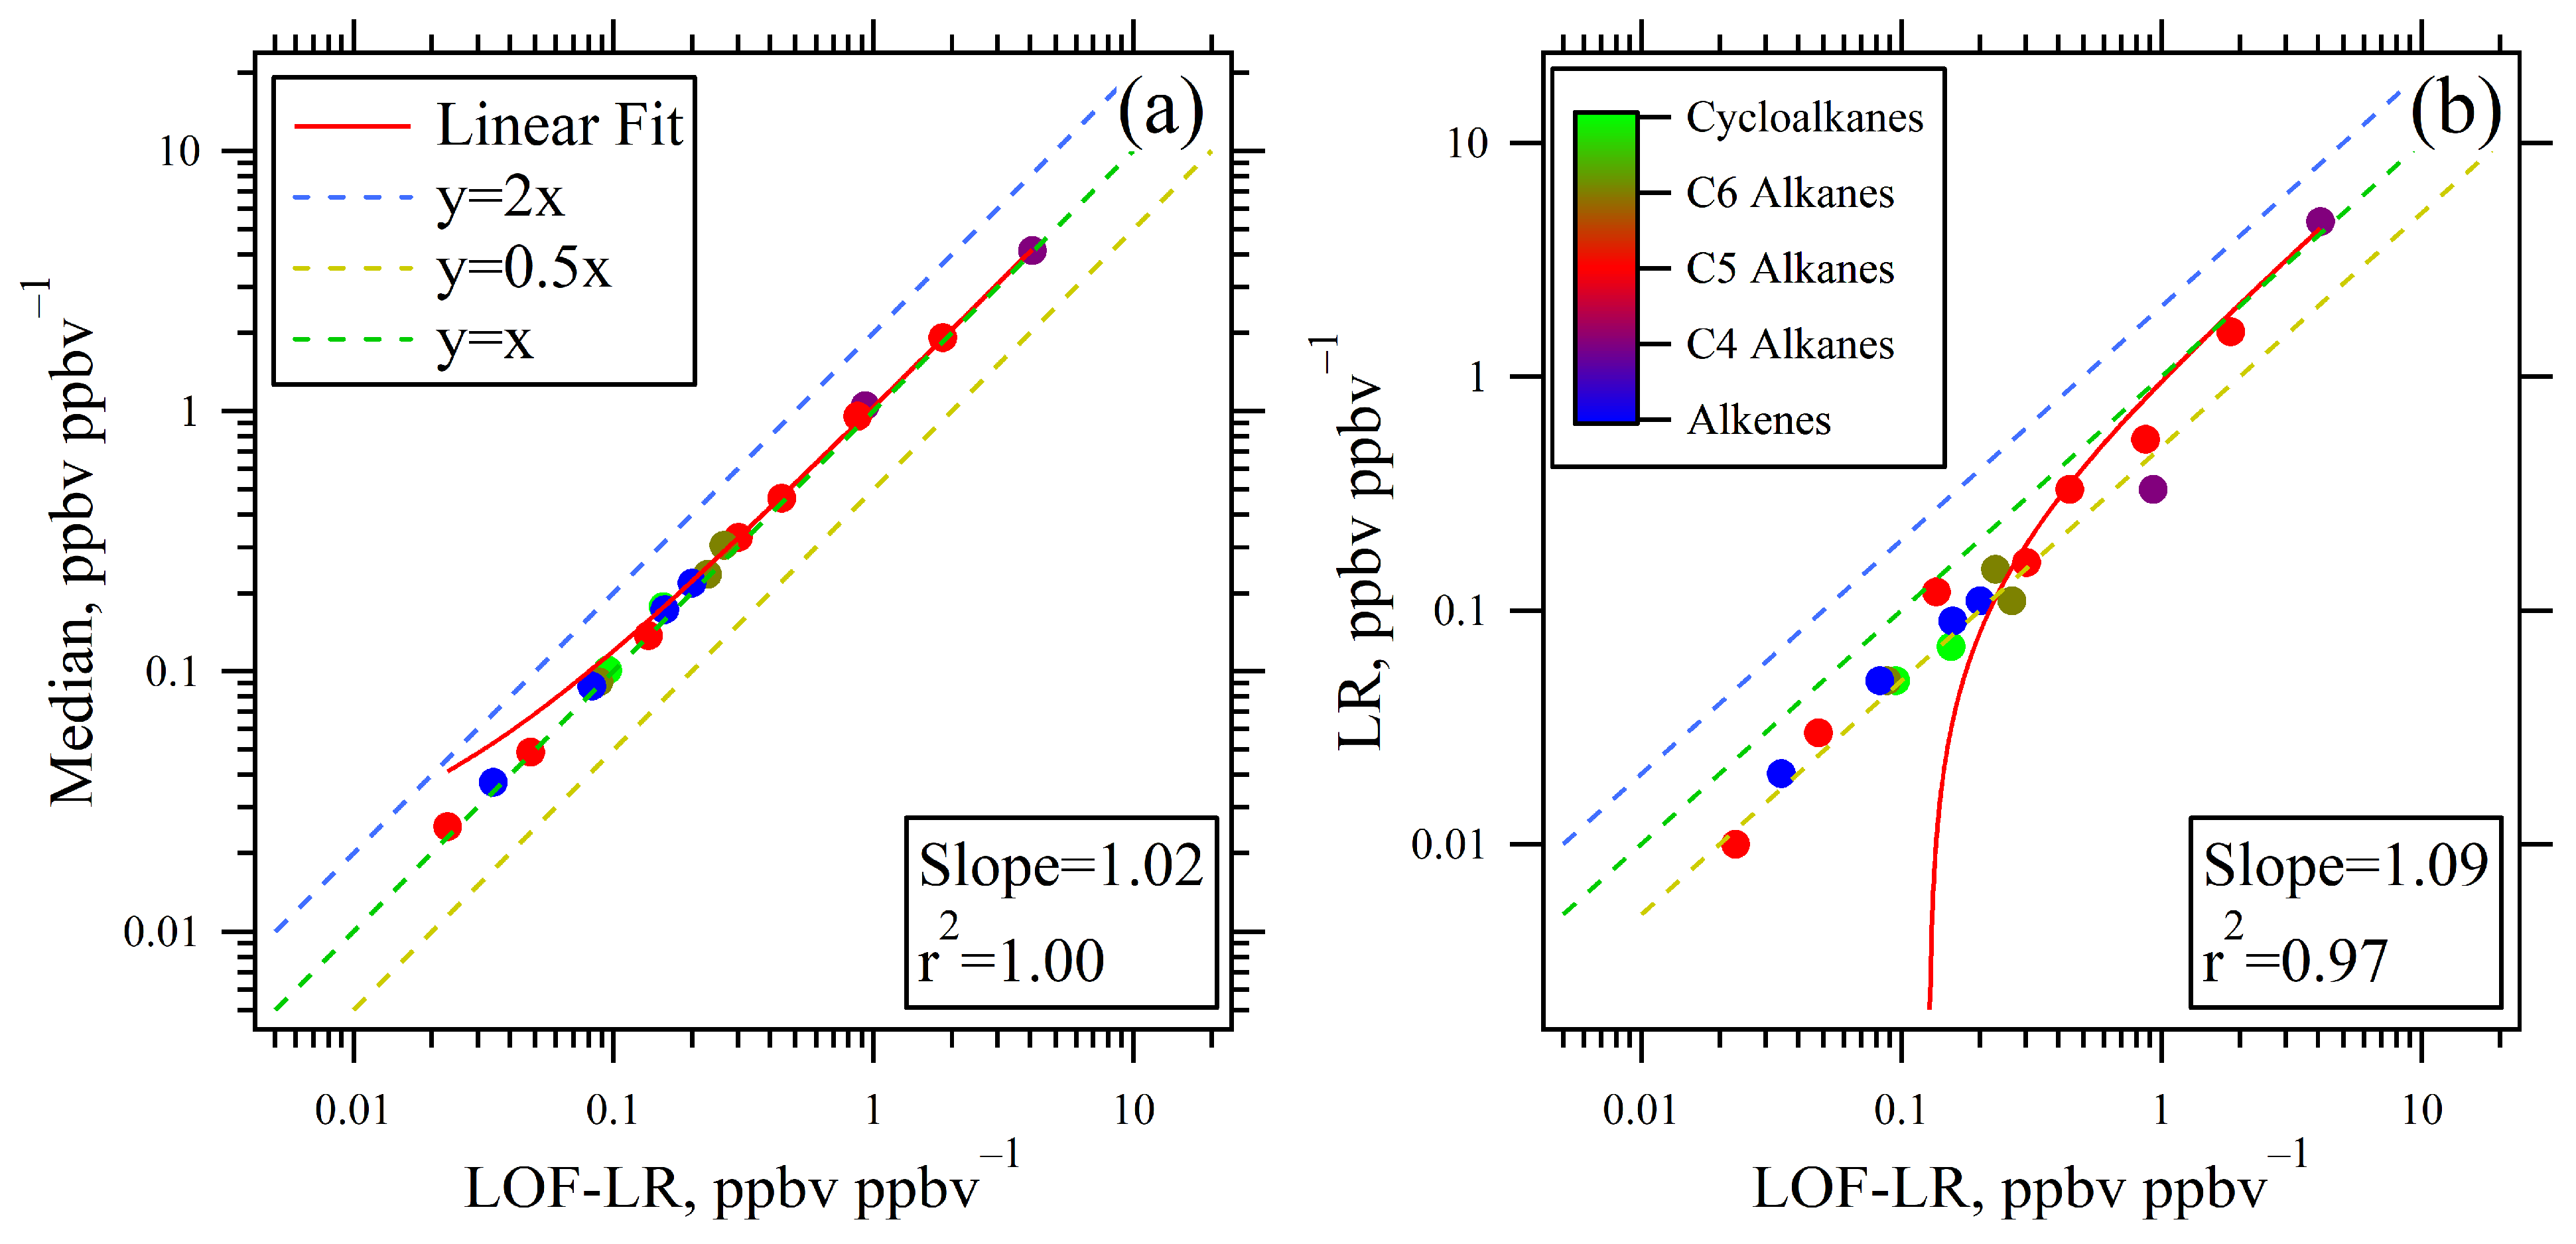
The enhancement ratios (ERs) of these 18 VOC species, relative to MTBE, were further calculated using the LR, median, and LOF-LR methods. The two approaches that first screened data influenced by gasoline evaporation (LOF-LR and median methods) showed good agreement, with r2 of 0.98 and slope of 1.02, and the ERs of individual species closely aligned with the 1:1 line (Figure 7a). The ERs obtained using the LR method were also significantly correlated with those derived from the LOF-LR method (r2 = 0.97, slope = 1.09). However, except for n-butane, i-pentane, and n-pentane, ERs of the remaining VOC species calculated using the LR method were systematically lower than those obtained with the LOF-LR method (Figure 7b), with the relative differences ranging from 13% to 181%, indicating that the LR method would underestimate ERs for species with low levels. Therefore, the ERs derived from the LOF-LR method were selected for subsequent analyses of gasoline evaporation emission characteristics.
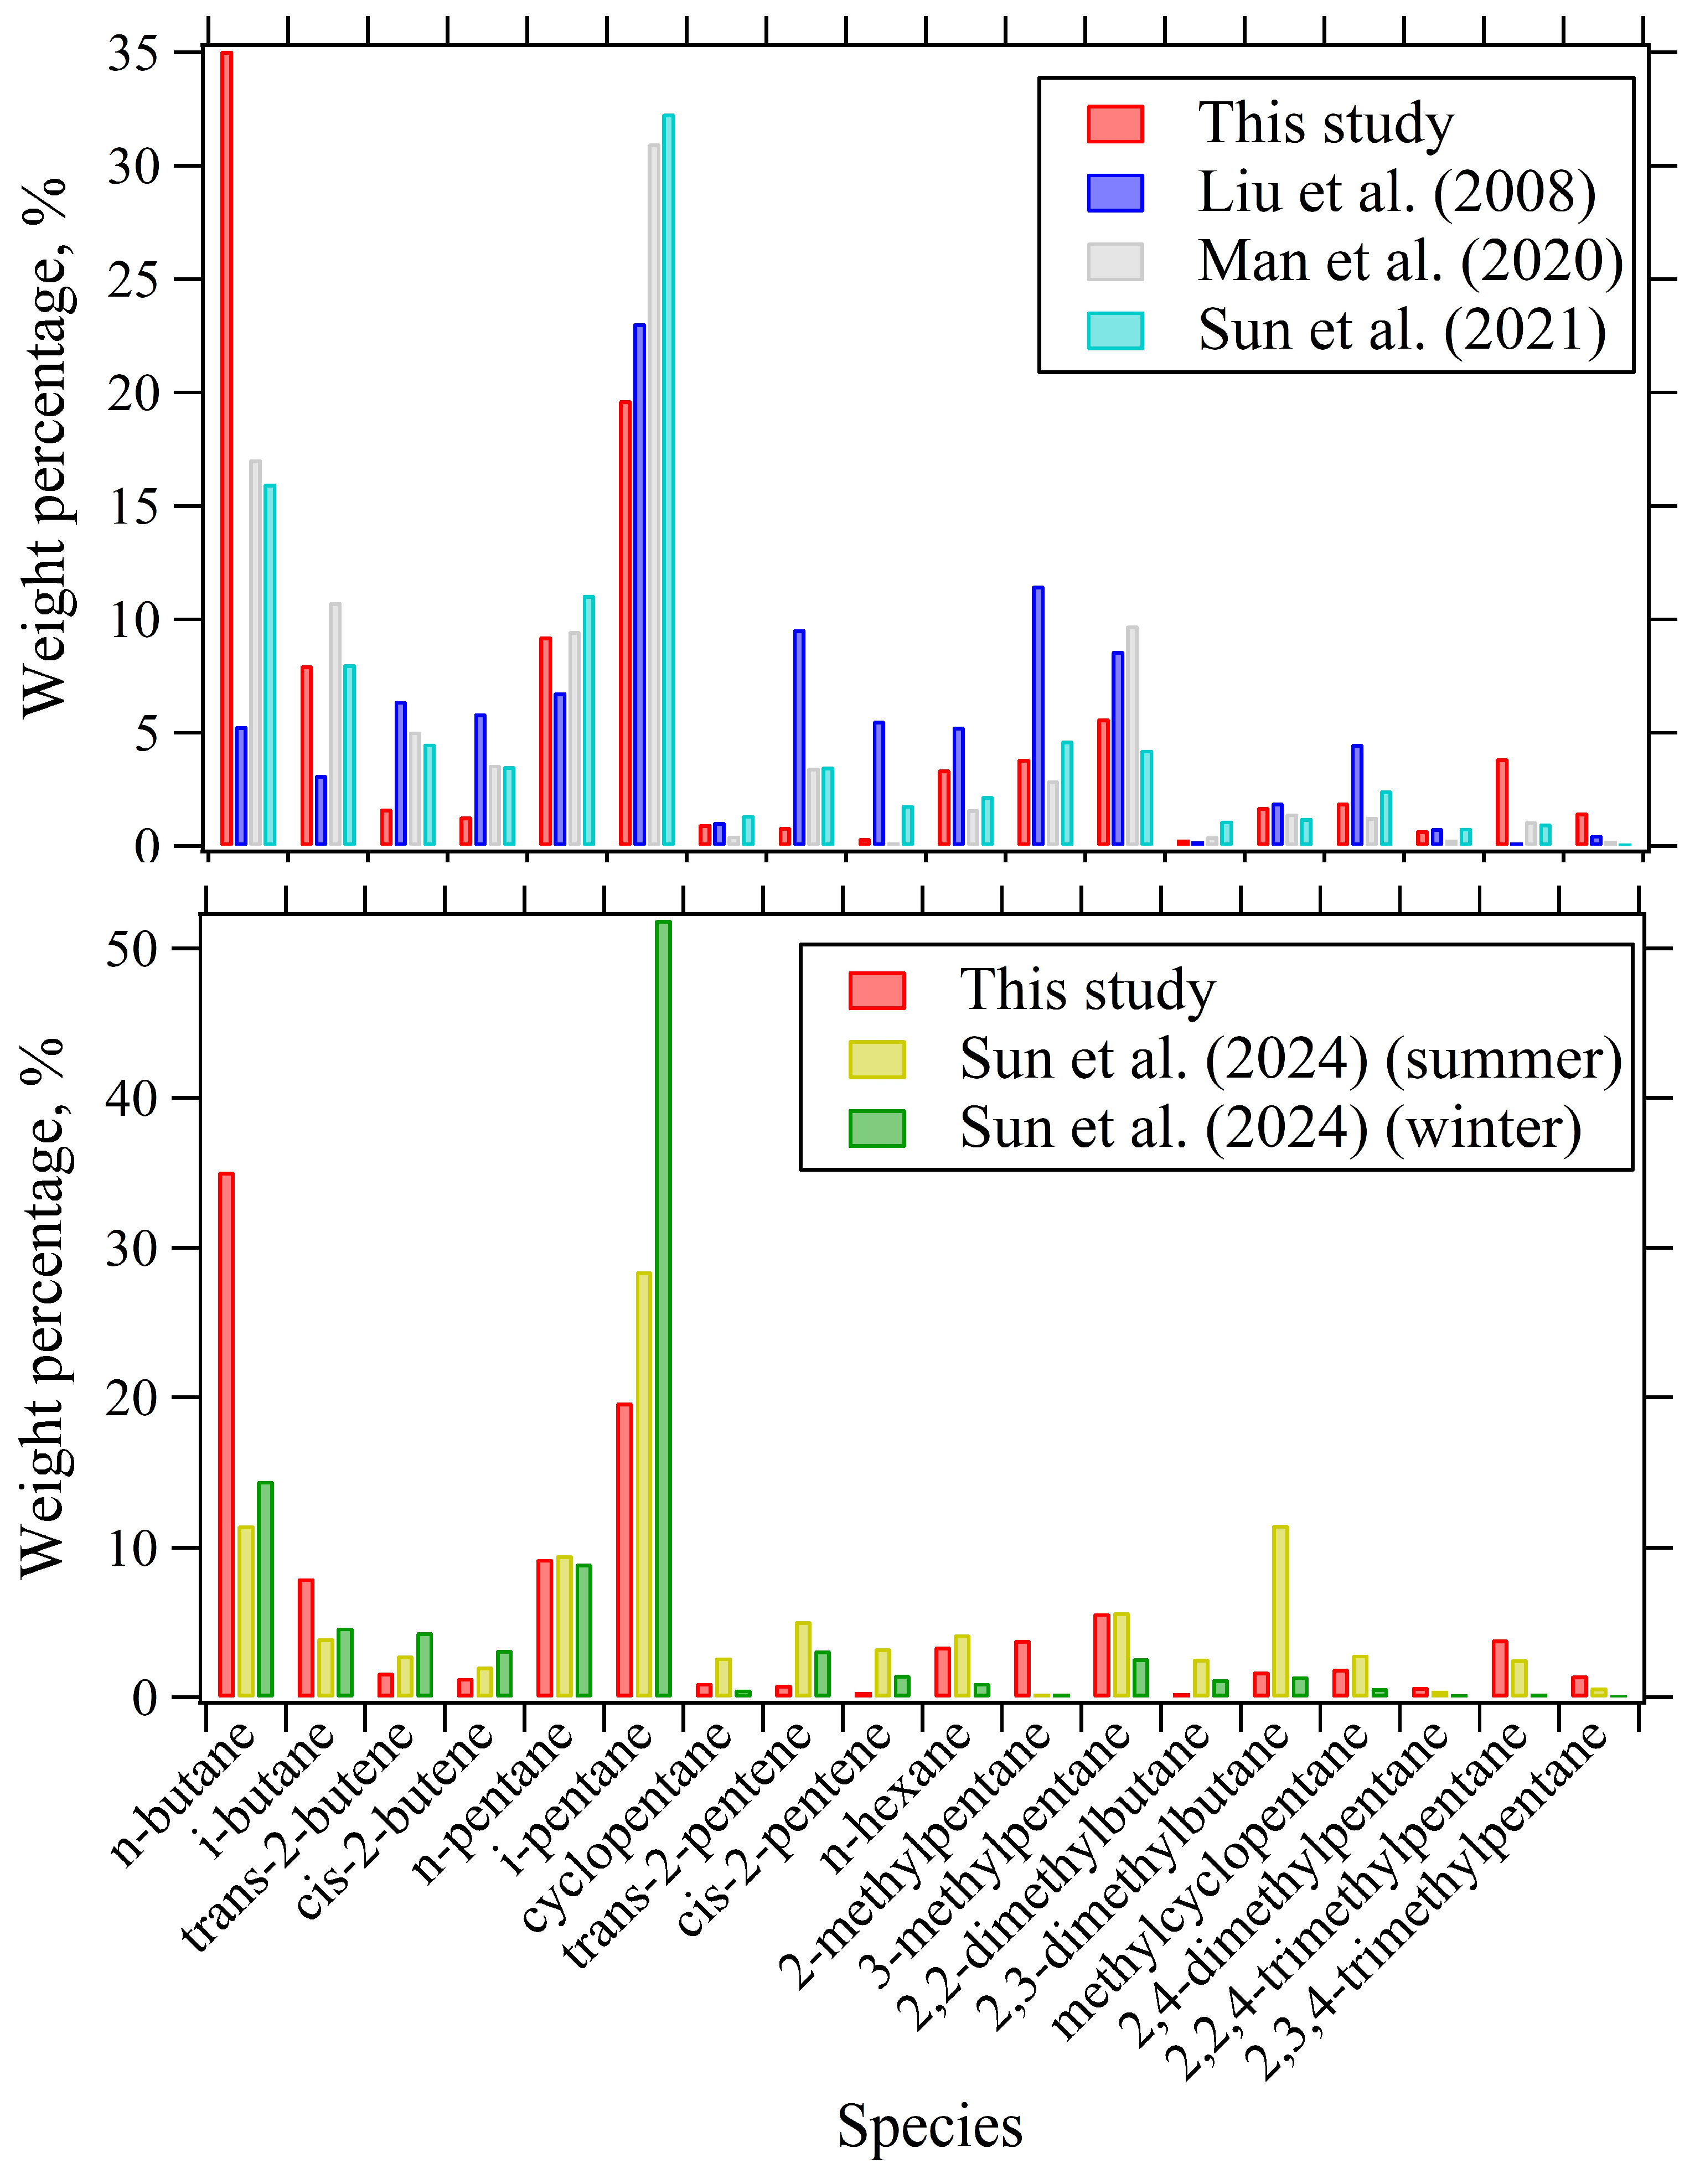
Based on the ERs of individual species derived using the LOF-LR method, the weight percentages of each species, relative to the total mass concentration of these 18 species, were calculated and compared with published studies [22,46,54,55] (Figure 8). In this study, n-butane accounted for 35% of the total mass concentration of these species, followed by i-pentane (20%), n-pentane (9%), and i-butane (8%). In contrast, previous studies consistently reported i-pentane as the dominant species in NMHCs from gasoline evaporation, with weight percentages ranging from 32% to 52% [22,55]: 1.6–2.6 times higher than observed in this study. By comparison, the weight percentage of n-butane here was 5–17%, 2–7 times higher than in other studies, while C4–C5 alkenes contributed only 4%, which was substantially lower than the 12–27% reported previously [22,46,54,55]. The vector similarity analysis showed that the angles ( θ ) between the winter gasoline evaporation source profile derived from online measurements in this study and those reported by Man et al. (2020) [54], Sun et al. (2021) [55], and Sun et al. (2024) [22] ranged from 31.4° to 44.9°, indicating noticeable differences, while the angle relative to the profile reported by Liu et al. (2008) [46] was 51.4°, reflecting a significant discrepancy.
These discrepancies may be attributed to seasonal variations in liquid gasoline composition [19,22] and differences in source profile establishment methods [17]. Gasoline formulations are seasonally adjusted, with a higher butane content in winter to enhance gasoline volatility [30]. In addition, temperature-dependent volatilization favors relatively less suppression of n-butane than i-pentane under winter conditions [31]. Moreover, differences between laboratory-based experiments and real-world refueling processes may contribute to these inconsistencies [21,54], leading to uncertainties in receptor-model-based VOC source apportionment [56].

3.3. Identification and Interpretation of PMF-Resolved Factors

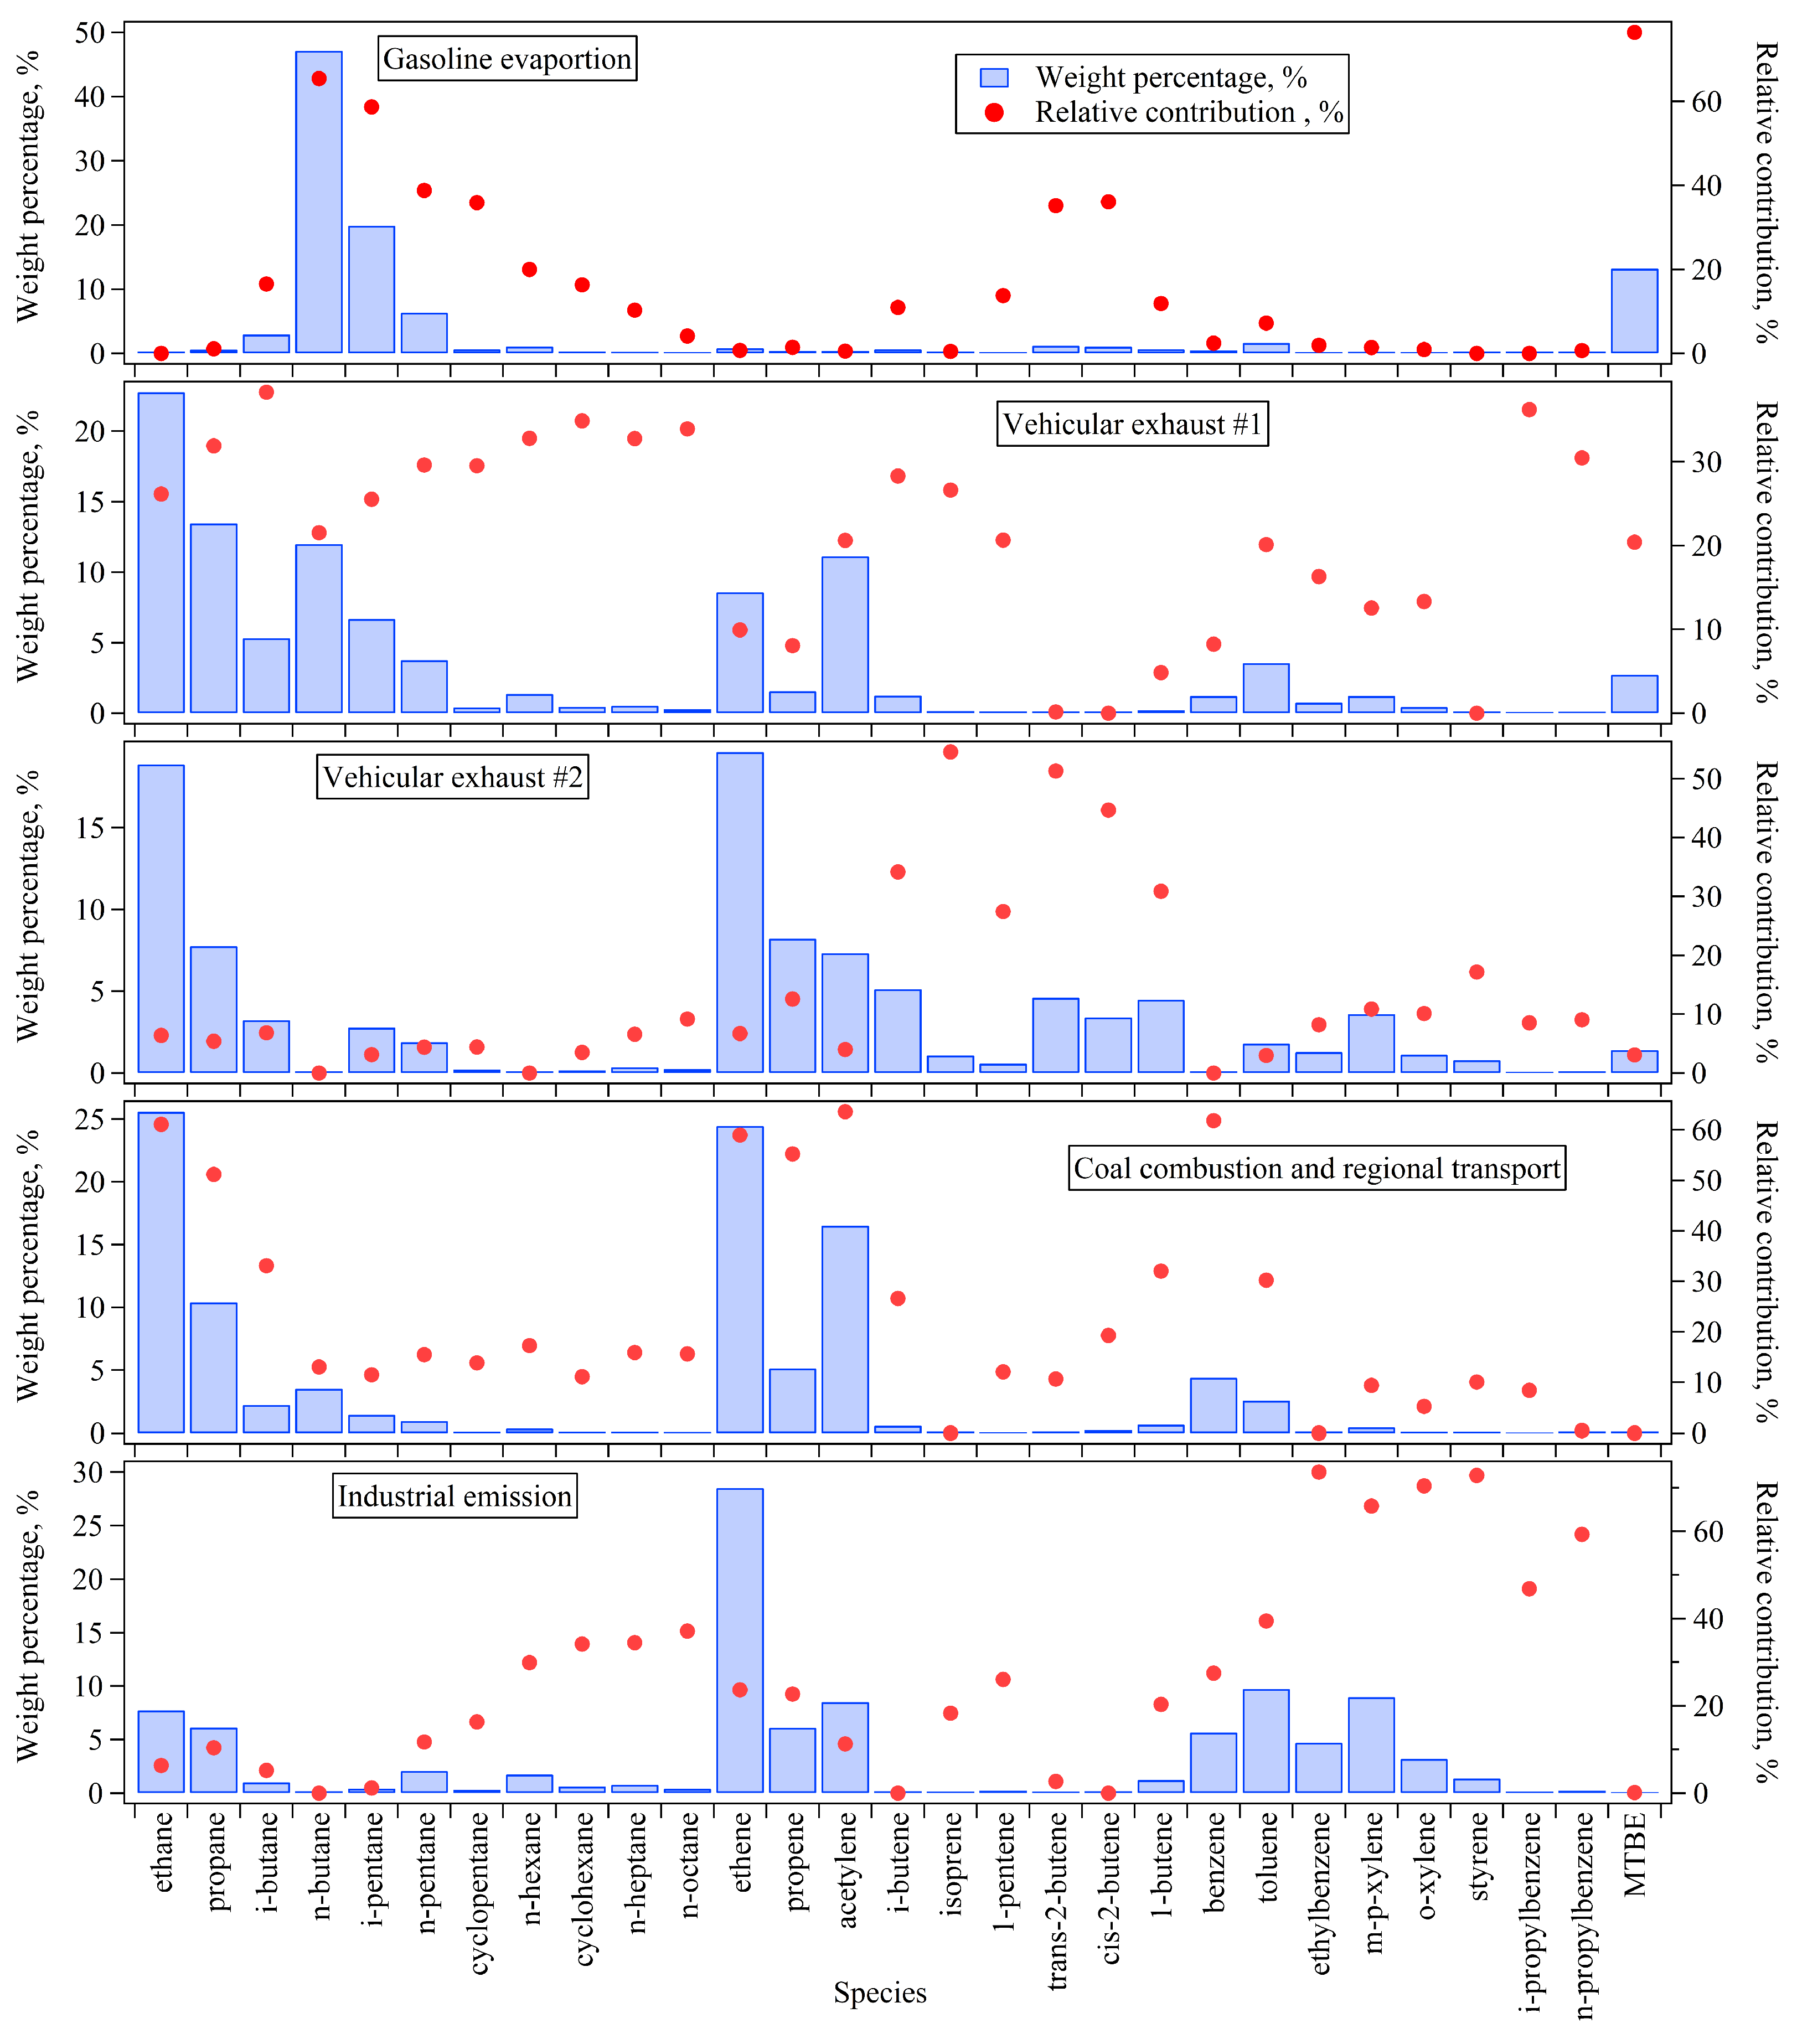
Figure 9 illustrates the VOC chemical composition profiles of the five factors resolved by PMF. Factor 1 exhibited high relative contributions to MTBE (76%), n-butane (65%), i-pentane (59%), and n-pentane (39%). In addition, n-butane and i-pentane showed the two highest weight percentages in this factor, with values of 47% and 19%. These species were identified as the most abundant components in the headspace vapor of evaporated gasoline during winter [30] and are also widely recognized as tracers of gasoline evaporation [18,21,57,58]; therefore, this factor was identified as the gasoline evaporation source. n-Butane accounted for 41% of the total mass concentration of the 18-gasoline evaporation-related species in Figure 5, followed by i-pentane (22%), n-pentane (7%), and i-butane (3%). Vector similarity analysis shows that the angle θ between the gasoline evaporation source profile resolved by PMF and that derived from ER is 9.64°, indicating high consistency between the two profiles.
Factor 2 was characterized by high abundances of C2–C5 alkanes, ethene, acetylene, toluene, and MTBE, and also showed high contributions to these species ranging from 7% to 38%. In addition, the toluene-to-benzene (T/B) ratio in this factor was 2.45, which was close to the reported emission ratio of 2.70 for vehicular exhaust [59]. Factor 3 was characterized by high abundances of ethene [60], with a weight percentage of 19%, and accounted for 27–54% of C2–C5 alkenes. Since C2–C5 alkanes and alkenes [61,62,63], acetylene [64,65], toluene [60], and MTBE [66] have been reported as important constituents of vehicular exhaust, Factors 2 and 3 were both identified as vehicular exhaust sources.
Factor 4 was dominated by acetylene, ethane, benzene, and propane: a combined weight percentage of more than 50%. Among these species, ethane showed the highest weight percentage, accounting for 26%. These compounds generally have relatively long atmospheric lifetimes [67,68,69]. In addition, this factor contributed more than 50% of the ethene and propene, which are commonly associated with incomplete combustion processes [70]. Accordingly, this factor was recognized as a mixed source related to coal combustion and regional transport.
Factor 5 was characterized by high abundances of ethene and aromatic hydrocarbons, with relatively high contributions to C8–C9 aromatics ranging from 47% to 74%. Ethene has been reported to be one of the most abundant VOC species in the industrial park [71], while C8–C9 aromatic hydrocarbons are important products or raw materials in the chemical industry [72,73]. Therefore, this factor was identified as being industrial emissions.
The n-butane/i-pentane ratio derived from the PMF source apportionment was 2.95 ppbv ppbv−1 in this study, which was significantly higher than the corresponding ratio (0.13 ppbv ppbv−1) in the PMF-resolved combined gasoline evaporation and vehicular exhaust factor during summer at the PKU site [74]. This result suggests a seasonal difference in the hydrocarbon composition associated with gasoline-related emissions. This finding is consistent with previous studies in Riverside [30], Houston [75], and Paris [76], all of which reported that n-butane accounted for a comparable or higher proportion than i-pentane in gasoline evaporation-related sources during winter.

4. Discussion

4.1. Influence of Gasoline Evaporation VOC Profiles on CMB Source Apportionment

Table 1 summarizes the corresponding CMB performance metrics. When Profile A was used as input to the CMB model, negative source contributions occurred in 37% and 9% of the samples for the 2015-BMT and 2015-PKU datasets, respectively. Applying Profile B to the 2015-BMT and 2015-PKU datasets reduced the occurrence of negative values to below 5%; however, for the 2021 dataset, the negative contributions exceeded 10%, with r2 below 0.7 and mass% exceeding 130%. The mass% in the range of 100–120% is generally considered to indicate good agreement with mass closure [42]. Although the measurement uncertainty (e.g., losses of highly reactive alkenes or low-volatility compounds) may affect the mass discrepancy in the CMB model, the intercomparison results with other VOC measurement systems have demonstrated the good agreement of reactive or low-volatility species [37]. Therefore, values exceeding 100% may result from uncertainties in source profiles, as well as collinearity or similarity among source profiles, which may lead to source over-allocation [42]. In contrast, applying Profile C, established in this study, substantially improved the overall CMB performance: negative source contributions occurred in less than 5% of samples, while the average r2 and %mass ranged from 0.74 to 0.77 and 89% to 103%, respectively.
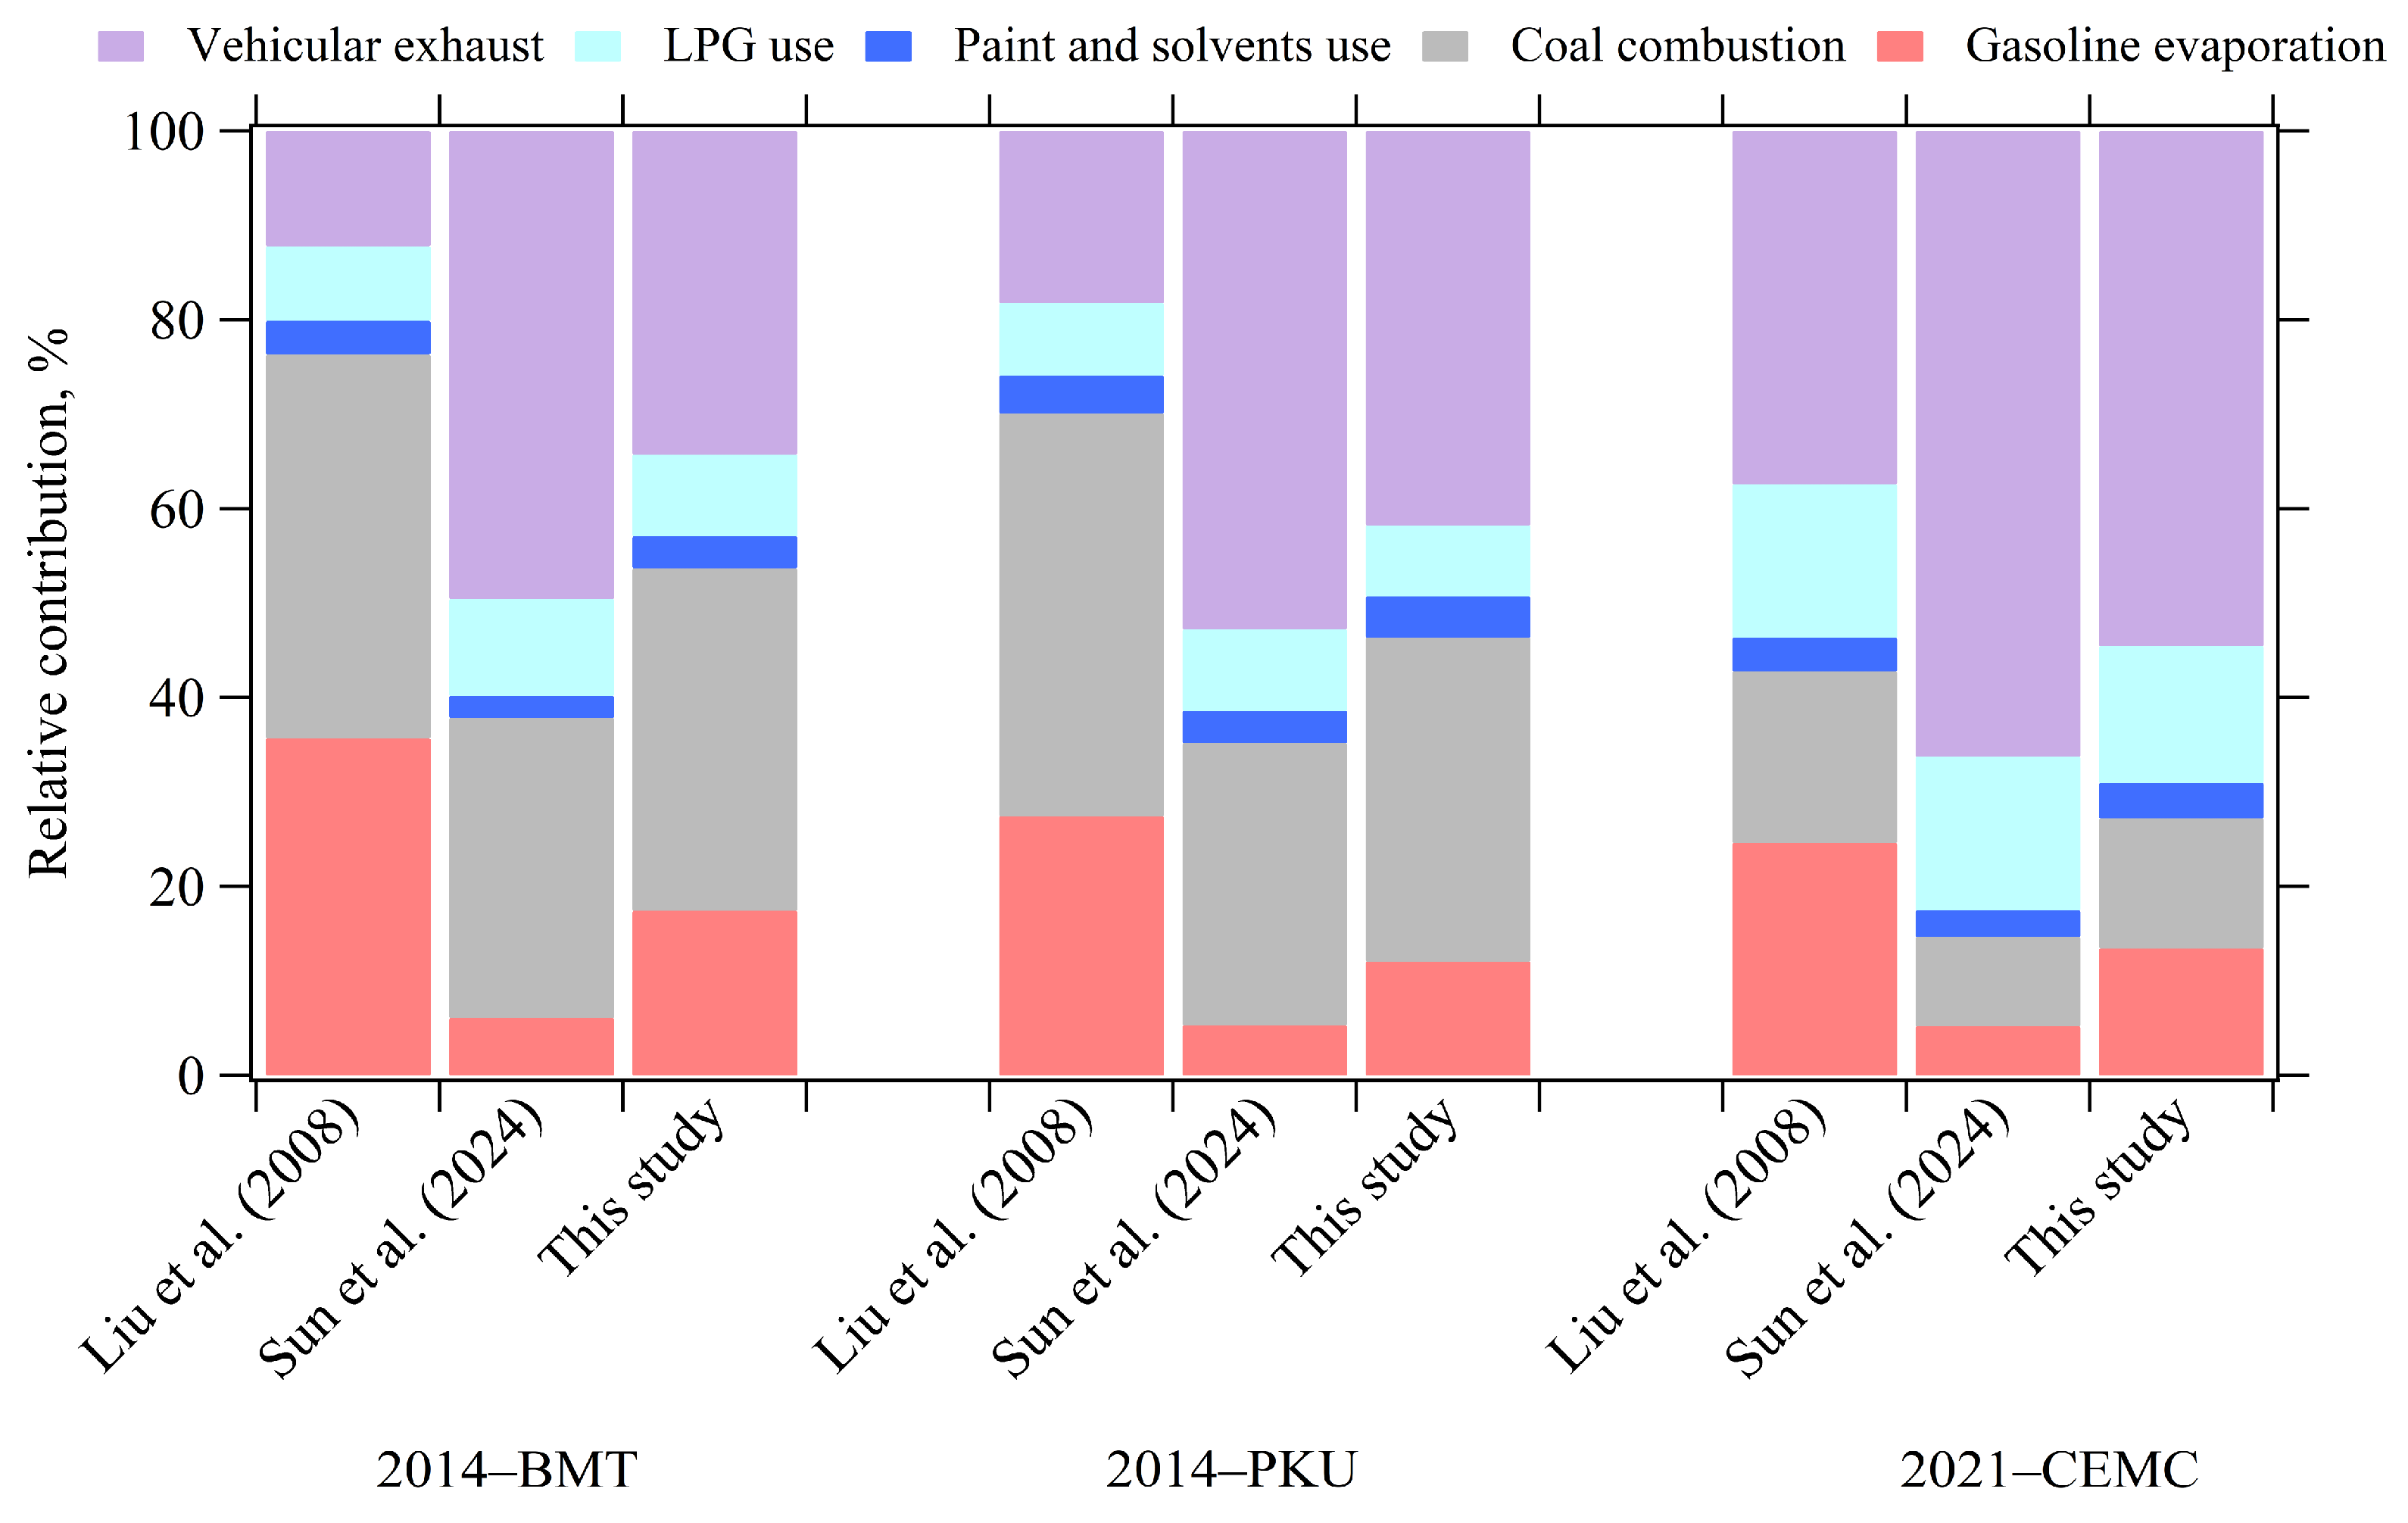
Figure 10 compares the relative contributions of the five source categories to the total VOC concentrations, as determined using the three gasoline evaporation source profiles. The CMB results based on Profile A indicate that coal combustion and gasoline evaporation were the dominant VOC sources during the winter of 2014–2015, contributing 41–43% and 27–36%, respectively, while vehicular exhaust accounted for only 12–18%. In contrast, the results applying Profile B suggest that vehicular exhaust dominated in winter 2015 (47–53%), followed by coal combustion (30%), whereas gasoline evaporation contributed only 5–6%. Using Profile C, coal combustion and vehicular exhaust were again the two major sources (34–36% and 34–42%, respectively), while the contribution of gasoline evaporation (12–17%) was 2.3–3 times higher than that obtained using Profile B. A similar pattern was observed for the winter of 2021: Profile A yielded relatively high contributions from gasoline evaporation and coal combustion, whereas Profile B showed the highest contribution from vehicular exhaust (64%) and the lowest from gasoline evaporation (5–6%). Overall, these comparisons demonstrate that CMB source apportionment is highly sensitive to the choice of gasoline evaporation source profile, and relying on winter profiles derived from offline measurement may underestimate gasoline evaporation contributions. Therefore, selecting a representative gasoline evaporation source profile is critical for reliable VOC source apportionment.

4.2. Comparison of CMB and PMF Source Apportionment Results

The 2015-BMT source apportionment results obtained using Profile C were compared with those derived from PMF, showing good agreement. The PMF results indicate that vehicular exhaust contributed 31%, which was slightly lower than the 34% estimated by CMB. Coal combustion and regional transport accounted for 43% in the PMF results, comparable to the combined contribution of coal combustion and LPG use estimated by CMB (45%). Gasoline evaporation contributed 16%, according to the PMF results, which was slightly lower than that obtained from CMB (17%). In contrast, the PMF-resolved contribution of industrial emissions (14%) is higher than the paint and solvent contribution estimated by CMB (3%). This discrepancy may arise because the industrial emission factor resolved by PMF encompasses not only aromatic hydrocarbons from paint and solvent use but also light hydrocarbons such as ethene, propene, acetylene, and ethane.
Previously published VOC source apportionment studies in Beijing have been predominantly conducted using PMF [44,66,77,78], yet their results show considerable variability (Table 2). The reported contribution of vehicular exhaust ranges from 8% to 46%. One study did not resolve coal combustion [44], whereas the other three studies reported coal combustion contributions ranging from 22% to 54% [66,77,78]. Contributions from paint and solvent use range from 11% to 20%. In addition, industrial emissions were identified in three studies, contributing 4–25% [44,66,78]. Only two studies resolved gasoline evaporation, with contributions of 5–23% [44,77], while other sources included background, biomass burning, and secondary formation [66]. The CMB-based source apportionment results for PKU in 2015 obtained in this study are broadly consistent with the PMF results reported by Zhang et al. (2020) [77]. Both studies indicate that vehicular exhaust and coal combustion are the dominant sources, together accounting for more than 75% of total VOCs. However, the contribution of gasoline evaporation resolved in this study (12%) is significantly higher than that reported by Zhang et al. (2020) (5%) [77], whereas the contribution of paint and solvent use (4%) is lower than their reported value (20%).

4.3. Changes in Wintertime VOC Concentrations and Sources Between 2015 and 2021

From November 2021 to January 2022, the average NMHC concentration at the CEMC site was 44.0 ± 40.9 μg m−3, representing a 63% decrease compared with the wintertime level at the PKU site during November 2014–January 2015 (118.3 ± 92.5 μg m−3). This decline aligns with previous studies, which reported that wintertime VOC concentrations in urban Beijing remained relatively high during 2015–2017, began to decline in 2018, and had dropped by 38% by 2019, relative to 2015 [79]. In the last decade, NO2 and PM2.5 concentrations also exhibited significant downward trends [80]. Previous studies reported that NO2 concentrations in Beijing decreased by 28% during 2015–2020 [81], while PM2.5 levels declined by approximately 53% from 2016 to 2021 [82]. Wintertime (November–January) anthropogenic VOC emissions in Beijing, based on the multi-resolution emission inventory model for climate and air pollution research (MEIC), also decreased by approximately 25% during 2014–2021 (http://meicmodel.org.cn), which is lower than the relative decline observed in this study. One possible explanation for this discrepancy is that the observation sites represent only urban areas and that the measured species did not include oxygenated VOCs. Overall, the observed decreases in wintertime atmospheric pollutant concentrations and emissions in Beijing are closely associated with the implementation of a series of air pollution control policies, including the Air Pollution Prevention and Control Action Plan (2013–2017) and the Blue Sky Defense Battle (2017–2020) [80].
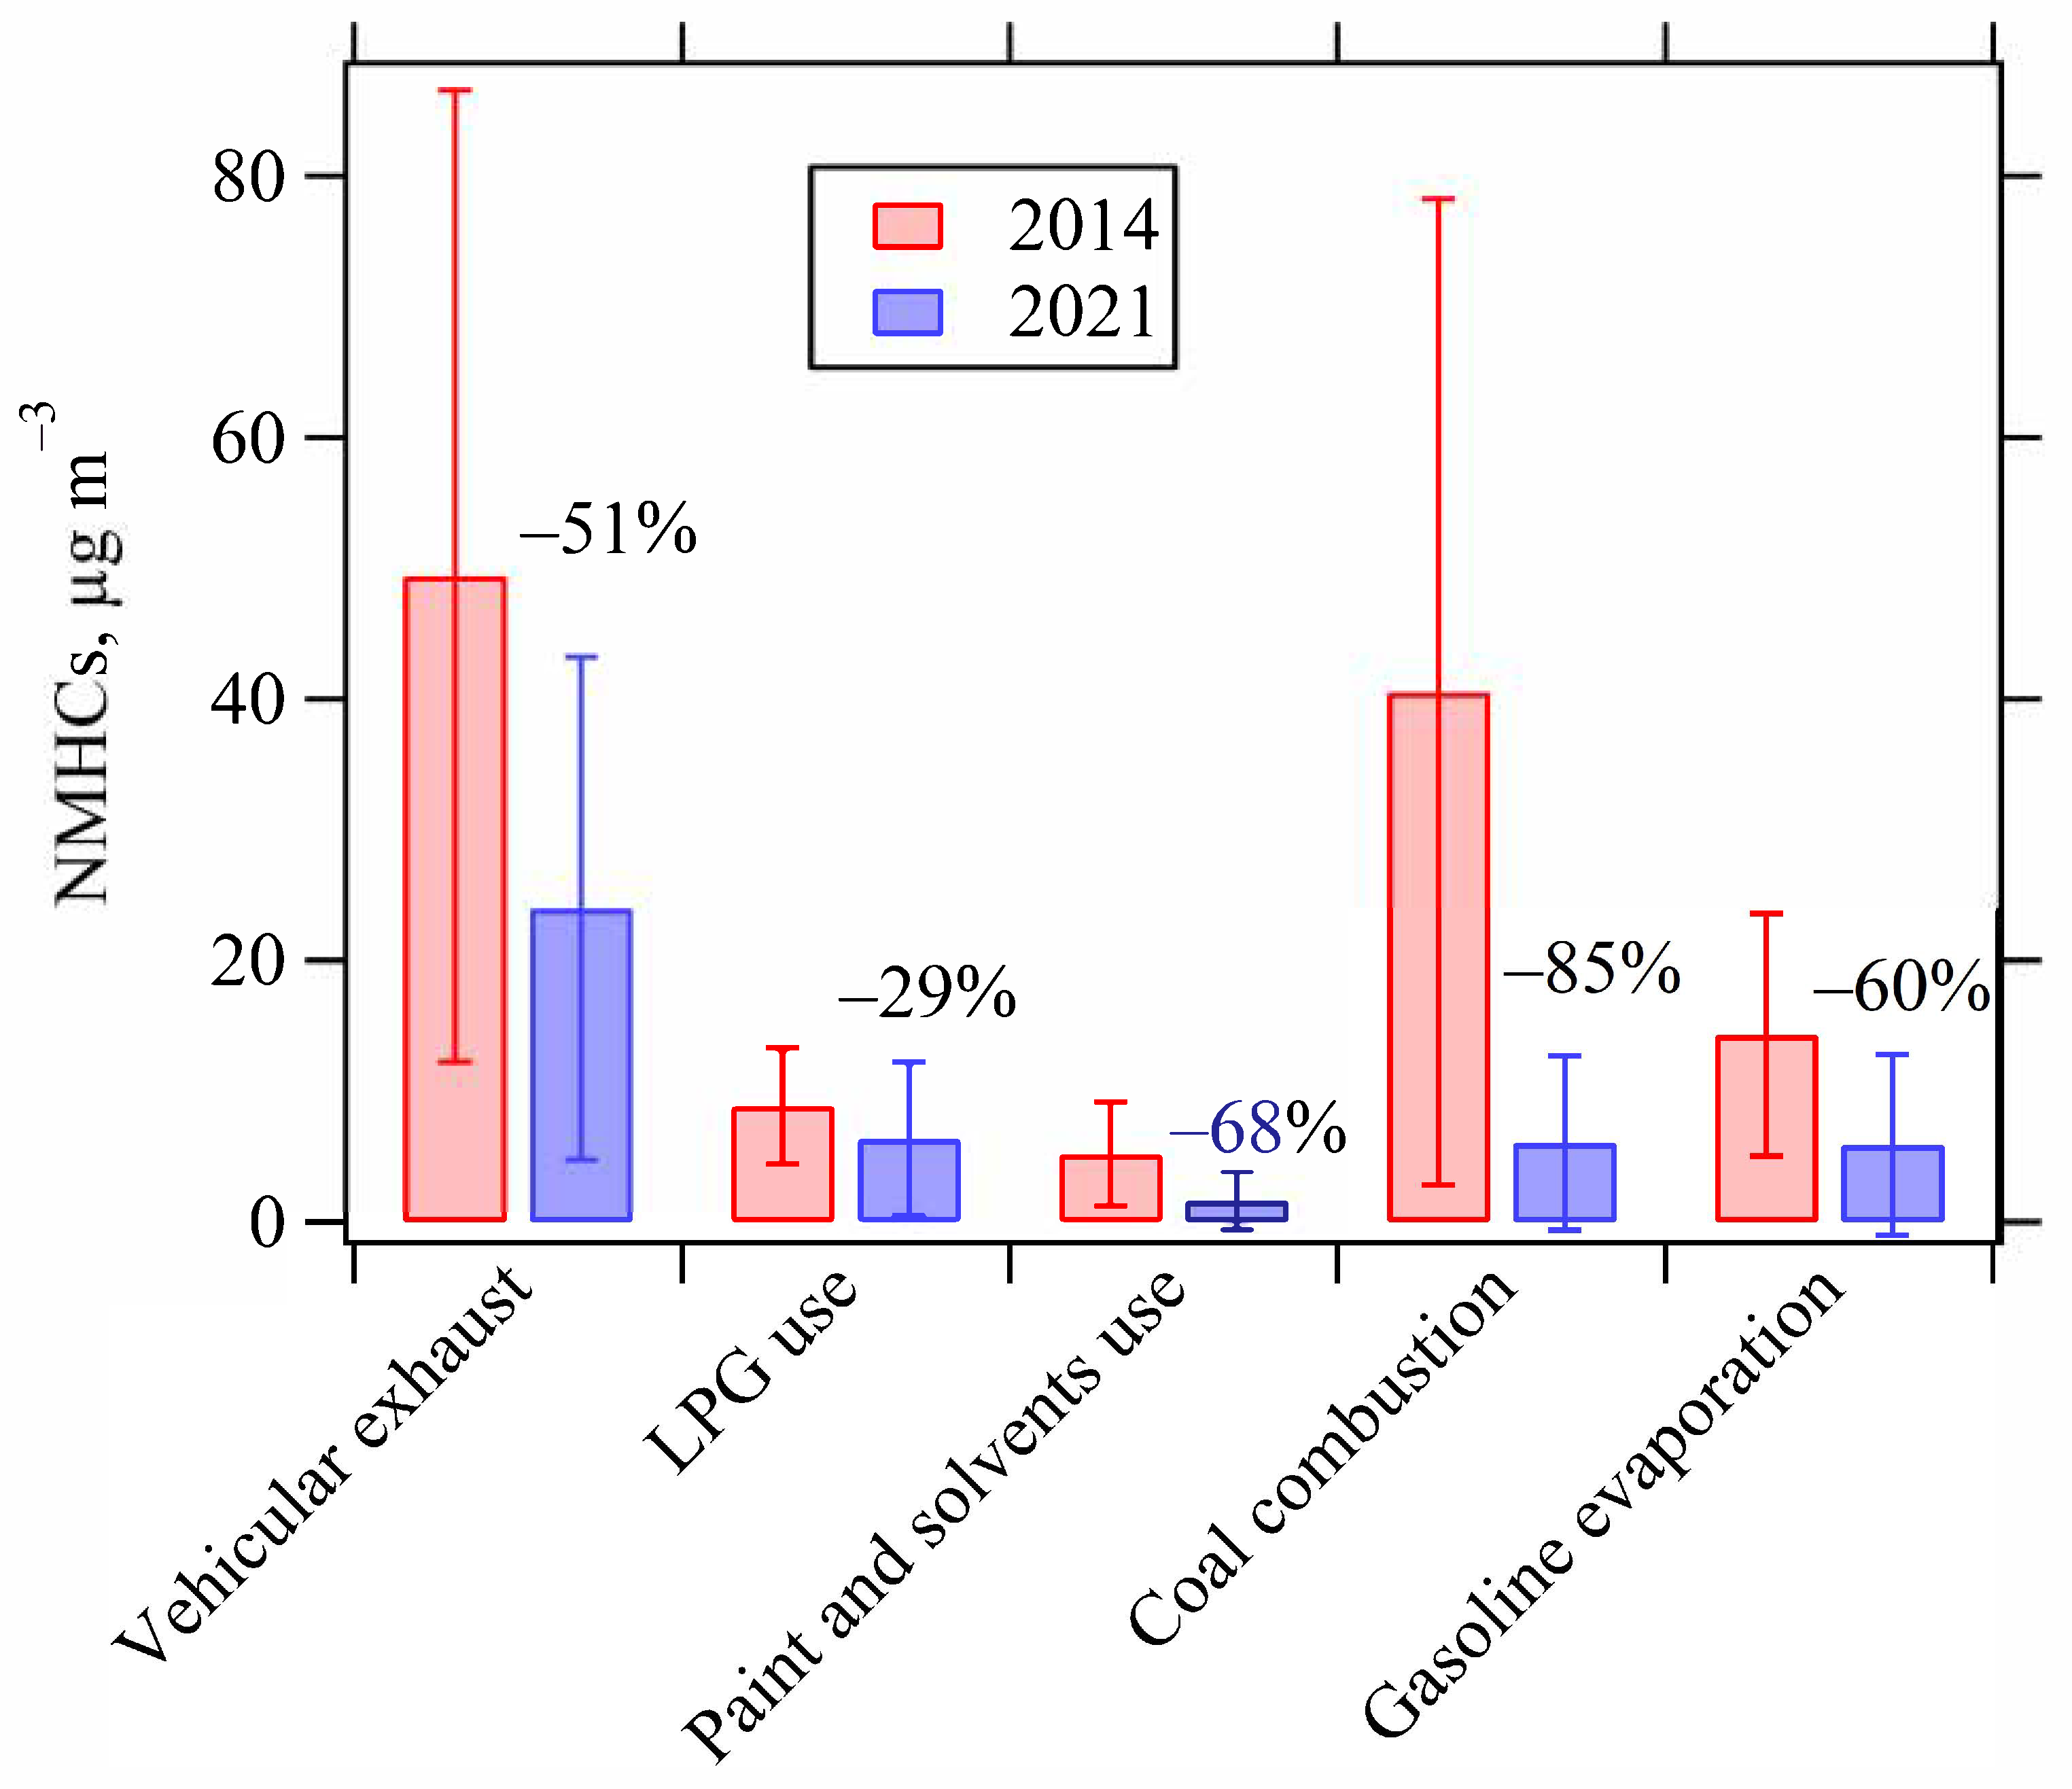
Further analysis of the reductions in NMHC concentrations by source categories (Figure 11) shows that coal combustion exhibited the largest decrease (85%), followed by paint and solvent use (68%). Gasoline evaporation and vehicular exhaust declined by 59% and 51%, respectively, while LPG use showed a smaller decline of 29%. Differences in the magnitudes of decline among emission sources led to significant increases in the relative contributions of vehicular exhaust and LPG use in 2021 compared with 2015, whereas the contribution of coal combustion dropped sharply from 41% to 14%. Consistently, the MEIC emission inventory indicates that VOC emissions from coal combustion decreased by 62%, exceeding the reductions from vehicular exhaust (37%) and paint and solvent use (22%). The pronounced decline in coal combustion contributions reflects the stringent control of coal use in the Beijing–Tianjin–Hebei region since the winter of 2015 and the promotion of clean heating alternatives, such as electricity and natural gas.

5. Conclusions

Online VOC monitoring was carried out at three urban sites in Beijing over the winters of 2014–2015 and 2021–2022. Peak VOC concentrations were frequently observed at the BMT site, indicating a strong influence from a nearby gasoline station. Eighteen NMHCs showed significant correlations with MTBE (r2 > 0.64, p < 0.01); their enhancement ratios relative to MTBE were therefore calculated and used to establish a wintertime gasoline source profile. The results show that n-butane accounted for 35% of the total mass concentration of 18 species, followed by i-pentane (20%), n-pentane (9%), and i-butane (8%). In contrast, previous studies have generally reported i-pentane as the dominant species of gasoline evaporation NMHCs. Vector similarity analysis indicates that the source profile derived from this study differs substantially from those reported in the literature. These discrepancies are likely attributable to seasonal variations in liquid gasoline composition and differences in the methodologies used to establish source profiles.
Positive matrix factorization was applied to identify VOC sources, and five distinct factors were resolved: gasoline evaporation, two vehicular exhaust-related factors, coal combustion and regional transport, and industrial emission. The gasoline evaporation source profile resolved by PMF was dominated by n-butane (41%), followed by i-pentane (22%), n-pentane (7%), and i-butane (3%), closely matching the profile derived from enhancement ratios. This strong agreement confirms the robustness of the gasoline evaporation source profile derived from both the PMF and enhancement ratios, underscoring the reliability of the observational data for characterizing wintertime VOC sources.
The CMB model was utilized to apportion the VOC sources and evaluate the sensitivity to three gasoline evaporation source profiles: one derived from online observations in this study and two from the literature. CMB analyses of three winter VOC datasets in Beijing showed that the literature-based profiles would lead to negative source contributions and poor model performance, especially for the 2021 dataset, with r2 values below 0.7 and mass closure exceeding 130%. In contrast, the profile derived from online observations substantially improved the CMB results, with negative contributions in less than 5% of samples, r2 values of 0.74–0.77, and mass closure of 89–103%, underscoring the importance of using season- and observation-specific source profiles for reliable VOC source apportionment.
The CMB results derived from the source profiles established in this study indicate that vehicular exhaust and coal combustion were the dominant contributors to wintertime NMHCs during 2014–2015, accounting for 42% and 41%, respectively, while gasoline evaporation contributed 12–17% of the total NMHCs. By 2021–2022, coal combustion exhibited the largest reduction in NMHC concentrations (85%), followed by paint and solvent use (68%), gasoline evaporation (59%), vehicular exhaust (51%), and LPG use (29%). These uneven reductions increased the relative contributions of vehicular exhaust (54%) and LPG use (14%), while the contribution of coal combustion declined sharply from 41% to 14%, underscoring the effectiveness of stringent coal control measures and the promotion of clean heating alternatives in the Beijing–Tianjin–Hebei region.

Author Contributions

Conceptualization, M.W.; methodology, H.Q. and M.W.; software, H.Q. and M.W.; validation, M.W.; formal analysis, H.Q.; investigation, M.W.; resources, M.W. and D.M.; data curation, R.X. and H.D.; writing—original draft preparation, H.Q.; writing—review and editing, M.W., R.X., H.D., D.M., J.L. and X.H.; visualization, H.Q. and M.W.; supervision, M.W.; funding acquisition, M.W. All authors have read and agreed to the published version of the manuscript.

Funding

This research was funded by the National Natural Science Foundation of China (grant number 42477108) and the Fujian Province Natural Science Foundation (grant number 2025J01989).

Institutional Review Board Statement

Not applicable.

Informed Consent Statement

Not applicable.

Data Availability Statement

The raw data supporting the conclusions of this article will be made available by the authors upon request.

Conflicts of Interest

The authors declare no conflicts of interest.

Abbreviations

MTBEmethyl tert-butyl ether
NMHCs non-methane hydrocarbons
VOCsvolatile organic compounds
LPGliquefied petroleum gas
PMFpositive matrix factorization
CMBchemical mass balance
VSAvector similarity analysis
ERAenhancement ratio analysis
ERsenhancement ratios
FIDflame ionization detection
GC–MSgas chromatography–mass spectrometry
VT-SHED vehicle testing sealed housing for evaporative determination
LOF-LR local outlier factor-based linear regression
Mediancalculation of the median ratio
LRlinear regression
MEIC multi-resolution emission inventory model for climate and air pollution research
RVPReid vapor pressure

Appendix A

Table A1. The measured species in this study.
AlkanesAlkenes and AlkyneAromaticsOther
ethane 1,22,4-dimethylpentaneethene 2benzene 2MTBE 2
propane 1,22-methylhexane 1propene 2toluene 1,2
n-butane 1,23-methylhexane 1i-butene 2ethylbenzene 2
i-butane 1,2cyclohexane 1,21-butene 2m,p-xylene 2
n-pentane 1,2methylcyclopentane 1cis-2-butene 2o-xylene 2
i-pentane 1,2n-octane 1,2trans-2-butene 2styrene 2
cyclopentane 1,22,2,4-trimethylpentane1,3-butadienei-propylbenzene 2
n-hexane 1,22,3,4-trimethylpentane1-pentene 2n-propylbenzene 2
2,2-dimethylbutanemethylcyclohexane 1cis-2-pentene1,3,5-trimethylbenzene
2,3-dimethylbutane 12-methylheptane 1trans-2-pentene1,2,4-trimethylbenzene
2-methylpentane 13-methylheptane 1isoprene 1,21,2,3-trimethylbenzene
3-methylpentanen-nonane1-hexenem-ethyltoluene
n-heptane 1,2n-decaneacetylene 1,2p-ethyltoluene
2,3-dimethylpentane 1 o-ethyltoluene
1 Fitting species for CMB, and 2 fitting species for PMF.

References

  1. in ’t Veld, M.; Seco, R.; Reche, C.; Pérez, N.; Alastuey, A.; Portillo-Estrada, M.; Janssens, I.A.; Peñuelas, J.; Fernandez-Martinez, M.; Marchand, N.; et al. Identification of volatile organic compounds and their sources driving ozone and secondary organic aerosol formation in NE Spain. Sci. Total Environ. 2024, 906, 167159. [Google Scholar] [CrossRef] [Scilit] [PubMed]
  2. Yan, X.; Gao, F.; Ji, Y.; An, C.; Gao, R.; Ren, Y.; Li, J.; Gao, X.; Xue, L.; Shang, F.; et al. Assessing the contribution of VOCs to SOA formation and identifying their key species during ozone pollution episodes in a typical petrochemical city. Environ. Pollut. 2025, 375, 126315. [Google Scholar] [CrossRef] [Scilit] [PubMed]
  3. Chen, S.-P.; Liu, W.-T.; Cheng, F.-Y.; Wang, C.-H.; Huang, S.-M.; Wang, J.-L. Ozone containment through selective mitigation measures on precursors of volatile organic compounds. Sci. Total Environ. 2024, 908, 167953. [Google Scholar] [CrossRef] [Scilit] [PubMed]
  4. Yáñez-Serrano, A.M.; Bach, A.; Bartolomé-Català, D.; Matthaios, V.; Seco, R.; Llusià, J.; Filella, I.; Peñuelas, J. Dynamics of volatile organic compounds in a western Mediterranean oak forest. Atmos. Environ. 2021, 257, 118447. [Google Scholar] [CrossRef] [Scilit]
  5. Mukherjee, S.; Pandithurai, G.; Waghmare, V.; Mahajan, A.S.; Tinel, L.; Aslam, M.Y.; Meena, G.S.; Patil, S.; Buchunde, P.; Kumar, A. Seasonal variability of volatile organic compounds (VOCs) at a high-altitude station in the Western Ghats, India: Influence of biogenic, anthropogenic emissions and long-range transport. Atmos. Environ. 2024, 331, 120598. [Google Scholar] [CrossRef] [Scilit]
  6. Zhang, Q.; Sun, L.; Wei, N.; Wu, L.; Mao, H. The characteristics and source analysis of VOCs emissions at roadside: Assess the impact of ethanol-gasoline implementation. Atmos. Environ. 2021, 263, 118670. [Google Scholar] [CrossRef] [Scilit]
  7. Xiao, Z.; Yang, X.; Gu, H.; Hu, J.; Zhang, T.; Chen, J.; Pan, X.; Xiu, G.; Zhang, W.; Lin, M. Characterization and sources of volatile organic compounds (VOCs) during 2022 summer ozone pollution control in Shanghai, China. Atmos. Environ. 2024, 327, 120464. [Google Scholar] [CrossRef] [Scilit]
  8. Rao, Z.; Feng, M.; Tan, Q.; Feng, Q.; Zhang, W.; Cao, P.; Chen, D.; Li, J.; Zhou, L.; Yang, F. Comprehensive evaluation of emission control strategies on anthropogenic VOCs and ozone reduction during the 31st summer Universiade in Chengdu. Atmos. Environ. 2025, 359, 121380. [Google Scholar] [CrossRef] [Scilit]
  9. Wu, Y.; Zhang, S.; Hao, J.; Liu, H.; Wu, X.; Hu, J.; Walsh, M.P.; Wallington, T.J.; Zhang, K.M.; Stevanovic, S. On-road vehicle emissions and their control in China: A review and outlook. Sci. Total Environ. 2017, 574, 332–349. [Google Scholar] [CrossRef] [Scilit]
  10. Yang, X.; Liu, H.; Cui, H.; Man, H.; Fu, M.; Hao, J.; He, K. Vehicular volatile organic compounds losses due to refueling and diurnal process in China: 2010–2050. J. Environ. Sci. 2015, 33, 88–96. [Google Scholar] [CrossRef] [Scilit]
  11. Liu, Y.; Zhong, C.; Peng, J.; Wang, T.; Wu, L.; Chen, Q.; Sun, L.; Sun, S.; Zou, C.; Zhao, J.; et al. Evaporative emission from China 5 and China 6 gasoline vehicles: Emission factors, profiles and future perspective. J. Clean. Prod. 2022, 331, 129861. [Google Scholar] [CrossRef] [Scilit]
  12. Zeng, L.; Yang, B.; Xiao, S.; Yan, M.; Cai, Y.; Liu, B.; Zheng, X.; Wu, Y. Species profiles, in-situ photochemistry and health risk of volatile organic compounds in the gasoline service station in China. Sci. Total Environ. 2022, 842, 156813. [Google Scholar] [CrossRef] [Scilit] [PubMed]
  13. Borlaza-Lacoste, L.; Aynul Bari, M.; Lu, C.-H.; Hopke, P.K. Long-term contributions of VOC sources and their link to ozone pollution in Bronx, New York City. Environ. Int. 2024, 191, 108993. [Google Scholar] [CrossRef] [Scilit] [PubMed]
  14. Guan, Y.; Liu, X.; Zheng, Z.; Dai, Y.; Du, G.; Han, J.; Hou, L.; Duan, E. Summer O3 pollution cycle characteristics and VOCs sources in a central city of Beijing-Tianjin-Hebei area, China. Environ. Pollut. 2023, 323, 121293. [Google Scholar] [CrossRef] [Scilit]
  15. Noumura, G.; Hata, H.; Yamada, H.; Tonokura, K. Improvement of the Theoretical model for evaluating evaporative emissions in parking and refueling events of gasoline fleets based on thermodynamics. ACS Omega 2022, 7, 31888–31896. [Google Scholar] [CrossRef] [Scilit]
  16. Huy, L.N.; Kim Oanh, N.T. Emission control for volatile organic compounds from gasoline stations and implication on ozone-forming potential. Atmos. Pollut. Res. 2020, 11, 87–98. [Google Scholar] [CrossRef] [Scilit]
  17. Niu, Z.; Kong, S.; Zheng, H.; Hu, Y.; Zheng, S.; Cheng, Y.; Yao, L.; Liu, W.; Ding, F.; Liu, X.; et al. Differences in compositions and effects of VOCs from vehicle emission detected using various methods. Environ. Pollut. 2023, 333, 122077. [Google Scholar] [CrossRef] [Scilit]
  18. Zi, T.; Wang, P.; Liu, B.; Zhou, Y.; Shen, X.; Zhang, L.; Lu, Y.; Feng, Q.; Yang, Y.; Lang, J. Evaporative emission characteristics of VOCs from in-use light-duty gasoline vehicles. Atmos. Environ. 2023, 312, 120024. [Google Scholar] [CrossRef] [Scilit]
  19. Hao, C.; Yin, D.; Wang, J.; Yin, H.; Guo, X.; Ke, J.; Liu, Q.; Ge, Y.; Dou, G. Localised evaporative emission inventory of gasoline vehicle volatile organic compounds (VOCs) in China: Insights into regional variations and driving behaviours. Environ. Pollut. 2025, 382, 126661. [Google Scholar] [CrossRef] [Scilit]
  20. Zhang, Y.; Wang, X.; Zhang, Z.; Lü, S.; Shao, M.; Lee, F.S.C.; Yu, J. Species profiles and normalized reactivity of volatile organic compounds from gasoline evaporation in China. Atmos. Environ. 2013, 79, 110–118. [Google Scholar] [CrossRef] [Scilit]
  21. Wu, Y.; Liu, Y.; Liu, P.; Sun, L.; Song, P.; Peng, J.; Li, R.; Wei, N.; Wu, L.; Wang, T.; et al. Evaluating vehicular exhaust and evaporative emissions via VOC measurement in an underground parking garage. Environ. Pollut. 2023, 333, 122022. [Google Scholar] [CrossRef] [Scilit]
  22. Sun, W.; Zhu, R.; Wang, M.; Chen, H.; Zhang, B.; Xie, P.; Zhang, R.; Liu, X.; Wei, P.; Zhang, R. Evaporative volatile organic compounds from the actual vehicle refueling emissions: Characteristics, secondary transformation, and health effects in winter and summer seasons. Atmos. Environ. 2024, 338, 120811. [Google Scholar] [CrossRef] [Scilit]
  23. Yang, J.; Roth, P.; Durbin, T.; Karavalakis, G. Impacts of gasoline aromatic and ethanol levels on the emissions from GDI vehicles: Part 1. Influence on regulated and gaseous toxic pollutants. Fuel 2019, 252, 799–811. [Google Scholar] [CrossRef] [Scilit]
  24. Zhang, Y.; Yang, X.; Wang, Y.; Yang, Z.; Zhao, H.; Ding, Y. Light-duty vehicle organic gas emissions from tailpipe and evaporation: A review of influencing factors. Sci. Total Environ. 2024, 947, 174523. [Google Scholar] [CrossRef] [Scilit]
  25. Jayaraj, S.; Nagendra, S.M.S. Environmental impact of VOC emissions from motor vehicle gasoline and vapours: Composition analysis and implications. J. Atmos. Chem. 2025, 82, 12. [Google Scholar] [CrossRef] [Scilit]
  26. Yue, X.; Wu, Y.; Hao, J.; Pang, Y.; Ma, Y.; Li, Y.; Li, B.; Bao, X.; France, N. Fuel quality management versus vehicle emission control in China, status quo and future perspectives. Energy Policy 2015, 79, 87–98. [Google Scholar] [CrossRef] [Scilit]
  27. Romagnuolo, L.; Frosina, E.; Andreozzi, A.; Senatore, A.; Fortunato, F. Experimental analysis of evaporative emissions of ethanol-blended gasoline in automotive tanks at different temperature conditions. Fuel 2021, 304, 121427. [Google Scholar] [CrossRef] [Scilit]
  28. Huang, J.; Yuan, Z.; Duan, Y.; Liu, D.; Fu, Q.; Liang, G.; Li, F.; Huang, X. Quantification of temperature dependence of vehicle evaporative volatile organic compound emissions from different fuel types in China. Sci. Total Environ. 2022, 813, 152661. [Google Scholar] [CrossRef] [Scilit]
  29. Landera, A.; Dowell, N.M.; George, A. Development of robust models for the prediction of Reid vapor pressure (RVP) in fuel blends and their application to oxygenated biofuels using the SAFT-γ approach. Fuel 2021, 283, 118624. [Google Scholar] [CrossRef] [Scilit]
  30. Gentner, D.R.; Harley, R.A.; Miller, A.M.; Goldstein, A.H. Diurnal and seasonal variability of gasoline-related volatile organic compound emissions in Riverside, California. Environ. Sci. Technol. 2009, 43, 4247–4252. [Google Scholar] [CrossRef] [Scilit]
  31. Wang, Y.; Li, X.; Kong, L.; Lu, S.; Liu, Y.; Dou, X.; Wang, K.; Wang, F.; Shi, X.; Wang, J.; et al. Emission characteristics of evaporative intermediate-volatility organic compounds from in-use gasoline vehicles. Environ. Sci. Technol. 2025, 59, 13730–13741. [Google Scholar] [CrossRef] [Scilit]
  32. Wu, X.; He, R. Modeling and influence factors analysis of refueling emissions for plug-in hybrid electric vehicles. J. Energy Resour. Technol. 2023, 146, 021702. [Google Scholar] [CrossRef] [Scilit]
  33. Wu, X.; Chen, Q.; He, R. Experimental research and estimation model of gasoline evaporative emissions from vehicles in China. Sci. Total Environ. 2024, 927, 171875. [Google Scholar] [CrossRef] [Scilit] [PubMed]
  34. Niu, Z.; Kong, S.; Zheng, H.; Yan, Q.; Liu, J.; Feng, Y.; Wu, J.; Zheng, S.; Zeng, X.; Yao, L.; et al. Temperature dependence of source profiles for volatile organic compounds from typical volatile emission sources. Sci. Total Environ. 2021, 751, 141741. [Google Scholar] [CrossRef] [Scilit] [PubMed]
  35. Li, J.; Hao, Y.; Cheng, Y.; Simayi, M.; Shi, Y.; Xi, Z.; Xie, S. Verification of anthropogenic VOC emission inventory through ambient measurements and satellite retrievals. Atmos. Chem. Phys. 2019, 19, 5905–5921. [Google Scholar] [CrossRef] [Scilit]
  36. Chai, W.; Wang, M.; Li, J.; Tang, G.; Zhang, G.; Chen, W. Pollution characteristics, sources, and photochemical roles of ambient carbonyl compounds in summer of Beijing, China. Environ. Pollut. 2023, 336, 122403. [Google Scholar] [CrossRef] [Scilit]
  37. Wang, M.; Zeng, L.; Lu, S.; Shao, M.; Liu, X.; Yu, X.; Chen, W.; Yuan, B.; Zhang, Q.; Hu, M. Development and validation of a cryogen-free automatic gas chromatograph system (GC-MS/FID) for online measurements of volatile organic compounds. Anal. Methods 2014, 6, 9424–9434. [Google Scholar] [CrossRef] [Scilit]
  38. Watson, J.G.; Chow, J.C.; Fujita, E.M. Review of volatile organic compound source apportionment by chemical mass balance. Atmos. Environ. 2001, 35, 1567–1584. [Google Scholar] [CrossRef] [Scilit]
  39. Kirchstetter, T.W.; Singer, B.C.; Harley, R.A.; Kendall, G.R.; Hesson, J.M. Impact of California reformulated gasoline on motor vehicle emissions. 2. volatile organic compound speciation and reactivity. Environ. Sci. Technol. 1999, 33, 329–336. [Google Scholar] [CrossRef] [Scilit]
  40. Chang, C.-C.; Lo, S.-J.; Lo, J.-G.; Wang, J.-L. Analysis of methyl tert-butyl ether in the atmosphere and implications as an exclusive indicator of automobile exhaust. Atmos. Environ. 2003, 37, 4747–4755. [Google Scholar] [CrossRef] [Scilit]
  41. Watson, J.G.; Cooper, J.A.; Huntzicker, J.J. The effective variance weighting for least squares calculations applied to the mass balance receptor model. Atmos. Environ. 1984, 18, 1347–1355. [Google Scholar] [CrossRef] [Scilit]
  42. Coulter, C.T. EPA-CMB8.2 Users Manual. 2004. Available online: https://www.epa.gov/sites/default/files/2020-10/documents/epa-cmb82manual.pdf (accessed on 12 September 2025).
  43. Yang, W.; Zhang, Y.; Wang, X.; Li, S.; Zhu, M.; Yu, Q.; Li, G.; Huang, Z.; Zhang, H.; Wu, Z.; et al. Volatile organic compounds at a rural site in Beijing: Influence of temporary emission control and wintertime heating. Atmos. Chem. Phys. 2018, 18, 12663–12682. [Google Scholar] [CrossRef] [Scilit]
  44. Wei, W.; Ren, Y.; Yang, G.; Cheng, S.; Han, L. Characteristics and source apportionment of atmospheric volatile organic compounds in Beijing, China. Environ. Monit. Assess. 2019, 191, 762. [Google Scholar] [CrossRef] [Scilit] [PubMed]
  45. Zhou, B.; Zhao, T.; Ma, J.; Zhang, Y.; Zhang, L.; Huo, P.; Zhang, Y. Characterization of VOCs during nonheating and heating periods in the typical suburban area of Beijing, China: Sources and Health Assessment. Atmosphere 2022, 13, 560. [Google Scholar] [CrossRef] [Scilit]
  46. Liu, Y.; Shao, M.; Fu, L.; Lu, S.; Zeng, L.; Tang, D. Source profiles of volatile organic compounds (VOCs) measured in China: Part I. Atmos. Environ. 2008, 42, 6247–6260. [Google Scholar] [CrossRef] [Scilit]
  47. Mo, Z.; Shao, M.; Lu, S. Compilation of a source profile database for hydrocarbon and OVOC emissions in China. Atmos. Environ. 2016, 143, 209–217. [Google Scholar] [CrossRef] [Scilit]
  48. Paatero, P. Least squares formulation of robust non-negative factor analysis. Chemometr. Intell. Lab. Syst. 1997, 37, 23–35. [Google Scholar] [CrossRef] [Scilit]
  49. Paatero, P.; Tapper, U. Positive matrix factorization: A non-negative factor model with optimal utilization of error estimates of data values. Environmetrics 1994, 5, 111–126. [Google Scholar] [CrossRef] [Scilit]
  50. Norris, G.; Duvall, R.; Brown, S.; Bai, S. EPA Positive Matrix Factorization (PMF) 5.0 Fundamentals and User Guide. 2014. Available online: https://www.epa.gov/air-research/epa-positive-matrix-factorization-50-fundamentals-and-user-guide (accessed on 12 September 2025).
  51. Zhu, W.; Guo, S.; Zhang, Z.; Wang, H.; Yu, Y.; Chen, Z.; Shen, R.; Tan, R.; Song, K.; Liu, K.; et al. Mass spectral characterization of secondary organic aerosol from urban cooking and vehicular sources. Atmos. Chem. Phys. 2021, 21, 15065–15079. [Google Scholar] [CrossRef] [Scilit]
  52. Wang, S.; Yuan, B.; He, X.; Cui, R.; Song, X.; Chen, Y.; Wu, C.; Wang, C.; Huangfu, Y.; Li, X.-B.; et al. Emission characteristics of reactive organic gases (ROGs) from industrial volatile chemical products (VCPs) in the Pearl River Delta (PRD), China. Atmos. Chem. Phys. 2024, 24, 7101–7121. [Google Scholar] [CrossRef] [Scilit]
  53. Zhang, L.; Wang, X.; Li, H.; Cheng, N.; Zhang, Y.; Zhang, K.; Li, L. Variations in levels and sources of atmospheric VOCs during the continuous haze and non-haze episodes in the urban area of Beijing: A case study in spring of 2019. Atmosphere 2021, 12, 171. [Google Scholar] [CrossRef] [Scilit]
  54. Man, H.; Liu, H.; Niu, H.; Wang, K.; Deng, F.; Wang, X.; Xiao, Q.; Hao, J. VOCs evaporative emissions from vehicles in China: Species characteristics of different emission processes. Environ. Sci. Ecotechnol. 2020, 1, 100002. [Google Scholar] [CrossRef] [Scilit]
  55. Sun, L.; Zhong, C.; Peng, J.; Wang, T.; Wu, L.; Liu, Y.; Sun, S.; Li, Y.; Chen, Q.; Song, P.; et al. Refueling emission of volatile organic compounds from China 6 gasoline vehicles. Sci. Total Environ. 2021, 789, 147883. [Google Scholar] [CrossRef] [Scilit] [PubMed]
  56. Tian, Y.; Wang, X.; Zhao, P.; Shi, Z.; Harrison, R.M. PM2.5 source apportionment using organic marker-based chemical mass balance modeling: Influence of inorganic markers and sensitivity to source profiles. Atmos. Environ. 2023, 294, 119477. [Google Scholar] [CrossRef] [Scilit]
  57. Ren, H.; Xia, Z.; Yao, L.; Qin, G.; Zhang, Y.; Xu, H.; Wang, Z.; Cheng, J. Investigation on ozone formation mechanism and control strategy of VOCs in petrochemical region: Insights from chemical reactivity and photochemical loss. Sci. Total Environ. 2024, 914, 169891. [Google Scholar] [CrossRef] [Scilit]
  58. Poulopoulos, S.; Philippopoulos, C. Influence of MTBE addition into gasoline on automotive exhaust emissions. Atmos. Environ. 2000, 34, 4781–4786. [Google Scholar] [CrossRef] [Scilit]
  59. Huo, S.; Zhang, X.; Xu, W.; Dang, J.; Xu, F.; Xie, W.; Tao, C.; Han, Y.; Liu, X.; Teng, Z.; et al. Updating vehicle VOCs emissions characteristics under clean air actions in a tropical city of China. Sci. Total Environ. 2024, 930, 172733. [Google Scholar] [CrossRef] [Scilit]
  60. Yu, W.; Shen, X.; Yao, Z.; Cao, X.; Hao, X.; Li, X.; Wu, B.; Zhang, H.; Wang, S.; Zhou, Q. Database of emission factors of volatile organic compound (VOC) species in motor vehicle exhaust in China. Sci. Total Environ. 2024, 914, 169844. [Google Scholar] [CrossRef] [Scilit]
  61. Han, T.; Ma, Z.; Li, Y.; Pu, W.; Wu, J.; Li, Z.; Shang, J.; He, D.; Zhou, L.; Wang, Y. Chemical characteristics and source apportionments of volatile organic compounds (VOCs) before and during the heating season at a regional background site in the North China Plain. Atmos. Res. 2021, 262, 105778. [Google Scholar] [CrossRef] [Scilit]
  62. Wang, M.; Li, S.; Zhu, R.; Zhang, R.; Zu, L.; Wang, Y.; Bao, X. On-road tailpipe emission characteristics and ozone formation potentials of VOCs from gasoline, diesel and liquefied petroleum gas fueled vehicles. Atmos. Environ. 2020, 223, 117294. [Google Scholar] [CrossRef] [Scilit]
  63. Zhang, J.; Sun, Y.; Wu, F.; Sun, J.; Wang, Y. The characteristics, seasonal variation and source apportionment of VOCs at Gongga Mountain, China. Atmos. Environ. 2014, 88, 297–305. [Google Scholar] [CrossRef] [Scilit]
  64. Yu, W.; Li, J.; Hao, C.; Ge, Y.; Wang, X.; Zhang, M.; Wang, Y. VOC species emissions from gasoline direct injection (GDI) and port fuel injection (PFI) vehicles combusting different gasoline. Sci. Total Environ. 2024, 954, 176234. [Google Scholar] [CrossRef] [Scilit]
  65. Liu, Y.; Shao, M.; Lu, S.; Chang, C.-C.; Wang, J.-L.; Fu, L. Source apportionment of ambient volatile organic compounds in the Pearl River Delta, China: Part II. Atmos. Environ. 2008, 42, 6261–6274. [Google Scholar] [CrossRef] [Scilit]
  66. Zhang, F.; Shang, X.; Chen, H.; Xie, G.; Fu, Y.; Wu, D.; Sun, W.; Liu, P.; Zhang, C.; Mu, Y.; et al. Significant impact of coal combustion on VOCs emissions in winter in a North China rural site. Sci. Total Environ. 2020, 720, 137617. [Google Scholar] [CrossRef] [Scilit] [PubMed]
  67. Dimitriou, K.; Kassomenos, P. Background concentrations of benzene, potential long range transport influences and corresponding cancer risk in four cities of central Europe, in relation to air mass origination. J. Environ. Manag. 2020, 262, 110374. [Google Scholar] [CrossRef] [Scilit]
  68. Dalsøren, S.B.; Myhre, G.; Hodnebrog, Ø.; Myhre, C.L.; Stohl, A.; Pisso, I.; Schwietzke, S.; Höglund-Isaksson, L.; Helmig, D.; Reimann, S.; et al. Discrepancy between simulated and observed ethane and propanelevels explained by underestimated fossil emissions. Nat. Geosci. 2018, 11, 178–184. [Google Scholar] [CrossRef] [Scilit]
  69. Liu, Y.; Wang, H.; Jing, S.; Gao, Y.; Peng, Y.; Lou, S.; Cheng, T.; Tao, S.; Li, L.; Li, Y.; et al. Characteristics and Sources of Volatile Organic Compounds (vocs) in Shanghai During Summer: Implications of Regional Transport. Atmos. Environ. 2019, 215, 116902. [Google Scholar] [CrossRef] [Scilit]
  70. Wang, J.; Jin, L.; Gao, J.; Shi, J.; Zhao, Y.; Liu, S.; Jin, T.; Bai, Z.; Wu, C.-Y. Investigation of speciated VOC in gasoline vehicular exhaust under ECE and EUDC test cycles. Sci. Total Environ. 2013, 445–446, 110–116. [Google Scholar] [CrossRef] [Scilit]
  71. Zheng, H.; Kong, S.; Yan, Y.; Chen, N.; Qi, S. Compositions, sources and health risks of ambient volatile organic compounds (VOCs) at a petrochemical industrial park along the Yangtze River. Sci. Total Environ. 2019, 703, 135505. [Google Scholar] [CrossRef] [Scilit]
  72. Mo, Z.; Shao, M.; Lu, S.; Qu, H.; Zhou, M.; Sun, J.; Gou, B. Process-specific emission characteristics of volatile organic compounds (VOCs) from petrochemical facilities in the Yangtze River Delta, China. Sci. Total Environ. 2015, 533, 422–431. [Google Scholar] [CrossRef] [Scilit]
  73. Wang, W.; Yan, Y.; Fang, H.; Li, J.; Zha, S.; Wu, T. Volatile organic compound emissions from typical industries: Implications for the importance of oxygenated volatile organic compounds. Atmos. Pollut. Res. 2023, 14, 101640. [Google Scholar] [CrossRef] [Scilit]
  74. Wang, M.; Shao, M.; Chen, W.; Lu, S.; Li, Y. Trends of non-methane hydrocarbons (NMHC) emissions in Beijing during 2002–2013. Atmos. Chem. Phys. 2015, 14, 85–94. [Google Scholar] [CrossRef] [Scilit]
  75. Sadeghi, B.; Pouyaei, A.; Choi, Y.; Rappenglueck, B. Measurement report: Summertime and wintertime VOCs in Houston: Source apportionment and spatial distribution of source origins. Atmos. Chem. Phys. Discuss. 2021. preprint. [Google Scholar] [CrossRef] [Scilit]
  76. Baudic, A.; Gros, V.; Sauvage, S.; Locoge, N.; Bonsang, B. Seasonal variability and source apportionment of volatile organic compounds (VOCs) in the Paris megacity (France). Atmos. Chem. Phys. 2016, 16, 11961. [Google Scholar] [CrossRef] [Scilit]
  77. Zhang, L.; Li, H.; Wu, Z.; Zhang, W.; Liu, K.; Cheng, X.; Zhang, Y.; Li, B.; Chen, Y. Characteristics of atmospheric volatile organic compounds in urban area of Beijing: Variations, photochemical reactivity and source apportionment. J. Environ. Sci. 2020, 95, 190–200. [Google Scholar] [CrossRef] [Scilit]
  78. Yang, W.; Zhang, Q.; Wang, J.; Zhou, C.; Zhang, Y.; Pan, Z. Emission characteristics and ozone formation potentials of VOCs from gasoline passenger cars at different driving modes. Atmos. Pollut. Res. 2018, 9, 804–813. [Google Scholar] [CrossRef] [Scilit]
  79. Li, J.; Shi, Y.; Wu, R.; Xie, S. Variations of wintertime ambient volatile organic compounds in Beijing, China, from 2015 to 2019. Environ. Sci. Technol. Lett. 2023, 10, 131–136. [Google Scholar] [CrossRef] [Scilit]
  80. Geng, G.; Liu, Y.; Liu, Y.; Liu, S.; Cheng, J.; Yan, L.; Wu, N.; Hu, H.; Tong, D.; Zheng, B.; et al. Efficacy of China’s clean air actions to tackle PM2.5 pollution between 2013 and 2020. Nat. Geosci. 2024, 17, 987–994. [Google Scholar] [CrossRef] [Scilit]
  81. Zhao, Z.; Lu, Y.; Zhan, Y.; Cheng, Y.; Yang, F.; Brook, J.R.; He, K. Long-term spatiotemporal variations in surface NO2 for Beijing reconstructed from surface data and satellite retrievals. Sci. Total Environ. 2023, 904, 166693. [Google Scholar] [CrossRef] [Scilit]
  82. Xing, Q.; Sun, M. Characteristics of PM2.5 and PM10 spatio-temporal distribution and influencing meteorological conditions in Beijing. Atmosphere 2022, 13, 1120. [Google Scholar] [CrossRef] [Scilit]
Figure 1. Locations of three observation sites (BMT, PKU, and CEMC) in this study.
Atmosphere 17 00278 g001
Figure 2. Time series of volatile organic compound (VOC) mixing ratios at the BMT site: (a) ethene and acetylene; (b) ethane and propane; (c) benzene and toluene; (d) i-pentane, methyl tert-butyl ether (MTBE), and n-butane; and (e) non-methane hydrocarbons (NMHCs).
Atmosphere 17 00278 g002
Figure 3. (a) Frequency distributions of NMHC mixing ratios and (b) relative contributions of six groups to total NMHCs observed at the BMT site.
Atmosphere 17 00278 g003
Figure 4. (a) Relationship of MTBE versus acetylene mixing ratios and (b) frequency distributions of MTBE/acetylene ratios. ** indicates significance at the 0.01 level (p < 0.01).
Atmosphere 17 00278 g004
Figure 5. Relationship between 18 NMHC species: (a) n-butane, (b) i-butane, (c) trans-2-butene, (d) cis-2-butene, (e) n-pentane, (f) i-pentane, (g) cyclopentane, (h) trans-2-pentene, (i) cis-2-pentene, (j) n-hexane, (k) 2-methylpentane, (l) 3-methylpentane, (m) 2,2-dimethylbutane, (n) 2,3-dimethylbutane, (o) methylcyclopentane, (p) 2,4-dimethylpentane, (q) 2,2,4-trimethylpentane, (r) 2,3,4-trimethylpentane. MTBE showing strong correlations at the BMT and PKU site. ** indicates significance at the 0.01 level (p < 0.01).
Atmosphere 17 00278 g005
Figure 6. Relationship between nine NMHC species: (a) ethane, (b) propane, (c) ethene, (d) propene, (e) isoprene, (f) benzene, (g) toluene, (h) m,p-xylene, (i) ethylbenzene. Acetylene showing strong correlations at the BMT and PKU site. ** indicates significance at the 0.01 level (p < 0.01).
Atmosphere 17 00278 g006
Figure 7. Comparisons of enhancement ratios of NMHCs determined using three methods: (a) median versus local outlier factor-based linear regression (LOF-LR) and (b) linear regression (LR) versus LOF-LR. Each filled circle represents an individual VOC species; colors denote different VOC groups.
Atmosphere 17 00278 g007
Figure 8. Comparison of gasoline evaporation NMHC source profile derived from online measurements in this study with those reported in previous studies [22,46,54,55].
Atmosphere 17 00278 g008
Figure 9. VOC chemical composition profiles of the five factors resolved by positive matrix factorization (PMF) (the red filled circles indicate the relative contribution of each factor to the corresponding species, and the blue bars represent the weight percentage of each species within that factor).
Atmosphere 17 00278 g009
Figure 10. Source apportionment results of wintertime VOCs in 2014–2015 and 2020–2021, based on chemical mass balance (CMB), using gasoline evaporation source profiles reported in the literature [22,46] and the source profile derived from online observations in this study.
Atmosphere 17 00278 g010
Figure 11. Changes in NMHC concentrations contributed by five emission source categories during the winters of 2014—2015 and 2021—2022.
Atmosphere 17 00278 g011
Table 1. The performance of chemical mass balance (CMB) results based on three gasoline evaporation profiles.
DatasetGasoline Evaporation Profiler2Mass%Percentage of Negative Source Contributions
2014–2015 BMTA: Liu et al. (2008) [46]0.7709137.4
B: Sun et al. (2024) [22]0.707964.63
C: This study0.774893.59
2014–2015
PKU
A: Liu et al. (2008) [46]0.7861019.02
B: Sun et al. (2024) [22]0.7181041.38
C: This study0.774980.46
2021–2022
CEMC
A: Liu et al. (2008) [46]0.7341220.36
B: Sun et al. (2024) [22]0.68513110.5
C: This study0.7361030.29
Table 2. Comparison of VOC source apportionment results with previous studies.
Observation PeriodsMethodsVehicular ExhaustCoal CombustionGasoline EvaporationPaint and Solvent UseIndustrial EmissionBackground/LPG UseOtherReferences
1–31 January 2015PMF46%--23%20%7%--3%[44]
15–20 November 2014PMF17%45%--13%25%----[78]
20 December 2016–19 January 2017PMF44%31%5%20%------[77]
1 November 2017–21 January 2018PMF8%54%--11%4%4% a19% c[66]
5 November 2014–25 January 2015CMB42%41%12%4%--8% b--This study
1 November 2021–31 January 2022CMB54%14%13%4%--14% b--
a Background, b LPG use, and c biomass burning and secondary formation.
Disclaimer/Publisher’s Note: The statements, opinions and data contained in all publications are solely those of the individual author(s) and contributor(s) and not of MDPI and/or the editor(s). MDPI and/or the editor(s) disclaim responsibility for any injury to people or property resulting from any ideas, methods, instructions or products referred to in the content.